Embed Size (px)
Citation preview
Slides 3 – Material flow analysis
MATERIAL FLOW ANALYSIS
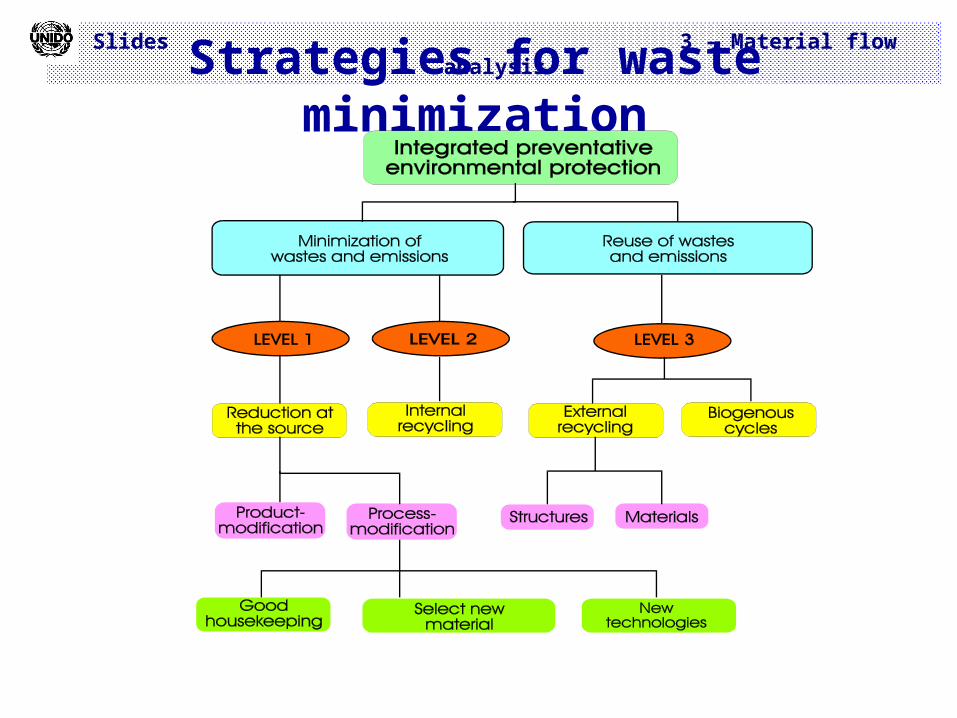
Slides 3 – Material flow analysisStrategies for waste minimization
Slides 3 – Material flow analysis
What are materials?
Goods/raw materials (e.g. wood, gravel, PVC)
Elements (e.g. carbon, cadmium)
Compounds (e.g. benzene, methane)
Slides 3 – Material flow analysis
What is a material flow analysis?
A material flow analysis is a systematic reconstruction of the way a chemical element, a compound or a material takes through the natural and/or economic cycle.
A material flow analysis is generally based on the principle of physical balance.
Definition of the Commission of inquiry "Protection of human life and the environment" of the German Bundestag
Slides 3 – Material flow analysis
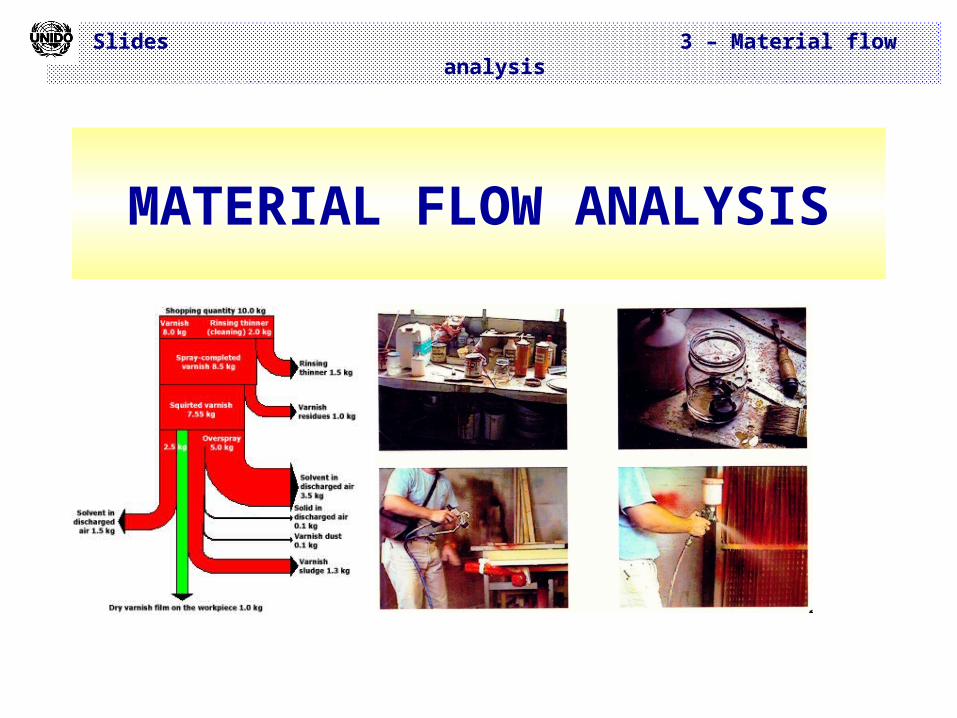
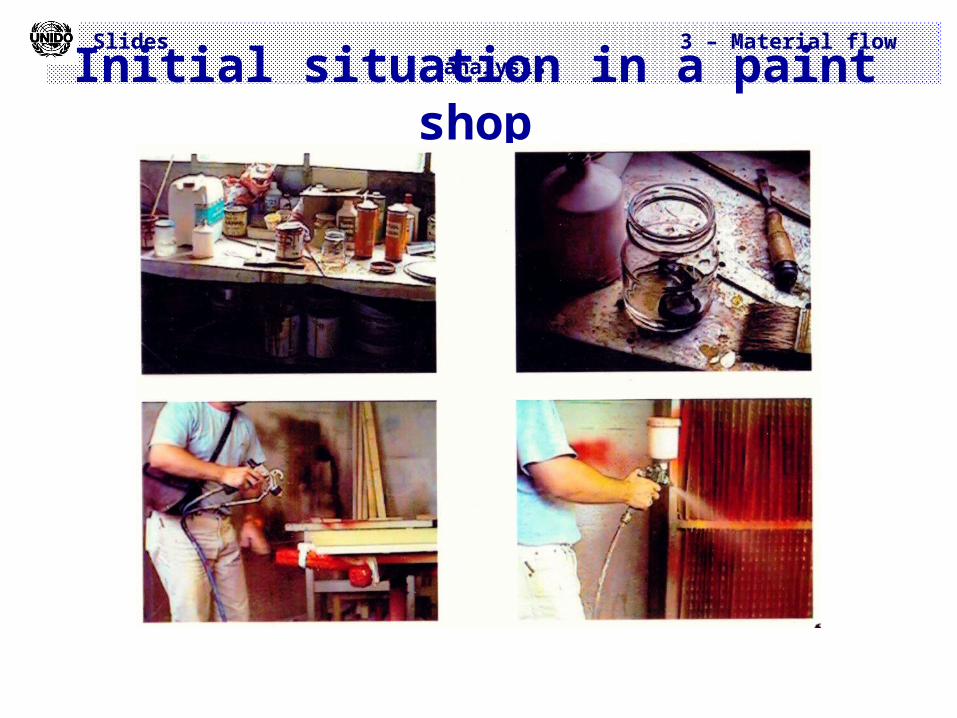
Initial situation in a paint shop
Slides 3 – Material flow analysis
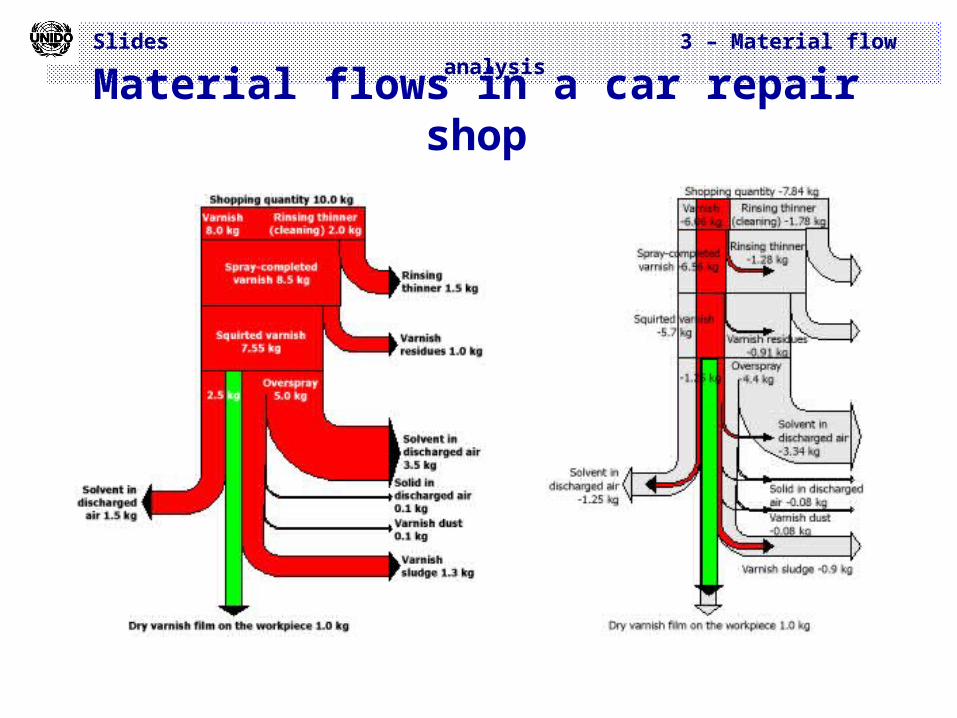
Material flows in a car repair shop
Slides 3 – Material flow analysis
How does a balance work?
Input mass = Output mass+ Storage
(Without chemical reaction)
Slides 3 – Material flow analysis
Material flow analysis and eco-balances
Eco-balancesAnalyse the whole life-cycle of a
productAnalyse the ecological effects Assess the material and energy
consumptions emerging during a life cycle and the arising environmental effects.
Slides 3 – Material flow analysis
Objectives of a material flow analysis
Trace the flow of raw materials through the company to establish connections within the process
Retrace waste and emissions to the point where they are generated
Identify weak points (inefficiencies)Define the basis for evaluationEdit data in a decision-oriented waySet priorities for appropriate measures
to minimize waste and emissions
Slides 3 – Material flow analysis
Criteria for the selection of a material
Quantity of the material flow
Costs of the material flow
Toxicity of the material flow
Legal aspects of the material flow
Slides 3 – Material flow analysis
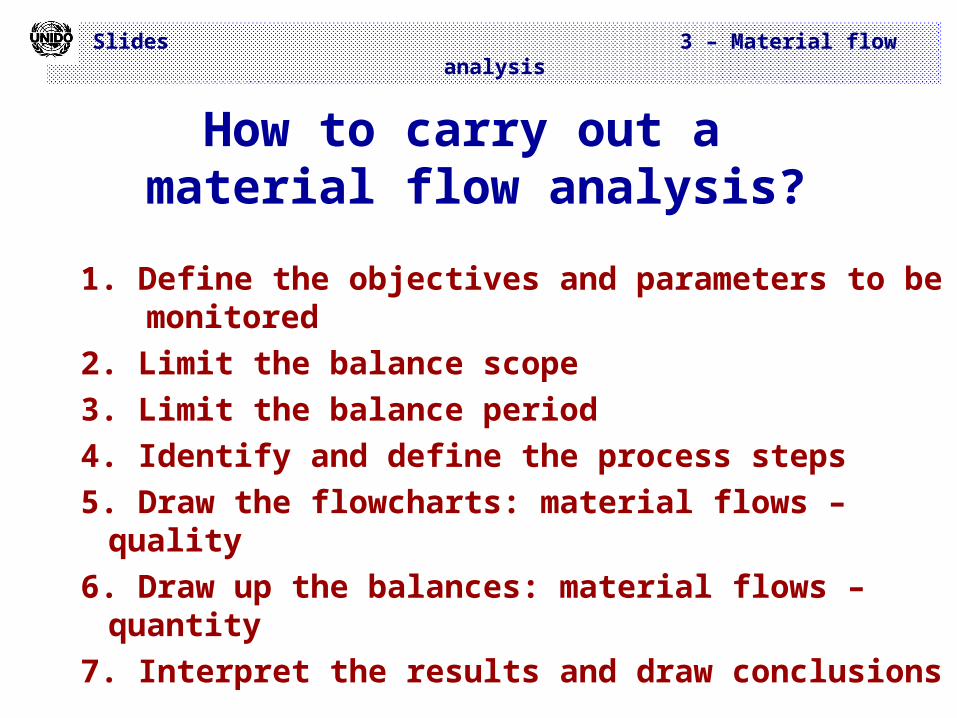
How to carry out a material flow analysis?
1. Define the objectives and parameters to be monitored
2. Limit the balance scope3. Limit the balance period4. Identify and define the process steps5. Draw the flowcharts: material flows – quality6. Draw up the balances: material flows –
quantity7. Interpret the results and draw conclusions
Slides 3 – Material flow analysis
Material flow analysis of machine painting
Slides 3 – Material flow analysis
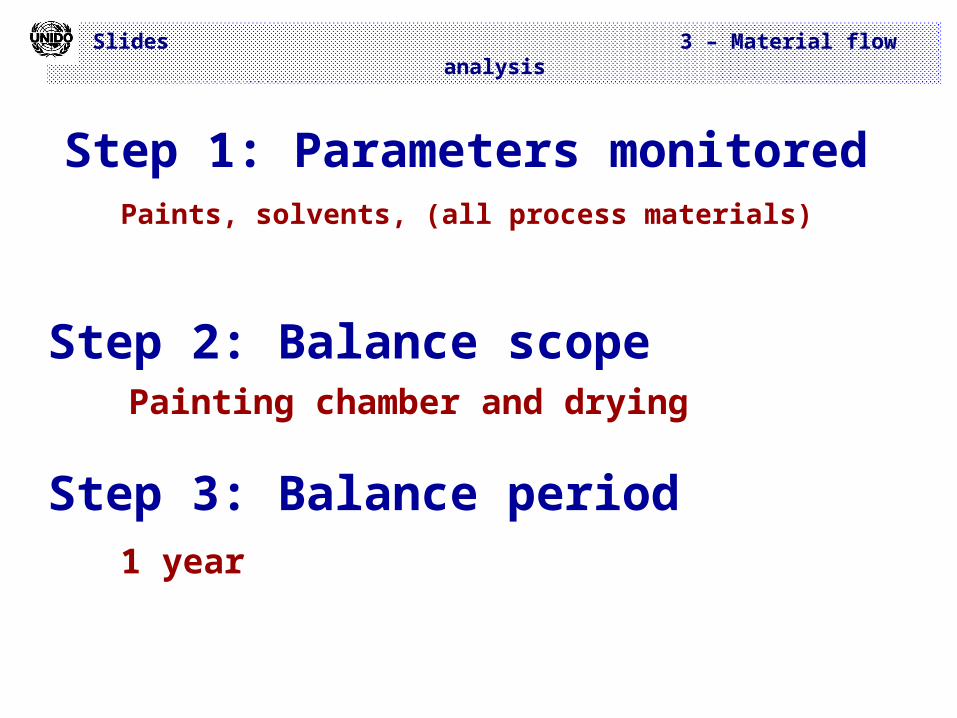
Step 1: Parameters monitoredPaints, solvents, (all process materials)
Step 2: Balance scopePainting chamber and drying
Step 3: Balance period1 year
Slides 3 – Material flow analysis
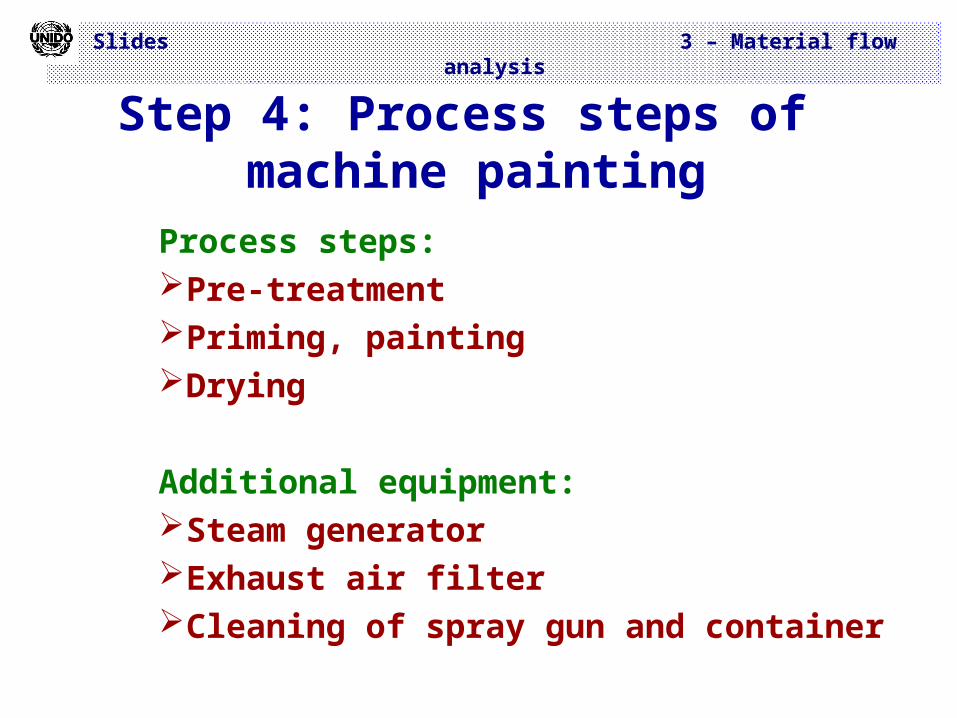
Step 4: Process steps of machine painting
Process steps:Pre-treatmentPriming, paintingDrying
Additional equipment:Steam generatorExhaust air filterCleaning of spray gun and container
Slides 3 – Material flow analysis
Step 5: Flowchart
Representing process steps by rectangles Representing material flows by arrows
Slides 3 – Material flow analysis
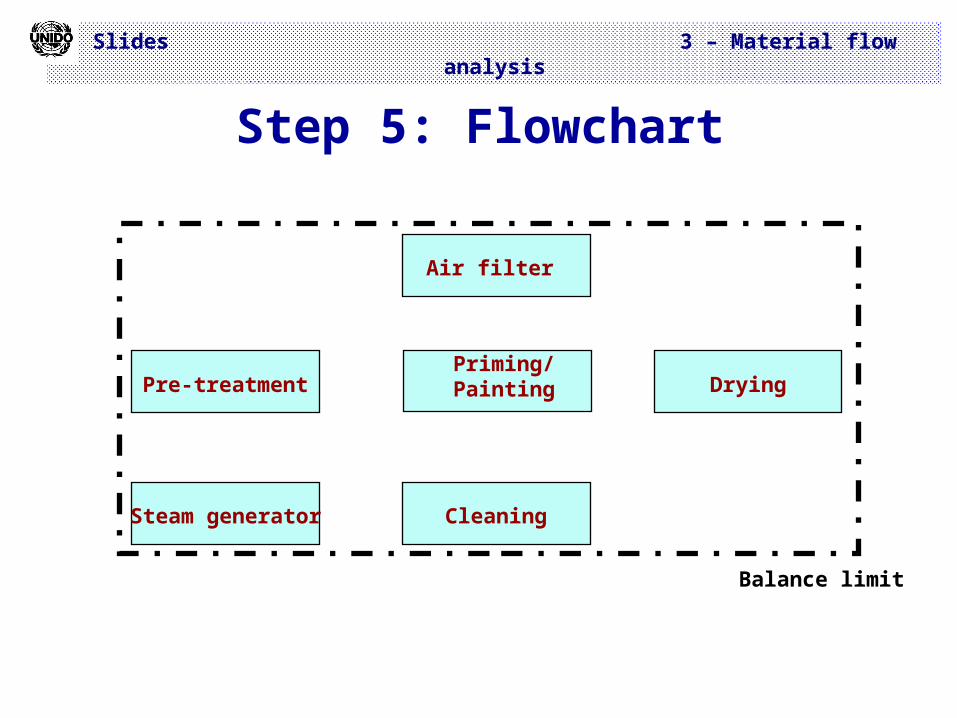
Step 5: Flowchart
Pre-treatmentPriming/Painting Drying
Air filter
CleaningSteam generator
Balance limit
Slides 3 – Material flow analysis
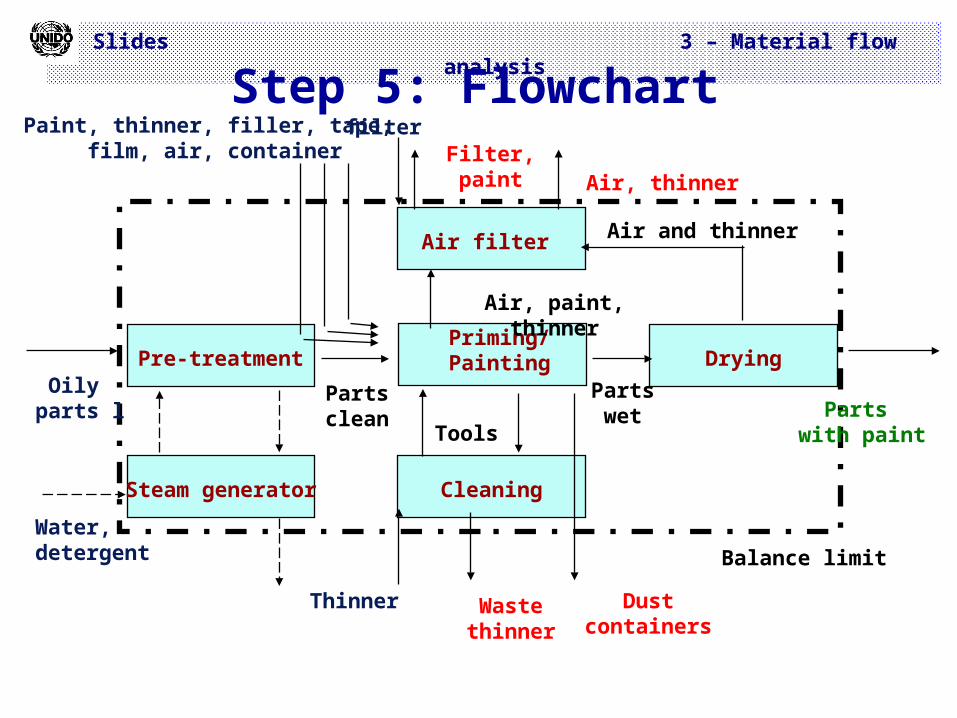
Step 5: Flowchart
Pre-treatmentPriming/Painting Drying
Air filter
CleaningSteam generator
Balance limit
Oily parts l Parts
with paint
Partsclean
Partswet
Thinner Wastethinner
Air and thinner
Air, paint, thinner
Air, thinnerFilter, paint
Paint, thinner, filler, tape, film, air, container
filter
Tools
Dustcontainers
Water,detergent

Slides 3 – Material flow analysis
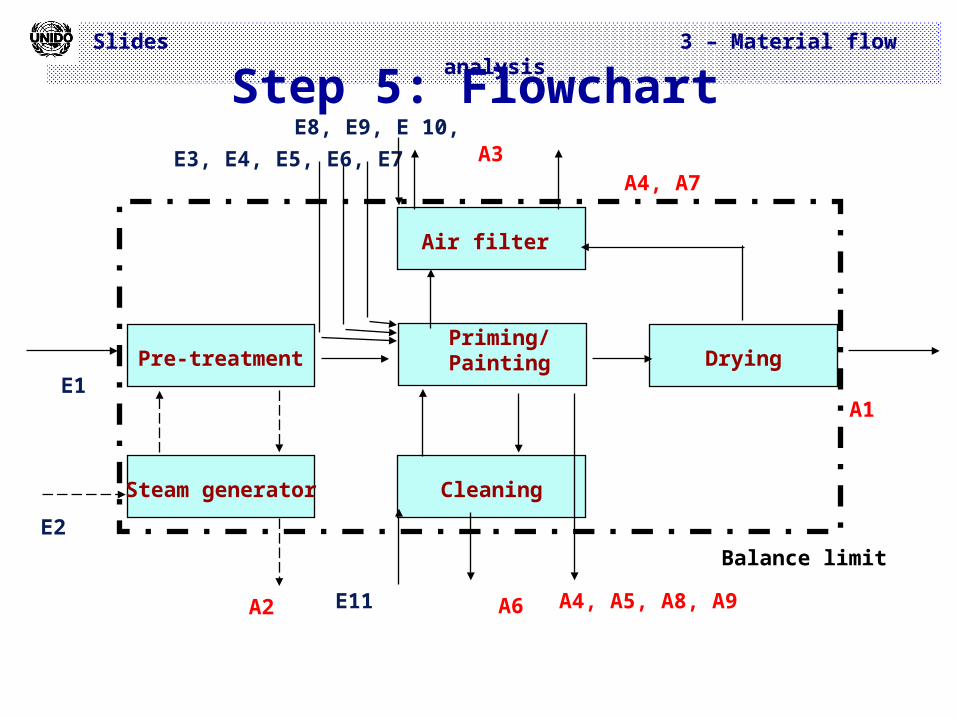
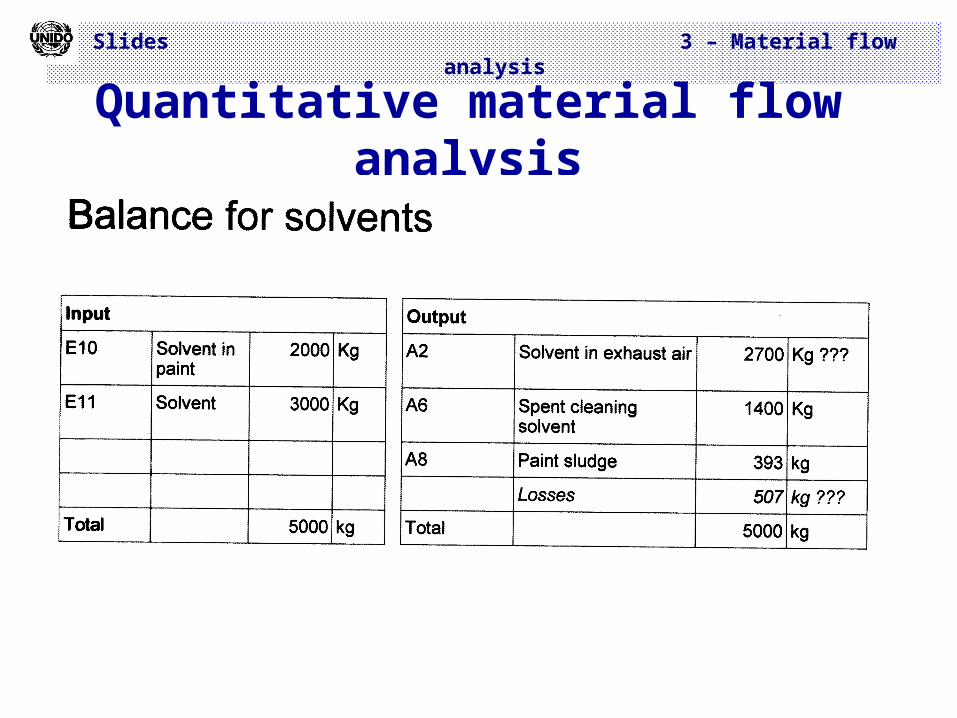
Input = output for the whole systemInput = output for the single steps
Step 6: Balances
Slides 3 – Material flow analysis
Step 5: Flowchart
Pre-treatmentPriming/Painting Drying
Air filter
CleaningSteam generator
Balance limit
E1A1
E11 A6
A4, A7A3E3, E4, E5, E6, E7
E8, E9, E 10,
A4, A5, A8, A9
E2
A2
Slides 3 – Material flow analysis
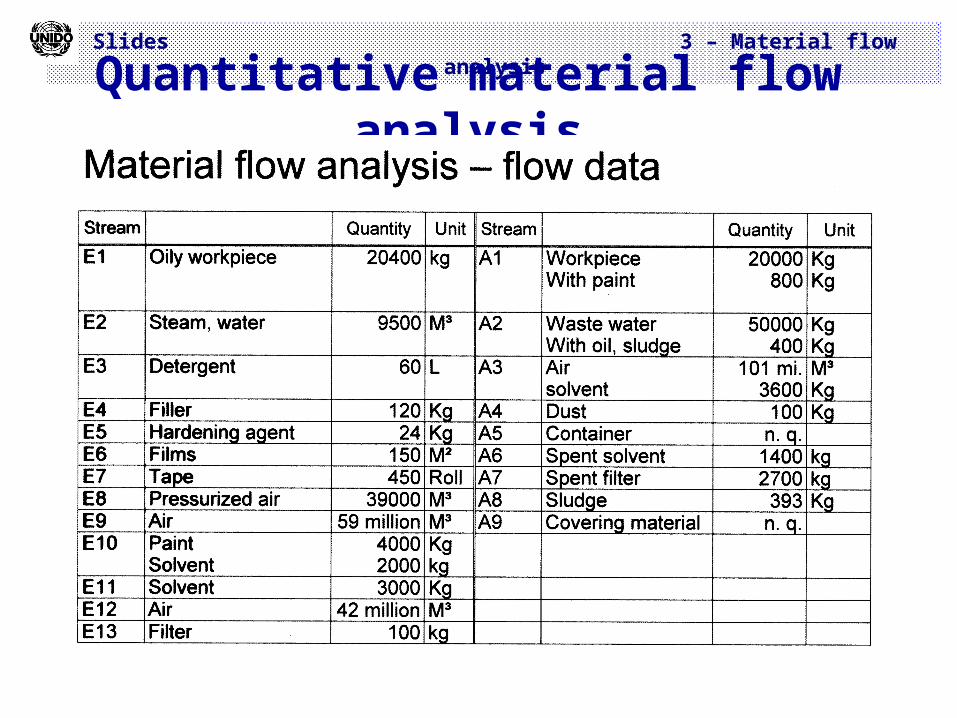
Quantitative material flow analysis
Slides 3 – Material flow analysis
Quantitative material flow analysis
Slides 3 – Material flow analysis
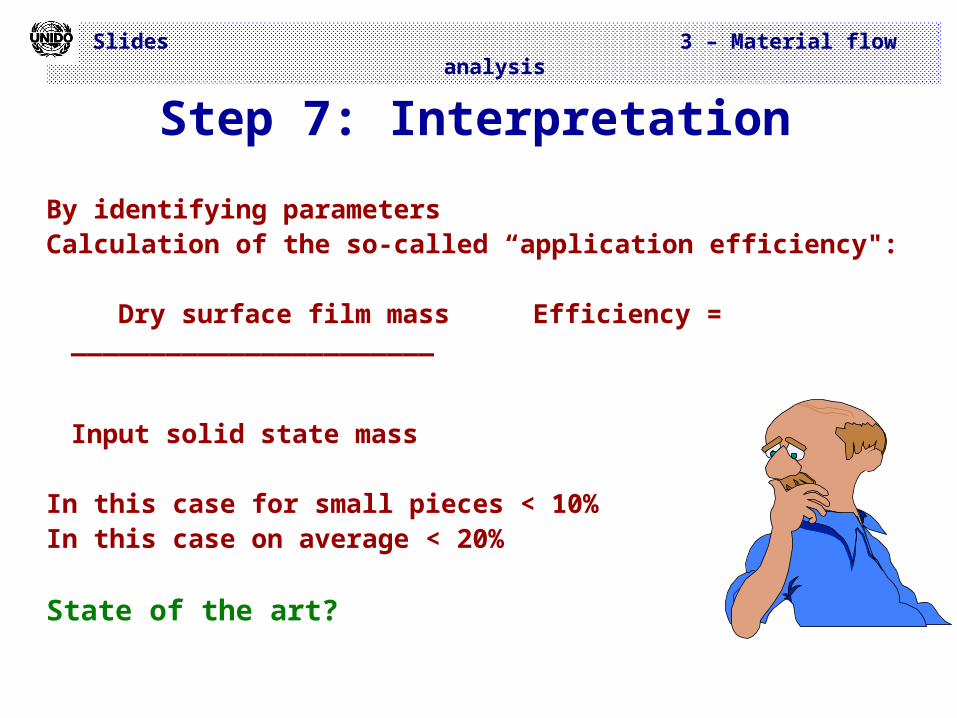
Step 7: Interpretation
By identifying parametersCalculation of the so-called “application efficiency":
Dry surface film mass Efficiency = _______________________
Input solid state mass
In this case for small pieces < 10% In this case on average < 20%
State of the art?

Slides 3 – Material flow analysis
Typical efficiencies (application efficiency, expressed in %
solids):Conventional 35-50%
HVLP 50-70%
Airless 40-75%
Electrostatic 50-85%
Rotating disc 75-90%
Dipping 90%
Pouring 95%
Rolling 98%
Slides 3 – Material flow analysis
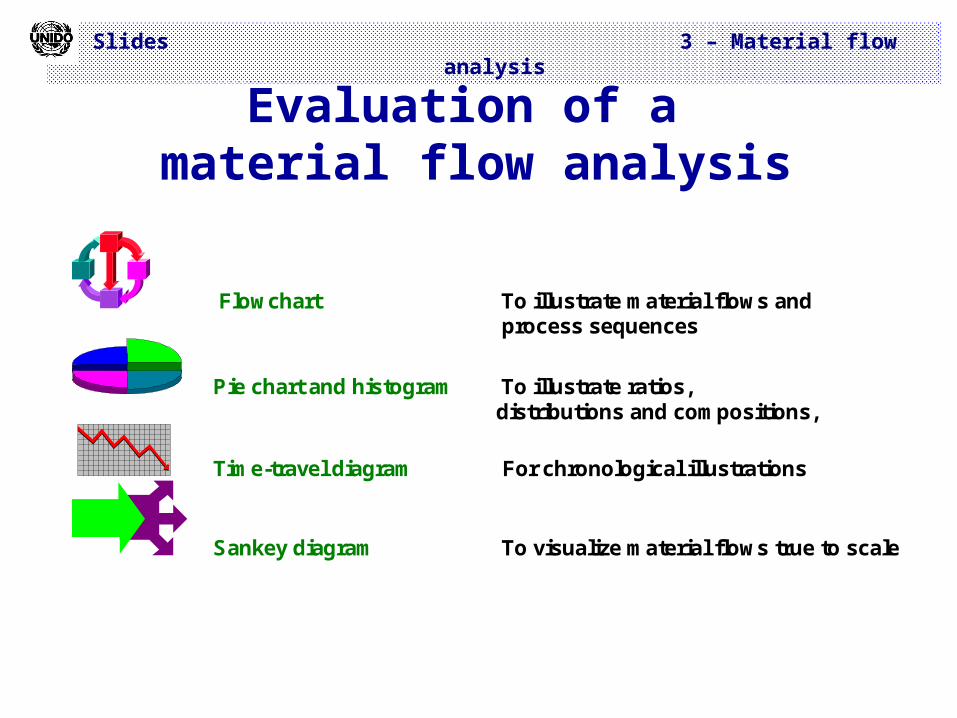
Evaluation of a material flow analysis
Flowchart To illustrate material flows and process sequences
Pie chart and histogram To illustrate ratios, distributions and compositions,
Time-travel diagram For chronological illustrations
Sankey diagram To visualize material flows true to scale
Slides 3 – Material flow analysis
Evaluation of a material flow analysis – 2
Possible parameters:
Efficiency factors (ratio of use to costs)Quality factors (ratio of real efficiency factor
to the theoretically possible efficiency factor)
Linkage with costs
Slides 3 – Material flow analysis
Data sourcesAccountingWarehousingCollection of process dataOperational accountingPersonal information (e.g. methods
engineer)EstimatesMeasurementsOriginal documents...
Slides 3 – Material flow analysis
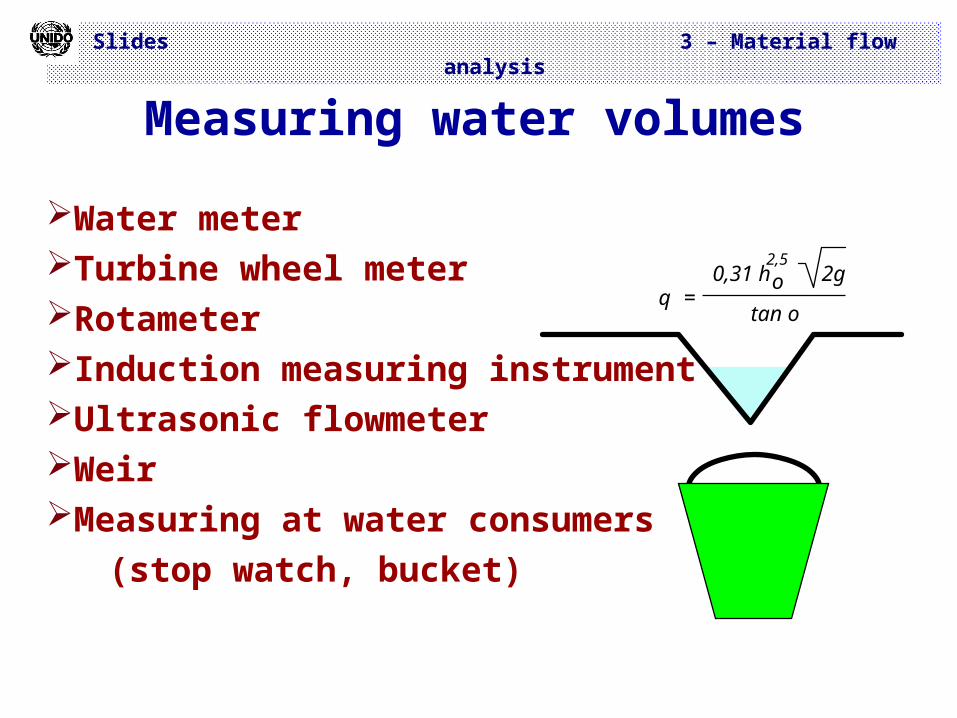
Measuring water volumes
Water meterTurbine wheel meterRotameterInduction measuring instrumentUltrasonic flowmeterWeirMeasuring at water consumers (stop watch, bucket)
q =0,31 h 2g
tan o
o2,5
Slides 3 – Material flow analysis
Recommendations 1 for a material flow analysis
Carry out the material flow analysis in steps
An estimate is better than doing nothing at all
Even with estimates it is possible to improve
80 – 90% of accuracy is sufficient
Use simple measuring instruments
Use indicators
If necessary, contact the supplier or plant manufacturer
Slides 3 – Material flow analysis
It is not essential to follow the instructions or procedures in great detail, a creative approach is often helpful.
Even by simply working with the balances you can sometimes achieve improvements.
It is important to translate the results into the language of the respective target group (monetary units, kg, pictures, comparisons, etc.)
Recommendations – 2 for a material flow analysis