Embed Size (px)
Citation preview
23.03.2018
Universitätsstr. 15 D-45141 Essen Fon: +49 (0)201 183-2757 Fax: +49 (0)201 183-2710
E-Mail: [email protected] www.uni-due.de/iml
INSTITUTE FOR
Metal and Lightweight Structures Prof. Dr.-Ing. habil. Natalie Stranghöner
Faculty of Civil Engineering and Geosciences, Department of
Steel and Composite Structures Prof. Dr. Milan Veljkovic
Stevinweg 1 | 2628CN Delft, Netherlands | Phone: +31 (0)152784034 E-Mail: [email protected] | www.tudelft.nl/citg
Slip factors for typical stainless steel surface finishes and new types of coatings for stainless steel
Deliverable report D6.2
WP 6 – Task 6.2 and Task 6.3
Prof. Dr.-Ing. habil. Natalie Stranghöner [email protected]
Nariman Afzali M.Sc. [email protected]
Peter de Vries M.Sc. [email protected]
RFCS Project No.: RFSR-CT-2014-00024
Project No.: UDE: 410410007-20003
Report No.: UDE: 2018-06
Part of the RFCS Research Project
“SIROCO”
Execution and reliability of slip-resistant connections for steel
structures using CS and SS

23.03.2018
2
Project No.: 410410007-20003 | Report No.: 2018-06
Slip factors for typical stainless steel surface finishes and new types of coatings for stainless steel
3 23.03.2018
Table of contents Page
1 Scope of investigation 5
2 State of the art 5
2.1 General 5
3 Experimental investigations 5
3.1 Pre-study 6
3.1.1 Establish the requirements for slip factor test 6
3.1.2 Influence of different surface treatment 9
3.2 Slip factor test according to Technical Annex 13
3.2.1 Test procedure according to Annex G of EN 1090-2 13
3.2.2 Test program 15
3.3 Results and discussions 18
3.3.1 General 18
3.3.2 Initial preload losses 20
3.3.3 Static tests 23
3.4 Creep tests 26
3.5 Extended creep tests 29
4 Conclusions 38
5 References 39
Appendix A Coating thickness and roughness measurement
Appendix B Slip factor test results (static and creep tests) – with HV M16 bolting assemblies
Appendix C Slip factor test results (static and creep tests) – with Bumax 88 bolting assemblies
Appendix D Slip factor test results (static and creep tests) – with Bumax 109 bolting assemblies

4 23.03.2018
Project No.: 410410007-20003 | Report No.: 2018-06
Slip factors for typical stainless steel surface finishes and new types of coatings for stainless steel
5 23.03.2018
1 Scope of investigation
The use of stainless steel components can lead to a significant reduction of maintenance costs compared to a structure executed in carbon steel. Because of its high material strength, ductility and corrosion resistance stainless steels are becoming more and more popular as a construction material in both building and civil engineering structures. Consequently, slip-resistant bolted connections made of stainless steel are becoming more important. Slip-resistant bolted connections are used in joints where slip is not acceptable (because they are subject to reversal of shear load or any other reason) or in joints that are subject to cyclic shear load (to improve the fatigue class of the connecting plates). Existing design codes/standards do not specify slip factors for surface treatments of stainless steel grades, the minimum values of slip factors for common surface treatments/coatings that are specified in EN 1090-2 are exclusively valid for carbon steels. One of the reasons for this is that stainless steel alloys are thought to suffer more than carbon steels from time dependent behaviour (creep and relaxation) at room temperature. This could lead to higher preload losses and consequently to lower slip factors than used for carbon steels with comparable surface treatment. However, no evidence of this can be found in literature. Creep and relaxation are stress dependant phenomena and the stresses in the components of preloaded bolted connections are locally highly non-uniform. Therefore, slip factors of different stainless steel grades have to be determined by experiments to investigate the effects of time dependant material behaviour. In this investigation, the results of slip factor tests on four stainless steel grades are presented and the influence of surface treatments and the preload level on the slip factor of stainless steel slip-resistant connections is discussed.
2 State of the art
2.1 General
The slip resistance of bolted slip-resistant connections is mainly determined by two factors: the condition of the faying surfaces and the preload level of the bolts. EN 1090-2 [1] defines slip factors only for slip-resistant connections made of carbon steel. Slip-resistant connections made of stainless steel are not standardized. This means that an individual qualification is required to apply stainless steel slip-resistant connections, which clearly hinders the expansion of the use of stainless steel in civil engineering and building constructions. In the frame of the European research project “Execution and reliability of slip-resistant connections for steel structures using CS and SS” (SIROCO), funded by the Research Fund for Coal and Steel (RFCS) of the European Community (RFSR-CT-2014-00024), a comprehensive first investigation has been conducted to define design parameters and slip factors for preloaded joints made of stainless steel that are subjected to shear loading.
The behaviour of preloaded bolted assemblies made of stainless steel components is thought to be influenced by creep and relaxation more than carbon steels in that way that preload losses resulting from the time-dependant behaviour would have a negative influence on the long term slip resistance and would consequently lead to reduced slip factors in comparison to those used for slip-resistant connections made of carbon steel.
3 Experimental investigations
Project No.: 410410007-20003 | Report No.: 2018-06
Slip factors for typical stainless steel surface finishes and new types of coatings for stainless steel
23.03.2018
6
3.1 Pre-study
Additional slip factor tests as originally planned according to the Technical Annex were carried out for two different purposes. First purpose was to establish the requirements for the test specimens and the most appropriate grades of stainless steel to test. The second purpose was to the effectivity of the surface treatment methods on the slip factors / friction coefficients of stainless steel plates. Tests were carried out on the stainless steel plates that were used in an earlier phase of the project to preliminary study the slip behaviour of stainless steel with ‘as rolled’ surface treatment (so called 1D surfaces).
3.1.1 Establish the requirements for slip factor test
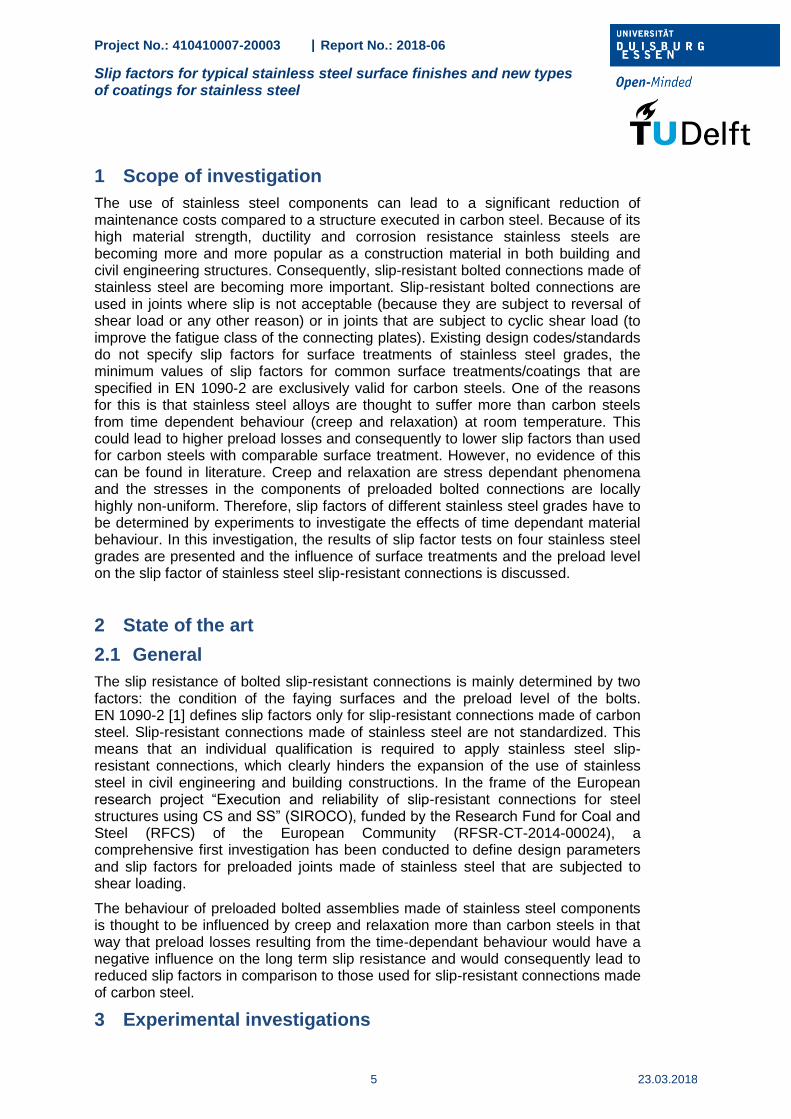
Two series of slip factor tests according to Annex G of EN 1090-2 were conducted to determine the slip coefficient of austenitic (1.4307) and duplex (1.4462 for 16 mm plates and 1.4401 for 8 mm plates) specimens. The test specimens consist of two inner plates (16 mm thickness) and two cover plates (8 mm thickness). Eight displacement transducers were used (as shown in Figure 1) to measure the relative displacement between an inner plate and a cover plate point, positions a and b as illustrated in Figure 1.
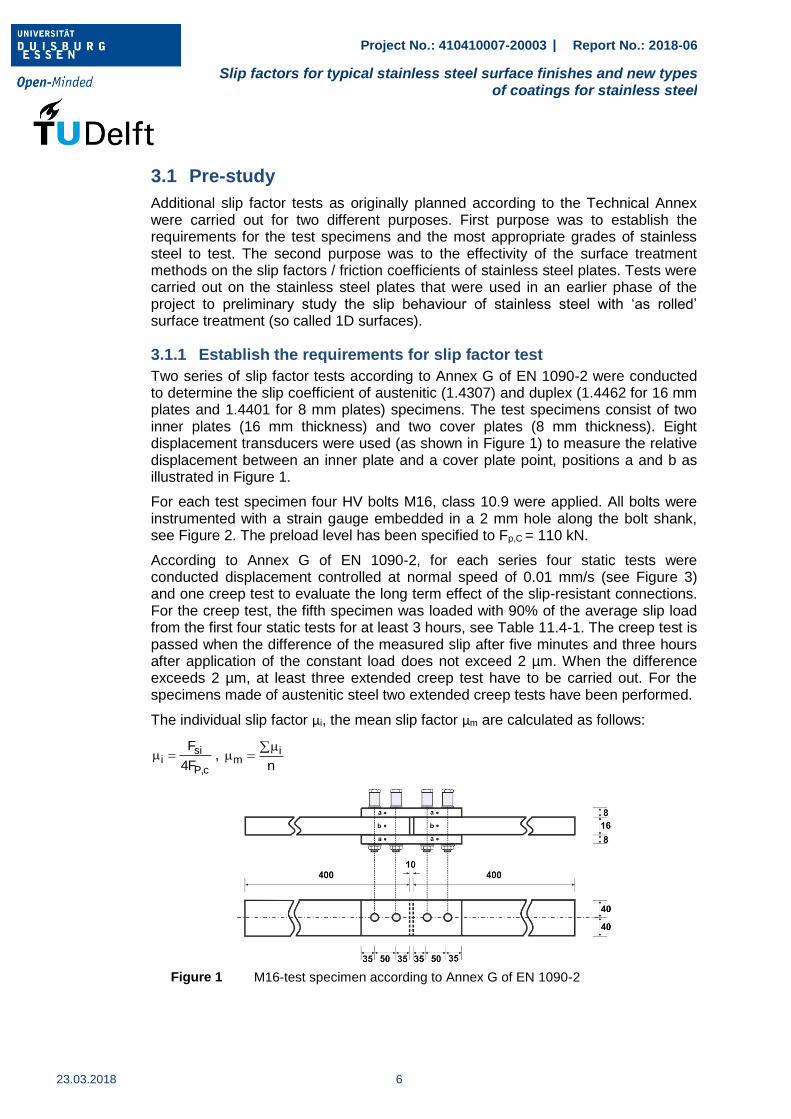
For each test specimen four HV bolts M16, class 10.9 were applied. All bolts were instrumented with a strain gauge embedded in a 2 mm hole along the bolt shank, see Figure 2. The preload level has been specified to Fp,C = 110 kN.
According to Annex G of EN 1090-2, for each series four static tests were conducted displacement controlled at normal speed of 0.01 mm/s (see Figure 3) and one creep test to evaluate the long term effect of the slip-resistant connections. For the creep test, the fifth specimen was loaded with 90% of the average slip load from the first four static tests for at least 3 hours, see Table 11.4-1. The creep test is passed when the difference of the measured slip after five minutes and three hours after application of the constant load does not exceed 2 µm. When the difference exceeds 2 µm, at least three extended creep test have to be carried out. For the specimens made of austenitic steel two extended creep tests have been performed.
The individual slip factor µi, the mean slip factor µm are calculated as follows:
sii
P,c
F
4F, i
mn
Figure 1 M16-test specimen according to Annex G of EN 1090-2
Project No.: 410410007-20003 | Report No.: 2018-06
Slip factors for typical stainless steel surface finishes and new types of coatings for stainless steel
7 23.03.2018
Figure 2 M16-Bolts with implanted strain gauges Figure 3 Test setup with eight LVDTs
Table 1 Test specimens and surface conditions
Series ID Surface finish t1)
[mm] t/d2)
[-]
Preload [kN]
Number of tests
µini,mean4)
st/st+ct [-]
µact,mean5)
st/st+ct [-]
V(µact)6)
st/st+ct [%]
Final slip factor
st/ct/ect3) µ5%
7) / µect
8)
Austenitic-Pre Hot rolled – 1D (as
received) 70 4.4 Fp,C/110
4/1/2 0.31/- 0.32/- 2.1/- -/0.15
Duplex-Pre 4/1/- 0.25/0.26 0.26/0.26 3.3/3.0 0.24/-
1) Ʃt: clamping length │2) d = 16 mm (bolt diameter) │3) st: static test/ct: creep-/ect: extended creep test │ 4) µini,mean: calculated slip factors as mean values considering the initial preload when the tests started │5)
µact,mean: calculated slip factors as mean values considering the actual preload at slip │6) V: Coefficient of
variation for µact│7) µ5%: slip factors as 5%-fractile calculated on the basis of the static tests and the passed
creep test 8) µect: slip factor as the result from the passed extended creep test
a) load-slip-displacement-curve b) µact- slip-displacement-curve
Figure 4 Influence of different plate material on the slip-load behaviour and actual slip factors
It can be seen from Table 1 that the highest static initial and actual slip factors were achieved for austenitic specimens. Figure 4 shows typical load-slip-displacement- and µact- slip-displacement-curves. The higher slip factors for austenitic specimens cannot be explained only by the type of material. Some surface characteristics like e. g. the surface roughness play also an important role for slip resistance behaviour
Tensile force
12
31
8 16 8
Bolt/Nut set EN 14399-4 – M16 × 90 – 10.9/10 – HV – tZn
Washer EN 14399-6 – 16 – tZn
30
Ø18
Ø 2
Strain Gauge
Adapter
8 5 9
70
36
Project No.: 410410007-20003 | Report No.: 2018-06
Slip factors for typical stainless steel surface finishes and new types of coatings for stainless steel
23.03.2018
8
of the connection and the slip factor can be strongly influenced by the surface condition/treatment of the specimens. For this reason, more tests have to be performed to investigate the influence of the plate material on the slip resistance behaviour of the connection.
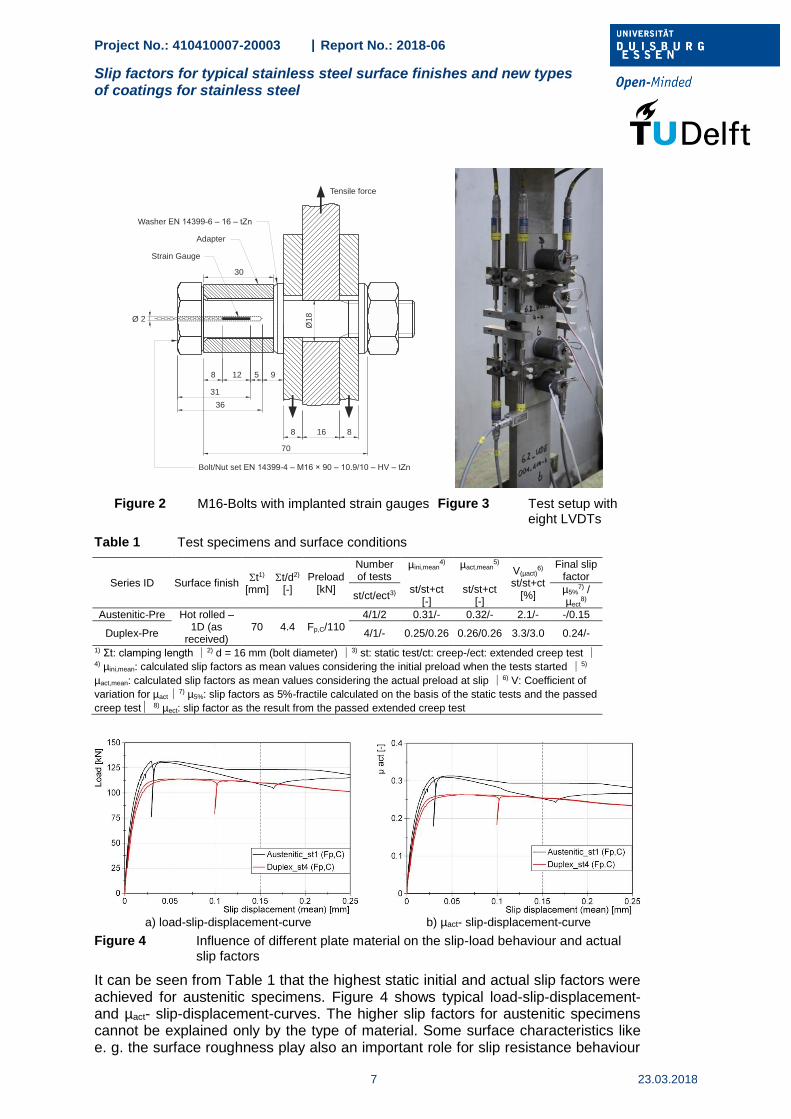
In the austenitic test series, the creep test was failed so that at least three extended creep tests were necessary to perform, see Figure 5.
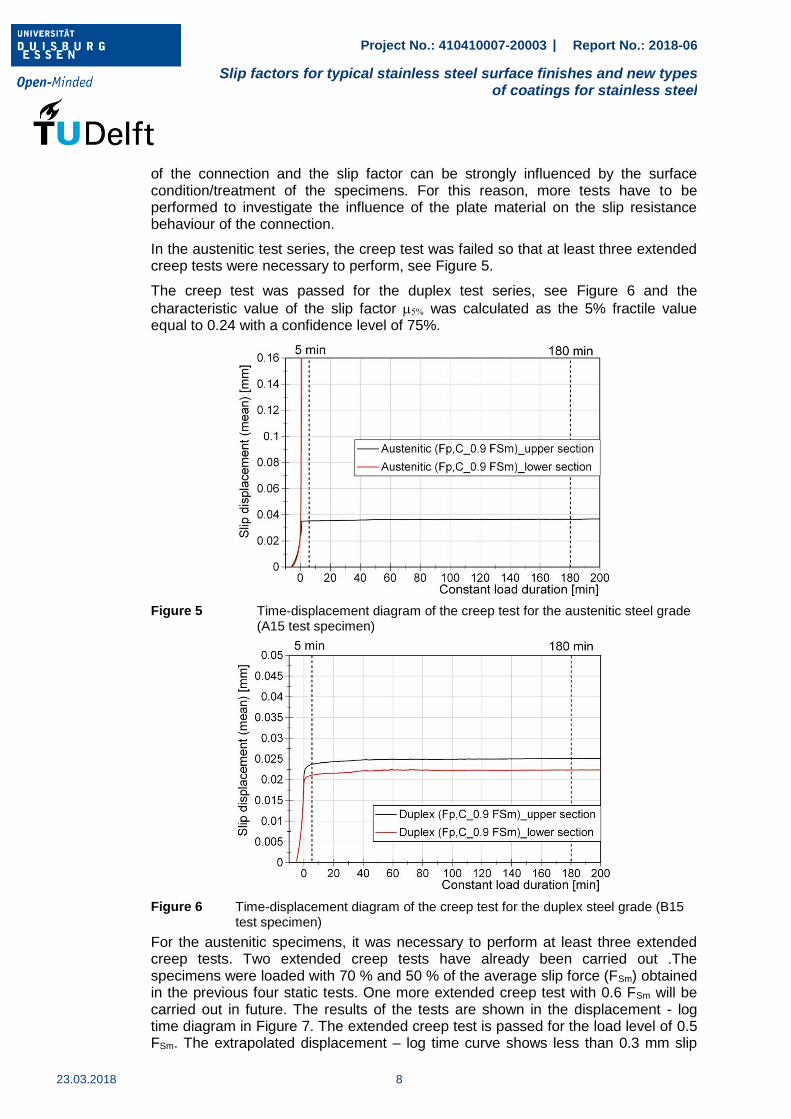
The creep test was passed for the duplex test series, see Figure 6 and the
characteristic value of the slip factor was calculated as the 5% fractile value equal to 0.24 with a confidence level of 75%.
Figure 5 Time-displacement diagram of the creep test for the austenitic steel grade (A15 test specimen)
Figure 6 Time-displacement diagram of the creep test for the duplex steel grade (B15 test specimen)
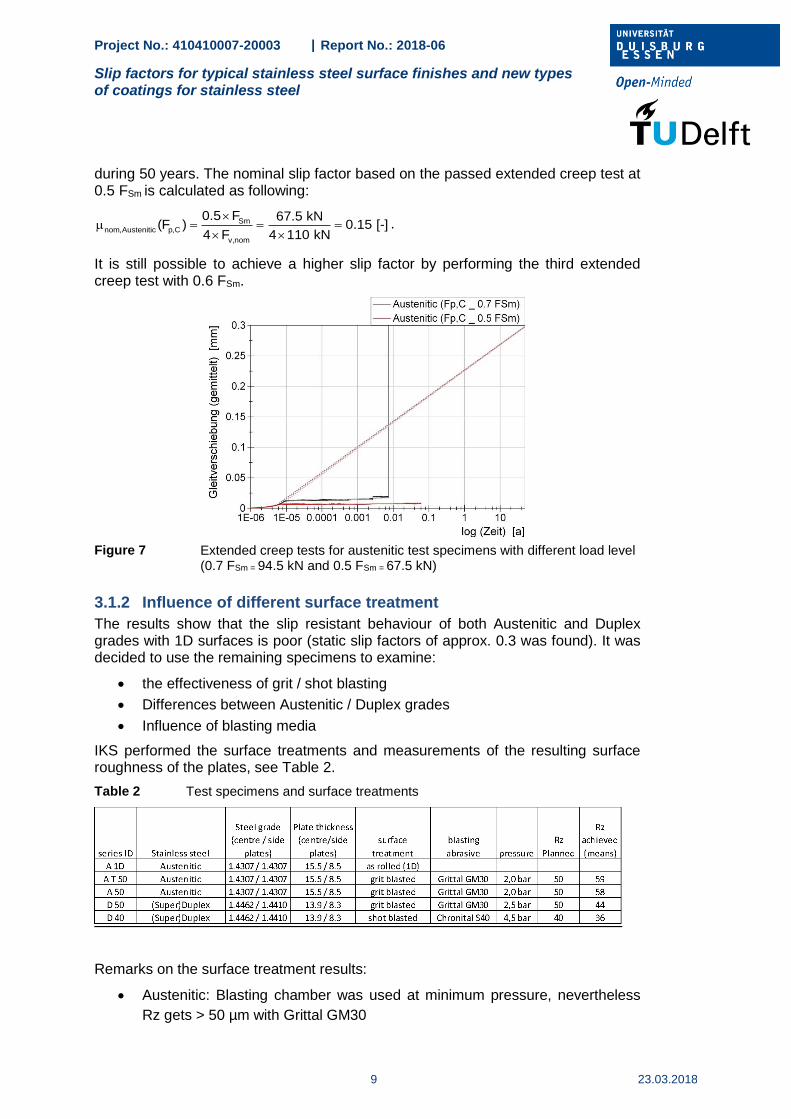
For the austenitic specimens, it was necessary to perform at least three extended creep tests. Two extended creep tests have already been carried out .The specimens were loaded with 70 % and 50 % of the average slip force (FSm) obtained in the previous four static tests. One more extended creep test with 0.6 FSm will be carried out in future. The results of the tests are shown in the displacement - log time diagram in Figure 7. The extended creep test is passed for the load level of 0.5 FSm. The extrapolated displacement – log time curve shows less than 0.3 mm slip
Project No.: 410410007-20003 | Report No.: 2018-06
Slip factors for typical stainless steel surface finishes and new types of coatings for stainless steel
9 23.03.2018
during 50 years. The nominal slip factor based on the passed extended creep test at 0.5 FSm is calculated as following:
Smnom,Austenitic p,C
v,nom
0.5 F 67.5 kN(F ) 0.15 [-]
4 F 4 110 kN.
It is still possible to achieve a higher slip factor by performing the third extended creep test with 0.6 FSm.
Figure 7 Extended creep tests for austenitic test specimens with different load level (0.7 FSm = 94.5 kN and 0.5 FSm = 67.5 kN)
3.1.2 Influence of different surface treatment
The results show that the slip resistant behaviour of both Austenitic and Duplex grades with 1D surfaces is poor (static slip factors of approx. 0.3 was found). It was decided to use the remaining specimens to examine:
the effectiveness of grit / shot blasting
Differences between Austenitic / Duplex grades
Influence of blasting media
IKS performed the surface treatments and measurements of the resulting surface roughness of the plates, see Table 2.
Table 2 Test specimens and surface treatments
Remarks on the surface treatment results:
Austenitic: Blasting chamber was used at minimum pressure, nevertheless
Rz gets > 50 µm with Grittal GM30
Project No.: 410410007-20003 | Report No.: 2018-06
Slip factors for typical stainless steel surface finishes and new types of coatings for stainless steel
23.03.2018
10
Duplex, despite high pressure, it was not possible to achieved Rz > 36 µm
with the Chronital S40 shot
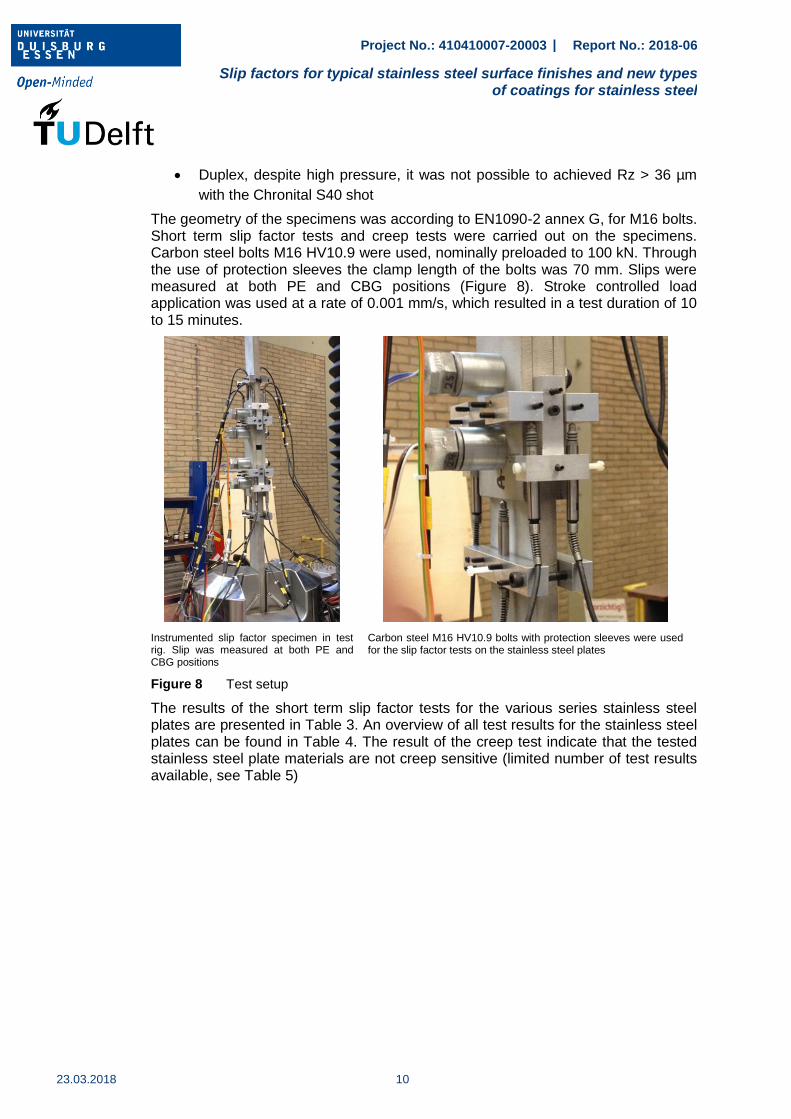
The geometry of the specimens was according to EN1090-2 annex G, for M16 bolts. Short term slip factor tests and creep tests were carried out on the specimens. Carbon steel bolts M16 HV10.9 were used, nominally preloaded to 100 kN. Through the use of protection sleeves the clamp length of the bolts was 70 mm. Slips were measured at both PE and CBG positions (Figure 8). Stroke controlled load application was used at a rate of 0.001 mm/s, which resulted in a test duration of 10 to 15 minutes.
Instrumented slip factor specimen in test rig. Slip was measured at both PE and CBG positions
Carbon steel M16 HV10.9 bolts with protection sleeves were used for the slip factor tests on the stainless steel plates
Figure 8 Test setup
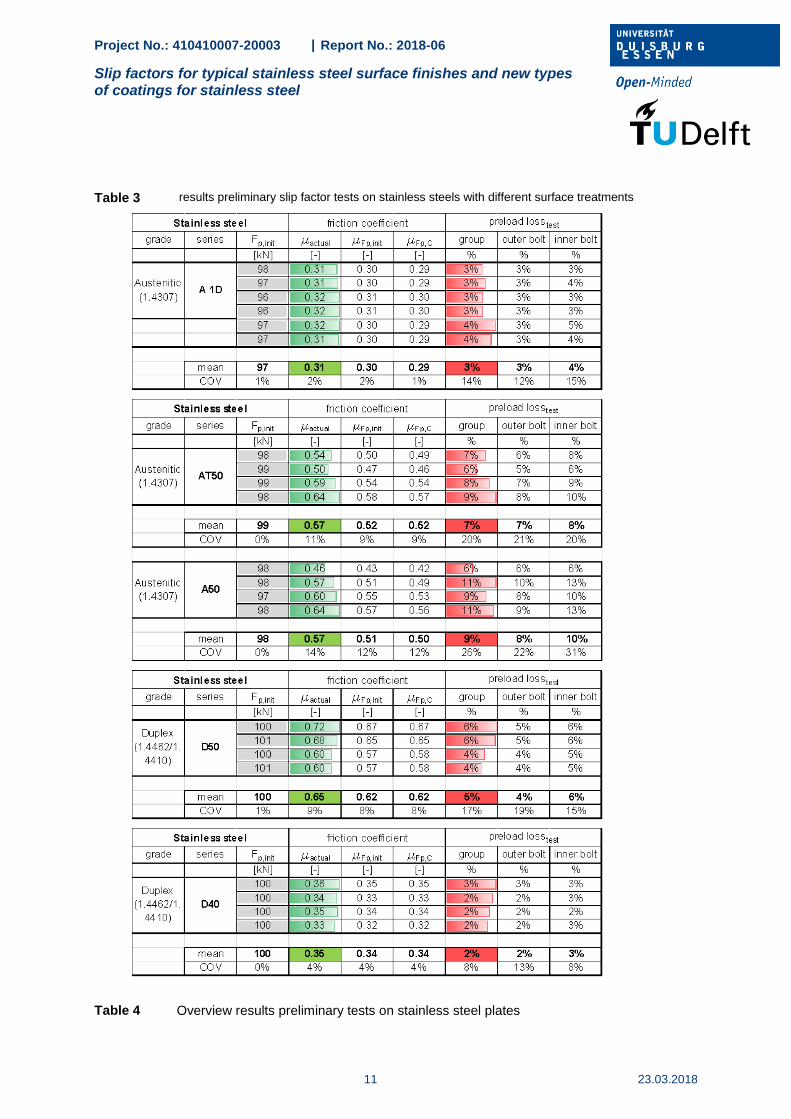
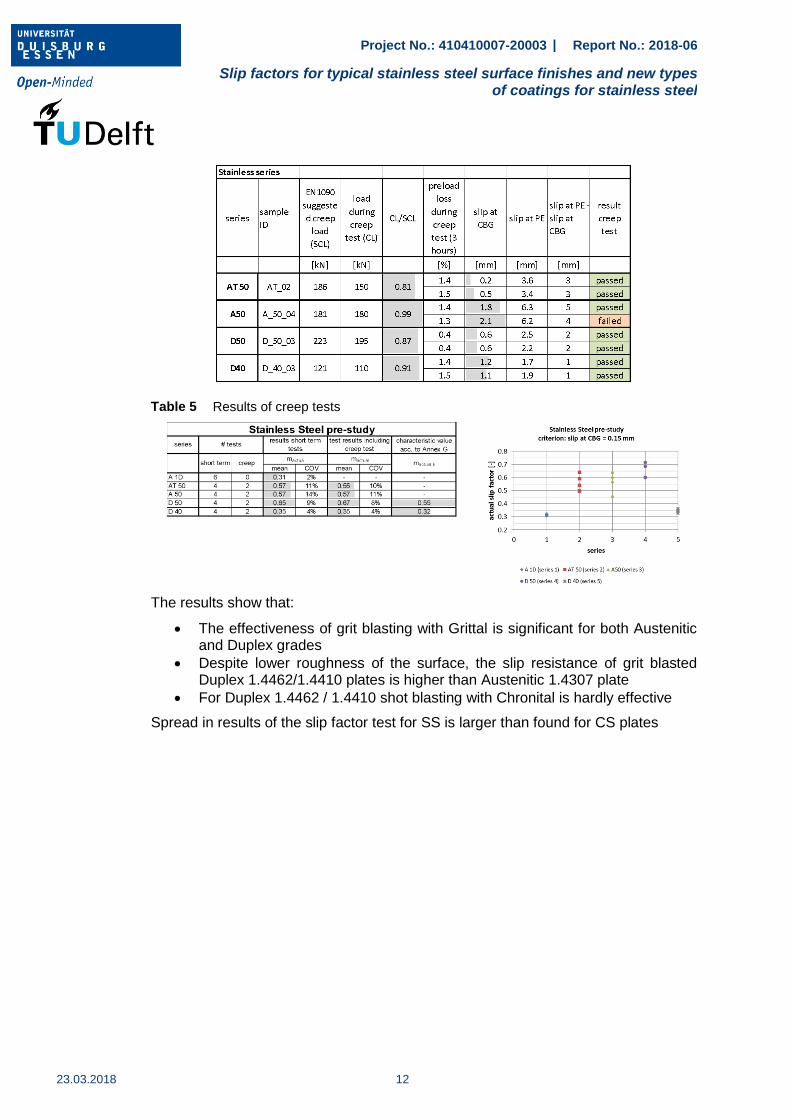
The results of the short term slip factor tests for the various series stainless steel plates are presented in Table 3. An overview of all test results for the stainless steel plates can be found in Table 4. The result of the creep test indicate that the tested stainless steel plate materials are not creep sensitive (limited number of test results available, see Table 5)
Project No.: 410410007-20003 | Report No.: 2018-06
Slip factors for typical stainless steel surface finishes and new types of coatings for stainless steel
11 23.03.2018
Table 3 results preliminary slip factor tests on stainless steels with different surface treatments
Table 4 Overview results preliminary tests on stainless steel plates
Project No.: 410410007-20003 | Report No.: 2018-06
Slip factors for typical stainless steel surface finishes and new types of coatings for stainless steel
23.03.2018
12
Table 5 Results of creep tests
The results show that:
The effectiveness of grit blasting with Grittal is significant for both Austenitic and Duplex grades
Despite lower roughness of the surface, the slip resistance of grit blasted Duplex 1.4462/1.4410 plates is higher than Austenitic 1.4307 plate
For Duplex 1.4462 / 1.4410 shot blasting with Chronital is hardly effective
Spread in results of the slip factor test for SS is larger than found for CS plates
Project No.: 410410007-20003 | Report No.: 2018-06
Slip factors for typical stainless steel surface finishes and new types of coatings for stainless steel
13 23.03.2018
3.2 Slip factor test according to Technical Annex
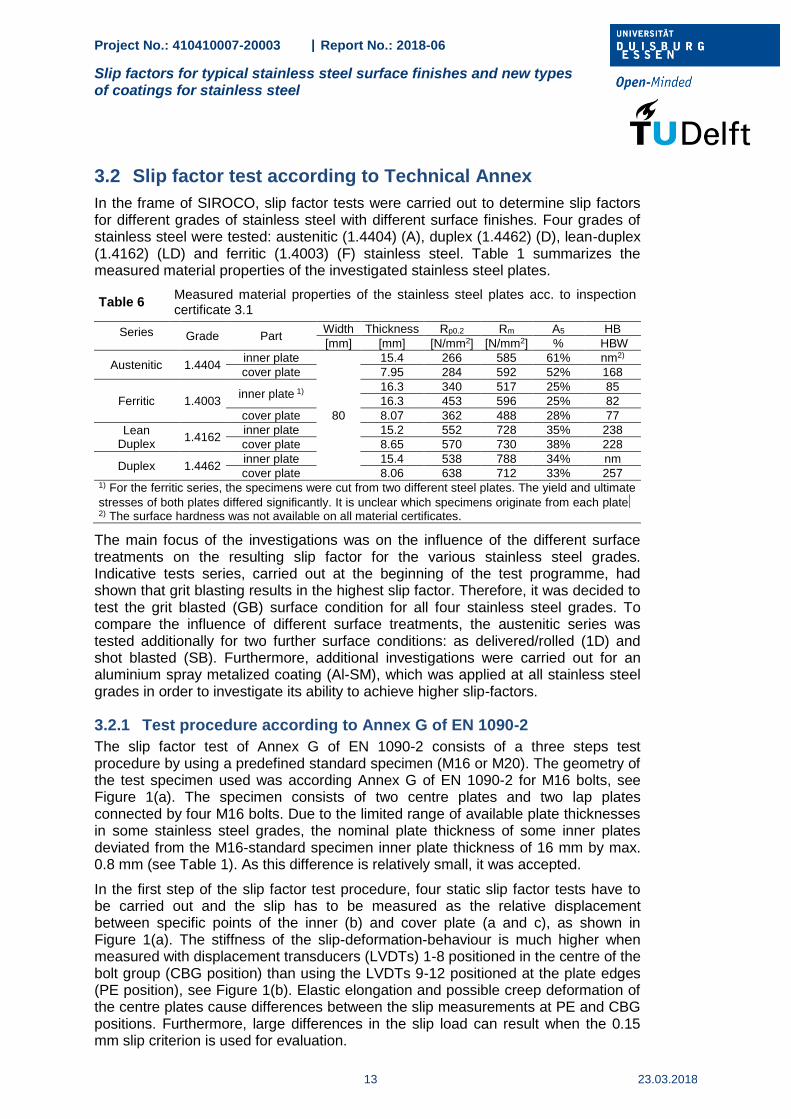
In the frame of SIROCO, slip factor tests were carried out to determine slip factors for different grades of stainless steel with different surface finishes. Four grades of stainless steel were tested: austenitic (1.4404) (A), duplex (1.4462) (D), lean-duplex (1.4162) (LD) and ferritic (1.4003) (F) stainless steel. Table 1 summarizes the measured material properties of the investigated stainless steel plates.
Table 6 Measured material properties of the stainless steel plates acc. to inspection certificate 3.1
Series Grade Part Width Thickness Rp0.2 Rm A5 HB
[mm] [mm] [N/mm2] [N/mm2] % HBW
Austenitic 1.4404 inner plate
80
15.4 266 585 61% nm2)
cover plate 7.95 284 592 52% 168
Ferritic 1.4003 inner plate 1) 16.3 340 517 25% 85
16.3 453 596 25% 82
cover plate 8.07 362 488 28% 77
Lean Duplex
1.4162 inner plate 15.2 552 728 35% 238
cover plate 8.65 570 730 38% 228
Duplex 1.4462 inner plate 15.4 538 788 34% nm
cover plate 8.06 638 712 33% 257 1) For the ferritic series, the specimens were cut from two different steel plates. The yield and ultimate
stresses of both plates differed significantly. It is unclear which specimens originate from each plate 2) The surface hardness was not available on all material certificates.
The main focus of the investigations was on the influence of the different surface treatments on the resulting slip factor for the various stainless steel grades. Indicative tests series, carried out at the beginning of the test programme, had shown that grit blasting results in the highest slip factor. Therefore, it was decided to test the grit blasted (GB) surface condition for all four stainless steel grades. To compare the influence of different surface treatments, the austenitic series was tested additionally for two further surface conditions: as delivered/rolled (1D) and shot blasted (SB). Furthermore, additional investigations were carried out for an aluminium spray metalized coating (Al-SM), which was applied at all stainless steel grades in order to investigate its ability to achieve higher slip-factors.
3.2.1 Test procedure according to Annex G of EN 1090-2
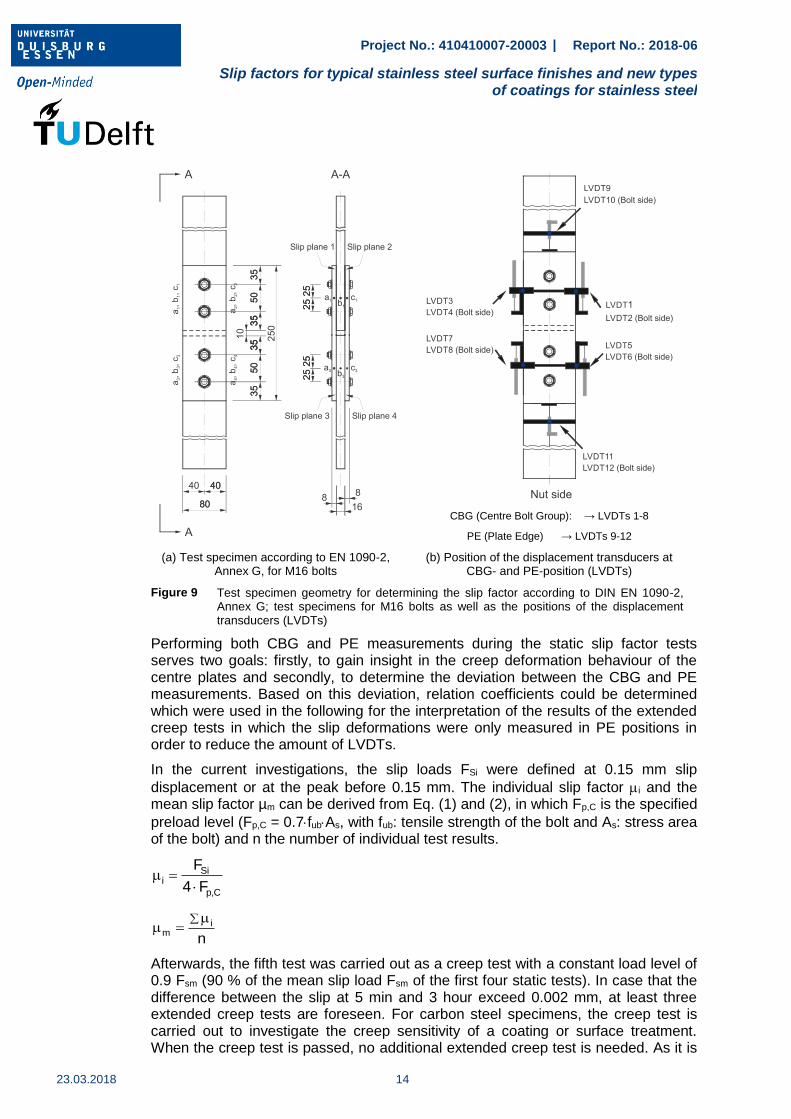
The slip factor test of Annex G of EN 1090-2 consists of a three steps test procedure by using a predefined standard specimen (M16 or M20). The geometry of the test specimen used was according Annex G of EN 1090-2 for M16 bolts, see Figure 1(a). The specimen consists of two centre plates and two lap plates connected by four M16 bolts. Due to the limited range of available plate thicknesses in some stainless steel grades, the nominal plate thickness of some inner plates deviated from the M16-standard specimen inner plate thickness of 16 mm by max. 0.8 mm (see Table 1). As this difference is relatively small, it was accepted.
In the first step of the slip factor test procedure, four static slip factor tests have to be carried out and the slip has to be measured as the relative displacement between specific points of the inner (b) and cover plate (a and c), as shown in Figure 1(a). The stiffness of the slip-deformation-behaviour is much higher when measured with displacement transducers (LVDTs) 1-8 positioned in the centre of the bolt group (CBG position) than using the LVDTs 9-12 positioned at the plate edges (PE position), see Figure 1(b). Elastic elongation and possible creep deformation of the centre plates cause differences between the slip measurements at PE and CBG positions. Furthermore, large differences in the slip load can result when the 0.15 mm slip criterion is used for evaluation.
Project No.: 410410007-20003 | Report No.: 2018-06
Slip factors for typical stainless steel surface finishes and new types of coatings for stainless steel
23.03.2018
14
CBG (Centre Bolt Group): → LVDTs 1-8
PE (Plate Edge) → LVDTs 9-12
(a) Test specimen according to EN 1090-2, Annex G, for M16 bolts
(b) Position of the displacement transducers at CBG- and PE-position (LVDTs)
Figure 9 Test specimen geometry for determining the slip factor according to DIN EN 1090-2, Annex G; test specimens for M16 bolts as well as the positions of the displacement transducers (LVDTs)
Performing both CBG and PE measurements during the static slip factor tests serves two goals: firstly, to gain insight in the creep deformation behaviour of the centre plates and secondly, to determine the deviation between the CBG and PE measurements. Based on this deviation, relation coefficients could be determined which were used in the following for the interpretation of the results of the extended creep tests in which the slip deformations were only measured in PE positions in order to reduce the amount of LVDTs.
In the current investigations, the slip loads FSi were defined at 0.15 mm slip
displacement or at the peak before 0.15 mm. The individual slip factor i and the mean slip factor µm can be derived from Eq. (1) and (2), in which Fp,C is the specified
preload level (Fp,C = 0.7fubAs, with fub: tensile strength of the bolt and As: stress area of the bolt) and n the number of individual test results.
Sii
p,C
F
4 F
(1)
im
n
(2)
Afterwards, the fifth test was carried out as a creep test with a constant load level of 0.9 Fsm (90 % of the mean slip load Fsm of the first four static tests). In case that the difference between the slip at 5 min and 3 hour exceed 0.002 mm, at least three extended creep tests are foreseen. For carbon steel specimens, the creep test is carried out to investigate the creep sensitivity of a coating or surface treatment. When the creep test is passed, no additional extended creep test is needed. As it is
Project No.: 410410007-20003 | Report No.: 2018-06
Slip factors for typical stainless steel surface finishes and new types of coatings for stainless steel
15 23.03.2018
unclear if the EN 1090-2 criterion for judging the creep sensitivity also applies to slip-resistant connections made of stainless steel components, extended creep tests were conducted on all test series, independently of the outcome of the creep test.
In addition to the requirements of EN 1090-2, in the investigations presented here, the slip factors were also evaluated by considering the initial preload at the
beginning of the test ini and the measured actual preload at the onset of slip act. All results are based on the slip measured in the centre bolt group (CBG) position.
3.2.2 Test program
Herewith, in total 20 test series with different stainless steel grades, surface treatments and preload levels were investigated. The test matrix is presented in Table 2. In this table all information regarding the surface preparation, clamp length of the bolting assemblies and preload levels can be found.
Table 7 Test programme
Series ID Steel grade
Surface condition
t2) [mm]
Preload
[kN]
Number of tests
Surface finish /
Rz1) [µm]
Type of coating
Coating thickness [µm]
st/ct/ect3)
M16 × 100 Bumax 88 (property class 8.8)
A_1D_B88 1.4404 1D4) / 24 - - 74 Fp,C/88 4/1/-
A_SB_B88 1.4404 SB5) / 38 - - 74 Fp,C/88 4/-/-
A_GB_B88 1.4404 GB6) / 45 - - 74 Fp,C/88 4/1/1
D_GB_B88 1.4462 GB / 47 - - 74 Fp,C/88 4/1/1
LD_GB_B88 1.4162 GB / 41 - - 74 Fp,C/88 4/-/-
F_GB_B88 1.4003 GB / 45 - - 74 Fp,C/88 4/-/3
A_Al-SM_B88 1.4404 GB / 45 Al-SM 1007) 74 Fp,C/88 4/1/1
D_Al-SM_B88 1.4462 GB / 43 Al-SM 1168) 74 Fp,C/88 4/1/1
LD_Al-SM_B88 1.4162 GB / 51 Al-SM 1058) 74 Fp,C/88 4/1/1
F_Al-SM_B88 1.4003 GB / 44 Al-SM 918) 74 Fp,C/88 4/1/1
M16 × 100 Bumax 109 (property class 10.9)
A_1D_B109 1.4404 1D / 24 - - 77 Fp,C/110 4/2/2
A_SB_B109 1.4404 SB / 34 - - 77 Fp,C/110 4/2/1
A_GB_B109 1.4404 GB / 41 - - 77 Fp,C/110 4/2/1
D_GB_B109 1.4462 GB / 47 - - 77 Fp,C/110 4/2/2
LD_GB_B109 1.4162 GB / 40 - - 77 Fp,C/110 4/2/1
F_GB_B109 1.4003 GB / 42 - - 77 Fp,C/110 4/2/2
A_Al-SM_B109 1.4404 GB / 45 Al-SM 1007) 77 Fp,C/110 4/2/1
D_Al-SM_B109 1.4462 GB / 43 Al-SM 1168) 77 Fp,C/110 4/2/1
LD_Al-SM_B109 1.4162 GB / 51 Al-SM 1058) 77 Fp,C/110 4/2/1
F_Al-SM_B109 1.4003 GB / 44 Al-SM 918) 77 Fp,C/110 4/2/1 1) Rz: roughness 2) t: clamping length 3) st: static test/ct: creep-/ect: extended creep test | 4) 1D surfaces | 5)
Shot blasted surfaces | 6) Grit blasted surfaces | 7) NDFT: nominal dry film thickness | 8) DFT: dry film thickness (measured value)
The Al-SM test specimens were blasted and the surface roughness was measured
according to EN ISO 4287 [3]. The measured roughness Rz of the faying surfaces
before coating was determined to 43 m to 51 m. The nominal coating thickness for the austenitic (A_Al-SM) test series was 100 (NDFT). For the other test series,
the coating thickness was measured according to ISO 2808 [4]. The measured
coating thicknesses were about 116 m, 105 m and 91 m for the duplex (D_Al-SM), lean-duplex (LD_Al-SM) and ferritic (F_Al-SM) test series respectively.
As the preload level is of great interest for the value of the final slip factor, two different kind of bolt classes and herewith preload levels were considered: bolt classes 8.8 and 10.9, austenitic stainless steel bolts. The bolt sets in slip-resistant connection have to be preloaded in order to activate the friction between the faying surfaces. For carbon steel connections, bolt sets that are especially developed for

Project No.: 410410007-20003 | Report No.: 2018-06
Slip factors for typical stainless steel surface finishes and new types of coatings for stainless steel
23.03.2018
16
preloading are available within the series of EN 14399, e. g. HV- or HR-bolting
assemblies [5], [6]. As currently comparable bolting assemblies made of stainless
steel are neither standardized nor available on the market, for this investigation austenitic stainless steel bolting assemblies were used consisting of bolts according
to EN ISO 4017 [7], nuts according to EN ISO 4032 [8] and washers according to
EN ISO 7089 [9]. Ten test series were assembled with austenitic bolts M16 A4-88,
austenitic nuts M16 A4‑88, and washers 17-88, HV 200, A4 (all Bumax 88). For the other ten test series austenitic bolts M16 A4-109, austenitic nuts M16 A4-109 and washers 17-109, HV 300, A4 (all Bumax 109) were used. The Bumax 88 and
Bumax 109 bolting assemblies are based on EN ISO 3506-1 [10] and EN ISO 3506-
2 [11] but with property classes 8.8 and 10.9 according to EN ISO 898-1 [12] for
carbon steel bolts, see [13]. All bolts were full threaded bolts. The resulting preload
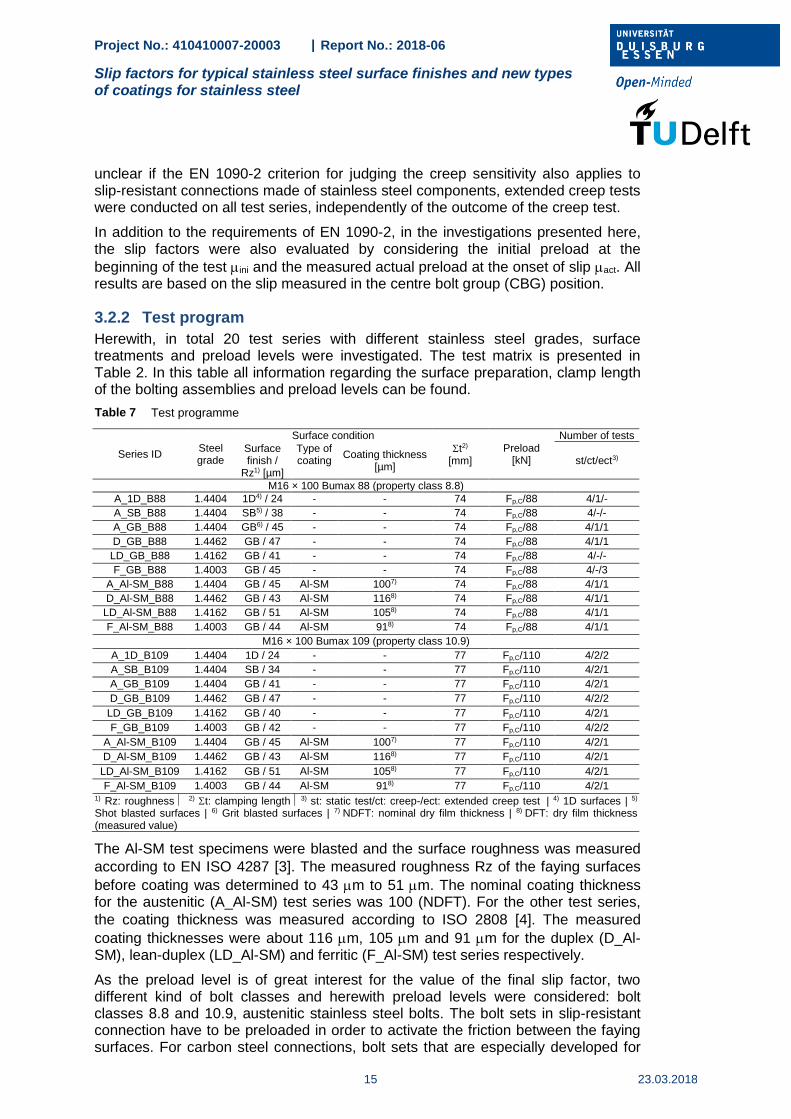
levels were Fp,C = 88 kN for Bumax 88 and Fp,C = 110 kN for Bumax 109. According to EN 1090-2, the preloads in the bolts have to be measured at the beginning of testing and adjusted to an accuracy of ± 5 %. In case of the presented slip factor tests, the preload in the bolts was measured by self-made small load cells instead of instrumented bolts in order to eliminate the influence of viscoplastic deformation on the measured preload level, see Figure 10.
(a) Test setup (b) Clamped plates of a bolted connection with load cell
Figure 10 Test setup exemplary for the Bumax 88 and 109 – M16 specimens
To measure the preload in bolting assemblies, two common methods are available: (1) instrumented bolts (SG) and (2) load cells (LC). In previous studies it could be shown that the accuracy of instrumented bolts with implanted strain gauges for measuring the preload is very high for carbon steel bolting assemblies but they are not appropriable for stainless steel bolting assemblies. Due to the fact that in stainless steel bolting assemblies viscoplasticity occurs already during the preloading process of the stainless steel bolt. This leads to changes in the strain which are measured by the implanted strain gauges as well. That yields to deviating values in comparison to the real preload level. This phenomenon is not observed in carbon steel bolting assemblies due to the dynamic strain aging that occurs at room temperature. For this reason, it was decided to prepare special small load cells for stainless steel bolts for the measurement of the preload, see Figure 11 (a). The advantage of using load cells for stainless steel bolts is that the observed viscoplastic deformation has no influence on the measured preload level.
Project No.: 410410007-20003 | Report No.: 2018-06
Slip factors for typical stainless steel surface finishes and new types of coatings for stainless steel
17 23.03.2018
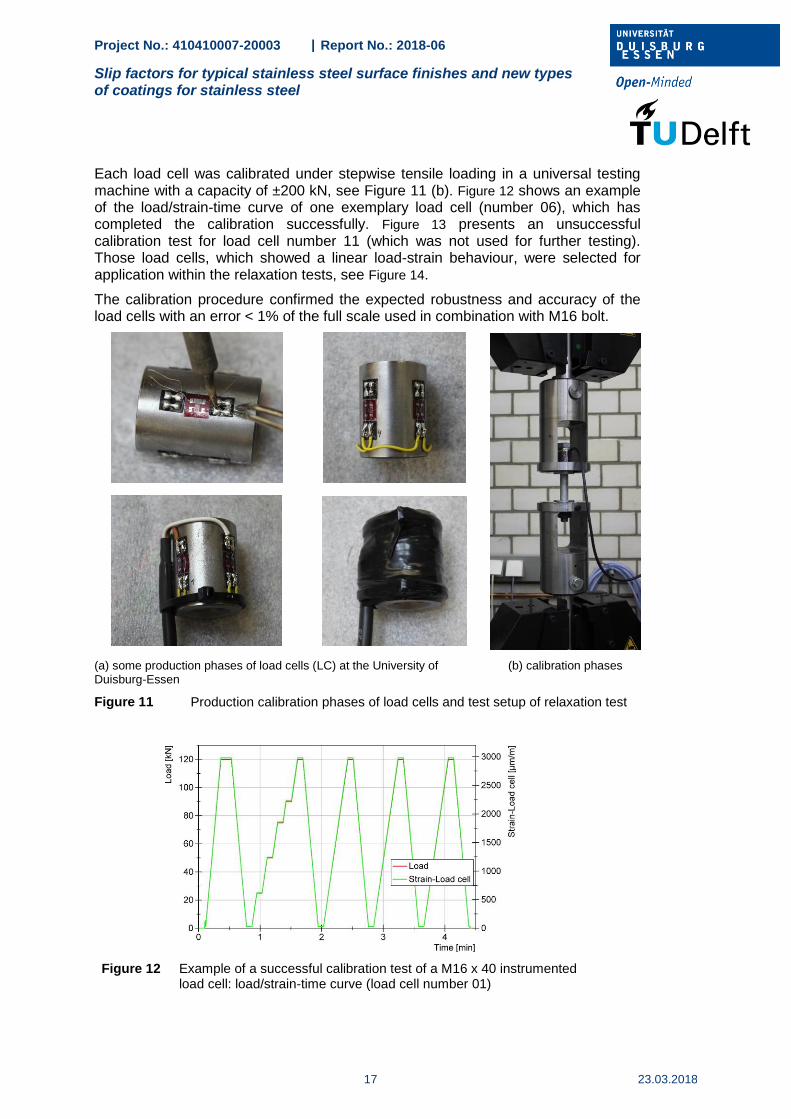
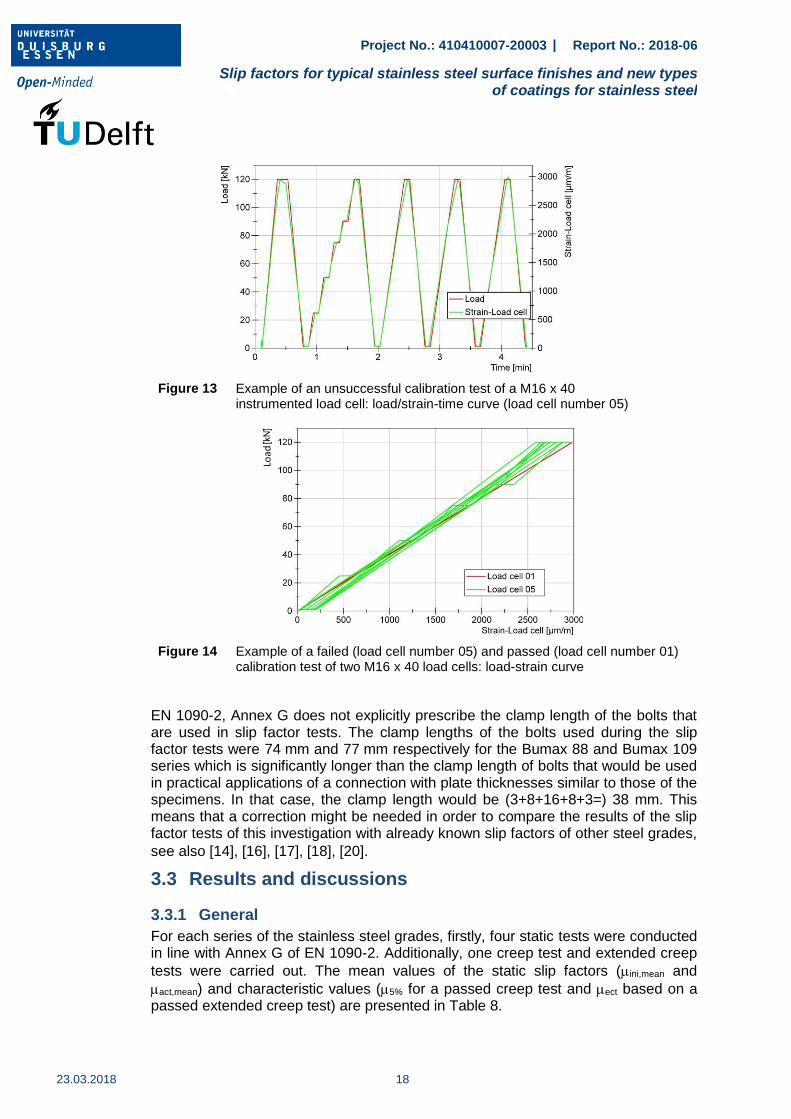
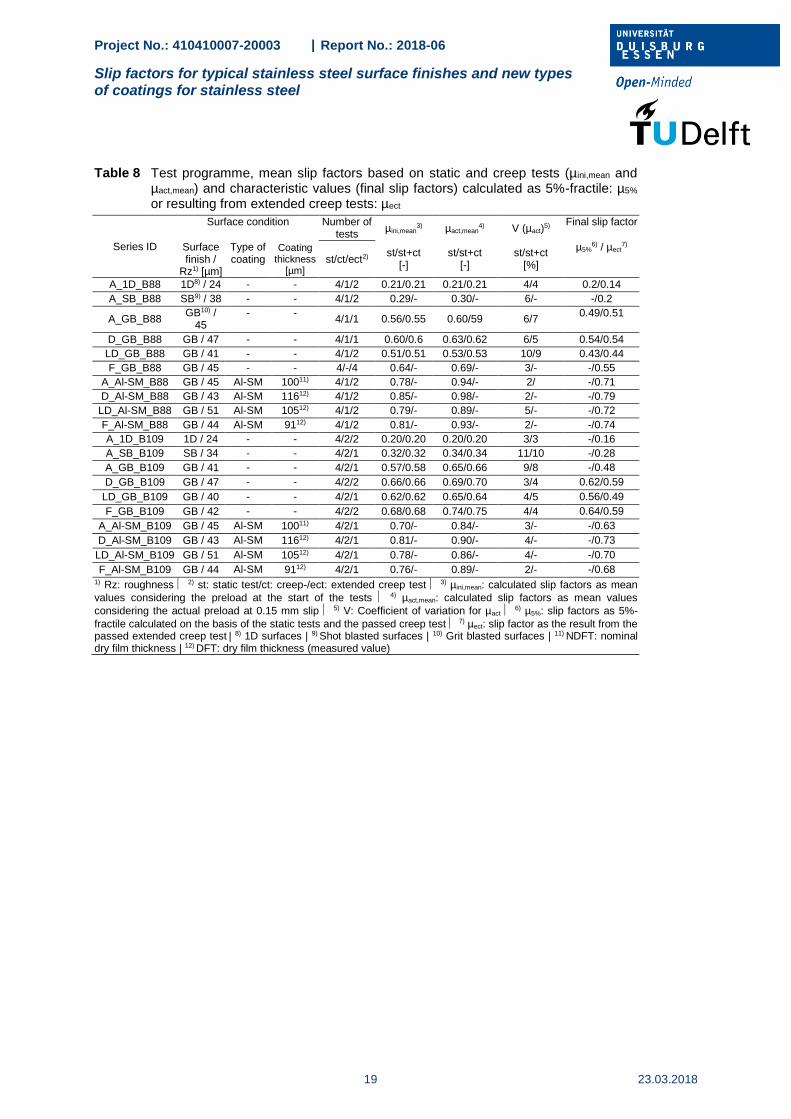
Each load cell was calibrated under stepwise tensile loading in a universal testing machine with a capacity of ±200 kN, see Figure 11 (b). Figure 12 shows an example of the load/strain-time curve of one exemplary load cell (number 06), which has completed the calibration successfully. Figure 13 presents an unsuccessful calibration test for load cell number 11 (which was not used for further testing). Those load cells, which showed a linear load-strain behaviour, were selected for application within the relaxation tests, see Figure 14.
The calibration procedure confirmed the expected robustness and accuracy of the load cells with an error < 1% of the full scale used in combination with M16 bolt.
(a) some production phases of load cells (LC) at the University of Duisburg-Essen
(b) calibration phases
Figure 11 Production calibration phases of load cells and test setup of relaxation test
Figure 12 Example of a successful calibration test of a M16 x 40 instrumented load cell: load/strain-time curve (load cell number 01)
Project No.: 410410007-20003 | Report No.: 2018-06
Slip factors for typical stainless steel surface finishes and new types of coatings for stainless steel
23.03.2018
18
Figure 13 Example of an unsuccessful calibration test of a M16 x 40 instrumented load cell: load/strain-time curve (load cell number 05)
Figure 14 Example of a failed (load cell number 05) and passed (load cell number 01) calibration test of two M16 x 40 load cells: load-strain curve
EN 1090-2, Annex G does not explicitly prescribe the clamp length of the bolts that are used in slip factor tests. The clamp lengths of the bolts used during the slip factor tests were 74 mm and 77 mm respectively for the Bumax 88 and Bumax 109 series which is significantly longer than the clamp length of bolts that would be used in practical applications of a connection with plate thicknesses similar to those of the specimens. In that case, the clamp length would be (3+8+16+8+3=) 38 mm. This means that a correction might be needed in order to compare the results of the slip factor tests of this investigation with already known slip factors of other steel grades,
see also [14], [16], [17], [18], [20].
3.3 Results and discussions
3.3.1 General
For each series of the stainless steel grades, firstly, four static tests were conducted in line with Annex G of EN 1090-2. Additionally, one creep test and extended creep
tests were carried out. The mean values of the static slip factors (ini,mean and
act,mean) and characteristic values (5% for a passed creep test and ect based on a passed extended creep test) are presented in Table 8.
Load
Project No.: 410410007-20003 | Report No.: 2018-06
Slip factors for typical stainless steel surface finishes and new types of coatings for stainless steel
19 23.03.2018
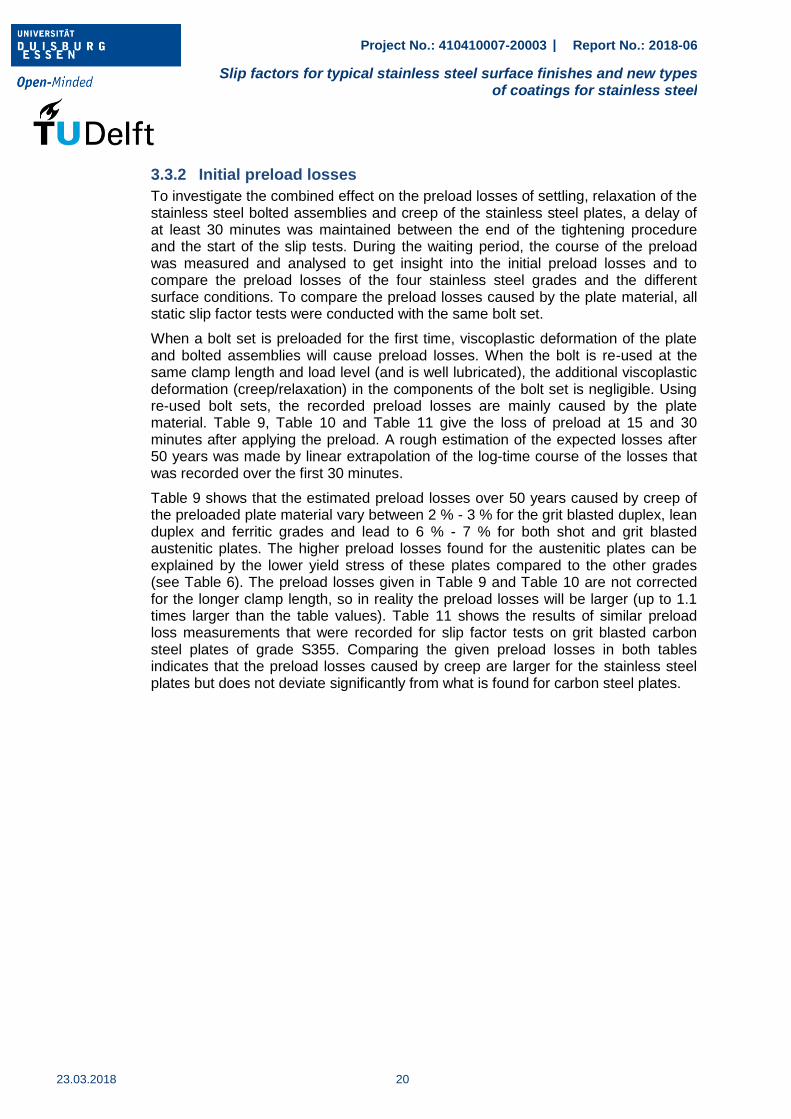
Table 8 Test programme, mean slip factors based on static and creep tests (µini,mean and µact,mean) and characteristic values (final slip factors) calculated as 5%-fractile: µ5% or resulting from extended creep tests: µect
Series ID
Surface condition Number of tests
µini,mean3)
st/st+ct [-]
µact,mean4)
st/st+ct [-]
V (µact)5)
st/st+ct [%]
Final slip factor
Surface finish /
Rz1) [µm]
Type of coating
Coating thickness
[µm] st/ct/ect2)
µ5%6) / µect
7)
A_1D_B88 1D8) / 24 - - 4/1/2 0.21/0.21 0.21/0.21 4/4 0.2/0.14
A_SB_B88 SB9) / 38 - - 4/1/2 0.29/- 0.30/- 6/- -/0.2
A_GB_B88 GB10) /
45 - -
4/1/1 0.56/0.55 0.60/59 6/7 0.49/0.51
D_GB_B88 GB / 47 - - 4/1/1 0.60/0.6 0.63/0.62 6/5 0.54/0.54
LD_GB_B88 GB / 41 - - 4/1/2 0.51/0.51 0.53/0.53 10/9 0.43/0.44
F_GB_B88 GB / 45 - - 4/-/4 0.64/- 0.69/- 3/- -/0.55
A_Al-SM_B88 GB / 45 Al-SM 10011) 4/1/2 0.78/- 0.94/- 2/ -/0.71
D_Al-SM_B88 GB / 43 Al-SM 11612) 4/1/2 0.85/- 0.98/- 2/- -/0.79
LD_Al-SM_B88 GB / 51 Al-SM 10512) 4/1/2 0.79/- 0.89/- 5/- -/0.72
F_Al-SM_B88 GB / 44 Al-SM 9112) 4/1/2 0.81/- 0.93/- 2/- -/0.74
A_1D_B109 1D / 24 - - 4/2/2 0.20/0.20 0.20/0.20 3/3 -/0.16
A_SB_B109 SB / 34 - - 4/2/1 0.32/0.32 0.34/0.34 11/10 -/0.28
A_GB_B109 GB / 41 - - 4/2/1 0.57/0.58 0.65/0.66 9/8 -/0.48
D_GB_B109 GB / 47 - - 4/2/2 0.66/0.66 0.69/0.70 3/4 0.62/0.59
LD_GB_B109 GB / 40 - - 4/2/1 0.62/0.62 0.65/0.64 4/5 0.56/0.49
F_GB_B109 GB / 42 - - 4/2/2 0.68/0.68 0.74/0.75 4/4 0.64/0.59
A_Al-SM_B109 GB / 45 Al-SM 10011) 4/2/1 0.70/- 0.84/- 3/- -/0.63
D_Al-SM_B109 GB / 43 Al-SM 11612) 4/2/1 0.81/- 0.90/- 4/- -/0.73
LD_Al-SM_B109 GB / 51 Al-SM 10512) 4/2/1 0.78/- 0.86/- 4/- -/0.70
F_Al-SM_B109 GB / 44 Al-SM 9112) 4/2/1 0.76/- 0.89/- 2/- -/0.68 1) Rz: roughness 2) st: static test/ct: creep-/ect: extended creep test 3) µini,mean: calculated slip factors as mean
values considering the preload at the start of the tests 4) µact,mean: calculated slip factors as mean values
considering the actual preload at 0.15 mm slip 5) V: Coefficient of variation for µact 6) µ5%: slip factors as 5%-
fractile calculated on the basis of the static tests and the passed creep test 7) µect: slip factor as the result from the passed extended creep test | 8) 1D surfaces | 9) Shot blasted surfaces | 10) Grit blasted surfaces | 11) NDFT: nominal dry film thickness | 12) DFT: dry film thickness (measured value)
Project No.: 410410007-20003 | Report No.: 2018-06
Slip factors for typical stainless steel surface finishes and new types of coatings for stainless steel
23.03.2018
20
3.3.2 Initial preload losses
To investigate the combined effect on the preload losses of settling, relaxation of the stainless steel bolted assemblies and creep of the stainless steel plates, a delay of at least 30 minutes was maintained between the end of the tightening procedure and the start of the slip tests. During the waiting period, the course of the preload was measured and analysed to get insight into the initial preload losses and to compare the preload losses of the four stainless steel grades and the different surface conditions. To compare the preload losses caused by the plate material, all static slip factor tests were conducted with the same bolt set.
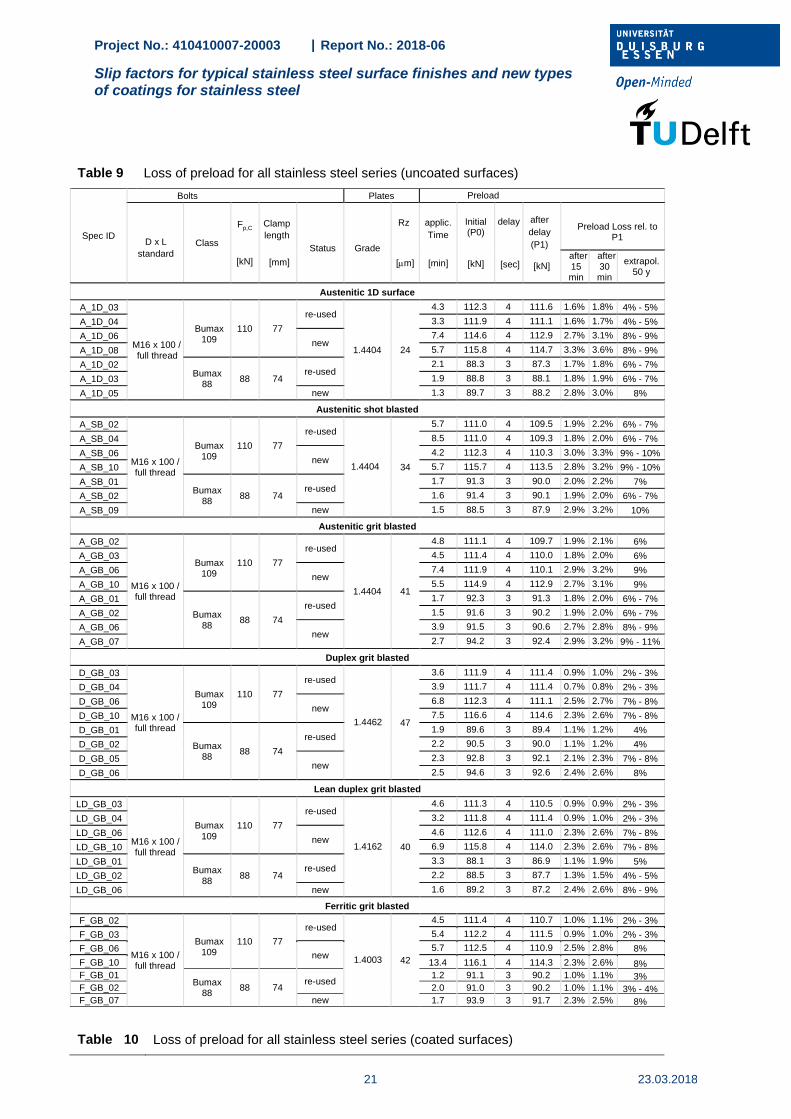
When a bolt set is preloaded for the first time, viscoplastic deformation of the plate and bolted assemblies will cause preload losses. When the bolt is re-used at the same clamp length and load level (and is well lubricated), the additional viscoplastic deformation (creep/relaxation) in the components of the bolt set is negligible. Using re-used bolt sets, the recorded preload losses are mainly caused by the plate material. Table 9, Table 10 and Table 11 give the loss of preload at 15 and 30 minutes after applying the preload. A rough estimation of the expected losses after 50 years was made by linear extrapolation of the log-time course of the losses that was recorded over the first 30 minutes.
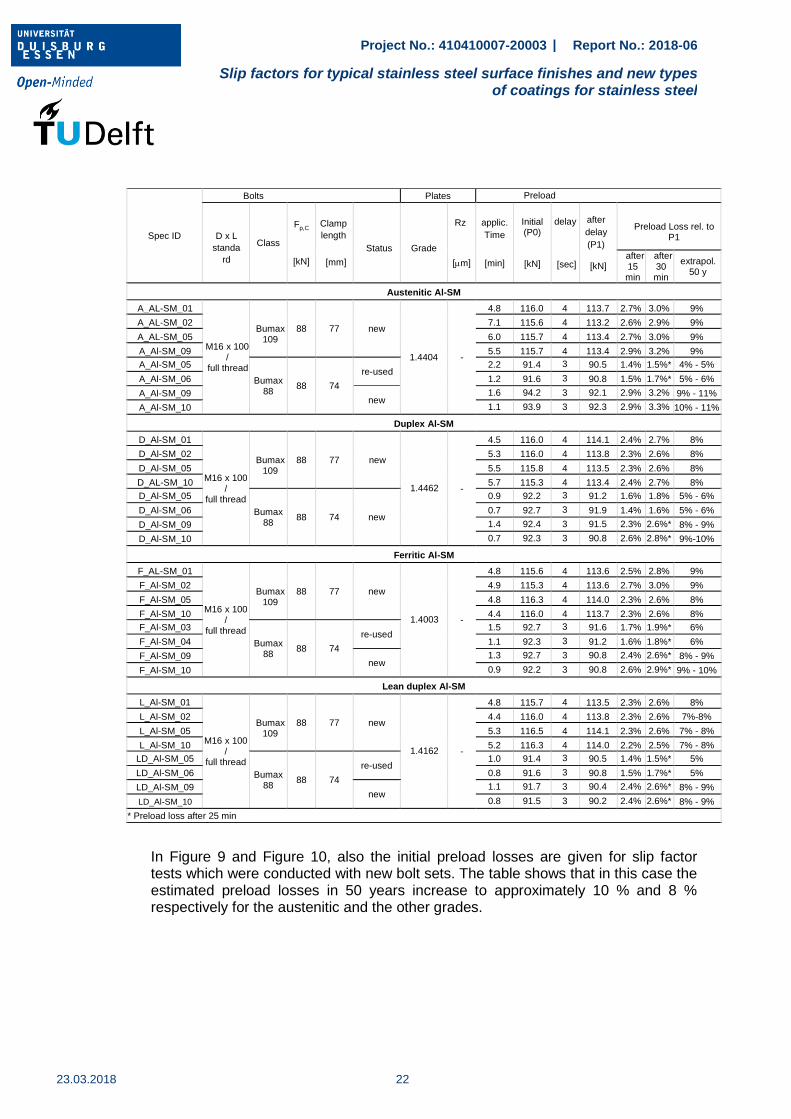
Table 9 shows that the estimated preload losses over 50 years caused by creep of the preloaded plate material vary between 2 % - 3 % for the grit blasted duplex, lean duplex and ferritic grades and lead to 6 % - 7 % for both shot and grit blasted austenitic plates. The higher preload losses found for the austenitic plates can be explained by the lower yield stress of these plates compared to the other grades (see Table 6). The preload losses given in Table 9 and Table 10 are not corrected for the longer clamp length, so in reality the preload losses will be larger (up to 1.1 times larger than the table values). Table 11 shows the results of similar preload loss measurements that were recorded for slip factor tests on grit blasted carbon steel plates of grade S355. Comparing the given preload losses in both tables indicates that the preload losses caused by creep are larger for the stainless steel plates but does not deviate significantly from what is found for carbon steel plates.
Project No.: 410410007-20003 | Report No.: 2018-06
Slip factors for typical stainless steel surface finishes and new types of coatings for stainless steel
21 23.03.2018
Table 9 Loss of preload for all stainless steel series (uncoated surfaces)
Spec ID
Bolts Plates Preload
D x L
standard Class
Fp,C
[kN]
Clamp
length
[mm]
Status
Grade
Rz
[m]
applic.
Time
[min]
Initial (P0)
[kN]
delay
[sec]
after
delay
(P1)
[kN]
Preload Loss rel. to
P1
after 15 min
after 30 min
extrapol. 50 y
Austenitic 1D surface
A_1D_03
M16 x 100 / full thread
Bumax
109 110 77
re-used
1.4404 24
4.3 112.3 4 111.6 1.6% 1.8% 4% - 5%
A_1D_04 3.3 111.9 4 111.1 1.6% 1.7% 4% - 5%
A_1D_06 new
7.4 114.6 4 112.9 2.7% 3.1% 8% - 9%
A_1D_08 5.7 115.8 4 114.7 3.3% 3.6% 8% - 9%
A_1D_02 Bumax
88 88 74
re-used 2.1 88.3 3 87.3 1.7% 1.8% 6% - 7%
A_1D_03 1.9 88.8 3 88.1 1.8% 1.9% 6% - 7%
A_1D_05 new 1.3 89.7 3 88.2 2.8% 3.0% 8%
Austenitic shot blasted
A_SB_02
M16 x 100 / full thread
Bumax
109 110 77
re-used
1.4404 34
5.7 111.0 4 109.5 1.9% 2.2% 6% - 7%
A_SB_04 8.5 111.0 4 109.3 1.8% 2.0% 6% - 7%
A_SB_06 new
4.2 112.3 4 110.3 3.0% 3.3% 9% - 10%
A_SB_10 5.7 115.7 4 113.5 2.8% 3.2% 9% - 10%
A_SB_01 Bumax
88 88 74
re-used 1.7 91.3 3 90.0 2.0% 2.2% 7%
A_SB_02 1.6 91.4 3 90.1 1.9% 2.0% 6% - 7%
A_SB_09 new 1.5 88.5 3 87.9 2.9% 3.2% 10%
Austenitic grit blasted
A_GB_02
M16 x 100 / full thread
Bumax
109 110 77
re-used
1.4404 41
4.8 111.1 4 109.7 1.9% 2.1% 6%
A_GB_03 4.5 111.4 4 110.0 1.8% 2.0% 6%
A_GB_06 new
7.4 111.9 4 110.1 2.9% 3.2% 9%
A_GB_10 5.5 114.9 4 112.9 2.7% 3.1% 9%
A_GB_01
Bumax 88
88 74
re-used 1.7 92.3 3 91.3 1.8% 2.0% 6% - 7%
A_GB_02 1.5 91.6 3 90.2 1.9% 2.0% 6% - 7%
A_GB_06 new
3.9 91.5 3 90.6 2.7% 2.8% 8% - 9%
A_GB_07 2.7 94.2 3 92.4 2.9% 3.2% 9% - 11%
Duplex grit blasted
D_GB_03
M16 x 100 / full thread
Bumax 109
110 77
re-used
1.4462 47
3.6 111.9 4 111.4 0.9% 1.0% 2% - 3%
D_GB_04 3.9 111.7 4 111.4 0.7% 0.8% 2% - 3%
D_GB_06 new
6.8 112.3 4 111.1 2.5% 2.7% 7% - 8%
D_GB_10 7.5 116.6 4 114.6 2.3% 2.6% 7% - 8%
D_GB_01
Bumax 88
88 74
re-used 1.9 89.6 3 89.4 1.1% 1.2% 4%
D_GB_02 2.2 90.5 3 90.0 1.1% 1.2% 4%
D_GB_05 new
2.3 92.8 3 92.1 2.1% 2.3% 7% - 8%
D_GB_06 2.5 94.6 3 92.6 2.4% 2.6% 8%
Lean duplex grit blasted
LD_GB_03
M16 x 100 / full thread
Bumax 109
110 77
re-used
1.4162 40
4.6 111.3 4 110.5 0.9% 0.9% 2% - 3%
LD_GB_04 3.2 111.8 4 111.4 0.9% 1.0% 2% - 3%
LD_GB_06 new
4.6 112.6 4 111.0 2.3% 2.6% 7% - 8%
LD_GB_10 6.9 115.8 4 114.0 2.3% 2.6% 7% - 8%
LD_GB_01 Bumax
88 88 74
re-used 3.3 88.1 3 86.9 1.1% 1.9% 5%
LD_GB_02 2.2 88.5 3 87.7 1.3% 1.5% 4% - 5%
LD_GB_06 new 1.6 89.2 3 87.2 2.4% 2.6% 8% - 9%
Ferritic grit blasted
F_GB_02
M16 x 100 / full thread
Bumax 109
110 77
re-used
1.4003 42
4.5 111.4 4 110.7 1.0% 1.1% 2% - 3%
F_GB_03 5.4 112.2 4 111.5 0.9% 1.0% 2% - 3%
F_GB_06 new
5.7 112.5 4 110.9 2.5% 2.8% 8%
F_GB_10 13.4 116.1 4 114.3 2.3% 2.6% 8%
F_GB_01 Bumax
88 88 74
re-used 1.2 91.1 3 90.2 1.0% 1.1% 3%
F_GB_02 2.0 91.0 3 90.2 1.0% 1.1% 3% - 4%
F_GB_07 new 1.7 93.9 3 91.7 2.3% 2.5% 8%
Table 10 Loss of preload for all stainless steel series (coated surfaces)
Project No.: 410410007-20003 | Report No.: 2018-06
Slip factors for typical stainless steel surface finishes and new types of coatings for stainless steel
23.03.2018
22
Spec ID
Bolts Plates Preload
D x L
standa
rd
Class
Fp,C
[kN]
Clamp
length
[mm]
Status
Grade
Rz
[m]
applic.
Time
[min]
Initial (P0)
[kN]
delay
[sec]
after
delay
(P1)
[kN]
Preload Loss rel. to
P1
after 15 min
after 30 min
extrapol. 50 y
Austenitic Al-SM
A_AL-SM_01
M16 x 100
/ full thread
Bumax
109 88 77 new
1.4404 -
4.8 116.0 4 113.7 2.7% 3.0% 9%
A_AL-SM_02 7.1 115.6 4 113.2 2.6% 2.9% 9%
A_AL-SM_05 6.0 115.7 4 113.4 2.7% 3.0% 9%
A_Al-SM_09 5.5 115.7 4 113.4 2.9% 3.2% 9%
A_Al-SM_05
Bumax 88
88 74
re-used 2.2 91.4 3 90.5 1.4% 1.5%* 4% - 5%
A_Al-SM_06 1.2 91.6 3 90.8 1.5% 1.7%* 5% - 6%
A_Al-SM_09 new
1.6 94.2 3 92.1 2.9% 3.2% 9% - 11%
A_Al-SM_10 1.1 93.9 3 92.3 2.9% 3.3% 10% - 11%
Duplex Al-SM
D_Al-SM_01
M16 x 100 /
full thread
Bumax
109 88 77 new
1.4462 -
4.5 116.0 4 114.1 2.4% 2.7% 8%
D_Al-SM_02 5.3 116.0 4 113.8 2.3% 2.6% 8%
D_Al-SM_05 5.5 115.8 4 113.5 2.3% 2.6% 8%
D_AL-SM_10 5.7 115.3 4 113.4 2.4% 2.7% 8%
D_Al-SM_05
Bumax 88
88 74 new
0.9 92.2 3 91.2 1.6% 1.8% 5% - 6%
D_Al-SM_06 0.7 92.7 3 91.9 1.4% 1.6% 5% - 6%
D_Al-SM_09 1.4 92.4 3 91.5 2.3% 2.6%* 8% - 9%
D_Al-SM_10 0.7 92.3 3 90.8 2.6% 2.8%* 9%-10%
Ferritic Al-SM
F_AL-SM_01
M16 x 100 /
full thread
Bumax 109
88 77 new
1.4003 -
4.8 115.6 4 113.6 2.5% 2.8% 9%
F_Al-SM_02 4.9 115.3 4 113.6 2.7% 3.0% 9%
F_Al-SM_05 4.8 116.3 4 114.0 2.3% 2.6% 8%
F_Al-SM_10 4.4 116.0 4 113.7 2.3% 2.6% 8%
F_Al-SM_03
Bumax 88
88 74
re-used 1.5 92.7 3 91.6 1.7% 1.9%* 6%
F_Al-SM_04 1.1 92.3 3 91.2 1.6% 1.8%* 6%
F_Al-SM_09 new
1.3 92.7 3 90.8 2.4% 2.6%* 8% - 9%
F_Al-SM_10 0.9 92.2 3 90.8 2.6% 2.9%* 9% - 10%
Lean duplex Al-SM
L_Al-SM_01
M16 x 100 /
full thread
Bumax
109 88 77 new
1.4162 -
4.8 115.7 4 113.5 2.3% 2.6% 8%
L_Al-SM_02 4.4 116.0 4 113.8 2.3% 2.6% 7%-8%
L_Al-SM_05 5.3 116.5 4 114.1 2.3% 2.6% 7% - 8%
L_Al-SM_10 5.2 116.3 4 114.0 2.2% 2.5% 7% - 8%
LD_Al-SM_05
Bumax 88
88 74
re-used 1.0 91.4 3 90.5 1.4% 1.5%* 5%
LD_Al-SM_06 0.8 91.6 3 90.8 1.5% 1.7%* 5%
LD_Al-SM_09 new
1.1 91.7 3 90.4 2.4% 2.6%* 8% - 9%
LD_Al-SM_10 0.8 91.5 3 90.2 2.4% 2.6%* 8% - 9%
* Preload loss after 25 min
In Figure 9 and Figure 10, also the initial preload losses are given for slip factor tests which were conducted with new bolt sets. The table shows that in this case the estimated preload losses in 50 years increase to approximately 10 % and 8 % respectively for the austenitic and the other grades.
Project No.: 410410007-20003 | Report No.: 2018-06
Slip factors for typical stainless steel surface finishes and new types of coatings for stainless steel
23 23.03.2018
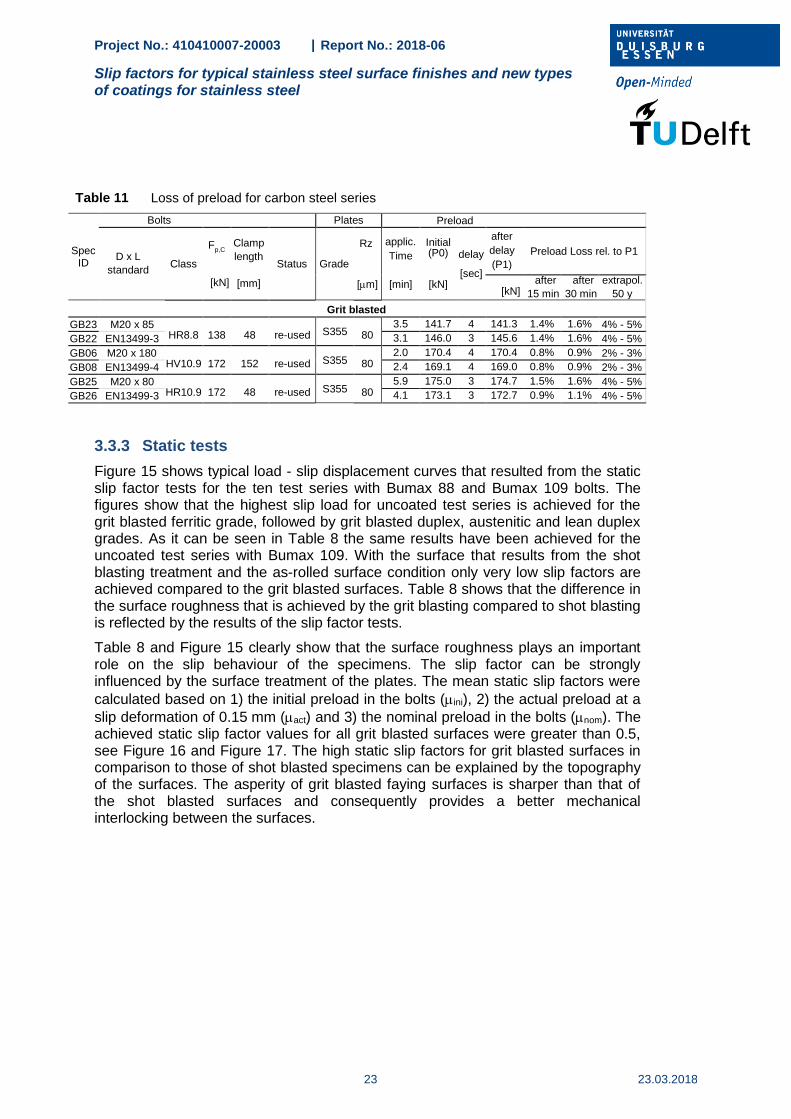
Table 11 Loss of preload for carbon steel series
Spec ID
Bolts Plates Preload
D x L
standard Class
Fp,C
[kN]
Clamp
length
[mm]
Status Grade
Rz
[m]
applic.
Time
[min]
Initial (P0)
[kN]
delay
[sec]
after
delay
(P1)
Preload Loss rel. to P1
[kN] after
15 min
after
30 min
extrapol.
50 y
Grit blasted
GB23 M20 x 85 HR8.8 138 48 re-used S355 80
3.5 141.7 4 141.3 1.4% 1.6% 4% - 5%
GB22 EN13499-3 3.1 146.0 3 145.6 1.4% 1.6% 4% - 5%
GB06 M20 x 180 HV10.9 172 152 re-used S355 80
2.0 170.4 4 170.4 0.8% 0.9% 2% - 3%
GB08 EN13499-4 2.4 169.1 4 169.0 0.8% 0.9% 2% - 3%
GB25 M20 x 80 HR10.9 172 48 re-used S355 80
5.9 175.0 3 174.7 1.5% 1.6% 4% - 5%
GB26 EN13499-3 4.1 173.1 3 172.7 0.9% 1.1% 4% - 5%
3.3.3 Static tests
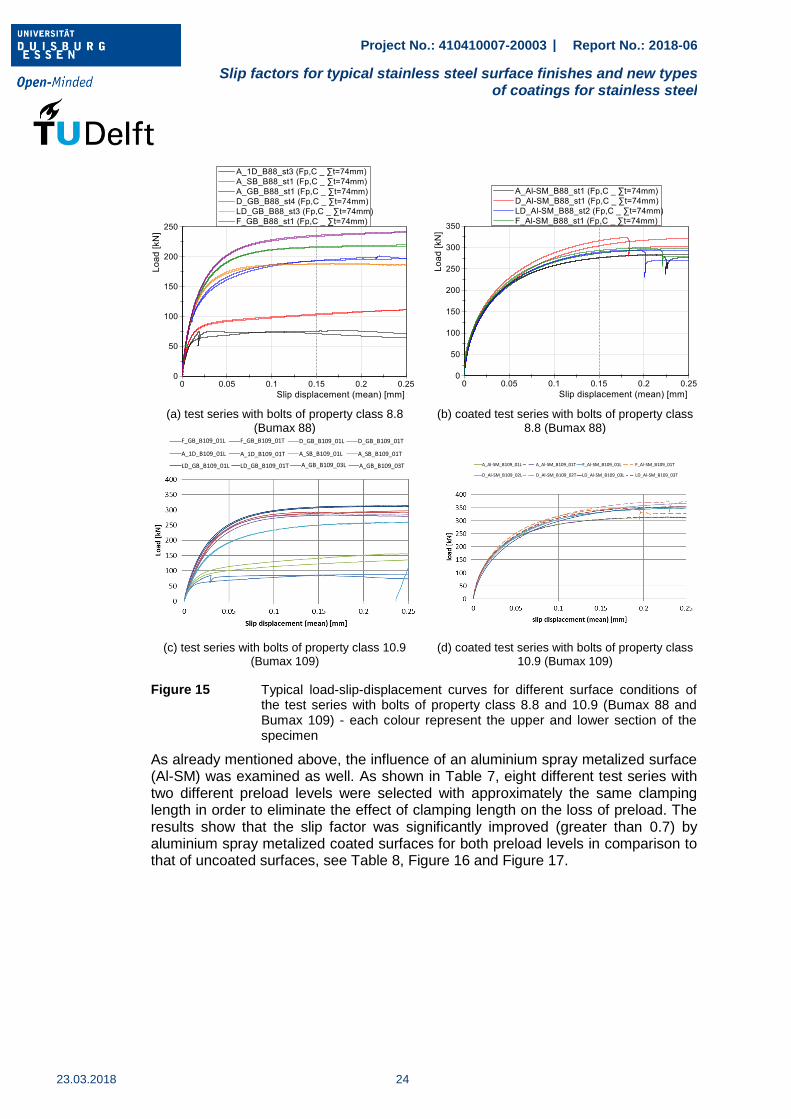
Figure 15 shows typical load - slip displacement curves that resulted from the static slip factor tests for the ten test series with Bumax 88 and Bumax 109 bolts. The figures show that the highest slip load for uncoated test series is achieved for the grit blasted ferritic grade, followed by grit blasted duplex, austenitic and lean duplex grades. As it can be seen in Table 8 the same results have been achieved for the uncoated test series with Bumax 109. With the surface that results from the shot blasting treatment and the as-rolled surface condition only very low slip factors are achieved compared to the grit blasted surfaces. Table 8 shows that the difference in the surface roughness that is achieved by the grit blasting compared to shot blasting is reflected by the results of the slip factor tests.
Table 8 and Figure 15 clearly show that the surface roughness plays an important role on the slip behaviour of the specimens. The slip factor can be strongly influenced by the surface treatment of the plates. The mean static slip factors were
calculated based on 1) the initial preload in the bolts (ini), 2) the actual preload at a
slip deformation of 0.15 mm (act) and 3) the nominal preload in the bolts (nom). The achieved static slip factor values for all grit blasted surfaces were greater than 0.5, see Figure 16 and Figure 17. The high static slip factors for grit blasted surfaces in comparison to those of shot blasted specimens can be explained by the topography of the surfaces. The asperity of grit blasted faying surfaces is sharper than that of the shot blasted surfaces and consequently provides a better mechanical interlocking between the surfaces.
Project No.: 410410007-20003 | Report No.: 2018-06
Slip factors for typical stainless steel surface finishes and new types of coatings for stainless steel
23.03.2018
24
(a) test series with bolts of property class 8.8 (Bumax 88)
(b) coated test series with bolts of property class 8.8 (Bumax 88)
(c) test series with bolts of property class 10.9 (Bumax 109)
(d) coated test series with bolts of property class 10.9 (Bumax 109)
Figure 15 Typical load-slip-displacement curves for different surface conditions of the test series with bolts of property class 8.8 and 10.9 (Bumax 88 and Bumax 109) - each colour represent the upper and lower section of the specimen
As already mentioned above, the influence of an aluminium spray metalized surface (Al-SM) was examined as well. As shown in Table 7, eight different test series with two different preload levels were selected with approximately the same clamping length in order to eliminate the effect of clamping length on the loss of preload. The results show that the slip factor was significantly improved (greater than 0.7) by aluminium spray metalized coated surfaces for both preload levels in comparison to that of uncoated surfaces, see Table 8, Figure 16 and Figure 17.
A_SB_B109_01L A_SB_B109_01T
A_GB_B109_03TA_GB_B109_03L
A_1D_B109_01L A_1D_B109_01T
F_GB_B109_01L F_GB_B109_01T D_GB_B109_01TD_GB_B109_01L
LD_GB_B109_01L LD_GB_B109_01T A_Al-SM_B109_01L A_Al-SM_B109_01T
D_Al-SM_B109_02L D_Al-SM_B109_02T
F_Al-SM_B109_01L F_Al-SM_B109_01T
LD_Al-SM_B109_03TLD_Al-SM_B109_03L
Project No.: 410410007-20003 | Report No.: 2018-06
Slip factors for typical stainless steel surface finishes and new types of coatings for stainless steel
25 23.03.2018
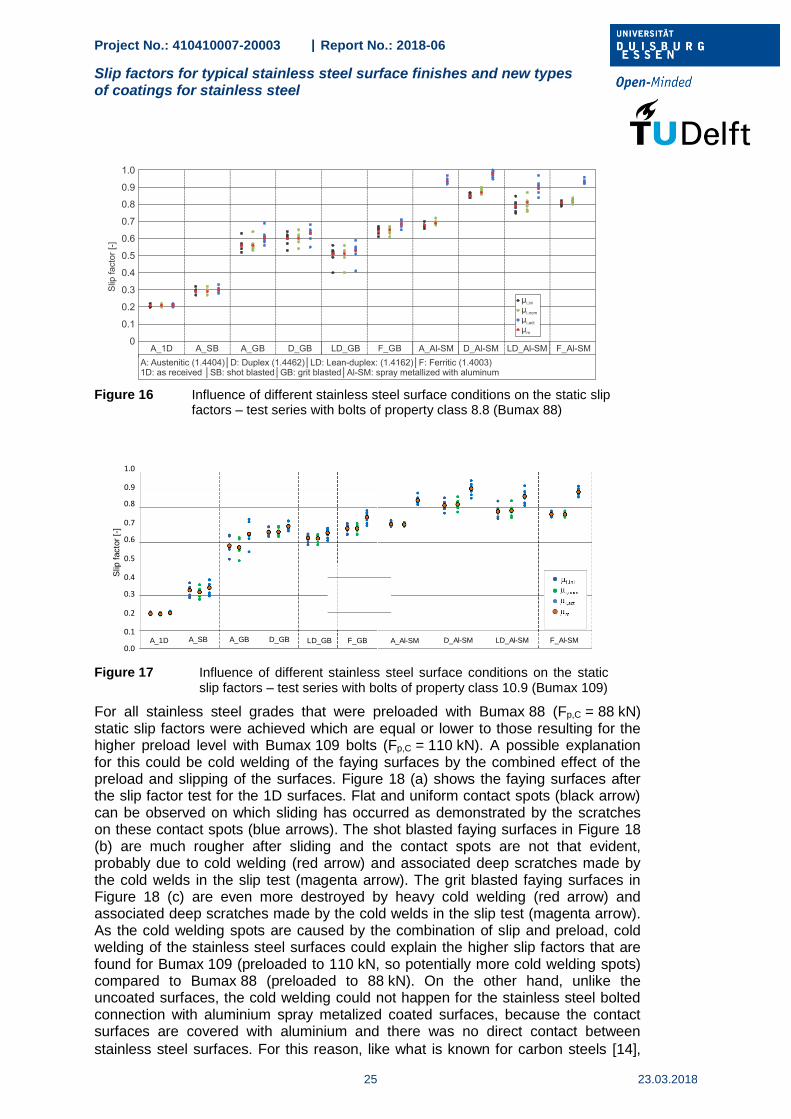
Figure 16 Influence of different stainless steel surface conditions on the static slip factors – test series with bolts of property class 8.8 (Bumax 88)
Figure 17 Influence of different stainless steel surface conditions on the static slip factors – test series with bolts of property class 10.9 (Bumax 109)
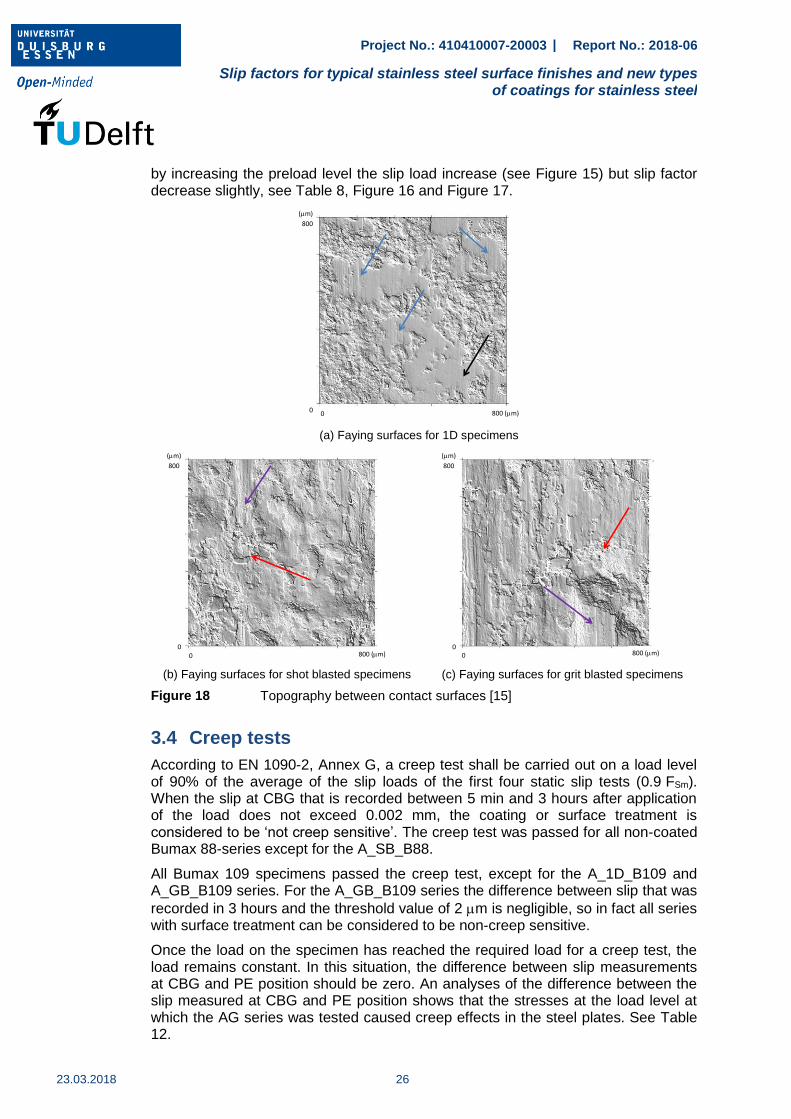
For all stainless steel grades that were preloaded with Bumax 88 (Fp,C = 88 kN) static slip factors were achieved which are equal or lower to those resulting for the higher preload level with Bumax 109 bolts (Fp,C = 110 kN). A possible explanation for this could be cold welding of the faying surfaces by the combined effect of the preload and slipping of the surfaces. Figure 18 (a) shows the faying surfaces after the slip factor test for the 1D surfaces. Flat and uniform contact spots (black arrow) can be observed on which sliding has occurred as demonstrated by the scratches on these contact spots (blue arrows). The shot blasted faying surfaces in Figure 18 (b) are much rougher after sliding and the contact spots are not that evident, probably due to cold welding (red arrow) and associated deep scratches made by the cold welds in the slip test (magenta arrow). The grit blasted faying surfaces in Figure 18 (c) are even more destroyed by heavy cold welding (red arrow) and associated deep scratches made by the cold welds in the slip test (magenta arrow). As the cold welding spots are caused by the combination of slip and preload, cold welding of the stainless steel surfaces could explain the higher slip factors that are found for Bumax 109 (preloaded to 110 kN, so potentially more cold welding spots) compared to Bumax 88 (preloaded to 88 kN). On the other hand, unlike the uncoated surfaces, the cold welding could not happen for the stainless steel bolted connection with aluminium spray metalized coated surfaces, because the contact surfaces are covered with aluminium and there was no direct contact between
stainless steel surfaces. For this reason, like what is known for carbon steels [14],
A_Al-SM D_Al-SM LD_Al-SM F_Al-SM
Slip
facto
r [-
]
1.0
0.9
0.8
0.7
0.6
0.5
0.4
0.3
0.2
0.1
0.0
Slip
facto
r [-
]
1.0
0.9
0.8
0.7
0.6
0.5
0.4
0.3
0.2
0.1
0.0A_1D A_SB A_GB D_GB LD_GB F_GB
Slip
facto
r [-
]
1.0
0.9
0.8
0.7
0.6
0.5
0.4
0.3
0.2
0.1
0.0A_1D A_SB A_GB D_GB LD_GB F_GB
Project No.: 410410007-20003 | Report No.: 2018-06
Slip factors for typical stainless steel surface finishes and new types of coatings for stainless steel
23.03.2018
26
by increasing the preload level the slip load increase (see Figure 15) but slip factor decrease slightly, see Table 8, Figure 16 and Figure 17.
(a) Faying surfaces for 1D specimens
(b) Faying surfaces for shot blasted specimens (c) Faying surfaces for grit blasted specimens
Figure 18 Topography between contact surfaces [15]
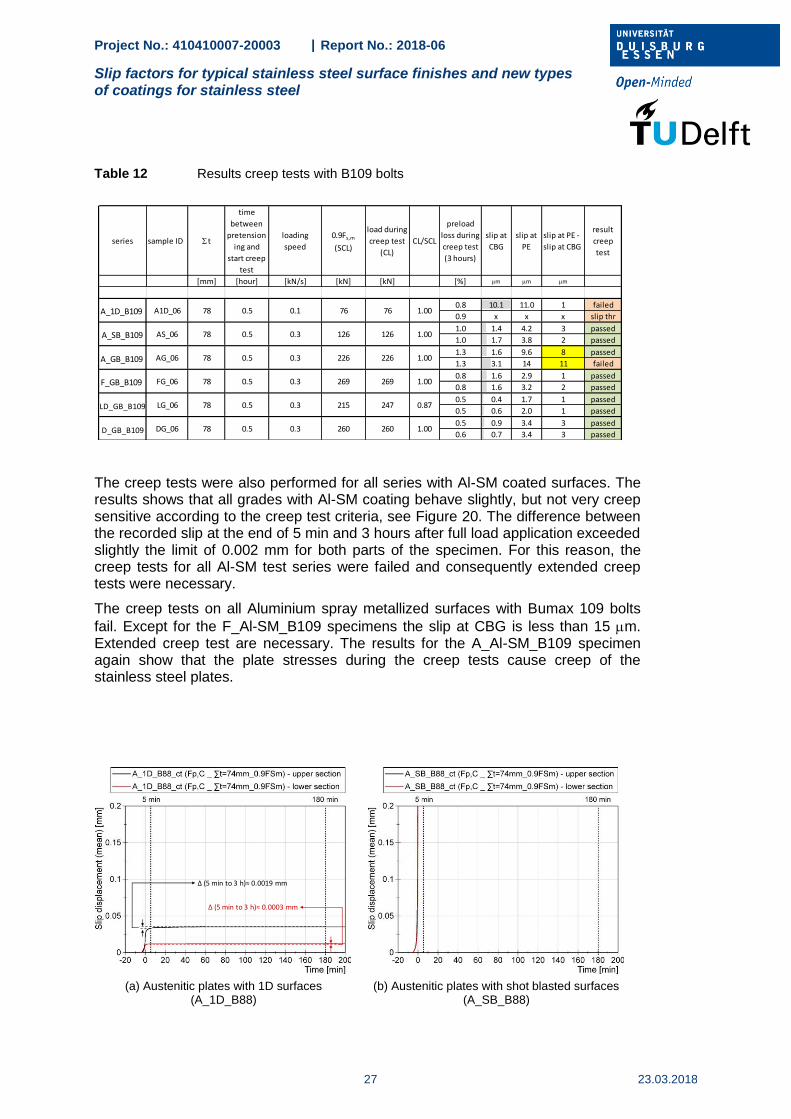
3.4 Creep tests
According to EN 1090-2, Annex G, a creep test shall be carried out on a load level of 90% of the average of the slip loads of the first four static slip tests (0.9 FSm). When the slip at CBG that is recorded between 5 min and 3 hours after application of the load does not exceed 0.002 mm, the coating or surface treatment is considered to be ‘not creep sensitive’. The creep test was passed for all non-coated Bumax 88-series except for the A_SB_B88.
All Bumax 109 specimens passed the creep test, except for the A_1D_B109 and A_GB_B109 series. For the A_GB_B109 series the difference between slip that was
recorded in 3 hours and the threshold value of 2 m is negligible, so in fact all series with surface treatment can be considered to be non-creep sensitive.
Once the load on the specimen has reached the required load for a creep test, the load remains constant. In this situation, the difference between slip measurements at CBG and PE position should be zero. An analyses of the difference between the slip measured at CBG and PE position shows that the stresses at the load level at which the AG series was tested caused creep effects in the steel plates. See Table 12.
0
(m)
800
0
800 (m)
0
(m)
800
0
800 (m)
0
(m)
800
0
800 (m)
Project No.: 410410007-20003 | Report No.: 2018-06
Slip factors for typical stainless steel surface finishes and new types of coatings for stainless steel
27 23.03.2018
Table 12 Results creep tests with B109 bolts
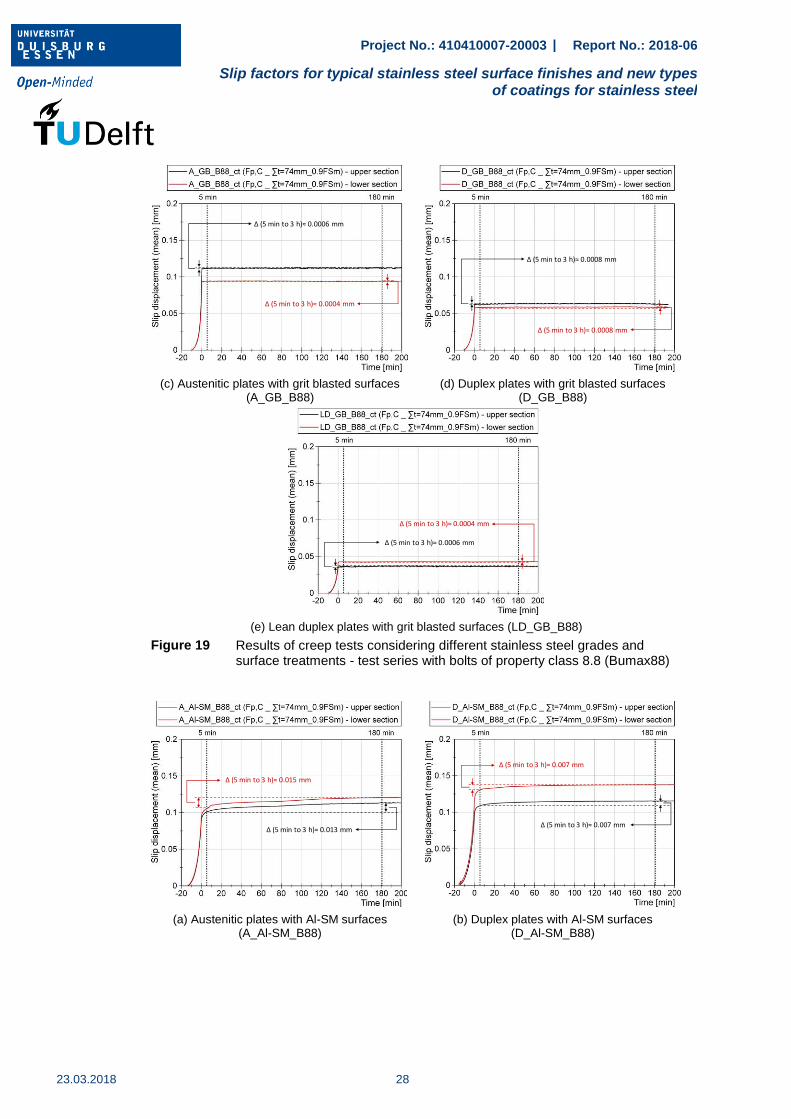
The creep tests were also performed for all series with Al-SM coated surfaces. The results shows that all grades with Al-SM coating behave slightly, but not very creep sensitive according to the creep test criteria, see Figure 20. The difference between the recorded slip at the end of 5 min and 3 hours after full load application exceeded slightly the limit of 0.002 mm for both parts of the specimen. For this reason, the creep tests for all Al-SM test series were failed and consequently extended creep tests were necessary.
The creep tests on all Aluminium spray metallized surfaces with Bumax 109 bolts
fail. Except for the F_Al-SM_B109 specimens the slip at CBG is less than 15 m. Extended creep test are necessary. The results for the A_Al-SM_B109 specimen again show that the plate stresses during the creep tests cause creep of the stainless steel plates.
(a) Austenitic plates with 1D surfaces
(A_1D_B88) (b) Austenitic plates with shot blasted surfaces
(A_SB_B88)
series sample ID t
time
between
pretension
ing and
start creep
test
loading
speed
0.9Fs,m
(SCL)
load during
creep test
(CL)
CL/SCL
preload
loss during
creep test
(3 hours)
slip at
CBG
slip at
PE
slip at PE -
slip at CBG
result
creep
test
[mm] [hour] [kN/s] [kN] [kN] [%] m m m
0.8 10.1 11.0 1 failed
0.9 x x x slip thr
1.0 1.4 4.2 3 passed
1.0 1.7 3.8 2 passed
1.3 1.6 9.6 8 passed
1.3 3.1 14 11 failed
0.8 1.6 2.9 1 passed
0.8 1.6 3.2 2 passed
0.5 0.4 1.7 1 passed
0.5 0.6 2.0 1 passed
0.5 0.9 3.4 3 passed
0.6 0.7 3.4 3 passedDG DG_06 78 0.5 0.3 260 260 1.00
FG FG_06 78 0.5 0.3 269 269 1.00
LG LG_06 78 0.5 0.3 215 247 0.87
AS_06 78 0.5 0.3 126 126 1.00
AG AG_06 78 0.5 0.3 226 226 1.00
A1D A1D_06 78 0.5 0.1 76 76 1.00
ASA_SB_B109
A_GB_B109
F_GB_B109
LD_GB_B109
D_GB_B109
A_1D_B109
Δ (5 min to 3 h)≈ 0.0019 mm
Δ (5 min to 3 h)≈ 0.0003 mm
Project No.: 410410007-20003 | Report No.: 2018-06
Slip factors for typical stainless steel surface finishes and new types of coatings for stainless steel
23.03.2018
28
(c) Austenitic plates with grit blasted surfaces
(A_GB_B88) (d) Duplex plates with grit blasted surfaces
(D_GB_B88)
(e) Lean duplex plates with grit blasted surfaces (LD_GB_B88)
Figure 19 Results of creep tests considering different stainless steel grades and surface treatments - test series with bolts of property class 8.8 (Bumax88)
(a) Austenitic plates with Al-SM surfaces
(A_Al-SM_B88) (b) Duplex plates with Al-SM surfaces
(D_Al-SM_B88)
Δ (5 min to 3 h)≈ 0.0006 mm
Δ (5 min to 3 h)≈ 0.0004 mm
Δ (5 min to 3 h)≈ 0.0008 mm
Δ (5 min to 3 h)≈ 0.0008 mm
Δ (5 min to 3 h)≈ 0.0006 mm
Δ (5 min to 3 h)≈ 0.0004 mm
Δ (5 min to 3 h)≈ 0.015 mm
Δ (5 min to 3 h)≈ 0.013 mm
Δ (5 min to 3 h)≈ 0.007 mm
Δ (5 min to 3 h)≈ 0.007 mm
Project No.: 410410007-20003 | Report No.: 2018-06
Slip factors for typical stainless steel surface finishes and new types of coatings for stainless steel
29 23.03.2018
(c) Lean duplex plates with Al-SM surfaces
(LD_Al-SM_B88) (d) Ferritic plates with Al-SM surfaces
(F_Al-SM_B88)
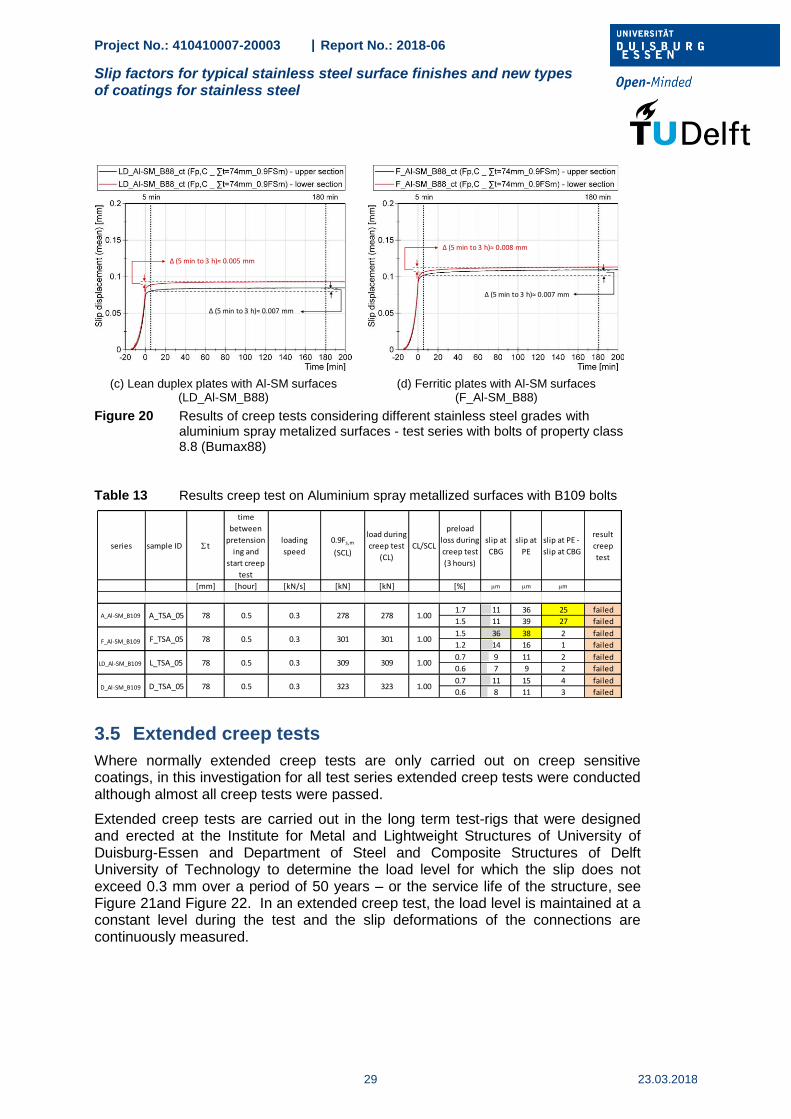
Figure 20 Results of creep tests considering different stainless steel grades with aluminium spray metalized surfaces - test series with bolts of property class 8.8 (Bumax88)
Table 13 Results creep test on Aluminium spray metallized surfaces with B109 bolts
3.5 Extended creep tests
Where normally extended creep tests are only carried out on creep sensitive coatings, in this investigation for all test series extended creep tests were conducted although almost all creep tests were passed.
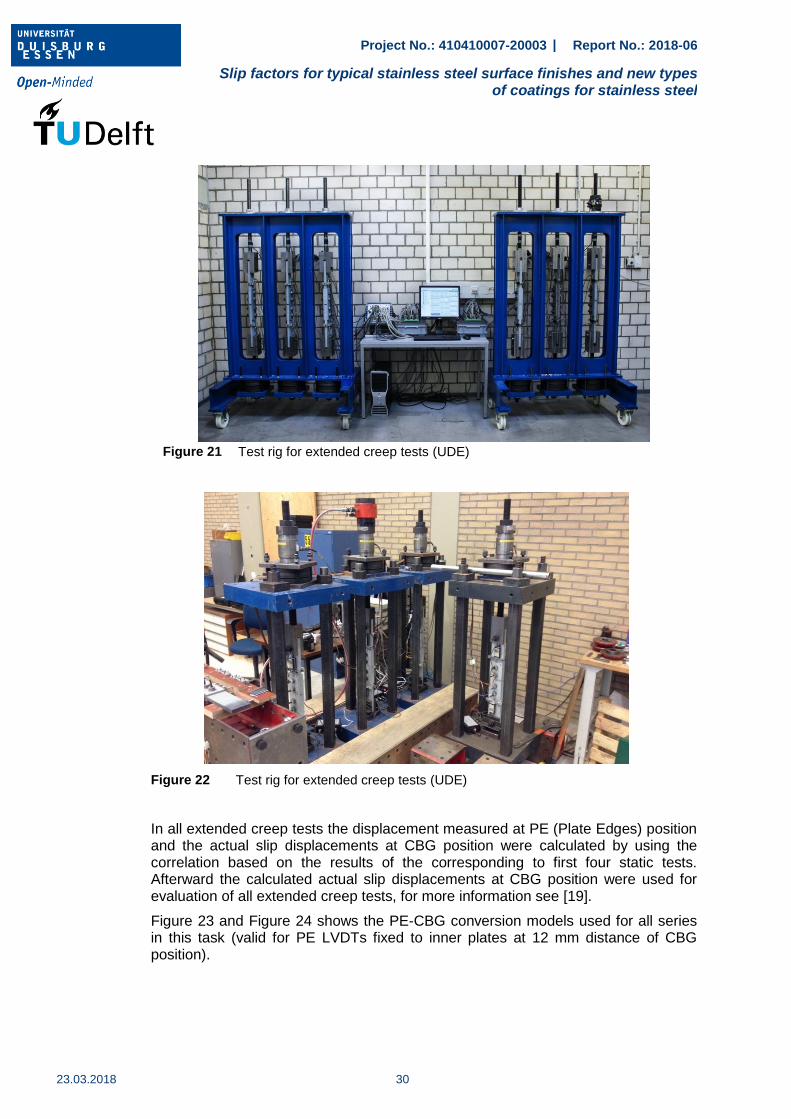
Extended creep tests are carried out in the long term test-rigs that were designed and erected at the Institute for Metal and Lightweight Structures of University of Duisburg-Essen and Department of Steel and Composite Structures of Delft University of Technology to determine the load level for which the slip does not exceed 0.3 mm over a period of 50 years – or the service life of the structure, see Figure 21and Figure 22. In an extended creep test, the load level is maintained at a constant level during the test and the slip deformations of the connections are continuously measured.
Δ (5 min to 3 h)≈ 0.005 mm
Δ (5 min to 3 h)≈ 0.007 mm
Δ (5 min to 3 h)≈ 0.008 mm
Δ (5 min to 3 h)≈ 0.007 mm
series sample ID t
time
between
pretension
ing and
start creep
test
loading
speed
0.9Fs,m
(SCL)
load during
creep test
(CL)
CL/SCL
preload
loss during
creep test
(3 hours)
slip at
CBG
slip at
PE
slip at PE -
slip at CBG
result
creep
test
[mm] [hour] [kN/s] [kN] [kN] [%] m m m
1.7 11 36 25 failed
1.5 11 39 27 failed
1.5 36 38 2 failed
1.2 14 16 1 failed
0.7 9 11 2 failed
0.6 7 9 2 failed
0.7 11 15 4 failed
0.6 8 11 3 failed
278 278 1.00
323 323 1.00
F_TSA F_TSA_05 78 0.5 0.3 301 301 1.00
L_TSA L_TSA_05 78 0.5 0.3 309 309 1.00
D_TSA D_TSA_05 78 0.5 0.3
A_TSA A_TSA_05 78 0.5 0.3A_Al-SM_B109
F_Al-SM_B109
LD_Al-SM_B109
D_Al-SM_B109
Project No.: 410410007-20003 | Report No.: 2018-06
Slip factors for typical stainless steel surface finishes and new types of coatings for stainless steel
23.03.2018
30
Figure 21 Test rig for extended creep tests (UDE)
Figure 22 Test rig for extended creep tests (UDE)
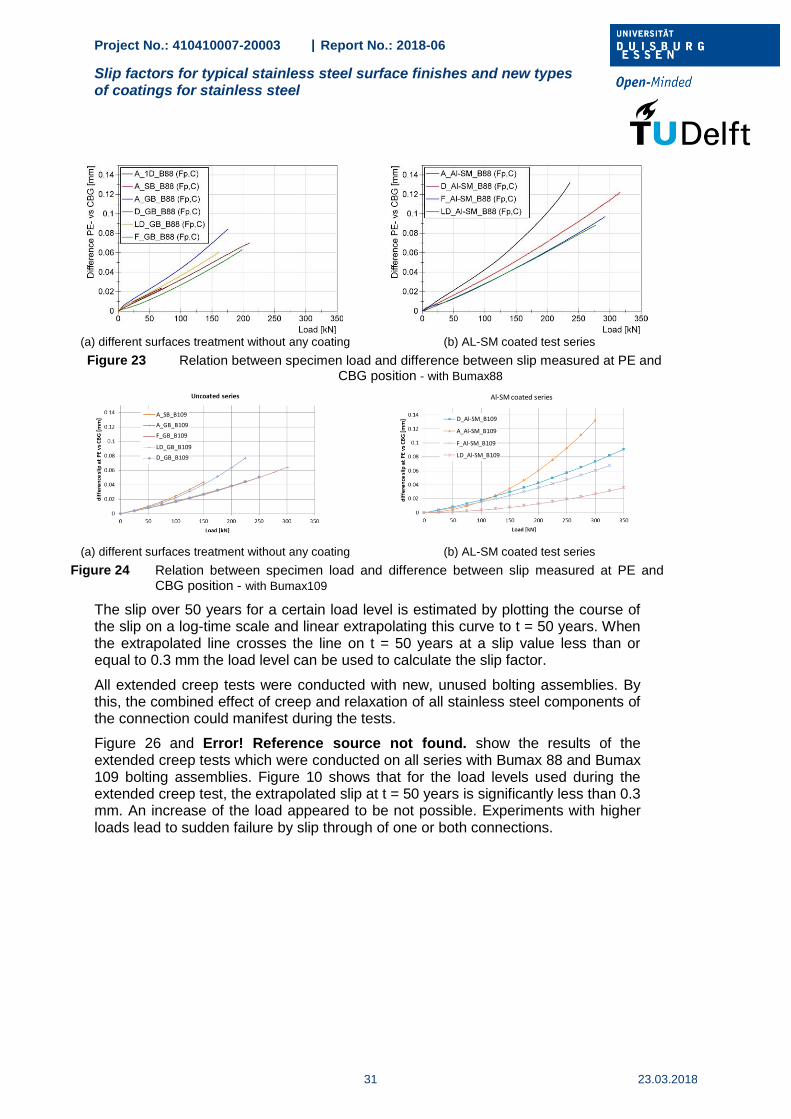
In all extended creep tests the displacement measured at PE (Plate Edges) position and the actual slip displacements at CBG position were calculated by using the correlation based on the results of the corresponding to first four static tests. Afterward the calculated actual slip displacements at CBG position were used for evaluation of all extended creep tests, for more information see [19].
Figure 23 and Figure 24 shows the PE-CBG conversion models used for all series in this task (valid for PE LVDTs fixed to inner plates at 12 mm distance of CBG position).
Project No.: 410410007-20003 | Report No.: 2018-06
Slip factors for typical stainless steel surface finishes and new types of coatings for stainless steel
31 23.03.2018
(a) different surfaces treatment without any coating (b) AL-SM coated test series
Figure 23 Relation between specimen load and difference between slip measured at PE and CBG position - with Bumax88
(a) different surfaces treatment without any coating (b) AL-SM coated test series
Figure 24 Relation between specimen load and difference between slip measured at PE and CBG position - with Bumax109
The slip over 50 years for a certain load level is estimated by plotting the course of the slip on a log-time scale and linear extrapolating this curve to t = 50 years. When the extrapolated line crosses the line on t = 50 years at a slip value less than or equal to 0.3 mm the load level can be used to calculate the slip factor.
All extended creep tests were conducted with new, unused bolting assemblies. By this, the combined effect of creep and relaxation of all stainless steel components of the connection could manifest during the tests.
Figure 26 and Error! Reference source not found. show the results of the extended creep tests which were conducted on all series with Bumax 88 and Bumax 109 bolting assemblies. Figure 10 shows that for the load levels used during the extended creep test, the extrapolated slip at t = 50 years is significantly less than 0.3 mm. An increase of the load appeared to be not possible. Experiments with higher loads lead to sudden failure by slip through of one or both connections.
A_SB_B109
A_GB_B109
F_GB_B109
LD_GB_B109
D_GB_B109
A_Al-SM_B109
D_Al-SM_B109
F_Al-SM_B109
LD_Al-SM_B109
Al-SM coated series
Project No.: 410410007-20003 | Report No.: 2018-06
Slip factors for typical stainless steel surface finishes and new types of coatings for stainless steel
23.03.2018
32
(a) Austenitic plates with 1D surfaces
(A_1D_B88) (b) Austenitic plates with shot blasted surfaces
(A_SB_B88)
(c) Austenitic plates with grit blasted surfaces
(A_GB_B88) (d) Duplex plates with grit blasted surfaces
(D_GB_B88)
(e) Lean duplex plates with grit blasted surfaces (LD_GB_B88)
(f) Ferritic plates with grit blasted surfaces (F_GB_B88)
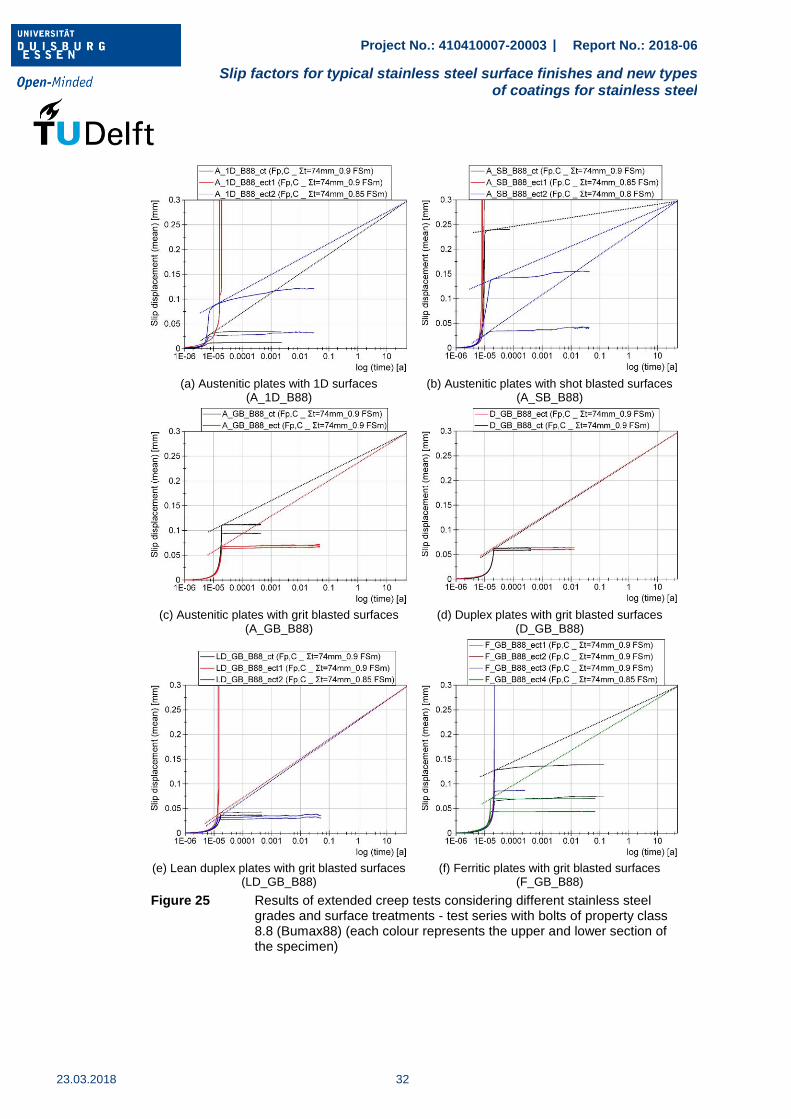
Figure 25 Results of extended creep tests considering different stainless steel grades and surface treatments - test series with bolts of property class 8.8 (Bumax88) (each colour represents the upper and lower section of the specimen)
Project No.: 410410007-20003 | Report No.: 2018-06
Slip factors for typical stainless steel surface finishes and new types of coatings for stainless steel
33 23.03.2018
(a) Austenitic plates with Al-SM surfaces
(A_Al-SM_B88) (b) Duplex plates with Al-SM surfaces
(D_Al-SM_B88)
(c) Lean duplex plates with Al-SM surfaces
(LD_Al-SM_B88) (d) Ferritic plates with Al-SM surfaces
(F_Al-SM_B88)
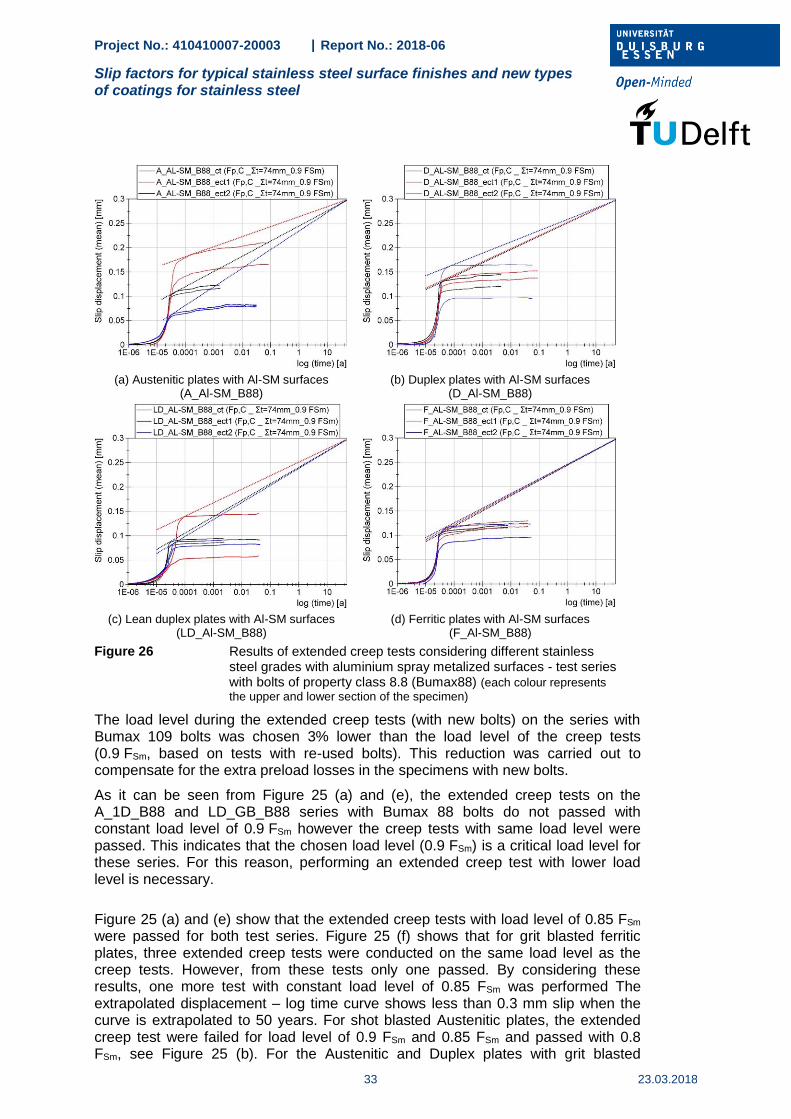
Figure 26 Results of extended creep tests considering different stainless steel grades with aluminium spray metalized surfaces - test series with bolts of property class 8.8 (Bumax88) (each colour represents
the upper and lower section of the specimen)
The load level during the extended creep tests (with new bolts) on the series with Bumax 109 bolts was chosen 3% lower than the load level of the creep tests (0.9 FSm, based on tests with re-used bolts). This reduction was carried out to compensate for the extra preload losses in the specimens with new bolts.
As it can be seen from Figure 25 (a) and (e), the extended creep tests on the A_1D_B88 and LD_GB_B88 series with Bumax 88 bolts do not passed with constant load level of 0.9 FSm however the creep tests with same load level were passed. This indicates that the chosen load level (0.9 FSm) is a critical load level for these series. For this reason, performing an extended creep test with lower load level is necessary.
Figure 25 (a) and (e) show that the extended creep tests with load level of 0.85 FSm were passed for both test series. Figure 25 (f) shows that for grit blasted ferritic plates, three extended creep tests were conducted on the same load level as the creep tests. However, from these tests only one passed. By considering these results, one more test with constant load level of 0.85 FSm was performed The extrapolated displacement – log time curve shows less than 0.3 mm slip when the curve is extrapolated to 50 years. For shot blasted Austenitic plates, the extended creep test were failed for load level of 0.9 FSm and 0.85 FSm and passed with 0.8 FSm, see Figure 25 (b). For the Austenitic and Duplex plates with grit blasted
Project No.: 410410007-20003 | Report No.: 2018-06
Slip factors for typical stainless steel surface finishes and new types of coatings for stainless steel
23.03.2018
34
surfaces, the extended creep tests were passed on the same load level as the creep tests and the final slip factor can be calculated with 0.9 FSm load level.
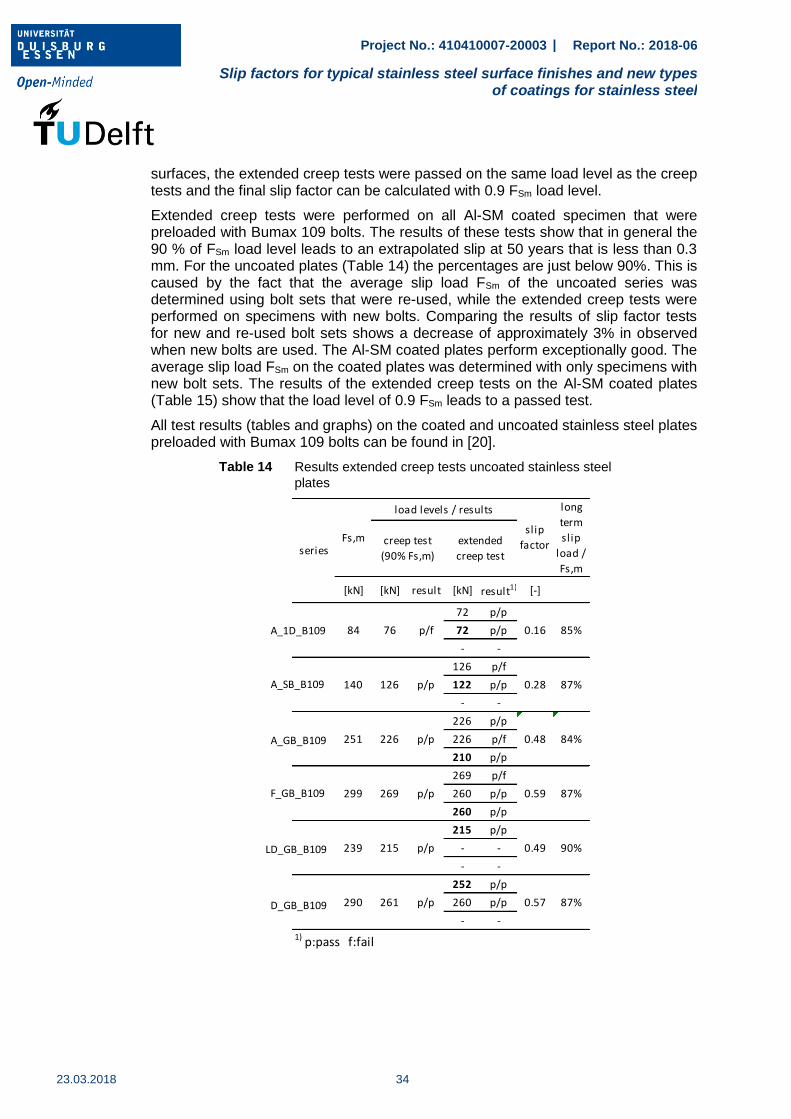
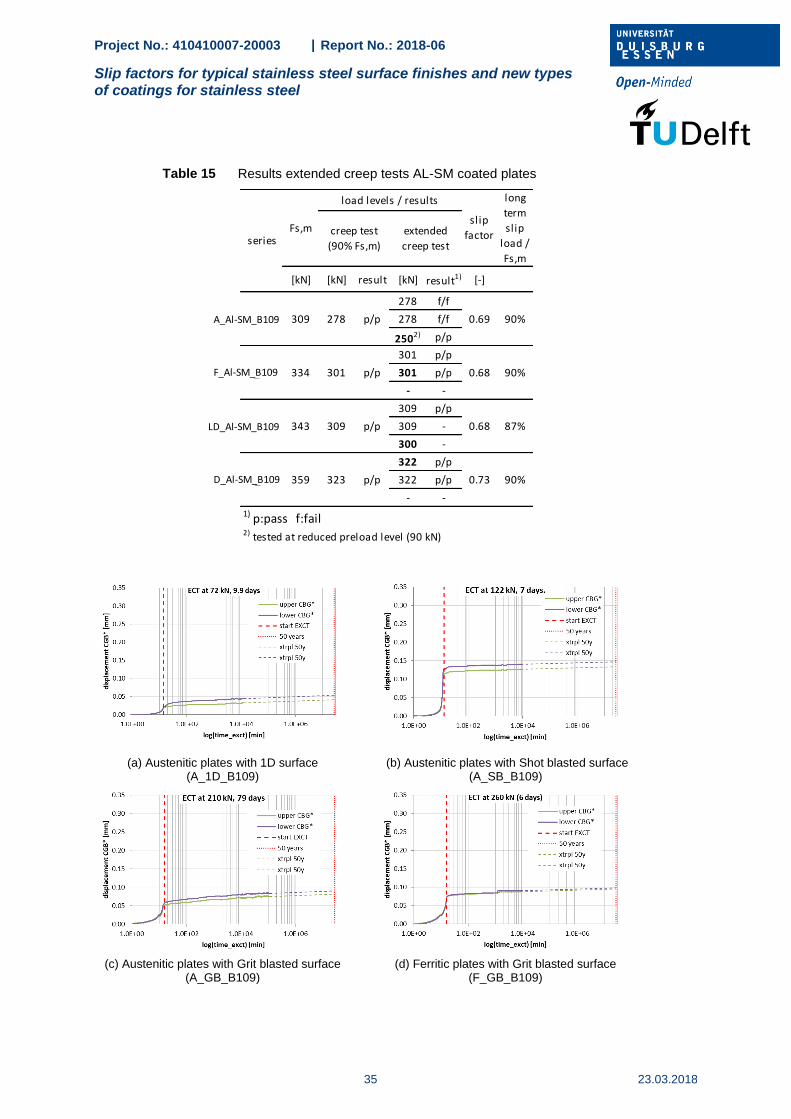
Extended creep tests were performed on all Al-SM coated specimen that were preloaded with Bumax 109 bolts. The results of these tests show that in general the 90 % of FSm load level leads to an extrapolated slip at 50 years that is less than 0.3 mm. For the uncoated plates (Table 14) the percentages are just below 90%. This is caused by the fact that the average slip load FSm of the uncoated series was determined using bolt sets that were re-used, while the extended creep tests were performed on specimens with new bolts. Comparing the results of slip factor tests for new and re-used bolt sets shows a decrease of approximately 3% in observed when new bolts are used. The Al-SM coated plates perform exceptionally good. The average slip load FSm on the coated plates was determined with only specimens with new bolt sets. The results of the extended creep tests on the Al-SM coated plates (Table 15) show that the load level of 0.9 FSm leads to a passed test.
All test results (tables and graphs) on the coated and uncoated stainless steel plates preloaded with Bumax 109 bolts can be found in [20].
Table 14 Results extended creep tests uncoated stainless steel
plates
[kN] [kN] result [kN] result1) [-]
72 p/p
72 p/p
- -
126 p/f
122 p/p
- -
226 p/p
226 p/f
210 p/p
269 p/f
260 p/p
260 p/p
215 p/p
- -
- -
252 p/p
260 p/p
- -
1) p:pass f:fail
series
A1D
AS
299 269 p/p
AG
FG
load levels / results
76 p/f
140 126 p/p
251 226 p/p
creep test
(90% Fs,m)
84
LG
DG
Fs,m
85%
87%
84%
87%
90%
87%
long
term
slip
load /
Fs,m
239 215 p/p
290 261 p/p
0.16
0.28
0.48
0.59
0.49
0.57
slip
factorextended
creep test
A_1D_B109
A_SB_B109
A_GB_B109
F_GB_B109
LD_GB_B109
D_GB_B109
Project No.: 410410007-20003 | Report No.: 2018-06
Slip factors for typical stainless steel surface finishes and new types of coatings for stainless steel
35 23.03.2018
Table 15 Results extended creep tests AL-SM coated plates
(a) Austenitic plates with 1D surface (A_1D_B109)
(b) Austenitic plates with Shot blasted surface (A_SB_B109)
(c) Austenitic plates with Grit blasted surface (A_GB_B109)
(d) Ferritic plates with Grit blasted surface (F_GB_B109)
[kN] [kN] result [kN] result1) [-]
278 f/f
278 f/f
2502) p/p
301 p/p
301 p/p
- -
309 p/p
309 -
300 -
322 p/p
322 p/p
- -
1) p:pass f:fail2) tested at reduced preload level (90 kN)
D_TSA 359 323 p/p 0.73 90%
L_TSA 343 309 p/p 0.68 87%
F_TSA 334 301 p/p 0.68 90%
A_TSA 309 278 p/p 0.69 90%
seriesFs,m
load levels / results
slip
factor
long
term
slip
load /
Fs,m
creep test
(90% Fs,m)
extended
creep test
A_Al-SM_B109
F_Al-SM_B109
LD_Al-SM_B109
D_Al-SM_B109
Project No.: 410410007-20003 | Report No.: 2018-06
Slip factors for typical stainless steel surface finishes and new types of coatings for stainless steel
23.03.2018
36
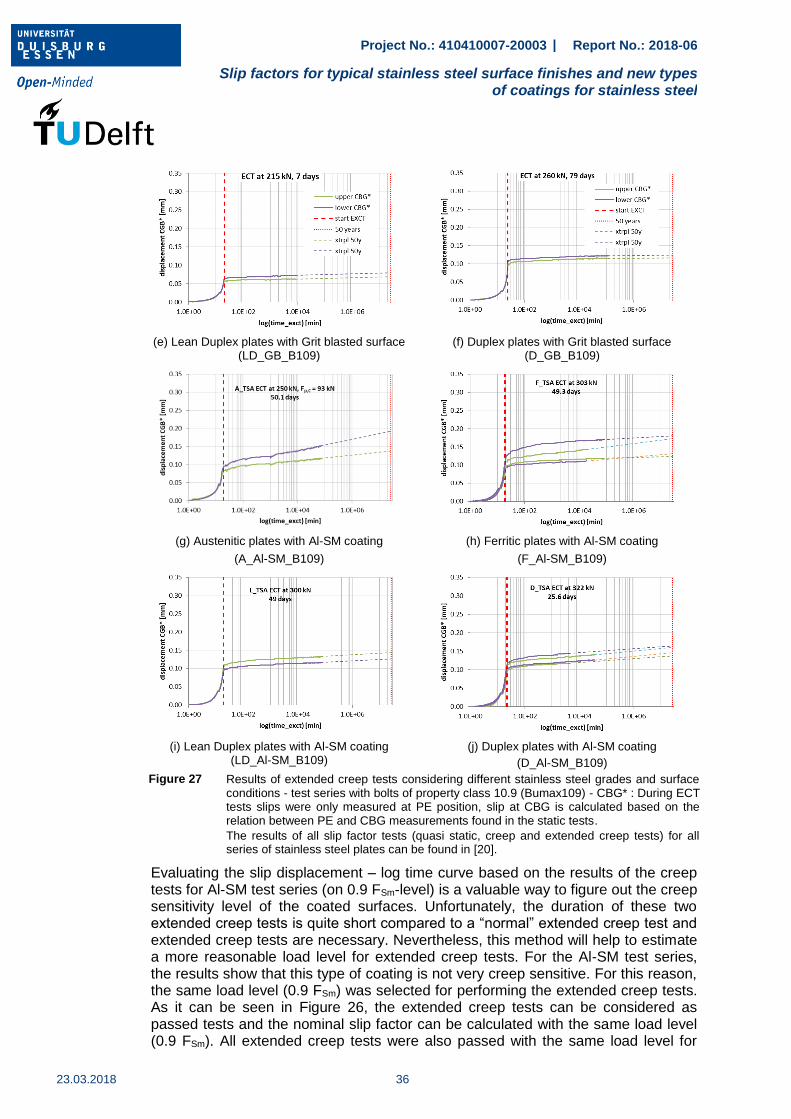
(e) Lean Duplex plates with Grit blasted surface (LD_GB_B109)
(f) Duplex plates with Grit blasted surface (D_GB_B109)
(g) Austenitic plates with Al-SM coating
(A_Al-SM_B109)
(h) Ferritic plates with Al-SM coating
(F_Al-SM_B109)
(i) Lean Duplex plates with Al-SM coating (LD_Al-SM_B109)
(j) Duplex plates with Al-SM coating
(D_Al-SM_B109)
Figure 27 Results of extended creep tests considering different stainless steel grades and surface conditions - test series with bolts of property class 10.9 (Bumax109) - CBG* : During ECT tests slips were only measured at PE position, slip at CBG is calculated based on the relation between PE and CBG measurements found in the static tests.
The results of all slip factor tests (quasi static, creep and extended creep tests) for all series of stainless steel plates can be found in [20].
Evaluating the slip displacement – log time curve based on the results of the creep tests for Al-SM test series (on 0.9 FSm-level) is a valuable way to figure out the creep sensitivity level of the coated surfaces. Unfortunately, the duration of these two extended creep tests is quite short compared to a “normal” extended creep test and extended creep tests are necessary. Nevertheless, this method will help to estimate a more reasonable load level for extended creep tests. For the Al-SM test series, the results show that this type of coating is not very creep sensitive. For this reason, the same load level (0.9 FSm) was selected for performing the extended creep tests. As it can be seen in Figure 26, the extended creep tests can be considered as passed tests and the nominal slip factor can be calculated with the same load level (0.9 FSm). All extended creep tests were also passed with the same load level for
Project No.: 410410007-20003 | Report No.: 2018-06
Slip factors for typical stainless steel surface finishes and new types of coatings for stainless steel
37 23.03.2018
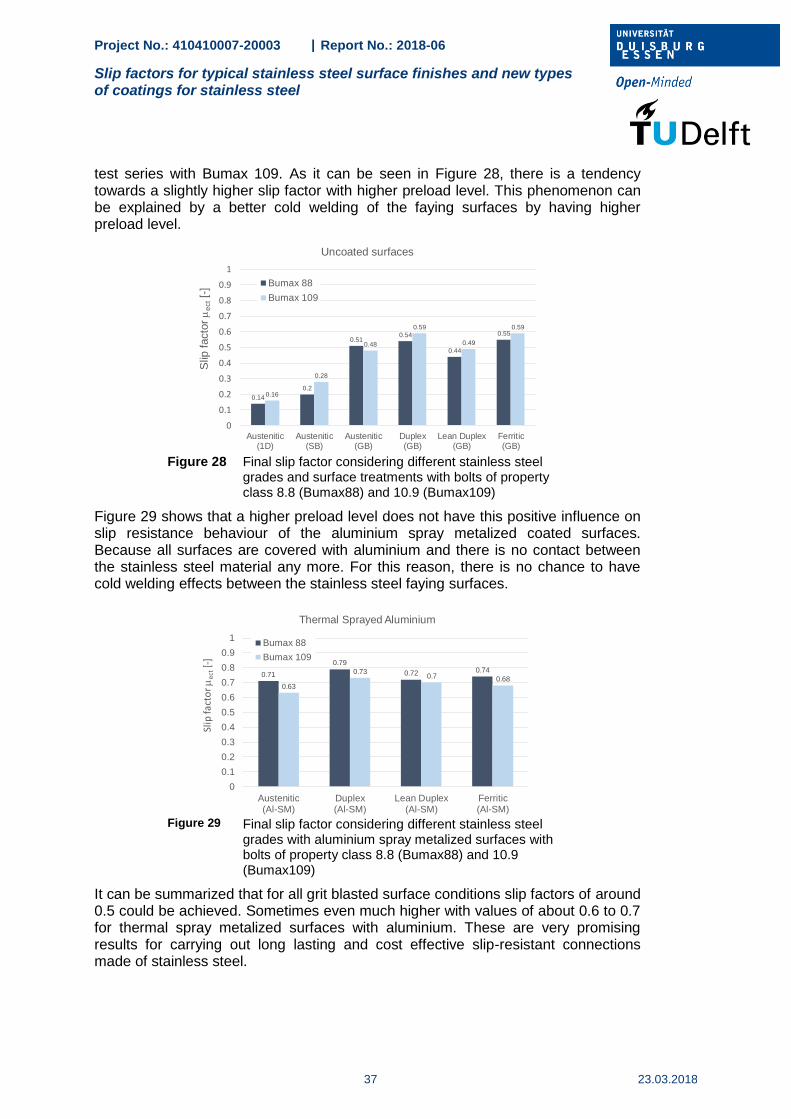
test series with Bumax 109. As it can be seen in Figure 28, there is a tendency towards a slightly higher slip factor with higher preload level. This phenomenon can be explained by a better cold welding of the faying surfaces by having higher preload level.
Figure 28 Final slip factor considering different stainless steel
grades and surface treatments with bolts of property class 8.8 (Bumax88) and 10.9 (Bumax109)
Figure 29 shows that a higher preload level does not have this positive influence on slip resistance behaviour of the aluminium spray metalized coated surfaces. Because all surfaces are covered with aluminium and there is no contact between the stainless steel material any more. For this reason, there is no chance to have cold welding effects between the stainless steel faying surfaces.
Figure 29 Final slip factor considering different stainless steel
grades with aluminium spray metalized surfaces with bolts of property class 8.8 (Bumax88) and 10.9 (Bumax109)
It can be summarized that for all grit blasted surface conditions slip factors of around 0.5 could be achieved. Sometimes even much higher with values of about 0.6 to 0.7 for thermal spray metalized surfaces with aluminium. These are very promising results for carrying out long lasting and cost effective slip-resistant connections made of stainless steel.
0.14
0.2
0.510.54
0.44
0.55
0.16
0.28
0.48
0.59
0.49
0.59
0
0.1
0.2
0.3
0.4
0.5
0.6
0.7
0.8
0.9
1
Austenitic(1D)
Austenitic(SB)
Austenitic(GB)
Duplex(GB)
Lean Duplex(GB)
Ferritic(GB)
Slip
facto
r
ect[-
]
Uncoated surfaces
Bumax 88
Bumax 109
0.71
0.79
0.72 0.74
0.63
0.730.7 0.68
0
0.1
0.2
0.3
0.4
0.5
0.6
0.7
0.8
0.9
1
Austenitic(Al-SM)
Duplex(Al-SM)
Lean Duplex(Al-SM)
Ferritic(Al-SM)
Slip
fact
or
ect[-
]
Thermal Sprayed Aluminium
Bumax 88
Bumax 109

Project No.: 410410007-20003 | Report No.: 2018-06
Slip factors for typical stainless steel surface finishes and new types of coatings for stainless steel
23.03.2018
38
4 Conclusions
For the investigated stainless steel plates and bolt sets, the preload losses during slip factor tests caused by viscoplastic deformation of the stainless steel material are not significantly higher than those found for preloaded bolted connections made of carbon steel components.
Grit blasting of stainless steel surfaces result in very high surface roughness and slip factors. For the investigated austenitic, duplex, lean duplex and ferritic stainless steel plates slip factors of about 0.5 and higher could be achieved. The results show that the slip factors for different grades of stainless steel with Al-SM-coating with Bumax 109 and Bumax 88 bolts were greater than 0.6 and 0.7 respectively. Stainless steel plates with untreated (1D) or shot blasted surfaces lead to comparable low slip factors of about 0.16 - 0.28 which might still be enough in some practical applications.
Opposite to what is known for carbon steels, uncoated slip-resistant connections made of stainless steel plates show with increasing preload levels higher slip factors. On the other hand, increasing the preload level in Al-SM-stainless steel slip-resistant connections lead to increased slip loads but slightly decreased slip factors comparable to the behaviour of coated carbon steel slip-resistant connections.
Essen, 23.03.2018
Univ.-Prof. Dr.-Ing. habil. Natalie Stranghöner Nariman Afzali M.Sc.
Peter de Vries M.Sc.
Project No.: 410410007-20003 | Report No.: 2018-06
Slip factors for typical stainless steel surface finishes and new types of coatings for stainless steel
39 23.03.2018
5 References
[1] EN 1090-2:2008+A1:2011, Execution of steel structures and aluminium structures — Part 2: Technical requirements for steel structures.
[2] Stranghöner, N., Afzali, N., de Vries, P., Schedin, E., Pilhagen, J.: Slip-resistant bolted connections of stainless steel, Steel Construction 10 (2017), Issue 4, p. 333-343.
[3] EN ISO 4287:2009, Geometrical Product Specifications (GPS) - Surface texture: Profile method - Terms, definitions and surface texture parameters (ISO 4287:1997 + Cor 1:1998 + Cor 2:2005 + Amd 1:2009)
[4] EN ISO 2808:2007, Paints and varnishes – Determination of film thickness.
[5] EN 14399-4:2015, High-strength structural bolting assemblies for preloading – Part 4: System HV – Hexagon bolt and nut assemblies.
[6] EN 14399-3:2015, High-strength structural bolting assemblies for preloading – Part 3: System HR – Hexagon bolt and nut assemblies.
[7] EN ISO 4017:2014, Fasteners – Hexagon head screws — Product grades A and B (ISO 4017:2014).
[8] EN ISO 4032:2012, Hexagon regular nuts (style 1) – Product grades A and B (ISO 4032:2012).
[9] EN ISO 7089:2000, Plain washers – Normal series, Product grade A (ISO 7089:2000).
[10] EN ISO 3506-1, Mechanical properties of corrosion-resistant stainless steel fasteners – Part 1: Bolts, screws and studs (ISO 3506-1:2009).
[11] EN ISO 3506-2, Mechanical properties of corrosion-resistant stainless steel fasteners – Part 2: Nuts (ISO 3506-2:2009).
[12] EN ISO 898-1:2013, Mechanical properties of fasteners made of carbon steel and alloy steel – Part 1: Bolts, screws and studs with specified property classes – Coarse thread and fine pitch thread (ISO 898-1:2013).
[13] Stranghöner, N., Jungbluth, D., Abraham, Chr., Söderman, A.: Tightening behaviour of preloaded stainless steel bolting assemblies, Steel Construction 10 (2017), No. 4, pp. 319–332.
[14] Stranghöner, N., Afzali, N., de Vries, P., Glienke, R., Ebert, A.: Optimization of the procedure for slip factor tests according to EN 1090-2, Steel Construction 10 (2017), No. 4.
[15] Stranghöner, N., Afzali, N., de Vries, P., Schedin, E., Pilhagen, J.: Slip-resistant bolted connections of stainless steel, Steel Construction 10 (2017), Issue 4, p. 333-343
[16] Stranghöner, N., Afzali, N., Berg, J., Schiborr, M., Bijlaard, F., Gresnigt, N., de Vries, P., Glienke, R., Ebert, A.: Influence of different testing criteria on the slip factor of slip-resistant connections, Proceedings of the 13th Nordic Steel Construction Conference, Tampere, Finland, September 23th – 25th, 2015.
[17] Stranghöner, N., Afzali, N., Berg, J., Schiborr, M., Rudolf, A., Berger, S.: Different coating systems for the application in slip-resistant connections, Proceedings of the 13th Nordic Steel Construction Conference, Tampere, Finland, September 23 – 25, 2015.
Project No.: 410410007-20003 | Report No.: 2018-06
Slip factors for typical stainless steel surface finishes and new types of coatings for stainless steel
23.03.2018
40
[18] Stranghöner, N., Afzali, N., Berg, J.: Gleitfeste Verbindungen im Turm- und Mastbau – Prüfung und Beschichtung, Stahlbau 84 (2015), Heft 12, S. 966-979.
[19] Stranghöner, N., Afzali, N.: Deliverable report D2.2, Comparative study on the influence of bolts preloaded in the plastic range vs. bolts preloaded in the elastic range only.
[20] Vries, P.A. de: Addition to Deliverable report D6.2/6.3, Delft University of Technology, Stevin report 6-18-4: Slip factor tests on 4 Stainless Steel grades with typical surface finishes and Al-SM coating, preloaded with BUMAX109 bolts, March 2018
Project No.: 410410007-20003 | Report No.: 2018-06
Slip factors for typical stainless steel surface finishes and new types of coatings for stainless steel
41 23.03.2018
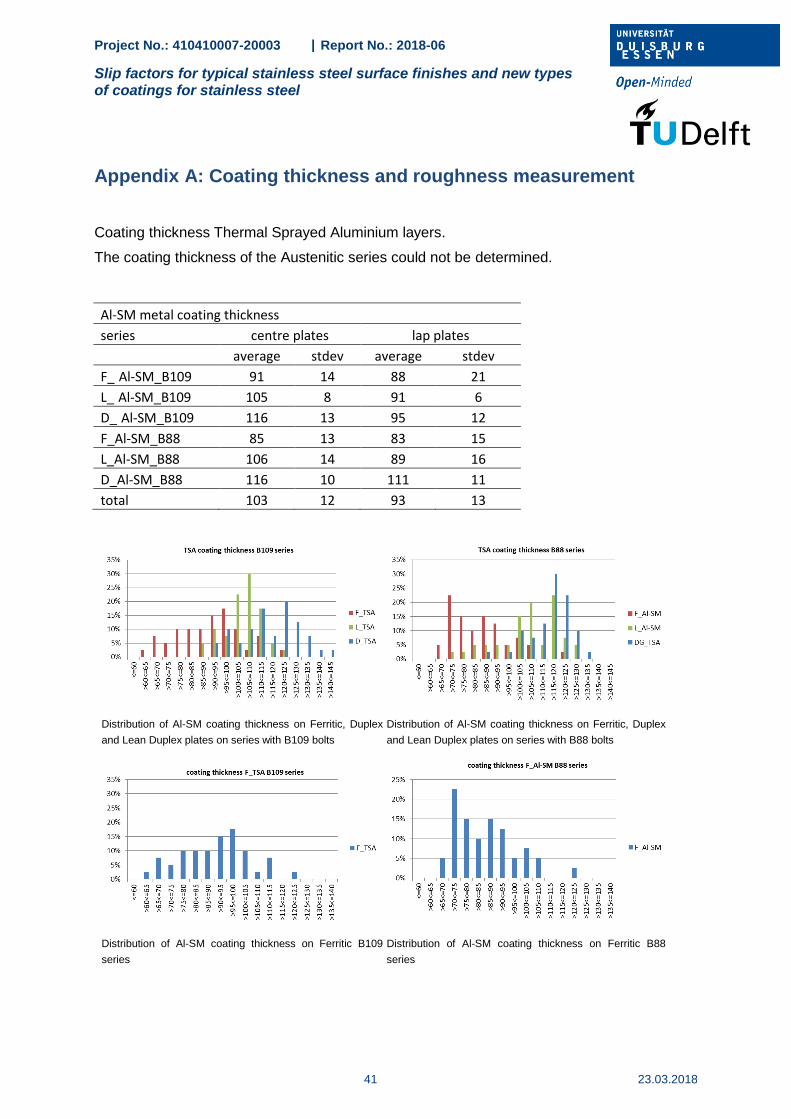
Appendix A: Coating thickness and roughness measurement
Coating thickness Thermal Sprayed Aluminium layers.
The coating thickness of the Austenitic series could not be determined.
Al-SM metal coating thickness
series centre plates lap plates
average stdev average stdev
F_ Al-SM_B109 91 14 88 21
L_ Al-SM_B109 105 8 91 6
D_ Al-SM_B109 116 13 95 12
F_Al-SM_B88 85 13 83 15
L_Al-SM_B88 106 14 89 16
D_Al-SM_B88 116 10 111 11
total 103 12 93 13
Distribution of Al-SM coating thickness on Ferritic, Duplex
and Lean Duplex plates on series with B109 bolts
Distribution of Al-SM coating thickness on Ferritic, Duplex
and Lean Duplex plates on series with B88 bolts
Distribution of Al-SM coating thickness on Ferritic B109
series
Distribution of Al-SM coating thickness on Ferritic B88
series
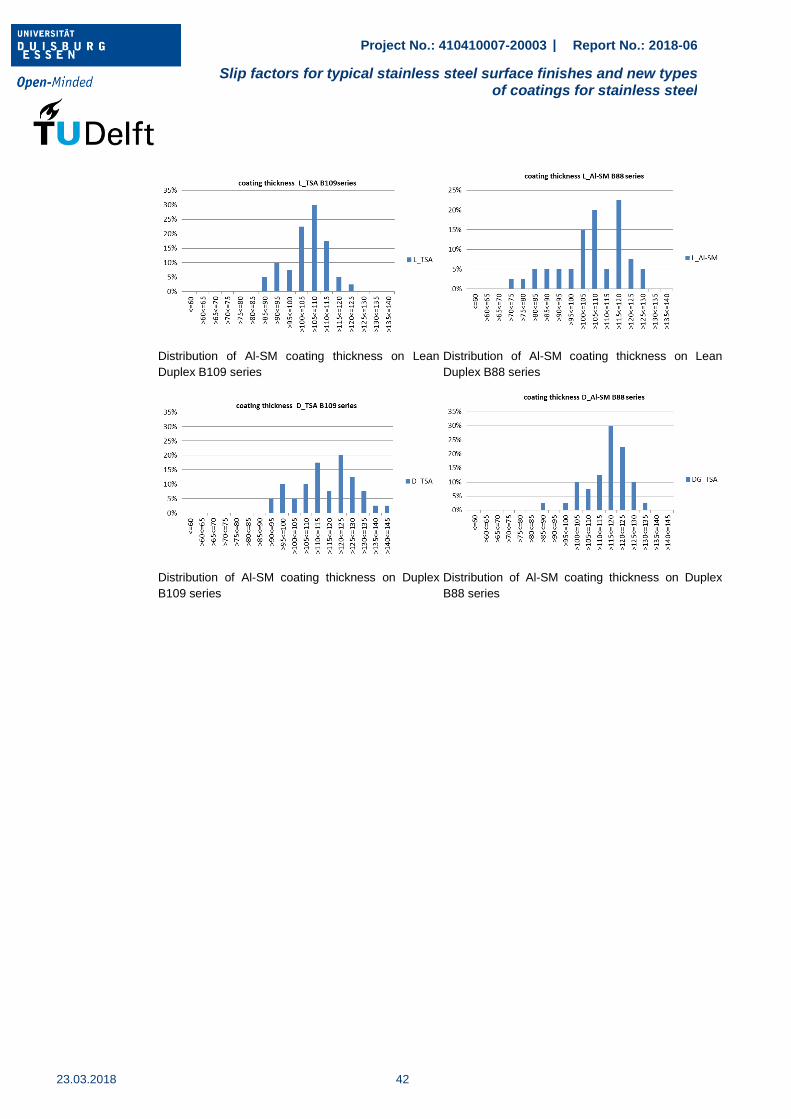
Project No.: 410410007-20003 | Report No.: 2018-06
Slip factors for typical stainless steel surface finishes and new types of coatings for stainless steel
23.03.2018
42
Distribution of Al-SM coating thickness on Lean
Duplex B109 series Distribution of Al-SM coating thickness on Lean
Duplex B88 series
Distribution of Al-SM coating thickness on Duplex
B109 series Distribution of Al-SM coating thickness on Duplex
B88 series
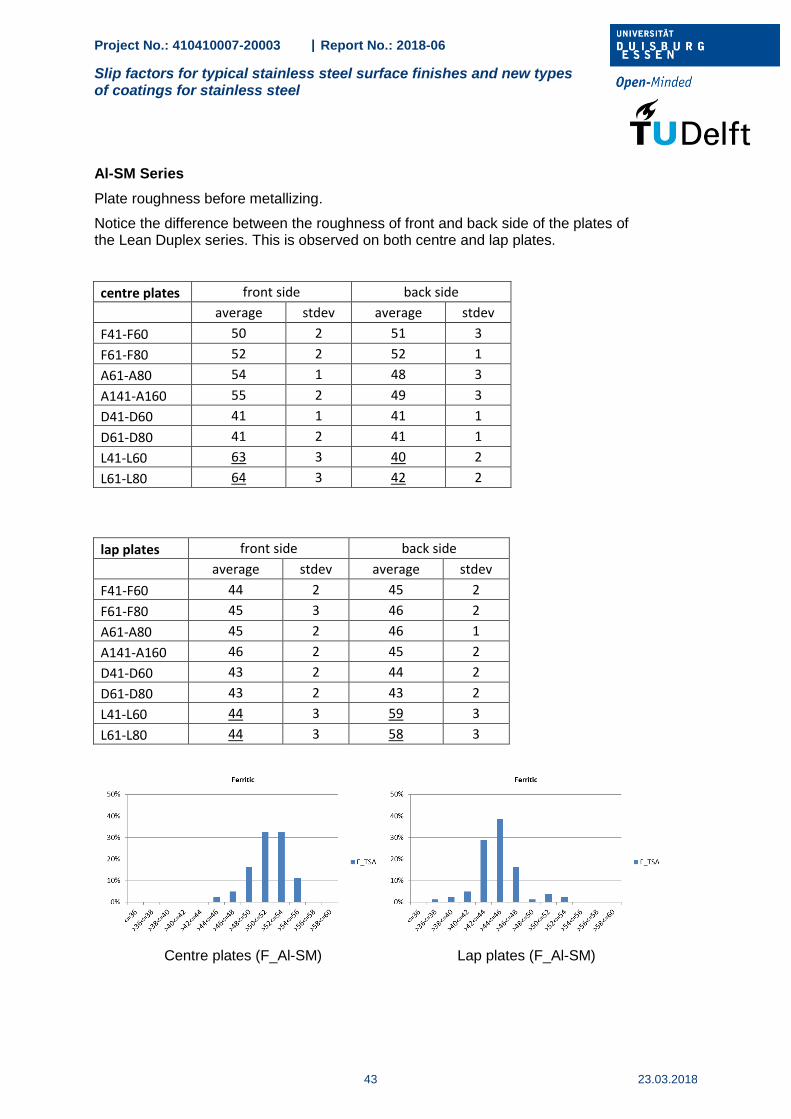
Project No.: 410410007-20003 | Report No.: 2018-06
Slip factors for typical stainless steel surface finishes and new types of coatings for stainless steel
43 23.03.2018
Al-SM Series
Plate roughness before metallizing.
Notice the difference between the roughness of front and back side of the plates of the Lean Duplex series. This is observed on both centre and lap plates.
centre plates front side back side
average stdev average stdev
F41-F60 50 2 51 3
F61-F80 52 2 52 1
A61-A80 54 1 48 3
A141-A160 55 2 49 3
D41-D60 41 1 41 1
D61-D80 41 2 41 1
L41-L60 63 3 40 2
L61-L80 64 3 42 2
lap plates front side back side
average stdev average stdev
F41-F60 44 2 45 2
F61-F80 45 3 46 2
A61-A80 45 2 46 1
A141-A160 46 2 45 2
D41-D60 43 2 44 2
D61-D80 43 2 43 2
L41-L60 44 3 59 3
L61-L80 44 3 58 3
Centre plates (F_Al-SM) Lap plates (F_Al-SM)
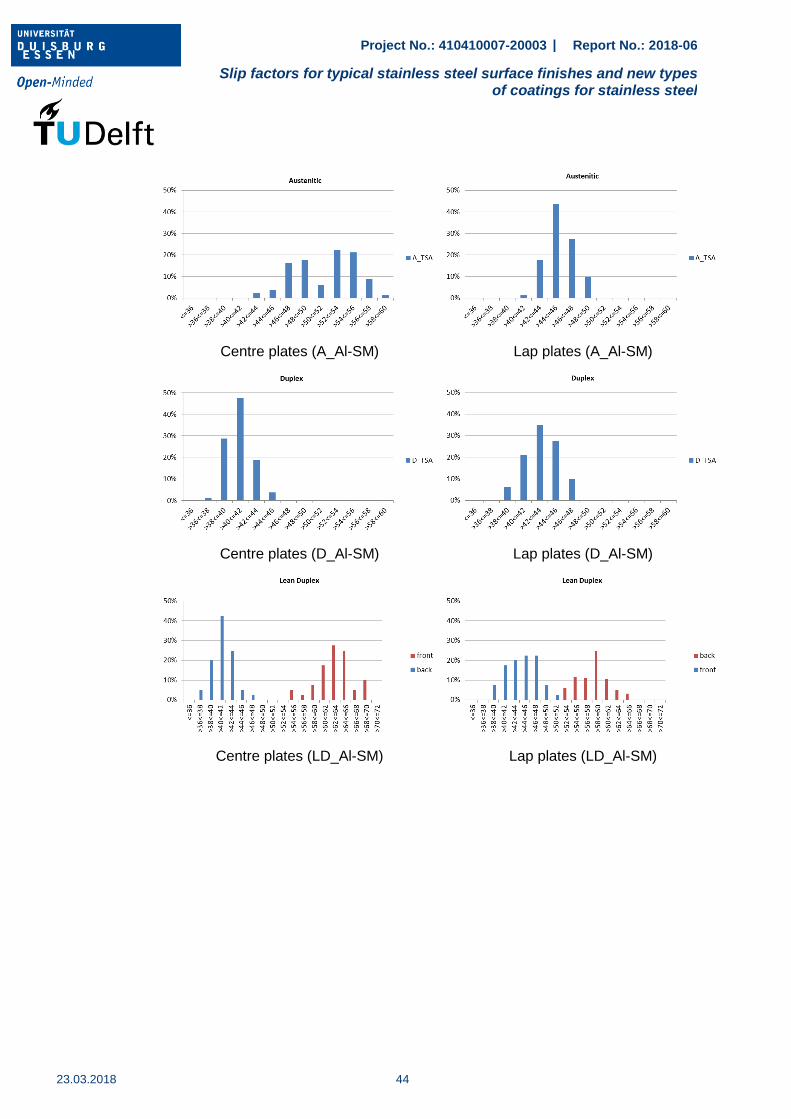
Project No.: 410410007-20003 | Report No.: 2018-06
Slip factors for typical stainless steel surface finishes and new types of coatings for stainless steel
23.03.2018
44
Centre plates (A_Al-SM) Lap plates (A_Al-SM)
Centre plates (D_Al-SM) Lap plates (D_Al-SM)
Centre plates (LD_Al-SM) Lap plates (LD_Al-SM)
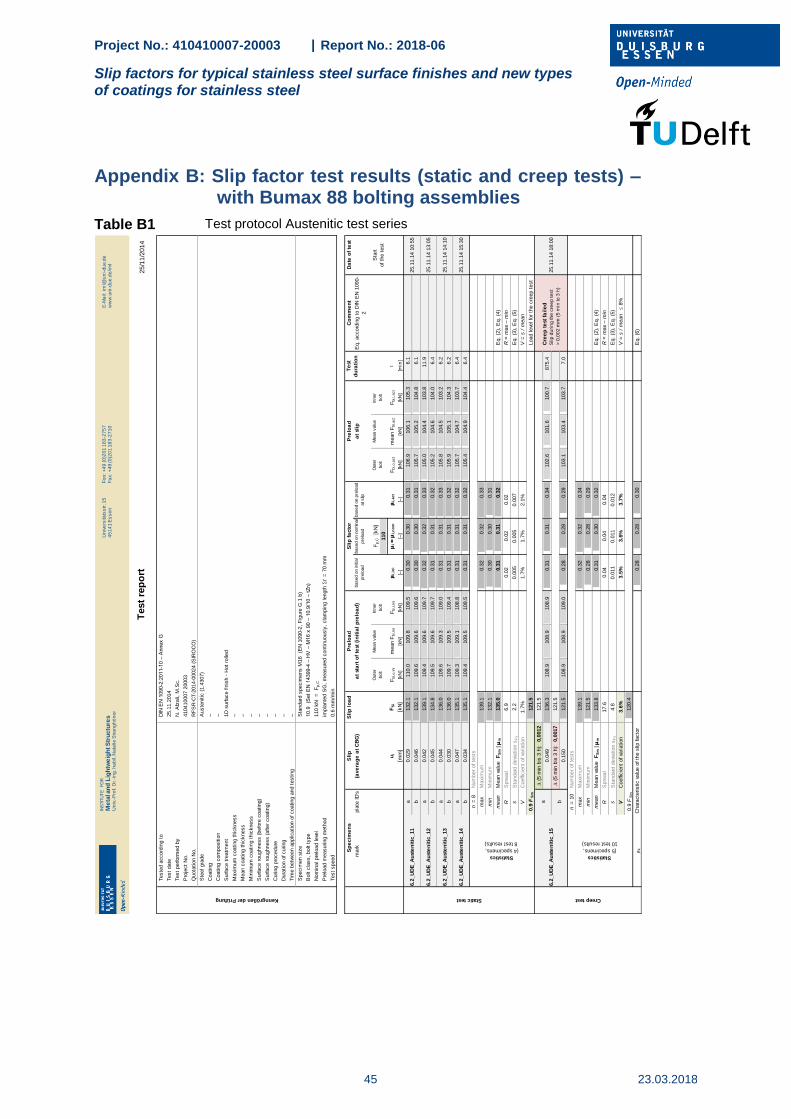
Project No.: 410410007-20003 | Report No.: 2018-06
Slip factors for typical stainless steel surface finishes and new types of coatings for stainless steel
45 23.03.2018
Appendix B: Slip factor test results (static and creep tests) – with Bumax 88 bolting assemblies
Table B1 Test protocol Austenitic test series
25
/11
/20
14
Sli
pS
lip
lo
ad
Co
mm
en
tD
ate
of
test
mark
pla
te ID
's(a
ve
rag
e a
t C
BG
)based o
n n
om
inal
pre
load
Mean v
alu
eF
p,C
[k
N]
Mean v
alu
e
110
ui
FS
iF
bi,o
,in
im
ean F
bi,in
iF
bi,i,in
i
i,in
i
i
i,
no
m
i,a
ct
Fb
i,o
,act
mean F
bi,a
ct
Fb
i,i,a
ct
t
[mm
][k
N]
[kN
][k
N]
[kN
][–
][–
][–
][k
N]
[kN
][k
N]
[min
]
a0.0
29
132.1
110.0
109.8
109.5
0.3
00.3
00.3
1106.9
106.1
105.3
6.1
b0.0
46
132.1
109.6
109.6
109.6
0.3
00.3
00.3
1105.7
105.2
104.8
6.1
a0.0
42
139.1
109.4
109.6
109.7
0.3
20.3
20.3
3105.0
104.4
103.8
11.9
b0.0
45
134.8
109.5
109.6
109.7
0.3
10.3
10.3
2105.2
104.6
104.0
6.4
a0.0
44
136.0
109.6
109.3
109.0
0.3
10.3
10.3
3105.8
104.5
103.2
6.2
b0.0
30
136.0
109.7
109.5
109.4
0.3
10.3
10.3
2105.9
105.1
104.3
6.2
a0.0
47
135.1
109.3
109.1
108.8
0.3
10.3
10.3
2105.7
104.7
103.7
6.4
b0.0
34
135.1
109.4
109.5
109.5
0.3
10.3
10.3
2105.4
104.9
104.4
6.4
n =
8N
um
ber
of te
sts
max
Maxim
um
139.1
0.3
20.3
20.3
3
min
Min
imum
132.1
0.3
00.3
00.3
1
mean
Mean v
alu
e
FS
m |
m135.0
0.3
10.3
10.3
2E
q.
(2),
Eq.
(4)
RS
pre
ad
6.9
0.0
20.0
20.0
2R
= m
ax
– m
in
sS
tandard
devi
ation s
Fs
2.2
0.0
05
0.0
05
0.0
07
Eq.
(3),
Eq.
(5)
VC
oeffi
cie
nt
of va
riation
1.7
%1.7
%1.7
%2.1
%V
= s
/ m
ean
0.9
FS
m121.5
Load leve
l fo
r th
e c
reep t
est
D (
5 m
in b
is 3
h):
0,0
012
121.5
0.0
49
136.3
108.9
108.9
108.9
0.3
10.3
10.3
4102.6
101.6
100.7
875.4
D (
5 m
in b
is 3
h):
0,0
017
121.5
0.1
50
121.5
108.9
108.9
109.0
0.2
80.2
80.2
9103.1
103.4
103.7
7.0
n =
10
Num
ber
of te
sts
max
Maxim
um
139.1
0.3
20.3
20.3
4
min
Min
imum
121.5
0.2
80.2
80.2
9
mean
Mean v
alu
e
FS
m |
m133.8
0.3
10.3
00.3
2E
q.
(2),
Eq.
(4)
RS
pre
ad
17.6
0.0
40.0
40.0
4R
= m
ax
– m
in
sS
tandard
devi
ation s
Fs
4.8
0.0
11
0.0
11
0.0
12
Eq.
(3),
Eq.
(5)
VC
oeffi
cie
nt
of va
riation
3.6
%3.5
%3.6
%3.7
%V
= s
/ m
ean 8
%
0.9
FS
m120.4
k
0.2
80.2
80.3
0E
q.
(6)
Test
date
Test
perform
ed b
y
25.1
1.2
014
N.
Afz
ali,
M.S
c.
Maxim
um
coating t
hic
kness
Mean c
oating t
hic
kness
Min
imum
coating t
hic
kness
Surface r
oughness (
befo
re c
oating)
– – – –Statistics
(5 specimens,
10 test results)
Chara
cte
ristic v
alu
e o
f th
e s
lip facto
r
Statistics
(4 specimens,
8 test results)
Creep test
6.2
_U
DE
_A
ust
en
itic
_15
aC
ree
p t
est
fa
ile
d
Slip
du
rin
g th
e c
ree
p te
st
> 0
,00
2 m
m (
5 m
in to
3 h
)
25.1
1.1
4 1
8:0
0
Static test
6.2
_U
DE
_A
ust
en
itic
_14
25.1
1.1
4 1
5:3
0
b
6.2
_U
DE
_A
ust
en
itic
_13
25.1
1.1
4 1
4:1
0
6.2
_U
DE
_A
ust
en
itic
_12
25.1
1.1
4 1
3:0
5
6.2
_U
DE
_A
ust
en
itic
_11
25.1
1.1
4 1
0:5
5
Sp
ecim
en
sP
relo
ad
Sli
p f
acto
rP
relo
ad
at
sta
rt o
f te
st (
init
ial
pre
loa
d)
based o
n p
relo
ad
at slip
at
slip
Sta
rt
of th
e t
est
Oute
r
bolt
Inner
bolt
Oute
r
bolt
Inner
bolt
Te
st
du
rati
on
based o
n in
itial
pre
load
Eq.
accord
ing t
o D
IN E
N 1
090-
2
Pre
load m
easuring m
eth
od
impla
nte
d S
G,
measure
d c
ontinuously
, cla
mpin
g length
t
= 7
0 m
m
Test
speed
0.6
mm
/min
Tim
e b
etw
een a
pplic
ation o
f coating a
nd t
esting
–
Specim
en s
ize
Sta
ndard
specim
ens M
16
(EN
1090-2
, F
igure
G.1
b)
Bolt c
lass,
bolt t
ype
10.9
(S
et
EN
14399-4
– H
V –
M16 x
90 –
10.9
/10 –
tZn)
Test
rep
ort
Kenngrößen der Prüfung
Teste
d a
ccord
ing t
oD
IN E
N 1
090-2
:2011-1
0 –
Annex G
Pro
ject
No.
410410007 2
0003
Quota
tion N
o.
RF
SR
-CT-2
014-0
0024 (
SIR
OC
O)
Ste
el gra
de
Auste
nitic
(1.4
307)
Surface r
oughness (
after
coating)
–
Curing p
rocedure
–
Dura
tion o
f curing
–
Coating
–
Coating c
om
positio
n–
Surface t
reatm
ent
1D
surface fin
ish -
Hot
rolle
d
Nom
inal pre
load leve
l110 k
N
=
Fp
,C
INS
TIT
UT
FÜ
R
Me
tall-u
nd
Le
ich
tbau
Un
iv.-
Pro
f.D
r.-I
ng
.h
ab
il.N
ata
lie
Str
an
gh
ön
er
Un
ive
rsitä
tss
tr. 1
54
51
41
Es
se
nF
on
: +
49
(0
)20
1 1
83
-27
57
Fa
x: +
49
(0
)20
1 1
83
-27
10
E-M
ail:
iml@
un
i-d
ue.d
ew
ww
.un
i-d
ue
.de
/im
l
INS
TIT
UT
FÜ
R
Me
tall-u
nd
Le
ich
tbau
Un
iv.-
Pro
f.D
r.-I
ng
.h
ab
il.N
ata
lie
Str
an
gh
ön
er
Un
ive
rsitä
tss
tr. 1
54
51
41
Es
se
nF
on
: +
49
(0
)20
1 1
83
-27
57
Fa
x: +
49
(0
)20
1 1
83
-27
10
E-M
ail:
iml@
un
i-d
ue.d
ew
ww
.un
i-d
ue
.de
/im
l
INS
TIT
UT
FÜ
R
Me
tall-u
nd
Le
ich
tbau
Un
iv.-
Pro
f.D
r.-I
ng
.h
ab
il.N
ata
lie
Str
an
gh
ön
er
Un
ive
rsitä
tss
tr. 1
54
51
41
Es
se
nF
on
: +
49
(0
)20
1 1
83
-27
57
Fa
x: +
49
(0
)20
1 1
83
-27
10
E-M
ail:
iml@
un
i-d
ue.d
ew
ww
.un
i-d
ue
.de
/im
lU
niv
ers
itä
tss
tr. 1
54
51
41
Es
se
nF
on
: +
49
(0
)20
1 1
83
-27
57
Fa
x: +
49
(0
)20
1 1
83
-27
10
E-M
ail:
iml@
un
i-d
ue.d
ew
ww
.un
i-d
ue
.de
/im
l
INS
TIT
UT
EFO
R
Me
talan
dL
igh
twe
igh
tS
tru
ctu
res
Un
iv.-
Pro
f.D
r.-I
ng
.h
ab
il.N
ata
lie
Str
an
gh
ön
er
INS
TIT
UT
FÜ
R
Me
tall-u
nd
Le
ich
tbau
Un
iv.-
Pro
f.D
r.-I
ng
.h
ab
il.N
ata
lie
Str
an
gh
ön
er
Un
ive
rsitä
tss
tr. 1
54
51
41
Es
se
nF
on
: +
49
(0
)20
1 1
83
-27
57
Fa
x: +
49
(0
)20
1 1
83
-27
10
E-M
ail:
iml@
un
i-d
ue.d
ew
ww
.un
i-d
ue
.de
/im
l
INS
TIT
UT
FÜ
R
Me
tall-u
nd
Le
ich
tbau
Un
iv.-
Pro
f.D
r.-I
ng
.h
ab
il.N
ata
lie
Str
an
gh
ön
er
Un
ive
rsitä
tss
tr. 1
54
51
41
Es
se
nF
on
: +
49
(0
)20
1 1
83
-27
57
Fa
x: +
49
(0
)20
1 1
83
-27
10
E-M
ail:
iml@
un
i-d
ue.d
ew
ww
.un
i-d
ue
.de
/im
lU
niv
ers
itä
tss
tr. 1
54
51
41
Es
se
nF
on
: +
49
(0
)20
1 1
83
-27
57
Fa
x: +
49
(0
)20
1 1
83
-27
10
E-M
ail:
iml@
un
i-d
ue.d
ew
ww
.un
i-d
ue
.de
/im
l
INS
TIT
UT
EFO
R
Me
talan
dL
igh
twe
igh
tS
tru
ctu
res
Un
iv.-
Pro
f.D
r.-I
ng
.h
ab
il.N
ata
lie
Str
an
gh
ön
er
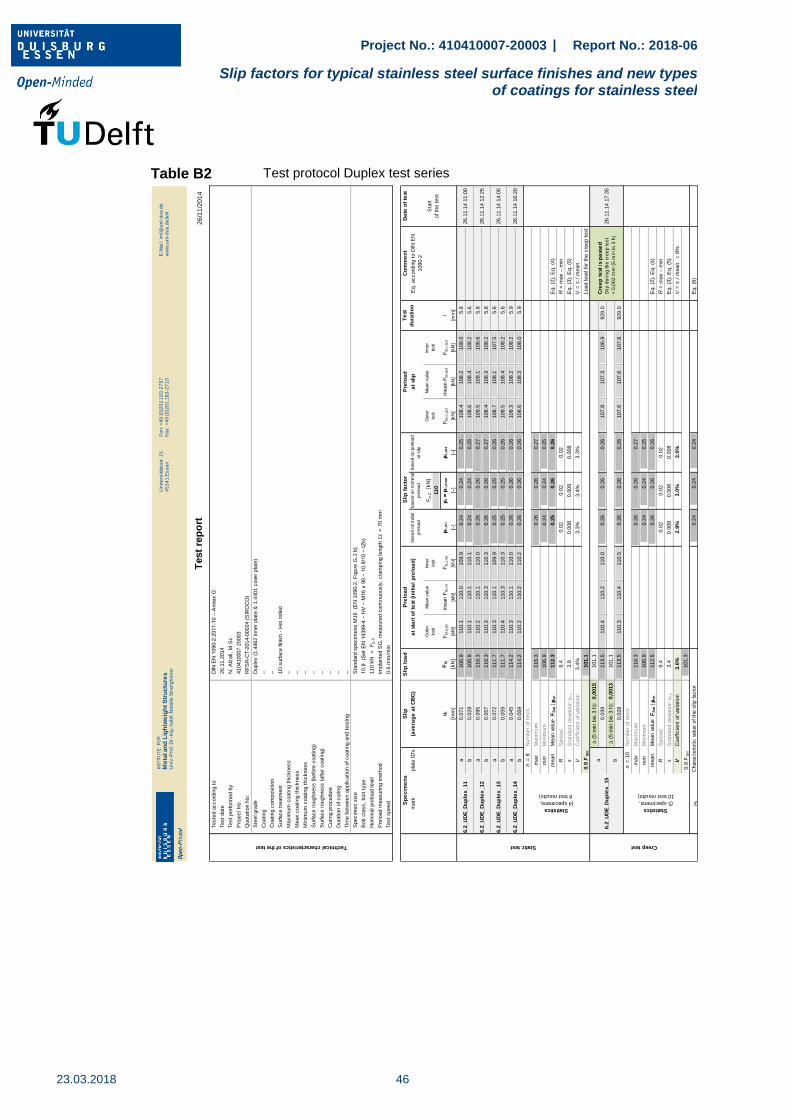
Project No.: 410410007-20003 | Report No.: 2018-06
Slip factors for typical stainless steel surface finishes and new types of coatings for stainless steel
23.03.2018
46
Table B2 Test protocol Duplex test series
26
/11
/20
14
Sli
pS
lip
lo
ad
Co
mm
en
tD
ate
of
test
mark
pla
te ID
's(a
ve
rag
e a
t C
BG
)based o
n n
om
inal
pre
load
Mean v
alu
eF
p,C
[k
N]
Mean v
alu
e
110
ui
FS
iF
bi,o,ini
mean F
bi,in
iF
bi,i,in
i
i,in
i
i
i,
no
m
i,act
Fbi,o,a
ct
mean F
bi,act
Fbi,i,act
t
[mm
][k
N]
[kN
][k
N]
[kN
][–
][–
][–
][k
N]
[kN
][k
N]
[min
]
a0.0
71
106.9
110.1
110.0
109.9
0.2
40.2
40.2
5108.4
108.2
108.0
5.6
b0.0
29
106.9
110.1
110.1
110.1
0.2
40.2
40.2
5108.6
108.4
108.2
5.6
a0.0
95
116.3
110.2
110.1
110.0
0.2
60.2
60.2
7109.5
109.1
108.6
5.8
b0.0
57
116.3
110.3
110.3
110.3
0.2
60.2
60.2
7108.4
108.3
108.2
5.8
a0.0
72
111.7
110.3
110.1
109.9
0.2
50.2
50.2
6108.7
108.1
107.5
5.6
b0.0
59
111.7
110.4
110.3
110.3
0.2
50.2
50.2
6108.5
108.4
108.2
5.6
a0.0
45
114.2
110.3
110.1
110.0
0.2
60.2
60.2
6108.3
108.2
108.2
5.9
b0.0
59
114.2
110.2
110.2
110.2
0.2
60.2
60.2
6108.6
108.3
108.0
5.9
n =
8N
um
ber
of te
sts
max
Maxim
um
116.3
0.2
60.2
60.2
7
min
Min
imum
106.9
0.2
40.2
40.2
5
mean
Mean v
alu
e
FS
m |
m112.3
0.2
50.2
60.2
6E
q.
(2),
Eq.
(4)
RS
pre
ad
9.4
0.0
20.0
20.0
2R
= m
ax
– m
in
sS
tandard
devi
ation s
Fs
3.8
0.0
08
0.0
09
0.0
08
Eq.
(3),
Eq.
(5)
VC
oeffi
cie
nt
of va
riation
3.4
%3.3
%3.4
%3.3
%V
= s
/ m
ean
0.9
FS
m101.1
Load leve
l fo
r th
e c
reep t
est
D (
5 m
in b
is 3
h):
0,0
015
101.1
0.0
39
113.5
110.4
110.2
110.0
0.2
60.2
60.2
6107.8
107.3
106.9
929.0
D (
5 m
in b
is 3
h):
0,0
013
101.1
0.0
28
113.5
110.3
110.4
110.5
0.2
60.2
60.2
6107.6
107.6
107.6
929.0
n =
10
Num
ber
of te
sts
max
Maxim
um
116.3
0.2
60.2
60.2
7
min
Min
imum
106.9
0.2
40.2
40.2
5
mean
Mean v
alu
e
FS
m |
m112.5
0.2
60.2
60.2
6E
q.
(2),
Eq.
(4)
RS
pre
ad
9.4
0.0
20.0
20.0
2R
= m
ax
– m
in
sS
tandard
devi
ation s
Fs
3.4
0.0
08
0.0
08
0.0
08
Eq.
(3),
Eq.
(5)
VC
oeffi
cie
nt
of va
riation
3.0
%2.9
%3.0
%3.0
%V
= s
/ m
ean 8
%
0.9
FS
m101.3
k
0.2
40.2
40.2
4E
q.
(6)
Test
date
Test
perform
ed b
y
Pro
ject
No.
26.1
1.2
014
N.
Afz
ali,
M.S
c.
Maxim
um
coating t
hic
kness
Mean c
oating t
hic
kness
Min
imum
coating t
hic
kness
Surface r
oughness (
befo
re c
oating)
– – – –
Test
rep
ort
Technical characteristics of the test
Teste
d a
ccord
ing t
oD
IN E
N 1
090-2
:2011-1
0 –
Annex G
410410007 2
0003
Quota
tion N
o.
RF
SR
-CT-2
014-0
0024 (
SIR
OC
O)
Ste
el gra
de
Duple
x (
1.4
462 inner
pla
te &
1.4
401 c
ove
r pla
te)
Surface r
oughness (
after
coating)
–
Curing p
rocedure
–
Dura
tion o
f curing
–
Coating
–
Coating c
om
positio
n–
Surface t
reatm
ent
1D
surface fin
ish -
Hot
rolle
d
Nom
inal pre
load leve
l110 k
N
=
Fp,C
Pre
load m
easuring m
eth
od
impla
nte
d S
G,
measure
d c
ontinuously
, cla
mpin
g length
t
= 7
0 m
m
Test
speed
0.6
mm
/min
Tim
e b
etw
een a
pplic
ation o
f coating a
nd t
esting
–
Specim
en s
ize
Sta
ndard
specim
ens M
16
(EN
1090-2
, F
igure
G.1
b)
Bolt c
lass,
bolt t
ype
10.9
(S
et
EN
14399-4
– H
V –
M16 x
90 –
10.9
/10 –
tZn)
Sp
ecim
en
sP
relo
ad
Sli
p f
acto
rP
relo
ad
at
sta
rt o
f te
st (
init
ial
pre
loa
d)
based o
n p
relo
ad
at slip
at
slip
Sta
rt
of th
e t
est
Oute
r
bolt
Inner
bolt
Oute
r
bolt
Inner
bolt
based o
n in
itial
pre
load
Eq.
accord
ing t
o D
IN E
N
1090-2
Te
st
du
rati
on
6.2
_U
DE
_D
up
lex
_12
26.1
1.1
4 1
2:2
5
6.2
_U
DE
_D
up
lex
_11
26.1
1.1
4 1
1:0
0
Statistics
(4 specimens,
8 test results)
Creep test
6.2
_U
DE
_D
up
lex
_15
aC
ree
p t
est
is
pa
sse
d
Slip
du
rin
g th
e c
ree
p te
st
< 0
,00
2 m
m (
5 m
in to
3 h
)
26.1
1.1
4 1
7:3
5
Static test
6.2
_U
DE
_D
up
lex
_14
26.1
1.1
4 1
6:2
0
b
6.2
_U
DE
_D
up
lex
_13
26.1
1.1
4 1
4:0
5
Statistics
(5 specimens,
10 test results)
Chara
cte
ristic v
alu
e o
f th
e s
lip facto
r
INS
TIT
UT
FÜ
R
Me
tall-u
nd
Le
ich
tbau
Un
iv.-
Pro
f.D
r.-I
ng
.h
ab
il.N
ata
lie
Str
an
gh
ön
er
Un
ive
rsitä
tss
tr. 1
54
51
41
Es
se
nF
on
: +
49
(0
)20
1 1
83
-27
57
Fa
x: +
49
(0
)20
1 1
83
-27
10
E-M
ail:
iml@
un
i-d
ue.d
ew
ww
.un
i-d
ue
.de
/im
l
INS
TIT
UT
FÜ
R
Me
tall-u
nd
Le
ich
tbau
Un
iv.-
Pro
f.D
r.-I
ng
.h
ab
il.N
ata
lie
Str
an
gh
ön
er
Un
ive
rsitä
tss
tr. 1
54
51
41
Es
se
nF
on
: +
49
(0
)20
1 1
83
-27
57
Fa
x: +
49
(0
)20
1 1
83
-27
10
E-M
ail:
iml@
un
i-d
ue.d
ew
ww
.un
i-d
ue
.de
/im
l
INS
TIT
UT
FÜ
R
Me
tall-u
nd
Le
ich
tbau
Un
iv.-
Pro
f.D
r.-I
ng
.h
ab
il.N
ata
lie
Str
an
gh
ön
er
Un
ive
rsitä
tss
tr. 1
54
51
41
Es
se
nF
on
: +
49
(0
)20
1 1
83
-27
57
Fa
x: +
49
(0
)20
1 1
83
-27
10
E-M
ail:
iml@
un
i-d
ue.d
ew
ww
.un
i-d
ue
.de
/im
lU
niv
ers
itä
tss
tr. 1
54
51
41
Es
se
nF
on
: +
49
(0
)20
1 1
83
-27
57
Fa
x: +
49
(0
)20
1 1
83
-27
10
E-M
ail:
iml@
un
i-d
ue.d
ew
ww
.un
i-d
ue
.de
/im
l
INS
TIT
UT
EFO
R
Me
talan
dL
igh
twe
igh
tS
tru
ctu
res
Un
iv.-
Pro
f.D
r.-I
ng
.h
ab
il.N
ata
lie
Str
an
gh
ön
er
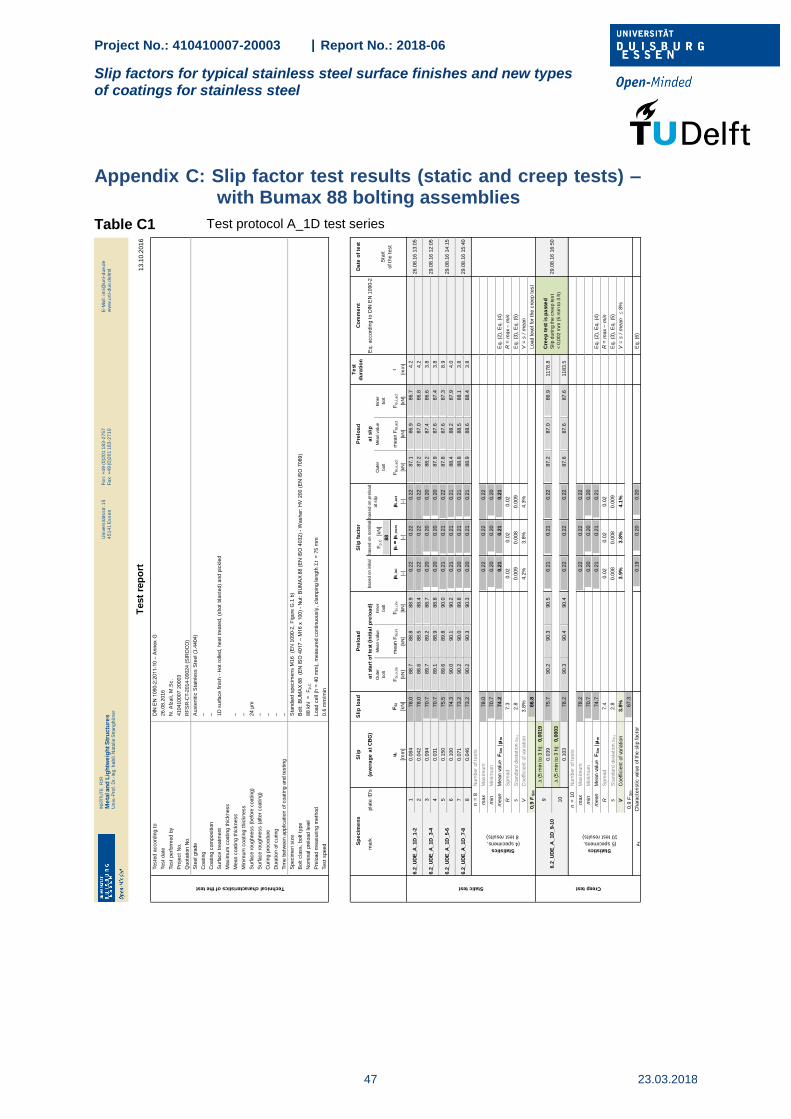
Project No.: 410410007-20003 | Report No.: 2018-06
Slip factors for typical stainless steel surface finishes and new types of coatings for stainless steel
47 23.03.2018
Appendix C: Slip factor test results (static and creep tests) – with Bumax 88 bolting assemblies
Table C1 Test protocol A_1D test series
13
.10
.20
16
Sli
pS
lip
lo
ad
Co
mm
en
tD
ate
of
test
mark
pla
te ID
's(a
ve
rag
e a
t C
BG
)based o
n in
itial
pre
load
based o
n n
om
inal
pre
load
Mean v
alu
eF
p,C
[k
N]
Mean v
alu
e
88
ui
FS
iF
bi,o,ini
mean F
bi,in
iF
bi,i,in
i
i,in
i
i
i,
no
m
i,act
Fbi,o,a
ct
mean F
bi,act
Fbi,i,act
t
[mm
][k
N]
[kN
][k
N]
[kN
][–
][–
][–
][k
N]
[kN
][k
N]
[min
]
10.0
84
78.0
88.7
88.8
88.9
0.2
20.2
20.2
287.1
86.9
86.7
4.2
20.0
42
78.0
88.6
88.5
88.4
0.2
20.2
20.2
287.2
87.0
86.8
4.2
30.0
94
70.7
89.7
89.2
88.7
0.2
00.2
00.2
088.2
87.4
86.6
3.8
40.0
31
70.7
89.1
88.9
88.8
0.2
00.2
00.2
087.9
87.6
87.4
3.8
50.1
50
75.5
89.6
89.8
90.0
0.2
10.2
10.2
287.8
87.6
87.3
8.9
60.1
00
74.3
90.0
90.1
90.2
0.2
10.2
10.2
188.4
88.2
87.9
4.0
70.0
71
73.2
90.2
90.0
89.8
0.2
00.2
10.2
188.8
88.5
88.1
3.8
80.0
46
73.2
90.2
90.3
90.3
0.2
00.2
10.2
188.9
88.6
88.4
3.8
n =
8N
um
ber
of te
sts
max
Maxim
um
78.0
0.2
20.2
20.2
2
min
Min
imum
70.7
0.2
00.2
00.2
0
mean
Mean v
alu
e
FS
m |
m74.2
0.2
10.2
10.2
1E
q.
(2),
Eq.
(4)
RS
pre
ad
7.3
0.0
20.0
20.0
2R
= m
ax
– m
in
sS
tandard
devi
ation s
Fs
2.8
0.0
09
0.0
08
0.0
09
Eq.
(3),
Eq.
(5)
VC
oeffi
cie
nt
of va
riation
3.8
%4.2
%3.8
%4.3
%V
= s
/ m
ean
0,9
FS
m66.8
Load leve
l fo
r th
e c
reep t
est
D (
5 m
in t
o 3
h):
0,0
019
0.0
39
75.7
90.2
90.3
90.5
0.2
10.2
10.2
287.2
87.0
86.9
1178.8
D (
5 m
in t
o 3
h):
0,0
003
0.1
03
78.2
90.3
90.4
90.4
0.2
20.2
20.2
287.6
87.6
87.6
1183.5
n =
10
Num
ber
of te
sts
max
Maxim
um
78.2
0.2
20.2
20.2
2
min
Min
imum
70.7
0.2
00.2
00.2
0
mean
Mean v
alu
e
FS
m |
m74.7
0.2
10.2
10.2
1E
q.
(2),
Eq.
(4)
RS
pre
ad
7.4
0.0
20.0
20.0
2R
= m
ax
– m
in
sS
tandard
devi
ation s
Fs
2.8
0.0
08
0.0
08
0.0
09
Eq.
(3),
Eq.
(5)
VC
oeffi
cie
nt
of va
riation
3.8
%3.9
%3.8
%4.1
%V
= s
/ m
ean 8
%
0,9
FS
m67.3
k
0.1
90.2
00.2
0E
q.
(6)
Test
rep
ort
Technical characteristics of the test
Teste
d a
ccord
ing t
oD
IN E
N 1
090-2
:2011-1
0 –
Annex G
Test
date
26.0
8.2
016
Test
perform
ed b
yN
. A
fzali,
M.S
c.
Pro
ject
No.
410410007 2
0003
Coating c
om
positio
n–
Surface t
reatm
ent
1D
surface fin
ish -
Hot
rolle
d,
heat
treate
d,
(shot
bla
ste
d)
and p
ickle
d
Maxim
um
coating t
hic
kness
Quota
tion N
o.
RF
SR
-CT-2
014-0
0024 (
SIR
OC
O)
Ste
el gra
de
Auste
nitic
Sta
inle
ss S
teel (1
.4404)
Coating
–
Surface r
oughness (
after
coating)
–
Curing p
rocedure
–
Dura
tion o
f curing
–
Mean c
oating t
hic
kness
–
Min
imum
coating t
hic
kness
–
Surface r
oughness (
befo
re c
oating)
24 µ
m
Nom
inal pre
load leve
l88 k
N
=
Fp,C
Pre
load m
easuring m
eth
od
Load c
ell
(h =
40 m
m),
measure
d c
ontinuously
, cla
mpin
g length
t
= 7
5 m
m
Test
speed
0.6
mm
/min
Tim
e b
etw
een a
pplic
ation o
f coating a
nd t
esting
–
Specim
en s
ize
Sta
ndard
specim
ens M
16
(EN
1090-2
, F
igure
G.1
b)
Bolt c
lass,
bolt t
ype
Bolt:
BU
MA
X 8
8
(EN
IS
O 4
017 –
M16 x
100)
- N
ut:
BU
MA
X 8
8 (
EN
IS
O 4
032)
- W
asher:
HV
200 (
EN
IS
O 7
089)
Sp
ecim
en
sP
relo
ad
Sli
p f
acto
rP
relo
ad
Te
st
du
rati
on
at
sta
rt o
f te
st (
init
ial
pre
loa
d)
based o
n p
relo
ad
at slip
at
slip
Sta
rt
of th
e t
est
6.2
_U
DE
_A
_1D
_3-4
29.0
8.1
6 1
2:0
5
Creep test
6.2
_U
DE
_A
_1D
_9-1
0
9C
ree
p t
est
is
pa
sse
d
Slip
du
rin
g th
e c
ree
p te
st
< 0
,00
2 m
m (
5 m
in to
3 h
)
29.0
8.1
6 1
6:5
0
6.2
_U
DE
_A
_1D
_7-8
29.0
8.1
6 1
5:4
0
Statistics
(4 specimens,
8 test results)
Static test
6.2
_U
DE
_A
_1D
_1-2
6.2
_U
DE
_A
_1D
_5-6
29.0
8.1
6 1
4:1
5
Inner
bolt
10
Eq.
accord
ing t
o D
IN E
N 1
090-2
26.0
8.1
6 1
3:0
5
Statistics
(5 specimens,
10 test results)
Chara
cte
ristic v
alu
e o
f th
e s
lip facto
r
Oute
r
bolt
Inner
bolt
Oute
r
bolt
INS
TIT
UT
FÜ
R
Me
tall-u
nd
Le
ich
tbau
Un
iv.-
Pro
f.D
r.-I
ng
.h
ab
il.N
ata
lie
Str
an
gh
ön
er
Un
ive
rsitä
tss
tr. 1
54
51
41
Es
se
nF
on
: +
49
(0
)20
1 1
83
-27
57
Fa
x: +
49
(0
)20
1 1
83
-27
10
E-M
ail:
iml@
un
i-d
ue.d
ew
ww
.un
i-d
ue
.de
/im
l
INS
TIT
UT
FÜ
R
Me
tall-u
nd
Le
ich
tbau
Un
iv.-
Pro
f.D
r.-I
ng
.h
ab
il.N
ata
lie
Str
an
gh
ön
er
Un
ive
rsitä
tss
tr. 1
54
51
41
Es
se
nF
on
: +
49
(0
)20
1 1
83
-27
57
Fa
x: +
49
(0
)20
1 1
83
-27
10
E-M
ail:
iml@
un
i-d
ue.d
ew
ww
.un
i-d
ue
.de
/im
lU
niv
ers
itä
tss
tr. 1
54
51
41
Es
se
nF
on
: +
49
(0
)20
1 1
83
-27
57
Fa
x: +
49
(0
)20
1 1
83
-27
10
E-M
ail:
iml@
un
i-d
ue.d
ew
ww
.un
i-d
ue
.de
/im
l
INS
TIT
UT
EFO
R
Me
talan
dL
igh
twe
igh
tS
tru
ctu
res
Un
iv.-
Pro
f.D
r.-I
ng
.h
ab
il.N
ata
lie
Str
an
gh
ön
er
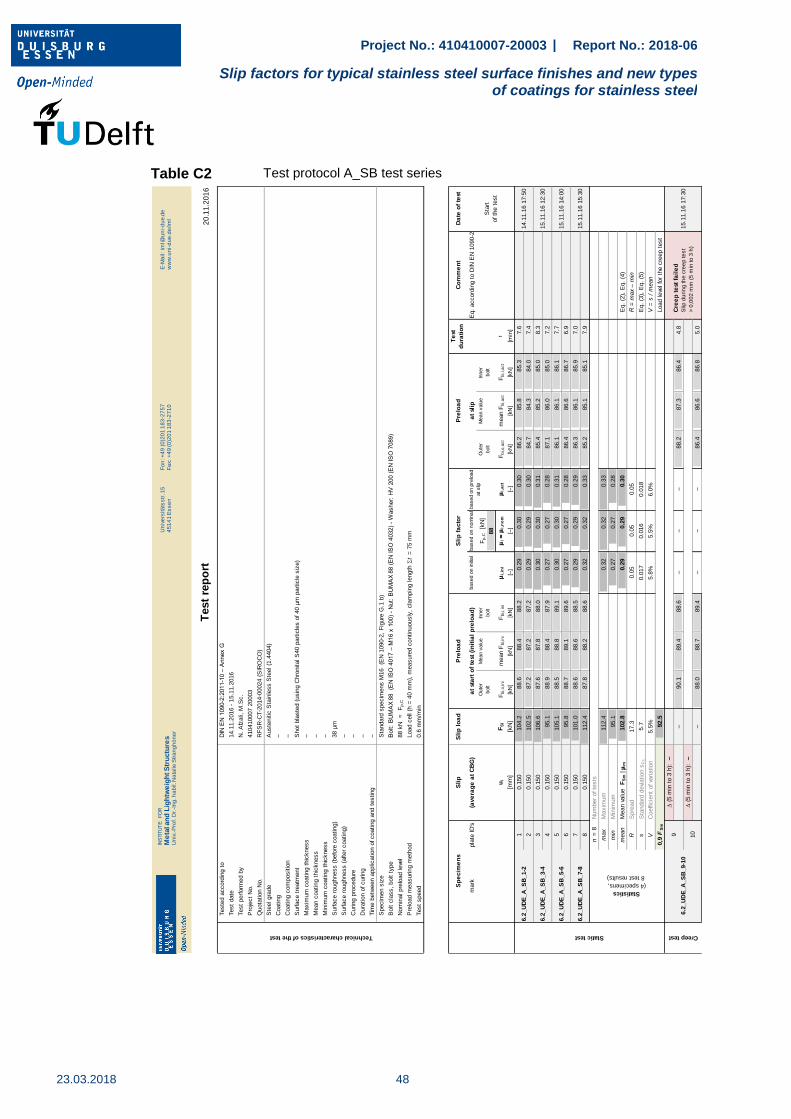
Project No.: 410410007-20003 | Report No.: 2018-06
Slip factors for typical stainless steel surface finishes and new types of coatings for stainless steel
23.03.2018
48
Table C2 Test protocol A_SB test series
20
.11
.20
16
Sli
pS
lip
lo
ad
Co
mm
en
tD
ate
of
test
mark
pla
te ID
's(a
ve
rag
e a
t C
BG
)based o
n in
itial
pre
load
based o
n n
om
inal
pre
load
Eq.
accord
ing t
o D
IN E
N 1
090-2
Mean v
alu
eF
p,C
[k
N]
Mean v
alu
e
88
ui
FS
iF
bi,o
,in
im
ean F
bi,in
iF
bi,i,in
i
i,in
i
i
i,
no
m
i,a
ct
Fb
i,o
,act
mean F
bi,a
ct
Fb
i,i,a
ct
t
[mm
][k
N]
[kN
][k
N]
[kN
][–
][–
][–
][k
N]
[kN
][k
N]
[min
]
10.1
50
104.2
88.6
88.4
88.2
0.2
90.3
00.3
086.2
85.8
85.3
7.6
20.1
50
102.5
87.2
87.2
87.2
0.2
90.2
90.3
084.7
84.3
84.0
7.4
30.1
50
106.6
87.6
87.8
88.0
0.3
00.3
00.3
185.4
85.2
85.0
8.3
40.1
50
95.1
88.9
88.4
87.9
0.2
70.2
70.2
887.1
86.0
85.0
7.2
50.1
50
105.1
88.5
88.8
89.1
0.3
00.3
00.3
186.1
86.1
86.1
7.7
60.1
50
95.8
88.7
89.1
89.6
0.2
70.2
70.2
886.4
86.6
86.7
6.9
70.1
50
101.0
88.6
88.6
88.5
0.2
90.2
90.2
986.3
86.1
85.9
7.0
80.1
50
112.4
87.8
88.2
88.6
0.3
20.3
20.3
385.2
85.1
85.1
7.9
n =
8N
um
ber
of te
sts
max
Maxim
um
112.4
0.3
20.3
20.3
3
min
Min
imum
95.1
0.2
70.2
70.2
8
mean
Mean v
alu
e
FS
m |
m102.8
0.2
90.2
90.3
0E
q.
(2),
Eq.
(4)
RS
pre
ad
17.3
0.0
50.0
50.0
5R
= m
ax
– m
in
sS
tandard
devi
ation s
Fs
5.7
0.0
17
0.0
16
0.0
18
Eq.
(3),
Eq.
(5)
VC
oeffi
cie
nt
of va
riation
5.5
%5.8
%5.5
%6.0
%V
= s
/ m
ean
0,9
FS
m92.5
Load leve
l fo
r th
e c
reep t
est
D (
5 m
in t
o 3
h):
–
–90.1
89.4
88.6
––
–88.2
87.3
86.4
4.8
D (
5 m
in t
o 3
h):
–
–88.0
88.7
89.4
––
–86.4
86.6
86.8
5.0
Statistics
(4 specimens,
8 test results)
Creep test
6.2
_U
DE
_A
_S
B_9-1
0
9C
ree
p t
est
fa
ile
d
Slip
du
rin
g th
e c
ree
p te
st
> 0
,00
2 m
m (
5 m
in to
3 h
)
15.1
1.1
6 1
7:3
0
6.2
_U
DE
_A
_S
B_7-8
15.1
1.1
6 1
5:3
0
10
Static test
6.2
_U
DE
_A
_S
B_1-2
14.1
1.1
6 1
7:5
0
6.2
_U
DE
_A
_S
B_3-4
15.1
1.1
6 1
2:3
0
6.2
_U
DE
_A
_S
B_5-6
15.1
1.1
6 1
4:0
0
Oute
r
bolt
Inner
bolt
Oute
r
bolt
Inner
bolt
Sp
ecim
en
sP
relo
ad
Sli
p f
acto
rP
relo
ad
Te
st
du
rati
on
at
sta
rt o
f te
st (
init
ial
pre
loa
d)
based o
n p
relo
ad
at slip
at
slip
Sta
rt
of th
e t
est
Nom
inal pre
load leve
l88 k
N
=
Fp
,C
Pre
load m
easuring m
eth
od
Load c
ell
(h =
40 m
m),
measure
d c
ontinuously
, cla
mpin
g length
t
= 7
5 m
m
Test
speed
0.6
mm
/min
Tim
e b
etw
een a
pplic
ation o
f coating a
nd t
esting
–
Specim
en s
ize
Sta
ndard
specim
ens M
16
(EN
1090-2
, F
igure
G.1
b)
Bolt c
lass,
bolt t
ype
Bolt:
BU
MA
X 8
8
(EN
IS
O 4
017 –
M16 x
100)
- N
ut:
BU
MA
X 8
8 (
EN
IS
O 4
032)
- W
asher:
HV
200 (
EN
IS
O 7
089)
Curing p
rocedure
–
Dura
tion o
f curing
–
Mean c
oating t
hic
kness
–
Min
imum
coating t
hic
kness
–
Surface r
oughness (
befo
re c
oating)
38 µ
m
Test
rep
ort
Technical characteristics of the test
Teste
d a
ccord
ing t
oD
IN E
N 1
090-2
:2011-1
0 –
Annex G
Test
date
14.1
1.2
016 -
15.1
1.2
016
Test
perform
ed b
yN
. A
fzali,
M.S
c.
Pro
ject
No.
410410007 2
0003
Coating c
om
positio
n–
Surface t
reatm
ent
Shot
bla
ste
d (
usin
g C
hro
nital S
40 p
art
icle
s o
f 40 µ
m p
art
icle
siz
e)
Maxim
um
coating t
hic
kness
–
Quota
tion N
o.
RF
SR
-CT-2
014-0
0024 (
SIR
OC
O)
Ste
el gra
de
Auste
nitic
Sta
inle
ss S
teel (1
.4404)
Coating
–
Surface r
oughness (
after
coating)
–
INS
TIT
UT
FÜ
R
Me
tall-u
nd
Le
ich
tbau
Un
iv.-
Pro
f.D
r.-I
ng
.h
ab
il.N
ata
lie
Str
an
gh
ön
er
Un
ive
rsitä
tss
tr. 1
54
51
41
Es
se
nF
on
: +
49
(0
)20
1 1
83
-27
57
Fa
x: +
49
(0
)20
1 1
83
-27
10
E-M
ail:
iml@
un
i-d
ue.d
ew
ww
.un
i-d
ue
.de
/im
l
INS
TIT
UT
FÜ
R
Me
tall-u
nd
Le
ich
tbau
Un
iv.-
Pro
f.D
r.-I
ng
.h
ab
il.N
ata
lie
Str
an
gh
ön
er
Un
ive
rsitä
tss
tr. 1
54
51
41
Es
se
nF
on
: +
49
(0
)20
1 1
83
-27
57
Fa
x: +
49
(0
)20
1 1
83
-27
10
E-M
ail:
iml@
un
i-d
ue.d
ew
ww
.un
i-d
ue
.de
/im
l
INS
TIT
UT
FÜ
R
Me
tall-u
nd
Le
ich
tbau
Un
iv.-
Pro
f.D
r.-I
ng
.h
ab
il.N
ata
lie
Str
an
gh
ön
er
Un
ive
rsitä
tss
tr. 1
54
51
41
Es
se
nF
on
: +
49
(0
)20
1 1
83
-27
57
Fa
x: +
49
(0
)20
1 1
83
-27
10
E-M
ail:
iml@
un
i-d
ue.d
ew
ww
.un
i-d
ue
.de
/im
lU
niv
ers
itä
tss
tr. 1
54
51
41
Es
se
nF
on
: +
49
(0
)20
1 1
83
-27
57
Fa
x: +
49
(0
)20
1 1
83
-27
10
E-M
ail:
iml@
un
i-d
ue.d
ew
ww
.un
i-d
ue
.de
/im
l
INS
TIT
UT
EFO
R
Me
talan
dL
igh
twe
igh
tS
tru
ctu
res
Un
iv.-
Pro
f.D
r.-I
ng
.h
ab
il.N
ata
lie
Str
an
gh
ön
er

Project No.: 410410007-20003 | Report No.: 2018-06
Slip factors for typical stainless steel surface finishes and new types of coatings for stainless steel
49 23.03.2018
Table C3 Test protocol A_GB test series
20
.11
.20
16
Sli
pS
lip
lo
ad
Co
mm
en
tD
ate
of
test
mark
pla
te ID
's(a
ve
rag
e a
t C
BG
)based o
n in
itial
pre
load
based o
n n
om
inal
pre
load
Eq.
accord
ing t
o D
IN E
N 1
090-2
Mean v
alu
eF
p,C
[k
N]
Mean v
alu
e
88
ui
FS
iF
bi,o,ini
mean F
bi,in
iF
bi,i,in
i
i,in
i
i
i,
no
m
i,act
Fbi,o,a
ct
mean F
bi,act
Fbi,i,act
t
[mm
][k
N]
[kN
][k
N]
[kN
][–
][–
][–
][k
N]
[kN
][k
N]
[min
]
10.1
50
193.5
89.4
89.7
90.1
0.5
40.5
50.5
884.1
84.0
83.9
11.9
20.1
50
193.0
89.2
89.2
89.2
0.5
40.5
50.5
883.5
82.8
82.1
11.9
30.1
41
199.4
88.0
88.4
88.7
0.5
60.5
70.6
181.2
81.4
81.5
14.4
40.1
50
191.5
88.2
88.1
88.0
0.5
40.5
40.5
982.3
81.4
80.4
10.9
70.1
50
197.0
88.9
88.8
88.6
0.5
60.5
60.6
083.3
82.4
81.5
15.5
80.1
50
186.1
89.6
88.9
88.2
0.5
20.5
30.5
684.5
82.8
81.1
11.1
90.1
50
223.6
89.1
89.1
89.1
0.6
30.6
40.6
982.5
81.5
80.6
15.6
10
0.1
50
200.5
89.2
88.6
88.0
0.5
70.5
70.6
283.0
81.4
79.7
11.4
n =
8N
um
ber
of te
sts
max
Maxim
um
223.6
0.6
30.6
40.6
9
min
Min
imum
186.1
0.5
20.5
30.5
6
mean
Mean v
alu
e
FS
m |
m198.1
0.5
60.5
60.6
0E
q.
(2),
Eq.
(4)
RS
pre
ad
37.4
0.1
00.1
10.1
2R
= m
ax
– m
in
sS
tandard
devi
ation s
Fs
11.3
0.0
31
0.0
32
0.0
38
Eq.
(3),
Eq.
(5)
VC
oeffi
cie
nt
of va
riation
5.7
%5.6
%5.7
%6.3
%V
= s
/ m
ean
0,9
FS
m178.3
Load leve
l fo
r th
e c
reep t
est
D (
5 m
in t
o 3
h):
0,0
006
0.1
50
183.7
90.0
89.3
88.7
0.5
10.5
20.5
683.6
82.4
81.3
229.1
D (
5 m
in t
o 3
h):
0,0
004
0.1
33
183.7
88.6
89.1
89.7
0.5
20.5
20.5
682.6
82.1
81.6
229.1
n =
10
Num
ber
of te
sts
max
Maxim
um
223.6
0.6
30.6
40.6
9
min
Min
imum
183.7
0.5
10.5
20.5
6
mean
Mean v
alu
e
FS
m |
m195.2
0.5
50.5
50.5
9E
q.
(2),
Eq.
(4)
RS
pre
ad
39.9
0.1
10.1
10.1
3R
= m
ax
– m
in
sS
tandard
devi
ation s
Fs
11.7
0.0
33
0.0
33
0.0
38
Eq.
(3),
Eq.
(5)
VC
oeffi
cie
nt
of va
riation
6.0
%6.0
%6.0
%6.5
%V
= s
/ m
ean 8
%
0,9
FS
m175.7
k
0.4
80.4
90.5
1E
q.
(6)
Test
rep
ort
Technical characteristics of the test
Teste
d a
ccord
ing t
oD
IN E
N 1
090-2
:2011-1
0 –
Annex G
Test
date
16.1
1.2
016
Test
perform
ed b
yN
. A
fzali,
M.S
c.
Pro
ject
No.
410410007 2
0003
Coating c
om
positio
n–
Surface t
reatm
ent
Grit
bla
ste
d (
usin
g G
ritt
al G
M30 p
art
icle
s o
f 50 µ
m p
art
icle
siz
e)
Maxim
um
coating t
hic
kness
–
Quota
tion N
o.
RF
SR
-CT-2
014-0
0024 (
SIR
OC
O)
Ste
el gra
de
Auste
nitic
Sta
inle
ss S
teel (1
.4404)
Coating
–
Surface r
oughness (
after
coating)
–
Curing p
rocedure
–
Dura
tion o
f curing
–
Mean c
oating t
hic
kness
–
Min
imum
coating t
hic
kness
–
Surface r
oughness (
befo
re c
oating)
45 µ
m
Nom
inal pre
load leve
l88 k
N
=
Fp,C
Pre
load m
easuring m
eth
od
Load c
ell
(h =
40 m
m),
measure
d c
ontinuously
, cla
mpin
g length
t
= 7
5 m
m
Test
speed
0.6
mm
/min
Tim
e b
etw
een a
pplic
ation o
f coating a
nd t
esting
–
Specim
en s
ize
Sta
ndard
specim
ens M
16
(EN
1090-2
, F
igure
G.1
b)
Bolt c
lass,
bolt t
ype
Bolt:
BU
MA
X 8
8
(EN
IS
O 4
017 –
M16 x
100)
- N
ut:
BU
MA
X 8
8 (
EN
IS
O 4
032)
- W
asher:
HV
200 (
EN
IS
O 7
089)
Oute
r
bolt
Inner
bolt
Oute
r
bolt
Inner
bolt
Sp
ecim
en
sP
relo
ad
Sli
p f
acto
rP
relo
ad
Te
st
du
rati
on
at
sta
rt o
f te
st (
init
ial
pre
loa
d)
based o
n p
relo
ad
at slip
at
slip
Sta
rt
of th
e t
est
Static test
6.2
_U
DE
_A
_G
B_1-2
16.1
1.1
6 9
:55
6.2
_U
DE
_A
_G
B_3-4
16.1
1.1
6 1
1:1
5
6.2
_U
DE
_A
_G
B_7-8
16.1
1.1
6 1
4:3
5
Statistics
(4 specimens,
8 test results)
Creep test
6.2
_U
DE
_A
_G
B_13-1
4
13
Cre
ep
te
st i
s p
ass
ed
Slip
du
rin
g th
e c
ree
p te
st
< 0
,00
2 m
m (
5 m
in to
3 h
)
16.1
1.1
6 1
8:0
0
6.2
_U
DE
_A
_G
B_9-1
016.1
1.1
6 1
6:1
0
14
Statistics
(5 specimens,
10 test results)
Chara
cte
ristic v
alu
e o
f th
e s
lip facto
r
INS
TIT
UT
FÜ
R
Me
tall-u
nd
Le
ich
tbau
Un
iv.-
Pro
f.D
r.-I
ng
.h
ab
il.N
ata
lie
Str
an
gh
ön
er
Un
ive
rsitä
tss
tr. 1
54
51
41
Es
se
nF
on
: +
49
(0
)20
1 1
83
-27
57
Fa
x: +
49
(0
)20
1 1
83
-27
10
E-M
ail:
iml@
un
i-d
ue.d
ew
ww
.un
i-d
ue
.de
/im
l
INS
TIT
UT
FÜ
R
Me
tall-u
nd
Le
ich
tbau
Un
iv.-
Pro
f.D
r.-I
ng
.h
ab
il.N
ata
lie
Str
an
gh
ön
er
Un
ive
rsitä
tss
tr. 1
54
51
41
Es
se
nF
on
: +
49
(0
)20
1 1
83
-27
57
Fa
x: +
49
(0
)20
1 1
83
-27
10
E-M
ail:
iml@
un
i-d
ue.d
ew
ww
.un
i-d
ue
.de
/im
l
INS
TIT
UT
FÜ
R
Me
tall-u
nd
Le
ich
tbau
Un
iv.-
Pro
f.D
r.-I
ng
.h
ab
il.N
ata
lie
Str
an
gh
ön
er
Un
ive
rsitä
tss
tr. 1
54
51
41
Es
se
nF
on
: +
49
(0
)20
1 1
83
-27
57
Fa
x: +
49
(0
)20
1 1
83
-27
10
E-M
ail:
iml@
un
i-d
ue.d
ew
ww
.un
i-d
ue
.de
/im
lU
niv
ers
itä
tss
tr. 1
54
51
41
Es
se
nF
on
: +
49
(0
)20
1 1
83
-27
57
Fa
x: +
49
(0
)20
1 1
83
-27
10
E-M
ail:
iml@
un
i-d
ue.d
ew
ww
.un
i-d
ue
.de
/im
l
INS
TIT
UT
EFO
R
Me
talan
dL
igh
twe
igh
tS
tru
ctu
res
Un
iv.-
Pro
f.D
r.-I
ng
.h
ab
il.N
ata
lie
Str
an
gh
ön
er
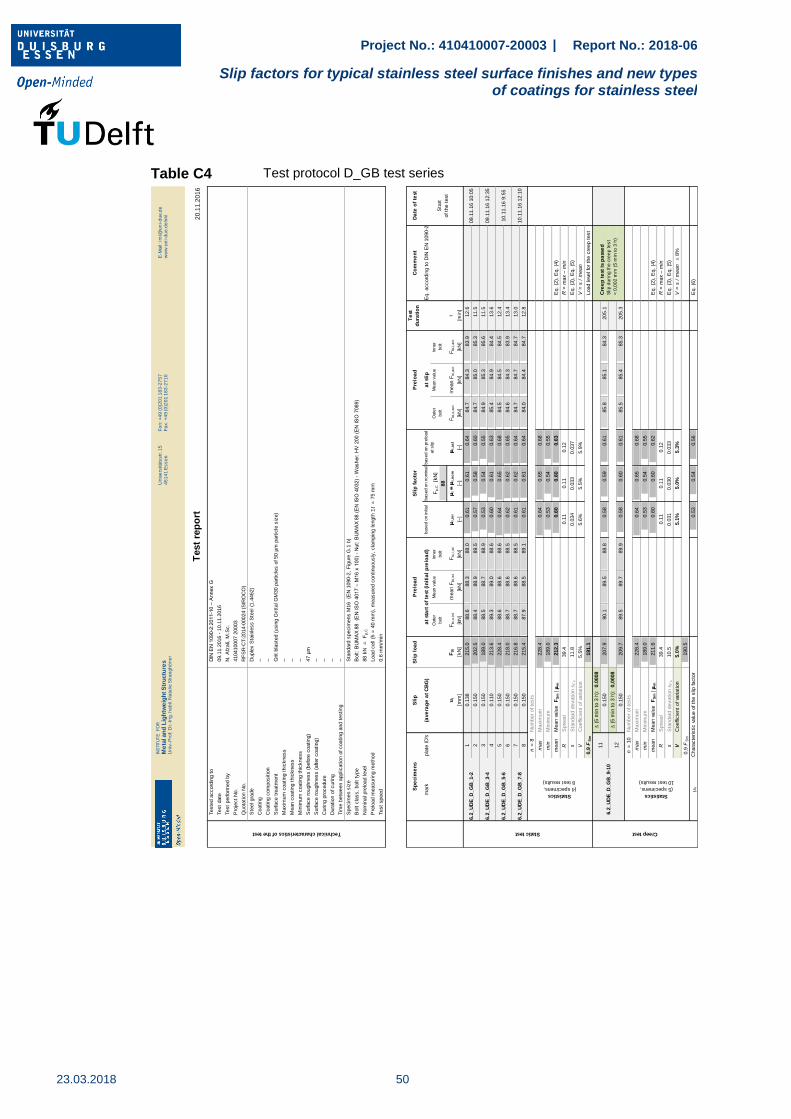
Project No.: 410410007-20003 | Report No.: 2018-06
Slip factors for typical stainless steel surface finishes and new types of coatings for stainless steel
23.03.2018
50
Table C4 Test protocol D_GB test series
20
.11
.20
16
Sli
pS
lip
lo
ad
Co
mm
en
tD
ate
of
test
mark
pla
te ID
's(a
ve
rag
e a
t C
BG
)based o
n in
itial
pre
load
based o
n n
om
inal
pre
load
Eq.
accord
ing t
o D
IN E
N 1
090-2
Mean v
alu
eF
p,C
[k
N]
Mean v
alu
e
88
ui
FS
iF
bi,o
,in
im
ean F
bi,in
iF
bi,i,in
i
i,in
i
i
i,
no
m
i,a
ct
Fb
i,o
,act
mean F
bi,a
ct
Fb
i,i,a
ct
t
[mm
][k
N]
[kN
][k
N]
[kN
][–
][–
][–
][k
N]
[kN
][k
N]
[min
]
10.1
38
215.0
88.6
88.3
88.0
0.6
10.6
10.6
484.7
84.3
83.9
12.6
20.1
50
202.5
88.4
88.9
89.5
0.5
70.5
80.6
084.7
85.0
85.3
11.5
30.1
50
189.0
88.5
88.7
88.9
0.5
30.5
40.5
584.9
85.3
85.6
11.5
40.1
10
213.6
89.3
89.0
88.6
0.6
00.6
10.6
385.4
84.9
84.4
13.6
50.1
50
228.4
88.6
88.6
88.6
0.6
40.6
50.6
884.5
84.5
84.5
12.4
60.1
50
218.0
88.7
88.6
88.5
0.6
20.6
20.6
584.6
84.3
83.9
13.4
70.1
50
216.8
88.7
88.6
88.5
0.6
10.6
20.6
484.7
84.7
84.7
13.0
80.1
50
215.4
87.9
88.5
89.1
0.6
10.6
10.6
484.0
84.4
84.7
12.8
n =
8N
um
ber
of te
sts
max
Maxim
um
228.4
0.6
40.6
50.6
8
min
Min
imum
189.0
0.5
30.5
40.5
5
mean
Mean v
alu
e
FS
m |
m212.3
0.6
00.6
00.6
3E
q.
(2),
Eq.
(4)
RS
pre
ad
39.4
0.1
10.1
10.1
2R
= m
ax
– m
in
sS
tandard
devi
ation s
Fs
11.8
0.0
34
0.0
33
0.0
37
Eq.
(3),
Eq.
(5)
VC
oeffi
cie
nt
of va
riation
5.5
%5.6
%5.5
%5.9
%V
= s
/ m
ean
0,9
FS
m191.1
Load leve
l fo
r th
e c
reep t
est
D (
5 m
in t
o 3
h):
0.0
008
0.1
50
207.9
90.1
89.5
88.8
0.5
80.5
90.6
185.8
85.1
84.3
205.1
D (
5 m
in t
o 3
h):
0,0
008
0.1
50
209.7
89.5
89.7
89.9
0.5
80.6
00.6
185.5
85.4
85.3
205.3
n =
10
Num
ber
of te
sts
max
Maxim
um
228.4
0.6
40.6
50.6
8
min
Min
imum
189.0
0.5
30.5
40.5
5
mean
Mean v
alu
e
FS
m |
m211.6
0.6
00.6
00.6
2E
q.
(2),
Eq.
(4)
RS
pre
ad
39.4
0.1
10.1
10.1
2R
= m
ax
– m
in
sS
tandard
devi
ation s
Fs
10.5
0.0
31
0.0
30
0.0
33
Eq.
(3),
Eq.
(5)
VC
oeffi
cie
nt
of va
riation
5.0
%5.1
%5.0
%5.3
%V
= s
/ m
ean 8
%
0,9
FS
m190.5
k
0.5
30.5
40.5
6E
q.
(6)
Test
rep
ort
Technical characteristics of the test
Teste
d a
ccord
ing t
oD
IN E
N 1
090-2
:2011-1
0 –
Annex G
Test
date
09.1
1.2
016 -
10.1
1.2
016
Test
perform
ed b
yN
. A
fzali,
M.S
c.
Pro
ject
No.
410410007 2
0003
Coating c
om
positio
n–
Surface t
reatm
ent
Grit
bla
ste
d (
usin
g G
ritt
al G
M30 p
art
icle
s o
f 50 µ
m p
art
icle
siz
e)
Maxim
um
coating t
hic
kness
–
Quota
tion N
o.
RF
SR
-CT-2
014-0
0024 (
SIR
OC
O)
Ste
el gra
de
Duple
x S
tain
less S
teel (1
.4462)
Coating
–
Surface r
oughness (
after
coating)
–
Curing p
rocedure
–
Dura
tion o
f curing
–
Mean c
oating t
hic
kness
–
Min
imum
coating t
hic
kness
–
Surface r
oughness (
befo
re c
oating)
47 µ
m
Nom
inal pre
load leve
l88 k
N
=
Fp
,C
Pre
load m
easuring m
eth
od
Load c
ell
(h =
40 m
m),
measure
d c
ontinuously
, cla
mpin
g length
t
= 7
5 m
m
Test
speed
0.6
mm
/min
Tim
e b
etw
een a
pplic
ation o
f coating a
nd t
esting
–
Specim
en s
ize
Sta
ndard
specim
ens M
16
(EN
1090-2
, F
igure
G.1
b)
Bolt c
lass,
bolt t
ype
Bolt:
BU
MA
X 8
8
(EN
IS
O 4
017 –
M16 x
100)
- N
ut:
BU
MA
X 8
8 (
EN
IS
O 4
032)
- W
asher:
HV
200 (
EN
IS
O 7
089)
Oute
r
bolt
Inner
bolt
Oute
r
bolt
Inner
bolt
Sp
ecim
en
sP
relo
ad
Sli
p f
acto
rP
relo
ad
Te
st
du
rati
on
at
sta
rt o
f te
st (
init
ial
pre
loa
d)
based o
n p
relo
ad
at slip
at
slip
Sta
rt
of th
e t
est
Static test
6.2
_U
DE
_D
_G
B_1-2
09.1
1.1
6 1
0:0
5
6.2
_U
DE
_D
_G
B_3-4
09.1
1.1
6 1
2:3
5
6.2
_U
DE
_D
_G
B_5-6
10.1
1.1
6 9
:55
Statistics
(4 specimens,
8 test results)
Creep test
6.2
_U
DE
_D
_G
B_9-1
0
11
Cre
ep
te
st i
s p
ass
ed
Slip
du
rin
g th
e c
ree
p te
st
< 0
,00
2 m
m (
5 m
in to
3 h
)
6.2
_U
DE
_D
_G
B_7-8
10.1
1.1
6 1
2:1
0
12
Statistics
(5 specimens,
10 test results)
Chara
cte
ristic v
alu
e o
f th
e s
lip facto
r
INS
TIT
UT
FÜ
R
Me
tall-u
nd
Le
ich
tbau
Un
iv.-
Pro
f.D
r.-I
ng
.h
ab
il.N
ata
lie
Str
an
gh
ön
er
Un
ive
rsitä
tss
tr. 1
54
51
41
Es
se
nF
on
: +
49
(0
)20
1 1
83
-27
57
Fa
x: +
49
(0
)20
1 1
83
-27
10
E-M
ail:
iml@
un
i-d
ue.d
ew
ww
.un
i-d
ue
.de
/im
l
INS
TIT
UT
FÜ
R
Me
tall-u
nd
Le
ich
tbau
Un
iv.-
Pro
f.D
r.-I
ng
.h
ab
il.N
ata
lie
Str
an
gh
ön
er
Un
ive
rsitä
tss
tr. 1
54
51
41
Es
se
nF
on
: +
49
(0
)20
1 1
83
-27
57
Fa
x: +
49
(0
)20
1 1
83
-27
10
E-M
ail:
iml@
un
i-d
ue.d
ew
ww
.un
i-d
ue
.de
/im
l
INS
TIT
UT
FÜ
R
Me
tall-u
nd
Le
ich
tbau
Un
iv.-
Pro
f.D
r.-I
ng
.h
ab
il.N
ata
lie
Str
an
gh
ön
er
Un
ive
rsitä
tss
tr. 1
54
51
41
Es
se
nF
on
: +
49
(0
)20
1 1
83
-27
57
Fa
x: +
49
(0
)20
1 1
83
-27
10
E-M
ail:
iml@
un
i-d
ue.d
ew
ww
.un
i-d
ue
.de
/im
lU
niv
ers
itä
tss
tr. 1
54
51
41
Es
se
nF
on
: +
49
(0
)20
1 1
83
-27
57
Fa
x: +
49
(0
)20
1 1
83
-27
10
E-M
ail:
iml@
un
i-d
ue.d
ew
ww
.un
i-d
ue
.de
/im
l
INS
TIT
UT
EFO
R
Me
talan
dL
igh
twe
igh
tS
tru
ctu
res
Un
iv.-
Pro
f.D
r.-I
ng
.h
ab
il.N
ata
lie
Str
an
gh
ön
er
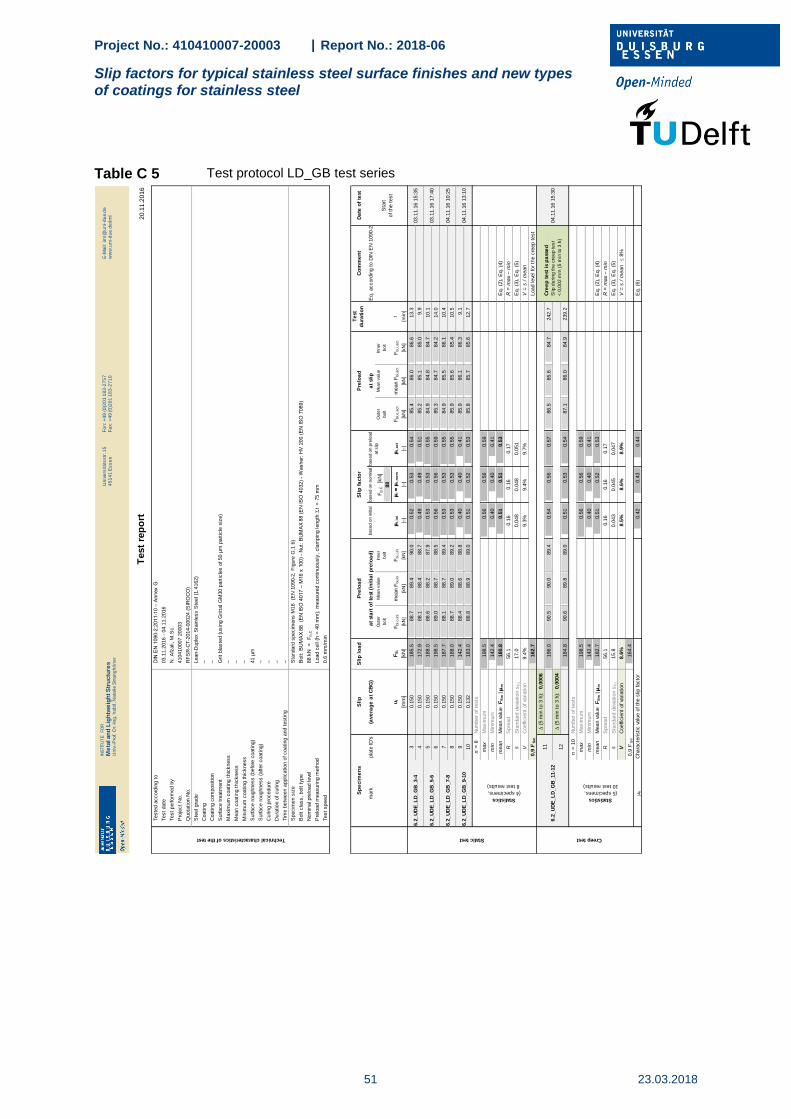
Project No.: 410410007-20003 | Report No.: 2018-06
Slip factors for typical stainless steel surface finishes and new types of coatings for stainless steel
51 23.03.2018
Table C 5 Test protocol LD_GB test series
20
.11
.20
16
Sli
pS
lip
lo
ad
Co
mm
en
tD
ate
of
test
mark
pla
te ID
's(a
ve
rag
e a
t C
BG
)based o
n in
itial
pre
load
based o
n n
om
inal
pre
load
Eq.
accord
ing t
o D
IN E
N 1
090-2
Mean v
alu
eF
p,C
[k
N]
Mean v
alu
e
88
ui
FS
iF
bi,o
,in
im
ean F
bi,in
iF
bi,i,in
i
i,in
i
i
i,
no
m
i,a
ct
Fb
i,o
,act
mean F
bi,a
ct
Fb
i,i,a
ct
t
[mm
][k
N]
[kN
][k
N]
[kN
][–
][–
][–
][k
N]
[kN
][k
N]
[min
]
30.1
50
185.5
88.7
89.4
90.0
0.5
20.5
30.5
485.4
86.0
86.6
13.3
40.1
50
172.9
88.1
88.4
88.7
0.4
90.4
90.5
185.2
85.1
85.0
9.9
50.1
50
188.0
88.6
88.2
87.9
0.5
30.5
30.5
584.9
84.8
84.7
10.1
60.1
50
198.5
89.0
88.7
88.5
0.5
60.5
60.5
985.3
84.7
84.2
14.0
70.1
50
187.7
88.1
88.7
89.4
0.5
30.5
30.5
584.9
85.5
86.1
10.4
80.1
50
188.0
88.7
89.0
89.2
0.5
30.5
30.5
585.9
85.6
85.4
10.5
90.1
50
142.4
88.4
88.6
88.8
0.4
00.4
00.4
185.9
86.1
86.3
9.1
10
0.1
32
183.0
88.8
88.9
89.0
0.5
10.5
20.5
385.8
85.7
85.6
12.7
n =
8N
um
ber
of te
sts
max
Maxim
um
198.5
0.5
60.5
60.5
9
min
Min
imum
142.4
0.4
00.4
00.4
1
mean
Mean v
alu
e
FS
m |
m180.8
0.5
10.5
10.5
3E
q.
(2),
Eq.
(4)
RS
pre
ad
56.1
0.1
60.1
60.1
7R
= m
ax
– m
in
sS
tandard
devi
ation s
Fs
17.0
0.0
48
0.0
48
0.0
51
Eq.
(3),
Eq.
(5)
VC
oeffi
cie
nt
of va
riation
9.4
%9.3
%9.4
%9.7
%V
= s
/ m
ean
0,9
FS
m162.7
Load leve
l fo
r th
e c
reep t
est
D (
5 m
in t
o 3
h):
0,0
006
196.0
90.5
90.0
89.4
0.5
40.5
60.5
786.5
85.6
84.7
242.7
D (
5 m
in t
o 3
h):
0,0
004
184.8
90.6
89.8
89.0
0.5
10.5
30.5
487.1
86.0
84.9
239.2
n =
10
Num
ber
of te
sts
max
Maxim
um
198.5
0.5
60.5
60.5
9
min
Min
imum
142.4
0.4
00.4
00.4
1
mean
Mean v
alu
e
FS
m |
m182.7
0.5
10.5
20.5
3E
q.
(2),
Eq.
(4)
RS
pre
ad
56.1
0.1
60.1
60.1
7R
= m
ax
– m
in
sS
tandard
devi
ation s
Fs
15.8
0.0
43
0.0
45
0.0
47
Eq.
(3),
Eq.
(5)
VC
oeffi
cie
nt
of va
riation
8.6
%8.5
%8.6
%8.9
%V
= s
/ m
ean 8
%
0,9
FS
m164.4
k
0.4
20.4
30.4
4E
q.
(6)
Test
rep
ort
Technical characteristics of the test
Teste
d a
ccord
ing t
oD
IN E
N 1
090-2
:2011-1
0 –
Annex G
Test
date
03.1
1.2
016 -
04.1
1.2
016
Test
perform
ed b
yN
. A
fzali,
M.S
c.
Pro
ject
No.
410410007 2
0003
Coating c
om
positio
n–
Surface t
reatm
ent
Grit
bla
ste
d (
usin
g G
ritt
al G
M30 p
art
icle
s o
f 50 µ
m p
art
icle
siz
e)
Maxim
um
coating t
hic
kness
–
Quota
tion N
o.
RF
SR
-CT-2
014-0
0024 (
SIR
OC
O)
Ste
el gra
de
Lean-D
uple
x S
tain
less S
teel (1
.4162)
Coating
–
Surface r
oughness (
after
coating)
–
Curing p
rocedure
–
Dura
tion o
f curing
–
Mean c
oating t
hic
kness
–
Min
imum
coating t
hic
kness
–
Surface r
oughness (
befo
re c
oating)
41 µ
m
Nom
inal pre
load leve
l88 k
N
=
Fp
,C
Pre
load m
easuring m
eth
od
Load c
ell
(h =
40 m
m),
measure
d c
ontinuously
, cla
mpin
g length
t
= 7
5 m
m
Test
speed
0.6
mm
/min
Tim
e b
etw
een a
pplic
ation o
f coating a
nd t
esting
–
Specim
en s
ize
Sta
ndard
specim
ens M
16
(EN
1090-2
, F
igure
G.1
b)
Bolt c
lass,
bolt t
ype
Bolt:
BU
MA
X 8
8
(EN
IS
O 4
017 –
M16 x
100)
- N
ut:
BU
MA
X 8
8 (
EN
IS
O 4
032)
- W
asher:
HV
200 (
EN
IS
O 7
089)
Oute
r
bolt
Inner
bolt
Oute
r
bolt
Inner
bolt
Sp
ecim
en
sP
relo
ad
Sli
p f
acto
rP
relo
ad
Te
st
du
rati
on
at
sta
rt o
f te
st (
init
ial
pre
loa
d)
based o
n p
relo
ad
at slip
at
slip
Sta
rt
of th
e t
est
Static test
6.2
_U
DE
_L
D_G
B_3-4
03.1
1.1
6 1
5:3
5
6.2
_U
DE
_L
D_G
B_5-6
03.1
1.1
6 1
7:4
0
6.2
_U
DE
_L
D_G
B_7-8
04.1
1.1
6 1
0:2
5
Statistics
(4 specimens,
8 test results)
Creep test
6.2
_U
DE
_L
D_G
B_11-1
2
11
Cre
ep
te
st i
s p
ass
ed
Slip
du
rin
g th
e c
ree
p te
st
< 0
,00
2 m
m (
5 m
in to
3 h
)
04.1
1.1
6 1
5:3
0
6.2
_U
DE
_L
D_G
B_9-1
004.1
1.1
6 1
3:1
0
12
Statistics
(5 specimens,
10 test results)
Chara
cte
ristic v
alu
e o
f th
e s
lip facto
r
INS
TIT
UT
FÜ
R
Me
tall-u
nd
Le
ich
tbau
Un
iv.-
Pro
f.D
r.-I
ng
.h
ab
il.N
ata
lie
Str
an
gh
ön
er
Un
ive
rsitä
tss
tr. 1
54
51
41
Es
se
nF
on
: +
49
(0
)20
1 1
83
-27
57
Fa
x: +
49
(0
)20
1 1
83
-27
10
E-M
ail:
iml@
un
i-d
ue.d
ew
ww
.un
i-d
ue
.de
/im
l
INS
TIT
UT
FÜ
R
Me
tall-u
nd
Le
ich
tbau
Un
iv.-
Pro
f.D
r.-I
ng
.h
ab
il.N
ata
lie
Str
an
gh
ön
er
Un
ive
rsitä
tss
tr. 1
54
51
41
Es
se
nF
on
: +
49
(0
)20
1 1
83
-27
57
Fa
x: +
49
(0
)20
1 1
83
-27
10
E-M
ail:
iml@
un
i-d
ue.d
ew
ww
.un
i-d
ue
.de
/im
l
INS
TIT
UT
FÜ
R
Me
tall-u
nd
Le
ich
tbau
Un
iv.-
Pro
f.D
r.-I
ng
.h
ab
il.N
ata
lie
Str
an
gh
ön
er
Un
ive
rsitä
tss
tr. 1
54
51
41
Es
se
nF
on
: +
49
(0
)20
1 1
83
-27
57
Fa
x: +
49
(0
)20
1 1
83
-27
10
E-M
ail:
iml@
un
i-d
ue.d
ew
ww
.un
i-d
ue
.de
/im
lU
niv
ers
itä
tss
tr. 1
54
51
41
Es
se
nF
on
: +
49
(0
)20
1 1
83
-27
57
Fa
x: +
49
(0
)20
1 1
83
-27
10
E-M
ail:
iml@
un
i-d
ue.d
ew
ww
.un
i-d
ue
.de
/im
l
INS
TIT
UT
EFO
R
Me
talan
dL
igh
twe
igh
tS
tru
ctu
res
Un
iv.-
Pro
f.D
r.-I
ng
.h
ab
il.N
ata
lie
Str
an
gh
ön
er
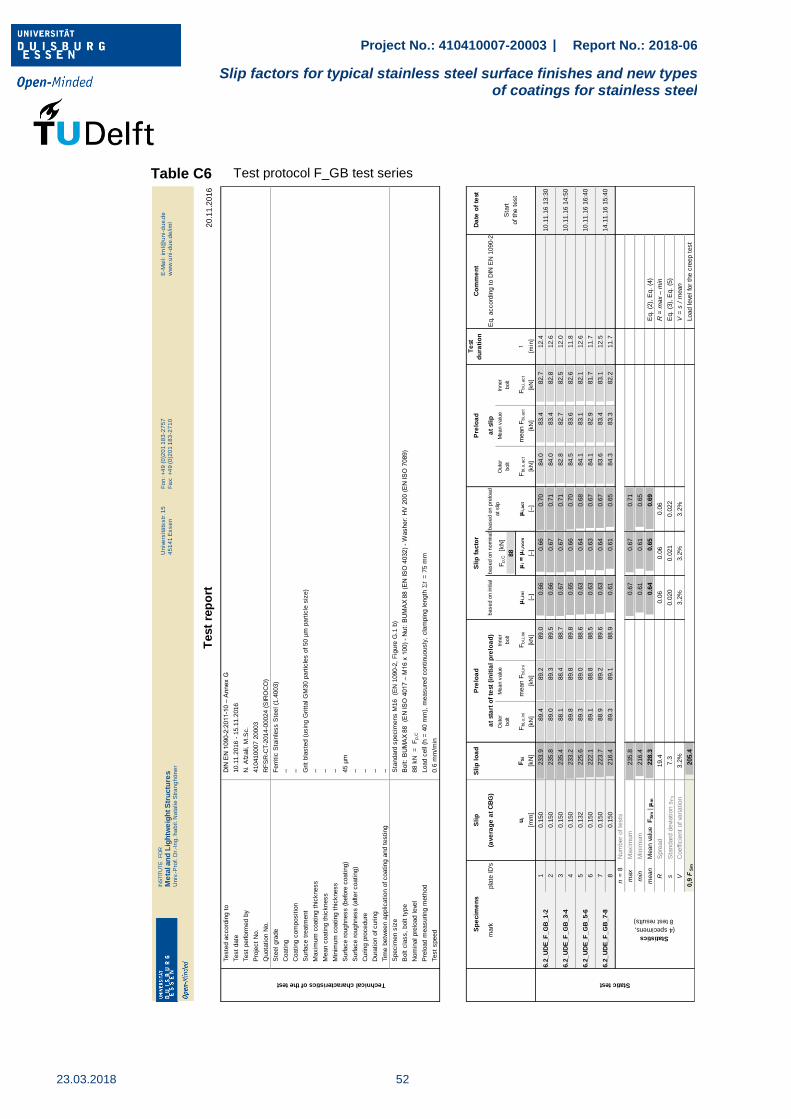
Project No.: 410410007-20003 | Report No.: 2018-06
Slip factors for typical stainless steel surface finishes and new types of coatings for stainless steel
23.03.2018
52
Table C6 Test protocol F_GB test series
20
.11
.20
16
Sli
pS
lip
lo
ad
Co
mm
en
tD
ate
of
test
mark
pla
te ID
's(a
ve
rag
e a
t C
BG
)based o
n in
itial
pre
load
based o
n n
om
inal
pre
load
Eq.
accord
ing t
o D
IN E
N 1
090-2
Mean v
alu
eF
p,C
[k
N]
Mean v
alu
e
88
ui
FS
iF
bi,o,ini
mean F
bi,in
iF
bi,i,in
i
i,in
i
i
i,
no
m
i,act
Fbi,o,a
ct
mean F
bi,act
Fbi,i,act
t
[mm
][k
N]
[kN
][k
N]
[kN
][–
][–
][–
][k
N]
[kN
][k
N]
[min
]
10.1
50
233.9
89.4
89.2
89.0
0.6
60.6
60.7
084.0
83.4
82.7
12.4
20.1
50
235.8
89.0
89.3
89.5
0.6
60.6
70.7
184.0
83.4
82.8
12.6
30.1
50
235.4
88.1
88.4
88.7
0.6
70.6
70.7
182.8
82.7
82.5
12.0
40.1
50
233.2
89.8
89.8
89.8
0.6
50.6
60.7
084.5
83.6
82.6
11.8
50.1
32
225.6
89.3
89.0
88.6
0.6
30.6
40.6
884.1
83.1
82.1
12.6
60.1
50
222.1
89.1
88.8
88.5
0.6
30.6
30.6
784.1
82.9
81.7
11.7
70.1
50
223.7
88.9
89.2
89.6
0.6
30.6
40.6
783.6
83.4
83.1
12.5
80.1
50
216.4
89.3
89.1
88.9
0.6
10.6
10.6
584.3
83.3
82.2
11.7
n =
8N
um
ber
of te
sts
max
Maxim
um
235.8
0.6
70.6
70.7
1
min
Min
imum
216.4
0.6
10.6
10.6
5
mean
Mean v
alu
e
FS
m |
m228.3
0.6
40.6
50.6
9E
q.
(2),
Eq.
(4)
RS
pre
ad
19.4
0.0
60.0
60.0
6R
= m
ax
– m
in
sS
tandard
devi
ation s
Fs
7.3
0.0
20
0.0
21
0.0
22
Eq.
(3),
Eq.
(5)
VC
oeffi
cie
nt
of va
riation
3.2
%3.2
%3.2
%3.2
%V
= s
/ m
ean
0,9
FS
m205.4
Load leve
l fo
r th
e c
reep t
est
Test
rep
ort
Technical characteristics of the test
Teste
d a
ccord
ing t
oD
IN E
N 1
090-2
:2011-1
0 –
Annex G
Test
date
10.1
1.2
016 -
15.1
1.2
016
Test
perform
ed b
yN
. A
fzali,
M.S
c.
Pro
ject
No.
410410007 2
0003
Coating c
om
positio
n–
Surface t
reatm
ent
Grit
bla
ste
d (
usin
g G
ritt
al G
M30 p
art
icle
s o
f 50 µ
m p
art
icle
siz
e)
Maxim
um
coating t
hic
kness
–
Quota
tion N
o.
RF
SR
-CT-2
014-0
0024 (
SIR
OC
O)
Ste
el gra
de
Ferr
itic
Sta
inle
ss S
teel (1
.4003)
Coating
–
Surface r
oughness (
after
coating)
–
Curing p
rocedure
–
Dura
tion o
f curing
–
Mean c
oating t
hic
kness
–
Min
imum
coating t
hic
kness
–
Surface r
oughness (
befo
re c
oating)
45 µ
m
Nom
inal pre
load leve
l88 k
N
=
Fp,C
Pre
load m
easuring m
eth
od
Load c
ell
(h =
40 m
m),
measure
d c
ontinuously
, cla
mpin
g length
t
= 7
5 m
m
Test
speed
0.6
mm
/min
Tim
e b
etw
een a
pplic
ation o
f coating a
nd t
esting
–
Specim
en s
ize
Sta
ndard
specim
ens M
16
(EN
1090-2
, F
igure
G.1
b)
Bolt c
lass,
bolt t
ype
Bolt:
BU
MA
X 8
8
(EN
IS
O 4
017 –
M16 x
100)
- N
ut:
BU
MA
X 8
8 (
EN
IS
O 4
032)
- W
asher:
HV
200 (
EN
IS
O 7
089)
Oute
r
bolt
Inner
bolt
Oute
r
bolt
Inner
bolt
Sp
ecim
en
sP
relo
ad
Sli
p f
acto
rP
relo
ad
Te
st
du
rati
on
at
sta
rt o
f te
st (
init
ial
pre
loa
d)
based o
n p
relo
ad
at slip
at
slip
Sta
rt
of th
e t
est
Static test
6.2
_U
DE
_F
_G
B_1-2
10.1
1.1
6 1
3:3
0
6.2
_U
DE
_F
_G
B_3-4
10.1
1.1
6 1
4:5
0
6.2
_U
DE
_F
_G
B_5-6
10.1
1.1
6 1
6:4
0
Statistics
(4 specimens,
8 test results)
6.2
_U
DE
_F
_G
B_7-8
14.1
1.1
6 1
5:4
0
INS
TIT
UT
FÜ
R
Me
tall-u
nd
Le
ich
tbau
Un
iv.-
Pro
f.D
r.-I
ng
.h
ab
il.N
ata
lie
Str
an
gh
ön
er
Un
ive
rsitä
tss
tr. 1
54
51
41
Es
se
nF
on
: +
49
(0
)20
1 1
83
-27
57
Fa
x: +
49
(0
)20
1 1
83
-27
10
E-M
ail:
iml@
un
i-d
ue.d
ew
ww
.un
i-d
ue
.de
/im
l
INS
TIT
UT
FÜ
R
Me
tall-u
nd
Le
ich
tbau
Un
iv.-
Pro
f.D
r.-I
ng
.h
ab
il.N
ata
lie
Str
an
gh
ön
er
Un
ive
rsitä
tss
tr. 1
54
51
41
Es
se
nF
on
: +
49
(0
)20
1 1
83
-27
57
Fa
x: +
49
(0
)20
1 1
83
-27
10
E-M
ail:
iml@
un
i-d
ue.d
ew
ww
.un
i-d
ue
.de
/im
l
INS
TIT
UT
FÜ
R
Me
tall-u
nd
Le
ich
tbau
Un
iv.-
Pro
f.D
r.-I
ng
.h
ab
il.N
ata
lie
Str
an
gh
ön
er
Un
ive
rsitä
tss
tr. 1
54
51
41
Es
se
nF
on
: +
49
(0
)20
1 1
83
-27
57
Fa
x: +
49
(0
)20
1 1
83
-27
10
E-M
ail:
iml@
un
i-d
ue.d
ew
ww
.un
i-d
ue
.de
/im
lU
niv
ers
itä
tss
tr. 1
54
51
41
Es
se
nF
on
: +
49
(0
)20
1 1
83
-27
57
Fa
x: +
49
(0
)20
1 1
83
-27
10
E-M
ail:
iml@
un
i-d
ue.d
ew
ww
.un
i-d
ue
.de
/im
l
INS
TIT
UT
EFO
R
Me
talan
dL
igh
twe
igh
tS
tru
ctu
res
Un
iv.-
Pro
f.D
r.-I
ng
.h
ab
il.N
ata
lie
Str
an
gh
ön
er
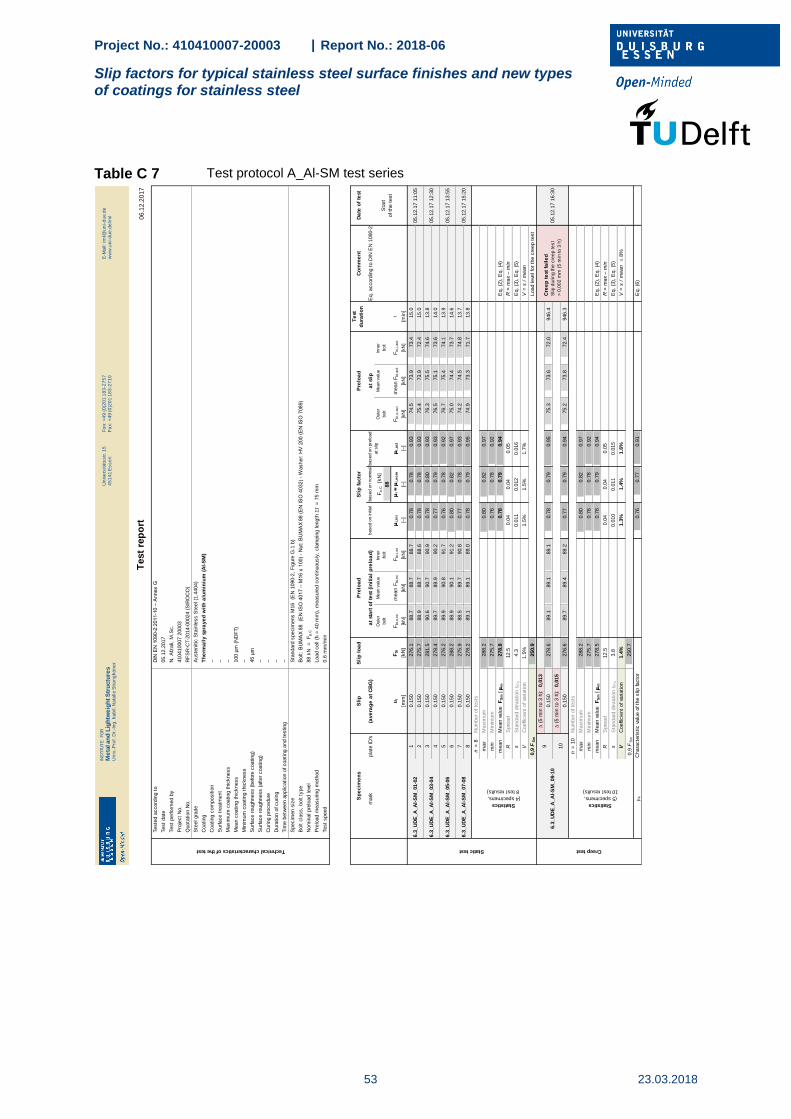
Project No.: 410410007-20003 | Report No.: 2018-06
Slip factors for typical stainless steel surface finishes and new types of coatings for stainless steel
53 23.03.2018
Table C 7 Test protocol A_Al-SM test series
06
.12
.20
17
Sli
pS
lip
lo
ad
Co
mm
en
tD
ate
of
test
mark
pla
te ID
's(a
ve
rag
e a
t C
BG
)based o
n in
itial
pre
load
based o
n n
om
inal
pre
load
Eq.
accord
ing t
o D
IN E
N 1
090-2
Mean v
alu
eF
p,C
[k
N]
Mean v
alu
e
88
ui
FS
iF
bi,o,ini
mean F
bi,in
iF
bi,i,in
i
i,in
i
i
i,
no
m
i,act
Fb
i,o,a
ct
mean F
bi,act
Fb
i,i,act
t
[mm
][k
N]
[kN
][k
N]
[kN
][–
][–
][–
][k
N]
[kN
][k
N]
[min
]
10.1
50
276.1
88.7
88.7
88.7
0.7
80.7
80.9
374.5
73.9
73.4
15.0
20.1
50
275.7
88.9
88.7
88.6
0.7
80.7
80.9
375.4
73.9
72.4
15.0
30.1
50
281.5
90.6
90.7
90.9
0.7
80.8
00.9
376.3
75.5
74.6
13.8
40.1
50
278.4
89.7
89.9
90.2
0.7
70.7
90.9
376.5
75.1
73.6
14.0
50.1
50
276.2
89.9
90.8
91.7
0.7
60.7
80.9
276.7
75.4
74.1
13.9
60.1
50
288.2
88.9
90.1
91.2
0.8
00.8
20.9
775.0
74.4
73.7
14.6
70.1
50
275.9
88.5
89.7
90.8
0.7
70.7
80.9
374.2
74.5
74.8
13.7
80.1
50
278.2
89.1
89.1
89.0
0.7
80.7
90.9
574.9
73.3
71.7
13.8
n =
8N
um
ber
of te
sts
max
Maxim
um
288.2
0.8
00.8
20.9
7
min
Min
imum
275.7
0.7
60.7
80.9
2
mean
Mean v
alu
e
FS
m |
m278.8
0.7
80.7
90.9
4E
q.
(2),
Eq.
(4)
RS
pre
ad
12.5
0.0
40.0
40.0
5R
= m
ax
– m
in
sS
tandard
devi
ation s
Fs
4.3
0.0
11
0.0
12
0.0
16
Eq.
(3),
Eq.
(5)
VC
oeffi
cie
nt
of va
riation
1.5
%1.5
%1.5
%1.7
%V
= s
/ m
ean
0,9
FS
m250.9
Load leve
l fo
r th
e c
reep t
est
D (
5 m
in t
o 3
h):
0,0
13
0.1
50
278.6
89.1
89.1
89.1
0.7
80.7
90.9
575.3
73.6
72.0
946.4
D (
5 m
in t
o 3
h):
0,0
15
0.1
50
276.6
89.7
89.4
89.2
0.7
70.7
90.9
475.2
73.8
72.4
946.3
n =
10
Num
ber
of te
sts
max
Maxim
um
288.2
0.8
00.8
20.9
7
min
Min
imum
275.7
0.7
60.7
80.9
2
mean
Mean v
alu
e
FS
m |
m278.5
0.7
80.7
90.9
4E
q.
(2),
Eq.
(4)
RS
pre
ad
12.5
0.0
40.0
40.0
5R
= m
ax
– m
in
sS
tandard
devi
ation s
Fs
3.8
0.0
10
0.0
11
0.0
15
Eq.
(3),
Eq.
(5)
VC
oeffi
cie
nt
of va
riation
1.4
%1.3
%1.4
%1.6
%V
= s
/ m
ean 8
%
0,9
FS
m250.7
k
0.7
60.7
70.9
1E
q.
(6)
Statistics
(5 specimens,
10 test results)
Chara
cte
ristic v
alu
e o
f th
e s
lip facto
r
Statistics
(4 specimens,
8 test results)
Creep test
6.3
_U
DE
_A
_A
l-S
M_09-1
0
9C
ree
p t
est
fa
ile
d
Slip
du
rin
g th
e c
ree
p te
st
> 0
,00
2 m
m (
5 m
in to
3 h
)
05.1
2.1
7 1
6:3
0
6.3
_U
DE
_A
_A
l-S
M_07-0
805.1
2.1
7 1
5:2
0
10
Static test
6.3
_U
DE
_A
_A
l-S
M_01-0
205.1
2.1
7 1
1:0
5
6.3
_U
DE
_A
_A
l-S
M_03-0
405.1
2.1
7 1
2:3
0
6.3
_U
DE
_A
_A
l-S
M_05-0
605.1
2.1
7 1
3:5
5
Oute
r
bolt
Inner
bolt
Oute
r
bolt
Inner
bolt
Sp
ecim
en
sP
relo
ad
Sli
p f
acto
rP
relo
ad
Te
st
du
rati
on
at
sta
rt o
f te
st (
init
ial
pre
loa
d)
based o
n p
relo
ad
at slip
at
slip
Sta
rt
of th
e t
est
Nom
inal pre
load leve
l88 k
N
=
Fp,C
Pre
load m
easuring m
eth
od
Load c
ell
(h =
40 m
m),
measure
d c
ontinuously
, cla
mpin
g length
t
= 7
5 m
m
Test
speed
0.6
mm
/min
Tim
e b
etw
een a
pplic
ation o
f coating a
nd t
esting
–
Specim
en s
ize
Sta
ndard
specim
ens M
16
(EN
1090-2
, F
igure
G.1
b)
Bolt c
lass,
bolt t
ype
Bolt:
BU
MA
X 8
8
(EN
IS
O 4
017 –
M16 x
100)
- N
ut:
BU
MA
X 8
8 (
EN
IS
O 4
032)
- W
asher:
HV
200 (
EN
IS
O 7
089)
Curing p
rocedure
–
Dura
tion o
f curing
–
Mean c
oating t
hic
kness
100 µ
m (
ND
FT)
Min
imum
coating t
hic
kness
–
Surface r
oughness (
befo
re c
oating)
45 µ
m
Test
rep
ort
Technical characteristics of the test
Teste
d a
ccord
ing t
oD
IN E
N 1
090-2
:2011-1
0 –
Annex G
Test
date
05.1
2.2
017
Test
perform
ed b
yN
. A
fzali,
M.S
c.
Pro
ject
No.
410410007 2
0003
Coating c
om
positio
n–
Surface t
reatm
ent
–
Maxim
um
coating t
hic
kness
–
Quota
tion N
o.
RF
SR
-CT-2
014-0
0024 (
SIR
OC
O)
Ste
el gra
de
Auste
nitic
Sta
inle
ss S
teel (1
.4404)
Coating
Th
erm
all
y s
pra
ye
d w
ith
alu
min
ium
(A
l-S
M)
Surface r
oughness (
after
coating)
–
INS
TIT
UT
FÜ
R
Me
tall-u
nd
Le
ich
tbau
Un
iv.-
Pro
f.D
r.-I
ng
.h
ab
il.N
ata
lie
Str
an
gh
ön
er
Un
ive
rsitä
tss
tr. 1
54
51
41
Es
se
nF
on
: +
49
(0
)20
1 1
83
-27
57
Fa
x: +
49
(0
)20
1 1
83
-27
10
E-M
ail:
iml@
un
i-d
ue.d
ew
ww
.un
i-d
ue
.de
/im
l
INS
TIT
UT
FÜ
R
Me
tall-u
nd
Le
ich
tbau
Un
iv.-
Pro
f.D
r.-I
ng
.h
ab
il.N
ata
lie
Str
an
gh
ön
er
Un
ive
rsitä
tss
tr. 1
54
51
41
Es
se
nF
on
: +
49
(0
)20
1 1
83
-27
57
Fa
x: +
49
(0
)20
1 1
83
-27
10
E-M
ail:
iml@
un
i-d
ue.d
ew
ww
.un
i-d
ue
.de
/im
l
INS
TIT
UT
FÜ
R
Me
tall-u
nd
Le
ich
tbau
Un
iv.-
Pro
f.D
r.-I
ng
.h
ab
il.N
ata
lie
Str
an
gh
ön
er
Un
ive
rsitä
tss
tr. 1
54
51
41
Es
se
nF
on
: +
49
(0
)20
1 1
83
-27
57
Fa
x: +
49
(0
)20
1 1
83
-27
10
E-M
ail:
iml@
un
i-d
ue.d
ew
ww
.un
i-d
ue
.de
/im
lU
niv
ers
itä
tss
tr. 1
54
51
41
Es
se
nF
on
: +
49
(0
)20
1 1
83
-27
57
Fa
x: +
49
(0
)20
1 1
83
-27
10
E-M
ail:
iml@
un
i-d
ue.d
ew
ww
.un
i-d
ue
.de
/im
l
INS
TIT
UT
EFO
R
Me
tala
nd
Lig
htw
eig
htS
tru
ctu
res
Un
iv.-
Pro
f.D
r.-I
ng
.h
ab
il.N
ata
lie
Str
an
gh
ön
er

Project No.: 410410007-20003 | Report No.: 2018-06
Slip factors for typical stainless steel surface finishes and new types of coatings for stainless steel
23.03.2018
54
Table C8 Test protocol D_Al-SM test series
06
.12
.20
17
Sli
pS
lip
lo
ad
Co
mm
en
tD
ate
of
test
mark
pla
te ID
's(a
ve
rag
e a
t C
BG
)based o
n in
itial
pre
load
based o
n n
om
inal
pre
load
Eq.
accord
ing t
o D
IN E
N 1
090-2
Mean v
alu
eF
p,C
[k
N]
Mean v
alu
e
88
ui
FS
iF
bi,o,ini
mean F
bi,in
iF
bi,i,in
i
i,in
i
i
i,
no
m
i,act
Fb
i,o,a
ct
mean F
bi,act
Fb
i,i,act
t
[mm
][k
N]
[kN
][k
N]
[kN
][–
][–
][–
][k
N]
[kN
][k
N]
[min
]
10.1
50
304.0
91.3
91.0
90.7
0.8
40.8
60.9
580.3
79.6
79.0
12.9
20.1
50
315.6
90.6
90.8
90.9
0.8
70.9
01.0
079.2
78.9
78.5
13.4
30.1
50
301.3
90.2
90.1
90.0
0.8
40.8
60.9
679.2
78.9
78.5
12.7
40.1
50
307.8
90.8
90.6
90.3
0.8
50.8
70.9
880.0
78.8
77.6
13.0
50.1
50
302.2
89.9
89.5
89.1
0.8
40.8
60.9
778.7
77.9
77.1
13.0
60.1
50
310.5
89.9
90.4
90.9
0.8
60.8
80.9
978.8
78.7
78.6
13.4
70.1
50
311.2
89.7
89.6
89.6
0.8
70.8
80.9
978.4
78.3
78.1
13.1
80.1
50
306.5
90.6
90.5
90.4
0.8
50.8
70.9
779.6
79.3
79.0
12.9
n =
8N
um
ber
of te
sts
max
Maxim
um
315.6
0.8
70.9
01.0
0
min
Min
imum
301.3
0.8
40.8
60.9
5
mean
Mean v
alu
e
FS
m |
m307.4
0.8
50.8
70.9
8E
q.
(2),
Eq.
(4)
RS
pre
ad
14.3
0.0
30.0
40.0
5R
= m
ax
– m
in
sS
tandard
devi
ation s
Fs
4.9
0.0
13
0.0
14
0.0
17
Eq.
(3),
Eq.
(5)
VC
oeffi
cie
nt
of va
riation
1.6
%1.6
%1.6
%1.8
%V
= s
/ m
ean
0,9
FS
m276.7
Load leve
l fo
r th
e c
reep t
est
D (
5 m
in t
o 3
h):
0,0
07
0.1
50
306.7
89.1
89.1
89.0
0.8
60.8
71.0
076.5
76.6
76.8
2516.9
D (
5 m
in t
o 3
h):
0,0
07
0.1
50
298.7
87.7
88.1
88.5
0.8
50.8
50.9
974.9
75.1
75.2
2516.5
n =
10
Num
ber
of te
sts
max
Maxim
um
315.6
0.8
70.9
01.0
0
min
Min
imum
298.7
0.8
40.8
50.9
5
mean
Mean v
alu
e
FS
m |
m306.5
0.8
50.8
70.9
8E
q.
(2),
Eq.
(4)
RS
pre
ad
16.9
0.0
30.0
50.0
5R
= m
ax
– m
in
sS
tandard
devi
ation s
Fs
5.1
0.0
12
0.0
15
0.0
18
Eq.
(3),
Eq.
(5)
VC
oeffi
cie
nt
of va
riation
1.7
%1.4
%1.7
%1.8
%V
= s
/ m
ean 8
%
0,9
FS
m275.8
k
0.8
30.8
40.9
4E
q.
(6)
Statistics
(5 specimens,
10 test results)
Chara
cte
ristic v
alu
e o
f th
e s
lip facto
r
Statistics
(4 specimens,
8 test results)
Creep test
6.3
_U
DE
_D
_A
l-S
M_09-1
0
9C
ree
p t
est
fa
ile
d
Slip
du
rin
g th
e c
ree
p te
st
> 0
,00
2 m
m (
5 m
in to
3 h
)
06.1
2.1
7 1
4:1
5
6.3
_U
DE
_D
_A
l-S
M_07-0
806.1
2.1
7 1
2:1
5
10
Static test
6.3
_U
DE
_D
_A
l-S
M_01-0
206.1
2.1
7 9
:10
6.3
_U
DE
_D
_A
l-S
M_03-0
406.1
2.1
7 1
0:1
0
6.3
_U
DE
_D
_A
l-S
M_05-0
606.1
2.1
7 1
1:1
5
Oute
r
bolt
Inner
bolt
Oute
r
bolt
Inner
bolt
Sp
ecim
en
sP
relo
ad
Sli
p f
acto
rP
relo
ad
Te
st
du
rati
on
at
sta
rt o
f te
st (
init
ial
pre
loa
d)
based o
n p
relo
ad
at slip
at
slip
Sta
rt
of th
e t
est
Nom
inal pre
load leve
l88 k
N
=
Fp,C
Pre
load m
easuring m
eth
od
Load c
ell
(h =
40 m
m),
measure
d c
ontinuously
, cla
mpin
g length
t
= 7
5 m
m
Test
speed
0.6
mm
/min
Tim
e b
etw
een a
pplic
ation o
f coating a
nd t
esting
–
Specim
en s
ize
Sta
ndard
specim
ens M
16
(EN
1090-2
, F
igure
G.1
b)
Bolt c
lass,
bolt t
ype
Bolt:
BU
MA
X 8
8
(EN
IS
O 4
017 –
M16 x
100)
- N
ut:
BU
MA
X 8
8 (
EN
IS
O 4
032)
- W
asher:
HV
200 (
EN
IS
O 7
089)
Curing p
rocedure
–
Dura
tion o
f curing
–
Mean c
oating t
hic
kness
116 µ
m (
DF
T)
Min
imum
coating t
hic
kness
–
Surface r
oughness (
befo
re c
oating)
43 µ
m
Test
rep
ort
Technical characteristics of the test
Teste
d a
ccord
ing t
oD
IN E
N 1
090-2
:2011-1
0 –
Annex G
Test
date
06.1
2.2
017
Test
perform
ed b
yN
. A
fzali,
M.S
c.
Pro
ject
No.
410410007 2
0003
Coating c
om
positio
n–
Surface t
reatm
ent
–
Maxim
um
coating t
hic
kness
–
Quota
tion N
o.
RF
SR
-CT-2
014-0
0024 (
SIR
OC
O)
Ste
el gra
de
Duple
x S
tain
less S
teel (1
.4462)
Coating
Th
erm
all
y s
pra
ye
d w
ith
alu
min
ium
(A
l-S
M)
Surface r
oughness (
after
coating)
–
INS
TIT
UT
FÜ
R
Me
tall-u
nd
Le
ich
tbau
Un
iv.-
Pro
f.D
r.-I
ng
.h
ab
il.N
ata
lie
Str
an
gh
ön
er
Un
ive
rsitä
tss
tr. 1
54
51
41
Es
se
nF
on
: +
49
(0
)20
1 1
83
-27
57
Fa
x: +
49
(0
)20
1 1
83
-27
10
E-M
ail:
iml@
un
i-d
ue.d
ew
ww
.un
i-d
ue
.de
/im
l
INS
TIT
UT
FÜ
R
Me
tall-u
nd
Le
ich
tbau
Un
iv.-
Pro
f.D
r.-I
ng
.h
ab
il.N
ata
lie
Str
an
gh
ön
er
Un
ive
rsitä
tss
tr. 1
54
51
41
Es
se
nF
on
: +
49
(0
)20
1 1
83
-27
57
Fa
x: +
49
(0
)20
1 1
83
-27
10
E-M
ail:
iml@
un
i-d
ue.d
ew
ww
.un
i-d
ue
.de
/im
l
INS
TIT
UT
FÜ
R
Me
tall-u
nd
Le
ich
tbau
Un
iv.-
Pro
f.D
r.-I
ng
.h
ab
il.N
ata
lie
Str
an
gh
ön
er
Un
ive
rsitä
tss
tr. 1
54
51
41
Es
se
nF
on
: +
49
(0
)20
1 1
83
-27
57
Fa
x: +
49
(0
)20
1 1
83
-27
10
E-M
ail:
iml@
un
i-d
ue.d
ew
ww
.un
i-d
ue
.de
/im
lU
niv
ers
itä
tss
tr. 1
54
51
41
Es
se
nF
on
: +
49
(0
)20
1 1
83
-27
57
Fa
x: +
49
(0
)20
1 1
83
-27
10
E-M
ail:
iml@
un
i-d
ue.d
ew
ww
.un
i-d
ue
.de
/im
l
INS
TIT
UT
EFO
R
Me
tala
nd
Lig
htw
eig
htS
tru
ctu
res
Un
iv.-
Pro
f.D
r.-I
ng
.h
ab
il.N
ata
lie
Str
an
gh
ön
er

Project No.: 410410007-20003 | Report No.: 2018-06
Slip factors for typical stainless steel surface finishes and new types of coatings for stainless steel
55 23.03.2018
Table C9 Test protocol LD_Al-SM test series
12
.12
.20
17
Sli
pS
lip
lo
ad
Co
mm
en
tD
ate
of
test
mark
pla
te ID
's(a
ve
rag
e a
t C
BG
)based o
n in
itial
pre
load
based o
n n
om
inal
pre
load
Eq.
accord
ing t
o D
IN E
N 1
090-2
Mean v
alu
eF
p,C
[k
N]
Mean v
alu
e
88
ui
FS
iF
bi,o,ini
mean F
bi,in
iF
bi,i,in
i
i,in
i
i
i,
no
m
i,act
Fb
i,o,a
ct
mean F
bi,act
Fb
i,i,act
t
[mm
][k
N]
[kN
][k
N]
[kN
][–
][–
][–
][k
N]
[kN
][k
N]
[min
]
10.1
50
290.3
91.2
90.6
90.0
0.8
00.8
20.9
181.5
79.9
78.3
12.3
20.1
48
305.4
90.0
89.9
89.9
0.8
50.8
70.9
779.5
78.7
77.9
13.1
30.1
50
287.1
89.4
89.5
89.5
0.8
00.8
20.9
079.3
79.6
79.9
12.6
40.1
50
289.3
89.0
89.0
89.0
0.8
10.8
20.9
279.0
78.8
78.5
12.7
50.1
50
269.3
88.6
89.1
89.5
0.7
60.7
70.8
479.6
79.9
80.2
11.8
60.1
12
279.2
89.0
89.3
89.6
0.7
80.7
90.8
780.6
80.0
79.5
12.4
70.1
50
268.1
90.1
89.5
88.9
0.7
50.7
60.8
481.1
80.0
78.9
11.8
80.1
50
278.6
88.8
89.1
89.5
0.7
80.7
90.8
780.8
80.1
79.3
12.3
n =
8N
um
ber
of te
sts
max
Maxim
um
305.4
0.8
50.8
70.9
7
min
Min
imum
268.1
0.7
50.7
60.8
4
mean
Mean v
alu
e
FS
m |
m283.4
0.7
90.8
10.8
9E
q.
(2),
Eq.
(4)
RS
pre
ad
37.3
0.1
00.1
10.1
3R
= m
ax
– m
in
sS
tandard
devi
ation s
Fs
12.3
0.0
32
0.0
35
0.0
44
Eq.
(3),
Eq.
(5)
VC
oeffi
cie
nt
of va
riation
4.3
%4.1
%4.3
%4.9
%V
= s
/ m
ean
0,9
FS
m255.1
Load leve
l fo
r th
e c
reep t
est
D (
5 m
in t
o 3
h):
0,0
07
0.1
50
301.4
87.8
88.0
88.2
0.8
60.8
60.9
976.5
76.4
76.2
1263.6
D (
5 m
in t
o 3
h):
0,0
05
0.1
51
298.5
87.5
87.8
88.1
0.8
50.8
50.9
876.8
76.2
75.6
1263.4
n =
10
Num
ber
of te
sts
max
Maxim
um
305.4
0.8
60.8
70.9
9
min
Min
imum
268.1
0.7
50.7
60.8
4
mean
Mean v
alu
e
FS
m |
m286.7
0.8
00.8
10.9
1E
q.
(2),
Eq.
(4)
RS
pre
ad
37.3
0.1
10.1
10.1
5R
= m
ax
– m
in
sS
tandard
devi
ation s
Fs
12.9
0.0
38
0.0
37
0.0
55
Eq.
(3),
Eq.
(5)
VC
oeffi
cie
nt
of va
riation
4.5
%4.8
%4.5
%6.1
%V
= s
/ m
ean 8
%
0,9
FS
m258.0
k
0.7
30.7
40.8
0E
q.
(6)
Statistics
(5 specimens,
10 test results)
Chara
cte
ristic v
alu
e o
f th
e s
lip facto
r
Statistics
(4 specimens,
8 test results)
Creep test
6.3
_U
DE
_L
D_A
l-S
M_09-1
0
9C
ree
p t
est
fa
ile
d
Slip
du
rin
g th
e c
ree
p te
st
> 0
,00
2 m
m (
5 m
in to
3 h
)
11.1
2.1
7 1
5:2
5
6.3
_U
DE
_L
D_A
l-S
M_07-0
811.1
2.1
7 1
4:3
0
10
Static test
6.3
_U
DE
_L
D_A
l-S
M_01-0
211.1
2.1
7 1
1:4
5
6.3
_U
DE
_L
D_A
l-S
M_03-0
411.1
2.1
7 1
2:4
0
6.3
_U
DE
_L
D_A
l-S
M_05-0
611.1
2.1
7 1
3:3
5
Oute
r
bolt
Inner
bolt
Oute
r
bolt
Inner
bolt
Sp
ecim
en
sP
relo
ad
Sli
p f
acto
rP
relo
ad
Te
st
du
rati
on
at
sta
rt o
f te
st (
init
ial
pre
loa
d)
based o
n p
relo
ad
at slip
at
slip
Sta
rt
of th
e t
est
Nom
inal pre
load leve
l88 k
N
=
Fp,C
Pre
load m
easuring m
eth
od
Load c
ell
(h =
40 m
m),
measure
d c
ontinuously
, cla
mpin
g length
t
= 7
5 m
m
Test
speed
0.6
mm
/min
Tim
e b
etw
een a
pplic
ation o
f coating a
nd t
esting
–
Specim
en s
ize
Sta
ndard
specim
ens M
16
(EN
1090-2
, F
igure
G.1
b)
Bolt c
lass,
bolt t
ype
Bolt:
BU
MA
X 8
8
(EN
IS
O 4
017 –
M16 x
100)
- N
ut:
BU
MA
X 8
8 (
EN
IS
O 4
032)
- W
asher:
HV
200 (
EN
IS
O 7
089)
–
Curing p
rocedure
–
Dura
tion o
f curing
–
Mean c
oating t
hic
kness
105 µ
m (
DF
T)
Min
imum
coating t
hic
kness
–
Surface r
oughness (
befo
re c
oating)
51 µ
m
Test
rep
ort
Technical characteristics of the test
Teste
d a
ccord
ing t
oD
IN E
N 1
090-2
:2011-1
0 –
Annex G
Test
date
11.1
2.2
017
Test
perform
ed b
yN
. A
fzali,
M.S
c.
Pro
ject
No.
410410007 2
0003
Coating c
om
positio
n–
Surface t
reatm
ent
–
Maxim
um
coating t
hic
kness
–
Quota
tion N
o.
RF
SR
-CT-2
014-0
0024 (
SIR
OC
O)
Ste
el gra
de
Lean-D
uple
x S
tain
less S
teel (1
.4162)
Coating
Th
erm
all
y s
pra
ye
d w
ith
alu
min
ium
(A
l-S
M)
Surface r
oughness (
after
coating)
INS
TIT
UT
FÜ
R
Me
tall-u
nd
Le
ich
tbau
Un
iv.-
Pro
f.D
r.-I
ng
.h
ab
il.N
ata
lie
Str
an
gh
ön
er
Un
ive
rsitä
tss
tr. 1
54
51
41
Es
se
nF
on
: +
49
(0
)20
1 1
83
-27
57
Fa
x: +
49
(0
)20
1 1
83
-27
10
E-M
ail:
iml@
un
i-d
ue.d
ew
ww
.un
i-d
ue
.de
/im
l
INS
TIT
UT
FÜ
R
Me
tall-u
nd
Le
ich
tbau
Un
iv.-
Pro
f.D
r.-I
ng
.h
ab
il.N
ata
lie
Str
an
gh
ön
er
Un
ive
rsitä
tss
tr. 1
54
51
41
Es
se
nF
on
: +
49
(0
)20
1 1
83
-27
57
Fa
x: +
49
(0
)20
1 1
83
-27
10
E-M
ail:
iml@
un
i-d
ue.d
ew
ww
.un
i-d
ue
.de
/im
l
INS
TIT
UT
FÜ
R
Me
tall-u
nd
Le
ich
tbau
Un
iv.-
Pro
f.D
r.-I
ng
.h
ab
il.N
ata
lie
Str
an
gh
ön
er
Un
ive
rsitä
tss
tr. 1
54
51
41
Es
se
nF
on
: +
49
(0
)20
1 1
83
-27
57
Fa
x: +
49
(0
)20
1 1
83
-27
10
E-M
ail:
iml@
un
i-d
ue.d
ew
ww
.un
i-d
ue
.de
/im
lU
niv
ers
itä
tss
tr. 1
54
51
41
Es
se
nF
on
: +
49
(0
)20
1 1
83
-27
57
Fa
x: +
49
(0
)20
1 1
83
-27
10
E-M
ail:
iml@
un
i-d
ue.d
ew
ww
.un
i-d
ue
.de
/im
l
INS
TIT
UT
EFO
R
Me
tala
nd
Lig
htw
eig
htS
tru
ctu
res
Un
iv.-
Pro
f.D
r.-I
ng
.h
ab
il.N
ata
lie
Str
an
gh
ön
er

Project No.: 410410007-20003 | Report No.: 2018-06
Slip factors for typical stainless steel surface finishes and new types of coatings for stainless steel
23.03.2018
56
Table C10 Test protocol F_Al-SM test series
11
.12
.20
17
Sli
pS
lip
lo
ad
Co
mm
en
tD
ate
of
test
mark
pla
te ID
's(a
ve
rag
e a
t C
BG
)based o
n in
itial
pre
load
based o
n n
om
inal
pre
load
Eq.
accord
ing t
o D
IN E
N 1
090-2
Mean v
alu
eF
p,C
[k
N]
Mean v
alu
e
88
ui
FS
iF
bi,o,ini
mean F
bi,in
iF
bi,i,in
i
i,in
i
i
i,
no
m
i,act
Fb
i,o,a
ct
mean F
bi,act
Fb
i,i,act
t
[mm
][k
N]
[kN
][k
N]
[kN
][–
][–
][–
][k
N]
[kN
][k
N]
[min
]
10.1
50
286.5
89.7
89.8
89.9
0.8
00.8
10.9
279.0
78.1
77.1
12.5
20.1
50
293.2
90.8
90.6
90.4
0.8
10.8
30.9
479.8
78.2
76.7
12.8
30.1
50
283.3
90.2
89.8
89.5
0.7
90.8
00.9
278.5
77.2
75.9
12.8
40.1
29
292.1
89.4
89.5
89.6
0.8
20.8
30.9
478.8
77.5
76.2
13.4
50.1
50
294.8
89.3
89.4
89.4
0.8
20.8
40.9
678.1
76.8
75.4
13.5
60.1
50
292.0
90.4
90.2
90.0
0.8
10.8
30.9
479.8
77.5
75.3
13.4
70.1
50
282.8
89.3
89.5
89.7
0.7
90.8
00.9
278.4
76.8
75.1
13.0
80.1
50
290.0
90.2
89.9
89.6
0.8
10.8
20.9
379.6
77.7
75.7
13.3
n =
8N
um
ber
of te
sts
max
Maxim
um
294.8
0.8
20.8
40.9
6
min
Min
imum
282.8
0.7
90.8
00.9
2
mean
Mean v
alu
e
FS
m |
m289.3
0.8
10.8
20.9
3E
q.
(2),
Eq.
(4)
RS
pre
ad
12.0
0.0
40.0
30.0
4R
= m
ax
– m
in
sS
tandard
devi
ation s
Fs
4.6
0.0
12
0.0
13
0.0
15
Eq.
(3),
Eq.
(5)
VC
oeffi
cie
nt
of va
riation
1.6
%1.6
%1.6
%1.6
%V
= s
/ m
ean
0,9
FS
m260.4
Load leve
l fo
r th
e c
reep t
est
D (
5 m
in t
o 3
h):
0,0
08
0.1
50
289.2
88.1
88.4
88.6
0.8
20.8
20.9
776.1
74.8
73.4
4262.6
D (
5 m
in t
o 3
h):
0,0
07
0.1
50
287.6
87.8
88.1
88.3
0.8
20.8
20.9
776.1
74.4
72.6
4262.5
n =
10
Num
ber
of te
sts
max
Maxim
um
294.8
0.8
20.8
40.9
7
min
Min
imum
282.8
0.7
90.8
00.9
2
mean
Mean v
alu
e
FS
m |
m289.2
0.8
10.8
20.9
4E
q.
(2),
Eq.
(4)
RS
pre
ad
12.0
0.0
40.0
30.0
5R
= m
ax
– m
in
sS
tandard
devi
ation s
Fs
4.1
0.0
12
0.0
12
0.0
19
Eq.
(3),
Eq.
(5)
VC
oeffi
cie
nt
of va
riation
1.4
%1.5
%1.4
%2.0
%V
= s
/ m
ean 8
%
0,9
FS
m260.2
k
0.7
80.8
00.9
0E
q.
(6)
Test
rep
ort
Technical characteristics of the test
Teste
d a
ccord
ing t
oD
IN E
N 1
090-2
:2011-1
0 –
Annex G
Test
date
06.1
2.2
017 a
nd 0
8.1
2.2
017
Test
perform
ed b
yN
. A
fzali,
M.S
c.
Pro
ject
No.
410410007 2
0003
Coating c
om
positio
n–
Surface t
reatm
ent
–
Maxim
um
coating t
hic
kness
–
Quota
tion N
o.
RF
SR
-CT-2
014-0
0024 (
SIR
OC
O)
Ste
el gra
de
Ferr
itic
Sta
inle
ss S
teel (1
.4003)
Coating
Th
erm
all
y s
pra
ye
d w
ith
alu
min
ium
(A
l-S
M)
Surface r
oughness (
after
coating)
–
Curing p
rocedure
–
Dura
tion o
f curing
–
Mean c
oating t
hic
kness
91 µ
m (
DF
T)
Min
imum
coating t
hic
kness
–
Surface r
oughness (
befo
re c
oating)
44 µ
m
Nom
inal pre
load leve
l88 k
N
=
Fp,C
Pre
load m
easuring m
eth
od
Load c
ell
(h =
40 m
m),
measure
d c
ontinuously
, cla
mpin
g length
t
= 7
5 m
m
Test
speed
0.6
mm
/min
Tim
e b
etw
een a
pplic
ation o
f coating a
nd t
esting
–
Specim
en s
ize
Sta
ndard
specim
ens M
16
(EN
1090-2
, F
igure
G.1
b)
Bolt c
lass,
bolt t
ype
Bolt:
BU
MA
X 8
8
(EN
IS
O 4
017 –
M16 x
100)
- N
ut:
BU
MA
X 8
8 (
EN
IS
O 4
032)
- W
asher:
HV
200 (
EN
IS
O 7
089)
Oute
r
bolt
Inner
bolt
Oute
r
bolt
Inner
bolt
Sp
ecim
en
sP
relo
ad
Sli
p f
acto
rP
relo
ad
Te
st
du
rati
on
at
sta
rt o
f te
st (
init
ial
pre
loa
d)
based o
n p
relo
ad
at slip
at
slip
Sta
rt
of th
e t
est
Static test
6.3
_U
DE
_F
_A
l-S
M_01-0
206.1
2.1
7 1
3:1
5
6.3
_U
DE
_F
_A
l-S
M_03-0
408.1
2.1
7 9
:05
6.3
_U
DE
_F
_A
l-S
M_05-0
608.1
2.1
7 1
0:0
0
Statistics
(4 specimens,
8 test results)
Creep test
6.3
_U
DE
_F
_A
l-S
M_09-1
0
9C
ree
p t
est
fa
ile
d
Slip
du
rin
g th
e c
ree
p te
st
> 0
,00
2 m
m (
5 m
in to
3 h
)
08.1
2.1
7 1
1:5
5
6.3
_U
DE
_F
_A
l-S
M_07-0
808.1
2.1
7 1
0:5
5
10
Statistics
(5 specimens,
10 test results)
Chara
cte
ristic v
alu
e o
f th
e s
lip facto
r
INS
TIT
UT
FÜ
R
Me
tall-u
nd
Le
ich
tbau
Un
iv.-
Pro
f.D
r.-I
ng
.h
ab
il.N
ata
lie
Str
an
gh
ön
er
Un
ive
rsitä
tss
tr. 1
54
51
41
Es
se
nF
on
: +
49
(0
)20
1 1
83
-27
57
Fa
x: +
49
(0
)20
1 1
83
-27
10
E-M
ail:
iml@
un
i-d
ue.d
ew
ww
.un
i-d
ue
.de
/im
l
INS
TIT
UT
FÜ
R
Me
tall-u
nd
Le
ich
tbau
Un
iv.-
Pro
f.D
r.-I
ng
.h
ab
il.N
ata
lie
Str
an
gh
ön
er
Un
ive
rsitä
tss
tr. 1
54
51
41
Es
se
nF
on
: +
49
(0
)20
1 1
83
-27
57
Fa
x: +
49
(0
)20
1 1
83
-27
10
E-M
ail:
iml@
un
i-d
ue.d
ew
ww
.un
i-d
ue
.de
/im
l
INS
TIT
UT
FÜ
R
Me
tall-u
nd
Le
ich
tbau
Un
iv.-
Pro
f.D
r.-I
ng
.h
ab
il.N
ata
lie
Str
an
gh
ön
er
Un
ive
rsitä
tss
tr. 1
54
51
41
Es
se
nF
on
: +
49
(0
)20
1 1
83
-27
57
Fa
x: +
49
(0
)20
1 1
83
-27
10
E-M
ail:
iml@
un
i-d
ue.d
ew
ww
.un
i-d
ue
.de
/im
lU
niv
ers
itä
tss
tr. 1
54
51
41
Es
se
nF
on
: +
49
(0
)20
1 1
83
-27
57
Fa
x: +
49
(0
)20
1 1
83
-27
10
E-M
ail:
iml@
un
i-d
ue.d
ew
ww
.un
i-d
ue
.de
/im
l
INS
TIT
UT
EFO
R
Me
tala
nd
Lig
htw
eig
htS
tru
ctu
res
Un
iv.-
Pro
f.D
r.-I
ng
.h
ab
il.N
ata
lie
Str
an
gh
ön
er
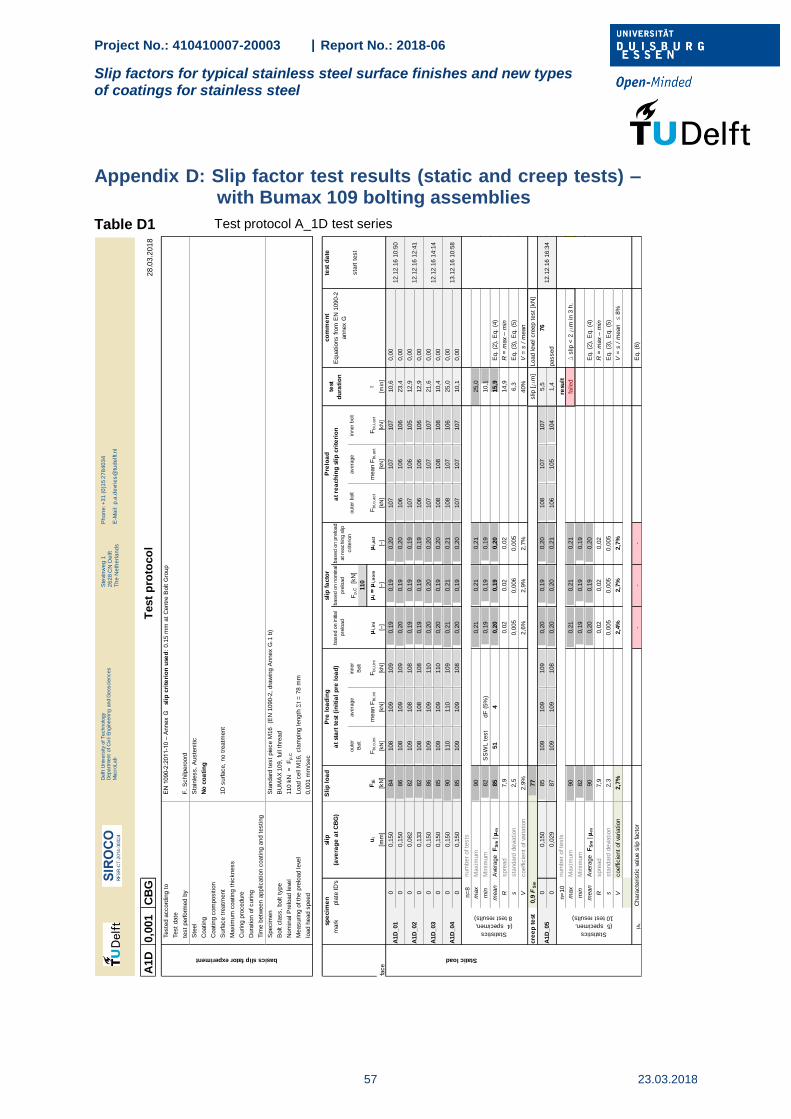
Project No.: 410410007-20003 | Report No.: 2018-06
Slip factors for typical stainless steel surface finishes and new types of coatings for stainless steel
57 23.03.2018
Appendix D: Slip factor test results (static and creep tests) – with Bumax 109 bolting assemblies
Table D1 Test protocol A_1D test series
A1D
0,0
01
CB
G2
8.0
3.2
01
8
1D
surface,
no t
reatm
ent
slip
Sli
p l
oa
dco
mm
en
tte
st d
ate
mark
pla
te ID
's(a
ve
rag
e a
t C
BG
)based o
n n
om
inal
pre
load
avera
ge
Fp,C
[k
N]
avera
ge
110
ui
FS
iF
bi,o,ini
mean F
bi,in
iF
bi,i,in
i
i,in
i
i
i,
no
m
i,act
Fbi,o,a
ct
mean F
bi,act
Fbi,i,act
t
A1D
: A
ust.
1D
surface
[mm
][k
N]
[kN
][k
N]
[kN
][–
][–
][–
][k
N]
[kN
][k
N]
[min
]
00,1
50
84
108
109
109
0,1
90,1
90,2
0107
107
107
10,6
0,0
0
00,1
50
86
108
109
109
0,2
00,1
90,2
0106
106
106
23,4
0,0
0
00,0
82
82
109
108
108
0,1
90,1
90,1
9107
106
105
12,9
0,0
0
00,1
33
82
108
108
108
0,1
90,1
90,1
9106
106
106
12,9
0,0
0
00,1
50
86
109
109
110
0,2
00,2
00,2
0107
107
107
21,6
0,0
0
00,1
50
85
109
109
110
0,2
00,1
90,2
0108
108
108
10,4
0,0
0
00,1
50
90
110
110
109
0,2
10,2
10,2
1108
107
106
25,0
0,0
0
00,1
50
85
109
109
108
0,2
00,1
90,2
0107
107
107
10,1
0,0
0
n=
8num
ber
of te
sts
max
Maxim
um
90
0,2
10,2
10,2
125,0
min
Min
imum
82
SS
WL t
est
dF
(5%
)0,1
90,1
90,1
910,1
mean
Ave
rage
FS
m |
m85
51
40,2
00,1
90,2
015,9
Eq.
(2),
Eq.
(4)
Rspre
ad
7,9
0,0
20,0
20,0
214,9
R =
max
– m
in
ssta
ndard
devi
ation
2,5
0,0
05
0,0
06
0,0
05
6,3
Eq.
(3),
Eq.
(5)
Vcoeffi
cie
nt
of va
riation
2,9
%2,6
%2,9
%2,7
%40%
V =
s /
mean
cre
ep
te
st0,9
FS
m77
slip
[m
m]
Load leve
l cre
ep t
est
[kN
]
00,1
50
85
109
109
109
0,2
00,1
90,2
0108
107
107
5,5
76
00,0
29
87
109
109
108
0,2
00,2
00,2
1106
105
104
1,4
passed
n=
10
num
ber
of te
sts
resu
lt
max
Maxim
um
90
0,2
10,2
10,2
1fa
iled
D s
lip <
2 m
m in 3
h.
min
Min
imum
82
0,1
90,1
90,1
9
mean
Ave
rage
FS
m |
m90
0,2
00,1
90,2
0E
q.
(2),
Eq.
(4)
Rspre
ad
7,9
0,0
20,0
20,0
2R
= m
ax
– m
in
ssta
ndard
devi
ation
2,3
0,0
05
0,0
05
0,0
05
Eq.
(3),
Eq.
(5)
Vcoeffi
cie
nt
of va
riation
2,7
%2,4
%2,7
%2,7
%V
= s
/ m
ean 8
%
k
--
-E
q.
(6)
Coating
No
co
ati
ng
Coating c
om
positio
n
Surface t
reatm
ent
Maxim
um
coating t
hic
kness
Test
pro
toco
lbasics slip fator experiment
Teste
d a
ccord
ing t
oE
N 1
090-2
:2011-1
0 –
Annex G
s
lip
cri
teri
on
use
d:
0.1
5 m
m a
t C
entr
e B
olt G
roup
Test
date
test
perform
ed b
yF
. S
chilp
ero
ord
Ste
el
Sta
inle
ss,
Auste
nitic
Specim
en
Sta
ndard
test
pie
ce M
16
(EN
1090-2
, dra
win
g A
nnex G
.1 b
)
Bolt c
lass,
bolt t
ype
BU
MA
X 1
09,
full
thre
ad
Nom
inal P
relo
ad leve
l110 k
N
=
Fp,C
Curing p
rocedure
Dura
tion o
f curing
Tim
e b
etw
een a
pplic
ation c
oating a
nd t
esting
Measuring o
f th
e p
relo
ad leve
lLoad c
ell
M16,
cla
mpin
g length
t
= 7
8 m
m
load h
ead s
peed
0,0
01 m
m/s
ec
spe
cim
en
Pre
lo
ad
ing
slip
fa
cto
rP
relo
ad
test
du
rati
on
inner
Bolt
oute
r bolt
inner
bolt
at
sta
rt t
est
(in
itia
l p
re l
oa
d)
based o
n in
itial
pre
load
based o
n p
relo
ad
at re
achin
g s
lip
crite
rion
at
rea
ch
ing
sli
p c
rite
rio
nE
quations fro
m E
N 1
090-2
annex G
sta
rt t
est
oute
r
Bolt
A1D
_03
12.1
2.1
6 1
4:1
4
A1D
_02
12.1
2.1
6 1
2:4
1
Statistics
(4 specimen,
8 test results)
A1D
_05
12.1
2.1
6 1
6:3
4
A1D
_04
13.1
2.1
6 1
0:5
8
Static load
A1D
_01
12.1
2.1
6 1
0:5
0
Statistics
(5 specimen,
10 test results)
Chara
cte
ristic v
alu
e s
lip facto
r
DelftU
niv
ers
ityofTechnolo
gy
Depart
ment
ofC
ivil
Engin
eering
and
Geoscie
nces
Macro
Lab
Ste
vin
we
g 1
26
28
CN
De
lft
Th
e N
eth
erl
an
ds
Ph
on
e: +
31
(0
)15
27
84
03
4
E-M
ail:
p.a
.de
vrie
s@
tud
elft.n
l

Project No.: 410410007-20003 | Report No.: 2018-06
Slip factors for typical stainless steel surface finishes and new types of coatings for stainless steel
23.03.2018
58
Table D2 Test protocol A_SB test series
AS
0,0
01
CB
G2
8.0
3.2
01
8
shot
bla
ste
d
slip
Sli
p l
oa
dco
mm
en
tte
st d
ate
mark
pla
te ID
's(a
ve
rag
e a
t C
BG
)based o
n n
om
inal
pre
load
avera
ge
Fp,C
[k
N]
avera
ge
110
ui
FS
iF
bi,o,ini
mean F
bi,in
iF
bi,i,in
i
i,in
i
i
i,
no
m
i,act
Fbi,o,a
ct
mean F
bi,act
Fbi,i,act
t
AS
: A
ust.
shot
bla
ste
d[m
m]
[kN
][k
N]
[kN
][k
N]
[–]
[–]
[–]
[kN
][k
N]
[kN
][m
in]
00,1
50
141
105
105
105
0,3
40,3
20,3
5102
101
100
26,5
0,0
0
00,1
50
122
105
105
105
0,2
90,2
80,3
0102
101
101
18,5
0,0
0
00,1
50
148
107
107
107
0,3
50,3
40,3
6103
102
101
19,6
0,0
0
00,1
50
159
107
107
107
0,3
70,3
60,3
9103
102
102
21,2
0,0
0
00,1
50
129
106
107
108
0,3
00,2
90,3
1103
103
102
18,0
0,0
0
00,1
50
138
106
106
107
0,3
30,3
10,3
4102
102
101
19,4
0,0
0
00,1
50
122
106
107
108
0,2
90,2
80,3
0103
103
103
16,9
0,0
0
00,1
50
158
106
107
107
0,3
70,3
60,3
9102
101
101
32,1
0,0
0
n=
8num
ber
of te
sts
max
Maxim
um
159
0,3
70,3
60,3
932,1
min
Min
imum
122
SS
WL t
est
dF
(5%
)0,2
90,2
80,3
016,9
mean
Ave
rage
FS
m |
m140
84
70,3
30,3
20,3
421,5
Eq.
(2),
Eq.
(4)
Rspre
ad
36,3
0,0
90,0
80,0
915,3
R =
max
– m
in
ssta
ndard
devi
ation
14,6
0,0
33
0,0
33
0,0
36
5,2
Eq.
(3),
Eq.
(5)
Vcoeffi
cie
nt
of va
riation
10,4
%10,2
%10,4
%10,6
%24%
V =
s /
mean
cre
ep
te
st0,9
FS
m126
slip
[m
m]
Load leve
l cre
ep t
est
[kN
]
00,1
50
142
109
109
109
0,3
30,3
20,3
5104
103
101
2,3
126
00,1
50
133
109
109
108
0,3
10,3
00,3
3104
103
102
1,7
passed
n=
10
num
ber
of te
sts
resu
lt
max
Maxim
um
159
0,3
70,3
60,3
9fa
iled
D s
lip <
2 m
m in 3
h.
min
Min
imum
122
0,2
90,2
80,3
0
mean
Ave
rage
FS
m |
m159
0,3
30,3
20,3
4E
q.
(2),
Eq.
(4)
Rspre
ad
36,3
0,0
90,0
80,0
9R
= m
ax
– m
in
ssta
ndard
devi
ation
13,0
0,0
30
0,0
30
0,0
33
Eq.
(3),
Eq.
(5)
Vcoeffi
cie
nt
of va
riation
9,4
%9,3
%9,4
%9,5
%V
= s
/ m
ean 8
%
k
--
-E
q.
(6)
Test
pro
toco
lbasics slip fator experiment
Teste
d a
ccord
ing t
oE
N 1
090-2
:2011-1
0 –
Annex G
s
lip
cri
teri
on
use
d:
0.1
5 m
m a
t C
entr
e B
olt G
roup
Test
date
test
perform
ed b
yF
. S
chilp
ero
ord
Ste
el
Sta
inle
ss,
Auste
nitic
Maxim
um
coating t
hic
kness
Curing p
rocedure
Dura
tion o
f curing
Coating
No
co
ati
ng
Coating c
om
positio
n
Surface t
reatm
ent
Nom
inal P
relo
ad leve
l110 k
N
=
Fp,C
Measuring o
f th
e p
relo
ad leve
lLoad c
ell
M16,
cla
mpin
g length
t
= 7
7 m
m
load h
ead s
peed
0,0
01 m
m/s
ec
Tim
e b
etw
een a
pplic
ation c
oating a
nd t
esting
Specim
en
Sta
ndard
test
pie
ce M
16
(EN
1090-2
, dra
win
g A
nnex G
.1 b
)
Bolt c
lass,
bolt t
ype
BU
MA
X 1
09,
full
thre
ad
spe
cim
en
Pre
lo
ad
ing
slip
fa
cto
rP
relo
ad
at
sta
rt t
est
(in
itia
l p
re l
oa
d)
at
rea
ch
ing
sli
p c
rite
rio
n
sta
rt t
est
oute
r
Bolt
inner
Bolt
oute
r bolt
inner
bolt
based o
n in
itial
pre
load
based o
n p
relo
ad
at re
achin
g s
lip
crite
rion
test
du
rati
on
Equations fro
m E
N 1
090-2
annex G
AS
_02
16.1
1.1
6 1
6:1
5
AS
_01
16.1
1.1
6 1
4:1
2
AS
_05
17.1
1.1
6 1
6:3
4
Static load
AS
_04
17.1
1.1
6 1
2:2
0
AS
_03
17.1
1.1
6 1
0:1
5
Statistics
(4 specimen,
8 test results)
Statistics
(5 specimen,
10 test results)
Chara
cte
ristic v
alu
e s
lip facto
r
DelftU
niv
ers
ityofTechnolo
gy
Depart
ment
ofC
ivil
Engin
eering
and
Geoscie
nces
Macro
Lab
Ste
vin
we
g 1
26
28
CN
De
lft
Th
e N
eth
erl
an
ds
Ph
on
e: +
31
(0
)15
27
84
03
4
E-M
ail:
p.a
.de
vrie
s@
tud
elft.n
l

Project No.: 410410007-20003 | Report No.: 2018-06
Slip factors for typical stainless steel surface finishes and new types of coatings for stainless steel
59 23.03.2018
Table D3 Test protocol A_GB test series
AG
0,0
01
CB
G2
8.0
3.2
01
8
grit
bla
ste
d
slip
Sli
p l
oa
dco
mm
en
tte
st d
ate
mark
pla
te ID
's(a
ve
rag
e a
t C
BG
)based o
n n
om
inal
pre
load
avera
ge
Fp,C
[k
N]
avera
ge
110
ui
FS
iF
bi,o,ini
mean F
bi,in
iF
bi,i,in
i
i,in
i
i
i,
no
m
i,act
Fbi,o,a
ct
mean F
bi,act
Fbi,i,act
t
AG
: A
ust.
grit
bla
ste
d[m
m]
[kN
][k
N]
[kN
][k
N]
[–]
[–]
[–]
[kN
][k
N]
[kN
][m
in]
00,1
50
244
108
109
109
0,5
60,5
50,6
299
98
97
59,7
0,0
0
00,1
50
218
108
108
109
0,5
10,5
00,5
5100
100
100
27,1
0,0
0
00,1
50
276
107
107
107
0,6
40,6
30,7
397
94
92
41,8
0,0
0
00,1
50
273
108
107
107
0,6
40,6
20,7
298
95
92
40,3
0,0
0
00,1
50
249
107
108
108
0,5
80,5
70,6
498
98
97
33,7
0,0
0
00,1
50
250
108
108
108
0,5
80,5
70,6
498
97
96
35,6
0,0
0
00,1
50
254
108
109
109
0,5
90,5
80,6
599
98
96
35,2
0,0
0
00,1
50
248
108
108
109
0,5
70,5
60,6
498
97
96
33,2
0,0
0
n=
8num
ber
of te
sts
max
Maxim
um
276
0,6
40,6
30,7
359,7
min
Min
imum
218
SS
WL t
est
dF
(5%
)0,5
10,5
00,5
527,1
mean
Ave
rage
FS
m |
m252
151
12,5
80,5
80,5
70,6
538,3
Eq.
(2),
Eq.
(4)
Rspre
ad
57,2
0,1
40,1
30,1
932,6
R =
max
– m
in
ssta
ndard
devi
ation
17,7
0,0
43
0,0
40
0,0
57
9,7
Eq.
(3),
Eq.
(5)
Vcoeffi
cie
nt
of va
riation
7,0
%7,3
%7,0
%8,8
%25%
V =
s /
mean
cre
ep
te
st0,9
FS
m226
slip
[m
m]
Load leve
l cre
ep t
est
[kN
]
00,1
50
272
109
109
108
0,6
30,6
20,7
198
96
94
2,3
226
00,1
50
266
108
108
108
0,6
10,6
00,6
998
97
95
2,6
NO
T p
assed
n=
10
num
ber
of te
sts
resu
lt
max
Maxim
um
276
0,6
40,6
30,7
3fa
iled
D s
lip <
2 m
m in 3
h.
min
Min
imum
218
0,5
10,5
00,5
5
mean
Ave
rage
FS
m |
m276
0,5
90,5
80,6
6E
q.
(2),
Eq.
(4)
Rspre
ad
57,2
0,1
40,1
30,1
9R
= m
ax
– m
in
ssta
ndard
devi
ation
17,3
0,0
41
0,0
39
0,0
55
Eq.
(3),
Eq.
(5)
Vcoeffi
cie
nt
of va
riation
6,8
%7,0
%6,8
%8,3
%V
= s
/ m
ean 8
%
k
--
-E
q.
(6)
Test
pro
toco
l
basics slip fator experiment
Teste
d a
ccord
ing t
oE
N 1
090-2
:2011-1
0 –
Annex G
s
lip c
rite
rion u
sed:
0.1
5 m
m a
t C
entr
e B
olt G
roup
Test
date
test
perform
ed b
yF
. S
chilp
ero
ord
Ste
el
Sta
inle
ss,
Auste
nitic
Maxim
um
coating t
hic
kness
Curing p
rocedure
Dura
tion o
f curing
Coating
No
co
ati
ng
Coating c
om
positio
n
Surface t
reatm
ent
Nom
inal P
relo
ad leve
l110 k
N
=
Fp,C
Measuring o
f th
e p
relo
ad leve
lLoad c
ell
M16,
cla
mpin
g length
t
= 7
7 m
m
load h
ead s
peed
0,0
01 m
m/s
ec
Tim
e b
etw
een a
pplic
ation c
oating a
nd t
esting
Specim
en
Sta
ndard
test
pie
ce M
16
(EN
1090-2
, dra
win
g A
nnex G
.1 b
)
Bolt c
lass,
bolt t
ype
BU
MA
X 1
09,
full
thre
ad
spe
cim
en
Pre
lo
ad
ing
slip
fa
cto
rP
relo
ad
test
du
rati
on
at
sta
rt t
est
(in
itia
l p
re l
oa
d)
based o
n in
itial
pre
load
based o
n p
relo
ad
at re
achin
g s
lip
crite
rion
at
rea
ch
ing
sli
p c
rite
rio
nE
quations fro
m E
N 1
090-2
annex G
sta
rt t
est
oute
r
Bolt
inner
Bolt
oute
r bolt
inner
bolt
AG
_02
21.1
1.1
6 1
2:3
7
Static load
AG
_01
21.1
1.1
6 1
0:3
3
Statistics
(4 specimen,
8 test results)
AG
_03
21.1
1.1
6 1
4:2
7
AG
_04
21.1
1.1
6 1
6:1
4
AG
_05
22.1
1.1
6 1
5:3
8
Statistics
(5 specimen,
10 test results)
Chara
cte
ristic v
alu
e s
lip facto
r
DelftU
niv
ers
ityofTechnolo
gy
Depart
ment
ofC
ivil
Engin
eering
and
Geoscie
nces
Macro
Lab
Ste
vin
we
g 1
26
28
CN
De
lft
Th
e N
eth
erl
an
ds
Ph
on
e: +
31
(0
)15
27
84
03
4
E-M
ail:
p.a
.de
vrie
s@
tud
elft.n
l

Project No.: 410410007-20003 | Report No.: 2018-06
Slip factors for typical stainless steel surface finishes and new types of coatings for stainless steel
23.03.2018
60
Table D4 Test protocol D_GB test series
DG
0,0
02
CB
G2
8.0
3.2
01
8
grit
bla
ste
d
slip
Sli
p l
oa
dco
mm
en
tte
st d
ate
mark
pla
te ID
's(a
ve
rag
e a
t C
BG
)based o
n n
om
inal
pre
load
avera
ge
Fp,C
[k
N]
avera
ge
110
ui
FS
iF
bi,o,ini
mean F
bi,in
iF
bi,i,in
i
i,in
i
i
i,
no
m
i,act
Fbi,o,a
ct
mean F
bi,act
Fbi,i,act
t
DG
: D
uple
x g
rit
bla
ste
d[m
m]
[kN
][k
N]
[kN
][k
N]
[–]
[–]
[–]
[kN
][k
N]
[kN
][m
in]
00,1
50
288
110
110
110
0,6
60,6
60,6
9105
105
104
16,5
0,0
0
00,1
50
293
110
110
110
0,6
60,6
70,7
0105
105
104
18,1
0,0
0
00,1
50
288
111
111
110
0,6
50,6
50,6
8106
105
104
21,0
0,0
0
00,1
50
279
110
110
110
0,6
30,6
30,6
6106
105
105
15,3
0,0
0
00,1
50
305
111
110
110
0,6
90,6
90,7
2106
105
104
18,3
0,0
0
00,1
50
302
110
110
110
0,6
90,6
90,7
2105
105
104
18,1
0,0
0
00,1
50
285
110
110
110
0,6
50,6
50,6
8106
105
105
16,1
0,0
0
00,1
50
283
111
111
111
0,6
40,6
40,6
7106
106
105
15,9
0,0
0
n=
8num
ber
of te
sts
max
Maxim
um
305
0,6
90,6
90,7
221,0
min
Min
imum
279
SS
WL t
est
dF
(5%
)0,6
30,6
30,6
615,3
mean
Ave
rage
FS
m |
m290
174
14,5
0,6
60,6
60,6
917,4
Eq.
(2),
Eq.
(4)
Rspre
ad
25,8
0,0
60,0
60,0
65,7
R =
max
– m
in
ssta
ndard
devi
ation
9,0
0,0
21
0,0
20
0,0
22
1,8
Eq.
(3),
Eq.
(5)
Vcoeffi
cie
nt
of va
riation
3,1
%3,2
%3,1
%3,2
%11%
V =
s /
mean
cre
ep
te
st0,9
FS
m261
slip
[m
m]
Load leve
l cre
ep t
est
[kN
]
00,1
50
309
110
110
109
0,7
10,7
00,7
5104
103
102
1,0
261
00,1
50
289
109
110
110
0,6
60,6
60,7
0104
104
104
1,2
passed
n=
10
num
ber
of te
sts
resu
lt
max
Maxim
um
309
0,7
10,7
00,7
5passed
D s
lip <
2 m
m in 3
h.
min
Min
imum
279
0,6
30,6
30,6
6
mean
Ave
rage
FS
m |
m309
0,6
60,6
60,7
0E
q.
(2),
Eq.
(4)
Rspre
ad
30,4
0,0
70,0
70,0
9R
= m
ax
– m
in
ssta
ndard
devi
ation
10,0
0,0
24
0,0
23
0,0
27
Eq.
(3),
Eq.
(5)
Vcoeffi
cie
nt
of va
riation
3,4
%3,6
%3,4
%3,9
%V
= s
/ m
ean 8
%
k
0,6
10,6
20,6
4E
q.
(6)
Chara
cte
ristic v
alu
e s
lip facto
r
Statistics
(4 specimen,
8 test results)
DG
_05
24.1
1.1
6 1
2:0
0
Statistics
(5 specimen,
10 test results)
DG
_02
23.1
1.1
6 1
1:1
8
23.1
1.1
6 9
:58
DG
_04
23.1
1.1
6 1
4:3
3
Static load
DG
_01
DG
_03
23.1
1.1
6 1
2:5
8
oute
r
Bolt
inner
Bolt
Bolt c
lass,
bolt t
ype
BU
MA
X 1
09,
full
thre
ad
Specim
en
Sta
ndard
test
pie
ce M
16
(EN
1090-2
, dra
win
g A
nnex G
.1 b
)
Nom
inal P
relo
ad leve
l110 k
N
=
Fp,C
Measuring o
f th
e p
relo
ad leve
lLoad c
ell
M16,
cla
mpin
g length
t
= 7
7 m
m
load h
ead s
peed
0,0
02 m
m/s
ec
at
sta
rt t
est
(in
itia
l p
re l
oa
d)
based o
n in
itial
pre
load
based o
n p
relo
ad
at re
achin
g s
lip
crite
rion
at
rea
ch
ing
sli
p c
rite
rio
nE
quations fro
m E
N 1
090-2
annex G
sta
rt t
est
spe
cim
en
Pre
lo
ad
ing
slip
fa
cto
rP
relo
ad
test
du
rati
on
oute
r bolt
inner
bolt
Test
pro
toco
lbasics slip fator experiment
Teste
d a
ccord
ing t
oE
N 1
090-2
:2011-1
0 –
Annex G
s
lip c
rite
rion u
sed:
0.1
5 m
m a
t C
entr
e B
olt G
roup
Test
date
test
perform
ed b
yF
. S
chilp
ero
ord
Ste
el
Sta
inle
ss,
Duple
x
Maxim
um
coating t
hic
kness
Curing p
rocedure
Coating
No
co
ati
ng
Coating c
om
positio
n
Surface t
reatm
ent
Dura
tion o
f curing
Tim
e b
etw
een a
pplic
ation c
oating a
nd t
esting
DelftU
niv
ers
ityofTechnolo
gy
Depart
ment
ofC
ivil
Engin
eering
and
Geoscie
nces
Macro
Lab
Ste
vin
we
g 1
26
28
CN
De
lft
Th
e N
eth
erl
an
ds
Ph
on
e: +
31
(0
)15
27
84
03
4
E-M
ail:
p.a
.de
vrie
s@
tud
elft.n
l
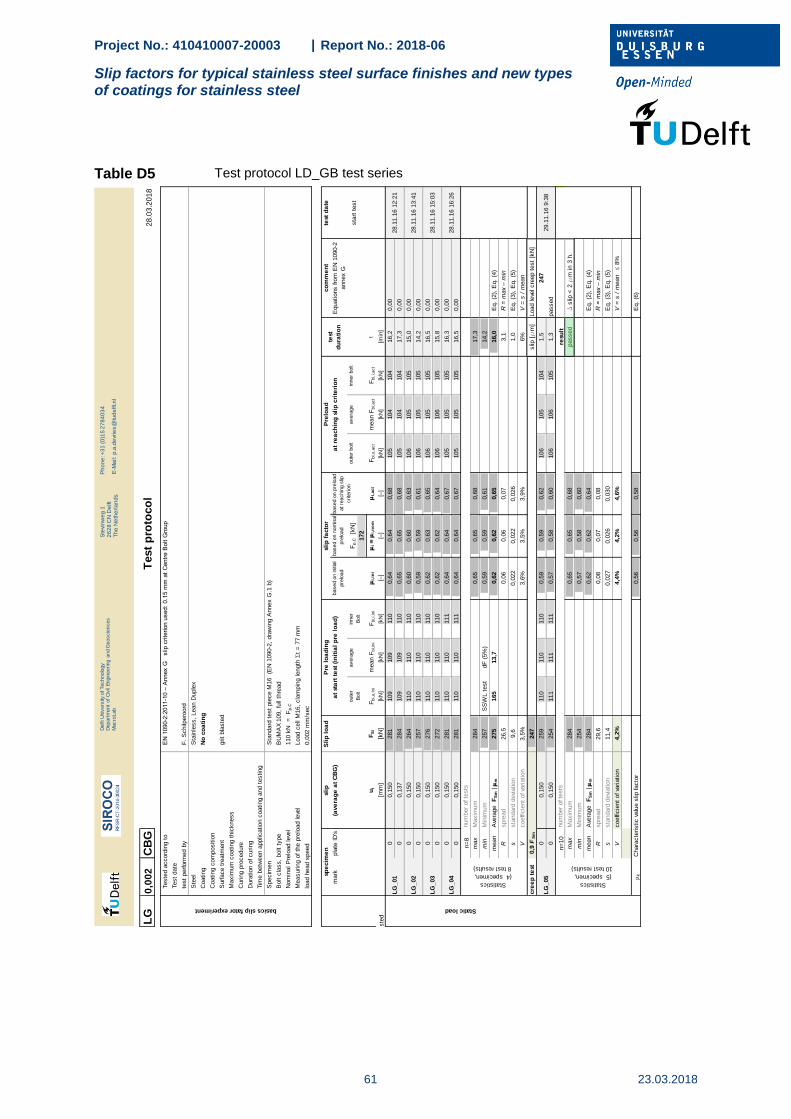
Project No.: 410410007-20003 | Report No.: 2018-06
Slip factors for typical stainless steel surface finishes and new types of coatings for stainless steel
61 23.03.2018
Table D5 Test protocol LD_GB test series
LG
0,0
02
CB
G2
8.0
3.2
01
8
grit
bla
ste
d
slip
Sli
p l
oa
dco
mm
en
tte
st d
ate
mark
pla
te ID
's(a
ve
rag
e a
t C
BG
)based o
n n
om
inal
pre
load
avera
ge
Fp,C
[k
N]
avera
ge
172
ui
FS
iF
bi,o,ini
mean F
bi,in
iF
bi,i,in
i
i,in
i
i
i,
no
m
i,act
Fbi,o,a
ct
mean F
bi,act
Fbi,i,act
t
LG
: LeanD
grit
bla
ste
d[m
m]
[kN
][k
N]
[kN
][k
N]
[–]
[–]
[–]
[kN
][k
N]
[kN
][m
in]
00,1
50
281
109
109
110
0,6
40,6
40,6
8105
104
104
16,2
0,0
0
00,1
37
284
109
109
110
0,6
50,6
50,6
8105
104
104
17,3
0,0
0
00,1
50
264
110
110
110
0,6
00,6
00,6
3106
105
105
15,0
0,0
0
00,1
50
257
110
110
110
0,5
90,5
90,6
1106
105
105
14,2
0,0
0
00,1
50
276
110
110
110
0,6
20,6
30,6
5106
105
105
16,5
0,0
0
00,1
50
272
110
110
110
0,6
20,6
20,6
4106
106
105
15,8
0,0
0
00,1
50
281
110
110
111
0,6
40,6
40,6
7105
105
105
16,3
0,0
0
00,1
50
281
110
110
111
0,6
40,6
40,6
7105
105
105
16,5
0,0
0
n=
8num
ber
of te
sts
max
Maxim
um
284
0,6
50,6
50,6
817,3
min
Min
imum
257
SS
WL t
est
dF
(5%
)0,5
90,5
90,6
114,2
mean
Ave
rage
FS
m |
m275
165
13,7
0,6
20,6
20,6
516,0
Eq.
(2),
Eq.
(4)
Rspre
ad
26,5
0,0
60,0
60,0
73,1
R =
max
– m
in
ssta
ndard
devi
ation
9,6
0,0
22
0,0
22
0,0
26
1,0
Eq.
(3),
Eq.
(5)
Vcoeffi
cie
nt
of va
riation
3,5
%3,6
%3,5
%3,9
%6%
V =
s /
mean
cre
ep
te
st0,9
FS
m247
slip
[m
m]
Load leve
l cre
ep t
est
[kN
]
00,1
50
259
110
110
110
0,5
90,5
90,6
2106
105
104
1,5
247
00,1
50
254
111
111
111
0,5
70,5
80,6
0106
106
105
1,3
passed
n=
10
num
ber
of te
sts
resu
lt
max
Maxim
um
284
0,6
50,6
50,6
8passed
D s
lip <
2 m
m in 3
h.
min
Min
imum
254
0,5
70,5
80,6
0
mean
Ave
rage
FS
m |
m284
0,6
20,6
20,6
4E
q.
(2),
Eq.
(4)
Rspre
ad
29,6
0,0
80,0
70,0
8R
= m
ax
– m
in
ssta
ndard
devi
ation
11,4
0,0
27
0,0
26
0,0
30
Eq.
(3),
Eq.
(5)
Vcoeffi
cie
nt
of va
riation
4,2
%4,4
%4,2
%4,6
%V
= s
/ m
ean 8
%
k
0,5
60,5
60,5
8E
q.
(6)
Statistics
(4 specimen,
8 test results)
Test
pro
toco
l
basics slip fator experiment
Teste
d a
ccord
ing t
oE
N 1
090-2
:2011-1
0 –
Annex G
s
lip c
rite
rion u
sed:
0.1
5 m
m a
t C
entr
e B
olt G
roup
Test
date
test
perform
ed b
yF
. S
chilp
ero
ord
Ste
el
Sta
inle
ss,
Lean D
uple
x
Maxim
um
coating t
hic
kness
Curing p
rocedure
Dura
tion o
f curing
Coating
No
co
ati
ng
Coating c
om
positio
n
Surface t
reatm
ent
Nom
inal P
relo
ad leve
l110 k
N
=
Fp,C
Measuring o
f th
e p
relo
ad leve
lLoad c
ell
M16,
cla
mpin
g length
t
= 7
7 m
m
load h
ead s
peed
0,0
02 m
m/s
ec
Tim
e b
etw
een a
pplic
ation c
oating a
nd t
esting
Specim
en
Sta
ndard
test
pie
ce M
16
(EN
1090-2
, dra
win
g A
nnex G
.1 b
)
Bolt c
lass,
bolt t
ype
BU
MA
X 1
09,
full
thre
ad
spe
cim
en
Pre
lo
ad
ing
slip
fa
cto
rP
relo
ad
test
du
rati
on
at
sta
rt t
est
(in
itia
l p
re l
oa
d)
based o
n in
itial
pre
load
based o
n p
relo
ad
at re
achin
g s
lip
crite
rion
at
rea
ch
ing
sli
p c
rite
rio
nE
quations fro
m E
N 1
090-2
annex G
sta
rt t
est
oute
r
Bolt
inner
Bolt
oute
r bolt
inner
bolt
LG
_04
28.1
1.1
6 1
6:2
6
Static load
LG
_01
28.1
1.1
6 1
2:2
1
LG
_05
29.1
1.1
6 9
:38
Statistics
(5 specimen,
10 test results)
Chara
cte
ristic v
alu
e s
lip facto
r
LG
_02
28.1
1.1
6 1
3:4
1
LG
_03
28.1
1.1
6 1
5:0
3
DelftU
niv
ers
ityofTechnolo
gy
Depart
ment
ofC
ivil
Engin
eering
and
Geoscie
nces
Macro
Lab
Ste
vin
we
g 1
26
28
CN
De
lft
Th
e N
eth
erl
an
ds
Ph
on
e: +
31
(0
)15
27
84
03
4
E-M
ail:
p.a
.de
vrie
s@
tud
elft.n
l
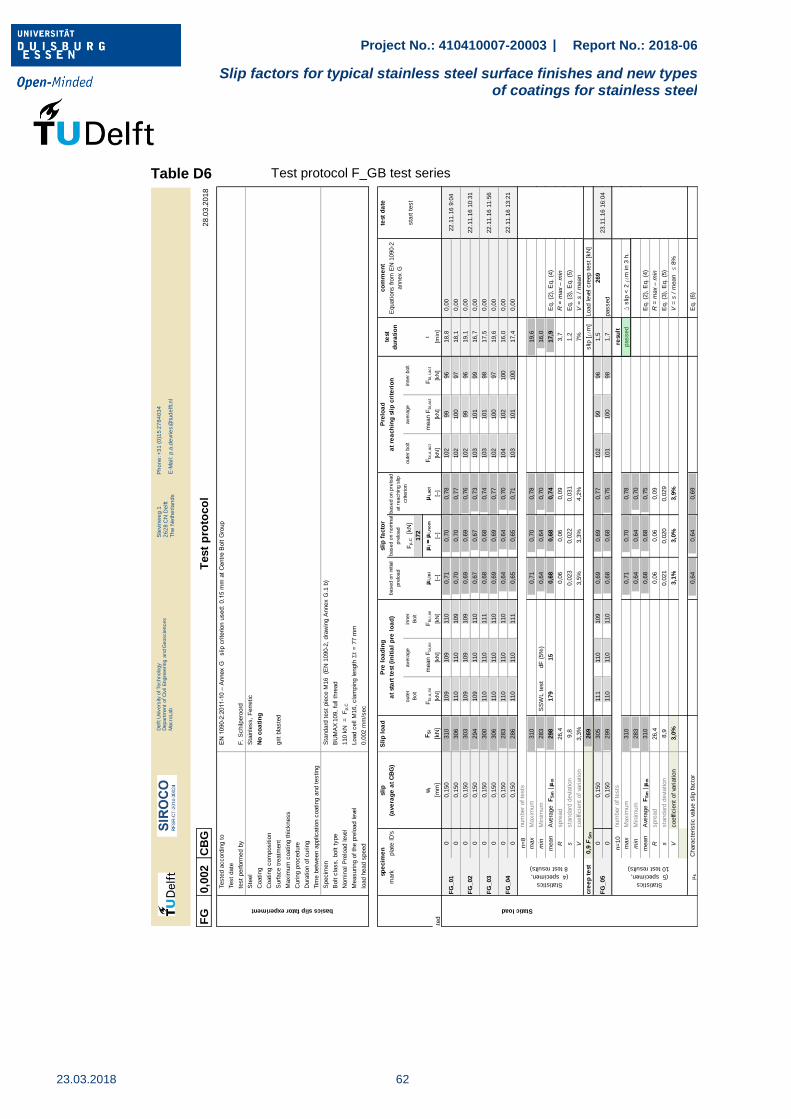
Project No.: 410410007-20003 | Report No.: 2018-06
Slip factors for typical stainless steel surface finishes and new types of coatings for stainless steel
23.03.2018
62
Table D6 Test protocol F_GB test series
FG
0,0
02
CB
G2
8.0
3.2
01
8
grit
bla
ste
d
slip
Sli
p l
oa
dco
mm
en
tte
st d
ate
mark
pla
te ID
's(a
ve
rag
e a
t C
BG
)based o
n n
om
inal
pre
load
avera
ge
Fp,C
[k
N]
avera
ge
172
ui
FS
iF
bi,o,ini
mean F
bi,in
iF
bi,i,in
i
i,in
i
i
i,
no
m
i,act
Fbi,o,a
ct
mean F
bi,act
Fbi,i,act
t
FG
: F
err
. grit
bla
ste
d[m
m]
[kN
][k
N]
[kN
][k
N]
[–]
[–]
[–]
[kN
][k
N]
[kN
][m
in]
00,1
50
310
109
109
110
0,7
10,7
00,7
8102
99
96
18,8
0,0
0
00,1
50
306
110
110
109
0,7
00,7
00,7
7102
100
97
18,1
0,0
0
00,1
50
303
109
109
109
0,6
90,6
90,7
6102
99
96
19,1
0,0
0
00,1
50
294
109
110
110
0,6
70,6
70,7
3103
101
99
16,7
0,0
0
00,1
50
300
110
110
111
0,6
80,6
80,7
4103
101
98
17,5
0,0
0
00,1
50
306
110
110
110
0,6
90,6
90,7
7102
100
97
19,6
0,0
0
00,1
50
283
110
110
110
0,6
40,6
40,7
0104
102
100
16,0
0,0
0
00,1
50
286
110
110
111
0,6
50,6
50,7
1103
101
100
17,4
0,0
0
n=
8num
ber
of te
sts
max
Maxim
um
310
0,7
10,7
00,7
819,6
min
Min
imum
283
SS
WL t
est
dF
(5%
)0,6
40,6
40,7
016,0
mean
Ave
rage
FS
m |
m298
179
15
0,6
80,6
80,7
417,9
Eq.
(2),
Eq.
(4)
Rspre
ad
26,4
0,0
60,0
60,0
93,7
R =
max
– m
in
ssta
ndard
devi
ation
9,8
0,0
23
0,0
22
0,0
31
1,2
Eq.
(3),
Eq.
(5)
Vcoeffi
cie
nt
of va
riation
3,3
%3,5
%3,3
%4,2
%7%
V =
s /
mean
cre
ep
te
st0,9
FS
m269
slip
[m
m]
Load leve
l cre
ep t
est
[kN
]
00,1
50
305
111
110
109
0,6
90,6
90,7
7102
99
96
1,5
269
00,1
50
299
110
110
110
0,6
80,6
80,7
5101
100
98
1,7
passed
n=
10
num
ber
of te
sts
resu
lt
max
Maxim
um
310
0,7
10,7
00,7
8passed
D s
lip <
2 m
m in 3
h.
min
Min
imum
283
0,6
40,6
40,7
0
mean
Ave
rage
FS
m |
m310
0,6
80,6
80,7
5E
q.
(2),
Eq.
(4)
Rspre
ad
26,4
0,0
60,0
60,0
9R
= m
ax
– m
in
ssta
ndard
devi
ation
8,9
0,0
21
0,0
20
0,0
29
Eq.
(3),
Eq.
(5)
Vcoeffi
cie
nt
of va
riation
3,0
%3,1
%3,0
%3,9
%V
= s
/ m
ean 8
%
k
0,6
40,6
40,6
9E
q.
(6)
Statistics
(5 specimen,
10 test results)
Chara
cte
ristic v
alu
e s
lip facto
r
Statistics
(4 specimen,
8 test results)
FG
_05
23.1
1.1
6 1
6:0
4
Static load
FG
_01
22.1
1.1
6 9
:04
FG
_02
22.1
1.1
6 1
0:3
1
FG
_04
22.1
1.1
6 1
3:2
1
FG
_03
22.1
1.1
6 1
1:5
6
spe
cim
en
Pre
lo
ad
ing
slip
fa
cto
rP
relo
ad
test
du
rati
on
at
sta
rt t
est
(in
itia
l p
re l
oa
d)
based o
n in
itial
pre
load
based o
n p
relo
ad
at re
achin
g s
lip
crite
rion
at
rea
ch
ing
sli
p c
rite
rio
nE
quations fro
m E
N 1
090-2
annex G
sta
rt t
est
oute
r
Bolt
inner
Bolt
oute
r bolt
inner
bolt
Load c
ell
M16,
cla
mpin
g length
t
= 7
7 m
m
load h
ead s
peed
0,0
02 m
m/s
ec
Tim
e b
etw
een a
pplic
ation c
oating a
nd t
esting
Specim
en
Sta
ndard
test
pie
ce M
16
(EN
1090-2
, dra
win
g A
nnex G
.1 b
)
Bolt c
lass,
bolt t
ype
BU
MA
X 1
09,
full
thre
ad
Test
pro
toco
lbasics slip fator experiment
Teste
d a
ccord
ing t
oE
N 1
090-2
:2011-1
0 –
Annex G
s
lip c
rite
rion u
sed:
0.1
5 m
m a
t C
entr
e B
olt G
roup
Test
date
test
perform
ed b
yF
. S
chilp
ero
ord
Ste
el
Sta
inle
ss,
Ferr
etic
Maxim
um
coating t
hic
kness
Curing p
rocedure
Dura
tion o
f curing
Coating
No
co
ati
ng
Coating c
om
positio
n
Surface t
reatm
ent
Nom
inal P
relo
ad leve
l110 k
N
=
Fp,C
Measuring o
f th
e p
relo
ad leve
l
DelftU
niv
ers
ityofTechnolo
gy
Depart
ment
ofC
ivil
Engin
eering
and
Geoscie
nces
Macro
Lab
Ste
vin
we
g 1
26
28
CN
De
lft
Th
e N
eth
erl
an
ds
Ph
on
e: +
31
(0
)15
27
84
03
4
E-M
ail:
p.a
.de
vrie
s@
tud
elft.n
l
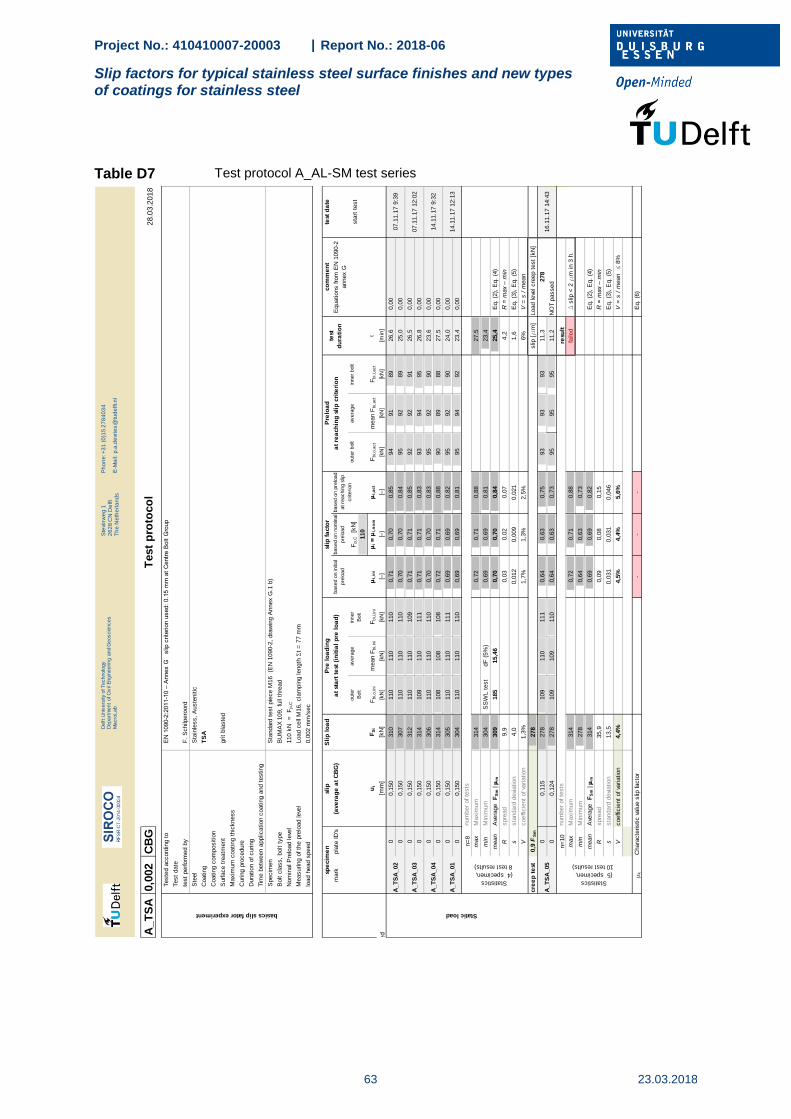
Project No.: 410410007-20003 | Report No.: 2018-06
Slip factors for typical stainless steel surface finishes and new types of coatings for stainless steel
63 23.03.2018
Table D7 Test protocol A_AL-SM test series
A_T
SA
0,0
02
CB
G2
8.0
3.2
01
8
grit
bla
ste
d
slip
Sli
p l
oa
dco
mm
en
tte
st d
ate
mark
pla
te ID
's(a
ve
rag
e a
t C
BG
)based o
n n
om
inal
pre
load
avera
ge
Fp,C
[k
N]
avera
ge
110
ui
FS
iF
bi,o,ini
mean F
bi,in
iF
bi,i,in
i
i,in
i
i
i,
no
m
i,act
Fbi,o,a
ct
mean F
bi,act
Fbi,i,act
t
A_TS
A:
Aust.
grit
bla
ste
d[m
m]
[kN
][k
N]
[kN
][k
N]
[–]
[–]
[–]
[kN
][k
N]
[kN
][m
in]
00,1
50
310
110
110
110
0,7
10,7
00,8
594
91
89
26,6
0,0
0
00,1
50
307
110
110
110
0,7
00,7
00,8
495
92
89
25,0
0,0
0
00,1
50
312
110
110
109
0,7
10,7
10,8
592
92
91
26,5
0,0
0
00,1
50
314
109
110
111
0,7
10,7
10,8
393
94
95
26,8
0,0
0
00,1
50
306
110
110
110
0,7
00,7
00,8
395
92
90
23,6
0,0
0
00,1
50
314
108
108
108
0,7
20,7
10,8
890
89
88
27,5
0,0
0
00,1
50
305
110
110
111
0,6
90,6
90,8
295
92
90
24,0
0,0
0
00,1
50
304
110
110
110
0,6
90,6
90,8
195
94
92
23,4
0,0
0
n=
8num
ber
of te
sts
max
Maxim
um
314
0,7
20,7
10,8
827,5
min
Min
imum
304
SS
WL t
est
dF
(5%
)0,6
90,6
90,8
123,4
mean
Ave
rage
FS
m |
m309
185
15,4
60,7
00,7
00,8
425,4
Eq.
(2),
Eq.
(4)
Rspre
ad
9,9
0,0
30,0
20,0
74,2
R =
max
– m
in
ssta
ndard
devi
ation
4,0
0,0
12
0,0
09
0,0
21
1,6
Eq.
(3),
Eq.
(5)
Vcoeffi
cie
nt
of va
riation
1,3
%1,7
%1,3
%2,5
%6%
V =
s /
mean
cre
ep
te
st0,9
FS
m278
slip
[m
m]
Load leve
l cre
ep t
est
[kN
]
00,1
15
278
109
110
111
0,6
40,6
30,7
593
93
93
11,3
278
00,1
24
278
109
109
110
0,6
40,6
30,7
395
95
95
11,2
NO
T p
assed
n=
10
num
ber
of te
sts
resu
lt
max
Maxim
um
314
0,7
20,7
10,8
8fa
iled
D s
lip <
2 m
m in 3
h.
min
Min
imum
278
0,6
40,6
30,7
3
mean
Ave
rage
FS
m |
m314
0,6
90,6
90,8
2E
q.
(2),
Eq.
(4)
Rspre
ad
35,9
0,0
90,0
80,1
5R
= m
ax
– m
in
ssta
ndard
devi
ation
13,5
0,0
31
0,0
31
0,0
46
Eq.
(3),
Eq.
(5)
Vcoeffi
cie
nt
of va
riation
4,4
%4,5
%4,4
%5,6
%V
= s
/ m
ean 8
%
k
--
-E
q.
(6)
A_T
SA
_05
16.1
1.1
7 1
4:4
3
Statistics
(5 specimen,
10 test results)
Chara
cte
ristic v
alu
e s
lip facto
r
Static load
A_T
SA
_02
07.1
1.1
7 9
:39
Statistics
(4 specimen,
8 test results)
A_T
SA
_04
14.1
1.1
7 9
:32
A_T
SA
_01
14.1
1.1
7 1
2:1
3
A_T
SA
_03
07.1
1.1
7 1
2:0
2
spe
cim
en
Pre
lo
ad
ing
slip
fa
cto
rP
relo
ad
test
du
rati
on
at
sta
rt t
est
(in
itia
l p
re l
oa
d)
based o
n in
itial
pre
load
based o
n p
relo
ad
at re
achin
g s
lip
crite
rion
at
rea
ch
ing
sli
p c
rite
rio
nE
quations fro
m E
N 1
090-2
annex G
sta
rt t
est
oute
r
Bolt
inner
Bolt
oute
r bolt
inner
bolt
Load c
ell
M16,
cla
mpin
g length
t
= 7
7 m
m
load h
ead s
peed
0,0
02 m
m/s
ec
Tim
e b
etw
een a
pplic
ation c
oating a
nd t
esting
Specim
en
Sta
ndard
test
pie
ce M
16
(EN
1090-2
, dra
win
g A
nnex G
.1 b
)
Bolt c
lass,
bolt t
ype
BU
MA
X 1
09,
full
thre
ad
Test
pro
toco
l
basics slip fator experiment
Teste
d a
ccord
ing t
oE
N 1
090-2
:2011-1
0 –
Annex G
s
lip c
rite
rion u
sed:
0.1
5 m
m a
t C
entr
e B
olt G
roup
Test
date
test
perform
ed b
yF
. S
chilp
ero
ord
Ste
el
Sta
inle
ss,
Auste
nitic
Maxim
um
coating t
hic
kness
Curing p
rocedure
Dura
tion o
f curing
Coating
TS
A
Coating c
om
positio
n
Surface t
reatm
ent
Nom
inal P
relo
ad leve
l110 k
N
=
Fp,C
Measuring o
f th
e p
relo
ad leve
l
DelftU
niv
ers
ityofTechnolo
gy
Depart
ment
ofC
ivil
Engin
eering
and
Geoscie
nces
Macro
Lab
Ste
vin
we
g 1
26
28
CN
De
lft
Th
e N
eth
erl
an
ds
Ph
on
e: +
31
(0
)15
27
84
03
4
E-M
ail:
p.a
.de
vrie
s@
tud
elft.n
l
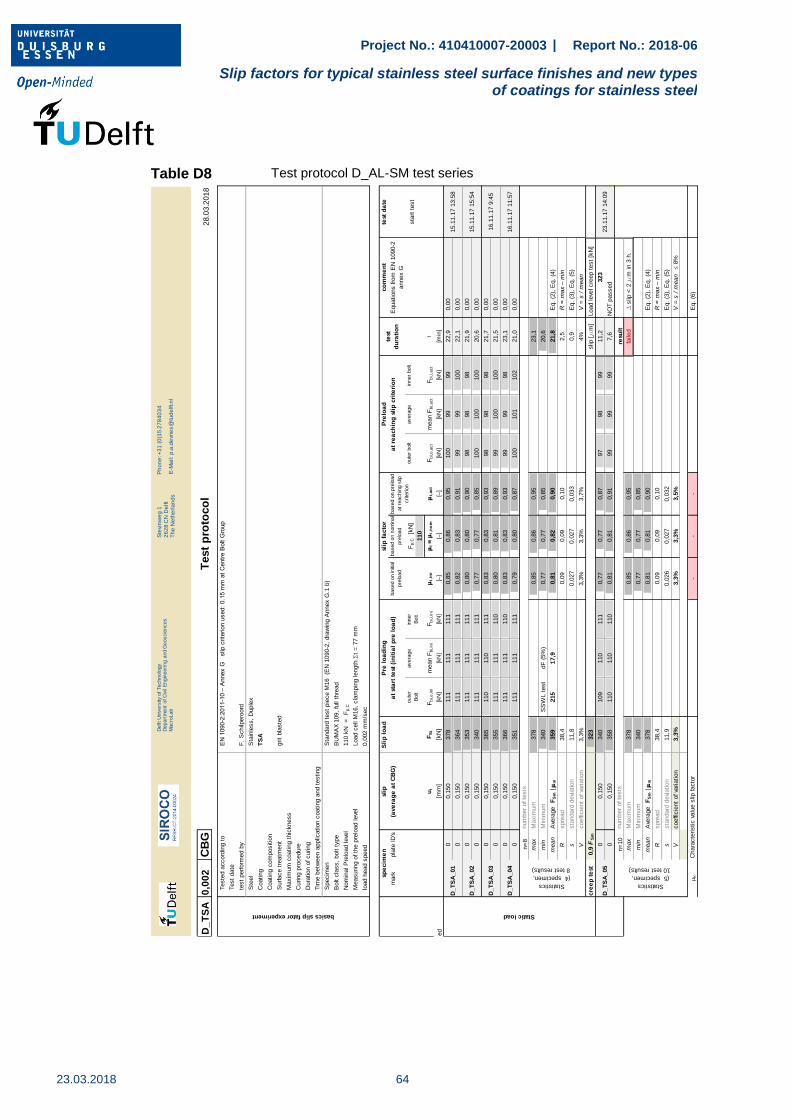
Project No.: 410410007-20003 | Report No.: 2018-06
Slip factors for typical stainless steel surface finishes and new types of coatings for stainless steel
23.03.2018
64
Table D8 Test protocol D_AL-SM test series
D_
TS
A0
,00
2C
BG
28
.03
.20
18
grit
bla
ste
d
slip
Sli
p l
oa
dco
mm
en
tte
st d
ate
mark
pla
te ID
's(a
ve
rag
e a
t C
BG
)based o
n n
om
inal
pre
load
avera
ge
Fp,C
[k
N]
avera
ge
110
ui
FS
iF
bi,o,ini
mean F
bi,in
iF
bi,i,in
i
i,in
i
i
i,
no
m
i,act
Fbi,o,a
ct
mean F
bi,act
Fbi,i,act
t
D_TS
A:
Duple
x g
rit
bla
ste
d[m
m]
[kN
][k
N]
[kN
][k
N]
[–]
[–]
[–]
[kN
][k
N]
[kN
][m
in]
00,1
50
378
111
111
111
0,8
50,8
60,9
5100
99
99
22,9
0,0
0
00,1
50
364
111
111
111
0,8
20,8
30,9
199
99
100
22,1
0,0
0
00,1
50
353
111
111
111
0,8
00,8
00,9
098
98
98
21,9
0,0
0
00,1
50
340
111
111
111
0,7
70,7
70,8
5100
100
100
20,6
0,0
0
00,1
50
365
110
110
111
0,8
30,8
30,9
398
98
98
21,7
0,0
0
00,1
50
355
111
111
110
0,8
00,8
10,8
999
100
100
21,5
0,0
0
00,1
50
366
111
111
110
0,8
30,8
30,9
399
99
98
23,1
0,0
0
00,1
50
351
111
111
111
0,7
90,8
00,8
7100
101
102
21,0
0,0
0
n=
8num
ber
of te
sts
max
Maxim
um
378
0,8
50,8
60,9
523,1
min
Min
imum
340
SS
WL t
est
dF
(5%
)0,7
70,7
70,8
520,6
mean
Ave
rage
FS
m |
m359
215
17,9
0,8
10,8
20,9
021,8
Eq.
(2),
Eq.
(4)
Rspre
ad
38,4
0,0
90,0
90,1
02,5
R =
max
– m
in
ssta
ndard
devi
ation
11,8
0,0
27
0,0
27
0,0
33
0,9
Eq.
(3),
Eq.
(5)
Vcoeffi
cie
nt
of va
riation
3,3
%3,3
%3,3
%3,7
%4%
V =
s /
mean
cre
ep
te
st0,9
FS
m323
slip
[m
m]
Load leve
l cre
ep t
est
[kN
]
00,1
50
340
109
110
111
0,7
70,7
70,8
797
98
99
11,2
323
00,1
50
358
110
110
110
0,8
10,8
10,9
199
99
99
7,6
NO
T p
assed
n=
10
num
ber
of te
sts
resu
lt
max
Maxim
um
378
0,8
50,8
60,9
5fa
iled
D s
lip <
2 m
m in 3
h.
min
Min
imum
340
0,7
70,7
70,8
5
mean
Ave
rage
FS
m |
m378
0,8
10,8
10,9
0E
q.
(2),
Eq.
(4)
Rspre
ad
38,4
0,0
90,0
90,1
0R
= m
ax
– m
in
ssta
ndard
devi
ation
11,9
0,0
26
0,0
27
0,0
32
Eq.
(3),
Eq.
(5)
Vcoeffi
cie
nt
of va
riation
3,3
%3,3
%3,3
%3,5
%V
= s
/ m
ean 8
%
k
--
-E
q.
(6)
Test
pro
toco
lbasics slip fator experiment
Teste
d a
ccord
ing t
oE
N 1
090-2
:2011-1
0 –
Annex G
s
lip c
rite
rion u
sed:
0.1
5 m
m a
t C
entr
e B
olt G
roup
Test
date
test
perform
ed b
yF
. S
chilp
ero
ord
Ste
el
Sta
inle
ss,
Duple
x
Maxim
um
coating t
hic
kness
Curing p
rocedure
Coating
TS
A
Coating c
om
positio
n
Surface t
reatm
ent
Dura
tion o
f curing
Tim
e b
etw
een a
pplic
ation c
oating a
nd t
esting
Measuring o
f th
e p
relo
ad leve
lLoad c
ell
M16,
cla
mpin
g length
t
= 7
7 m
m
load h
ead s
peed
0,0
02 m
m/s
ec
at
sta
rt t
est
(in
itia
l p
re l
oa
d)
based o
n in
itial
pre
load
based o
n p
relo
ad
at re
achin
g s
lip
crite
rion
at
rea
ch
ing
sli
p c
rite
rio
nE
quations fro
m E
N 1
090-2
annex G
sta
rt t
est
spe
cim
en
Pre
lo
ad
ing
slip
fa
cto
rP
relo
ad
test
du
rati
on
oute
r bolt
inner
bolt
oute
r
Bolt
inner
Bolt
Bolt c
lass,
bolt t
ype
BU
MA
X 1
09,
full
thre
ad
Specim
en
Sta
ndard
test
pie
ce M
16
(EN
1090-2
, dra
win
g A
nnex G
.1 b
)
Nom
inal P
relo
ad leve
l110 k
N
=
Fp,C
Static load
D_T
SA
_01
D_T
SA
_03
16.1
1.1
7 9
:45
Chara
cte
ristic v
alu
e s
lip facto
r
Statistics
(4 specimen,
8 test results)
D_T
SA
_05
23.1
1.1
7 1
4:0
9
Statistics
(5 specimen,
10 test results)
D_T
SA
_02
15.1
1.1
7 1
5:5
4
15.1
1.1
7 1
3:5
8
D_T
SA
_04
16.1
1.1
7 1
1:5
7
DelftU
niv
ers
ityofTechnolo
gy
Depart
ment
ofC
ivil
Engin
eering
and
Geoscie
nces
Macro
Lab
Ste
vin
we
g 1
26
28
CN
De
lft
Th
e N
eth
erl
an
ds
Ph
on
e: +
31
(0
)15
27
84
03
4
E-M
ail:
p.a
.de
vrie
s@
tud
elft.n
l

Project No.: 410410007-20003 | Report No.: 2018-06
Slip factors for typical stainless steel surface finishes and new types of coatings for stainless steel
65 23.03.2018
Table D9 Test protocol LD_AL-SM test series
L_T
SA
0,0
02
CB
G2
8.0
3.2
01
8
grit
bla
ste
d
slip
Sli
p l
oa
dco
mm
en
tte
st d
ate
mark
pla
te ID
's(a
ve
rag
e a
t C
BG
)based o
n n
om
inal
pre
load
avera
ge
Fp
,C
[kN
]avera
ge
110
ui
FS
iF
bi,o
,in
im
ean F
bi,in
iF
bi,i,in
i
i,in
i
i
i,
no
m
i,a
ct
Fb
i,o
,act
mean F
bi,a
ct
Fb
i,i,a
ct
t
L_TS
A:
LeanD
grit
bla
ste
d[m
m]
[kN
][k
N]
[kN
][k
N]
[–]
[–]
[–]
[kN
][k
N]
[kN
][m
in]
00,1
50
344
111
110
110
0,7
80,7
80,8
7100
99
97
21,6
0,0
0
00,1
50
369
110
111
111
0,8
30,8
40,9
299
100
100
22,8
0,0
0
00,1
50
349
111
110
110
0,7
90,7
90,8
9100
98
96
46,2
0,0
0
00,1
50
326
111
111
111
0,7
30,7
40,8
1101
101
100
19,0
0,0
0
00,1
50
340
111
111
111
0,7
70,7
70,8
5101
100
99
20,5
0,0
0
00,1
50
331
111
111
111
0,7
50,7
50,8
2101
100
100
19,6
0,0
0
00,1
50
343
111
111
111
0,7
70,7
80,8
6101
100
99
19,7
0,0
0
00,1
50
350
111
111
111
0,7
90,7
90,8
7101
100
100
20,4
0,0
0
n=
8num
ber
of te
sts
max
Maxim
um
369
0,8
30,8
40,9
246,2
min
Min
imum
326
SS
WL t
est
dF
(5%
)0,7
30,7
40,8
119,0
mean
Ave
rage
FS
m |
m344
206
17,2
0,7
80,7
80,8
623,7
Eq.
(2),
Eq.
(4)
Rspre
ad
42,5
0,1
00,1
00,1
127,2
R =
max
– m
in
ssta
ndard
devi
ation
13,0
0,0
31
0,0
30
0,0
35
9,2
Eq.
(3),
Eq.
(5)
Vcoeffi
cie
nt
of va
riation
3,8
%3,9
%3,8
%4,1
%39%
V =
s /
mean
cre
ep
te
st0,9
FS
m309
slip
[m
m]
Load leve
l cre
ep t
est
[kN
]
00,1
50
344
111
111
111
0,7
70,7
80,8
6101
100
99
8,6
309
00,1
50
355
112
111
110
0,8
00,8
10,8
8102
101
100
6,7
NO
T p
assed
n=
10
num
ber
of te
sts
resu
lt
max
Maxim
um
369
0,8
30,8
40,9
2fa
iled
D s
lip <
2 m
m in 3
h.
min
Min
imum
326
0,7
30,7
40,8
1
mean
Ave
rage
FS
m |
m369
0,7
80,7
80,8
6E
q.
(2),
Eq.
(4)
Rspre
ad
42,5
0,1
00,1
00,1
1R
= m
ax
– m
in
ssta
ndard
devi
ation
12,0
0,0
28
0,0
27
0,0
32
Eq.
(3),
Eq.
(5)
Vcoeffi
cie
nt
of va
riation
3,5
%3,6
%3,5
%3,7
%V
= s
/ m
ean 8
%
k
--
-E
q.
(6)
Static load
L_T
SA
_01
28.1
1.1
7 9
:42
L_T
SA
_05
30.1
1.1
7 1
4:0
0
Statistics
(5 specimen,
10 test results)
Chara
cte
ristic v
alu
e s
lip facto
r
L_T
SA
_02
29.1
1.1
7 9
:50
L_T
SA
_03
29.1
1.1
7 1
3:2
2
L_T
SA
_04
29.1
1.1
7 1
5:0
8
spe
cim
en
Pre
lo
ad
ing
slip
fa
cto
rP
relo
ad
test
du
rati
on
at
sta
rt t
est
(in
itia
l p
re l
oa
d)
based o
n in
itial
pre
load
based o
n p
relo
ad
at re
achin
g s
lip
crite
rion
at
rea
ch
ing
sli
p c
rite
rio
nE
quations fro
m E
N 1
090-2
annex G
sta
rt t
est
oute
r
Bolt
inner
Bolt
oute
r bolt
inner
bolt
Coating c
om
positio
n
Surface t
reatm
ent
Nom
inal P
relo
ad leve
l110 k
N
=
Fp
,C
Measuring o
f th
e p
relo
ad leve
lLoad c
ell
M16,
cla
mpin
g length
t
= 7
7 m
m
load h
ead s
peed
0,0
02 m
m/s
ec
Tim
e b
etw
een a
pplic
ation c
oating a
nd t
esting
Specim
en
Sta
ndard
test
pie
ce M
16
(EN
1090-2
, dra
win
g A
nnex G
.1 b
)
Bolt c
lass,
bolt t
ype
BU
MA
X 1
09,
full
thre
ad
Statistics
(4 specimen,
8 test results)
Test
pro
toco
l
basics slip fator experiment
Teste
d a
ccord
ing t
oE
N 1
090-2
:2011-1
0 –
Annex G
s
lip c
rite
rion u
sed:
0.1
5 m
m a
t C
entr
e B
olt G
roup
Test
date
test
perform
ed b
yF
. S
chilp
ero
ord
Ste
el
Sta
inle
ss,
Lean D
uple
x
Maxim
um
coating t
hic
kness
Curing p
rocedure
Dura
tion o
f curing
Coating
TS
A
DelftU
niv
ers
ityofTechnolo
gy
Depart
ment
ofC
ivil
Engin
eering
and
Geoscie
nces
Macro
Lab
Ste
vin
we
g 1
26
28
CN
De
lft
Th
e N
eth
erl
an
ds
Ph
on
e: +
31
(0
)15
27
84
03
4
E-M
ail:
p.a
.de
vrie
s@
tud
elft.n
l

Project No.: 410410007-20003 | Report No.: 2018-06
Slip factors for typical stainless steel surface finishes and new types of coatings for stainless steel
23.03.2018
66
Table D10 Test protocol F_AL-SM test series
F_T
SA
0,0
02
CB
G2
8.0
3.2
01
8
grit
bla
ste
d
slip
Sli
p l
oa
dco
mm
en
tte
st d
ate
mark
pla
te ID
's(a
ve
rag
e a
t C
BG
)based o
n n
om
inal
pre
load
avera
ge
Fp
,C
[kN
]avera
ge
110
ui
FS
iF
bi,o
,in
im
ean F
bi,in
iF
bi,i,in
i
i,in
i
i
i,
no
m
i,a
ct
Fb
i,o
,act
mean F
bi,a
ct
Fb
i,i,a
ct
t
[mm
][k
N]
[kN
][k
N]
[kN
][–
][–
][–
][k
N]
[kN
][k
N]
[min
]
00,1
50
343
111
110
110
0,7
80,7
80,9
296
93
90
21,8
0,0
0
00,1
50
332
110
110
110
0,7
50,7
60,8
797
95
94
20,3
0,0
0
00,1
50
336
110
110
111
0,7
60,7
60,9
195
93
90
20,9
0,0
0
00,1
50
329
109
110
110
0,7
50,7
50,8
796
94
93
20,1
0,0
0
00,1
50
334
109
110
111
0,7
60,7
60,8
897
94
92
20,7
0,0
0
00,1
50
343
110
110
110
0,7
80,7
80,9
197
95
92
22,1
0,0
0
00,1
50
335
112
111
111
0,7
50,7
60,8
898
95
92
21,4
0,0
0
00,1
50
328
110
110
111
0,7
40,7
50,8
697
96
94
20,5
0,0
0
n=
8num
ber
of te
sts
max
Maxim
um
343
0,7
80,7
80,9
222,1
min
Min
imum
328
SS
WL t
est
dF
(5%
)0,7
40,7
50,8
620,1
mean
Ave
rage
FS
m |
m335
201
17
0,7
60,7
60,8
921,0
Eq.
(2),
Eq.
(4)
Rspre
ad
14,6
0,0
40,0
30,0
62,1
R =
max
– m
in
ssta
ndard
devi
ation
5,6
0,0
13
0,0
13
0,0
21
0,7
Eq.
(3),
Eq.
(5)
Vcoeffi
cie
nt
of va
riation
1,7
%1,7
%1,7
%2,4
%3%
V =
s /
mean
cre
ep
te
st0,9
FS
m301
slip
[m
m]
Load leve
l cre
ep t
est
[kN
]
00,1
50
301
111
111
111
0,6
80,6
80,7
7100
98
96
35,5
301
00,1
50
314
110
111
111
0,7
10,7
10,8
297
96
95
14,1
NO
T p
assed
n=
10
num
ber
of te
sts
resu
lt
max
Maxim
um
343
0,7
80,7
80,9
2fa
iled
D s
lip <
2 m
m in 3
h.
min
Min
imum
301
0,6
80,6
80,7
7
mean
Ave
rage
FS
m |
m343
0,7
50,7
50,8
7E
q.
(2),
Eq.
(4)
Rspre
ad
41,6
0,1
00,0
90,1
5R
= m
ax
– m
in
ssta
ndard
devi
ation
12,9
0,0
31
0,0
29
0,0
45
Eq.
(3),
Eq.
(5)
Vcoeffi
cie
nt
of va
riation
3,9
%4,1
%3,9
%5,1
%V
= s
/ m
ean 8
%
k
--
-E
q.
(6)
Test
pro
toco
lbasics slip fator experiment
Teste
d a
ccord
ing t
oE
N 1
090-2
:2011-1
0 –
Annex G
s
lip c
rite
rion u
sed:
0.1
5 m
m a
t C
entr
e B
olt G
roup
Test
date
test
perform
ed b
yF
. S
chilp
ero
ord
Ste
el
Sta
inle
ss,
Ferr
etic
Maxim
um
coating t
hic
kness
Curing p
rocedure
Dura
tion o
f curing
Coating
TS
A
Coating c
om
positio
n
Surface t
reatm
ent
Nom
inal P
relo
ad leve
l110 k
N
=
Fp
,C
Measuring o
f th
e p
relo
ad leve
lLoad c
ell
M16,
cla
mpin
g length
t
= 7
7 m
m
load h
ead s
peed
0,0
02 m
m/s
ec
Tim
e b
etw
een a
pplic
ation c
oating a
nd t
esting
Specim
en
Sta
ndard
test
pie
ce M
16
(EN
1090-2
, dra
win
g A
nnex G
.1 b
)
Bolt c
lass,
bolt t
ype
BU
MA
X 1
09,
full
thre
ad
spe
cim
en
Pre
lo
ad
ing
slip
fa
cto
rP
relo
ad
test
du
rati
on
at
sta
rt t
est
(in
itia
l p
re l
oa
d)
based o
n in
itial
pre
load
based o
n p
relo
ad
at re
achin
g s
lip
crite
rion
at
rea
ch
ing
sli
p c
rite
rio
nE
quations fro
m E
N 1
090-2
annex G
sta
rt t
est
oute
r
Bolt
inner
Bolt
oute
r bolt
inner
bolt
F_T
SA
_04
27.1
1.1
7 1
2:5
4
F_T
SA
_03
27.1
1.1
7 1
0:5
2
F_T
SA
_02
21.1
1.1
7 1
2:0
5
F_T
SA
_05
28.1
1.1
7 1
1:4
8
Static load
F_T
SA
_01
20.1
1.1
7 1
2:3
4
Statistics
(5 specimen,
10 test results)
Chara
cte
ristic v
alu
e s
lip facto
r
Statistics
(4 specimen,
8 test results)
DelftU
niv
ers
ityofTechnolo
gy
Depart
ment
ofC
ivil
Engin
eering
and
Geoscie
nces
Macro
Lab
Ste
vin
we
g 1
26
28
CN
De
lft
Th
e N
eth
erl
an
ds
Ph
on
e: +
31
(0
)15
27
84
03
4
E-M
ail:
p.a
.de
vrie
s@
tud
elft.n
l