Embed Size (px)
Citation preview
Slope and the Equation of a Name
Kelly Cole
Rationale
The slope of a line is a large part of the curriculum in 8th grade and a springboard for
many of the concepts that are associated with Algebra. Yet it is a concept that many
students struggle to understand. The comprehension, application, and analysis of this
crucial concept aids in transitioning successfully into Algebra and beyond. Without a
solid understanding of what slope is and how to find it, students are lost in interpreting
linear word problems, graphing the equation of a line, and even understanding correlation
and line of best fit. This unit is designed to help answer the following essential
questions: What is the true meaning of slope? Is slope more than its numerical
representation?
Many of my students are not math lovers. They do okay at math, some of them even
do quite well. But do they really understand it? Do they perceive its beauty? Do they
understand its relevance in their own lives? Does it relate to the world in which they
live? In this unit I aim to catch their attention and ignite their imagination. I want them
to learn about slope and lines, linear equations and inequalities in a fresh way. I want to
link their world to the world of math and show them that the two can coexist.
I like the technical side of mathematics; the black and white of it; the way that math is
objective. I like that there is a right answer and I like the mechanics of finding that
answer. I like puzzles and the challenge of solving puzzles. I teach the way I like
mathematics. I teach mechanics and technique. I teach logical process and how to get
from a to b. I do a good job teaching students how to graph equations and how to find
slope using a formula. However I don’t think this is enough. I want my students to know
why they need to know how to graph a line and find slope. I want them to be able to
interpret word problems and graphs. I want them to be able to talk logically about what
slope represents in any given situation. Can they give me a real world example of a
linear equation? It is not enough for a student to leave my class knowing that y = mx + b.
This is a great place to start, but I ought to have higher expectations for my students.
This unit was birthed from my desire to do a better job of teaching slope in a more
relevant and interesting way. Students will learn not only the mechanics and
understanding, but also application, analysis and synthesis.
Objective

I teach in a middle school with a population of approximately 1,400 students. The school
is located just outside of Charlotte, North Carolina. It is part of the Charlotte-
Mecklenburg school district. The school is in an affluent area and populated mostly by
students whose parents are well-educated and have high-paying jobs. Our community is
also growing rapidly, with many newcomers moving from Northern states such as New
York, Michigan, and Ohio. While the majority of our student population is white (78%),
we have a growing number of minority groups. The makeup of the school’s minorities is
as follows: 13% African American, 7% Hispanic, and 2% Asian. [1]
As stated above, our
school is located in an affluent community; even so, 25% of our students receive free or
reduced lunch. Six percent of our population is limited in English proficiency. Many of
our LEP students come from countries like Mexico, Brazil, Guatemala, Honduras,
Germany, and Sweden. Seven percent of our students are identified as having some type
of learning disability and receive services from our EC department. [2]
Middle school math is broken into two levels at my school. Standard Plus classes
contain students who may be well-below grade level, below grade level, or at grade level.
Honors classes contain students who are at, or above grade level. Standard Plus classes
teach on-grade level objectives. Honors classes teach objectives that are a year in
advance, whilst maintaining objectives for the students’ current grade level. In eighth
grade, that means that Standard Plus classes learn objectives from the 8th
grade North
Carolina Standard Course of Study (NCSCOS), and Honors classes take Algebra 1
(traditionally a ninth grade course) receiving high school credit upon completion of the
End of Course test at the end of the year. The Common Core standards are being adopted
for North Carolina schools, and as such are being integrated into our curriculum
gradually over the next couple of years. Standard Plus classes tend to have more
diversity of race and socio-economic status than Honors classes. Students in Honors
classes are more likely to be self-motivated. Standard Plus classes, because of their
innate diversity, allow for a greater range of learning.
This unit is designed specifically for middle school students. I have included
extensions that I plan to use with my eighth grade Algebra students, as well as
remediation and differentiation that can be used in an inclusion setting. Students will
explore slope through a variety of activities involving fonts and games.
Content Background
Prior Knowledge
It is important that students have prior knowledge of adding and subtracting integers, how
to graph points on the coordinate plane, how to graph from a table, and how to solve an
equation for a given variable.
Adding and Subtracting Integers

Integers are the set of whole numbers and their opposites {…-3, -2, -1, 0, 1, 2, 3 …}.
When adding a positive number to a positive number the solution is a larger positive
number (see example 1). When adding a negative number to a negative number the
solution is a larger negative number (see example 2). When adding a positive number
and a negative number the solution is the difference of the absolute values of each and
will take the sign of the larger number (see examples 3 and 4).
Ex. 1 2 + 5 = 7
Ex. 2 -2 + (-5) = -7
Ex. 3 2 + (-5) = -3 Take the difference of the absolute values: |-5| - |2| = 3. Since -5 is
a larger negative value than 2 is a positive value, the solution will be negative.
Ex. 4 -2 + 5 = 3 Take the difference of the absolute values: |5| - |-2| = 3. Since 5 is a
larger positive value than -2 is a negative value, the solution will be positive.
I use the strategy of “heaps and holes” [3]
when teaching about integers. A “heap”
represents a positive number. A “hole” represents a negative number. When a heap
meets a hole, the heap fills the hole creating “level ground” (i.e. zero). This is the
concept of zero pairs. The first four examples can be shown visually as seen in Figure 1.
Figure 1: “Heaps and Holes”
Subtraction is the inverse of addition. We can employ “add the opposite” tactics to
solve subtraction problems. I use the strategy “KFC”, which stands for “Keep the first
number the same, Flip the minus sign to a plus sign, and Change the sign of the second
number.” Students then employ the rules of addition.

Ex. 5 2 – 5
K F C
2 + (-5) = -3
Ex. 6 -2 – (-5)
K F C
-2 + 5 = 3
Ex. 7 2 – (-5)
K F C
2 + 5 = 7
Ex. 8 -2 – 5
K F C
-2 + (-5) = -7
Graphing on the Coordinate Plane
The coordinate plane is the perpendicular intersection of two number lines at zero. Points
can be graphed in this two-dimensional space by using an x-coordinate and a y-
coordinate (x, y). First move left or right along the x-axis, then up or down the y-axis to
place a point.
Figure 2: The coordinate plane
Graph from a Table
An (x,y/ input,output) table is another way to represent a set of ordered pairs. The table
may be vertical or horizontal.
x y
1 5

Figure 3: Vertical and horizontal tables of points graphed on coordinate plane.
Solve for a Variable
Equations are often written in a form where the dependent variable is not isolated. In
order to graph the equation of a line in slope-intercept form (y = mx + b, where x and y
are coordinates, m is the slope of the line and b is the y-intercept) it is important to know
how to solve for the dependent variable. Students will isolate the dependent variable by
using inverse operations and keeping the equation balanced by performing the same
operation to both sides of the equals sign. An example of this is listed below.
First, subtract the term with the independent variable from both sides. This is done in
order to isolate the dependent variable, noted in red, as seen below:
Ax + By = C
-Ax -Ax
By = -Ax + C
Since the dependent variable, y, is still not isolated, we must divide both sides of the
equation by the dependent variable’s coefficient, as seen below:
=
y =
+
Slope
2 7
3 9
4 11 X 1 2 3 4
Y 5 7 9 11

When we refer to the slope of a hill, we reference its steepness. In fact, we ski on slopes
that are often called steep. In this sense, the slope of a line describes the steepness of that
line. Slope can be expressed as positive (rising from lower left to upper right), negative
(falling from upper left to lower right), zero slope (horizontal line), and undefined slope
(vertical line).
Graphs are always read from left to right, the same way we read a book. Positive
slopes move “up, up, and away” like Superman taking off to help someone. Superman is
a “positive” role model. Negative slopes move “down and out” like someone who is
down on his luck. This is a “negative” situation. It is possible for an idling car to go zero
distance on a “zero” slope. But try driving on an “undefined” slope and you will fall off
a cliff.
There are four types of slope that one must know and recognize: (a) positive slope, (b)
negative slope, (c) zero slope, and (d) undefined slope. Figure 4 depicts examples of
each type of slope.
Figure 4: Four types of slope
Slope is the numerical representation of the change in y values (vertical change)

divided by the change in x values (horizontal change) on the coordinate plane.
m =
=
=
Figure 5 gives an example of calculating slope.
Figure 5: Calculating slope
Students often wonder why the variable, m, is used to represent slope. This is not
clear, though many have offered conjecture. The following is an answer offered by “Dr.
Math” at http://mathforum.org/dr.math/faq/faq.terms.html:[4]
“Although m can stand for "modulus of slope" and the term "modulus" has often
been used for "the essential parameter determining," there is no definitive proof
that this is the derivation of m.
M. Risi, the author of math textbooks written in French for students of Quebec
province, says that in his system, "the first letters of the alphabet, a, b, c...
represent the constants, the last letters, x, y, z, represent the unknown variables,
and the middle letters, m, n, p... represent the parameters." When he started to
explain slope, it was in studying the first degree equation: y = mx + b. X and y
were the variables, b was fixed and considered as a constant, and was appended to
the coefficient of x as its value varied--so it was a parameter, and that is why m
was selected.
Student Robby Grant has suggested a way of remembering m for slope and b for
y-intercept:
I think of m as standing for "move" and b for "begin." This relates to the
way you graph linear equations by hand. You can use the b value to plot
the "beginning" point (0, b). Then the m value instructs you where to
"move" from point (0, b) to plot the next point, thus giving you the line for
the equation.”
Slope-Intercept Form
Linear equations are in slope-intercept form when the dependent variable (usually y) is
isolated. The form is as follows:
y = mx + b
where x and y are coordinates on the coordinate plane, m is the slope of the line and b is
the y-intercept.
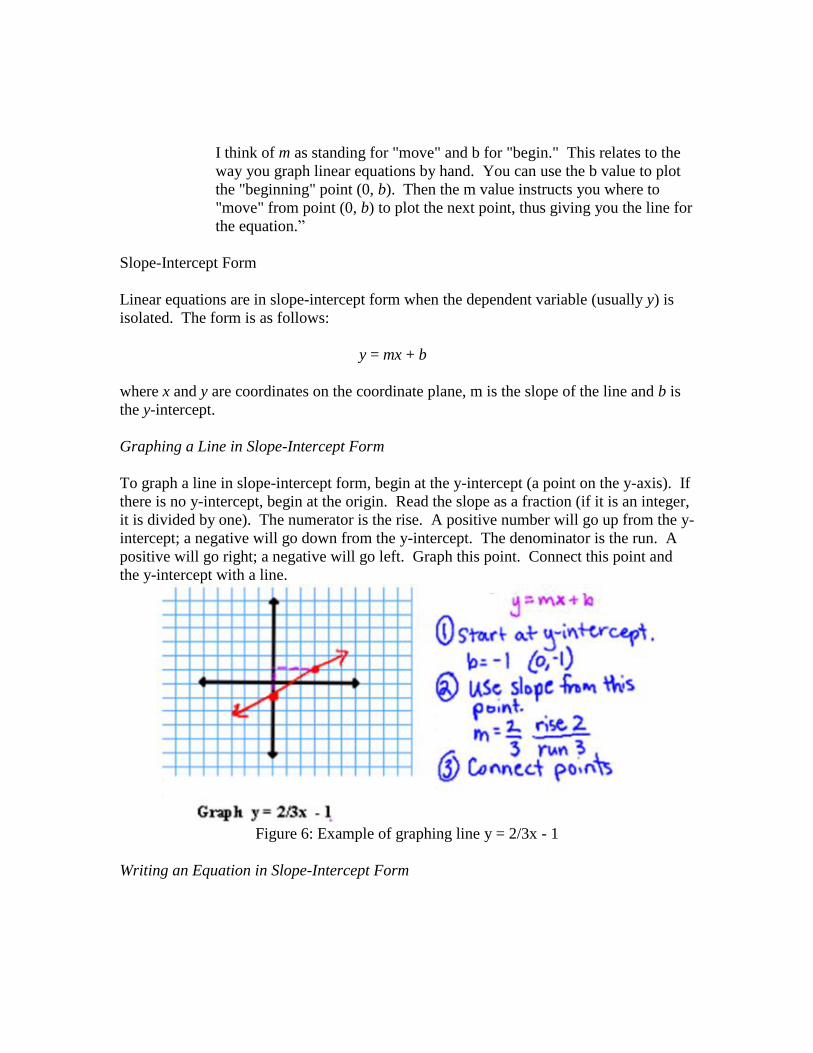
Graphing a Line in Slope-Intercept Form
To graph a line in slope-intercept form, begin at the y-intercept (a point on the y-axis). If
there is no y-intercept, begin at the origin. Read the slope as a fraction (if it is an integer,
it is divided by one). The numerator is the rise. A positive number will go up from the y-
intercept; a negative will go down from the y-intercept. The denominator is the run. A
positive will go right; a negative will go left. Graph this point. Connect this point and
the y-intercept with a line.
Figure 6: Example of graphing line y = 2/3x - 1
Writing an Equation in Slope-Intercept Form

The equation of a line can be written from two points. First, find the slope between the
two points using slope formula. Then substitute the slope (m), and one point (x, y) into
the slope-intercept formula y = mx + b. Solve for b. Substitute the slope and the
y-intercept into the slope-intercept formula. See example below:
(-2, 4) (4, -2)
m = –
m = -1
y = mx + b
4 = -1(-2) + b
-2 -2
2 = b
y = -1x + 2
Parallel and Perpendicular Lines
Lines that are parallel to one another never intersect on the same coordinate plane. The
slopes of these lines are the same. Lines that are perpendicular to one another intersect at
right angles to one another. The slopes of these lines are opposite reciprocals.
Figure 7: Example of parallel and perpendicular lines
Extended Activities Content
Dilations
A dilation is a transformation on the coordinate plane that involves either an enlargement
or reduction of an object by a scale factor. To dilate an object from the origin, the center
of dilation, simply multiply both the x and y coordinates by the scale factor. A scale
factor, k, that is between -1 and 1, excluding 0 (-1 < k < 1, k ≠ 0) will form a reduction.
A scale factor less than -1 or greater than 1 (k < -1 or k > 1) will form an enlargement.
All negative scale factors will reflect the dilation across y = x.
Activities
Fonts [5]
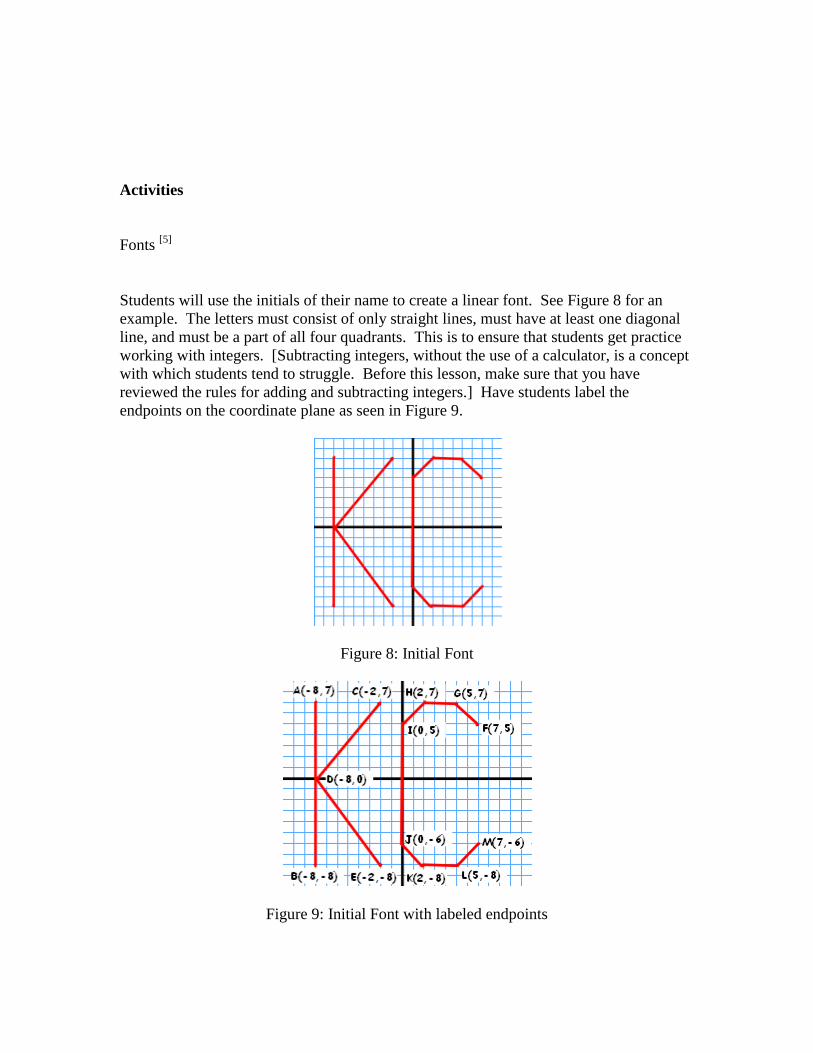
Students will use the initials of their name to create a linear font. See Figure 8 for an
example. The letters must consist of only straight lines, must have at least one diagonal
line, and must be a part of all four quadrants. This is to ensure that students get practice
working with integers. [Subtracting integers, without the use of a calculator, is a concept
with which students tend to struggle. Before this lesson, make sure that you have
reviewed the rules for adding and subtracting integers.] Have students label the
endpoints on the coordinate plane as seen in Figure 9.
Figure 8: Initial Font
Figure 9: Initial Font with labeled endpoints

Spend some time discussing the meaning of slope. Show examples of the four
different types of slope. Have students label each of their lines as having either positive,
negative, zero, or undefined slope. This is demonstrated in Figure 10.
Figure 10: Initial Font with types of slopes
Introduce the slope formula. Slope of a line can be determined by the change in the
rise (y-values) divided by the change in the run (x-values). Spend a few minutes
discussing why we use the letter m to represent slope. This is often a curiosity for
students. If you would rather not spend the time in class, have the students conduct their
own research as to why slope is represented by m. This could be used as a homework
grade, or an extra credit assignment, or as part of a project.
Have students determine the slope of each line in their font initials. Students are
required to write the slope formula each time, and must show all of their work. It also
helps students, when they are first learning about slope, to label the points (x1, y1),
(x2, y2). See Figure 11 for an example.
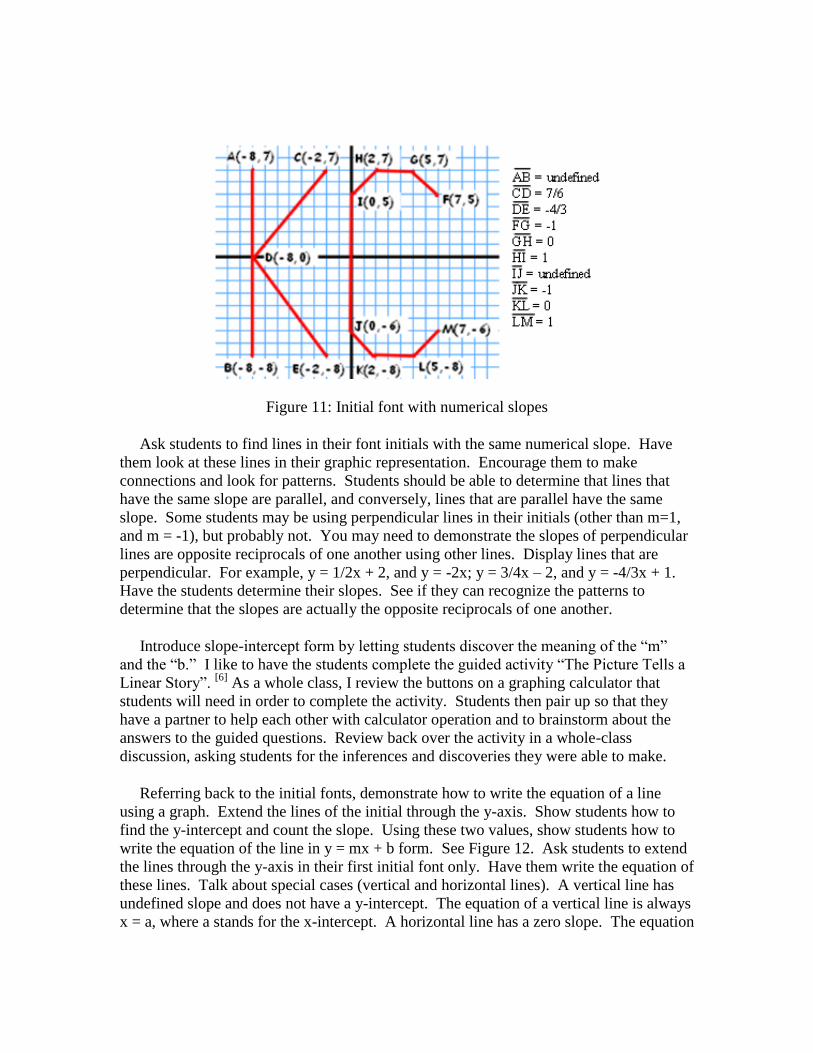
Figure 11: Initial font with numerical slopes
Ask students to find lines in their font initials with the same numerical slope. Have
them look at these lines in their graphic representation. Encourage them to make
connections and look for patterns. Students should be able to determine that lines that
have the same slope are parallel, and conversely, lines that are parallel have the same
slope. Some students may be using perpendicular lines in their initials (other than m=1,
and m = -1), but probably not. You may need to demonstrate the slopes of perpendicular
lines are opposite reciprocals of one another using other lines. Display lines that are
perpendicular. For example, y = 1/2x + 2, and y = -2x; y = 3/4x – 2, and y = -4/3x + 1.
Have the students determine their slopes. See if they can recognize the patterns to
determine that the slopes are actually the opposite reciprocals of one another.
Introduce slope-intercept form by letting students discover the meaning of the “m”
and the “b.” I like to have the students complete the guided activity “The Picture Tells a
Linear Story”. [6]
As a whole class, I review the buttons on a graphing calculator that
students will need in order to complete the activity. Students then pair up so that they
have a partner to help each other with calculator operation and to brainstorm about the
answers to the guided questions. Review back over the activity in a whole-class
discussion, asking students for the inferences and discoveries they were able to make.
Referring back to the initial fonts, demonstrate how to write the equation of a line
using a graph. Extend the lines of the initial through the y-axis. Show students how to
find the y-intercept and count the slope. Using these two values, show students how to
write the equation of the line in y = mx + b form. See Figure 12. Ask students to extend
the lines through the y-axis in their first initial font only. Have them write the equation of
these lines. Talk about special cases (vertical and horizontal lines). A vertical line has
undefined slope and does not have a y-intercept. The equation of a vertical line is always
x = a, where a stands for the x-intercept. A horizontal line has a zero slope. The equation

of a horizontal line is always y = b, where b stands for the y-intercept (there is no x in the
equation since the zero slope is multiplied to the x).
Figure 12: Initial Font with equations of lines
Let students know that they can also find the equation of a line if they know one point
on the line and the slope of the line. Show how to find the y-intercept by substituting the
x, and y coordinates, and the slope (m) into the equation y = mx + b. Solve for b
(y-intercept). Rewrite the equation y = mx + b, substituting the slope and the y-intercept.
If students have only two points on a line, is it possible for them to find the equation
of the line? What do we know we can do with two points? Can two points make a line?
If so, does this line have a slope? Have students use the two points to find the slope of
the line through these points. Ask students what they would do next to find the
y-intercept. Students may suggest using the slope and a point. Which point? Does it
matter? Will you get the same equation if you use either point? Have students
hypothesize the answers to these questions and then draw conclusions after they have
determined the equation of the line using first, one point, and then, the other. Have
students use this method for finding the equations of the lines in their last initial.
Extension
Word Problems

Students tend to struggle with word problems. In actuality we are writing an algebraic
model of a real-life situation. Students need to be exposed to several situations which are
modeled by equations. There are several hands-on activities that can help students
understand the linear equation model. For example, start with the height of a desk. Add
a textbook on top of the desk. Have students measure from the floor to the top of the
textbook. Continue to add textbooks (of the same size), taking measurements after each
book is added. Write the results in a table. Have students look for patterns. Ask them to
write an equation to model this situation, given the data that they obtained. Students
should see that the equation is linear. What does the y-intercept represent? What about
the slope? It is very important that students are able to tell you what the slope and
y-intercept stand for in each situation that is modeled. Make some generalizations such
as the y-intercept usually is a starting amount (when the independent variable is zero).
The slope is a rate. It is usually found near words such as “per,” “for every,” or “for
each” and shows up near the independent variable.
Once students have had a decent amount of exposure to modeling situations using
equations, have students write their own word problems. Using the lines in the initials of
their names, have students write situations that would be modeled by their equations.
They should use things that they are interested in. Students may need assistance
brainstorming ideas to get them started. It may be a good idea to have a list of possible
scenarios that they could personalize using their own equations. Students may also
benefit from being in partners for this exercise. They can use “Think, Pair, Share” where
each student would individually think of what he wants to say in his equation. Then he
would get together with his partner to share his ideas. The partner would give feedback,
each one helping the other to make the best word problems possible. Students could then
trade word problems and come up with equations to model each situation.
Dilations
Dilations deal with the enlargement or reduction of objects. Fonts undergo a dilation of
sorts when we increase/decrease the font size on our computers. Students can use the
fonts that have been created to discover the affect of a variety of scale factors on their
lines. Teach students to multiply each coordinate by the scale factor in order to dilate.
Students will take the endpoints of one of their initials and place them in a table. Then
students will be asked to dilate each point given scale factors of ½, ¼, 2, 3, -1, and -2.
Once the table is complete have students graph the dilations. Ask students to draw
conclusions based on their dilations as to what kind of scale factors cause reductions and
which cause enlargements. What does a negative scale factor do? You may also want to
have students measure the original line segments and the new line segments. Are the
measurements in the same ratio as that of the scale factor? Does the dilation affect the
equation of the line? Is the slope affected?

Figure 13: Original Font
Figure 14: Example of a reduction using scale factor = ½ (shown in purple)

Figure 15: Example of an enlargement using scale factor = 2 (shown in purple)
Figure 16: Example of a dilation using scale factor = -1 (shown in purple)
Chutes and Ladders
Many of us grew up playing “Chutes and Ladders” or “Snakes and Ladders.” The classic
board game has one hundred squares. The object of the game is to be the first to navigate
successfully from 1 to 100. On several squares there are ladders, which one can climb
and “skip” ahead. On other squares there are snakeheads or the openings of chutes,
which one slides down and goes back.

Figure 16: Traditional Chutes and Ladders board game, Bing images [7]
I have modified this board game to fit on the coordinate plane and to allow students to
practice graphing slope. The objective is still the same; one navigates from 1 to 100.
These are no longer squares, but points on the coordinate plane. On several points there
are slopes given that will “skip” the player ahead. There are also points that have slopes
that will set the player back. The slopes and a vertical or horizontal line are given.
Players will use the slope until they get to the vertical/horizontal line given (this is the
end point). The chutes and ladders are hidden, so that students are using the slopes given.
You may want to introduce the game as a whole class, or in small groups. Once the
students understand how it works, they can break off into groups of 3 or 4 to play. Figure
17 provides an example of the “Chutes and Ladders with Slope” that I created.
Figure 17: Chutes and Ladders with Slope

Extension
Students can make their own “chutes and ladders” game. Give students a blank board.
Have them choose 5 - 10 points on the graph. These will be “beginning” points. Ask
students to select the same number of “end” points (these must be unique). Connect
beginning points to end points. These will be our “ladders”. List the lesser of the two
points on each ladder. Determine the slope of the line. Write the vertical or horizontal
line of the greater of the two points (where the ladder ends). For the “chutes,”follow the
same directions as for the ladders, except that you should list the greater of the two points
on the chute, and write the horizontal or vertical line of the lesser of the two points
(where the chute ends).
Once the beginning points of the chutes and ladders, the slopes, and the ending lines
are determined and written down, the students should take a blank board and label the
chutes and ladders points. Have students play each other’s board games.
Figure 18: Blank Chutes and Ladders board
Notes
1
"Bailey Middle School Test Scores - Cornelius, North Carolina – NC,"
http://www.greatschools.org/modperl/achievement/nc/3383#from(accessed November 7,
2010). 2
CMS School Improvement Plan 2010-2012: Bailey Middle School 2010-2011. 3
"Modeling Addition and Subtraction of Integers with Heaps and Holes."
ncwiseowl.org.http://math.ncwiseowl.org/UserFiles/Servers/Server_4507209/File/G7Nu
mber.pdf(accessed November 3, 2011). 4
"Math Forum: Ask Dr. Math FAQ: Math Terms." The Math Forum @ Drexel
University.http://mathforum.org/dr.math/faq/faq.terms.html(accessed October 3, 2011).
5 Chartier, Tim, Daniel Clayton, Michelle Navas, and Mallory Nobles. "Mathematical
Penmanship." Math Horizons 15 (2008): 10-11, 31.
http://www.maa.org/mathhorizons/teasers/teasers04-08.html (accessed November 28,
2011).
6 "The Picture Tells a Linear Story." www.dpi.state.nc.us.
www.dpi.state.nc.us/docs/curriculum/mathematics/middlegrades/grade08/goal05/objectiv
e5.01d/5.01d-tasks/5.01d-picturetellsstory.pdf(accessed November 3, 2011). 7
"chutes and ladders - Bing Images." Bing.
http://www.bing.com/images/search?q=chutes+and+ladders&view=detail&id=F541F8E8
43DFBFDDC155316E1A8BD725D0A5F4FF&first=0&qpvt=chutes+and+ladders&FOR
M=IDFRIR (accessed October 28, 2011).
Bibliography
"Bailey Middle School Test Scores - Cornelius, North Carolina - NC."GreatSchools -
Public and Private School Ratings, Reviews and Parent
Community.http://www.greatschools.org/modperl/achievement/nc/3383#from.
HeaderLink (accessed November 7, 2010). Information for my particular school.
Chartier, Tim, Daniel Clayton, Michelle Navas, and Mallory Nobles. "Mathematical
Penmanship." Math Horizons 15 (2008): 10-11, 31.
http://www.maa.org/mathhorizons/teasers/teasers04-08.html (accessed November 28,
2011). This was the inspiration for this unit.
"Math Forum: Ask Dr. Math FAQ: Math Terms." The Math Forum @ Drexel
University.http://mathforum.org/dr.math/faq/faq.terms.html(accessed October 3,
2011). This website is a good resource for students and teachers for math vocabulary
and topics of interest.
"Modeling Addition and Subtraction of Integers with Heaps and Holes."
ncwiseowl.org.http://math.ncwiseowl.org/UserFiles/Servers/Server_4507209/File/G7
Number.pdf(accessed November 3, 2011). This is a strategy that is both visual and
kinesthetic.

"The Picture Tells a Linear Story." www.dpi.state.nc.us.
www.dpi.state.nc.us/docs/curriculum/mathematics/middlegrades/grade08/goal05/obje
ctive5.01d/5.01d-tasks/5.01d-picturetellsstory.pdf(accessed November 3, 2011). This
is a great discovery activity to do with students to introduce them to slope-intercept
form.
Chicago formatting by BibMe.org.