Embed Size (px)
Citation preview
Slow Ground Motion Studies at Fermilab
James T Volk
Accelerator Division
Andrey Chupyra, Shavkat Singatulin, Budker Institute of Nuclear Physics
Vladimir Shiltsev, Sten Hansen, Terry KiperFermilab
Principle that water seeks its own level
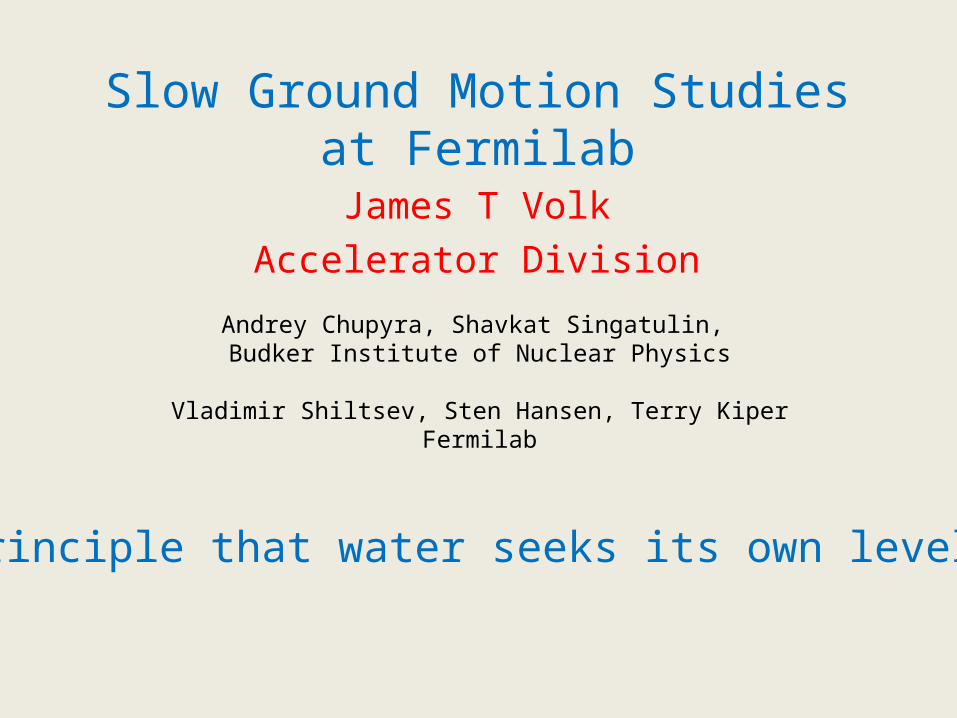
There are two types of HLS systems in use
James T Volk May 2009
Budker Institute of Nuclear Physics
Fermilab designed Tevatron style
Balluff proximity sensor
Capacitive sensor
Water pool
Air line
Water line
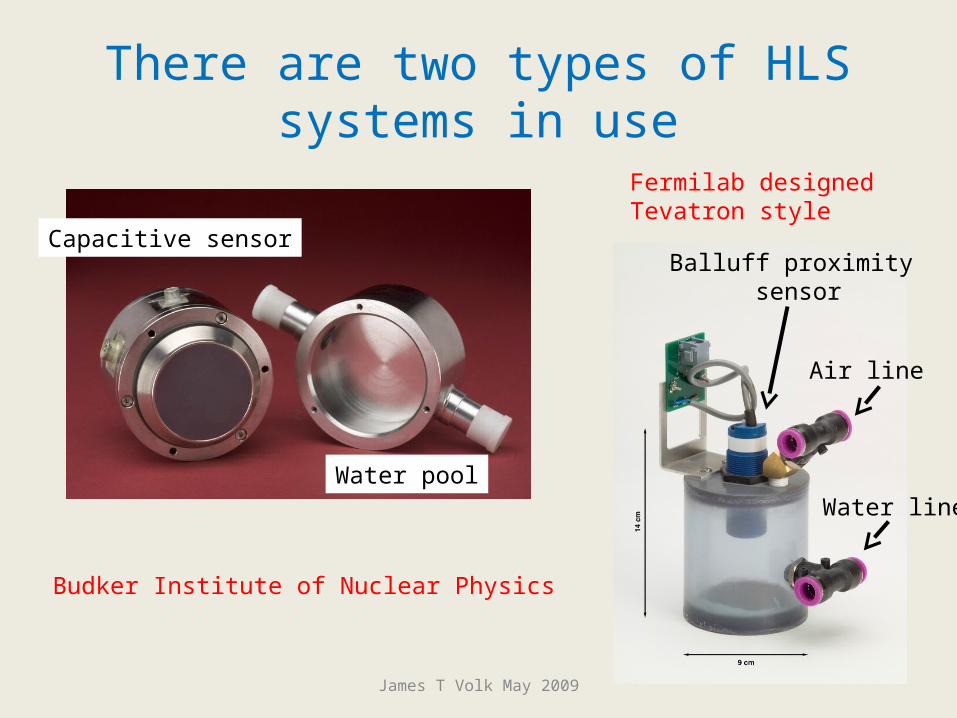
Fermilab Design Tevatron Style
James T Volk May 2009
8 channel readout card Ether net interface
Balluff sensor and pool
Power supplyRS232 port
Paper in IWAA-08 J Volk

Tevatron Sensors on Quad
James T Volk May 2009
In the circle is a water level pot on a Tevatron quadrupole
Air Line
Water line
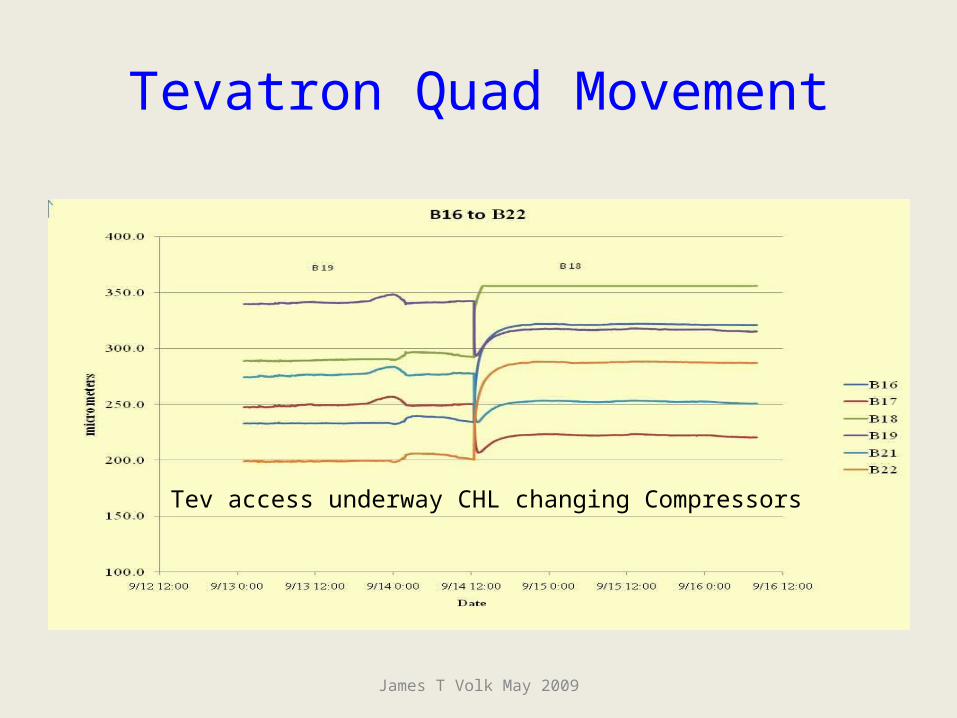
Tevatron Quad Movement
James T Volk May 2009
Tev access underway CHL changing Compressors
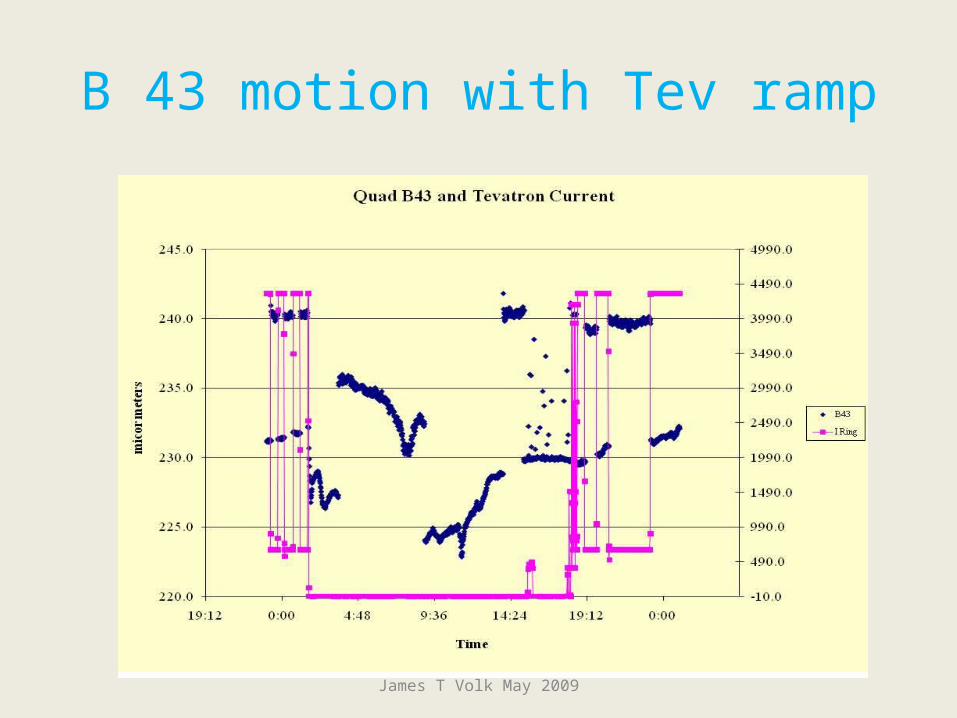
B 43 motion with Tev ramp
James T Volk May 2009
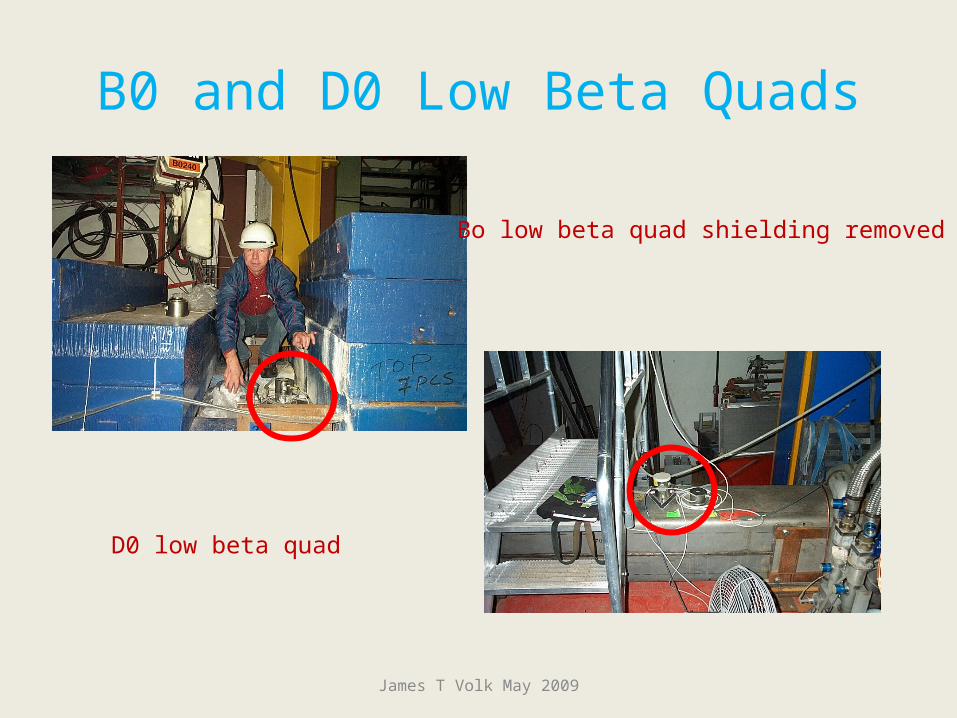
B0 and D0 Low Beta Quads
James T Volk May 2009
Bo low beta quad shielding removed
D0 low beta quad

D0 low beta quad motion
James T Volk May 2009
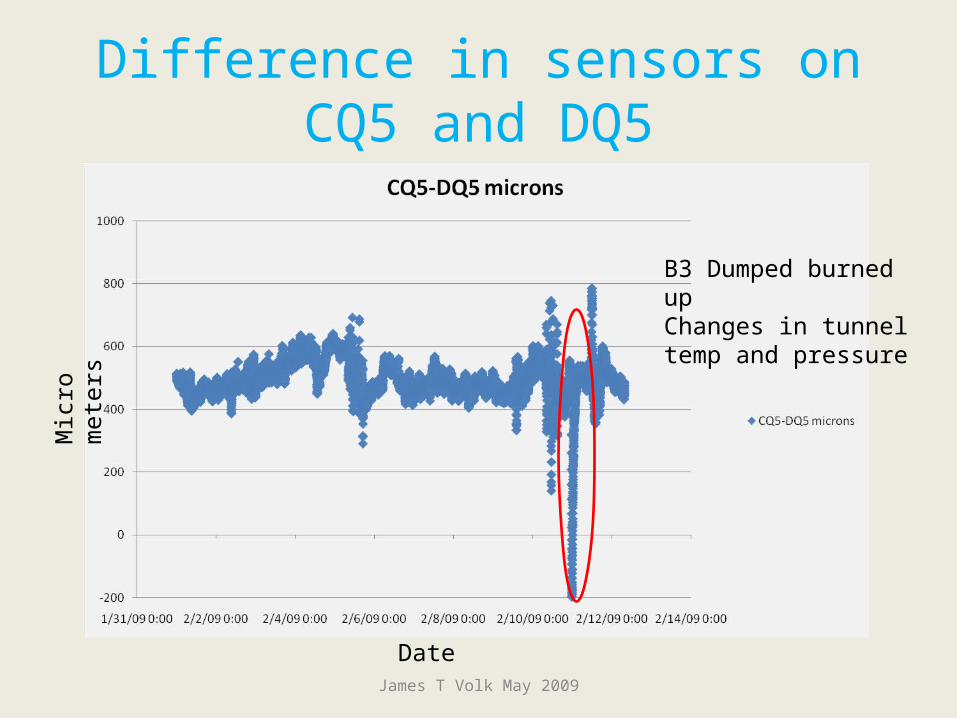
Difference in sensors on CQ5 and DQ5
James T Volk May 2009
Date
Mic
ro m
eter
s
B3 Dumped burned upChanges in tunnel temp and pressure
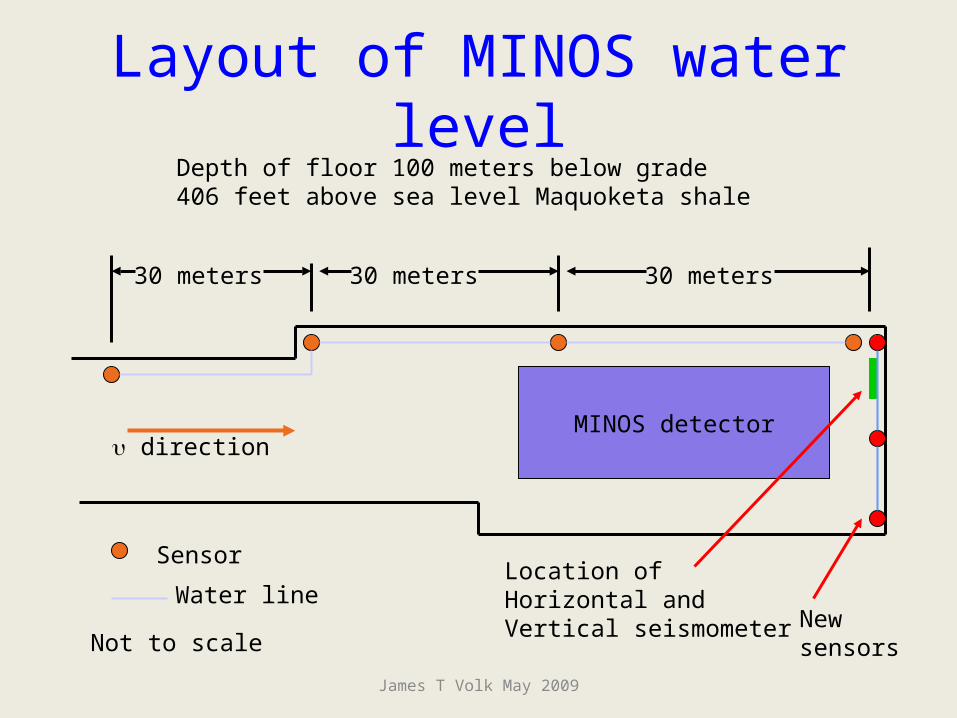
Layout of MINOS water level
James T Volk May 2009
MINOS detector
30 meters30 meters30 meters
Not to scale
direction
Sensor
Water line
Depth of floor 100 meters below grade406 feet above sea level Maquoketa shale
Location of Horizontal andVertical seismometer New
sensors
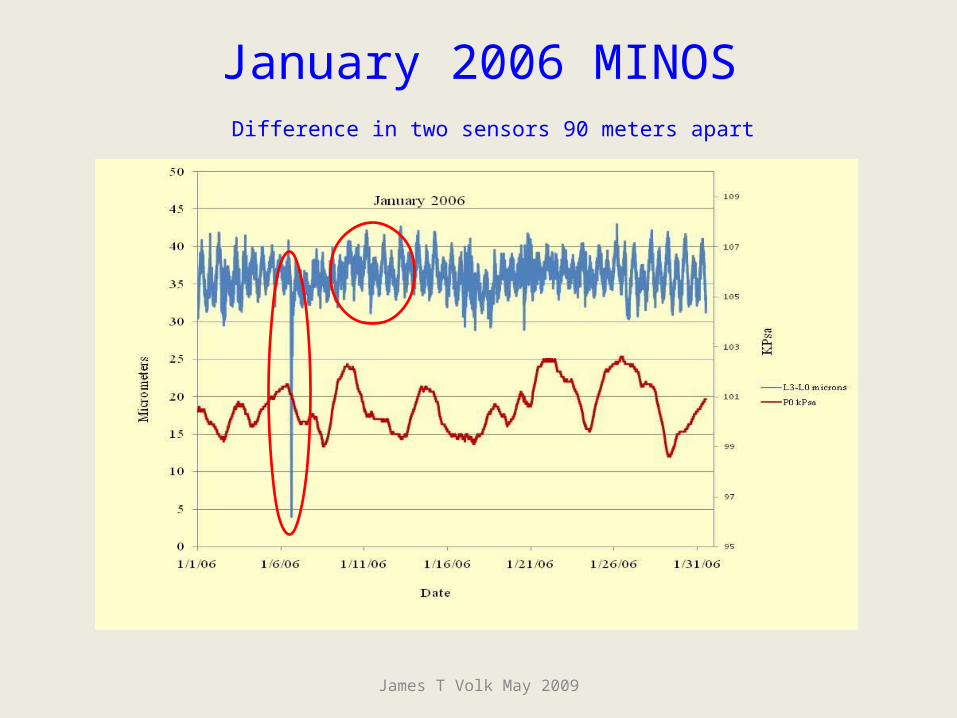
January 2006 MINOS Difference in two sensors 90 meters apart
James T Volk May 2009
James T Volk May 2009
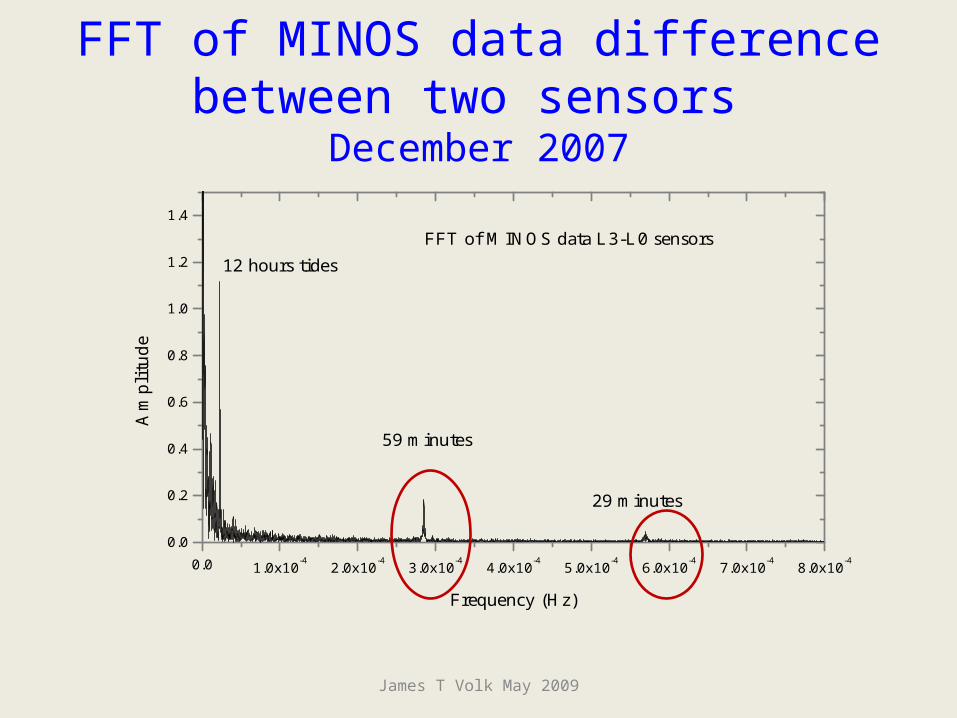
FFT of MINOS data difference between two sensors
December 2007
0.0 1.0x10⁻⁴ 2.0x10⁻⁴ 3.0x10⁻⁴ 4.0x10⁻⁴ 5.0x10⁻⁴ 6.0x10⁻⁴ 7.0x10⁻⁴ 8.0x10⁻⁴
0.0
0.2
0.4
0.6
0.8
1.0
1.2
1.4
Frequency (Hz)
Am
plit
ude
12 hours tidesFFT of MINOS data L3-L0 sensors
59 minutes
29 minutes
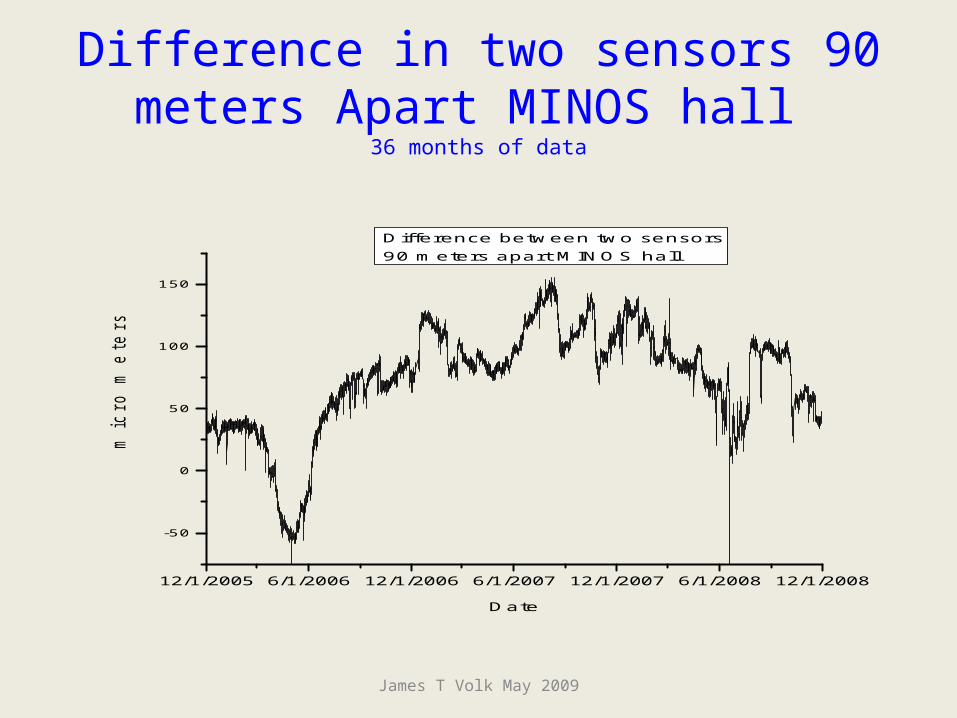
Difference in two sensors 90 meters Apart MINOS hall
36 months of data
James T Volk May 2009
12/1/2005 6/1/2006 12/1/2006 6/1/2007 12/1/2007 6/1/2008 12/1/2008
-50
0
50
100
150
mic
ro m
ete
rs
Date
Difference between two sensors90 meters apart MINOS hall