Embed Size (px)
Citation preview
- 1 -
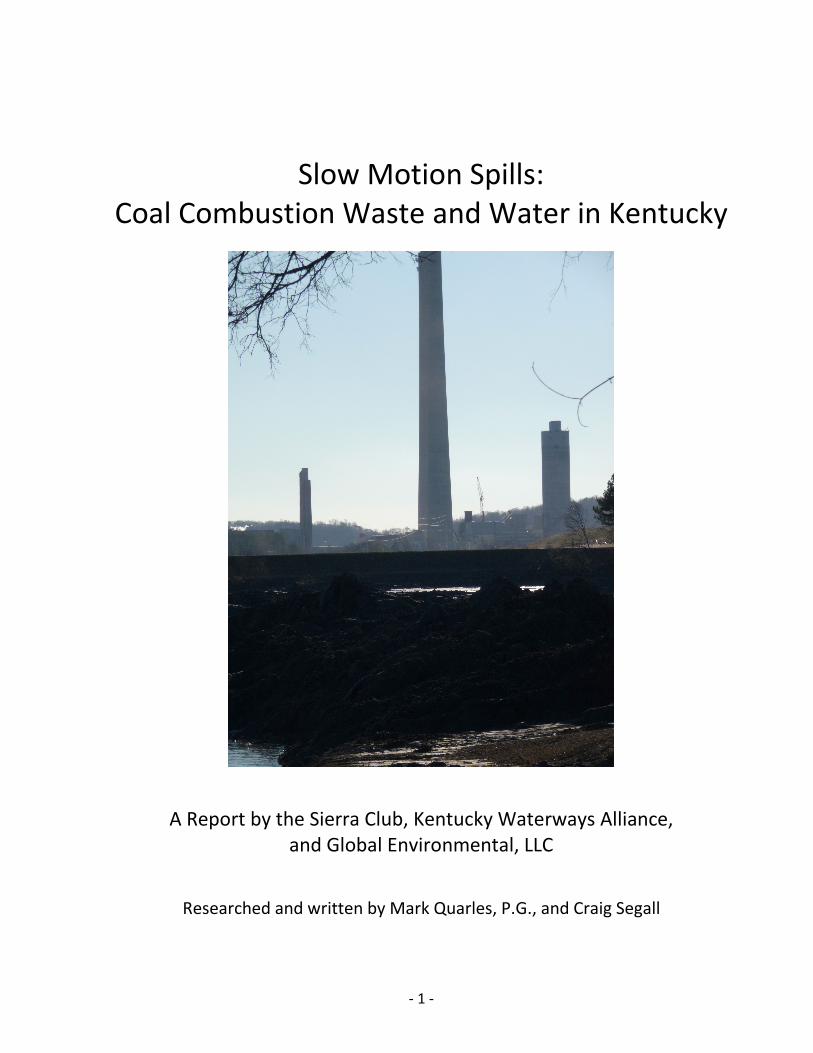
Slow Motion Spills:
Coal Combustion Waste and Water in Kentucky
A Report by the Sierra Club, Kentucky Waterways Alliance,
and Global Environmental, LLC
Researched and written by Mark Quarles, P.G., and Craig Segall
- 2 -
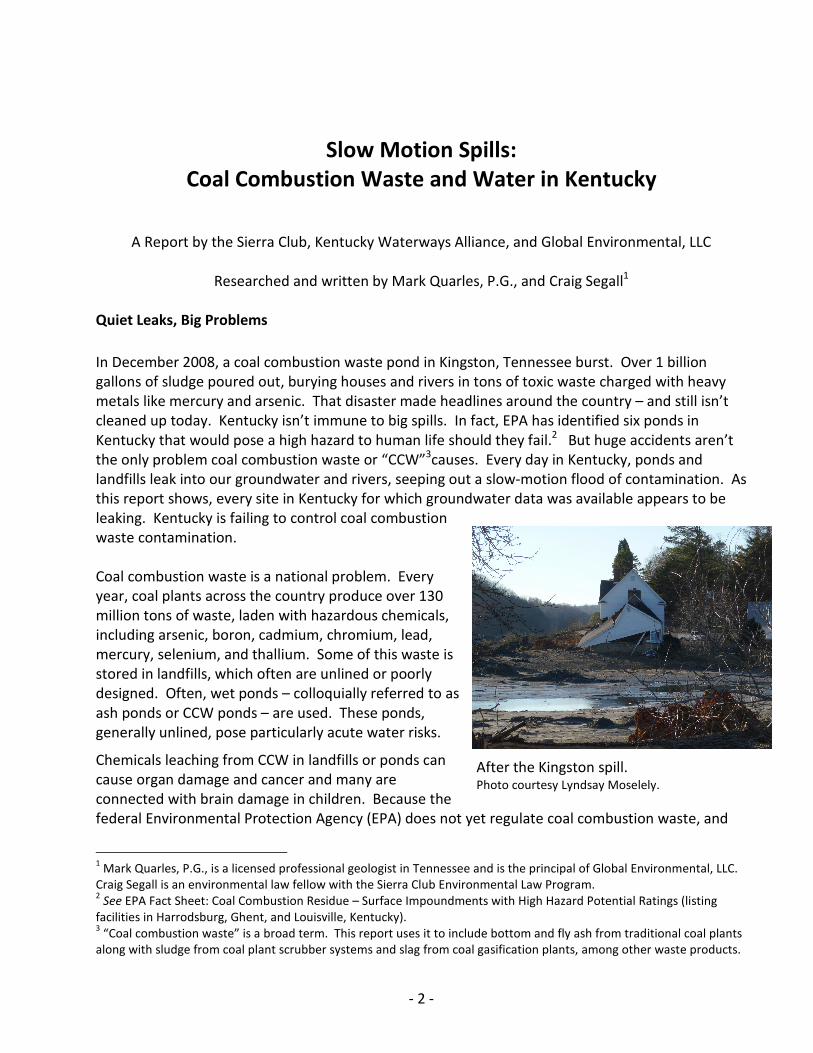
After the Kingston spill. Photo courtesy Lyndsay Moselely.
Slow Motion Spills:
Coal Combustion Waste and Water in Kentucky
A Report by the Sierra Club, Kentucky Waterways Alliance, and Global Environmental, LLC
Researched and written by Mark Quarles, P.G., and Craig Segall1
Quiet Leaks, Big Problems
In December 2008, a coal combustion waste pond in Kingston, Tennessee burst. Over 1 billion
gallons of sludge poured out, burying houses and rivers in tons of toxic waste charged with heavy
metals like mercury and arsenic. That disaster made headlines around the country – and still isn’t
cleaned up today. Kentucky isn’t immune to big spills. In fact, EPA has identified six ponds in
Kentucky that would pose a high hazard to human life should they fail.2 But huge accidents aren’t
the only problem coal combustion waste or “CCW”3causes. Every day in Kentucky, ponds and
landfills leak into our groundwater and rivers, seeping out a slow-motion flood of contamination. As
this report shows, every site in Kentucky for which groundwater data was available appears to be
leaking. Kentucky is failing to control coal combustion
waste contamination.
Coal combustion waste is a national problem. Every
year, coal plants across the country produce over 130
million tons of waste, laden with hazardous chemicals,
including arsenic, boron, cadmium, chromium, lead,
mercury, selenium, and thallium. Some of this waste is
stored in landfills, which often are unlined or poorly
designed. Often, wet ponds – colloquially referred to as
ash ponds or CCW ponds – are used. These ponds,
generally unlined, pose particularly acute water risks.
Chemicals leaching from CCW in landfills or ponds can
cause organ damage and cancer and many are
connected with brain damage in children. Because the
federal Environmental Protection Agency (EPA) does not yet regulate coal combustion waste, and
1 Mark Quarles, P.G., is a licensed professional geologist in Tennessee and is the principal of Global Environmental, LLC.
Craig Segall is an environmental law fellow with the Sierra Club Environmental Law Program. 2 See EPA Fact Sheet: Coal Combustion Residue – Surface Impoundments with High Hazard Potential Ratings (listing
facilities in Harrodsburg, Ghent, and Louisville, Kentucky). 3 “Coal combustion waste” is a broad term. This report uses it to include bottom and fly ash from traditional coal plants
along with sludge from coal plant scrubber systems and slag from coal gasification plants, among other waste products.
- 3 -
most states don’t fill the gap, power companies are largely free to dispose of their waste how, and
where, they like.
That casual and dangerous practice has damaged the water of more than a hundred communities.4
EPA’s own damage reports – which only describe a few examples of a national problem -- make for
harrowing reading. In Virginia, for instance, CCW dumping turned water green in nearby residences
– and filled that water with toxic selenium.5 High levels of arsenic also fouled groundwater and a
nearby stream. In South Carolina, a leaking old ash pond was replaced with a new pond – which still
leaked so badly that arsenic levels in groundwater spiked above human health limits.6 In North
Carolina and Texas, selenium from CCW crept into the flesh of fish in lakes and reservoirs.7 And in
Indiana, where power plants dumped 1 million tons of ash in and around the town of Pines, well
water turned foul and turned out to have elevated levels of arsenic, lead, and cancer-causing
benzene.8
Is the past prologue for Kentucky? Kentucky has 44 ash ponds, the
second most in the nation after Indiana,9 and dozens of coal combustion
waste landfills and dumpsites – and it barely regulates these sites. The
Sierra Club and Kentucky Waterways Alliance, working with Global
Environmental, LLC, launched an investigation into the commonwealth’s
own records to find out what coal combustion waste is doing to
Kentucky’s water. We found grim news. Although records are spotty,
every one of the sites for which data were available has groundwater
contamination consistent with coal combustion waste and, in many
instances, this contamination is getting worse.
The Investigation
We set out to examine groundwater records for CCW sites throughout Kentucky. Using Kentucky
Open Records Act requests, we reviewed monitoring records held by the Kentucky Division of Waste
Management. We were interested in records for both dry landfill sites and CCW disposal ponds.
We focused particularly strongly on pond disposal sites because, although both dry landfills and
ponds can leach poisons into water, unlined CCW ponds pose an extreme threat to Kentucky’s
water, as they place huge volumes of wet sludge directly above groundwater, with no barrier in
between. Eventually, we received monitoring data for 8 sites, covering a range of ponds and dry
landfills.
4 See EPA, Coal Combustion Waste Damage Case Assessments (2007) (listing 71 potential or proven damage cases);
Earthjustice & Environmental Integrity Project, Out of Control: Mounting Damage from Coal Ash Waste Sites (2010)
(describing an additional 31 sites). 5 EPA, Coal Combustion Waste Damage Case Assessments at 14-16 (2007)
6 Id. at 24-25.
7 Id. at 25, 33-34.
8 Id. at 32-33.
9 See Jim Bruggers, KentuckianaGreen.com, Here are the Rankings (Sept. 1, 2009) (Louisville Courier-Journal compilation
of EPA data).
Kentucky has 44 ash
ponds, the second
most in the nation
after Indiana…
Kentucky barely
regulates these
sites.
- 4 -
The Division of Waste Management’s staff was very helpful, but it soon became clear that the
Division’s records are far from complete and well-organized. Of the 44 ponds in Kentucky, we were
able to turn up information on only 8 sites. Even for those 8 sites, Kentucky did not have monitoring
records for all CCW contaminants. In some cases, the Division had even allowed sites whose early
records showed dangerous levels of toxic heavy metals to stop monitoring for those pollutants.
Worse, the Division generally does not require specific monitoring sites near ponds, which are
especially leak-prone. As a result, we were able to secure data associated with ponds only where a
facility happened to have installed monitoring wells for a landfill, and those wells were placed in
ways that allowed us to analyze pond contaminants. Finally, even more troubling, the Division often
lacked even basic maps showing where monitoring wells were – meaning that, without following up,
Division of Waste Management staff members are forced to rely upon company’s characterizations
of how wells are placed within a groundwater system, rather than being able to see for themselves.
Despite these limitations, the state’s data still contained strong evidence of contamination, as we
describe below. It is striking – and unfortunate – that the records documenting this important
problem are so limited. Although it is possible that the Division’s databases may hold information
for other sites, which we did not obtain, the generally incomplete nature of records in this area
suggests that Kentucky is not approaching the problem with sufficient seriousness.
The Results
Even with the limited data the Division of Waste Management
could provide, signs of CCW contamination are unmistakable.
At each site, the chemical signature of leaking coal combustion
waste appears in the water, with pollutant levels that can be
hundreds of times over levels EPA has determined to be safe.
To be clear: while the data are imperfect, due to flawed state
monitoring practices, the compounds fouling water beneath
these sites very likely came from coal combustion waste. This
is not a subtle problem. Coal combustion waste appears to be contaminating water across
Kentucky.
We received groundwater monitoring data from eight power plants in Kentucky. All eight sites were
contaminated. The plants are:
• Cane Run Station near Louisville, owned and operated by E.On and Louisville Gas & Electric
• East Bend Station near Rabbit Hash, owned and operated by Cincinnati Gas and Electric and
Duke Power
• R.D. Green Station near Robards, owned and operated by Big Rivers Electric Corporation
• Paradise Station near Drakesboro, owned and operated by the Tennessee Valley Authority
• Trimble County Station near Louisville, owned and operated by E.On and Louisville Gas &
Electric
We received
groundwater monitoring
data from eight power
plants in Kentucky. All
eight sites were
contaminated.
- 5 -
• Shawnee Station near Paducah, owned and operated by the Tennessee Valley Authority
• Spurlock Station near Maysville, owned and operated by the Eastern Kentucky Power
Cooperative
• D.B. Wilson Station near Centertown, owned and operated by Big Rivers Electric Corporation
We assessed environmental issues at these sites by relying on EPA’s methods. EPA recognizes
“proven damage cases” – instances where coal combustion waste has harmed water quality –
where a plant causes violations of the Safe Drinking Water Act’s primary standards, which are
designed to protect human health and the environment, and polluted water is migrating away from
the site. These primary standards, called “maximum contaminant levels” or “MCLs,” are set for
heavy metals found in coal combustion waste. EPA recognizes “potential” damage cases where
either primary MCLs have been violated but there is not evidence that pollution has migrated, or
where there are violations of secondary MCLs, which are set to protect public welfare.10
Each of these plants is, at a minimum, a potential damage case. Because Kentucky does not have
monitoring data tracking how far pollutants have migrated, and sometimes did not have data for
pollutants covered by primary MCLs, it’s difficult to determine whether the plants are proven
damage cases. Further, because these sites often have massive waste complexes, covering acres
and containing both ponds and landfills, and companies often did not submit detailed groundwater
diagrams or surface maps, it is sometimes hard to tell which component of the waste facility is
causing pollution. Nonetheless, the available data do point to onsite CCW contamination and the
degree of contamination strongly suggests that pollutants are making their way off site.
Indeed, EPA has already confirmed that one of these Kentucky facilities -- East Bend -- is, at the
least, a potential damage case.11 Notably, EPA’s analysis focused on iron, dissolved solids, and
sulfates leaking from the site, which were alone sufficient for it to make its case. Its report did not
include some of the heavy metals we found in earlier groundwater monitoring data for that site,
and which suggest even more substantial damage, as we discuss in a site-specific review later in this
report. EPA’s decision thus suggests the stronger evidence gathered in our file review warrants
similar designations for the other facilities we reviewed, which have similar or more severe leaks.
Based upon our review of these sites, we drew three primary conclusions:
1. Existing data point to groundwater contamination caused by coal combustion waste
beneath every plant we studied. For many sites, contamination is intensifying as CCW
continues to build up in ponds and landfills.
2. Kentucky’s regulatory program is not properly addressing this threat; instead, it’s getting
weaker. Even as evidence of contamination mounted in state files, Kentucky reduced
monitoring requirements, failed to commence enforcement action, and continued to
permit new ponds and landfills without proper controls.
10
See generally EPA, Coal Combustion Waste Damage Case Assessments (2007). 11
See id. at 43 (describing leaks to the Ohio River from the East Bend site).
- 6 -
3. Kentucky is not comprehensively tracking where CCW contamination is going, putting off-
site drinking water and communities at risk and allowing CCW discharges to enter our
rivers and streams. Because heavy metals found in CCW waste are toxic in extremely low
concentrations, and many of these metals accumulate over time, the combination of
information gaps and leaky CCW sites is very dangerous.
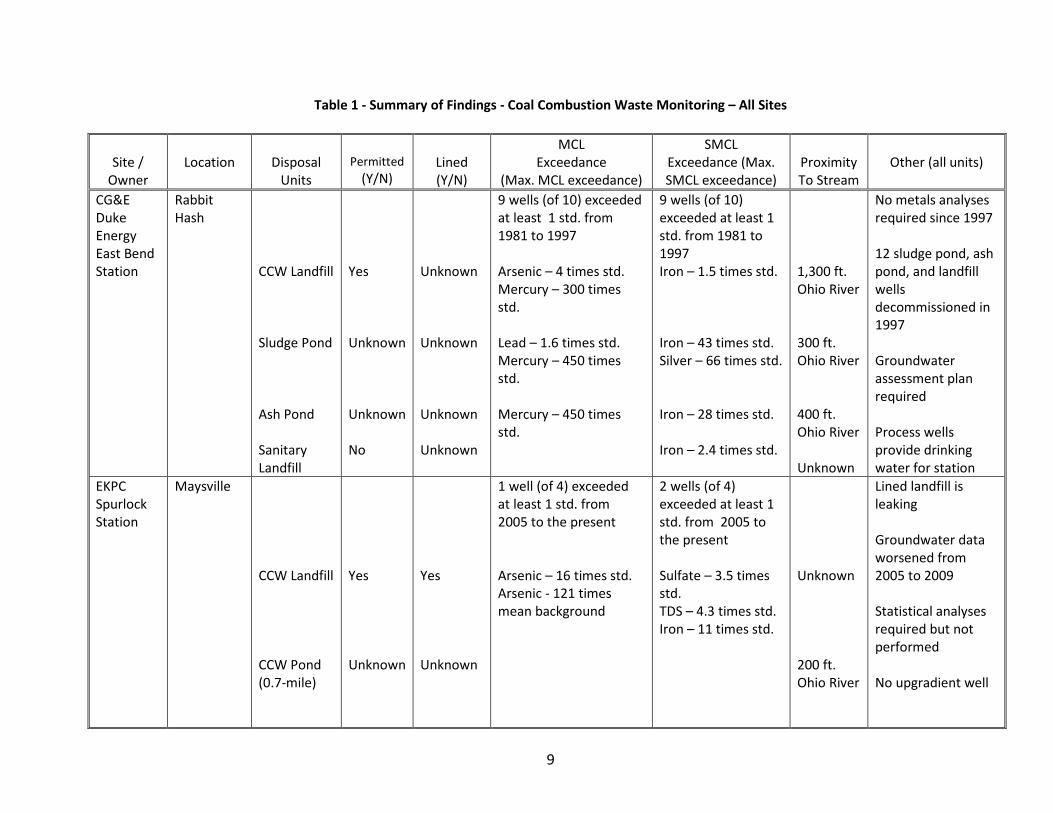
Our detailed results appear in the summary table below and in the plant-by-plant data attached to
this report.
It is clear that something is badly wrong with the water under these waste facilities, and that the
pollutants in that water are consistent with coal combustion waste contamination. Highlights of our
findings include the following:
Clear Contamination
• Total dissolved solids (TDS), chlorides, iron, and/or sulfate parameter concentrations
indicate groundwater contamination at every site. TDS, chlorides, iron, and sulfates are
known to be good indicators of coal combustion wastes in groundwater and surface water.
• Every site that tested for heavy metals and reported the data to the Division of Waste
Management had metal concentrations that exceeded state and EPA drinking water
standards (e.g. Duke Energy East Bend; EKPC Spurlock; TVA Shawnee; Big Rivers D.B. Wilson;
Big Rivers R.D. Green). In some cases, metals contamination is more than a hundred times
over drinking water standards.
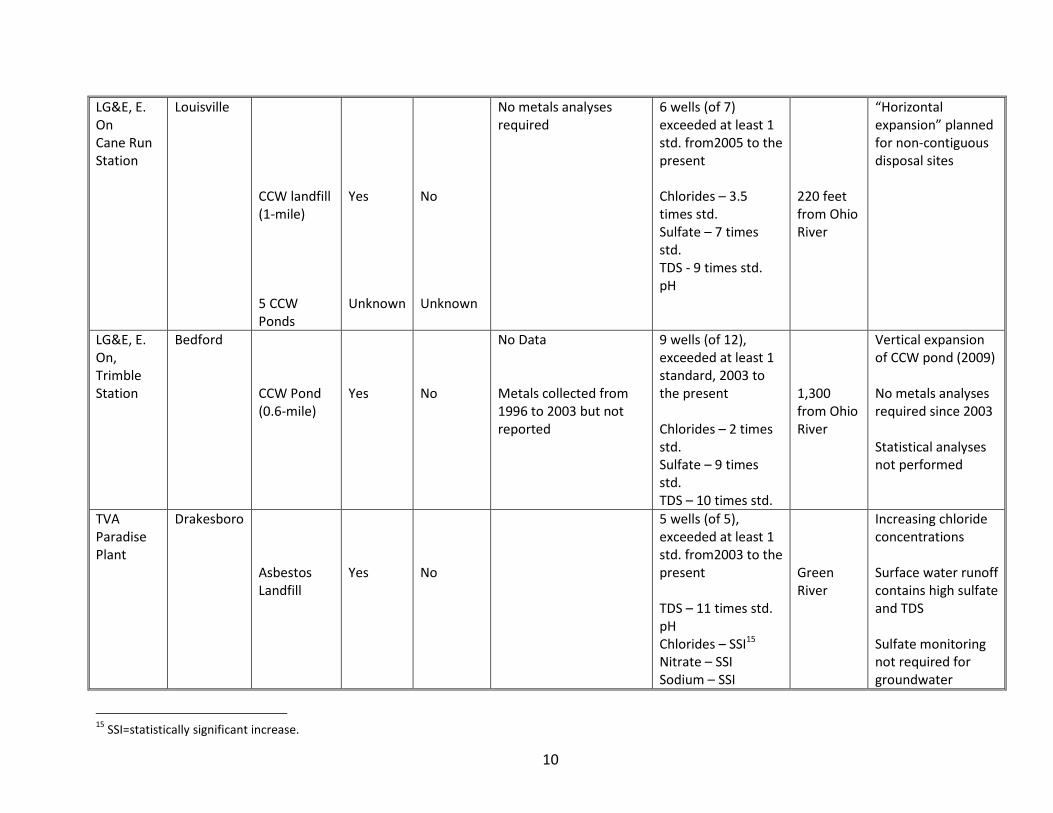
• CCW ponds are clearly leaking into the groundwater beneath them, as every pond for which
data were available was associated with contamination (e.g. LG&E Trimble Station; Duke
Energy East Bend).
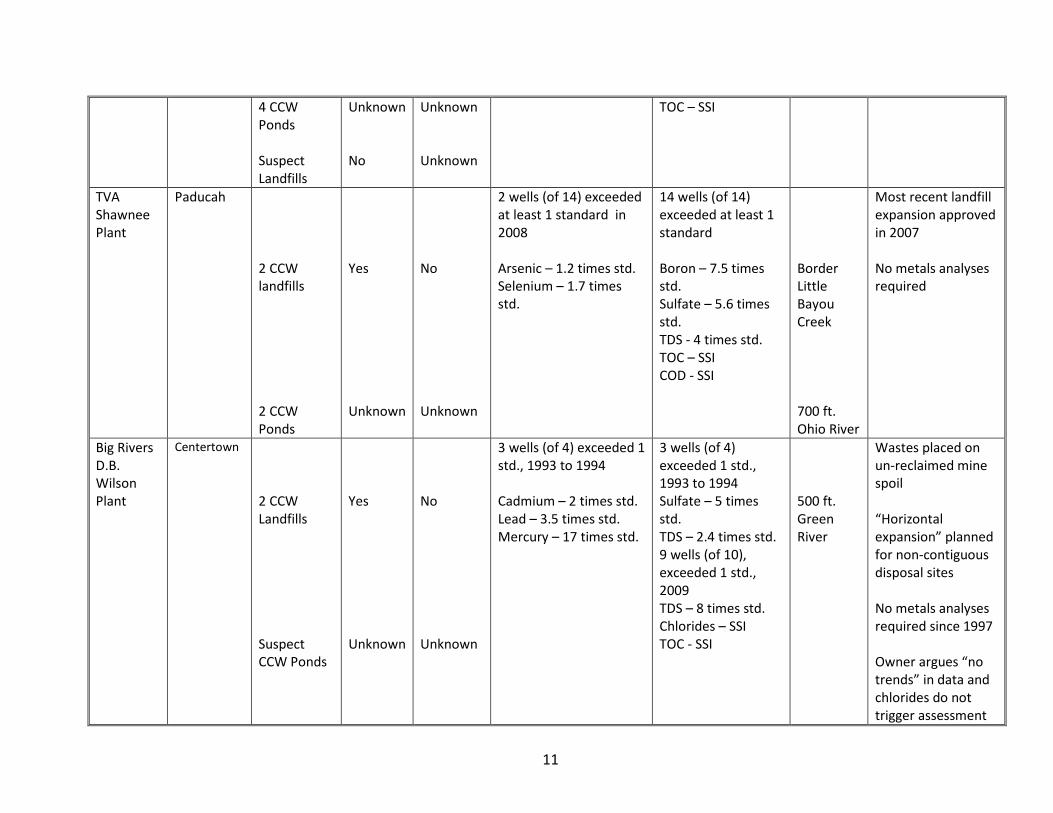
• Groundwater contamination problems are becoming more acute with time at many sites,
presumably due to long-term leakage (e.g., TVA Paradise, TVA Shawnee, Big Rivers D.B.
Wilson).
• Compacted clay-liners have proven ineffective at preventing contaminant migration from
the “dry” waste disposal in landfills (e.g. EKPC Spurlock Station).
• Coal combustion wastes are placed in unlined landfills on un-reclaimed mine spoil sites in
close proximity to rivers, and there is no meaningful soil barrier on the spoil to provide any
pollutant attenuation (e.g. Big Rivers D.B. Wilson Plant).
Failed Oversight
• Ash ponds are not monitored statewide even though data clearly indicate leakage resulting
in contamination of groundwater (e.g. LG&E Trimble Station; Duke Energy East Bend). Ash
ponds are extensive in acreage (up to ¾-mile long) and are located adjacent to major rivers
and small tributary streams (e.g. EKPC Spurlock Station; LG&E Trimble Station).
- 7 -
• Groundwater monitoring programs dating to the 1980s and mid-1990s were more stringent
because metals testing was required. The Division of Waste Management discontinued
metals testing in 1997 / 1998, even though contamination above regulatory standards
existed dating to the 1980s (e.g. Duke Energy East Bend, Big Rivers D.B. Wilson and R.D.
Green Plants).
• No surface water, fish and aquatic life, or sediment monitoring is required even where
contaminated groundwater is expected to discharge to a receiving stream (e.g. LG&E Trimble
Station; LG&E Cane Run).
• Statistical analyses of groundwater data are not always required and even when required,
are not always performed by the owner (e.g. LG&E Trimble Plant; EKPC Spurlock).
• The Division of Waste Management does not require that potentiometric surface diagrams
for each groundwater monitoring event be prepared, even though the owner already has
the information necessary to prepare such a map. As a result, neither the Division nor the
plant owner knows with certainty the rate or direction of groundwater flow that are critical
to determine migration pathways and risks. Instead, plant owners report wells as
“upgradient”, “downgradient” or “sidegradient,” and Division staff must take companies’
word for it if they do not conduct further research.
• In fact, even basic maps showing the location of monitoring wells were missing from some
files.
Continuing Pollution
• Unlined disposal sites that the Division of Waste Management continues to approve are
typically located adjacent to receiving streams where shallow groundwater is expected.
• Many ash ponds are not lined and expansions of unlined ponds continue – even though
groundwater data at expansion sites indicate contamination of groundwater (e.g. LG&E
Trimble).
• Recent unlined, horizontal expansions of permit-by-rule landfills continue even though there
is clear evidence of leakage resulting in groundwater contamination, and/or the “horizontal
expansions” are not contiguous on power plant properties (e.g., TVA Shawnee; Big Rivers
D.B. Wilson Plant; LG&E Cane Run Station).
Kentucky’s failure to control metal discharges is particularly troubling. Monitoring groundwater and
surface water for metals, and controlling these discharges, should be of utmost importance to
Kentucky because these substances can be extremely harmful at very low concentrations. A
summary of the metals detected above regulatory standards at one or more of the power plant
sites and their known harm is below. Importantly, these metals may not produce these results in
every case: not everyone responds in the same way to pollution. But it is clear that even very small
concentrations of these pollutants can make people sick. Indeed, EPA studies have found that
cancer risk for well users living near leaking CCW sites can increase dramatically.12
12
See EPA, Draft Human and Ecological Risk Assessment of Coal Combustion Wastes (Aug. 6, 2007); See also Earthjustice
& Environmental Integrity Project, Coming Clean: What the EPA Knows About the Dangers of Coal Ash (May 2009).
- 8 -
Metals and Their Effects
Parameter Effect
Arsenic Human carcinogen (0.01 mg/L MCL)
Boron Nausea, vomiting, and throat ulcer (2.0 mg/L EPA
long-term child health advisory average)
Cadmium Kidney, lung, and bone damage (0.005 mg/L MCL)
Lead Kidney damage, high blood pressure, and
development delays for children (0.015 mg/L MCL)
Mercury Kidney damage (0.002 mg/L MCL)
Selenium Hair and fingernail loss (0.05 mg/L MCL)
Fish and aquatic life toxicity (0.020 mg/L acute
toxicity, 0.005 mg/L chronic toxicity, 401 KAR,
10:031)
Toxins leaching from CCW can also cause substantial environmental harm. Heavy metals that
slowly accumulate in the food chain are particularly dangerous, and may be toxic at extremely small
concentrations. EPA, for instance, recommends that states set water quality limits to ensure that
ecosystems are not exposed to chronic levels of more than just 0.77 micrograms of mercury per liter
– that is, 0.00000077 grams – or more than 5 micrograms per liter of selenium.13 Long term leaks
from CCW sites can push ecosystems above such limits, leading to lasting harm to rivers and
streams.14
The conclusion is simple: Kentucky has failed to control coal combustion waste pollution and that
pollution is dangerous.
13
See EPA, National Recommended Water Quality Criteria, available at
http://www.epa.gov/waterscience/criteria/wqctable/. 14
See, e.g., A. Dennis Lemly, Aquatic Exposure to Selenium is a Global Environmental Safety Issue, 59 Ecotoxicology and
Environmental Safety 44 (2004) (observing that coal ash may have as much as 1250 times the selenium that unburned
coal does and listing “locations where selenium pollution has contaminated fish and wildlife populations”).
9
Table 1 - Summary of Findings - Coal Combustion Waste Monitoring – All Sites
Site /
Owner
Location
Disposal
Units
Permitted
(Y/N)
Lined
(Y/N)
MCL
Exceedance
(Max. MCL exceedance)
SMCL
Exceedance (Max.
SMCL exceedance)
Proximity
To Stream
Other (all units)
CG&E
Duke
Energy
East Bend
Station
Rabbit
Hash
CCW Landfill
Sludge Pond
Ash Pond
Sanitary
Landfill
Yes
Unknown
Unknown
No
Unknown
Unknown
Unknown
Unknown
9 wells (of 10) exceeded
at least 1 std. from
1981 to 1997
Arsenic – 4 times std.
Mercury – 300 times
std.
Lead – 1.6 times std.
Mercury – 450 times
std.
Mercury – 450 times
std.
9 wells (of 10)
exceeded at least 1
std. from 1981 to
1997
Iron – 1.5 times std.
Iron – 43 times std.
Silver – 66 times std.
Iron – 28 times std.
Iron – 2.4 times std.
1,300 ft.
Ohio River
300 ft.
Ohio River
400 ft.
Ohio River
Unknown
No metals analyses
required since 1997
12 sludge pond, ash
pond, and landfill
wells
decommissioned in
1997
Groundwater
assessment plan
required
Process wells
provide drinking
water for station
EKPC
Spurlock
Station
Maysville
CCW Landfill
CCW Pond
(0.7-mile)
Yes
Unknown
Yes
Unknown
1 well (of 4) exceeded
at least 1 std. from
2005 to the present
Arsenic – 16 times std.
Arsenic - 121 times
mean background
2 wells (of 4)
exceeded at least 1
std. from 2005 to
the present
Sulfate – 3.5 times
std.
TDS – 4.3 times std.
Iron – 11 times std.
Unknown
200 ft.
Ohio River
Lined landfill is
leaking
Groundwater data
worsened from
2005 to 2009
Statistical analyses
required but not
performed
No upgradient well
10
LG&E, E.
On
Cane Run
Station
Louisville
CCW landfill
(1-mile)
5 CCW
Ponds
Yes
Unknown
No
Unknown
No metals analyses
required
6 wells (of 7)
exceeded at least 1
std. from2005 to the
present
Chlorides – 3.5
times std.
Sulfate – 7 times
std.
TDS - 9 times std.
pH
220 feet
from Ohio
River
“Horizontal
expansion” planned
for non-contiguous
disposal sites
LG&E, E.
On,
Trimble
Station
Bedford
CCW Pond
(0.6-mile)
Yes
No
No Data
Metals collected from
1996 to 2003 but not
reported
9 wells (of 12),
exceeded at least 1
standard, 2003 to
the present
Chlorides – 2 times
std.
Sulfate – 9 times
std.
TDS – 10 times std.
1,300
from Ohio
River
Vertical expansion
of CCW pond (2009)
No metals analyses
required since 2003
Statistical analyses
not performed
TVA
Paradise
Plant
Drakesboro
Asbestos
Landfill
Yes
No
5 wells (of 5),
exceeded at least 1
std. from2003 to the
present
TDS – 11 times std.
pH
Chlorides – SSI15
Nitrate – SSI
Sodium – SSI
Green
River
Increasing chloride
concentrations
Surface water runoff
contains high sulfate
and TDS
Sulfate monitoring
not required for
groundwater
15
SSI=statistically significant increase.
11
4 CCW
Ponds
Suspect
Landfills
Unknown
No
Unknown
Unknown
TOC – SSI
TVA
Shawnee
Plant
Paducah
2 CCW
landfills
2 CCW
Ponds
Yes
Unknown
No
Unknown
2 wells (of 14) exceeded
at least 1 standard in
2008
Arsenic – 1.2 times std.
Selenium – 1.7 times
std.
14 wells (of 14)
exceeded at least 1
standard
Boron – 7.5 times
std.
Sulfate – 5.6 times
std.
TDS - 4 times std.
TOC – SSI
COD - SSI
Border
Little
Bayou
Creek
700 ft.
Ohio River
Most recent landfill
expansion approved
in 2007
No metals analyses
required
Big Rivers
D.B.
Wilson
Plant
Centertown
2 CCW
Landfills
Suspect
CCW Ponds
Yes
Unknown
No
Unknown
3 wells (of 4) exceeded 1
std., 1993 to 1994
Cadmium – 2 times std.
Lead – 3.5 times std.
Mercury – 17 times std.
3 wells (of 4)
exceeded 1 std.,
1993 to 1994
Sulfate – 5 times
std.
TDS – 2.4 times std.
9 wells (of 10),
exceeded 1 std.,
2009
TDS – 8 times std.
Chlorides – SSI
TOC - SSI
500 ft.
Green
River
Wastes placed on
un-reclaimed mine
spoil
“Horizontal
expansion” planned
for non-contiguous
disposal sites
No metals analyses
required since 1997
Owner argues “no
trends” in data and
chlorides do not
trigger assessment
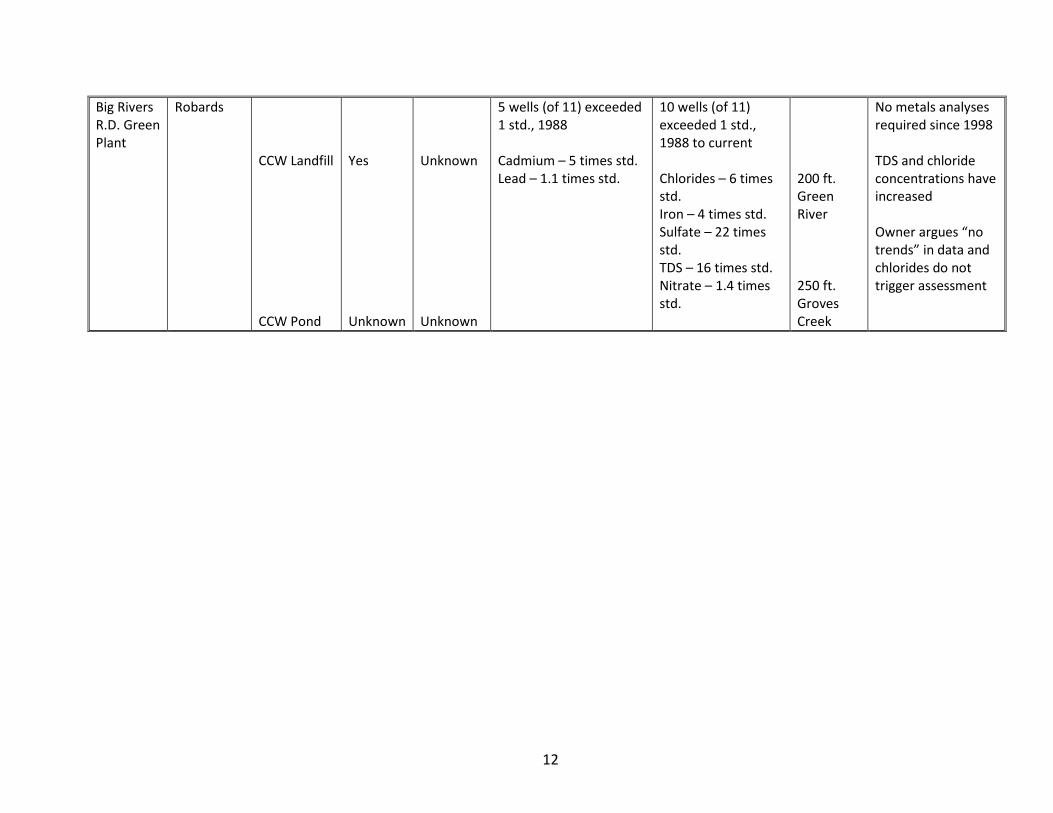
12
Big Rivers
R.D. Green
Plant
Robards
CCW Landfill
CCW Pond
Yes
Unknown
Unknown
Unknown
5 wells (of 11) exceeded
1 std., 1988
Cadmium – 5 times std.
Lead – 1.1 times std.
10 wells (of 11)
exceeded 1 std.,
1988 to current
Chlorides – 6 times
std.
Iron – 4 times std.
Sulfate – 22 times
std.
TDS – 16 times std.
Nitrate – 1.4 times
std.
200 ft.
Green
River
250 ft.
Groves
Creek
No metals analyses
required since 1998
TDS and chloride
concentrations have
increased
Owner argues “no
trends” in data and
chlorides do not
trigger assessment
13
What Went Wrong?
How did contamination become so severe and so widespread? After all, most coal combustion
waste issues can be solved by using modern landfills with composite liners (which are
multilayered lining systems) and effective leachate collection and treatment systems. Yet,
Kentucky continues to permit antiquated projects without basic monitoring and safeguards.
In part, this state of affairs came about because the coal industry has spent decades insisting,
despite mountains of evidence to the contrary, that its waste is not dangerous. In part, it is
because the EPA has failed to provide federal leadership by classifying and regulating coal
combustion waste as the hazardous waste that it is. And, in part, it is because Kentucky, in the
absence of federal leadership, did not act strongly enough to protect its citizens.
The state oversight structure fails at the start due to a state law classifying most coal
combustion waste as “special waste,” which is defined as “high volume and low hazard.”16 This
decision, which ignores the heavy metals that leach from these wastes, permits the Division of
Waste Management to regulate these “special wastes” as a distinct category, to be treated as if
it is not dangerous.
Compounding this problem is the Kentucky legislature’s decision not to lead on environmental
issues. A section of the Kentucky code provides that Kentucky rules “shall be no more stringent
than the federal law or regulations.”17 As a result, Kentucky has largely decided to follow the
federal government’s lead, rather than to actively work to find solutions to environmental
challenges. Although Kentucky could still do better, even with this prohibition, its decision to
preemptively limit its efforts to protect citizens and the environment is a lasting mistake.
The regulatory structure that has resulted from these choices has many flaws, including:
• Free passes for dangerous CCW ponds
CCW ponds are among the most dangerous of all coal combustion waste sites but the
Kentucky rules pay them almost no attention. “[S]pecial waste surface impoundments”
–ponds – which comply with state water discharge permits are “permit-by-rule.”18 That
means that the Division of Waste Management just “deem[s]” that they have a permit
provided they meet extremely basic generic design requirements, which do not even
include a requirement to line and monitor the pond. As a result, CCW ponds are not
subject to detailed engineering reviews, public oversight, or most protective rules. CCW
ponds should be phased out entirely – not completely overlooked.
• A “beneficial reuse” loophole
“Beneficial reuse” projects, which are very broadly defined, are also in the “permit-by-
rule” category.19 As a result, if a company recharacterizes a CCW disposal site as, for
16
K.R.S. § 224.50-760. 17
K.R.S. § 13A-120(1). 18
See 401 K.A.R. 45:060 § 1(4). 19
401 K.A.R. 45:060 § 1.
14
instance, “structural fill,” “highway base” material, or “mine stabilization and
reclamation material,” it may be able to evade permit review – even though the site
remains dangerous. The company must “characterize[ ] the nonhazardous nature of the
coal combustion byproducts” to use this loophole, but it’s far from clear that this
requirement is applied rigorously – especially because CCW is inherently hazardous.
Moreover, even if that hurdle is cleared, most design review requirements are waived,
save for basic siting standards, which means that these projects may lack liners,
appropriate monitoring systems, or other safeguards a full permit review would include.
.If “beneficial reuse” of this sort can ever be safe, oversight must be far tighter,
ensuring, for instance, that any ash is safely insulated from water supplies.
• Lax design requirements
Even those projects that escape the “permit-by-rule” loopholes do not face much
stronger oversight. Design requirements for special waste landfills are weak. Liners,
cover materials, and leachate collection systems – the basic, unglamorous tools that
would prevent most coal combustion waste contamination -- must be used only if the
Division of Waste Management determines that a company should be “required” to do
so – not as a matter of course. Rather than establishing a firm, sensible baseline, the
rules leave basic safety measures as options, to be implemented on a case-by-case
basis.
• A major water loophole
The Division of Waste Management may require a landfill to collect its leachate, but it
does not set treatment standards for the leachate discharges themselves. That
responsibility falls to the Division of Water, and the Division of Water is not doing its job.
The Division of Water regularly fails to impose any limits on heavy metals in coal
combustion waste discharges because antiquated EPA guidelines, which are nearly
thirty years old, do not contain such requirements. EPA itself has warned that the
guidelines “do not adequately address the pollutants being discharged” and cautioned
that states nonetheless have a duty to impose appropriate limits.20 Because the Division
of Water ignores this duty, untreated toxin-filled landfill leachate can be discharged into
rivers, streams, or even the old unlined ash ponds landfills are meant to replace.
Indeed, the Division of Water sometimes declines to process a discharge permit at all,
on the grounds that ash ponds are “zero discharge,” a stance that ignores the state’s
own data demonstrating extensive leaks. Even worse, many of these new landfills,
including, for instance, LG&E’s $94 million Trimble landfill project, are ratepayer-
funded,21 in part because they have been presented as environmental improvements. It
risks public health and wastes ratepayer money to build new ash landfills when the
Division of Water allows their leachate discharges to wind up right back in old ponds or
in rivers.
20
See 74 Fed. Reg. 55,837 (Oct. 29, 2009); 74 Fed. Reg. 65,599 (Dec. 28, 2009). 21
See, e.g., PSC Order in Case 2009-00197 (Dec. 23, 2009).
15
• Subpar enforcement
Even though file data show that pollution is widespread and increasing, Kentucky
enforcement agencies are not acting to force CCW dumpers to clean up their acts.
Under Kentucky’s rules, all waste impoundments must, at a minimum, avoid violating
primary MCLs, which are core federal groundwater protections against toxic metals like
arsenic and mercury.22 Such violations should trigger enforcement action and should
also trigger groundwater contamination corrective action.23 Despite the systemic
violations and contamination documented in the Division of Waste Management’s own
monitoring data, we are aware of only one completed groundwater assessment for a
CCW site – the East Bend facility – which was finished only months ago. The state has
had evidence of violations and spreading contamination for years, but has not acted to
enforce against violators or to reform its rules.
• Inadequate monitoring and review
The rules blind Kentucky to problems in several ways.
First, although ponds are the most likely to be leaking, the monitoring rules do
not require groundwater monitoring around CCW ponds. Although the Division of
Waste Management may require such monitoring, it must do so only for landfills.24 As a
result, contamination from ponds is only regularly measured where facilities have
installed monitoring wells for other purposes.
Second, the rules do not require regular monitoring off-site. Spreading
contamination is a major problem, but the groundwater monitoring system requires a
minimum of just three wells – one upgradient from the waste and two downgradient.25
The rules do not explicitly require off-site monitors, even if contamination is detected
onsite. For other forms of solid waste, three, not two, downgradient wells are required,
along with surface water monitoring that might better catch contamination.26
Third, the rules, as enforced, do not even cover all the contaminants that coal
combustion waste may produce. The special waste rules on the books require
monitoring for most (but not all) the metals in coal combustion waste in baseline
testing, but not over time, as metals leach and dump sites age.27 In practice, plants get
away with very little monitoring. In several cases, metal monitoring requirements have
simply been dropped from monitoring reports, leaving regulators in the dark. In others,
such requirements were never included.
Fourth, in assessing new applications, the Division of Waste Management does
not appear to be tracking the most recent testing data for CCW’s leaching risk. Both EPA
and the National Research Council of the National Academy of Sciences have concluded
that the “TCLP” test – a short term test that only assesses whether materials will leach
under the conditions of a municipal landfill, and which Kentucky agencies regularly
22
See 401 K.A.R. 45. 060, 45:070, & 45:110 (all requiring compliance with environmental performance standards in
401 K.A.R. 30:031); 401 K.A.R. 30:031 § 5 (groundwater requirements); 401 K.A.R. 8:250 (incorporating federal
MCLs). 23
See 401 K.A.R. 45.160 § 5. 24
401 K.A.R. 45:160 § 1. 25
Id. § 2. 26
See 401 K.A.R. 48:300. 27
See id. § 7.
16
accept – underestimate these risks over the long time periods and varied conditions that
CCW ponds and landfills face.28 Indeed, several EPA reports, published from 2006 to
2009, provide conclusive evidence that this single-point pH test is not sufficient for
evaluating potential impacts from the disposal and reuse of coal combustion waste.
According to the EPA, the single-point leach test, the Toxicity Characteristic Leaching
Procedure (TCLP), should be replaced by a test that more accurately predicts the levels
of toxic metals that can leach out of coal ash when the ash is improperly disposed and
re-used.29
These failures are just the tip of the iceberg. Kentucky’s rules are due for a major overhaul,
commensurate with the scale of the coal combustion waste crisis.
Conclusions and Recommendations
State regulation of coal combustion waste is failing in Kentucky. CCW ponds and landfills
around the states appear to be leaking and coal companies are clamoring to build even more
CCW disposal sites – often at ratepayer expense. Meanwhile, Kentucky’s regulatory system
fails to require even basic monitoring for many sites, much less the quality engineering that
would reduce contamination risk. This situation must come to an end. We recommend that
Kentucky:
1. Recognize that coal combustion waste, including ash, slag, and scrubber sludge, is toxic
and advocate for strong federal regulation of these substances as hazardous waste.
2. Immediately commence a detailed file review and field testing program to identify all
relevant data for all CCW sites in Kentucky and analyze this information for evidence of
possible leaks and contamination. Where information is inadequate, Kentucky should
require companies to submit additional monitoring data.
3. Ensure that this review is open to the public and conducted through a participatory
process that encourage citizens to report possible damage cases
4. Revise its special waste statutes and regulations to treat coal combustion waste as a
public health and environmental threat warranting strict control, including:
28
See NRC, Managing Coal Combustion Residues in Mines (2006); see also Tom FitzGerald, Current Issues in the
Regulation of Coal Ash, World of Coal Ash Conference (2009) (discussing leaching results. 29
EPA fully describes its transition to a more sensitive and accurate leaching test for coal ash in the following
studies:
Characterization of Coal Combustion Residues from Electric Utilities Using Wet Scrubbers for Multi-Pollutant
Control" (EPA/600/R-08/077) July2008, available at:
http://www.epa.gov/nrmrl/pubs/600r08077/600r08077.htm.
(2) "Characterization of Mercury-Enriched Coal Combustion Residues from Electric Utilities Using Enhanced
Sorbents for Mercury Control" (EPA-600/R-06/008) February 2006; available
at:http://www.epa.gov/nrmrl/pubs/600r06008/600r06008.pdf
(3) U.S. EPA, Characterization of Coal Combustion Residues from Electric Utilities Using Multi-Pollutant Control
Technology – Leaching and Characterization Data (EPA-600/R-09/151) December 2009, available at
http://www.epa.gov/nrmrl/pubs/600r09151/600r09151.html
17
a. Banning all new CCW ponds. Require a swift transition to dry handling of coal
ash and phase-out dangerous wet storage in ponds, which pose the greatest
danger of contaminating groundwater and surface water, as well as the risk of
catastrophic collapse.
b. Banning all new permit-by-rule beneficial use areas where unencapsulated ash is
used as structural fill, for road-building, for mine stabilization and reclamation,
or in other circumstances that could contaminate ground or surface water.
c. Requiring that all dry landfills use composite liner systems, appropriate and
durable cover materials, and effective leachate collection systems.
d. Providing for detailed and systematic monitoring of all coal combustion waste
sites, including hydrogeological baseline monitoring before disposal begins and
offsite groundwater and surface water monitoring to track any contamination
plumes. Monitoring and analysis of coal combustion waste should include
appropriate leaching tests that accurately characterize long-term leaching
potential over varied conditions.
5. Close the “water loophole” by making clear that the Division of Water must follow
federal law and strictly control metals and other pollutants in any leachate
discharge.
6. Swiftly investigate and implement measures to reduce the production of coal
combustion waste by transitioning to cleaner energy sources.
Kentuckians deserve clean, healthy drinking water and thriving, healthy rivers and streams. It’s
time for the Commonwealth to take action to protect its citizens from coal combustion waste.
18
Part 2 - File Review Summary – Individual Sites
2.1 Cincinnati Gas and Electric / Duke Energy, East Bend Station, Rabbit Hash
Location
6293 Beaver Road
Rabbit Hash, Kentucky 41005
Boone County
GPS Coordinates: 38°54’26”; 84°50’25”
Summary
Groundwater data indicate multiple exceedances of groundwater standards as early as 1981 for
arsenic, mercury, iron, and TDS. Monitoring programs for a sanitary landfill, an ash pond, and
sludge ponds were terminated sometime between 1981 and 1994 even though there was
evidence of leakage from the bottom of those waste disposal units, and there was groundwater
contamination. An unmonitored ash pond is situated within approximately 400 feet of the Ohio
River. An increase of contaminants downgradient of the coal combustion waste landfill
indicates that the landfill is leaking. Groundwater elevation and temperature data suggest that
the ash pond is leaking and resulting in mounding of the groundwater in the area. A
groundwater and risk assessment was performed for the ash pond 10 years after the
assessment was first required. That assessment concluded that there were no risk to human
and ecological receptors but the assessment was substantially flawed – it failed to consider
heavy metals that have been detected at high concentrations in the groundwater, failed to
consider groundwater discharge to a nearby small receiving stream, and included very limited
ash pond water samples.
Type(s) of Waste Management Units and Wastes Present
Special waste landfill that contains unspecified coal combustion wastes. Correspondence in the
file suggests that groundwater monitoring wells were installed in 1980. The landfill is situated
approximately 1,300 feet north of the Ohio River.
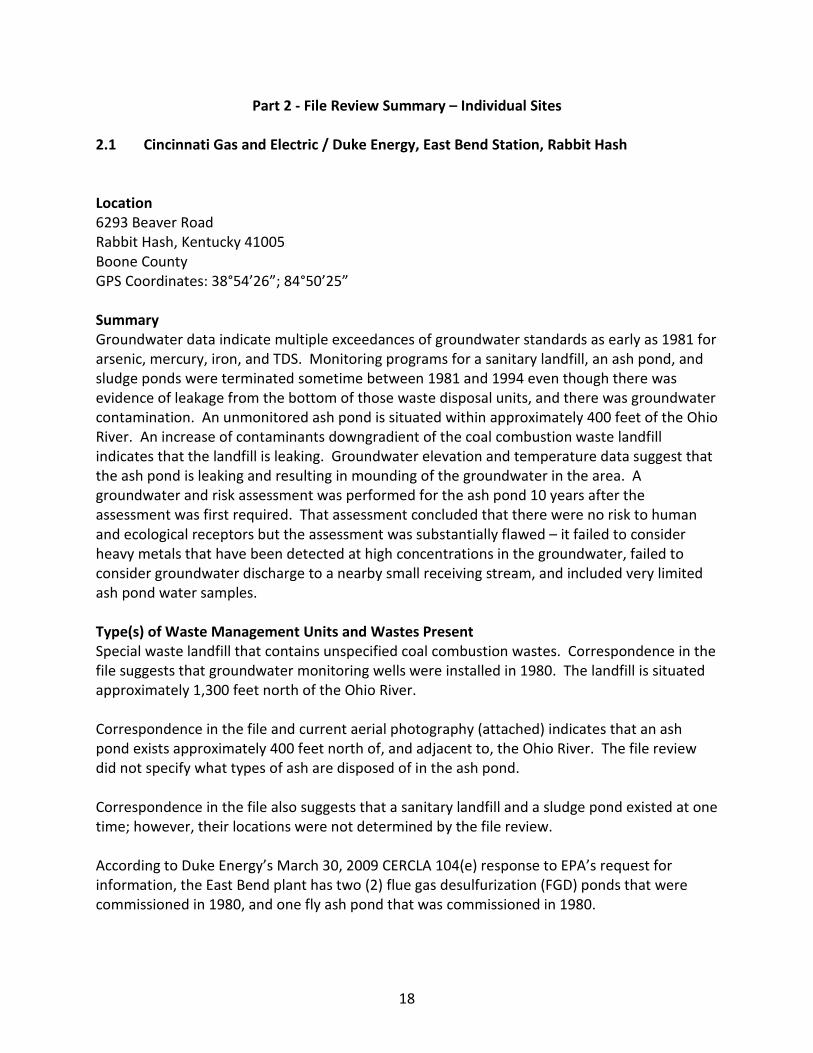
Correspondence in the file and current aerial photography (attached) indicates that an ash
pond exists approximately 400 feet north of, and adjacent to, the Ohio River. The file review
did not specify what types of ash are disposed of in the ash pond.
Correspondence in the file also suggests that a sanitary landfill and a sludge pond existed at one
time; however, their locations were not determined by the file review.
According to Duke Energy’s March 30, 2009 CERCLA 104(e) response to EPA’s request for
information, the East Bend plant has two (2) flue gas desulfurization (FGD) ponds that were
commissioned in 1980, and one fly ash pond that was commissioned in 1980.
19
Aerial Photo – East Bend
Monitoring Requirements
The oldest correspondence from the file that provided groundwater data for the facility is 1981.
The monitoring system at that time included 6 wells at the solid waste disposal area (Well 1 was
upgradient, Wells 2 through 6 downgradient); one upgradient well (Well 7) at a sanitary landfill;
a downgradient well (Well 8) at a sludge pond B; two downgradient wells (Wells 9 and 10) at an
ash storage area; and two production wells (TW-1 and TW-2) at the plant. Groundwater
monitoring in 1981 consisted of these parameters:
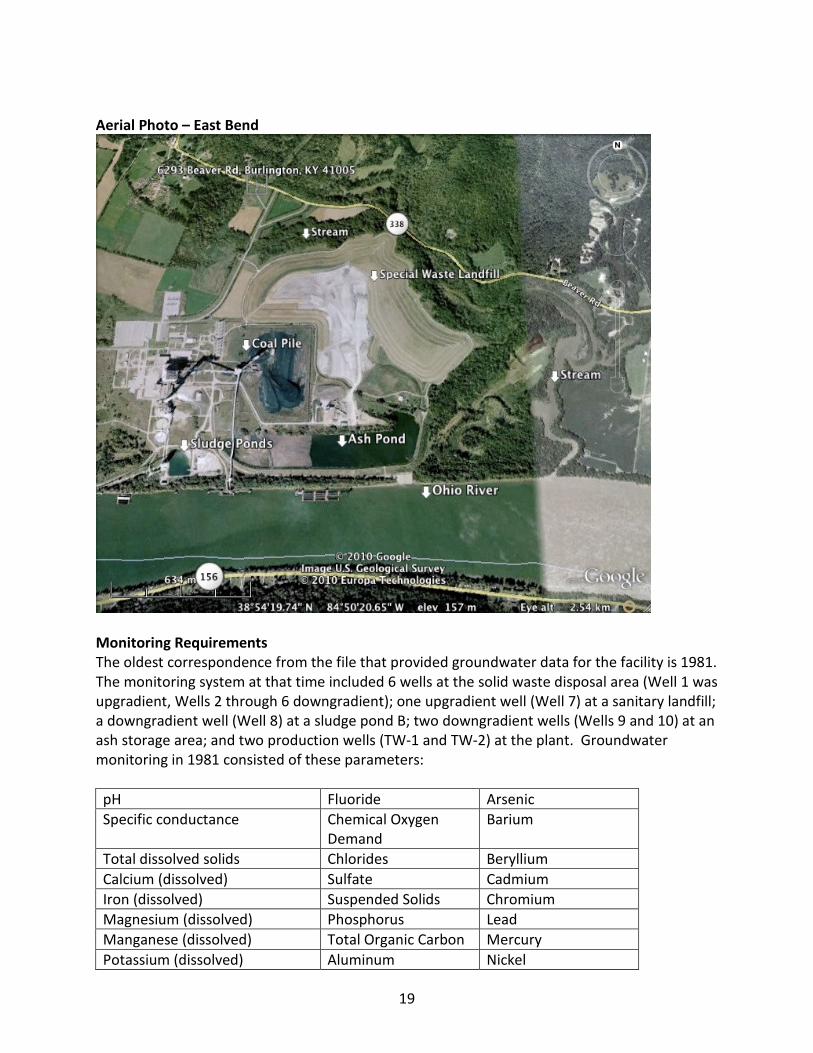
pH Fluoride Arsenic
Specific conductance Chemical Oxygen
Demand
Barium
Total dissolved solids Chlorides Beryllium
Calcium (dissolved) Sulfate Cadmium
Iron (dissolved) Suspended Solids Chromium
Magnesium (dissolved) Phosphorus Lead
Manganese (dissolved) Total Organic Carbon Mercury
Potassium (dissolved) Aluminum Nickel
20
Sodium (dissolved) Iron Selenium
Alkalinity Calcium Silver
Nitrate (as Nitrogen) Copper Thallium
Hardness Antimony Zinc
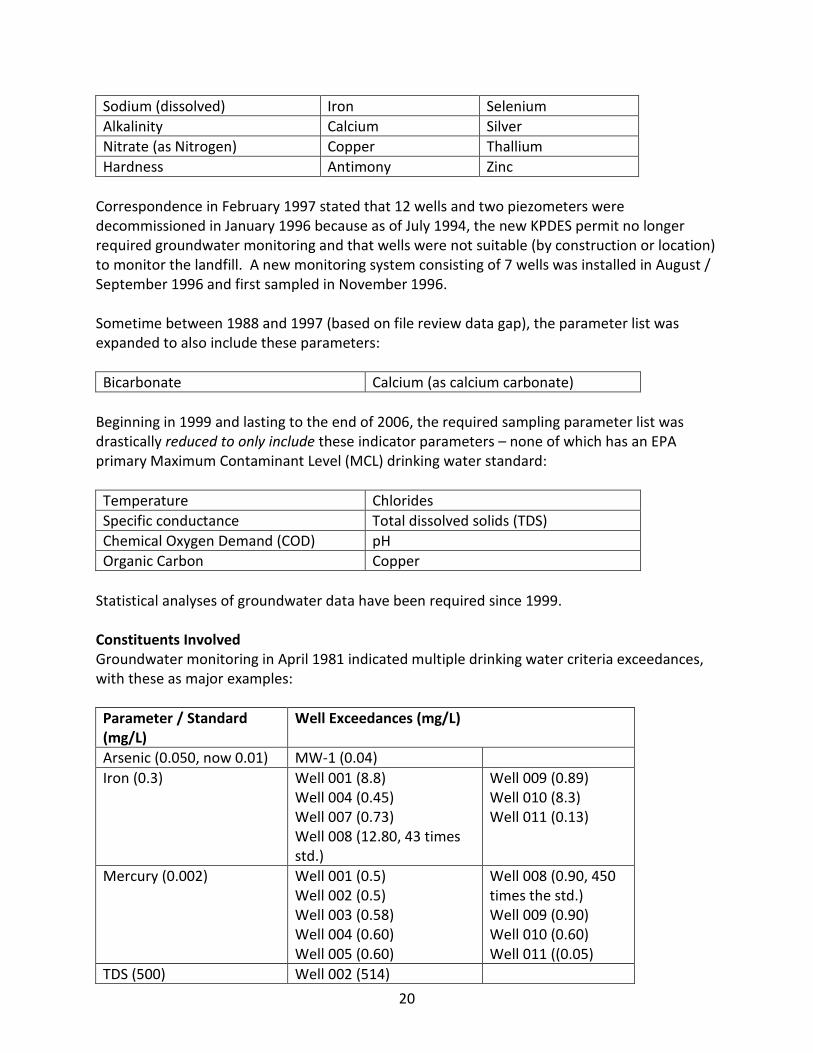
Correspondence in February 1997 stated that 12 wells and two piezometers were
decommissioned in January 1996 because as of July 1994, the new KPDES permit no longer
required groundwater monitoring and that wells were not suitable (by construction or location)
to monitor the landfill. A new monitoring system consisting of 7 wells was installed in August /
September 1996 and first sampled in November 1996.
Sometime between 1988 and 1997 (based on file review data gap), the parameter list was
expanded to also include these parameters:
Bicarbonate Calcium (as calcium carbonate)
Beginning in 1999 and lasting to the end of 2006, the required sampling parameter list was
drastically reduced to only include these indicator parameters – none of which has an EPA
primary Maximum Contaminant Level (MCL) drinking water standard:
Temperature Chlorides
Specific conductance Total dissolved solids (TDS)
Chemical Oxygen Demand (COD) pH
Organic Carbon Copper
Statistical analyses of groundwater data have been required since 1999.
Constituents Involved
Groundwater monitoring in April 1981 indicated multiple drinking water criteria exceedances,
with these as major examples:
Parameter / Standard
(mg/L)
Well Exceedances (mg/L)
Arsenic (0.050, now 0.01) MW-1 (0.04)
Iron (0.3) Well 001 (8.8)
Well 004 (0.45)
Well 007 (0.73)
Well 008 (12.80, 43 times
std.)
Well 009 (0.89)
Well 010 (8.3)
Well 011 (0.13)
Mercury (0.002) Well 001 (0.5)
Well 002 (0.5)
Well 003 (0.58)
Well 004 (0.60)
Well 005 (0.60)
Well 008 (0.90, 450
times the std.)
Well 009 (0.90)
Well 010 (0.60)
Well 011 ((0.05)
TDS (500) Well 002 (514)
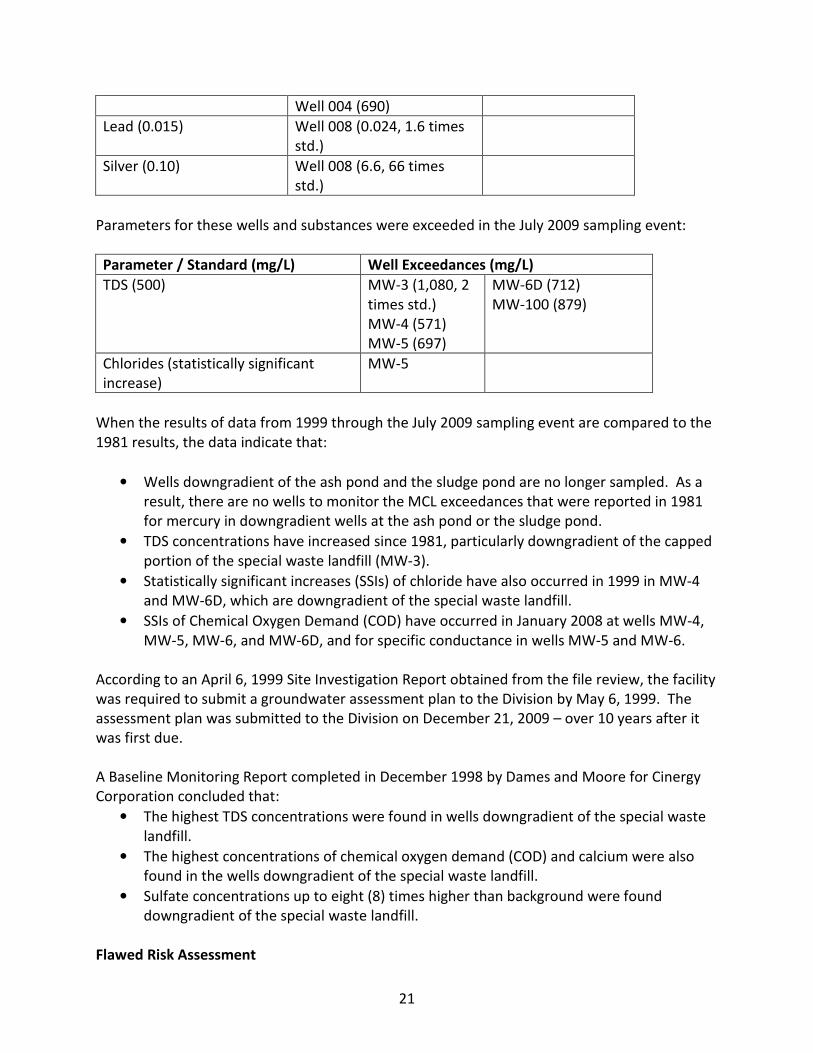
21
Well 004 (690)
Lead (0.015) Well 008 (0.024, 1.6 times
std.)
Silver (0.10) Well 008 (6.6, 66 times
std.)
Parameters for these wells and substances were exceeded in the July 2009 sampling event:
Parameter / Standard (mg/L) Well Exceedances (mg/L)
TDS (500) MW-3 (1,080, 2
times std.)
MW-4 (571)
MW-5 (697)
MW-6D (712)
MW-100 (879)
Chlorides (statistically significant
increase)
MW-5
When the results of data from 1999 through the July 2009 sampling event are compared to the
1981 results, the data indicate that:
• Wells downgradient of the ash pond and the sludge pond are no longer sampled. As a
result, there are no wells to monitor the MCL exceedances that were reported in 1981
for mercury in downgradient wells at the ash pond or the sludge pond.
• TDS concentrations have increased since 1981, particularly downgradient of the capped
portion of the special waste landfill (MW-3).
• Statistically significant increases (SSIs) of chloride have also occurred in 1999 in MW-4
and MW-6D, which are downgradient of the special waste landfill.
• SSIs of Chemical Oxygen Demand (COD) have occurred in January 2008 at wells MW-4,
MW-5, MW-6, and MW-6D, and for specific conductance in wells MW-5 and MW-6.
According to an April 6, 1999 Site Investigation Report obtained from the file review, the facility
was required to submit a groundwater assessment plan to the Division by May 6, 1999. The
assessment plan was submitted to the Division on December 21, 2009 – over 10 years after it
was first due.
A Baseline Monitoring Report completed in December 1998 by Dames and Moore for Cinergy
Corporation concluded that:
• The highest TDS concentrations were found in wells downgradient of the special waste
landfill.
• The highest concentrations of chemical oxygen demand (COD) and calcium were also
found in the wells downgradient of the special waste landfill.
• Sulfate concentrations up to eight (8) times higher than background were found
downgradient of the special waste landfill.
Flawed Risk Assessment
22
A revised groundwater assessment plan that also included a risk assessment was submitted to
the Department in December 2009. The risk assessment made the following conclusions:
Constituents of Probable Concern
• The only constituents of probable concern (COPC) were iron, manganese, and sulfate.
These parameters only have secondary drinking water standards established by EPA.
• The risk assessment included no risk determinations for heavy metals that have been
reported in the facility wells as early as 1981 above their respective drinking water
standard: arsenic, mercury, lead, and silver.
Human Risk Assessment Conclusion
• The only possible human exposure pathway was from ingesting water containing the
three COPCs from plant production wells that supply drinking water to the plant.
• The human health risk was acceptable for on-site workers but that any future residential
use would not be acceptable.
Ecological Risk Assessment Conclusion
• The only ecological exposure pathway that was examined was groundwater discharge to
the Ohio River.
• Iron and sulfate concentrations in groundwater do not pose a risk to ecological
receptors in the Ohio River.
• Manganese concentrations in groundwater exceeded the Ohio River surface water
screening criteria but that exceedance would not be expected once the groundwater
reaches the Ohio River because of dilution from the river.
• The ecological risk assessment was acceptable for ecological receptors.
Upon review of the risk assessment, the conclusion of no risk to both human and ecological
receptors is flawed because:
• The ecological pathway assessment did not even consider stream sampling and toxicity
determinations for an un-named tributary nearest the ash pond and landfill. That
stream represents the closest, most logical exposure pathway to fish and aquatic life -
yet it was never even considered in the risk assessment.
• The assessment did not include arsenic, mercury, lead, and silver--heavy metals that
have been reported in on-site wells in the past.
• The assessment did not include selenium, which is common in coal combustion wastes
and is extremely toxic to fish and aquatic life at extremely low concentrations.
• The ash pond water samples included no testing from the bottom of the pond in the
area of the highest COPC concentrations (northwest corner) and the lowest pH (2.79 at
the surface). In fact, only one bottom sample was collected for the entire pond.
• The ash pond water surface water samples were collected after an un-specified “brief”
plant outage and therefore may not be representative of the highest concentrations.
23
Hydrogeologic Conditions
The power plant location adjacent to the Ohio River suggests that shallow water table aquifer
conditions exist. According to a February 11, 1997, report by Dames and Moore, perched water
table and Ohio River valley aquifers occur at the plant. The wells that were installed in 1996 do
not monitor the perched water table and therefore do not monitor the upper-most water-
bearing zone.
Potentiometric surface diagrams have been prepared since at least 1997 for each sampling
event. Those diagrams show that groundwater flows from the landfill to the southwest and
southeast towards the Ohio River and even occasionally show flows away from the river to the
northwest. A December 14, 1998 report by Dames and Moore concluded that the reversed
groundwater flow direction was due to “infrequent strong rises” in the Ohio River; however,
this fact was not supported by their data because the river stage that they reported for the
same period “was relatively stable at approximately 455.5 feet”. The reversed flow could also
be due to pumping from plant groundwater production wells and mounding of groundwater
from waste disposal unit(s), including the unlined ash pond.
The results of temperature measurements obtained during groundwater sampling in July 1998
indicate that the well nearest the ash pond (MW-4) had a groundwater temperature 15° F
hotter (73.5° F) than the typical shallow aquifer well on-site (59° F) – suggesting that the ash
pond is leaking to the shallow aquifer.
24
2.2 East Kentucky Power Cooperative, Spurlock Station, Maysville
Location
Route 8
Maysville, KY 41056
Mason County
GPS Coordinates: 38°41’50”; 83°48’37”
Summary
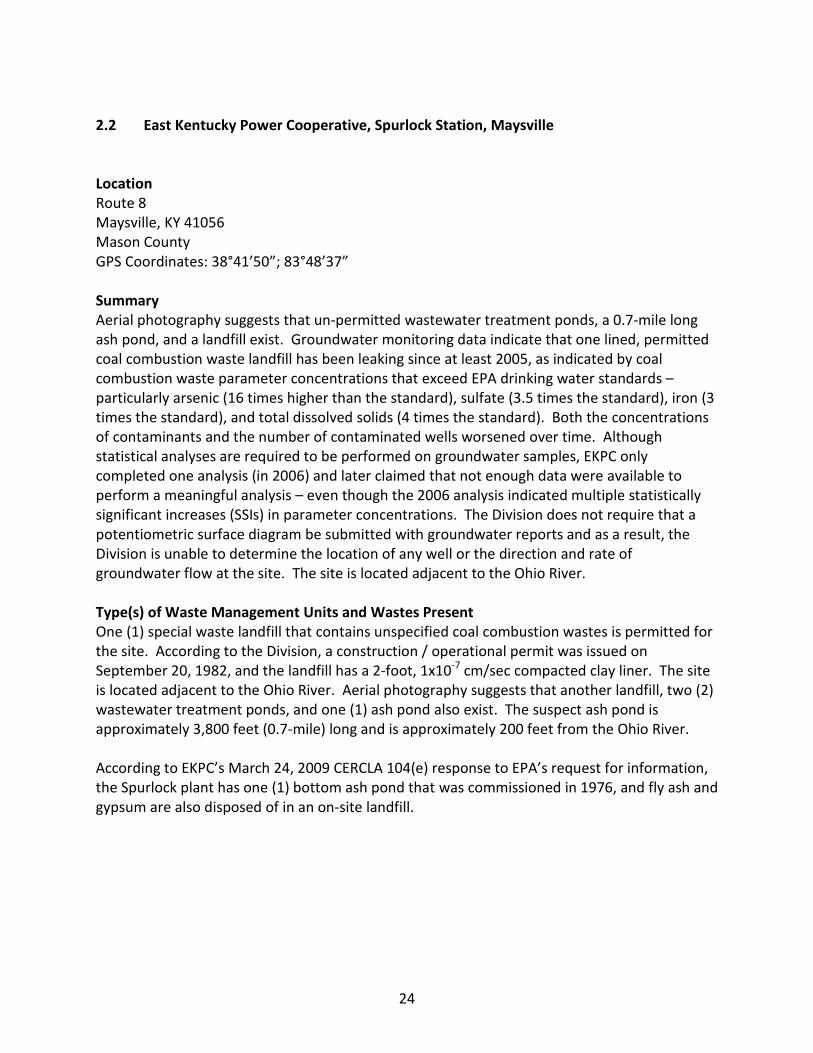
Aerial photography suggests that un-permitted wastewater treatment ponds, a 0.7-mile long
ash pond, and a landfill exist. Groundwater monitoring data indicate that one lined, permitted
coal combustion waste landfill has been leaking since at least 2005, as indicated by coal
combustion waste parameter concentrations that exceed EPA drinking water standards –
particularly arsenic (16 times higher than the standard), sulfate (3.5 times the standard), iron (3
times the standard), and total dissolved solids (4 times the standard). Both the concentrations
of contaminants and the number of contaminated wells worsened over time. Although
statistical analyses are required to be performed on groundwater samples, EKPC only
completed one analysis (in 2006) and later claimed that not enough data were available to
perform a meaningful analysis – even though the 2006 analysis indicated multiple statistically
significant increases (SSIs) in parameter concentrations. The Division does not require that a
potentiometric surface diagram be submitted with groundwater reports and as a result, the
Division is unable to determine the location of any well or the direction and rate of
groundwater flow at the site. The site is located adjacent to the Ohio River.
Type(s) of Waste Management Units and Wastes Present
One (1) special waste landfill that contains unspecified coal combustion wastes is permitted for
the site. According to the Division, a construction / operational permit was issued on
September 20, 1982, and the landfill has a 2-foot, 1x10⁻⁷ cm/sec compacted clay liner. The site
is located adjacent to the Ohio River. Aerial photography suggests that another landfill, two (2)
wastewater treatment ponds, and one (1) ash pond also exist. The suspect ash pond is
approximately 3,800 feet (0.7-mile) long and is approximately 200 feet from the Ohio River.
According to EKPC’s March 24, 2009 CERCLA 104(e) response to EPA’s request for information,
the Spurlock plant has one (1) bottom ash pond that was commissioned in 1976, and fly ash and
gypsum are also disposed of in an on-site landfill.
25
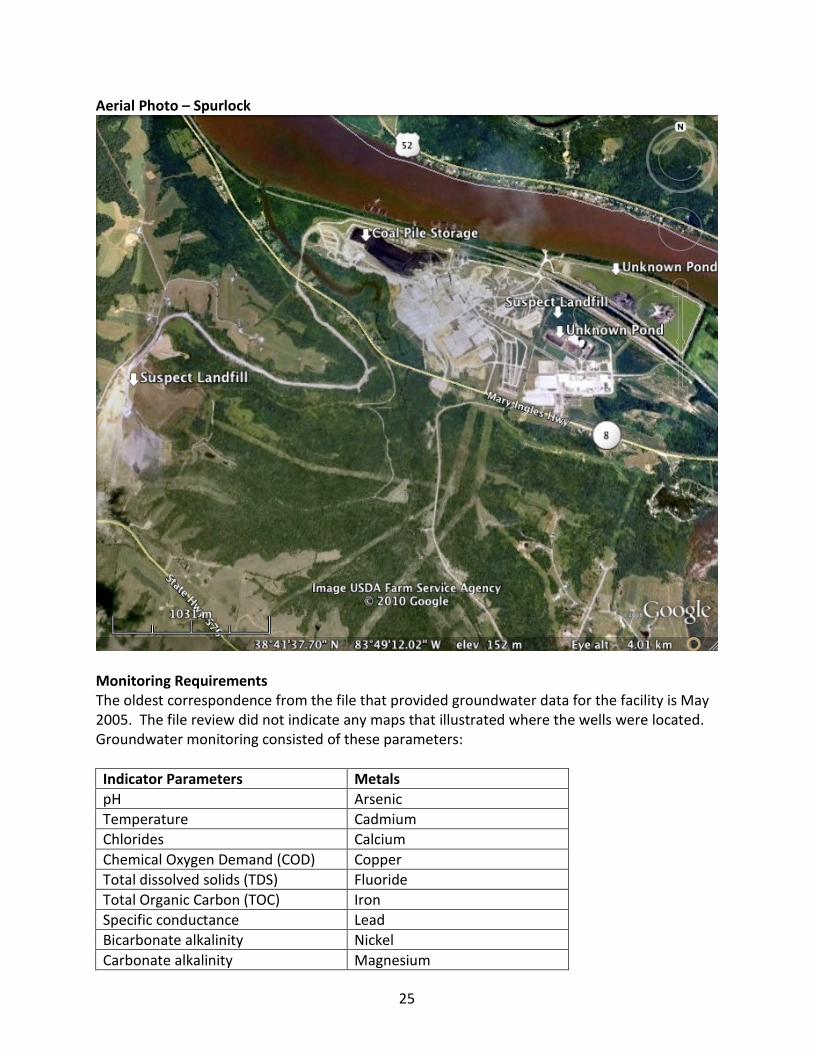
Aerial Photo – Spurlock
Monitoring Requirements
The oldest correspondence from the file that provided groundwater data for the facility is May
2005. The file review did not indicate any maps that illustrated where the wells were located.
Groundwater monitoring consisted of these parameters:
Indicator Parameters Metals
pH Arsenic
Temperature Cadmium
Chlorides Calcium
Chemical Oxygen Demand (COD) Copper
Total dissolved solids (TDS) Fluoride
Total Organic Carbon (TOC) Iron
Specific conductance Lead
Bicarbonate alkalinity Nickel
Carbonate alkalinity Magnesium
26
Nitrate (as Nitrogen) Manganese
Phosphorus Mercury
Sulfate Potassium
Selenium
Sodium
Zinc
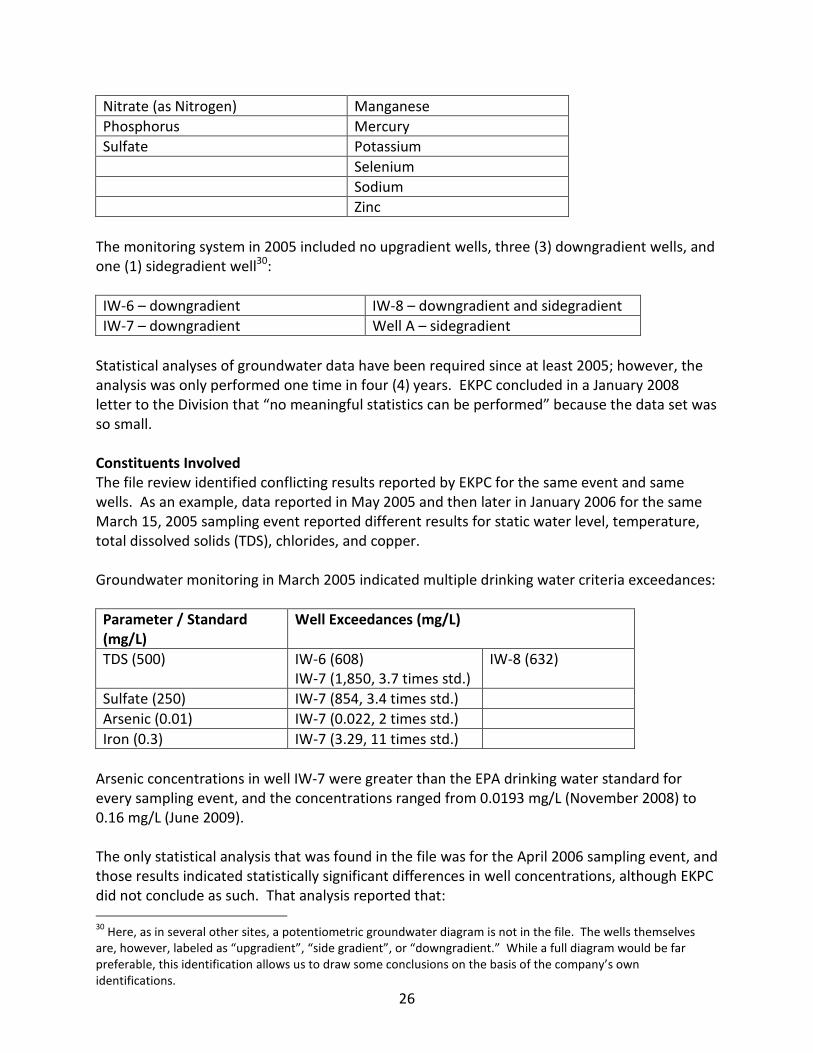
The monitoring system in 2005 included no upgradient wells, three (3) downgradient wells, and
one (1) sidegradient well30:
IW-6 – downgradient IW-8 – downgradient and sidegradient
IW-7 – downgradient Well A – sidegradient
Statistical analyses of groundwater data have been required since at least 2005; however, the
analysis was only performed one time in four (4) years. EKPC concluded in a January 2008
letter to the Division that “no meaningful statistics can be performed” because the data set was
so small.
Constituents Involved
The file review identified conflicting results reported by EKPC for the same event and same
wells. As an example, data reported in May 2005 and then later in January 2006 for the same
March 15, 2005 sampling event reported different results for static water level, temperature,
total dissolved solids (TDS), chlorides, and copper.
Groundwater monitoring in March 2005 indicated multiple drinking water criteria exceedances:
Parameter / Standard
(mg/L)
Well Exceedances (mg/L)
TDS (500) IW-6 (608)
IW-7 (1,850, 3.7 times std.)
IW-8 (632)
Sulfate (250) IW-7 (854, 3.4 times std.)
Arsenic (0.01) IW-7 (0.022, 2 times std.)
Iron (0.3) IW-7 (3.29, 11 times std.)
Arsenic concentrations in well IW-7 were greater than the EPA drinking water standard for
every sampling event, and the concentrations ranged from 0.0193 mg/L (November 2008) to
0.16 mg/L (June 2009).
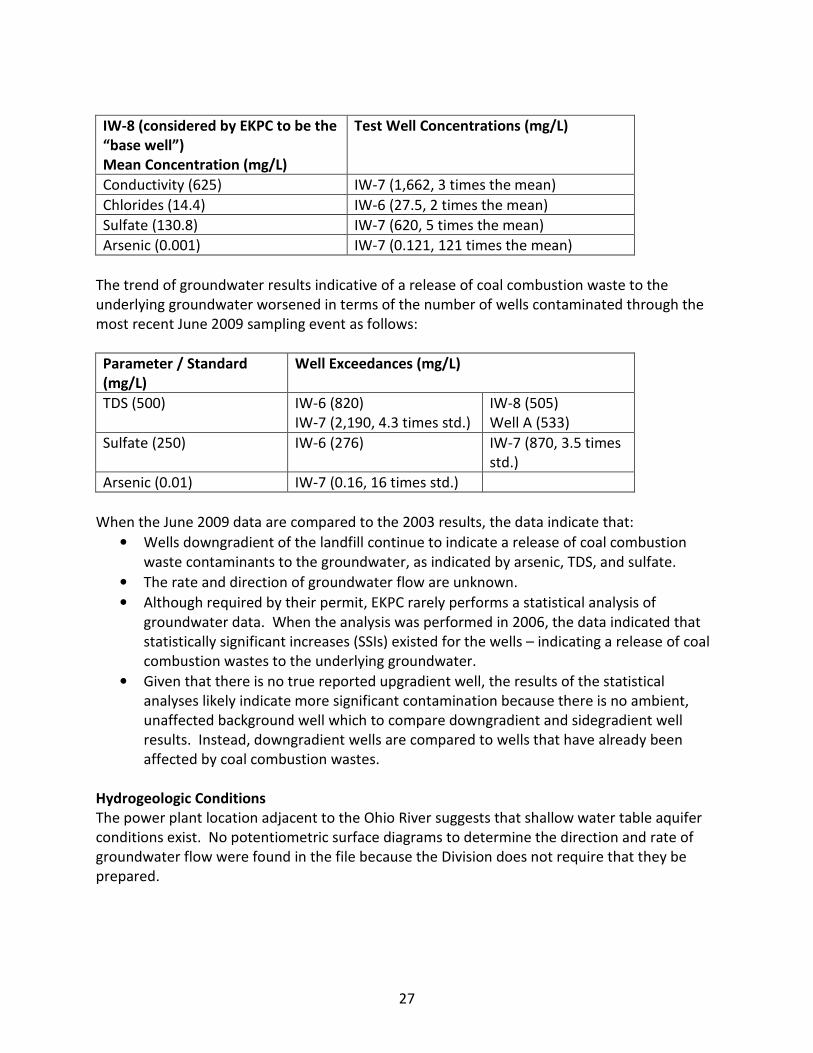
The only statistical analysis that was found in the file was for the April 2006 sampling event, and
those results indicated statistically significant differences in well concentrations, although EKPC
did not conclude as such. That analysis reported that:
30
Here, as in several other sites, a potentiometric groundwater diagram is not in the file. The wells themselves
are, however, labeled as “upgradient”, “side gradient”, or “downgradient.” While a full diagram would be far
preferable, this identification allows us to draw some conclusions on the basis of the company’s own
identifications.
27
IW-8 (considered by EKPC to be the
“base well”)
Mean Concentration (mg/L)
Test Well Concentrations (mg/L)
Conductivity (625) IW-7 (1,662, 3 times the mean)
Chlorides (14.4) IW-6 (27.5, 2 times the mean)
Sulfate (130.8) IW-7 (620, 5 times the mean)
Arsenic (0.001) IW-7 (0.121, 121 times the mean)
The trend of groundwater results indicative of a release of coal combustion waste to the
underlying groundwater worsened in terms of the number of wells contaminated through the
most recent June 2009 sampling event as follows:
Parameter / Standard
(mg/L)
Well Exceedances (mg/L)
TDS (500) IW-6 (820)
IW-7 (2,190, 4.3 times std.)
IW-8 (505)
Well A (533)
Sulfate (250) IW-6 (276) IW-7 (870, 3.5 times
std.)
Arsenic (0.01) IW-7 (0.16, 16 times std.)
When the June 2009 data are compared to the 2003 results, the data indicate that:
• Wells downgradient of the landfill continue to indicate a release of coal combustion
waste contaminants to the groundwater, as indicated by arsenic, TDS, and sulfate.
• The rate and direction of groundwater flow are unknown.
• Although required by their permit, EKPC rarely performs a statistical analysis of
groundwater data. When the analysis was performed in 2006, the data indicated that
statistically significant increases (SSIs) existed for the wells – indicating a release of coal
combustion wastes to the underlying groundwater.
• Given that there is no true reported upgradient well, the results of the statistical
analyses likely indicate more significant contamination because there is no ambient,
unaffected background well which to compare downgradient and sidegradient well
results. Instead, downgradient wells are compared to wells that have already been
affected by coal combustion wastes.
Hydrogeologic Conditions
The power plant location adjacent to the Ohio River suggests that shallow water table aquifer
conditions exist. No potentiometric surface diagrams to determine the direction and rate of
groundwater flow were found in the file because the Division does not require that they be
prepared.
28
2.3 Louisville Gas and Electric / E. On, Cane Run Station, Louisville
Location
5252 Cane Run Road
Louisville, Kentucky 40216
Jefferson County
GPS Coordinates: 38°10’45”; 85°53’22”
Summary
The groundwater monitoring reports demonstrate that there have been multiple, continually
repeated exceedances of groundwater standards since at least 2005. Existing unlined waste
disposal units that have resulted in groundwater contamination include an unlined landfill
approximately one (1) mile long and adjacent to the Ohio River, an unlined ash pond beneath
the landfill, and an unlined ash pond adjacent to the landfill. Groundwater monitoring
temperature results strongly suggest an interconnection between the ash pond, the landfill,
and the groundwater beneath those units. The Division received a “horizontal expansion”
landfill application to construct another 61-acre landfill to contain 5.7 million cubic yards of coal
combustion wastes, even though the new landfill will be located approximately 1,500 feet from
the existing landfill. No heavy metals tests are required for the groundwater sampling program
to determine the concentrations of metals that are indicative of coal combustion wastes and
are harmful to humans and fish and aquatic life at extremely low concentrations.
Type(s) of Waste Management Units and Wastes Present
A special waste landfill that contains coal combustion wastes of any type, according to the
Division. An operational permit was issued for the landfill in 1982. The landfill is situated
approximately 200 feet east of and parallel to the Ohio River for approximately one (1) mile.
Approximately half of the landfill was constructed over and old unlined ash pond. A toe drain
along the river-side of the landfill was installed to remove excessive groundwater seepage from
within the landfill dike to improve the structural stability of the dike, but not as a groundwater
remedial measure.
LG&E applied for a “horizontal expansion” of the coal combustion waste landfill for a separate
61-acre area located approximately 1,500 feet to the northeast. The Division received the
expansion application on January 10, 2010. According to the Division, a 60-mil LLDPE liner
(approximately 1/16-inch thick) is planned for the landfill. The storage capacity of the proposed
landfill is 5.7 million cubic yards.
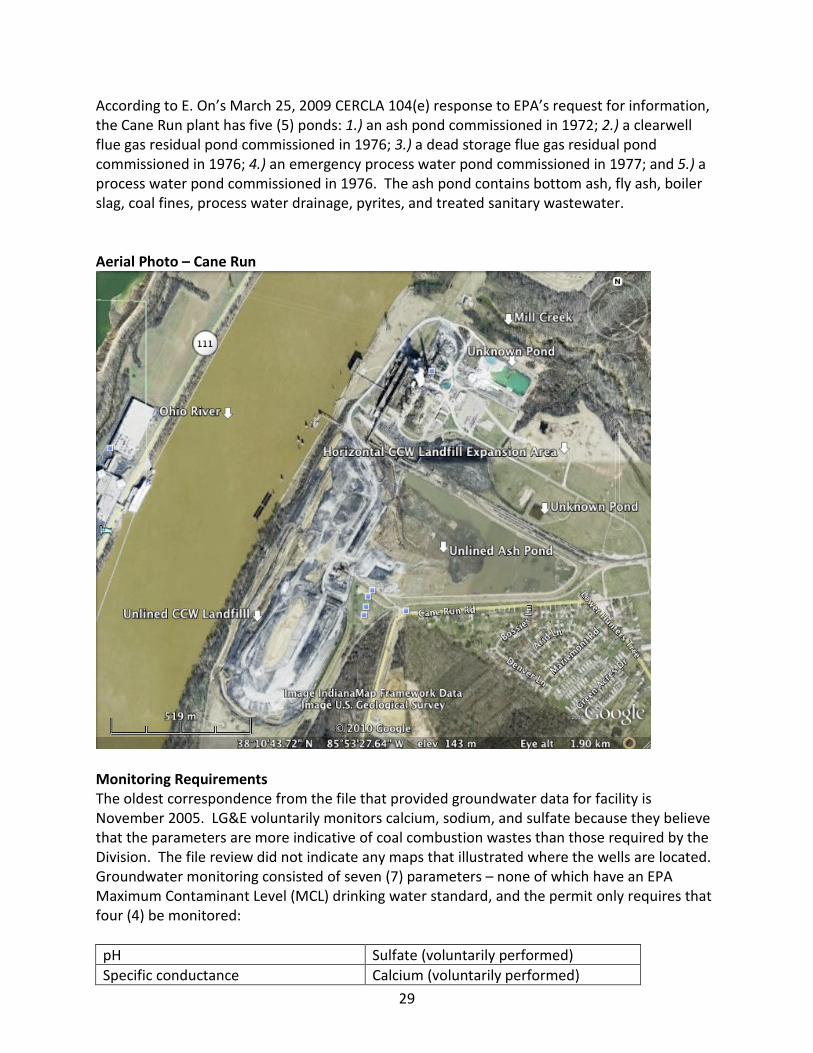
Correspondence in the file and current aerial photography (attached) indicates that a large ash
pond exists adjacent to the landfill and approximately 1,000 feet east of the Ohio River. The file
review did not specify what types of ash are disposed of in the ash pond. The aerial
photography also shows that at least two other waste ponds of undetermined type exist.
29
According to E. On’s March 25, 2009 CERCLA 104(e) response to EPA’s request for information,
the Cane Run plant has five (5) ponds: 1.) an ash pond commissioned in 1972; 2.) a clearwell
flue gas residual pond commissioned in 1976; 3.) a dead storage flue gas residual pond
commissioned in 1976; 4.) an emergency process water pond commissioned in 1977; and 5.) a
process water pond commissioned in 1976. The ash pond contains bottom ash, fly ash, boiler
slag, coal fines, process water drainage, pyrites, and treated sanitary wastewater.
Aerial Photo – Cane Run
Monitoring Requirements
The oldest correspondence from the file that provided groundwater data for facility is
November 2005. LG&E voluntarily monitors calcium, sodium, and sulfate because they believe
that the parameters are more indicative of coal combustion wastes than those required by the
Division. The file review did not indicate any maps that illustrated where the wells are located.
Groundwater monitoring consisted of seven (7) parameters – none of which have an EPA
Maximum Contaminant Level (MCL) drinking water standard, and the permit only requires that
four (4) be monitored:
pH Sulfate (voluntarily performed)
Specific conductance Calcium (voluntarily performed)
30
Total dissolved solids (TDS) Sodium (voluntarily performed)
Chlorides Chemical Oxygen Demand (COD)
The monitoring system in 2005 included seven wells, MW-3 through MW-9, that are, according
to the Division, located as such:
MW-3 – upgradient near plant
entrance
Designated as “background”.
MW-7 – southern most well upgradient
of floodwall. Designated as
“background”
MW-4 – north of ash pond along dike MW-8 – south corner landfill between
landfill and river
MW-5 – between landfill and ash pond MW-9 – north corner of landfill
between landfill and river
MW-6 – between landfill and river
Statistical analyses of groundwater data have been required since at least 2005.
Constituents Involved
Groundwater monitoring in November 2005 indicated multiple drinking water criteria
exceedances:
Parameter / Standard
(mg/L)
Well Exceedances (mg/L, except pH)
Chlorides (250) MW-5 (802) MW-6 (848)
TDS (500) MW-3 (568)
MW-5 (4,592)
MW-6 (4,606, 9 times std.)
MW-7 (544)
MW-8 (1,150)
MW-9 (2,006)
pH (6.5 to 8.5) MW-5 (9.95)
Sulfate MW-5 (1,736, 7 times std.)
MW-6 (1,725)
MW-8 (508)
MW-9 (1,205)
Groundwater temperature measurements are not required by the permit or routinely
performed; however, measurements were reported for a November 4, 2008 sampling event.
The results strongly suggest an interconnection between the ash pond, the landfill, and the
shallow groundwater beneath those units. The temperature of the groundwater reported for
wells MW-5 and MW-6 downgradient of the ash pond and landfill were approximately 10°
degrees Fahrenheit warmer than the four other wells in the same aquifer.
The trend of groundwater results indicative of a release of coal combustion waste releases to
the underlying groundwater continued through the most recent June 2009 sampling event as
follows:
Parameter / Standard
(mg/L)
Well Exceedances (mg/L, except pH)
Chlorides (250) MW-6 (596)
31
TDS (500) MW-3 (504)
MW-5 (3,740)
MW-6 (3,776, 7.5 times std.)
MW-7 (500)
MW-8 (820)
pH (6.5 to 8.5) MW-5 (9.62)
Sulfate MW-5 (1,752, 7 times std.) MW-6 (1,733)
When the results of 2008 / 2009 data are compared to the 2005 results, the data indicate that:
• Wells downgradient of the ash pond landfill continue to indicate a release of coal
combustion waste contaminants to the groundwater, as indicated by chlorides, sulfate,
pH, calcium, sodium, and TDS.
• The most downgradient wells indicative of waste contaminants above EPA standards are
immediately adjacent to the Ohio River and suggest that contaminated groundwater
reaches the river.
• Calcium and sodium concentrations indicative of coal combustion wastes are
substantially higher in wells downgradient of the ash pond and landfill (MW-5 and MW-
6). Calcium was approximately 5 times higher and sodium was approximately 30 times
higher than other wells.
• No metals tests are performed to determine concentrations that are typically found in
coal combustion wastes. Such metals are harmful to humans and fish and aquatic life at
extremely low concentrations.
According to the Division, LG&E has agreed to complete a groundwater assessment of the
landfill but there was no indication in the file that such an assessment has been performed or
when one is due.
Hydrogeologic Conditions
The power plant location adjacent to the Ohio River suggests that shallow water table aquifer
conditions exist. No potentiometric surface diagrams to determine the direction and rate of
groundwater flow were found in the file because the Division does not require that they be
prepared. The results of temperature measurements obtained during groundwater sampling in
November 2008 suggest that the ash pond and landfill are leaking to a shallow aquifer.
32
2.4 Louisville Gas and Electric / E. On, Trimble Station, Bedford
Location
487 Corn Creek Road
Bedford, KY 40006
Trimble County
GPS Coordinates: 38°35’16”; 85°24’57”
Summary
One unlined pond that is nearly ¾-mile long has been used to dispose of coal combustion
wastes since the 1980s. LG&E proposed a 30-foot tall vertical expansion of that pond in 2009 –
even though groundwater data since at least 2003 indicates that the pond is leaking, and
drinking water standards have been exceeded in nine (9) of 12 wells on-site. Groundwater
parameter concentrations are up to 10 times higher than allowable EPA standards for chlorides,
total dissolved solids, and sulfates. The current monitoring program is less stringent in terms of
required analyses than what was required in 1996 because no heavy metals testing has been
required since at least 2003 – even though coal combustion waste constituents have been
reported in the groundwater, and heavy metals are common in coal combustion wastes. The
Division does not require a potentiometric surface diagram be submitted with groundwater
reports and as a result, the Division is unable to determine the direction and rate of
groundwater flow. The site is located adjacent to the Ohio River, and contaminated wells are
located within 250 feet of a tributary stream to the Ohio River.
Type(s) of Waste Management Units and Wastes Present
LG&E was issued a landfill permit in 1984, and the permit was re-issued in May 1996; however,
the landfill was never constructed. Although no landfill was constructed, a landfill permit was
issued. An unlined ash pond (called the “Bottom Ash Pond” or “BAP”) is used to dispose of coal
combustion wastes including bottom ash, fly ash, boiler slag, flue gas emission control
residuals, coal fines, process water drainage, and pyrite. The Division has issued a KPDES
permit for that pond but considers the pond to have zero-discharge. The bottom of the Bottom
Ash Pond is approximately 45 feet below the natural ground elevation in that area. A 30-foot
vertical expansion of the pond was proposed by LG&E in 2009 for pond dikes heights that were
already 40 to 75 feet high. A gypsum disposal pond located on an adjacent property to the
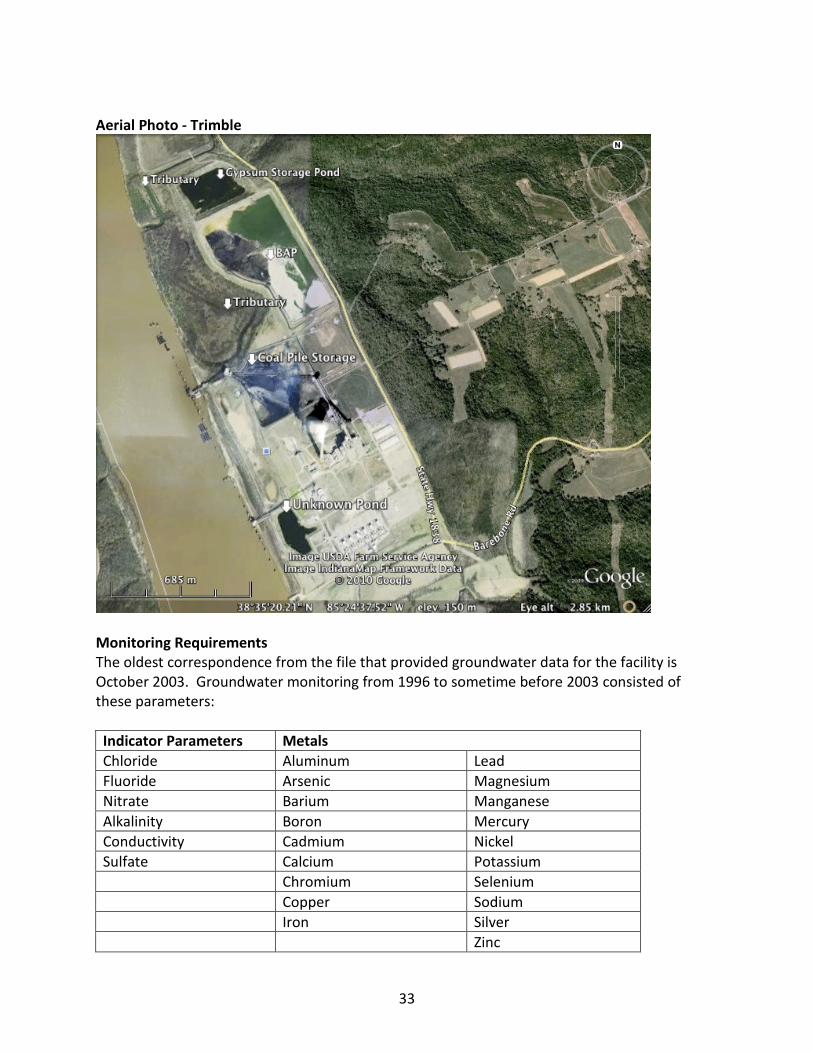
north is also proposed. The site is adjacent to the Ohio River. Aerial photography suggests that
another, un-permitted wastewater treatment pond exists to the southeast adjacent to the
river. The Bottom Ash Pond is approximately 3,300 feet (0.6-mile) long and is approximately
1,300 feet from the Ohio River.
According to E.O On’s March 25, 2009 CERCLA 104(e) response to EPA’s request for
information, the Trimble plant has one (1) ash pond that was commissioned in 1990, and the
pond contains bottom ash, fly ash, boiler slag, flue gas residuals, coal fines, process water
drainage, pyrites, and treated sanitary wastewater.
33
Aerial Photo - Trimble
Monitoring Requirements
The oldest correspondence from the file that provided groundwater data for the facility is
October 2003. Groundwater monitoring from 1996 to sometime before 2003 consisted of
these parameters:
Indicator Parameters Metals
Chloride Aluminum Lead
Fluoride Arsenic Magnesium
Nitrate Barium Manganese
Alkalinity Boron Mercury
Conductivity Cadmium Nickel
Sulfate Calcium Potassium
Chromium Selenium
Copper Sodium
Iron Silver
Zinc
34
The monitoring system for the Bottom Ash Pond includes one (1) upgradient well, eight (8)
downgradient wells, and three (3) sidegradient well. Wells MW-2 through MW-9 are located
topographically and hydraulically downgradient of the Bottom Ash Pond and are within
approximately 250 feet of a small stream / wetland area that discharges to the Ohio River. The
monitoring well summary is as follows:
MW-1 – upgradient MW-7 - downgradient
MW-2 – downgradient MW-8 – downgradient
MW-3 – downgradient MW-9 - downgradient
MW-4 – downgradient MW-10 – sidegradient
MW-5 – downgradient MW-11 – sidegradient
MW-6 – downgradient MW-12 – sidegradient
Actual well locations were later clarified with Division personnel. The wells are generally
located between the Ohio River and the Bottom Ash Pond and the Coal Pile. Only one well,
MW-1, was not topographically downgradient of the facility operations area or the Bottom Ash
Pond.
Sometime between 1996 and 2003, the required sampling parameter list was drastically
reduced to only include these indicator parameters – none of which has an EPA Maximum
Contaminant Level (MCL) drinking water standard:
pH Chlorides
Specific conductance Total dissolved solids (TDS)
Chemical Oxygen Demand (COD) Copper
Total Organic Carbon (TOC) Sodium
Calcium Sulfate
There is no indication in the file that statistical analyses of groundwater data is required by the
permit or performed by LG&E.
Constituents Involved
Groundwater monitoring in October 2003 indicated multiple drinking water criteria
exceedances:
Parameter / Standard
(mg/L)
Well Exceedances (mg/L)
Chlorides (250) MW-4 (330, 2 times std.) MW-8 (281)
TDS (500) MW-2 (1,354)
MW-3 (850)
MW-4 (4,296)
MW-5 (1,656)
MW-6 (532)
MW-8 (4,582, 9 times std.)
MW-11 (720)
MW-12 (682)
Sulfate (250) MW-2 (692)
MW-3 (330)
MW-4 (2,045, 8 times std.)
MW-5 (605)
MW-8 (1,990)
MW-11 (328)
35
The trend of groundwater results indicative of a release of coal combustion waste to the
underlying groundwater worsened in terms of the intra-well concentrations through the most
recent October 2009 sampling event as follows:
Parameter / Standard
(mg/L)
Well Exceedances (mg/L)
Chlorides (250) MW-4 (499.1, 2 times std.) MW-8 (394.5)
TDS (500) MW-2 (1,090)
MW-3 (592)
MW-4 (4,806, 10 times
std.)
MW-5 (1,196)
MW-8 (3,950)
MW-10 (566)
MW-11 (1,350)
MW-12 (1,096)
Sulfate (250) MW-2 (450)
MW-4 (2,218, 9 times std.)
MW-5 (350)
MW-8 (1,810)
MW-11 (639)
MW-12 (312)
When the current 2009 results of data are compared to the 1996 and 2003 results, the data
indicate that:
• Wells downgradient of the Bottom Ash Pond continue to indicate a release of coal
combustion waste contaminants to the groundwater, as indicated by chlorides, TDS, and
sulfate.
• Testing for metals is not required even though metals can be harmful to human health
and fish and aquatic life at very low concentrations.
• The rate and direction of groundwater flow are unknown by the Division.
• There is no indication in the file that statistical analyses of groundwater data are
required or completed by LG&E.
• Contaminated wells can indicate the concentrations of groundwater discharges to the
Ohio River.
Hydrogeologic Conditions
The power plant is location adjacent to the Ohio River suggests that shallow water table aquifer
conditions exist. No potentiometric surface diagrams to determine the direction and rate of
groundwater flow were found in the file because the Division does not require that they be
prepared.
36
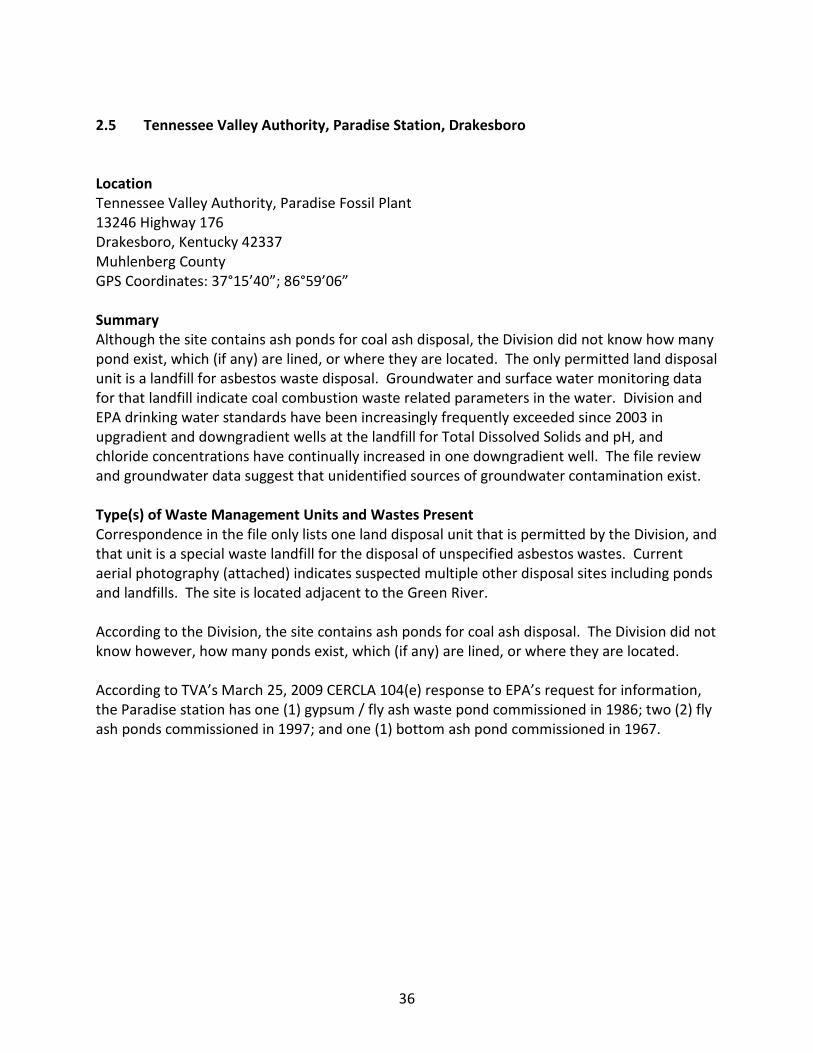
2.5 Tennessee Valley Authority, Paradise Station, Drakesboro
Location
Tennessee Valley Authority, Paradise Fossil Plant
13246 Highway 176
Drakesboro, Kentucky 42337
Muhlenberg County
GPS Coordinates: 37°15’40”; 86°59’06”
Summary
Although the site contains ash ponds for coal ash disposal, the Division did not know how many
pond exist, which (if any) are lined, or where they are located. The only permitted land disposal
unit is a landfill for asbestos waste disposal. Groundwater and surface water monitoring data
for that landfill indicate coal combustion waste related parameters in the water. Division and
EPA drinking water standards have been increasingly frequently exceeded since 2003 in
upgradient and downgradient wells at the landfill for Total Dissolved Solids and pH, and
chloride concentrations have continually increased in one downgradient well. The file review
and groundwater data suggest that unidentified sources of groundwater contamination exist.
Type(s) of Waste Management Units and Wastes Present
Correspondence in the file only lists one land disposal unit that is permitted by the Division, and
that unit is a special waste landfill for the disposal of unspecified asbestos wastes. Current
aerial photography (attached) indicates suspected multiple other disposal sites including ponds
and landfills. The site is located adjacent to the Green River.
According to the Division, the site contains ash ponds for coal ash disposal. The Division did not
know however, how many ponds exist, which (if any) are lined, or where they are located.
According to TVA’s March 25, 2009 CERCLA 104(e) response to EPA’s request for information,
the Paradise station has one (1) gypsum / fly ash waste pond commissioned in 1986; two (2) fly
ash ponds commissioned in 1997; and one (1) bottom ash pond commissioned in 1967.
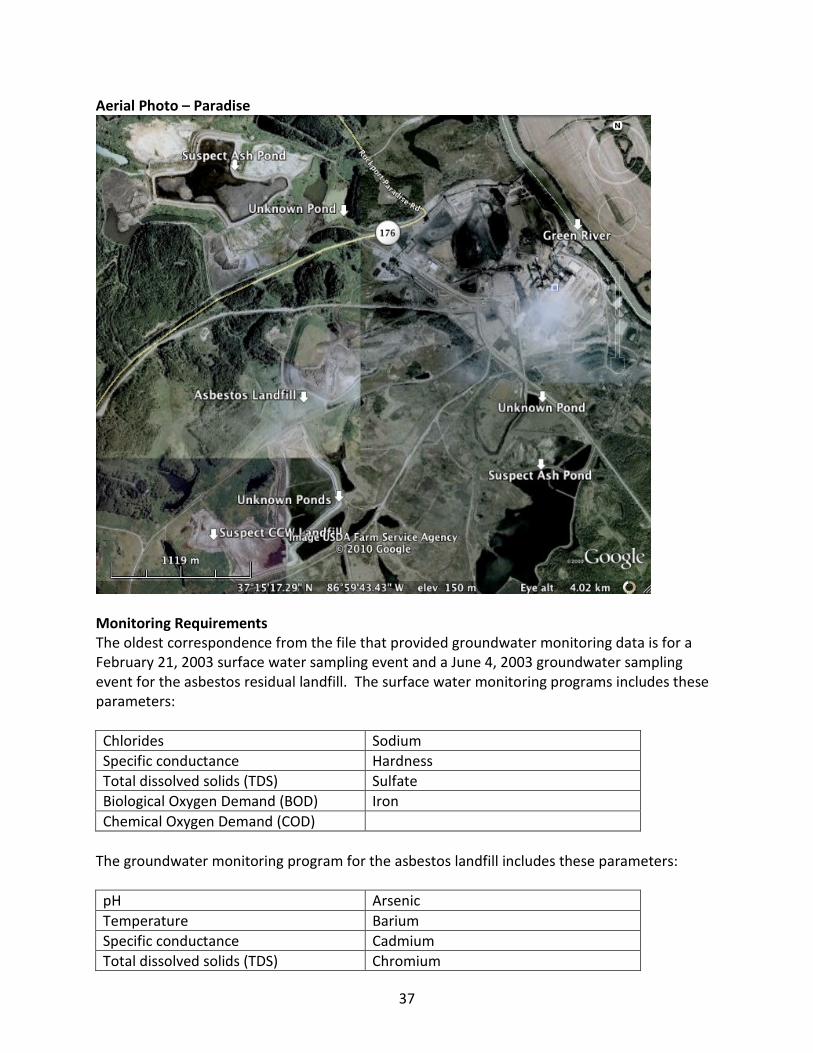
37
Aerial Photo – Paradise
Monitoring Requirements
The oldest correspondence from the file that provided groundwater monitoring data is for a
February 21, 2003 surface water sampling event and a June 4, 2003 groundwater sampling
event for the asbestos residual landfill. The surface water monitoring programs includes these
parameters:
Chlorides Sodium
Specific conductance Hardness
Total dissolved solids (TDS) Sulfate
Biological Oxygen Demand (BOD) Iron
Chemical Oxygen Demand (COD)
The groundwater monitoring program for the asbestos landfill includes these parameters:
pH Arsenic
Temperature Barium
Specific conductance Cadmium
Total dissolved solids (TDS) Chromium
38
Chlorides Lead
Chemical Oxygen Demand (COD) Mercury
Iron Selenium
Sodium Nitrate
Total Organic Carbon Asbestos
The groundwater monitoring system in 2003 included five (5) wells located as such:
94-42 – upgradient 97-45 - upgradient
94-41 – downgradient 97-43 - downgradient
97-44- downgradient
Statistical analyses of groundwater data have been required since at least 2003.
Constituents Involved
Groundwater monitoring in June 2003 indicated multiple drinking water criteria exceedances,
with the highest TDS concentration reported for an upgradient well:
Parameter / Standard
(mg/L)
Well Exceedances (mg/L, except pH)
TDS (500) 94-42 (4,600, 9 times std.)
97-45 (3,500)
94-41 (3,800)
97-43 (3,300)
97-44 (3,500)
pH (6.5 to 8.5) 97-45 (6.45) 94-41 (6.41)
Statistically significant increases (SSIs) in groundwater constituent concentrations have been
reported in downgradient wells since at least 2003. SSIs have been reported for these
parameters that are reported on a semi-annual basis: chlorides, nitrate, sodium, total organic
carbon. TVA compares the results of downgradient well data to upgradient well data to
determine if a SSI occurs, even though the groundwater data suggests that the upgradient wells
have already been impacted by coal combustion wastes. As a result, the standard to which
downgradient wells are compared is abnormally and unnaturally high.
Chloride concentrations have steadily increased in well 97-44 since 2003 (maximum
concentration 91 mg/L) up to 15 times higher than other wells on-site, although the
concentrations have not yet exceeded the EPA secondary MCL (250 mg/L).
Quarterly surface water monitoring results since 2003 indicated these TDS concentrations: 753
mg/L average; 1,174 mg/L maximum. Sulfate concentrations in surface water ranged from: 511
mg/L average; 1,040 mg/L maximum.
The trend of groundwater results indicative of a release of coal combustion waste to the
underlying groundwater increased through the most recent June 2009 sampling event as
follows:
39
Parameter / Standard
(mg/L)
Well Exceedances (mg/L, except pH)
TDS (500) 94-42 (5,000)
97-45 (3,300)
94-41 (3,800)
97-43 (5,500, 11
times std.)
97-44 (3,500)
pH (6.5 to 8.5) MW-5 (9.62)
Sulfate MW-5 (1,752, 7 times std.) MW-6 (1,733)
When the results of 2009 data are compared to the 2003 results, the data indicate that:
• Landfill area wells continue to indicate that a release of coal combustion waste
contaminants has occurred to the groundwater, as indicated by chlorides, sulfate, pH,
and TDS.
• Sulfate is not required for the landfill permit even though the parameter is present in
surface water and is indicative of coal combustion wastes.
• Other landfills and ash ponds that have not yet been identified could possibly be the
source(s) of coal combustion waste parameters in the groundwater because asbestos
wastes would not necessarily be expected to contain such contaminants.
Hydrogeologic Conditions
Aerial photography suggests that the site has substantially disturbed by land development
activities. Groundwater monitoring reports state that the aquifer underlying the asbestos
landfill is in mine spoil, suggesting that mining was performed at the site. TVA reported that
since 2003 the groundwater flow velocity in the mine spoil aquifer ranged from approximately
13 feet / year (average) to 18 feet / year (maximum).
40
2.6 Tennessee Valley Authority, Shawnee Station, Paducah
Location
7900 Metropolis Lake Road
Paducah, Kentucky 42086
McCracken County
GPS Coordinates: 37°09’24”; 88°47’01”
Summary
Two unlined ash ponds and two unlined landfills exist at the site for disposal of coal combustion
wastes. The ponds and landfills are located adjacent to the Ohio River. The most recently
permitted landfill was approved without a liner in July 2007, although groundwater
contamination from an older unlined landfill and ash pond indicates that those disposal units
are leaking. The new landfill is being built over old unlined ash ponds. Groundwater
contamination above one or more standard exists in all eleven (11) downgradient wells. The
most notable groundwater contaminants above regulatory standards include: boron (up to 7.5
times higher than the EPA health advisory); arsenic (slightly higher than the EPA MCL); and
selenium (almost 2 times the standard). No potentiometric surface map was found in the file
review to determine placement of wells, direction of groundwater flow, or gradient of the
water table aquifer because the Division does not require this information to be submitted.
Type(s) of Waste Management Units and Waste Types
The Shawnee Fossil Plant has two (2) coal combustion waste landfills that are geographically
contiguous. One landfill is nearing final closure. A new landfill was approved by the Division in
July 2007 and is presently being operated. Neither landfill is lined. The waste type(s) is
unspecified. The landfills operate under the same permit. The Division has designated the
landfills as “special waste” landfills. The landfill closest to the ash ponds has a partial final
cover. One landfill has southern and eastern boundaries that are Little Bayou Creek and water
lines to the Paducah Gaseous Diffusion Plant located miles away. The landfills share a
groundwater monitoring system with two adjacent ash settling basins.
The two ash ponds have historically been very large and filling has gradually, incrementally
created a smaller wetted area on the surface. The ponds are unlined and are located
approximately 700 feet from the Ohio River. The type(s) of ash disposed of in the ponds were
unspecified in the file.
As a result, historical and new coal combustion wastes are being disposed of in unlined units at
this location.
According to TVA’s March 25, 2009 CERCLA 104(e) response to EPA’s request for information,
the Shawnee plant has one (1) ash pond commissioned in 1952 for the disposal of fly ash and
bottom ash, and one (1) “dry stack” commissioned in 1984 for fly ash and bottom ash disposal.
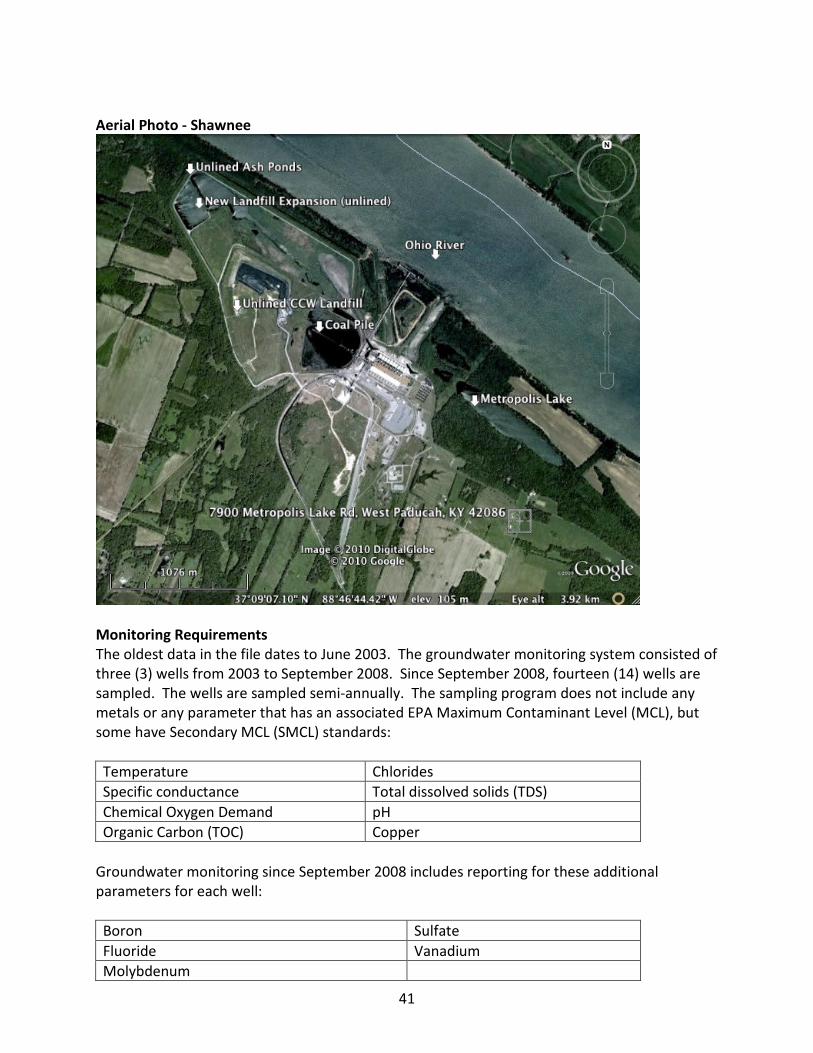
41
Aerial Photo - Shawnee
Monitoring Requirements
The oldest data in the file dates to June 2003. The groundwater monitoring system consisted of
three (3) wells from 2003 to September 2008. Since September 2008, fourteen (14) wells are
sampled. The wells are sampled semi-annually. The sampling program does not include any
metals or any parameter that has an associated EPA Maximum Contaminant Level (MCL), but
some have Secondary MCL (SMCL) standards:
Temperature Chlorides
Specific conductance Total dissolved solids (TDS)
Chemical Oxygen Demand pH
Organic Carbon (TOC) Copper
Groundwater monitoring since September 2008 includes reporting for these additional
parameters for each well:
Boron Sulfate
Fluoride Vanadium
Molybdenum
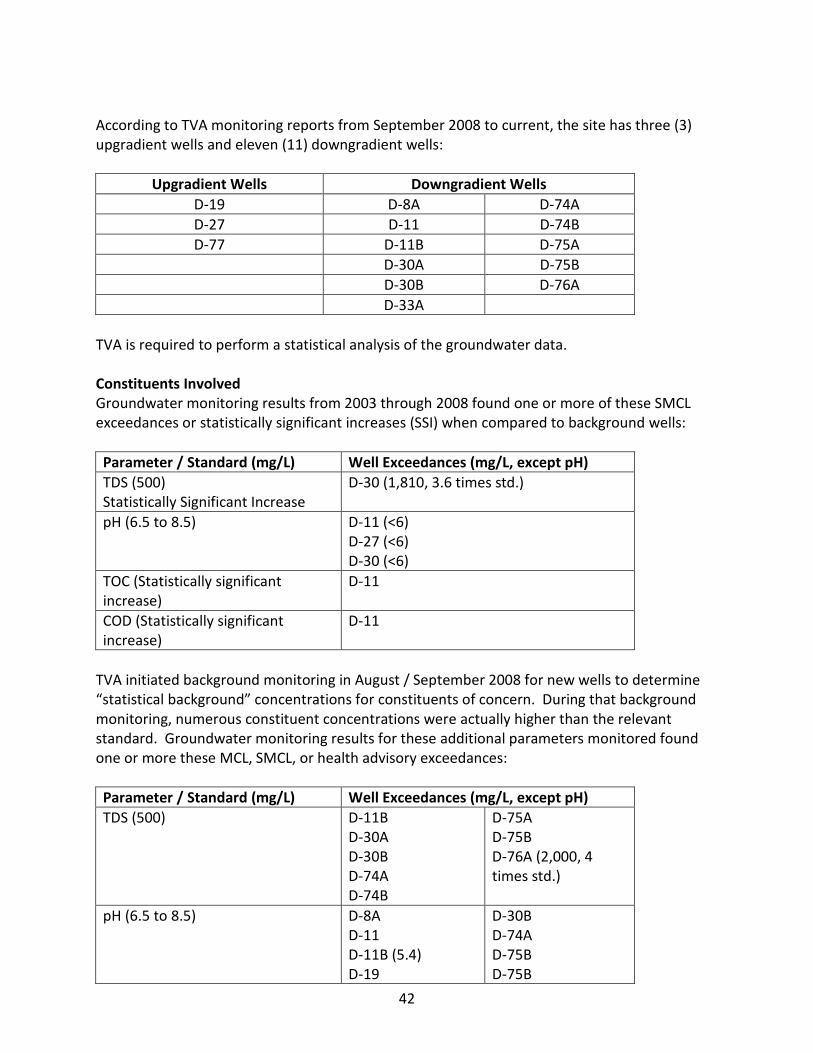
42
According to TVA monitoring reports from September 2008 to current, the site has three (3)
upgradient wells and eleven (11) downgradient wells:
Upgradient Wells Downgradient Wells
D-19 D-8A D-74A
D-27 D-11 D-74B
D-77 D-11B D-75A
D-30A D-75B
D-30B D-76A
D-33A
TVA is required to perform a statistical analysis of the groundwater data.
Constituents Involved
Groundwater monitoring results from 2003 through 2008 found one or more of these SMCL
exceedances or statistically significant increases (SSI) when compared to background wells:
Parameter / Standard (mg/L) Well Exceedances (mg/L, except pH)
TDS (500)
Statistically Significant Increase
D-30 (1,810, 3.6 times std.)
pH (6.5 to 8.5) D-11 (<6)
D-27 (<6)
D-30 (<6)
TOC (Statistically significant
increase)
D-11
COD (Statistically significant
increase)
D-11
TVA initiated background monitoring in August / September 2008 for new wells to determine
“statistical background” concentrations for constituents of concern. During that background
monitoring, numerous constituent concentrations were actually higher than the relevant
standard. Groundwater monitoring results for these additional parameters monitored found
one or more these MCL, SMCL, or health advisory exceedances:
Parameter / Standard (mg/L) Well Exceedances (mg/L, except pH)
TDS (500) D-11B
D-30A
D-30B
D-74A
D-74B
D-75A
D-75B
D-76A (2,000, 4
times std.)
pH (6.5 to 8.5) D-8A
D-11
D-11B (5.4)
D-19
D-30B
D-74A
D-75B
D-75B
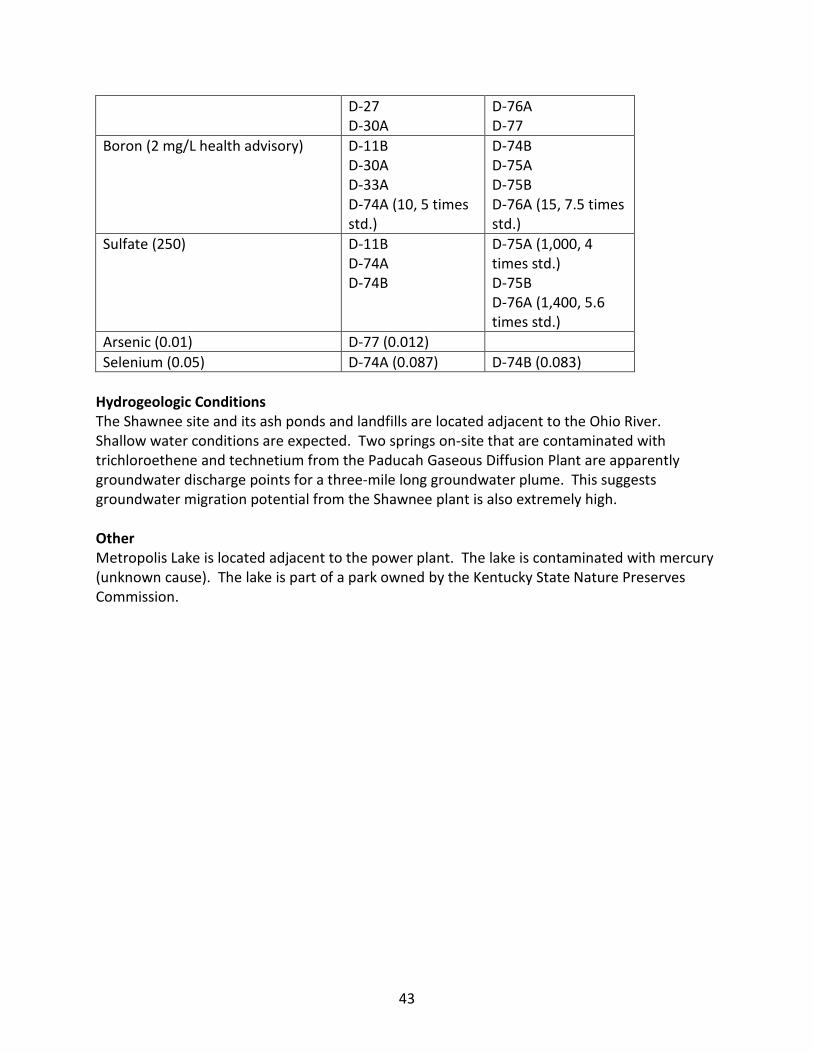
43
D-27
D-30A
D-76A
D-77
Boron (2 mg/L health advisory) D-11B
D-30A
D-33A
D-74A (10, 5 times
std.)
D-74B
D-75A
D-75B
D-76A (15, 7.5 times
std.)
Sulfate (250) D-11B
D-74A
D-74B
D-75A (1,000, 4
times std.)
D-75B
D-76A (1,400, 5.6
times std.)
Arsenic (0.01) D-77 (0.012)
Selenium (0.05) D-74A (0.087) D-74B (0.083)
Hydrogeologic Conditions
The Shawnee site and its ash ponds and landfills are located adjacent to the Ohio River.
Shallow water conditions are expected. Two springs on-site that are contaminated with
trichloroethene and technetium from the Paducah Gaseous Diffusion Plant are apparently
groundwater discharge points for a three-mile long groundwater plume. This suggests
groundwater migration potential from the Shawnee plant is also extremely high.
Other
Metropolis Lake is located adjacent to the power plant. The lake is contaminated with mercury
(unknown cause). The lake is part of a park owned by the Kentucky State Nature Preserves
Commission.
44
2.7 Big Rivers Electricity Corporation, D.B. Wilson Plant, Centertown
Location
5663 State route 85 W
Centertown, Kentucky 42328
Ohio County
GPS Coordinates: 37°27’08”; 87°04’50”
Summary
The station and all waste disposal units are constructed on an abandoned, un-reclaimed strip
mine void of natural soil. The Division approved a horizontal expansion (Phase II) of an existing
unlined landfill in 2008 / 2009 even though the expansion is not contiguous. Neither landfill is
lined. The Phase II landfill is located within approximately 500 feet of the Green River. A
comparison of groundwater data from 1982 (before the plant construction was finished) to
2009 indicates that the coal combustion waste landfill has further contaminated the underlying
aquifer above Division and EPA drinking water standards. The current groundwater monitoring
parameters are much less restrictive than those required at the plant in 1982.
Type(s) of Waste Management Units and Wastes Present
Two special waste landfills that contain fly ash, bottom ash, and flue gas desulfurization (FGD)
sludges exist at the site. The first as-built landfill construction design approval was granted in
1979. The Division approved the most recent Phase II landfill (approval date undetermined but
first waste placement was in August 2009) as a “horizontal expansion” of a landfill to the east,
even though a 340-volt electric transmission line physically separates the two landfills. The file
review did not indicate when waste was first placed in the initial phase of the landfill or what
type(s) of coal combustion wastes was placed. The new landfill will be used to store flue gas
desulfurization wastes. The Phase II landfill is situated approximately 500 feet east of the
Green River.
Current aerial photography (attached) indicated that at least one suspect ash pond also exists
at the site. Historic maps found in the file also illustrated wastewater treatment ponds south of
the station, and those ponds are located approximately 250 feet north of Elk Creek, a tributary
of the Green River.
According to the file review, the plant was constructed in 1984; the station and the waste
disposal units were constructed over strip-mined areas; the ground surface is void of natural
soils; the coal combustion waste is placed directly on top of the soil; and neither of the landfills
has a liner.
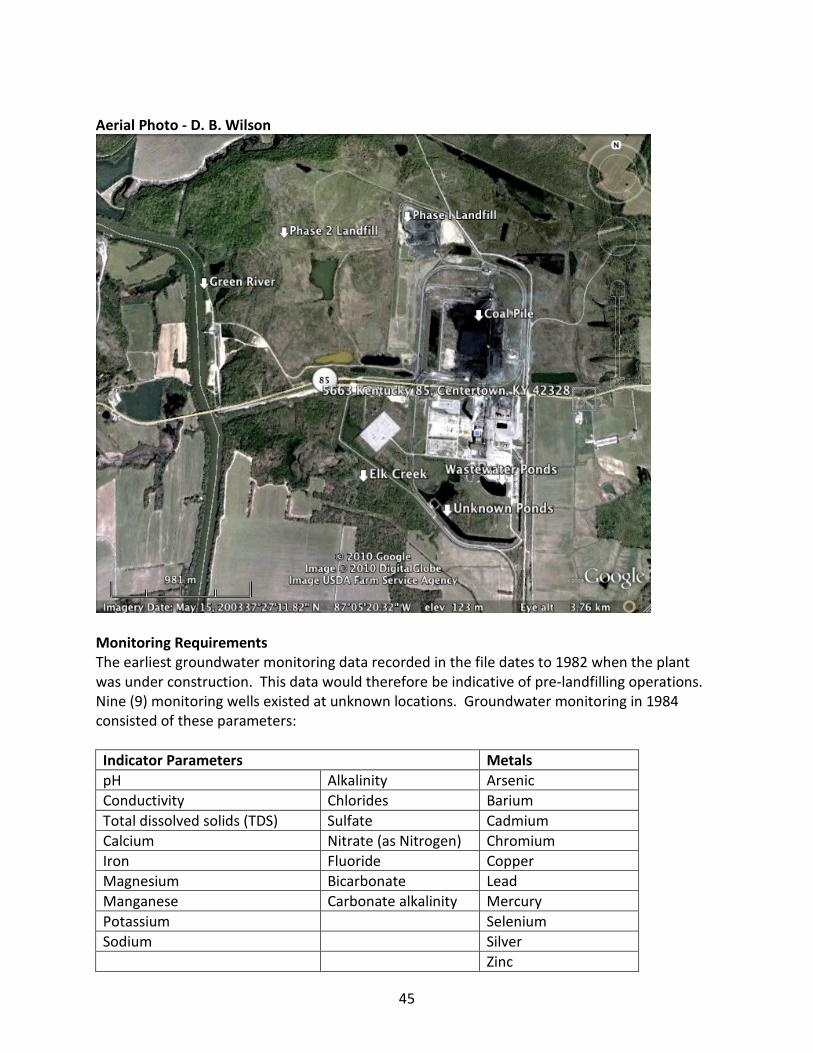
45
Aerial Photo - D. B. Wilson
Monitoring Requirements
The earliest groundwater monitoring data recorded in the file dates to 1982 when the plant
was under construction. This data would therefore be indicative of pre-landfilling operations.
Nine (9) monitoring wells existed at unknown locations. Groundwater monitoring in 1984
consisted of these parameters:
Indicator Parameters Metals
pH Alkalinity Arsenic
Conductivity Chlorides Barium
Total dissolved solids (TDS) Sulfate Cadmium
Calcium Nitrate (as Nitrogen) Chromium
Iron Fluoride Copper
Magnesium Bicarbonate Lead
Manganese Carbonate alkalinity Mercury
Potassium Selenium
Sodium Silver
Zinc
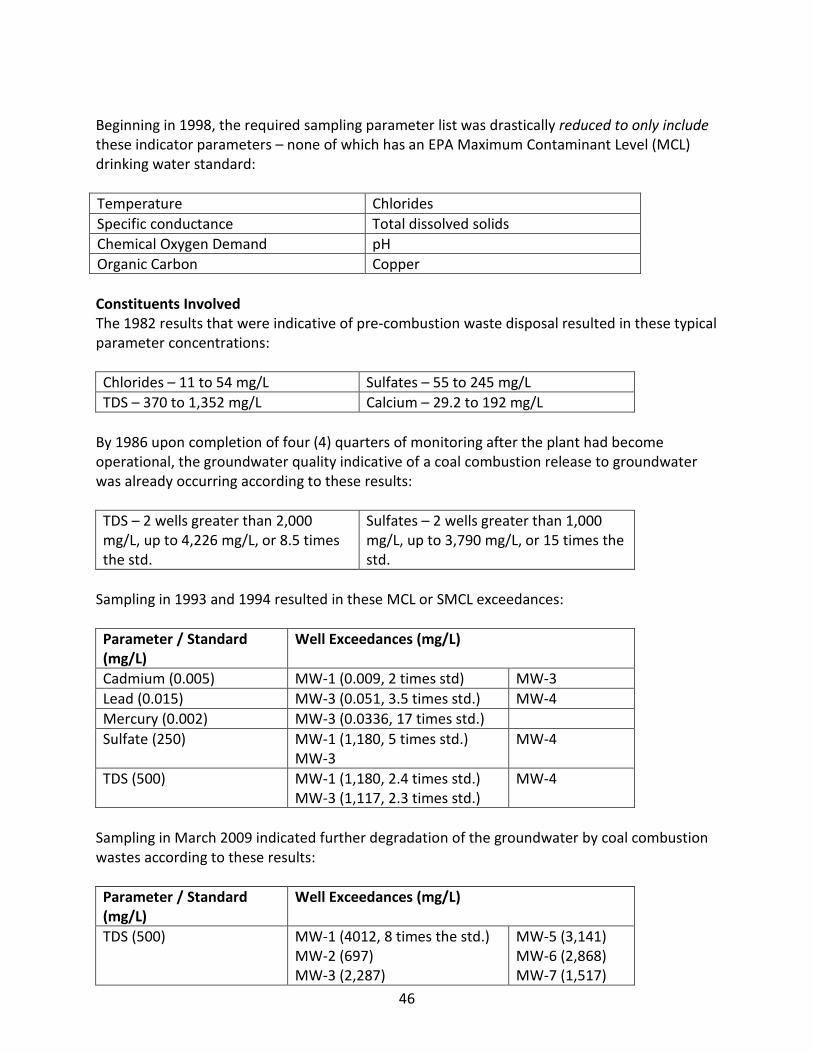
46
Beginning in 1998, the required sampling parameter list was drastically reduced to only include
these indicator parameters – none of which has an EPA Maximum Contaminant Level (MCL)
drinking water standard:
Temperature Chlorides
Specific conductance Total dissolved solids
Chemical Oxygen Demand pH
Organic Carbon Copper
Constituents Involved
The 1982 results that were indicative of pre-combustion waste disposal resulted in these typical
parameter concentrations:
Chlorides – 11 to 54 mg/L Sulfates – 55 to 245 mg/L
TDS – 370 to 1,352 mg/L Calcium – 29.2 to 192 mg/L
By 1986 upon completion of four (4) quarters of monitoring after the plant had become
operational, the groundwater quality indicative of a coal combustion release to groundwater
was already occurring according to these results:
TDS – 2 wells greater than 2,000
mg/L, up to 4,226 mg/L, or 8.5 times
the std.
Sulfates – 2 wells greater than 1,000
mg/L, up to 3,790 mg/L, or 15 times the
std.
Sampling in 1993 and 1994 resulted in these MCL or SMCL exceedances:
Parameter / Standard
(mg/L)
Well Exceedances (mg/L)
Cadmium (0.005) MW-1 (0.009, 2 times std) MW-3
Lead (0.015) MW-3 (0.051, 3.5 times std.) MW-4
Mercury (0.002) MW-3 (0.0336, 17 times std.)
Sulfate (250) MW-1 (1,180, 5 times std.)
MW-3
MW-4
TDS (500) MW-1 (1,180, 2.4 times std.)
MW-3 (1,117, 2.3 times std.)
MW-4
Sampling in March 2009 indicated further degradation of the groundwater by coal combustion
wastes according to these results:
Parameter / Standard
(mg/L)
Well Exceedances (mg/L)
TDS (500) MW-1 (4012, 8 times the std.)
MW-2 (697)
MW-3 (2,287)
MW-5 (3,141)
MW-6 (2,868)
MW-7 (1,517)
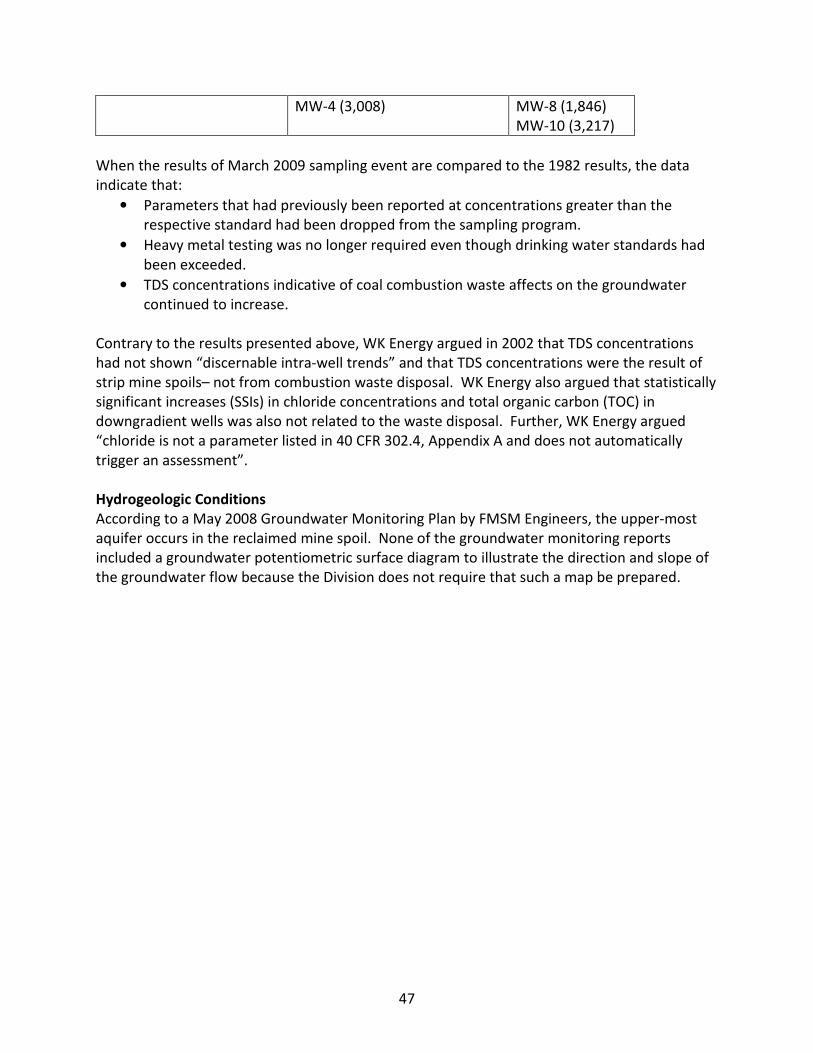
47
MW-4 (3,008) MW-8 (1,846)
MW-10 (3,217)
When the results of March 2009 sampling event are compared to the 1982 results, the data
indicate that:
• Parameters that had previously been reported at concentrations greater than the
respective standard had been dropped from the sampling program.
• Heavy metal testing was no longer required even though drinking water standards had
been exceeded.
• TDS concentrations indicative of coal combustion waste affects on the groundwater
continued to increase.
Contrary to the results presented above, WK Energy argued in 2002 that TDS concentrations
had not shown “discernable intra-well trends” and that TDS concentrations were the result of
strip mine spoils– not from combustion waste disposal. WK Energy also argued that statistically
significant increases (SSIs) in chloride concentrations and total organic carbon (TOC) in
downgradient wells was also not related to the waste disposal. Further, WK Energy argued
“chloride is not a parameter listed in 40 CFR 302.4, Appendix A and does not automatically
trigger an assessment”.
Hydrogeologic Conditions
According to a May 2008 Groundwater Monitoring Plan by FMSM Engineers, the upper-most
aquifer occurs in the reclaimed mine spoil. None of the groundwater monitoring reports
included a groundwater potentiometric surface diagram to illustrate the direction and slope of
the groundwater flow because the Division does not require that such a map be prepared.
48
2.8 Big Rivers Electricity Corporation, R.D. Green Plant, Robards
Location
9000 Highway 2096
Robards, Kentucky 42452
Webster County
GPS Coordinates: 37°38’08”; 87°30’12”
Summary
The groundwater monitoring program at the special waste landfill was drastically reduced in
1998 to include only eight (8) indicator parameters - despite lead and cadmium contamination
at concentrations above Division and EPA drinking water standards. The landfill is located
adjacent to and within approximately 200 feet of the Green River. The current monitoring
program indicates that coal combustion waste indicator parameters (TDS and chlorides) have
increased substantially in downgradient wells adjacent to the Green River.
Type(s) of Waste Management Units and Wastes Present
Special waste landfill that contains unspecified coal combustion wastes. The file review did not
indicate when waste was first placed in the landfill. The landfill is situated approximately 200
feet west of the Green River and approximately 250 feet north of Groves Creek, a tributary of
the Green River. Current aerial photography indicated that at least one suspect ash pond also
exists at the site.
According to Big River’s CERCLA 104(e) response (no date given) to EPA’s request for
information dated March 9, 2009, the Green plant has one (1) ash pond for the disposal of
bottom ash, and design drawings for that pond are dated 1978 – suggesting that waste
placement began about that time. No official ash pond commission date was given.
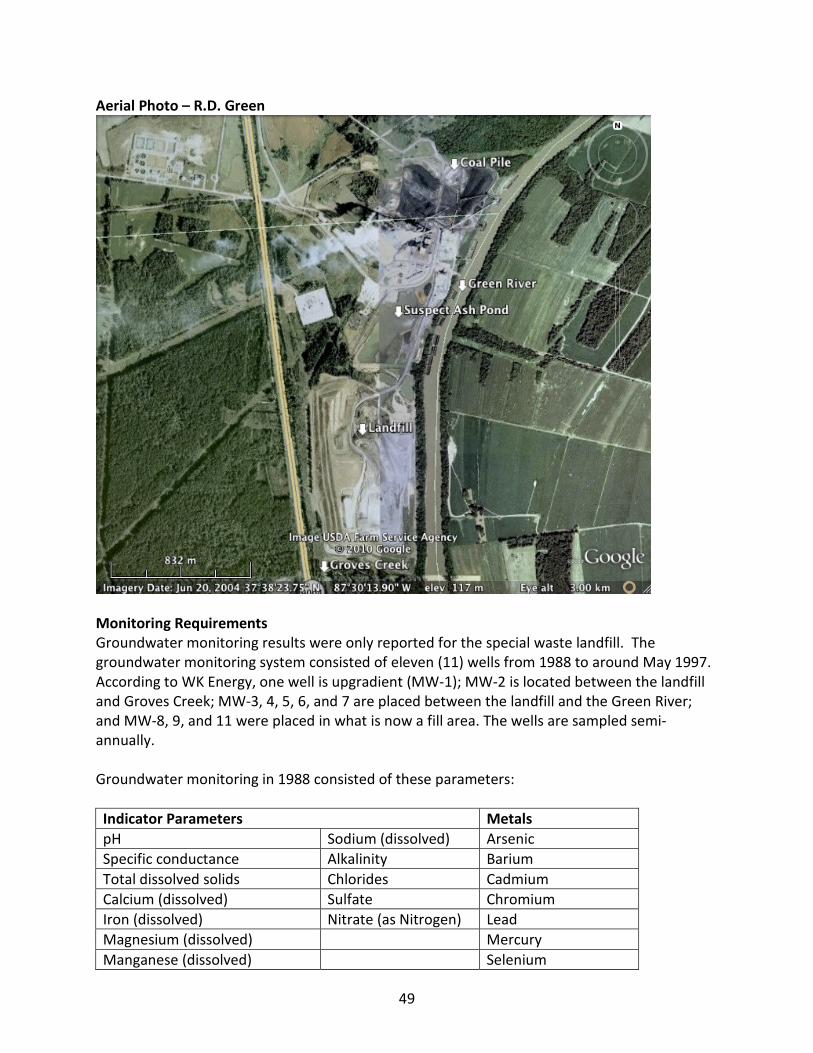
49
Aerial Photo – R.D. Green
Monitoring Requirements
Groundwater monitoring results were only reported for the special waste landfill. The
groundwater monitoring system consisted of eleven (11) wells from 1988 to around May 1997.
According to WK Energy, one well is upgradient (MW-1); MW-2 is located between the landfill
and Groves Creek; MW-3, 4, 5, 6, and 7 are placed between the landfill and the Green River;
and MW-8, 9, and 11 were placed in what is now a fill area. The wells are sampled semi-
annually.
Groundwater monitoring in 1988 consisted of these parameters:
Indicator Parameters Metals
pH Sodium (dissolved) Arsenic
Specific conductance Alkalinity Barium
Total dissolved solids Chlorides Cadmium
Calcium (dissolved) Sulfate Chromium
Iron (dissolved) Nitrate (as Nitrogen) Lead
Magnesium (dissolved) Mercury
Manganese (dissolved) Selenium
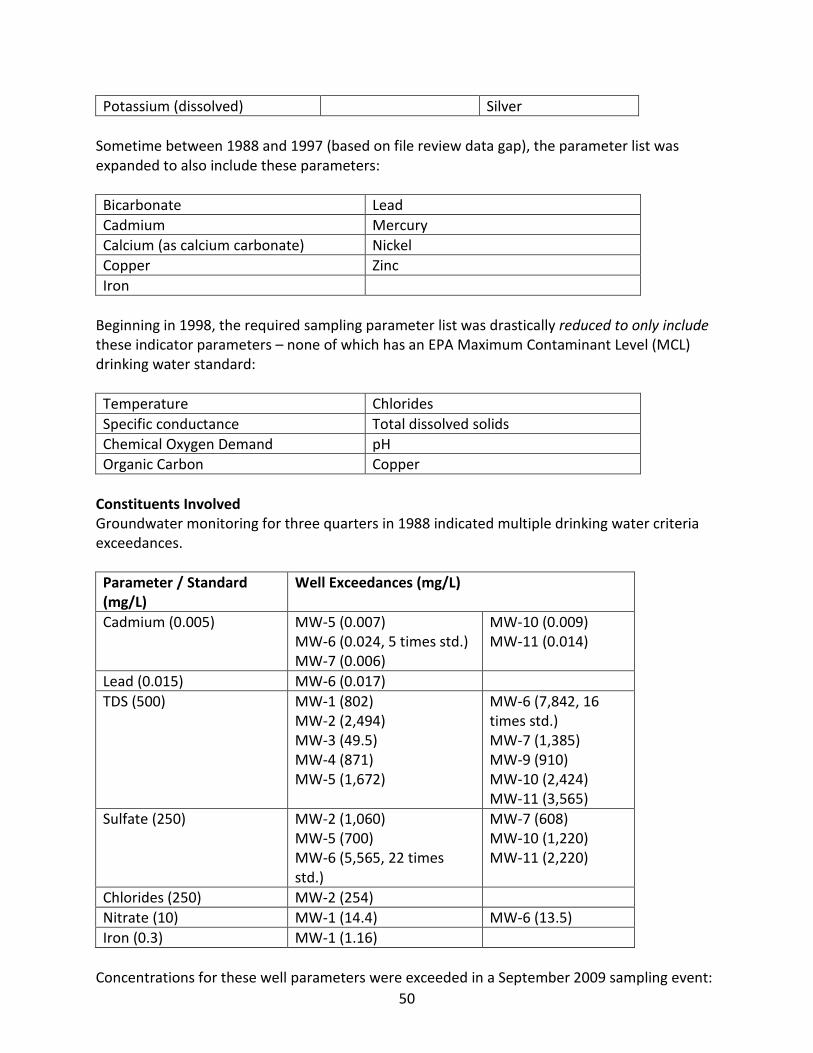
50
Potassium (dissolved) Silver
Sometime between 1988 and 1997 (based on file review data gap), the parameter list was
expanded to also include these parameters:
Bicarbonate Lead
Cadmium Mercury
Calcium (as calcium carbonate) Nickel
Copper Zinc
Iron
Beginning in 1998, the required sampling parameter list was drastically reduced to only include
these indicator parameters – none of which has an EPA Maximum Contaminant Level (MCL)
drinking water standard:
Temperature Chlorides
Specific conductance Total dissolved solids
Chemical Oxygen Demand pH
Organic Carbon Copper
Constituents Involved
Groundwater monitoring for three quarters in 1988 indicated multiple drinking water criteria
exceedances.
Parameter / Standard
(mg/L)
Well Exceedances (mg/L)
Cadmium (0.005) MW-5 (0.007)
MW-6 (0.024, 5 times std.)
MW-7 (0.006)
MW-10 (0.009)
MW-11 (0.014)
Lead (0.015) MW-6 (0.017)
TDS (500) MW-1 (802)
MW-2 (2,494)
MW-3 (49.5)
MW-4 (871)
MW-5 (1,672)
MW-6 (7,842, 16
times std.)
MW-7 (1,385)
MW-9 (910)
MW-10 (2,424)
MW-11 (3,565)
Sulfate (250) MW-2 (1,060)
MW-5 (700)
MW-6 (5,565, 22 times
std.)
MW-7 (608)
MW-10 (1,220)
MW-11 (2,220)
Chlorides (250) MW-2 (254)
Nitrate (10) MW-1 (14.4) MW-6 (13.5)
Iron (0.3) MW-1 (1.16)
Concentrations for these well parameters were exceeded in a September 2009 sampling event:
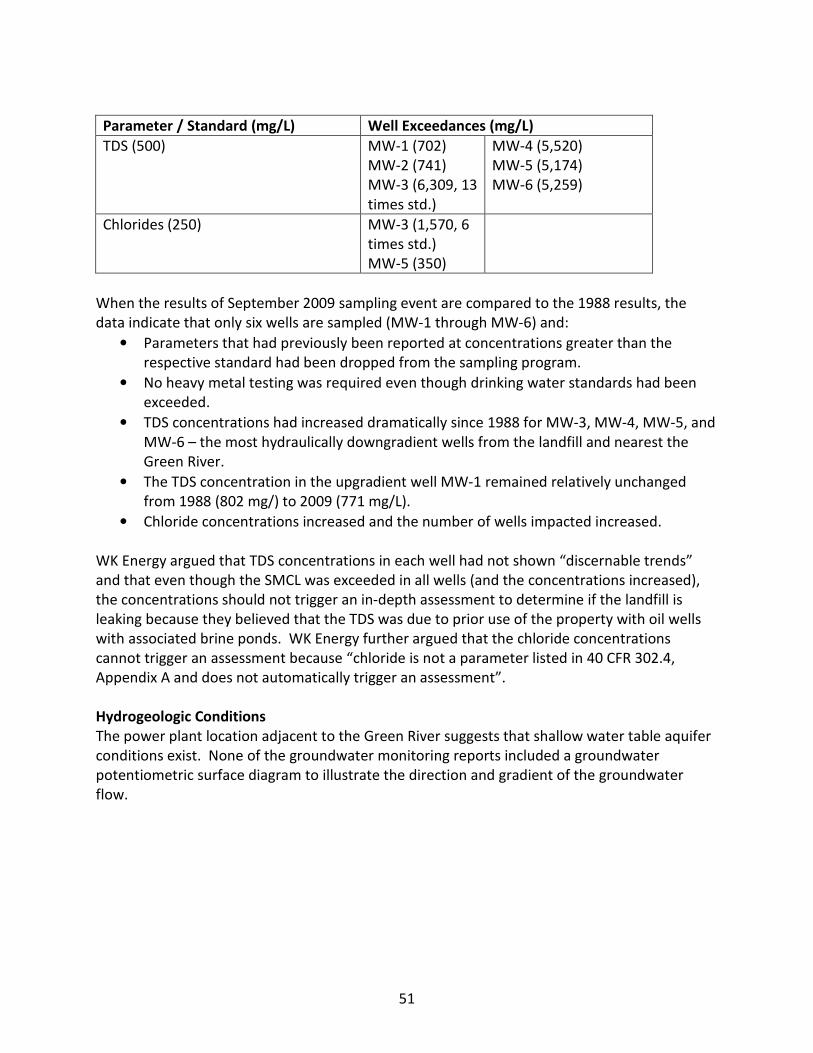
51
Parameter / Standard (mg/L) Well Exceedances (mg/L)
TDS (500) MW-1 (702)
MW-2 (741)
MW-3 (6,309, 13
times std.)
MW-4 (5,520)
MW-5 (5,174)
MW-6 (5,259)
Chlorides (250) MW-3 (1,570, 6
times std.)
MW-5 (350)
When the results of September 2009 sampling event are compared to the 1988 results, the
data indicate that only six wells are sampled (MW-1 through MW-6) and:
• Parameters that had previously been reported at concentrations greater than the
respective standard had been dropped from the sampling program.
• No heavy metal testing was required even though drinking water standards had been
exceeded.
• TDS concentrations had increased dramatically since 1988 for MW-3, MW-4, MW-5, and
MW-6 – the most hydraulically downgradient wells from the landfill and nearest the
Green River.
• The TDS concentration in the upgradient well MW-1 remained relatively unchanged
from 1988 (802 mg/) to 2009 (771 mg/L).
• Chloride concentrations increased and the number of wells impacted increased.
WK Energy argued that TDS concentrations in each well had not shown “discernable trends”
and that even though the SMCL was exceeded in all wells (and the concentrations increased),
the concentrations should not trigger an in-depth assessment to determine if the landfill is
leaking because they believed that the TDS was due to prior use of the property with oil wells
with associated brine ponds. WK Energy further argued that the chloride concentrations
cannot trigger an assessment because “chloride is not a parameter listed in 40 CFR 302.4,
Appendix A and does not automatically trigger an assessment”.
Hydrogeologic Conditions
The power plant location adjacent to the Green River suggests that shallow water table aquifer
conditions exist. None of the groundwater monitoring reports included a groundwater
potentiometric surface diagram to illustrate the direction and gradient of the groundwater
flow.
52
Contact Information
To learn more, please contact
Sierra Club
408 C St NE
Washington, DC, 2003
202-675-7919
Kentucky Waterways Alliance
120 Webster Street, Suite 217
Louisville, KY 40206
502-589-8008
Global Environmental, LLC,
Mark Quarles,
Tennessee Licensed Professional Geologist (TN 3834),
5640 Stoneway Trail, Nashville, TN 37209
Acknowledgements
Special thanks to Lisa Evans and Jeff Stant for reviewing and improving this report. Thanks to
Lyndsay Moseley for her photographs.


![Chemical Spills [1]](https://img.pdfslide.net/doc/110x75/577ccfc91a28ab9e789093e1/chemical-spills-1.jpg)