Embed Size (px)
Citation preview
PNNL-19491
Prepared for the U.S. Department of Energy under Contract DE-AC05-76RL01830
Slug Test Characterization Results for Multi-Test/Depth Intervals Conducted During the Drilling of CERCLA Operable Unit OU ZP-1 Wells 299-W11-43, 299-W15-50, and 299-W18-16 FA Spane DR Newcomer June 2010

DISCLAIMER This report was prepared as an account of work sponsored by an agency of the United States Government. Neither the United States Government nor any agency thereof, nor Battelle Memorial Institute, nor any of their employees, makes any warranty, express or implied, or assumes any legal liability or responsibility for the accuracy, completeness, or usefulness of any information, apparatus, product, or process disclosed, or represents that its use would not infringe privately owned rights. Reference herein to any specific commercial product, process, or service by trade name, trademark, manufacturer, or otherwise does not necessarily constitute or imply its endorsement, recommendation, or favoring by the United States Government or any agency thereof, or Battelle Memorial Institute. The views and opinions of authors expressed herein do not necessarily state or reflect those of the United States Government or any agency thereof. PACIFIC NORTHWEST NATIONAL LABORATORY operated by BATTELLE for the UNITED STATES DEPARTMENT OF ENERGY under Contract DE-ACO5-76RL01830
Printed in the United States of America
Available to DOE and DOE contractors from the Office of Scientific and Technical Information,
P.O. Box 62, Oak Ridge, TN 37831-0062; ph: (865) 576-8401 fax: (865) 576 5728
email: [email protected]
Available to the public from the National Technical Information Service, U.S. Department of Commerce, 5285 Port Royal Rd., Springfield, VA 22161
ph: (800) 553-6847 fax: (703) 605-6900
email: [email protected] online ordering: http://www.ntis.gov/ordering.htm

Project No. F54559 Internal Distribution
Date
To
From
Subject
September 13, 2005 M.E. Byrnes F.A. Spane and D.R. Newcomer Slug Test Characterization Results for Multi- Test/Depth Intervals Conducted During the Drilling of CERCLA Operable Unit OU ZP-1 Wells 299-W11-43, 299-W15-50, and 299-W18-16
F.J. Anderson J.V. Borghese M. Connelly J.S. Fruchter S.P. Luttrell W.J. McMahon D.A. Milliers L.C. Swanson B.A. Williams C.S. Wright File/LB
The following draft letter report presents test descriptions and analysis results for multiple, stress-level slug tests that were performed at selected test/depth intervals within three Operable Unit (OU) ZP-1 wells: 299-W11-43 (C4694/Well H), 299-W15-50 (C4302/Well E), and 299-W18-16 (C4303/Well D). These wells are located within south-central region of the Hanford Site 200-West Area (Figure 1.1). The test intervals were characterized as the individual boreholes were advanced to their final drill depths. The primary objective of the hydrologic tests was to provide information pertaining to the areal variability and vertical distribution of hydraulic conductivity with depth at these locations within the OU ZP-1 area. This type of characterization information is important for predicting/simulating contaminant migration (i.e., numerical flow/transport modeling) and designing proper monitor well strategies for OU and Waste Management Area locations. For ease in referencing results for the OU ZP-1 field testing program within the letter report, the following outline is provided:
DRAFT LETTER REPORT OUTLINE
1. Executive Summary 2. General Hydrologic Test Plan Description 3. Hydrologic Test System Description
4. Slug Test Response/Analysis
5. Slug Test Results
5.1 Well 299-W11-43 (C4694)
E54-1900-001 (8/98)

M.E. Byrnes September 13, 2005 Page 2
5.1.1 Zone 1 5.1.2 Zone 2 5.1.3 Zone 3
5.2 Well 299-W15-50 (C4302)
5.2.1 Zone 1 5.2.2 Zone 2 5.2.3 Zone 3
5.3 Well 299-W18-16 (C4303)
6. Conclusions 7. References Appendix A: Test Equipment Pictures Appendix B: Selected Borehole Logs 1. Executive Summary Overall, the test results obtained from multiple, stress-level slug tests conducted during drilling and borehole advancement provide detailed information concerning the vertical distribution of hydraulic conductivity at three Hanford Site Operable Unit (OU) ZP-1 test well locations. The individual test/depth intervals were generally sited to provide hydraulic property information within the upper, middle, and lower sections of the unconfined aquifer (i.e., Ringold Formation, Unit 5). These characterization results complement previous and on-going drill-and-test characterization programs at surrounding 200-West and -East Area locations (e.g., Spane 2003, 2005). Analysis of the slug test results indicate a relatively wide-range in the calculated average, test interval hydraulic conductivity (Table 5.2), with estimates ranging between 0.04 and 24.8 m/day. The ZP-1 well hydraulic conductivity estimates were derived for test interval sections that ranged from 2.29 to 3.05 m in length (Table 5.1). Overall, the highest hydraulic conductivity estimates were obtained for test zones within well 299-W11-43 (i.e., range: 16.0 to 24.8 m/day), which is the northernmost ZP-1 well tested. Most available surrounding well hydraulic characterization information is reflective of conditions within the upper 10-m of the unconfined aquifer. Only one ZP-1 test interval was located within this zone (i.e., well 299-W15-50, Zone 1; Table 5.2). The calculated hydraulic conductivity estimate of 3.07 m (type-curve analysis result) for this ZP-1 test interval is essentially identical to the reported 200-West Area geometric mean value (3.08 m/day) for recent slug tests conducted at thirty monitor well sites completed within the upper-part of the unconfined aquifer in the 200-West Area (Spane et al., 2001a, 2001b, 2002, 2003; Spane and Newcomer 2004). The vertical hydraulic conductivity profiles for ZP-1 wells 299-W11-43 and 299-W15-50 (based on only two and three test/depth intervals at each site, respectively) do not suggest a consistent pattern

M.E. Byrnes September 13, 2005 Page 3 for hydraulic conductivity with depth within the Ringold Formation at these two locations. As a point of comparison, a more extensive, on-going (unpublished) drill-and-test characterization program for a borehole site (well 299-W11-25) located within the WMA T area (located generally east to northeast of the ZP-1 test well sites), however, does exhibit a slightly increasing permeability with depth pattern, which may also be suggested at the well 299-W15-50 location. 2. General Hydrologic Test Plan Description The following general hydrologic test plan discussion is taken primarily from a similar slug test characterization program description presented previously in Spane (2003, 2005). Hydrologic testing was implemented when the approximate targeted depth interval within the upper, middle and lower sections of the unconfined aquifer were reached during drilling. To prepare the test zone for slug test characterization, the packer/well-screen test assembly was lowered to the bottom of the borehole and the drill casing retracted exposing an approximate ≤3-m open borehole section (note: ~2.3 m for well 299-W18-16). The packer was then inflated to isolate the well-screened/test interval, and testing string from the inside of the drill casing. A series of multiple, stress-level slug tests were performed for each isolated test-interval section. The reason for utilizing a multi-stress level approach was to determine whether the associated slug test responses exhibited either a variable or stress-level dependence. As noted in Butler (1998) and Spane et al. (2003), tests exhibiting either variable or stress-level dependence can provide valuable information pertaining to the presence of dynamic well skin or non-linear (i.e., turbulence) test response conditions occurring within the test section. General slug test stress levels applied during testing were designed to be within the range of ~0.3 to 0.5 m for lower-stress tests and ~1.0 m for higher-stress tests. The slug tests were initiated utilizing several slugging rods of different, known displacement volumes (i.e., for test intervals at wells 299-W15-50 and –W18-16) or conducted pneumatically using compressed air/gas (i.e., for test intervals at well 299-W11-43). For pneumatic tests, compressed air was used to depress the fluid-column levels within the test-casing/test interval system to the designed test stress levels. Actual stress levels applied for each test were determined by comparing pressure transducer readings below and above the borehole fluid-column surface. After the monitored fluid column stabilized for several minutes at the prescribed stress level, the slug test (slug withdrawal test) was initiated by rapidly releasing the compressed gas used to depress the borehole fluid-column level. The compressed gas was released from the borehole column by opening valves (e.g., ball valves) mounted on the surface wellhead used to seal the casing system. As noted in Spane et al. (1996), the gas release valves had a cross-sectional area that was greater (e.g. >1.5 times) than the cross-sectional area of the test system where fluid-level surface recovering took place during testing. For most test zones, three or more multi-stress slug tests were conducted. Individual slug tests were fully recovered prior to depressing the fluid column for preparation of the next slug test within the characterization sequence. A wide-range in recovery times were expected based on anticipated range in permeability conditions. For example Spane et al., (2001a, 2001b, 2002, 2003) and Spane and Newcomer (2004) report recovery times as rapid as <15 sec for high permeability test intervals to

M.E. Byrnes September 13, 2005 Page 4 >5 min for lower permeability test zones for 200-West Area wells. A description of the hydrologic test system utilized during slug test characterization is provided in the following report section. 3. Hydrologic Test System Description Figures 3.1 and 3.2 show the general test system configuration utilized for slug tests conducted during the drilling and testing of the ZP-1 wells using single- and dual-wall drill casing strings, respectively. Slug tests were conducted using only slugging rods for all test zones within single-wall drill casing wells 299-W15-50 and 299-W18-16; while pneumatic slug tests were performed solely for test zones within well 299-W11-43, which was drilled with dual-wall drilling casing. Salient features common to both test system configurations are: the downhole packer/well-screen test assembly and downhole pressure transducer and surface datalogger systems. The drill-casing strings used for borehole advancement during the drilling of the ZP-1 wells varied for the respective well sites and had the following I.D./O.D. dimensions: well 299-W11-43 (dual-wall casing: outer casing 0.216/0.229 m; inner casing 0.152/0.165 m); well 299-W15-50 (0.194/0.219 m); and well 299-W18-16 (0.222/0.244 m). As shown in Figures 3.1 and 3.2, an inflatable packer was used to seal and isolate the test interval and testing string from the encompassing drill casing area. For tests conducted with dual-wall casing (i.e., well 299-W11-43), the annular zone between the drill casings was also connected (theoretically), to the isolated test interval during testing (note: this assumes that the drilling bit orifices at the bottom of the drill casings were not clogged with drill cutting debris, which could effectively seal the drill casing annular zone from contributing to associated test responses). A 20-slot, well-screen section was attached below the packer to maintain an open section for testing after retracting the drill casing. For testing at all ZP-1 well sites, one standard packer/well-screen assembly was utilized: 3-m well-screen (Figure 3.3). In most cases, a strain-gauge, 0 to 345 kPa (0 to 50 psig) pressure transducer was installed within the test-casing string to monitor downhole test interval response prior to and during slug testing. Selected pictures of the packer/well-screen test assembly are shown in Appendix A. Pneumatic slug tests conducted at well 299-W11-43 required the use of a surface wellhead assembly for sealing the test-casing string, thereby isolating the test interval from the overlying inner, drill-casing section. The surface wellhead assembly encompassed not only the testing string, but also extended to the outer drill casing. This wellhead extension was necessary to permit equal application of compressed gas for depressing the fluid columns within the 0.102 m I.D. testing-string and annular zone between the dual-wall drill casing, which are both communicative with the underlying test interval. This wellhead isolation is required to contain the administered compressed air that is used to pneumatically depress the fluid columns to designed slug test stress levels, as discussed in Section 2. Salient features of the well-head assembly include:
• a sealed, pass-through connection allowing for passage of downhole pressure transducer and cable to be used to measure test interval pressure response within the test-casing string

M.E. Byrnes September 13, 2005 Page 5
• an outside pressure probe connection that allows direct measurement of the air/gas pressure within the test-casing below the surface seal
• a connection to allow compressed air to be introduced directly to the
inside of the testing-string casing
• surface wellhead valves for the rapid release of the compressed air within the testing-string casing, which allows for the immediate initiation of slug test application.
The preceding discussion describes the test system as designed for use during pneumatic slug tests at well 299-W11-43. Slug tests conducted within test intervals at wells drilled with single-wall casing (i.e., wells 299-W15-50 and -W18-16) were performed using slugging rods to initiate the slug test response. The test system configuration utilized is shown schematically in Figure 3.1. The two slugging rods used for conducting the multiple, stress-level slug tests had O.D. dimensions of 0.038 and 0.051 m that theoretically produce a maximum initial displacement stress within the 0.102 m I.D. test casing of 0.255 and 0.458 m, respectively. Slug tests conducted with slugging rods are particularly well-suited for test/depth intervals exhibiting lower hydraulic property conditions (e.g., K ≤ 1 m/day). This is because of the difficulty in establishing stability in downhole well pressures (i.e., prior to test initiated) when pneumatic methods are employed. 4. Slug Test Response/Analysis The following discussion pertaining to slug test response and analysis is taken primarily from Spane (2003, 2005). As shown in Figure 4.1 and discussed in Butler (1998) and Spane et al. (2003b), water levels within a test well can respond in one of three ways to the instantaneously applied stress of a slug test. These response model patterns are: 1) an over-damped response, where the water levels recover in an exponentially decreasing recovery pattern; 2) an underdamped response, where the slug test response oscillates above and below the initial static, with decreasing peak amplitudes with time; and 3) critically-damped, where the slug test behavior exhibits characteristics that are transitional to the over- and under-damped response patterns. Factors that control the type of slug test response model that will be exhibited within a well include a number of aquifer properties (hydraulic conductivity) and well-dimension characteristics (well-screen length, well-casing radius, well-radius, aquifer thickness, fluid-column length) and can be expressed by the response damping parameter, CD, which Butler (1998) reports for unconfined aquifer tests as:
CD = (g/Le)½ rc2 ln (Re/rw)/(2 K L) (1)
where g = acceleration due to gravity
Le = effective well water-column length
rc = well casing radius; i.e., radius of well water-column that is active during testing

M.E. Byrnes September 13, 2005 Page 6 Re = effective test radius parameter; as defined by Bouwer and Rice (1976)
rw = well radius
K = hydraulic conductivity of test interval
L = well-screen length. Given the multitude of possible combinations of aquifer properties, well-casing dimensions, and test interval lengths, no universal CD value ranges can be provided that describe slug test response conditions. However, for various combinations anticipated for testing at ZP-1 well sites during drilling the following general guidelines on slug test response prediction are provided:
• CD >3 = over-damped response • CD 1 - 3 = critically-damped response • CD <1 = under-damped response
Over-damped test response generally occurs within stress wells monitoring test formations of low to moderately high hydraulic conductivity (e.g., Ringold Formation), and are indicative of test conditions where frictional forces (i.e., resistance of groundwater flow from the test interval to the well) are predominant over test system inertial forces. Most ZP-1 well test intervals exhibited over-damped response characteristics. Figure 4.2 shows predicted slug test recovery as a function of hydraulic conductivity (K range: 1 to 25 m/day; 3.05 m test interval) for test intervals exhibiting over-damped response characteristics, for general ZP-1 test well/interval conditions. The test predictions shown in the figure are based on responses occurring within a test system casing I.D. = 0.102 m. As indicated in the figure, test intervals having hydraulic conductivity values of approximately 25 m/day or less, should be readily resolved for tests exhibiting over-damped slug test behavior. For over-damped slug tests, two different methods were used for the slug-test analysis: the semiempirical, straight-line analysis method described in Bouwer and Rice (1976) and Bouwer (1989) and the type-curve-matching method for unconfined aquifers presented in Butler (1997). A detailed description of over-damped slug-test analysis methods is presented in Spane and Newcomer (2004). Under-damped test response patterns are exhibited within stress wells where inertial forces are predominant over formation frictional forces. This commonly occurs in wells with extremely long fluid columns (i.e., large water mass within the well column) and/or that penetrate highly permeable aquifers (e.g., Hanford formation). Tests exhibiting under-damped behavior should be conducted with very small stress level applications. No ZP-1 well test intervals displayed formational under-damped test response characteristics. As mentioned previously, critically-damped test responses are indicated by stress well water-level responses that are transitional to the over- and under-damped test conditions, as shown in Figure 4.1. They typically occur in wells that monitor test formations exhibiting intermediate to high hydraulic conductivity. As noted in Butler (1998), distinguishing between over- and critically-damped slug test response may be difficult in some cases (i.e., due to test signal noise) when

M.E. Byrnes September 13, 2005 Page 7 examined on arithmetic plots. Proper model identification may be enhanced when semi-log plots are utilized, i.e., log head versus time (e.g., Bouwer and Rice plot). Critically-damped slug tests exhibit a diagnostic concave-downward pattern when plotted in this semi-log plot format. This is in contrast to over-damped response behavior, which displays either a linear or concave upward (elastic) pattern. Critically-damped slug-test responses are influenced by processes (e.g., inertial) that are not accounted for in the previously discussed slug test analytical methods (i.e., for over-damped tests). Because of this, slug tests exhibiting these response characteristics cannot be analyzed quantitatively using the Bouwer and Rice or standard type-curve methods. High-K analysis methods that can be employed for analyzing unconfined aquifer tests exhibiting either critically-damped or under-damped response behavior include those described in Springer and Gelhar (1991), Butler (1997), McElwee and Zenner (1998), McElwee (2001), Butler and Garnett (2000), and Zurbuchen et al. (2002). Because of the ease provided by a spreadsheet-based approach, the test analysis method presented in Butler and Garnett (2000) was used for analyzing ZP-1 tests (i.e., at well 299-W11-43) exhibiting critically-damped behavior. A detailed discussion of this analytical procedure and method is presented in Spane and Newcomer (2004). It should also be noted that slug test responses conducted within well 299-W11-43, which employed dual-wall drilling casing, were “complicated” by the presence of an annular zone between the dual-wall drill casing, which is potentially communicative with the underlying test interval (as shown in Figure 3.2). The presence of two connected test system areas (i.e., within the 0.102 m I.D. testing string and within the dual-wall drill casing annular area) to respond to the initiated slug test response can be visualized as a “u-tube” test system that is connected to the test formation (see Figure 4.3). As noted in Spane (1996), slug test response time, t, is directly related to the square of the radius of the area where the water-level response occurs, rc
2, and can be expressed in the form of the relationship below: t = (S rc
2)/T (2)
where, S = test interval storativity T = test interval transmissivity
Slug test response recovery occurring in such a dual-area test system would be function not only of the hydraulic properties within the test interval, but also water-level (head) imbalances that occur between the two test system areas, and where the water-level responses are monitored. Water-level imbalances would be expected to be most pronounced during the early phases of test recovery and diminish with lowering recovery rates exhibited later during the tests. For the test system utilized as well 299-W11-43, early-time test responses would recover initially at a faster rate within the 0.102 I.D. test string and within the dual-wall drill casing annular area. Because the cross-sectional area within the dual-wall annulus is larger than within the test string (i.e., 0.015 m2 vs. 0.008 m2), recovery within this zone would noticeably lag behind that within the smaller testing string at the beginning of the slug test response period. This is shown diagrammatically in Figure 4.3, where ti represents the equal fluid-column position at the initiation point of the test, and ti+1 shows the dissimilar fluid-column positions in the two areas at some early time in the slug test response (e.g., <5 sec). Since

M.E. Byrnes September 13, 2005 Page 8 the test interval response pressure is only measured within the smaller testing string (rc = 0.051 m), test recovery should initially be reflective of recovery solely within the testing string. At some point, the imbalance in water-level recovery (pressures) between the dual-wall area and the testing string would cause recovery to perceptively slow within the testing string and then oscillate against a common recovery trend back to static level conditions, which is controlled by the test interval hydraulic properties. Figure 4.4 illustrates this superimposed oscillatory recovery pattern for a test example observed at well 299-W11-43 (Zone 2; test SW #1), which was tested using dual-wall drill casing. As shown for the given test interval hydraulic conductivity, the initial oscillatory response behavior indicative of faster test recovery is directly bound by the predicted exponential-decay (over-damped) test response based on a test system radius, rin that is the average of the smaller testing string radius, rc, (0.051 m) and the average total test system, ravg (0.069 m). Complimenting this response, the oscillatory behavior indicative of slower test recovery is directly bound by the predicted exponential-decay test response based on a test system radius, rout,, which equals the average of total test system equivalent radius, reqv, (0.086 m) and average test system radius, ravg. Following the first oscillation cycle, the predicted exponential test recovery responses would be expected to encompass but not directly bound the oscillatory recovery back to static test interval conditions. For the testing string and dual-wall drilling casing used at ZP-1 well 299-W11-43, the following test system test radii analysis relationships apply: rc = radius of testing string; (0.051 m) ran = equivalent radius of the annular zone between the dual-wall drill casing; (0.070 m) reqv = equivalent radius of the total test system: (rc
2 + ran2)½; (0.086 m)
ravg = average test system radius: (rc + reqv)/2; (0.069 m) rin = radius of test system bounding faster oscillatory recovery: (rc + ravg)/2; (0.060 m) rout = radius of test system bounding slower oscillatory recovery: (reqv + ravg)/2; (0.077 m) The preceding discussion focuses primarily on influences and controlling factors of slug tests conducted in ZP-1 wells that utilize dual-wall drill casing. To analyze the results of tests exhibiting this type of oscillatory behavior superimposed on formational over-damped (exponential decay) or critically-damped (transitional) test response characteristics, a two-step analysis procedure was employed. First, to remove the effects of the artificially imposed test system oscillations, a polynomial (cubic) curve was applied to the observed test data. The calculated polynomial fit, which represents the test response reflective of the “average” test system, was then analyzed using the Butler and Garnett (2000) analysis method described previously for critically-damped tests. The well radius value (i.e., 0.069 m) used in test analysis represents the average radius, ravg, for the two regions within the test system where the slug test response occurred (i.e. within the testing string and annular area between the dual-wall drill casing).

M.E. Byrnes September 13, 2005 Page 9 5. Slug Test Results The following discussion presents pertinent information describing slug testing activities and analysis results for the test/depth zones that were hydrologically characterized at the ZP-1 boreholes, as they were advanced to their final drilling depths. Table 5.1 presents pertinent slug test information for the respective test/depth intervals, while Table 2 summarizes the slug test analysis results. Selected borehole logs are presented in Appendix B, which can be referred to for a geologic description of the respective well test zone/depth intervals.
5.1 Well 299-W11-43
Drilling of OU ZP-1 well 299-W11-43 was initiated on May 23, 2005 and continued until reaching a final depth of 136.55 m bgs on June 20, 2005. The Lower Mud unit of the Ringold Formation was not encountered during drilling, which represents the bottom boundary of the unconfined aquifer at this location. Based on projections from neighboring well sites, however, the Lower Mud unit contact would be expected at a depth of 60 to 65 m bgs. Three test depth intervals were tested at the borehole location; Zone 1 = 87.78 - 90.83 m bgs; Zone 2 = 106.28 - 109.33 m bgs; and Zone 3 = 133.50 - 136.55 m bgs.
5.1.1 Zone 1 After reaching a depth of 90.83 m bgs, the packer/well-screen assembly was lowered to the bottom of the borehole and the 0.229 m O.D. dual-wall, drill casing retracted 3.05 m, producing a test/depth interval for Zone 1 of 87.78 to 90.83 m bgs. The borehole geology log (Appendix B; Figure B.1) indicates that the test interval section generally consists of a gravel unit, comprised of 85% gravel and 15% sand. A series of four pneumatic slug withdrawal tests were conducted between 1008 hours and 1500 hours, (PDT) June 2, 2005. The pneumatic slug tests were conducted by pressurizing the 4-in testing-string casing (I.D. = 0.102 m) used to set the packer/well-screen assembly and the adjoining annular area between the dual-wall drilling casing. The pneumatic tests used applied stress (compressed air) pressures that produced fluid-column depressions ranging between 0.3 and 0.9 m for individual tests. After test zone pressure was stabilized, the slug tests were initiated by rapidly releasing the compressed air used to depress the test system fluid column by opening the wellhead surface valves. Downhole test interval response pressures during testing were monitored using a 0 - 50 psig (0 - 345 kPa) pressure transducer set at a depth of ~83.9 m bgs, while pneumatic gas injection pressure was recorded utilizing a 10 psig (0 - 69 kPa) pressure transducer installed on the surface wellhead assembly. The static depth-to-water for the test interval during testing was 81.56 m bgs. Due to a field testing error, the data logger was not turned off at the termination of testing. This error caused the data logger to over-write the collected data, resulting in a loss of all test response information. Based on observations by the attending field hydrologist, however, the test responses

M.E. Byrnes September 13, 2005 Page 10 exhibited relatively rapid recoveries (i.e., within 30 to 60 seconds, which appear similar to test responses for the underlying two test intervals. Based on this qualitative assessment, an intermediate to moderately high hydraulic conductivity is suggested for this test interval, within the range of 10 to 20 m/day.
5.1.2 Zone 2 After reaching a depth of 109.33 m bgs, the packer/well-screen assembly was lowered to the bottom of the borehole and the 0.229 m O.D. dual-wall, drill casing retracted 3.05 m, producing a test/depth interval for Zone 2 of 106.28 to 109.33 m bgs. The borehole geology log (Appendix B; Figure B.1) indicates that the test interval section generally consists of a gravel unit, comprised of 80% gravel and 20% sand. A series of three pneumatic slug withdrawal tests were conducted between 1206 hours and 1450 hours, (PDT) June 10, 2005. The pneumatic slug tests were conducted by pressurizing the 4-in testing-string casing (I.D. = 0.102 m) used to set the packer/well-screen assembly and the adjoining annular area between the dual-wall, drilling casing. The pneumatic tests used applied stress (compressed air) pressures that produced fluid-column depressions ranging between 0.5 and 0.9 m for individual tests. After the test zone pressure was stabilized, the slug tests were initiated by rapidly releasing the compressed air used to depress the test system fluid column by opening the wellhead surface valves. Downhole test interval response pressures during testing were monitored using a 0 - 50 psig (0 - 345 kPa) pressure transducer set at a depth of ~84.1 m bgs, while pneumatic gas injection pressure was recorded utilizing a 10 psig (0 - 69 kPa) pressure transducer installed on the surface wellhead assembly. The static depth-to-water for the test interval during testing was 81.53 m bgs. Because of the utilization of dual-wall drill casing at this well, all slug tests exhibited oscillatory behavior superimposed on exponentially decay test response as illustrated in Figure 4.4. A comparison of the normalized, polynomial curve-fits of the observed test data shown in Figure 5.1, indicates a slight nonlinear (concave downward), critically-damped slug test response, which were fully recovered within ~30 sec of test initiation. The normalized test responses indicate a stress-dependence, with the highest stress test (SW #3) exhibiting more time lag in the observed recovery. This is common for critically-damped tests and is associated with increased turbulence effects imposed by higher stress levels. For this reason, hydraulic conductivity estimates for this test are based solely on the results of the two lower-stress slug tests (i.e., SW #1 and #2). As noted previously, slug tests exhibiting this critically-damped response behavior cannot be analyzed quantitatively with the standard, linear, response-based analytical methods employed for over-damped tests (i.e., the Bouwer and Rice or type-curve methods). The High-K analysis method presented in Butler and Garnett (2000) was used to analyze the polynomial-curve fit slug test data for this test/depth interval. Because the critically-damped test responses for the two lower stress tests were very similar, results obtained from the High-K analysis method are quite comparable. Estimates for K ranged between 24.1 and 25.5 m/day, and averaged 24.8 m/day for the two tests, which is based on using the average test system radius (ravg = 0.069 m). A selected example of an analysis plot for this test interval is shown in Figure 5.2.

M.E. Byrnes September 13, 2005 Page 11 For qualitative comparison, the type curve used in analyzing the polynomial-curve fit data in Figure 5.2 is shown superimposed with the observed test data response in Figure 5.3. The bounding type-curve solutions displayed previously in Figure 4.4 that are based on different test system radii are also included in the figure. As shown, the analysis type-curve matches the observed test data response, while the bounding type curves encompass the oscillatory test responses reasonably well indicating a corroboration of the more quantitative test analysis results. It should also be noted that an additional slug test stress was applied solely within the annular zone of the dual-wall casing by rapidly adding ~5 gal of water between the two drill casings at land surface. This was not designed to be a quantitative test, but rather to assess the level of hydraulic communication between the annular zone and the test interval. The observed response indicated a very similar pattern (i.e., oscillatory response superimposed on exponential decay recovery) as exhibited for the lower stress pneumatic tests, indicating a highly communicative condition between this annular test area and the underlying test interval.
5.1.3 Zone 3 After reaching a depth of 136.55 m bgs, the packer/well-screen assembly was lowered to the bottom of the borehole and the 0.229 m O.D. dual-wall, drill casing retracted 3.05 m, producing a test/depth interval for Zone 3 of 133.50 to 136.55 m bgs. The borehole geology log (Appendix B; Figure B.1) indicates that the test interval section generally consists of a sandy gravel unit, comprised of 40% gravel, 55% sand, and 5% silt. A series of four pneumatic slug withdrawal tests were conducted between 1206 hours and 1450 hours, (PDT) June 22, 2005. The pneumatic slug tests were conducted by pressurizing the 4-in testing-string casing (I.D. = 0.102 m) used to set the packer/well-screen assembly and the adjoining annular area between the dual-wall, drilling casing. The pneumatic tests used applied stress (compressed air) pressures that produced fluid-column depressions ranging between 0.3 and 1.0 m for individual tests, which was then rapidly released using the wellhead surface valves. Downhole test interval response pressures during testing were monitored using a 0 - 50 psig (0 - 345 kPa) pressure transducer set at a depth of ~84.0 m bgs, while pneumatic gas injection pressure was recorded utilizing a 10 psig (0 - 69 kPa) pressure transducer installed on the surface wellhead assembly. The static depth-to-water for the test interval during testing was 81.53 m bgs. Because of the utilization of dual-wall drill casing at this well, all slug tests exhibited oscillatory behavior superimposed on exponentially decay test response as previously illustrated in Figure 4.4. A comparison of the normalized, polynomial curve-fits of the observed test data shown in Figure 5.4, indicates a nonlinear (concave downward), critically-damped slug test response, which were fully recovered within ~45 sec of test initiation. The normalized test responses indicate a stress-dependence, with the highest stress test (SW #3) exhibiting more time lag in the observed recovery. This is common for critically-damped tests and is associated with increased turbulence effects imposed by higher stress levels. For this reason, hydraulic conductivity estimates for this test are based solely on the results of the two lower-stress slug tests (i.e., SW #1 and #4).

M.E. Byrnes September 13, 2005 Page 12 As noted previously, slug tests exhibiting this critically-damped response behavior cannot be analyzed quantitatively with the standard, linear, response-based analytical methods employed for over-damped tests (i.e., the Bouwer and Rice or type-curve methods). The High-K analysis method presented in Butler and Garnett (2000) was used to analyze the polynomial-curve fit slug test data for this test/depth interval. Because the critically-damped test responses for the two lowest stress tests were similar, results obtained from the High-K analysis method are quite comparable. Estimates for K ranged between 14.3 and 17.7 m/day, and averaged 16.0 m/day for the two low stress tests, which is based on using the average test system radius (ravg = 0.069 m). A selected example of an analysis plot for this test interval is shown in Figure 5.5. As indicated, the High-K analysis solution matches the polynomial-curve fit slug test data for ~70% of the initial recovery curve. The reason for the faster test data recovery during the later stages of the test are not completely understood, but maybe attributed to minor leakage occurring around the packer used to isolate the test interval. For qualitative comparison, the type curve used in analyzing the polynomial-curve fit data in Figure 5.5 is shown superimposed with the observed test data response in Figure 5.6. The bounding type-curve solutions that are based on different test system radii, are also included in the figure. As shown, the analysis type-curve matches the observed test data response over approximately 70% of the decay and the bounding type curves generally encompass the oscillatory test responses reasonably well. The oscillatory responses exhibited later in the test are attributed to equilibration effects due to minor pressure/recovery imbalances between the two test system fluid column areas. It should also be noted that an additional slug test stress was applied solely within the annular zone of the dual-wall casing by rapidly adding ~5 gal of water between the two drill casings at land surface. This was not designed to be a quantitative test, but rather to assess the level of hydraulic communication between the annular zone and the test interval. The observed response indicated a very similar pattern (i.e., oscillatory response superimposed on exponential decay recovery) as exhibited for the lower stress pneumatic tests, indicating a highly communicative condition between this annular test area and the underlying test interval.
5.2 Well 299-W15-50
Drilling of OU ZP-1 well 299-W15-50 was initiated on January 4, 2005 and continued until reaching a final depth of 102.93 m bgs on February 9, 2005. The Lower Mud unit of the Ringold Formation was not encountered during drilling, which represents the bottom boundary of the unconfined aquifer at this location. Based on projections from neighboring well sites, however, the Lower Mud unit contact would be expected at a depth of 60 to 65 m bgs. Three test depth intervals were tested at the borehole location; Zone 1 = 71.02 - 74.04 m bgs; Zone 2 = 83.45 - 86.50 m bgs; and Zone 3 = 99.97 - 102.93 m bgs.
M.E. Byrnes September 13, 2005 Page 13
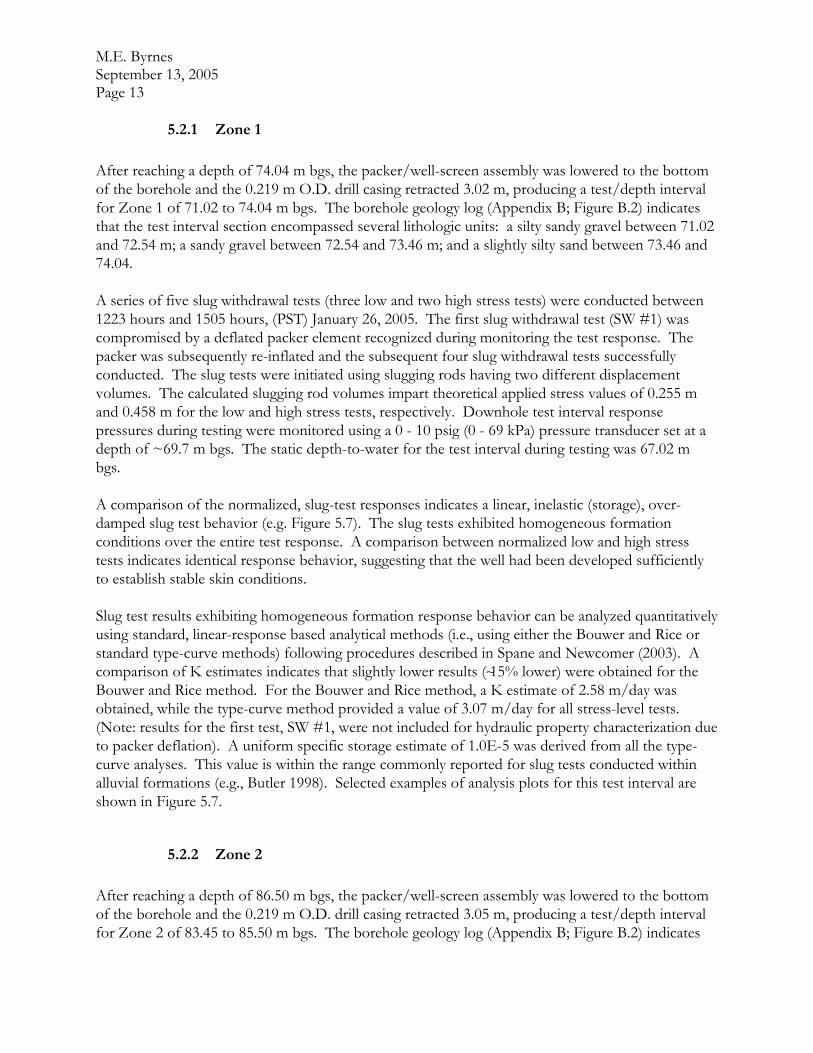
5.2.1 Zone 1 After reaching a depth of 74.04 m bgs, the packer/well-screen assembly was lowered to the bottom of the borehole and the 0.219 m O.D. drill casing retracted 3.02 m, producing a test/depth interval for Zone 1 of 71.02 to 74.04 m bgs. The borehole geology log (Appendix B; Figure B.2) indicates that the test interval section encompassed several lithologic units: a silty sandy gravel between 71.02 and 72.54 m; a sandy gravel between 72.54 and 73.46 m; and a slightly silty sand between 73.46 and 74.04. A series of five slug withdrawal tests (three low and two high stress tests) were conducted between 1223 hours and 1505 hours, (PST) January 26, 2005. The first slug withdrawal test (SW #1) was compromised by a deflated packer element recognized during monitoring the test response. The packer was subsequently re-inflated and the subsequent four slug withdrawal tests successfully conducted. The slug tests were initiated using slugging rods having two different displacement volumes. The calculated slugging rod volumes impart theoretical applied stress values of 0.255 m and 0.458 m for the low and high stress tests, respectively. Downhole test interval response pressures during testing were monitored using a 0 - 10 psig (0 - 69 kPa) pressure transducer set at a depth of ~69.7 m bgs. The static depth-to-water for the test interval during testing was 67.02 m bgs. A comparison of the normalized, slug-test responses indicates a linear, inelastic (storage), over-damped slug test behavior (e.g. Figure 5.7). The slug tests exhibited homogeneous formation conditions over the entire test response. A comparison between normalized low and high stress tests indicates identical response behavior, suggesting that the well had been developed sufficiently to establish stable skin conditions. Slug test results exhibiting homogeneous formation response behavior can be analyzed quantitatively using standard, linear-response based analytical methods (i.e., using either the Bouwer and Rice or standard type-curve methods) following procedures described in Spane and Newcomer (2003). A comparison of K estimates indicates that slightly lower results (∼15% lower) were obtained for the Bouwer and Rice method. For the Bouwer and Rice method, a K estimate of 2.58 m/day was obtained, while the type-curve method provided a value of 3.07 m/day for all stress-level tests. (Note: results for the first test, SW #1, were not included for hydraulic property characterization due to packer deflation). A uniform specific storage estimate of 1.0E-5 was derived from all the type-curve analyses. This value is within the range commonly reported for slug tests conducted within alluvial formations (e.g., Butler 1998). Selected examples of analysis plots for this test interval are shown in Figure 5.7.
5.2.2 Zone 2 After reaching a depth of 86.50 m bgs, the packer/well-screen assembly was lowered to the bottom of the borehole and the 0.219 m O.D. drill casing retracted 3.05 m, producing a test/depth interval for Zone 2 of 83.45 to 85.50 m bgs. The borehole geology log (Appendix B; Figure B.2) indicates
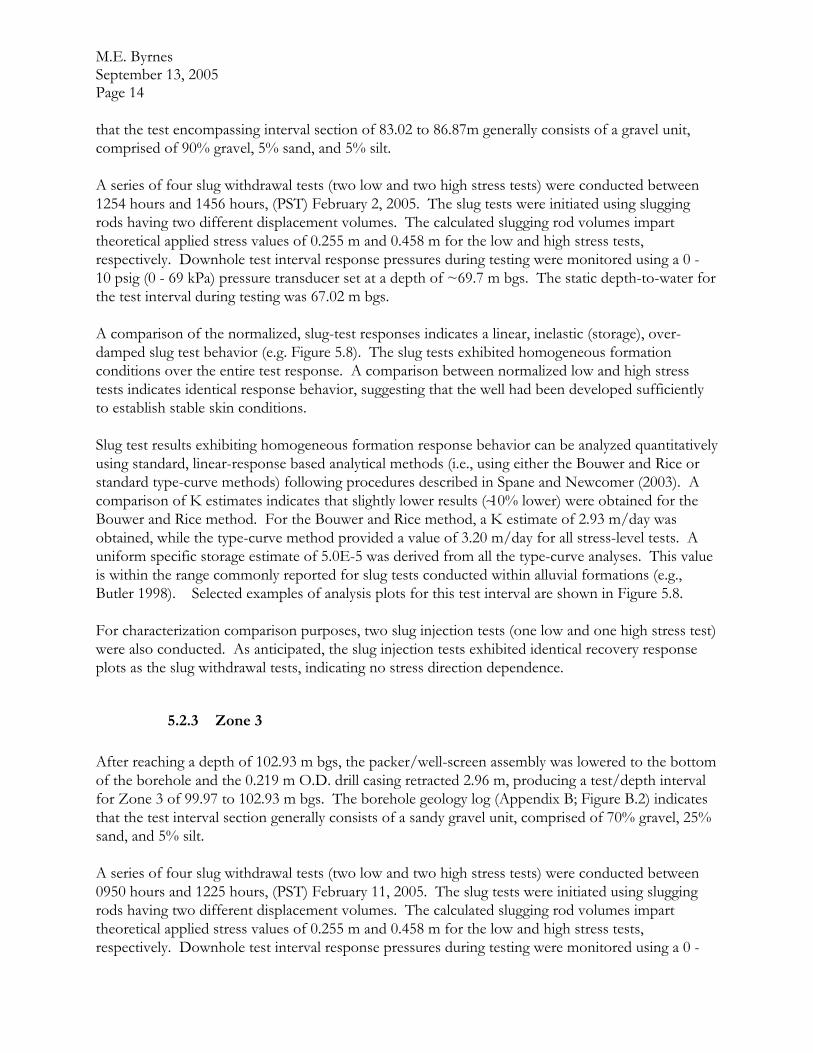
M.E. Byrnes September 13, 2005 Page 14 that the test encompassing interval section of 83.02 to 86.87m generally consists of a gravel unit, comprised of 90% gravel, 5% sand, and 5% silt. A series of four slug withdrawal tests (two low and two high stress tests) were conducted between 1254 hours and 1456 hours, (PST) February 2, 2005. The slug tests were initiated using slugging rods having two different displacement volumes. The calculated slugging rod volumes impart theoretical applied stress values of 0.255 m and 0.458 m for the low and high stress tests, respectively. Downhole test interval response pressures during testing were monitored using a 0 - 10 psig (0 - 69 kPa) pressure transducer set at a depth of ~69.7 m bgs. The static depth-to-water for the test interval during testing was 67.02 m bgs. A comparison of the normalized, slug-test responses indicates a linear, inelastic (storage), over-damped slug test behavior (e.g. Figure 5.8). The slug tests exhibited homogeneous formation conditions over the entire test response. A comparison between normalized low and high stress tests indicates identical response behavior, suggesting that the well had been developed sufficiently to establish stable skin conditions. Slug test results exhibiting homogeneous formation response behavior can be analyzed quantitatively using standard, linear-response based analytical methods (i.e., using either the Bouwer and Rice or standard type-curve methods) following procedures described in Spane and Newcomer (2003). A comparison of K estimates indicates that slightly lower results (∼10% lower) were obtained for the Bouwer and Rice method. For the Bouwer and Rice method, a K estimate of 2.93 m/day was obtained, while the type-curve method provided a value of 3.20 m/day for all stress-level tests. A uniform specific storage estimate of 5.0E-5 was derived from all the type-curve analyses. This value is within the range commonly reported for slug tests conducted within alluvial formations (e.g., Butler 1998). Selected examples of analysis plots for this test interval are shown in Figure 5.8. For characterization comparison purposes, two slug injection tests (one low and one high stress test) were also conducted. As anticipated, the slug injection tests exhibited identical recovery response plots as the slug withdrawal tests, indicating no stress direction dependence.
5.2.3 Zone 3 After reaching a depth of 102.93 m bgs, the packer/well-screen assembly was lowered to the bottom of the borehole and the 0.219 m O.D. drill casing retracted 2.96 m, producing a test/depth interval for Zone 3 of 99.97 to 102.93 m bgs. The borehole geology log (Appendix B; Figure B.2) indicates that the test interval section generally consists of a sandy gravel unit, comprised of 70% gravel, 25% sand, and 5% silt. A series of four slug withdrawal tests (two low and two high stress tests) were conducted between 0950 hours and 1225 hours, (PST) February 11, 2005. The slug tests were initiated using slugging rods having two different displacement volumes. The calculated slugging rod volumes impart theoretical applied stress values of 0.255 m and 0.458 m for the low and high stress tests, respectively. Downhole test interval response pressures during testing were monitored using a 0 -

M.E. Byrnes September 13, 2005 Page 15 10 psig (0 - 69 kPa) pressure transducer set at a depth of ~68.9 m bgs. The static depth-to-water for the test interval during testing was 66.30 m bgs. A comparison of the normalized, slug-test responses indicates a linear, inelastic (storage), over-damped slug test behavior (e.g. Figure 5.9). The slug tests exhibited homogeneous formation conditions over the entire test response. A comparison between normalized low and high stress tests indicates a slight stress dependency, suggesting a near well dynamic skin condition. Slug test results exhibiting homogeneous formation response behavior can be analyzed quantitatively using standard, linear-response based analytical methods (i.e., using either the Bouwer and Rice or standard type-curve methods) following procedures described in Spane and Newcomer (2003). A comparison of K estimates indicates a close correspondence between results obtained for the Bouwer and Rice and type-curve analytical methods. For the Bouwer and Rice method, estimates for K ranged between 8.07 and 9.63 m/day (average 8.77 m/day), while the type-curve method provided estimates between 8.06 and 9.50 m/day (average 8.66 m/day) for all stress-level tests. A uniform specific storage estimate of 1.0E-6 was derived from all the type-curve analyses. This value is within the range commonly reported for slug tests conducted within alluvial formations (e.g., Butler 1998). Selected examples of analysis plots for this test interval are shown in Figure 5.9. For characterization comparison purposes, two slug injection tests (one low and one high stress test) were also conducted. As anticipated, the slug injection tests exhibited similar recovery response behavior and K estimates within the range cited above for the slug withdrawal tests. The close similarity in test responses indicates no stress direction dependence for the test results.
5.3 Well 299-W18-16 Drilling of OU ZP-1 well 299-W19-48 was initiated on October 20, 2004 and continued until reaching a final depth of 106.07 m bgs on December 13, 2004. The Lower Mud unit of the Ringold Formation was not encountered during drilling, which represents the bottom boundary of the unconfined aquifer at this location. Based on projections from neighboring well sites, however, the Lower Mud unit contact would be expected at a depth of 60 to 65 m bgs. Initially three test/depth intervals were planned to be tested at the borehole location; however, borehole instability conditions and end-of-year deadline requirements for completing the well restricted hydrologic testing to only one upper-unconfined aquifer test zone. After reaching a depth of 97.99 m bgs, the packer/well-screen assembly was lowered to the bottom of the borehole on December 7, 2004, and the 0.245 m O.D. drill casing retracted 2.29 m, producing a theoretical test/depth interval for Zone 3 of 95.70 to 97.99 m bgs. The borehole geology log (Appendix B; Figure B.3) indicates that the test interval section consists of a silty, sandy gravel unit, comprised of 50% gravel, 20% sand, and 30% silt. Two slug withdrawal tests (one low and one high stress test) were conducted between 1228 hours and 1422 hours, (PST) December 7, 2004. The slug tests were initiated using slugging rods having

M.E. Byrnes September 13, 2005 Page 16 two different displacement volumes. The calculated slugging rod volumes impart theoretical applied stress values of 0.255 m and 0.458 m for the low and high stress tests, respectively. Downhole test interval response pressures during testing were monitored using a 0 - 10 psig (0 - 69 kPa) pressure transducer set at a depth of ~74.8 m bgs. The pre-test depth-to-water for the test interval during testing was 71.69 m bgs. This value, however, is not considered to be representative of “static” conditions, since a declining water-level trend of -0.0008333 m/min was observed during testing. Because of the extremely low recovery rate following initiation of the initial, low stress slug test (SW#1), the first slug test was aborted in favor of performing a high stress slug injection and withdrawal test sequence (SI #2 and SW #2). The two slug test sequence was initiated by rapidly submerging a 0.051 O.D. slugging rod (slug injection test) below the fluid column within the 4-in testing-string casing (I.D. = 0.102 m) used to set the packer/well-screen assembly. After approximately 40 minutes of recovery, the previously submerged slugging rod was removed from the fluid column initiating a slug withdrawal test. Because the recovery times for these tests were extremely slow, the consecutive slug injection/withdrawal tests were combined and analyzed compositely using a test history match approach. This analysis approach is particularly useful when analysis of individual tests using standard techniques (e.g., Bouwer and Rice, type-curve methods) may be uncertain (i.e., due to only small recovery percentage; e.g. ≤10%). The test history match approach relies on superimposing the predicted test responses of subsequent testing activities, which can be used to match the entire composite test sequence (test history match). Figure 5.10 shows the observed well response for the composite slug injection/slug withdrawal tests using the 0.051 m O.D. slugging rod. Also shown in the figure, is the predicted test history match for the two tests, which was produced by superimposing the two individual slug tests at their appropriate time of test initiation. A declining water-level trend of -0.0008333 m/min was observed over the test period and included in the test history match. As indicated, a hydraulic conductivity, K, of 0.04 m/day provides a good match to the observed test response sequence. To demonstrate the sensitivity of the analytical solution, Figure 5.11 shows the predicted history match using K values of 0.04, 0.2 and 1.0 m/day. As indicated, significant departures in the test history matches of the observed test responses are produced with higher K values. This suggests that the interval tested exhibits a K value of ~0.04 m/day, which is consistent with reported values for silts and silty fine-sand units (e.g., Freeze and Cherry, 1979). It is not completely certain whether the relatively low hydraulic conductivity indicated for this test interval is actually representative of in-situ formation conditions or an artifact of the drilling process or borehole instability (i.e., collapse of low permeability materials around the well screen during drill casing pullback/retraction to expose the depth interval for characterization. A number of observations, however, suggest that this test interval would likely exhibit low permeability conditions. These indications included:
• the high percentage of silt (i.e., 30%) as noted in the borehole geology log (Appendix B; Figure B.3), and
M.E. Byrnes September 13, 2005 Page 17
• previous low groundwater production and presence of abundant silt in the bailed water during the pre-test, interval development and hydrochemical sampling
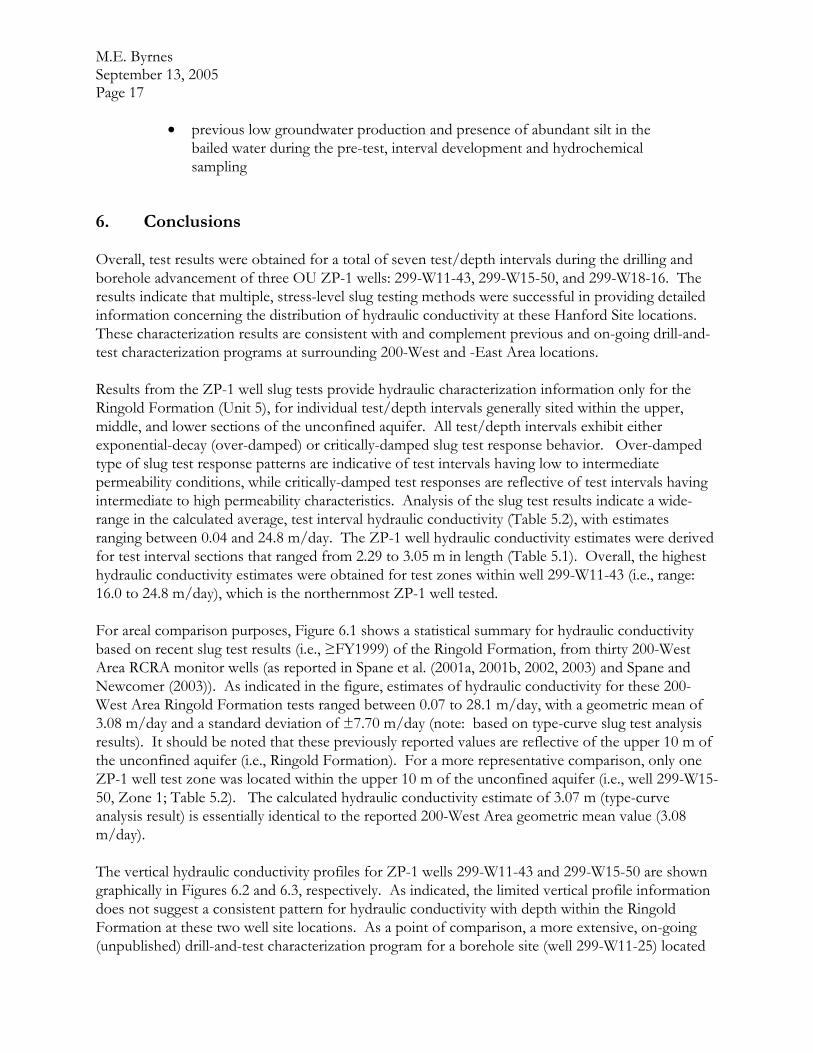
6. Conclusions Overall, test results were obtained for a total of seven test/depth intervals during the drilling and borehole advancement of three OU ZP-1 wells: 299-W11-43, 299-W15-50, and 299-W18-16. The results indicate that multiple, stress-level slug testing methods were successful in providing detailed information concerning the distribution of hydraulic conductivity at these Hanford Site locations. These characterization results are consistent with and complement previous and on-going drill-and-test characterization programs at surrounding 200-West and -East Area locations. Results from the ZP-1 well slug tests provide hydraulic characterization information only for the Ringold Formation (Unit 5), for individual test/depth intervals generally sited within the upper, middle, and lower sections of the unconfined aquifer. All test/depth intervals exhibit either exponential-decay (over-damped) or critically-damped slug test response behavior. Over-damped type of slug test response patterns are indicative of test intervals having low to intermediate permeability conditions, while critically-damped test responses are reflective of test intervals having intermediate to high permeability characteristics. Analysis of the slug test results indicate a wide-range in the calculated average, test interval hydraulic conductivity (Table 5.2), with estimates ranging between 0.04 and 24.8 m/day. The ZP-1 well hydraulic conductivity estimates were derived for test interval sections that ranged from 2.29 to 3.05 m in length (Table 5.1). Overall, the highest hydraulic conductivity estimates were obtained for test zones within well 299-W11-43 (i.e., range: 16.0 to 24.8 m/day), which is the northernmost ZP-1 well tested. For areal comparison purposes, Figure 6.1 shows a statistical summary for hydraulic conductivity based on recent slug test results (i.e., ≥FY1999) of the Ringold Formation, from thirty 200-West Area RCRA monitor wells (as reported in Spane et al. (2001a, 2001b, 2002, 2003) and Spane and Newcomer (2003)). As indicated in the figure, estimates of hydraulic conductivity for these 200-West Area Ringold Formation tests ranged between 0.07 to 28.1 m/day, with a geometric mean of 3.08 m/day and a standard deviation of ±7.70 m/day (note: based on type-curve slug test analysis results). It should be noted that these previously reported values are reflective of the upper 10 m of the unconfined aquifer (i.e., Ringold Formation). For a more representative comparison, only one ZP-1 well test zone was located within the upper 10 m of the unconfined aquifer (i.e., well 299-W15-50, Zone 1; Table 5.2). The calculated hydraulic conductivity estimate of 3.07 m (type-curve analysis result) is essentially identical to the reported 200-West Area geometric mean value (3.08 m/day). The vertical hydraulic conductivity profiles for ZP-1 wells 299-W11-43 and 299-W15-50 are shown graphically in Figures 6.2 and 6.3, respectively. As indicated, the limited vertical profile information does not suggest a consistent pattern for hydraulic conductivity with depth within the Ringold Formation at these two well site locations. As a point of comparison, a more extensive, on-going (unpublished) drill-and-test characterization program for a borehole site (well 299-W11-25) located

M.E. Byrnes September 13, 2005 Page 18 within the WMA T area (located generally east to northeast of the ZP-1 test well sites), however, does exhibit a slightly increasing permeability with depth pattern, which may also be suggested at the well 299-W15-50 location. It should be noted that hydraulic property values reported in this letter report are determined from the slug test characterization that are believed to be representative of conditions in proximity to the individual well site locations. It is difficult to assess the representative scale or radius of investigation that the slug test characterization results represent. However based on theoretical relationships presented in Guyonnet et al. (1993), slug test results are likely more representative of formation conditions within ~3 m of test site. This scale-of-investigation estimate, however, is highly uncertain and provided only for qualitative discussion purposes. Previous Hanford Site hydraulic property comparisons of slug tests with larger scale-of-investigation pumping test results (reported in Spane et al. 2001a, 2001b, 2002, 2003) and Spane and Newcomer (2003) have indicated a fairly close agreement (i.e., within a factor of 2). This suggests that a larger scale may be representative for the slug test results. 7. References
Bouwer H and RC Rice. 1976. “A slug test for determining hydraulic conductivity of unconfined aquifers with completely or partially penetrating wells.” Water Resources Research 12(3):423-428.
Butler JJ, Jr. 1998. The design, performance, and analysis of slug tests. Lewis Publishers, CRC Press, Boca Raton, Florida. .
Butler, JJ, Jr., GC Bohling, ZH Hyder, and CD McElwee. 1994. “The use of slug tests to describe vertical variations in hydraulic conductivity.” Journal of Hydrology 156:137-162.
Butler, JJ, Jr. and EJ Garnett. 2000. Simple procedures for analysis of slug tests in formations of high hydraulic conductivity using spreadsheet and Scientific Graphics Software. Open-file Report 2000-40, Kansas Geological Survey, Lawrence, Kansas.
Butler JJ, Jr., EJ Garnett, and JM Healey. 2003. “Analysis of slug tests in formations of high hydraulic conductivity.” Ground Water 41(5):620-630.
Freeze, RA and JA Cherry. 1979. Groundwater. Prentice-Hall, Inc., Englewood Cliffs, New Jersey.
Guyonnet D, S Mishra, and J McCord. 1993. “Evaluating the volume of porous medium investigated during slug tests.” Ground Water 31(4):627-633.
McElwee CD and MA Zenner. 1998. “A nonlinear model for analysis of slug-test data.” Water Resources Research 34(1):55-66.
Spane FA, Jr.. 1996. “Applicability of slug interference tests for hydraulic characterization of unconfined aquifer: (1) analytical assessment.” Ground Water 34(1):66-74.

M.E. Byrnes September 13, 2005 Page 19 Spane, FA. 2003. Slug Test Characterization Results for Multi- Test/Depth Intervals Conducted During the Drilling of WMA-C Well 299-E27-22 (C4124). Letter report to Jane Borghese (Fluor Hanford, Inc.), October 8, 2003, 28p. Spane, FA. 2005. Slug Test Characterization Results for Multi-Test/Depth Intervals Conducted During the Drilling of WMA-BX-BY Well 299-E33-49; letter report to Jane Borghese (Fluor-Hanford, ORP) January 10, 2005.
Spane, F.A.. Jr. and D.R. Newcomer. 2003. “Results of detailed hydrologic characterization tests – FY 2003.” PNNL-14804. Pacific Northwest National Laboratory, Richland, Washington
Spane FA, Jr., PD Thorne, and LC Swanson. 1996. “Applicability of slug interference tests for hydraulic characterization of unconfined aquifer: (2) Field test examples.” Ground Water 34(5):925-933.
Spane, F.A.. Jr., P.D. Thorne, and D.R. Newcomer. 2001a. “Results of detailed hydrologic characterization tests – FY 1999.” PNNL-13378. Pacific Northwest National Laboratory, Richland, Washington
Spane, F.A.. Jr., P.D. Thorne, and D.R. Newcomer. 2001b. “Results of detailed hydrologic characterization tests – FY 2000.” PNNL-13514. Pacific Northwest National Laboratory, Richland, Washington
Spane, F.A.. Jr., P.D. Thorne, and D.R. Newcomer. 2002. “Results of detailed hydrologic characterization tests – FY 2001.” PNNL-14113. Pacific Northwest National Laboratory, Richland, Washington
Spane, F.A.. Jr., P.D. Thorne, and D.R. Newcomer. 2003. “Results of detailed hydrologic characterization tests – FY 2002.” PNNL-14186. Pacific Northwest National Laboratory, Richland, Washington
Spane FA, Jr., JJ Butler, MD White, and TJ Gilmore. 2003. “Improving pulse/slug interference tests for contaminated site hydraulic property characterization.” SERDP Fiscal Year 2004 Research Proposal, submitted February 25, 2003.
Springer RK and LW Gelhar. 1991. “Characterization of large-scale aquifer heterogeneity in glacial outwash by analysis of slug tests with oscillatory response, Cape Cod, Massachusetts.” In U.S. Geological Survey Water Resources Investigations. Report 91-4034:36-40. Zubruchen, BR, VA Zlotnik, and JJ Butler, Jr. 2002. “Dynamic interpretation of slug tests in highly permeable aquifers.” Water Resources Research, 38(3):10.1029/2001WR000354

M.E. Byrnes September 13, 2005 Page 20 Table 1. Slug-Test Characteristics for Selected Test/Depth Intervals at Operable Unit ZP-1 Test
Wells 299-W11-43, 299-W15-50, and 299-W18-16
Test Parameters
Test Well
Test Zone
Test Date
Slug Tests
#
Depth to Water, m bgs
Depth/Test Interval ,
m bgs
Diagnostic Slug Test Response
Model
Hydrogeologic Unit Tested (a)
Zone 1
6/2/05
4
81.56
87.78 - 90.83
(3.05)
Critically-Damped(b) Ringold
Formation (Unit 5)
Zone 2
6/10/05
3
81.53
106.28 - 109.33
(3.05)
Critically-Damped Ringold
Formation (Unit 5)
299-W11-43
Zone 3
6/22/05
4
81.53
133.50 - 136.55
(3.05)
Critically-Damped Ringold
Formation (Unit 5)
Zone 1
1/26/05
5
67.02
71.02 - 74.04
(3.02)
Exponential Decay
(over-damped)
Ringold Formation
(Unit 5)
Zone 2
2/2/05
6
66.67
83.45 - 86.50
(3.05)
Exponential Decay
(over-damped)
Ringold Formation
(Unit 5)
299-W15-50
Zone 3
2/11/05
6
66.30
99.97 - 102.93
(2.96)
Exponential Decay
(over-damped)
Ringold Formation
(Unit 5)
299-W18-16
Zone 1
12/7/04
2
~71.69
95.70 - 97.99
(2.29)
Exponential Decay
(over-damped)
Ringold Formation (Unit 5)
Note: For all test wells, rc = 0.051 meter; rw ranged between 0.111 and 0.149 meters. The ~ symbol used in combination with depth-to-water measurements indicates that the value is not considered to reflect static conditions at the time of testing
(a) Unit number in parentheses indicates the relevant groundwater-flow model layer, as described in Thorne, et al., 1993..
(b) Test data lost due to datalogger malfunction; assigned diagnostic response characteristics based on field test observations

M.E. Byrnes September 13, 2005 Page 21 Table 5.2 Slug-Test Analysis Results
Bouwer and Rice Analysis Method
Standard or High-K(b)/ Type-Curve Analysis
Method
Test History Matching
Analysis Method(c)
Test Well
Test Zone
Horizontal Hydraulic
Conductivity, Kh,(a) (m/day)
Horizontal Hydraulic
Conductivity, Kh,(a) (m/day)
Specific Storage, Ss (m-1)
Horizontal Hydraulic Conductivity, Kh,(a) (m/day)
Zone 1
NA
NA
NA
NA
Zone 2
NA
24.1 - 25.5
(24.8)
NA
NA
299-W11-43
Zone 3
NA
14.3 - 17.7
(16.0)
NA
NA
Zone 1
2.58
3.07
1.0E-5
NA
Zone 2
2.93
3.20
5.0E-5
NA
299-W15-50
Zone 3
8.07 - 9.63
(8.77)
8.06 - 9.50
(8.66)
1.0E-6
NA
299-W18-16
Zone 1
NA
NA
NA
0.04
Number in parentheses is the average value for all tests. NA = method is either not applicable or not applied (a) Assumed to be uniform within the well-screen test section. For tests exhibiting a heterogeneous formation response,
only outer zone analysis results are considered representative of in-situ formation conditions (b) Standard analytical methods are not applicable for tests exhibiting critically-damped response characteristics.
Results based on High-K analysis method presented in Butler and Garnett (2000) (c) Because of test interval, low-permeability conditions, insufficient test response recovery (i.e., ≤10% ) was collected for
these tests to permit use of standard analytical methods. For these tests, a test history matching/type-curve analysis approach was applied
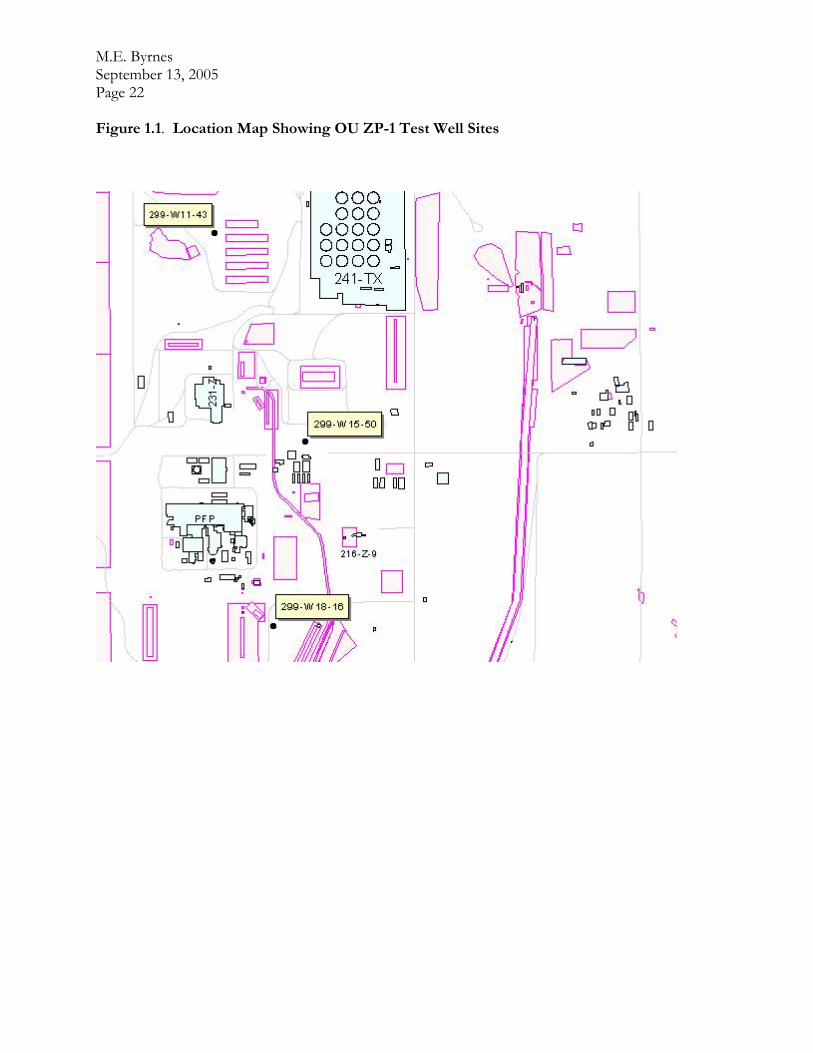
M.E. Byrnes September 13, 2005 Page 22 Figure 1.1. Location Map Showing OU ZP-1 Test Well Sites

M.E. Byrnes September 13, 2005 Page 23 Figure 3.1. General Slug Test Configuration Using Slugging Rods

M.E. Byrnes September 13, 2005 Page 24 Figure 3.2. General Pneumatic Slug Test System Using Dual-Wall Drill Casing System
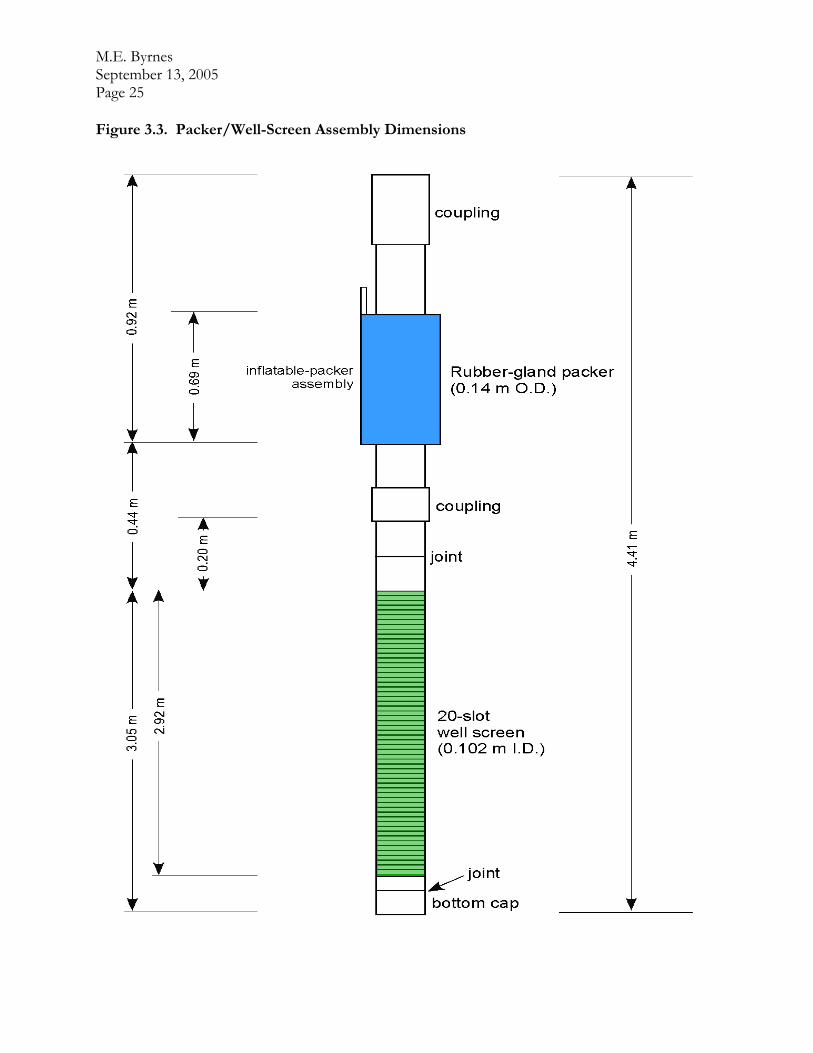
M.E. Byrnes September 13, 2005 Page 25 Figure 3.3. Packer/Well-Screen Assembly Dimensions

M.E. Byrnes September 13, 2005 Page 26
Figure 4.1. Diagnostic Slug Test Response (taken from Spane et al. (2003)
-1.0
-0.5
0.0
0.5
1.0
0 5 10 15
Time, sec
Nor
mal
ized
Res
pons
e, H
D
Over-Damped
Critically Damped
Under-DampedStatic Level
Test Parameters
m = 10.5 m b = 25 m rc = 0.0508 m rw = 0.0508 m
Diagnostic Slug Test Response
Figure 4.2 Over-Damped Slug Test Response as a Function of Test Interval
Hydraulic Conductivity
0.00
0.10
0.20
0.30
0.40
0.50
0.60
0.70
0.80
0.90
1.00
1 10 100 1000 10000
Time, sec
Dim
ensi
onle
ss H
ead,
HD
K = 1 m/d
K = 5 m/d
K = 25 m/d
Test Parameters
rc = 0.0508 m rw = 0.1143 m L = 3.048 m Ss = 1.0E-5 m-1
KD = 1.0
Predicted Over-Damped Slug Test Response
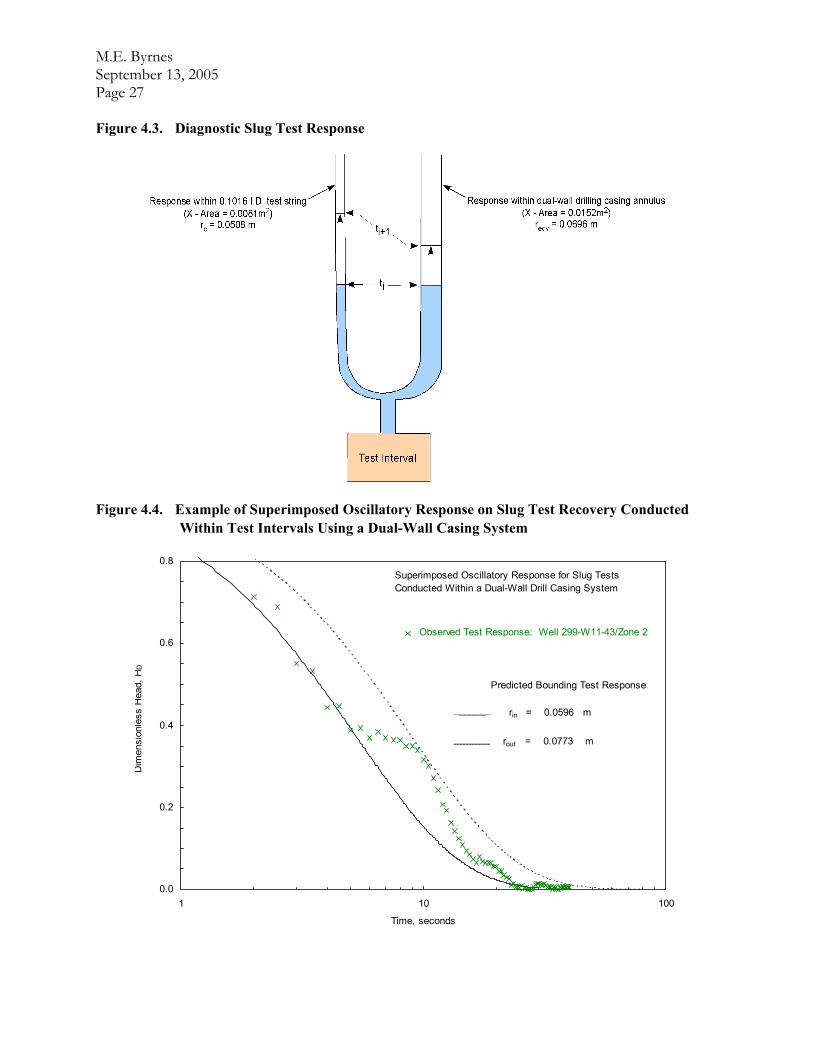
M.E. Byrnes September 13, 2005 Page 27 Figure 4.3. Diagnostic Slug Test Response
Figure 4.4. Example of Superimposed Oscillatory Response on Slug Test Recovery Conducted Within Test Intervals Using a Dual-Wall Casing System
0.0
0.2
0.4
0.6
0.8
1 10 100
Time, seconds
Dim
ensi
onle
ss H
ead,
HD
Observed Test Response: Well 299-W11-43/Zone 2
Predicted Bounding Test Response
rin = 0.0596 m
rout = 0.0773 m
Superimposed Oscillatory Response for Slug Tests Conducted Within a Dual-Wall Drill Casing System
_______
------------

M.E. Byrnes September 13, 2005 Page 28 Figure 5.1 Diagnostic Analysis of Slug Test Responses Well 299-W11-43: Test Interval
Zone 2
0.01
0.10
1.00
10.00
0 5 10 15 20 25 30
Time, sec
Nor
mal
ized
Wel
l Res
pons
e, H
D
SW #1: Ho = 0.5 m
SW #2: Ho = 0.7 m
SW #3: Ho = 0.9 m
Well 299-W11-43Test Interval: Zone 2Critically-Damped Slug Test Responses
Concave Downward Pattern Indicative of Critically-Damped Response Behavior
Figure 5.2 Selected High-K Test Analysis Plot for Well 299-W11-43: Test Interval Zone 2
0.00
0.10
0.20
0.30
0.40
0.50
0.60
0.70
0.80
0.90
1.00
0.0 0.1 1.0 10.0
Time, min
Dim
ensi
onle
ss H
ead
and
Hea
d D
eriv
ativ
e
Test Data
Data Derivative
Type Curve
Type-Curve Derivative
Analysis Parameters
K = 25.5 m/d KD = 1.0 rc = 0.0508 m rav g = 0.0685 m rw = 0.1143 m b ≈ 60.0 m L = 3.05 m Ho = 0.4821 m (projected)
Well 299-W11-43Test Interval: Zone 2Test: SW #1
High-K Formation
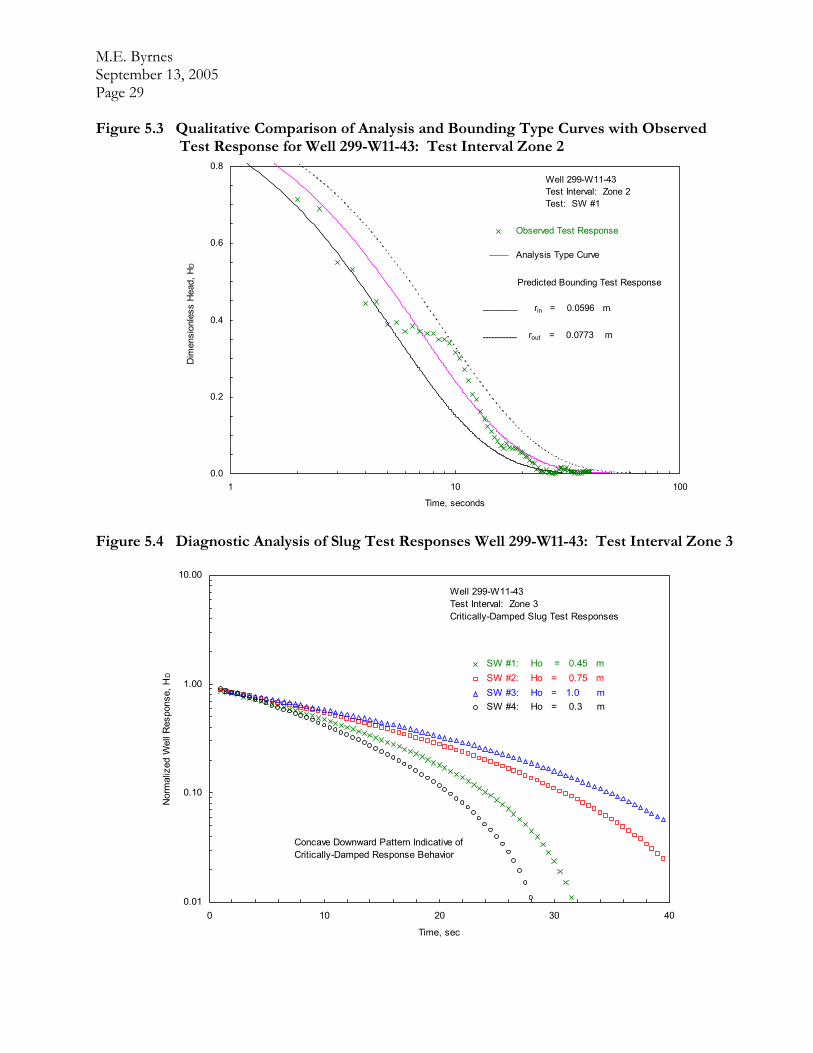
M.E. Byrnes September 13, 2005 Page 29 Figure 5.3 Qualitative Comparison of Analysis and Bounding Type Curves with Observed
Test Response for Well 299-W11-43: Test Interval Zone 2
0.0
0.2
0.4
0.6
0.8
1 10
Time, seconds
Dim
ensi
onle
ss H
ead,
HD
100
Observed Test Response
Analysis Type Curve
Predicted Bounding Test Response
rin = 0.0596 m
rout = 0.0773 m
Well 299-W11-43Test Interval: Zone 2Test: SW #1
_______
------------
Figure 5.4 Diagnostic Analysis of Slug Test Responses Well 299-W11-43: Test Interval Zone 3
0.01
0.10
1.00
10.00
0 10 20 30 4
Time, sec
Nor
mal
ized
Wel
l Res
pons
e, H
D
0
SW #1: Ho = 0.45 m SW #2: Ho = 0.75 m SW #3: Ho = 1.0 m SW #4: Ho = 0.3 m
Well 299-W11-43Test Interval: Zone 3Critically-Damped Slug Test Responses
Concave Downward Pattern Indicative of Critically-Damped Response Behavior

M.E. Byrnes September 13, 2005 Page 30 Figure 5.5 Selected High-K Test Analysis Plot for Well 299-W11-43: Test Interval Zone 3
0.00
0.10
0.20
0.30
0.40
0.50
0.60
0.70
0.80
0.90
1.00
0.01 0.10 1.00 10.00
Time, min
Dim
ensi
onle
ss H
ead
and
Hea
d D
eriv
ativ
e
Test Data
Data Derivative
Type Curve
Type-Curve Derivative
Analysis Parameters
K = 17.7 m/d KD = 1.0 rc = 0.0508 m rav g = 0.0685 m rw = 0.1143 m b ≈ 60.0 m L = 3.05 m Ho = 0.2741 m (projected)
Well 299-W11-43Test Interval: Zone 3Test: SW #4
High-K Formation
Figure 5.6 Qualitative Comparison of Analysis and Bounding Type Curves with Observed Test Response for Well 299-W11-43: Test Interval Zone 3
0.0
0.2
0.4
0.6
0.8
1.0
1 10 100 1000
Time, seconds
Dim
ensi
onle
ss H
ead,
HD
Observed Test Response
Analysis Type Curve
Predicted Bounding Test Response
rin = 0.0596 m
rout = 0.0773 m
Well 299-W11-43Test Interval: Zone 3Test: SW #4
_______
------------

M.E. Byrnes September 13, 2005 Page 31 Figure 5.7 Selected Slug Test Analysis Plots for Well 299-W15-50: Test Interval Zone 1
(Bouwer and Rice Method [top} and Type-Curve Method {bottom})
0.01
0.10
1.00
10.00
0.0 0.5 1.0 1.5
Time, min
2.0
Nor
mal
ized
Pre
ssur
e R
espo
nse
Test: SW #4
Well 299-W15-50Test Interval: Zone 1
Analysis Parameters K = 2.58 m/d KD = 1.0 b ≈ 60.0 m L = 3.02 m Yo = 0.458 m rc = 0.0508 m rw = 0.1095 m
Linear RegressionData Analyzed: 0.090 - 2.20 min
0.00
0.10
0.20
0.30
0.40
0.50
0.60
0.70
0.80
0.90
1.00
0.0 0.1 1.0 10.0 100.0
Time, min
Dim
ensi
onle
ss H
ead
and
Hea
d D
eriv
ativ
e Test Data
Data Derivative
Type Curve
Type-Curve Derivative
Analysis Parameters
K = 3.07 m/d KD = 1.0 SS = 0.00001 m-1
rc = 0.0508 m b ≈ 60.0 m L = 3.02 m Ho = 0.4126 m (projected)
Well 299-W15-50Test Interval: Zone 1Test: SW #4
Homogeneous Formation

M.E. Byrnes September 13, 2005 Page 32 Figure 5.8 Selected Slug Test Analysis Plots for Well 299-W15-50: Test Interval Zone 2
(Bouwer and Rice Method [top} and Type-Curve Method {bottom})
0.01
0.10
1.00
10.00
0.0 0.5 1.0 1.5
Time, min
Nor
mal
ized
Pre
ssur
e R
espo
nse
Test: SW #2
Well 299-W15-50Test Interval: Zone 2
Analysis Parameters K = 2.93 m/d KD = 1.0 b ≈ 60.0 m L = 3.05 m Yo = 0.255 m rc = 0.0508 m rw = 0.1095 m
Linear RegressionData Analyzed: 0.060 - 1.50 min
0.00
0.10
0.20
0.30
0.40
0.50
0.60
0.70
0.80
0.90
1.00
0.0 0.1 1.0 10.0 100.0
Time, min
Dim
ensi
onle
ss H
ead
and
Hea
d D
eriv
ativ
e Test Data
Data Derivative
Type Curve
Type-Curve Derivative
Analysis Parameters
K = 3.20 m/d KD = 1.0 SS = 0.00005 m-1
rc = 0.0508 m b ≈ 60.0 m L = 3.05 m Ho = 0.2434 m (projected)
Well 299-W15-50Test Interval: Zone 2Test: SW #2
Homogeneous Formation

M.E. Byrnes September 13, 2005 Page 33 Figure 5.9 Selected Slug Test Analysis Plots for Well 299-W15-50: Test Interval Zone 3
(Bouwer and Rice Method [top} and Type-Curve Method {bottom})
0.01
0.10
1.00
10.00
0.0 0.1 0.2 0.3 0.4 0.5 0.6 0
Time, min
.7
Nor
mal
ized
Pre
ssur
e R
espo
nse
Test: SW #3
Well 299-W15-50Test Interval: Zone 3
Analysis Parameters K = 8.60 m/d KD = 1.0 b ≈ 60.0 m L = 2.96 m Yo = 0.455 m rc = 0.0508 m rw = 0.1095 m
Linear RegressionData Analyzed: 0.060 - 0.700 min
0.00
0.10
0.20
0.30
0.40
0.50
0.60
0.70
0.80
0.90
1.00
0.0 0.1 1.0 10.0 100.0
Time, min
Dim
ensi
onle
ss H
ead
and
Hea
d D
eriv
ativ
e Test Data
Data Derivative
Type Curve
Type-Curve Derivative
Analysis Parameters
K = 8.42 m/d KD = 1.0 SS = 0.000001 m-1
rc = 0.0508 m b ≈ 60.0 m L = 2.96 m Ho = 0.467 m (projected)
Well 299-W15-50Test Interval: Zone 3Test: SW #3
Homogeneous Formation

M.E. Byrnes September 13, 2005 Page 34 Figure 5.10 Slug Test SI #2 and SW #2 Response and Test History Match for Well 299-W18-16
2.5
3.5
4.5
805 835 865
Time, min (to = 000 hrs; 12/7/2004)
Wel
l Res
pons
e, m
eter
s
Test: SI #2 & SW #2
Pre-Test Trend
History Match
Analysis Parameters K = 0.04 m/d L = 2.29 m rc = 0.0508 m Ho = 0.490 m
Well 299-W18-16
-0.0008333 m/min______
SW #2 Initiated(slugging rod removed)
SI #2 Initiated (slugging rod immersed)
Figure 5.11 Slug Tests SI #1 and SW #1 Response and Test History Match for Well 299-W18-16: Sensitivity to Varying K Values (0.04, 0.2, 1.0 m/day)
2.5
3.0
3.5
4.0
4.5
805 835 865
Time, min (to = 000 hrs; 12/7/2004)
Wel
l Res
pons
e, m
eter
s
Tests: SI #2 & SW #2
Test History SensitivityAnalysis Match
Analysis Parameters K = 0.04 m/d
K = 0.20 m/d
K = 1.0 m/d
Well 299-W18-16
_______
------------
___ ___

M.E. Byrnes September 13, 2005 Page 35 Figure 6.1 Hydraulic Conductivity Histogram for Recently Tested 200-West Area Wells
0.0
5.0
10.0
15.0
20.0
25.0
0.01 0.10 1.00 10.00 100.00 1000.00
Hydraulic Conductivity, m/day
Freq
uenc
y
WMA S-SX, T, TX-TY WellsSlug Test Results
Hydraulic Conductivity Histogram
Geometric Mean: 3.08 m/day Standard Deviation: 7.70 m/day Range: 0.07 to 28.1 m/day n = 30 wells
Normal Distribution Curve
Figure 6.2 Hydraulic Conductivity Profile for ZP-1 Well 299-W11-43 Test/Depth Intervals
70.0
90.0
110.0
130.0
150.00.0 10.0 20.0 30.0 40.0
Hydraulic Conductivity, m/day
Dep
th, m
eter
s be
low
gro
und
surfa
ce
Top of Lower Mud (estimated)
Current Water TableWell 299-W11-43Slug Test Results
Hydraulic Conductivity Profile
Zone 1(note: Zone 1 is an assigned value and not based on test analysis results)
Zone 2
Zone 3

M.E. Byrnes September 13, 2005 Page 36 Figure 6.3. Hydraulic Conductivity Profile for ZP-1 Well 299-W15-50 Test/Depth Intervals
60.0
70.0
80.0
90.0
100.0
110.0
120.0
130.00.0 5.0 10.0 15.0 20.0
Hydraulic Conductivity, m/day
Dep
th, m
eter
s be
low
gro
und
surfa
ce
Top of Lower Mud (estimated)
Current Water Table Well 299-W15-50Slug Test Results
Hydraulic Conductivity ProfileZone 1
Zone 2
Zone 3

M.E. Byrnes September 13, 2005 Page 37
APPENDIX A. MISCELLANEOUS TEST EQUIPMENT PICTURES

M.E. Byrnes September 13, 2005 Page 38
Figure A.1 Inflatable Packer and Well-Screen Assembly Shown on Pipe Rack
Figure A.2 Closer View of Packer/Well-Screen
Inflatable Packer
Test Well Screen

M.E. Byrnes September 13, 2005 Page 39 Figure A.3 Close-up View of Test Well Screen and Bottom End-Cap

M.E. Byrnes September 13, 2005 Page 40
APPENDIX B. SELECTED BOREHOLE LOGS
Figure B.1 Well 299-W11-43
Figure B.2 Well 299-W15-50
Figure B.3 Well 299-W18-16

M.E. Byrnes September 13, 2005 Page 41
Figure B.1 Selected Borehole Log for Well 299-W11-43

M.E. Byrnes September 13, 2005 Page 42
Figure B.1 Selected Borehole Log for Well 299-W11-43, Cont.’

M.E. Byrnes September 13, 2005 Page 43 Figure B.1 Selected Borehole Log for Well 299-W11-43, Cont.’
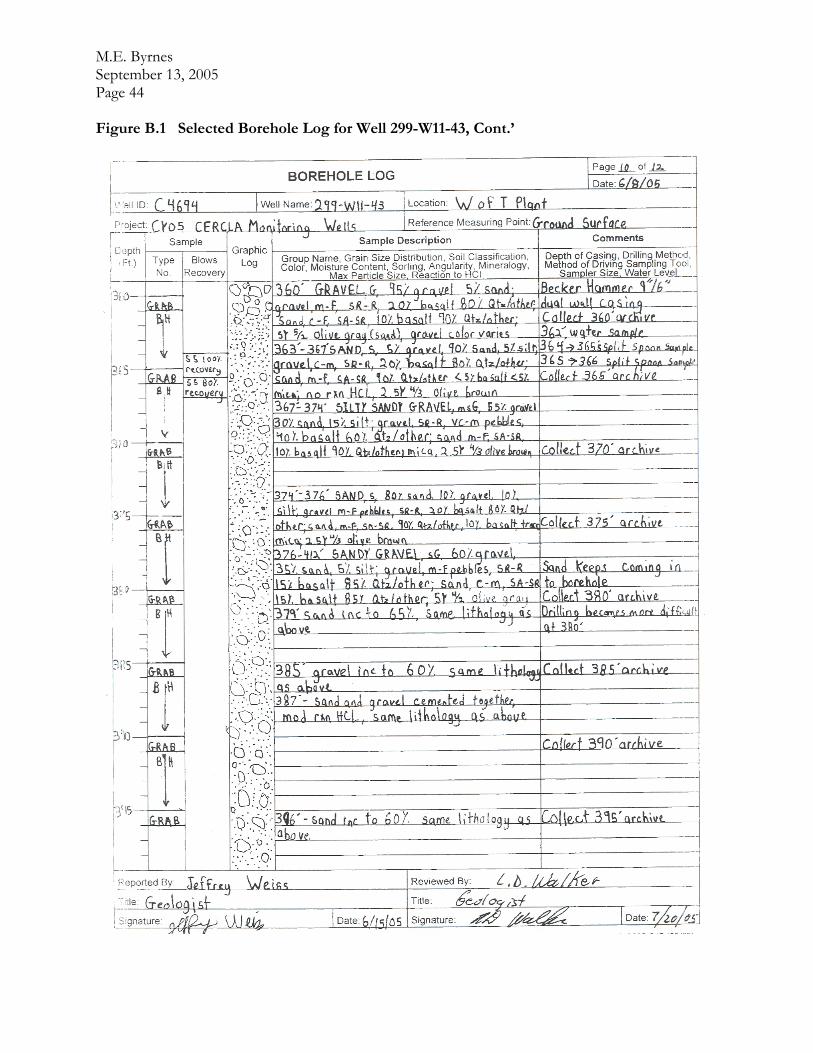
M.E. Byrnes September 13, 2005 Page 44 Figure B.1 Selected Borehole Log for Well 299-W11-43, Cont.’
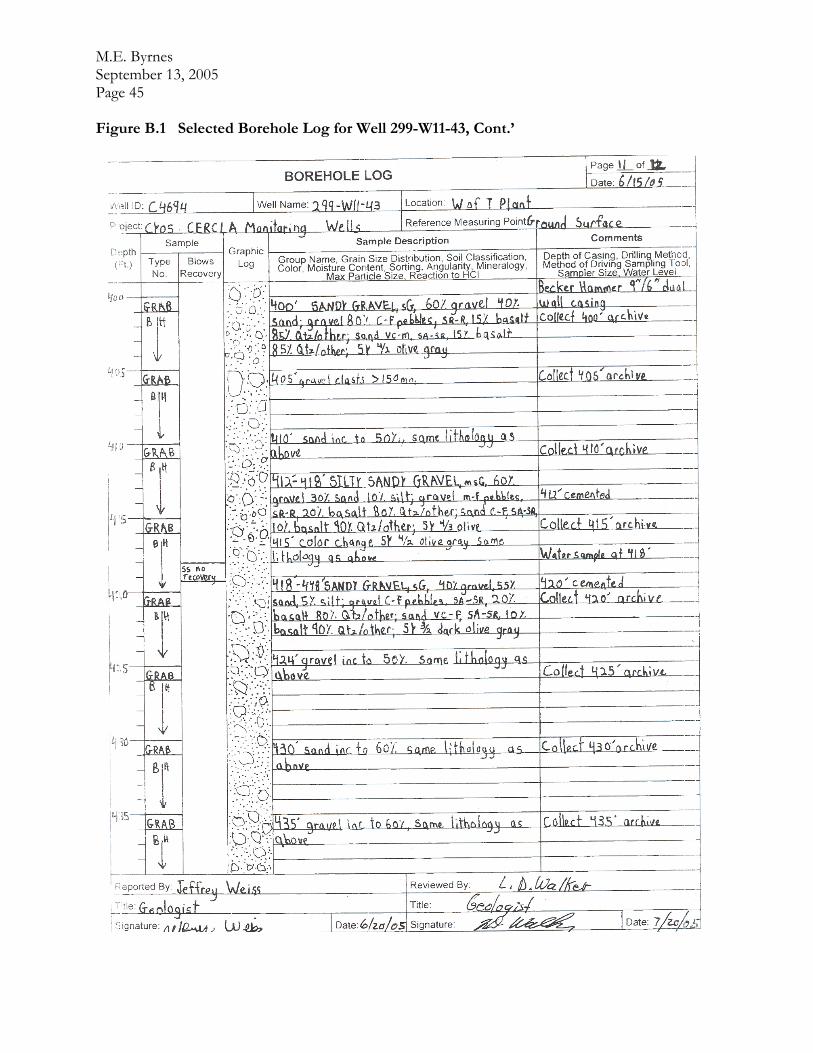
M.E. Byrnes September 13, 2005 Page 45 Figure B.1 Selected Borehole Log for Well 299-W11-43, Cont.’

M.E. Byrnes September 13, 2005 Page 46 Figure B.1 Selected Borehole Log for Well 299-W11-43, Cont.’
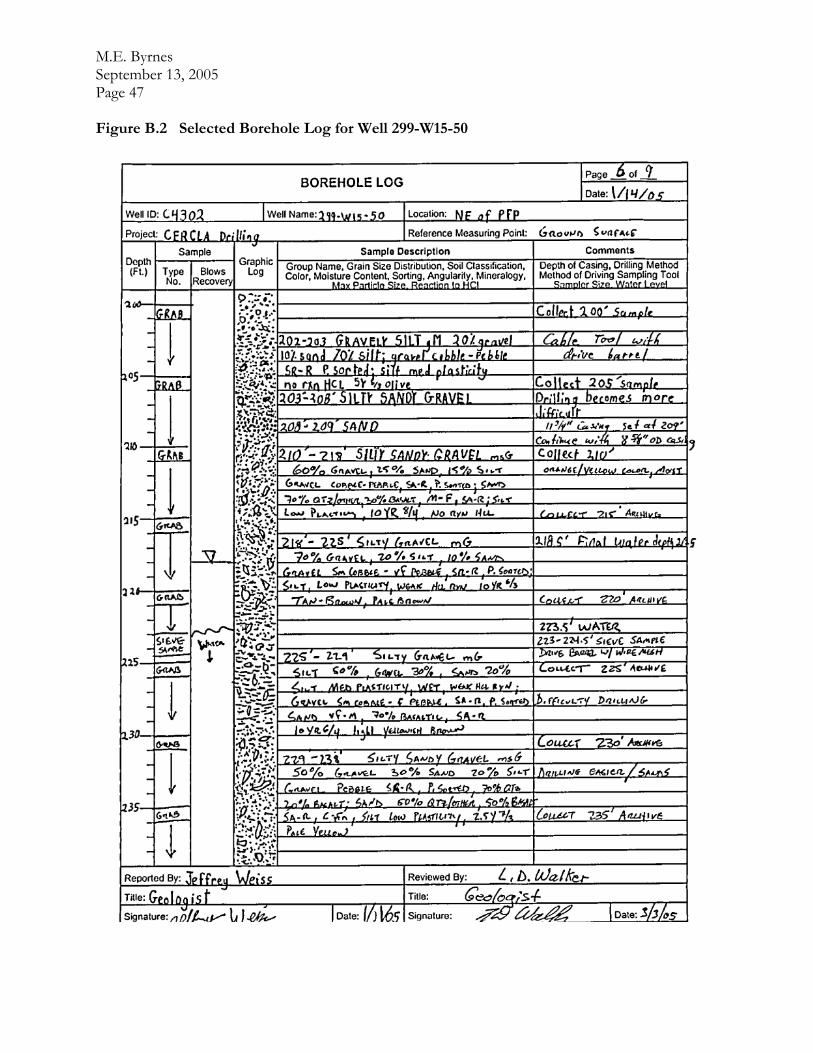
M.E. Byrnes September 13, 2005 Page 47 Figure B.2 Selected Borehole Log for Well 299-W15-50

M.E. Byrnes September 13, 2005 Page 48
Figure B.2 Selected Borehole Log for Well 299-W15-50, Cont’.

M.E. Byrnes September 13, 2005 Page 49 Figure B.2 Selected Borehole Log for Well 299-W15-50, Cont’.

M.E. Byrnes September 13, 2005 Page 50 Figure B.2 Selected Borehole Log for Well 299-W15-50, Cont’.

M.E. Byrnes September 13, 2005 Page 51 Figure B.3 Selected Borehole Log for Well 299-W18-16

M.E. Byrnes September 13, 2005 Page 52 Figure B.3 Selected Borehole Log for Well 299-W18-16Cont’.