Embed Size (px)
Citation preview
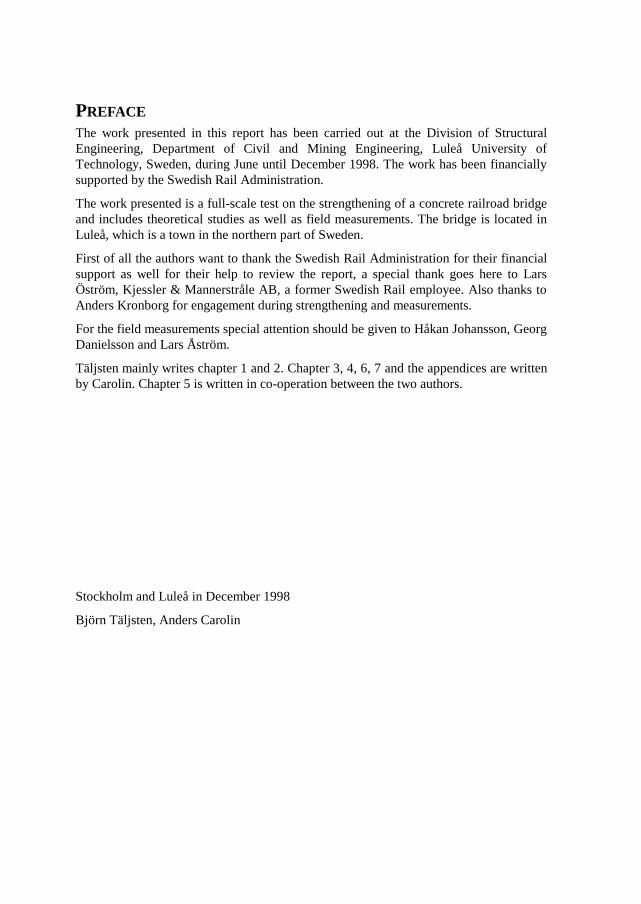
STRENGTHENING OF A CONCRETE
RAILWAY BRIDGE IN LULEÅ WITH
CARBON FIBRE REINFORCED
POLYMERS – CFRP
-Load bearing capacity before and afterstrengthening
BJÖRN TÄLJSTEN ANDERS CAROLIN
Department of Civil and Mining EngineeringDivision of Structural Engineering
PREFACEThe work presented in this report has been carried out at the Division of StructuralEngineering, Department of Civil and Mining Engineering, Luleå University ofTechnology, Sweden, during June until December 1998. The work has been financiallysupported by the Swedish Rail Administration.
The work presented is a full-scale test on the strengthening of a concrete railroad bridgeand includes theoretical studies as well as field measurements. The bridge is located inLuleå, which is a town in the northern part of Sweden.
First of all the authors want to thank the Swedish Rail Administration for their financialsupport as well for their help to review the report, a special thank goes here to LarsÖström, Kjessler & Mannerstråle AB, a former Swedish Rail employee. Also thanks toAnders Kronborg for engagement during strengthening and measurements.
For the field measurements special attention should be given to Håkan Johansson, GeorgDanielsson and Lars Åström.
Täljsten mainly writes chapter 1 and 2. Chapter 3, 4, 6, 7 and the appendices are writtenby Carolin. Chapter 5 is written in co-operation between the two authors.
Stockholm and Luleå in December 1998
Björn Täljsten, Anders Carolin
Summary
SUMMARYThe railroad between Gällivare and Luleå in the northern part of Sweden is calledMalmbanan. Heavy loads of iron ore are transported on this railroad daily. During longtime the weight of the load has been approximately 5 000 tons per train whichcorrespond to 25 tons per axle. A wish from LKAB to increase the load up to 30 tonsper axle or 6 000 tons per train exists. Calculations of the load bearing capacity of thebridges show that many of them will not be able to carry these higher loads withoutstrengthening. There exist several methods for strengthening of a concrete structure. Astrengthening method that have been more and more used during the last years isbonding of carbon fibre composite fabrics or laminates to the surface of the structure.The Swedish Rail Road authorities wanted to investigate the method more closely and ofthat reason a bridge were strengthened in Luleå during the summer of 1998. The bridgeis built of concrete and has three spans. It is located at Kallkällan NW of the city centre.The objective of the test was not only to investigate the strengthening effect but also tostudy the work methods and the work environment during handling of the thermosettingplastic.
Before the strengthening system was applied, the concrete surface was smoothened bysandblasting and grinding. Putty was used for bigger irregularities. The strengtheningsystem consists of a hand lay up system with epoxy and unidirectional carbon fibresheets. Later the concrete surface was coated by a polyurethane paint, with function toprotect against UV-radiation and mechanical damage and also to give an increasedaesthetic value. During the work the environmental and health aspects were taken intoaccount and the epoxy, as well as the epoxy components were handled in a strict andcareful manner, for example all the waste were placed in closed containers and sent todestruction.
In the report, general equations, modes of action and design principles for strengtheningby externally bonded fibre-reinforced polymers are described shortly. Some of thecalculations that have been done for the bridge are also shown.
For investigation of the strengthening system a comprehensive test program wasundertaken on the bridge before and after the strengthening system was mounted. Bothstrains and deformations were measured when ore trains at different speeds passed onthe bridge. The weight of each train was measured to be able to compare measurementsof different trains with each other. Measured values from testing were relatively close totheoretical calculated levels, before and after the strengthening, both regarding strainsand deformation. The measurement showed that the strengthening had increased thestiffness of the bridge by about 16 %. Also measurements of the concrete quality wereundertaken as well as an investigation of the bridge condition.
The difficulties to decide the clamping of the slab in the load bearing beams and thechosen models for calculations have a big influence of the theoretical results. However,the measurements show that the method of strengthening concrete bridges by bondingcarbon fibres to the surface works in an effective manner even when trains arefrequenting the bridge during the strengthening work.

Summary
In chapter 1 a short introduction and background to the project is given. In chapter 2theoretical work are described and in chapter 3 the execution of the strengthening workis described. In chapter 4 the results and the performance from the measurements arerecorded. In chapter 5 a comparison between theory and tests are made. In chapter 6conclusions are presented and finally in chapter 7 proposal to further work is given.

Sammanfattning
SAMMANFATTNINGJärnvägssträckningen mellan Gällivare och Luleå benämns Malmbanan. På dennasträckning fraktas dagligen stora mängder järnmalm. Under lång tid har fraktlasten varitca 5 000 ton per tåg vilket då motsvarar 25 ton per axel. Önskemål finns nu från LKABatt öka lastkapaciteten upp till 30 ton per axel eller 6 000 ton per tåg. Beräkningar visardå att ett stort antal av de befintliga broarna inte klarar denna belastningsnivå utanförstärkning. Härvid finns då ett flertal förstärkningsmetoder att tillgå. En alltmeranvänd förstärkningsmetod är att limma kolfiberväv eller laminat mot enbetongkonstruktion och på så sätt öka dess bärighet. Banverket ville undersöka metodenmer ingående och av den anledningen förstärktes en bro i Luleå under sommaren 1998.Bron är en traditionell trågbro i betong bestående av tre fack och belägen i utkanten avLuleå, nämligen vid Kallkällan. Målsättningen med försöken var förutom att undersökaförstärkningseffekten även att studera utförandemomenten och arbetsmiljöaspekterna.
Innan förstärkningssystemet monterades, jämnades betongytan till genom sandblästringoch slipning med efterföljande spackling av större ojämnheter. Förstärkningssystemetbestod av ett handmonterat system av en kombination av epoxi och enkelriktadekolfibrer i remsor. Efter appliceringen av kolfiber målades ytan med en gråpolyuretanfärg vilkens funktioner är att skydda ytan mot uv-strålning och viss mekaniskåverkan samt ge ett förhöjt estetiskt utseende. Under arbete togs stor hänsyn till miljö-och hälsoaspekter, bl a placerade härdplastavfall i slutna behållare och sändes tilldestruering efter avklarat arbete. För övrigt följdes föreskrifter bestämda avarbetarskyddsstyrelsen.
I rapporten beskrivs även kort generella ekvationer, verkningssätt ochdimensioneringsprinciper för förstärkning med utanpåliggande fastlimmadfiberkomposit. En del av beräkningarna vilka utförts på bron redovisas också.
För att undersöka förstärkningseffekten utfördes ett omfattande mätprogram på bron föreoch efter förstärkningsarbetet. Både töjningar och deformationer mättes när malmtågpasserade bron i olika hastigheter. Samtliga tåg vägdes för att kunna jämföra mätvärdenfrån de olika tågen med varandra. De uppmätta värdena från provbelastningarnaöverensstämde relativt bra med de teoretiska före och efter förstärkningen både medavseende på töjningar och deformationer. Mätningarna visade att förstärkningen hadeökat brons styvhet med cirka 16 %. Även mätningar av betongens kvalitet såväl som enundersökning av brons tillstånd gjordes.
Det bör nämnas att det finns svårigheter att bestämma trågbottens inspänningsgrad ihuvudbalkarna samt att valda beräkningsmodeller har stor betydelse för erhållnateoretiska mätresultat. Dock visar de jämförande mätningarna att förstärkningsmetodenmed pålimning av kolfiber mot betongytan fungerar på ett effektivt sätt och detta ävennär tåg trafikerar bron under förstärkningsarbetets gång.
I kapitel 1 ges en kortfattad inledning och bakgrund till förstärkningsmetoden. Kapitel 2redovisar det teoretiska arbetet och i kapitel 3 beskrivs arbetsutförandet. I kapitel 4beskrivs mätförfarandet och resultat från mätningen. I kapitel 5 görs en jämförelsemellan teori och försök. I kapitel 6 ges en sammanfattning och förslag till fortsatt arbeteredovisas slutligen i kapitel 7.
Contents I
CONTENTS
PREFACE
SUMMARY
SAMMANFATTNING
CONTENTS___________________________________________________I
NOTATIONS AND SYMBOLS ___________________________________III
1 INTRODUCTION __________________________________________ 11.1 Background................................................................................................. 11.2 The Reason for Strengthening the Concrete Railroad Bridge ............... 31.3 Objective of the Report.............................................................................. 5
2 THEORETICAL WORK _____________________________________ 82.1 General........................................................................................................ 82.2 Material Data ............................................................................................. 9
2.2.1 General ............................................................................................... 92.3 Design Principles ...................................................................................... 10
2.3.1 General ............................................................................................. 102.4 Estimation of the Ultimate Bending Moment at Failure....................... 13
2.4.1 General ............................................................................................. 132.4.2 Calculation of Strain and Stresses for the Dead Load....................... 132.4.3 Calculation of the Theoretical Bending Moment at Failure.............. 15
2.5 Estimation of the Strain and Stresses for the Full Scale Test............... 162.5.1 General ............................................................................................. 162.5.2 Bending Moment at Loading ............................................................ 162.5.3 Calculations of Stresses and Strains Over the Studied Cross Section182.5.4 List of Stresses and Strains ............................................................... 24
2.6 Estimation of the Deformations .............................................................. 252.6.1 General ............................................................................................. 252.6.2 Calculation of Theoretical Deflections ............................................. 26
3 EXECUTION OF STRENGTHENING____________________________ 283.1 General...................................................................................................... 283.2 Preparing Work ....................................................................................... 283.3 Strengthening ........................................................................................... 293.4 Completing Work..................................................................................... 293.5 Environmental Aspects ............................................................................ 293.6 Control of the Strengthening Work........................................................ 31
4 MEASUREMENTS AND CONDITION OF THE BRIDGE _______________ 324.1 General...................................................................................................... 32
ContentsII
4.2 Survey of Cracks.......................................................................................324.3 Test of Material Parameters ....................................................................34
4.3.1 Concrete Parameters..........................................................................344.3.2 Carbon Fibre Composite Strength .....................................................344.3.3 Fibre Content in the Composite.........................................................34
4.4 Strains and Deformations.........................................................................354.4.1 Measurements Before Strengthening.................................................374.4.2 Measurements After Strengthening ...................................................394.4.3 Measurements on Non-Strengthened Parts........................................41
5 COMPARISON BETWEEN THEORY AND TEST ____________________435.1 General ......................................................................................................435.2 Results from Tests.....................................................................................435.3 Theoretical Results ...................................................................................465.4 Comparison Between Test and Theory...................................................47
6 CONCLUSIONS__________________________________________496.1 General ......................................................................................................496.2 Field Test ...................................................................................................49
7 FURTHER WORK ________________________________________517.1 General ......................................................................................................517.2 Fatigue Load During Curing ...................................................................517.3 Roughness of Concrete Surface ...............................................................517.4 Pre-Stressing of Carbon Fibre Laminates ..............................................52
REFERENCES _______________________________________________53
APPENDIX A: CONCRETE PARAMETERS ________________________55
APPENDIX B: SAMPLED RESULTS _____________________________58

Notations and Symbols III
NOTATIONS AND SYMBOLS
Roman Capital LettersAf cross section area for composite [m2]As cross section area for tensile steel reinforcement [m2]
'sA cross section area for compressive steel reinforcement [m2]
C1 constant [N/m]C2 constant [N]C3 constant [Nm]Eck modulus of elasticity, concrete [Pa]Ece effective modulus of elasticity, concrete [Pa]Ef modulus of elasticity, fibre [Pa]Esk modulus of elasticity, steel [Pa]Fc compressive force in concrete [N]Ff tensile force in composite [N]Fs tensile force in the tensile steel reinforcement [N]
'sF compressive force in the compressive steel reinforcement [N]
Ic moment of inertia, concrete [m4]Is moment of inertia, steel [m4]I1 ideal moment of inertia, stadium I [m4]I2 ideal moment of inertia, stadium II [m4]L length [m]M bending moment [Nm]M(x) bending moment as a function of x [Nm]M0 bending moment due to dead load [Nm]Mballast bending moment due to ballast, dead load [Nm]Mconcrete bending moment due to concrete, dead load [Nm]Mmax maximum bending moment [Nm]VA support force, support A [N]VB support force, support B [N]Vf volume fraction [--]Wf weight fraction [--]

Notations and SymbolsIV
Roman Lower Case Lettersa distance [m]b width [m]bf width of composite laminate [m]d effective depth [m]ds effective depth to tensile reinforcement [m]
'sd effective depth to compressive reinforcement [m]
fcc compressive strength, concrete [Pa]fcck characteristic compressive strength, concrete [Pa]fct tensile strength, concrete [Pa]fctk characteristic tensile strength, concrete [Pa]fcbt bending tensile strength, concrete [Pa]fyk tensile strength, steel reinforcement [Pa]ffu tensile strength, carbon fibre [Pa]fyk tensile strength, steel reinforcement [Pa]h height [m]l1 distance [m]l2 distance [m]ma adjustment mass [kg]mm measured mass [kg]p1 deflection [m]p2 deflection [m]p3 deflection [m]p4 deflection [m]q(x) distributed load [N/m]x co-ordinate [--]x inner lever [m]y0 distance to neutral axis [m]ytp,c distance to centre of gravity of concrete [m]

Notations and Symbols V
Greek Lower Case Lettersα proportional factor for concrete [--]αs scale factor steel/concrete [--]α2 scale factor carbon fibre/concrete [--]αf scale factor carbon fibre/concrete [--]αs scale factor steel/concrete [--]β proportional factor for concrete [--]εa adjusted strain [--]εc strain in concrete [--]∆εc additional strain in concrete [--]εc0 compressive strain in concrete due to e.g. dead load [--]εct compressive strain in concrete [--]εcb tensile strain in concrete [--]εc0 compressive strain in concrete due to e.g. dead load [--]εf strain in fibre [--]εfu ultimate strain in fibre [--]εm measured strain [--]εs tensile strain in reinforcement [--]εs0 tensile strain in reinforcement due to e.g. dead load [--]∆εs0 additional strain in reinforcement [--]
'sε compressive strain in steel reinforcement [--]
εu0 strain in the bottom face due to e.g. dead load [--]ϕ creep number [--]φ diameter [m]µ reduction factor [--]ρm density of matrix [kg/m3]ρf density of fibre [kg/m3]σc normal stress in concrete [Pa]σct normal stress in concrete, top face [Pa]σcb normal stress in concrete, bottom face [Pa]σf tensile stress in carbon fibre [Pa]σs tensile stress in steel reinforcement [Pa]
'sσ compressive stress in steel reinforcement [Pa]
AbbreviationsFRP Fibre Reinforced Polymer
CFRP Carbon Fibre Reinforced Polymer
Chapter 1
Luleå University of Technology
1
1 INTRODUCTION
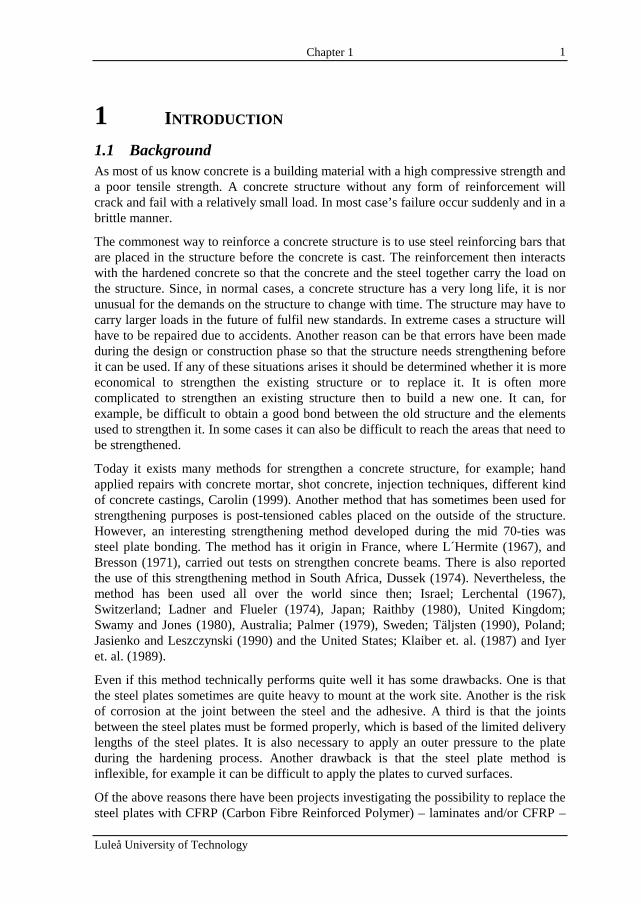
1.1 BackgroundAs most of us know concrete is a building material with a high compressive strength anda poor tensile strength. A concrete structure without any form of reinforcement willcrack and fail with a relatively small load. In most case’s failure occur suddenly and in abrittle manner.
The commonest way to reinforce a concrete structure is to use steel reinforcing bars thatare placed in the structure before the concrete is cast. The reinforcement then interactswith the hardened concrete so that the concrete and the steel together carry the load onthe structure. Since, in normal cases, a concrete structure has a very long life, it is norunusual for the demands on the structure to change with time. The structure may have tocarry larger loads in the future of fulfil new standards. In extreme cases a structure willhave to be repaired due to accidents. Another reason can be that errors have been madeduring the design or construction phase so that the structure needs strengthening beforeit can be used. If any of these situations arises it should be determined whether it is moreeconomical to strengthen the existing structure or to replace it. It is often morecomplicated to strengthen an existing structure then to build a new one. It can, forexample, be difficult to obtain a good bond between the old structure and the elementsused to strengthen it. In some cases it can also be difficult to reach the areas that need tobe strengthened.
Today it exists many methods for strengthen a concrete structure, for example; handapplied repairs with concrete mortar, shot concrete, injection techniques, different kindof concrete castings, Carolin (1999). Another method that has sometimes been used forstrengthening purposes is post-tensioned cables placed on the outside of the structure.However, an interesting strengthening method developed during the mid 70-ties wassteel plate bonding. The method has it origin in France, where L´Hermite (1967), andBresson (1971), carried out tests on strengthen concrete beams. There is also reportedthe use of this strengthening method in South Africa, Dussek (1974). Nevertheless, themethod has been used all over the world since then; Israel; Lerchental (1967),Switzerland; Ladner and Flueler (1974), Japan; Raithby (1980), United Kingdom;Swamy and Jones (1980), Australia; Palmer (1979), Sweden; Täljsten (1990), Poland;Jasienko and Leszczynski (1990) and the United States; Klaiber et. al. (1987) and Iyeret. al. (1989).
Even if this method technically performs quite well it has some drawbacks. One is thatthe steel plates sometimes are quite heavy to mount at the work site. Another is the riskof corrosion at the joint between the steel and the adhesive. A third is that the jointsbetween the steel plates must be formed properly, which is based of the limited deliverylengths of the steel plates. It is also necessary to apply an outer pressure to the plateduring the hardening process. Another drawback is that the steel plate method isinflexible, for example it can be difficult to apply the plates to curved surfaces.
Of the above reasons there have been projects investigating the possibility to replace thesteel plates with CFRP (Carbon Fibre Reinforced Polymer) – laminates and/or CFRP –
Chapter 1
Luleå University of Technology
2
fabrics, see for example Busel and Barno (1990), Deuring (1993), Meier et. al. (1992)and Täljsten (1997). These types of materials have the advantages of being very strongyet lightweight, and having excellent fatigue properties and outstanding corrosionresistance. The major disadvantages is that these materials are considerably moreexpansive than steel.
Fibre composites and reinforced polymers offer unique advantages in applications whereconventional materials cannot supply a satisfactory service life, Agarwal and Broutman(1990).
The high strength to weight ratio and the excellent resistance to electrochemicalcorrosion of composites make them attractive materials for structural applications. Inaddition, composites are formable and can be shaped to any desired form and surfacetexture. Today the major applications of composites in the civil engineering arena arefor repair and strengthening of damaged or structurally inadequate structures.
The strengthening method can be used if the amount of reinforcement is insufficient dueto a design error or a mistake on site. The method of outer reinforcement in form ofCFRP materials can be used if the concrete is of normal quality, >K20. However, if theinner reinforcement has extensive corrosion or the concrete is heavily contaminated bychlorides, the corroded bars and/or the concrete should be removed and replaced beforethe strengthening work starts. If increased stiffness is the purpose for strengthening themethod will nor contribute very much to the stiffness in the uncracked stage, but ratherin the cracked stage.
Today there exists approximately four different strengthen methods with compositematerials, these are:
• Laminates
• Pre-fabricated composite shells
• Wet and dry winding
• Hand lay-up techniques with unidirectional or bi-directional fabrics.
In this report only short explanations to the different methods are given. Whenstrengthen with laminates pre-fabricated thin shells are glued to a concrete surface with ahigh viscosity adhesive. When pre-fabricated shells are used these are designed for atypical structure such as columns. The composite action is achieved with a mediumviscosity adhesive. For the wet- and dry-winding methods a robot is used. In case of drywinding the fibre is pre-impregnated with a resin, a filament of fibres are winded rounda column and the curing process is taken care of by an outer heat source, for example anoven. For wet winding also a robot is used, however the filament passes a resin bathbefore it is winded around the column. Common for the hand lay-up techniques are thatthey are placed on the concrete surface by hand and can be used on flat as well as curvedsurfaces. All these methods has at least two things in common, first that a structure isstrengthen with fibre composite materials second that before beginning to strengthen astructure there are certain steps that must be taken.
Chapter 1
Luleå University of Technology
3
Firstly it is important to investigate the structure to see whether it is suitable forstrengthening. If so the strengthening work begins with dimensioning of thestrengthening system chosen. On site the concrete has to be sandblasted or ground, toremove latiance, and to level out possible cavities. The levelling is carried out with puttyor if there are big cavities, concrete mortar can be used. Then the surface must bevacuumed or cleaned with compressed air. The next step is to apply a primer to surface.The strengthening work starts with applying adhesive to the primed surface, then thecomposite material is put in place. If necessary a finishing layer, for example paint, canbe used to protect or to increase the aesthete value of the repaired structure. However,when carrying out strengthening with outer reinforcement there are some importantfactors that also have to be considered. First, for effective force transfer between theadherents, minimum anchor lengths must be ensured. Considerations must also be givento peeling, fatigue and long-term behaviour.
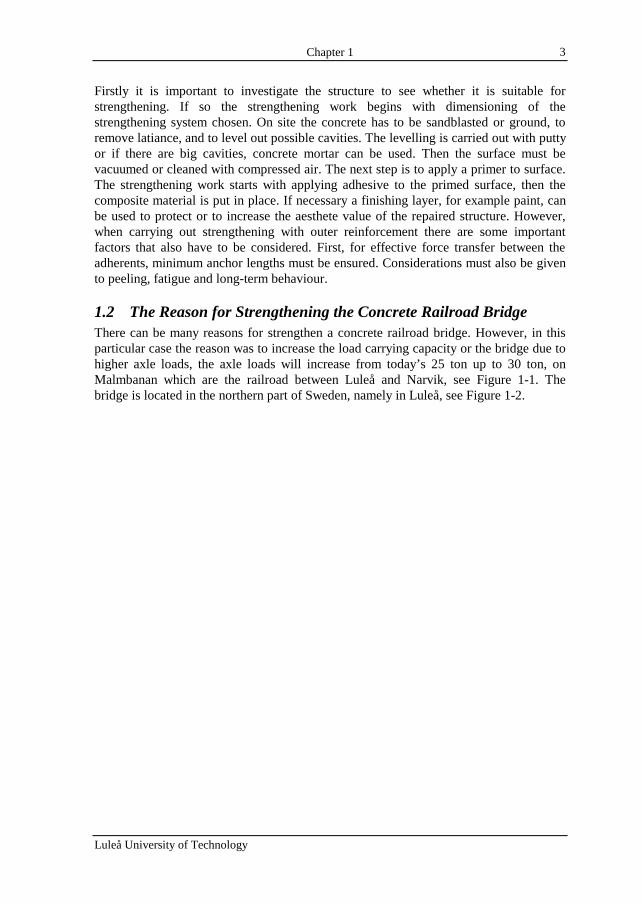
1.2 The Reason for Strengthening the Concrete Railroad BridgeThere can be many reasons for strengthen a concrete railroad bridge. However, in thisparticular case the reason was to increase the load carrying capacity or the bridge due tohigher axle loads, the axle loads will increase from today’s 25 ton up to 30 ton, onMalmbanan which are the railroad between Luleå and Narvik, see Figure 1-1. Thebridge is located in the northern part of Sweden, namely in Luleå, see Figure 1-2.
Chapter 1
Luleå University of Technology
4
Figure 1-1 The extension of Malmbanan, Banverket (1996)
Chapter 1
Luleå University of Technology
5
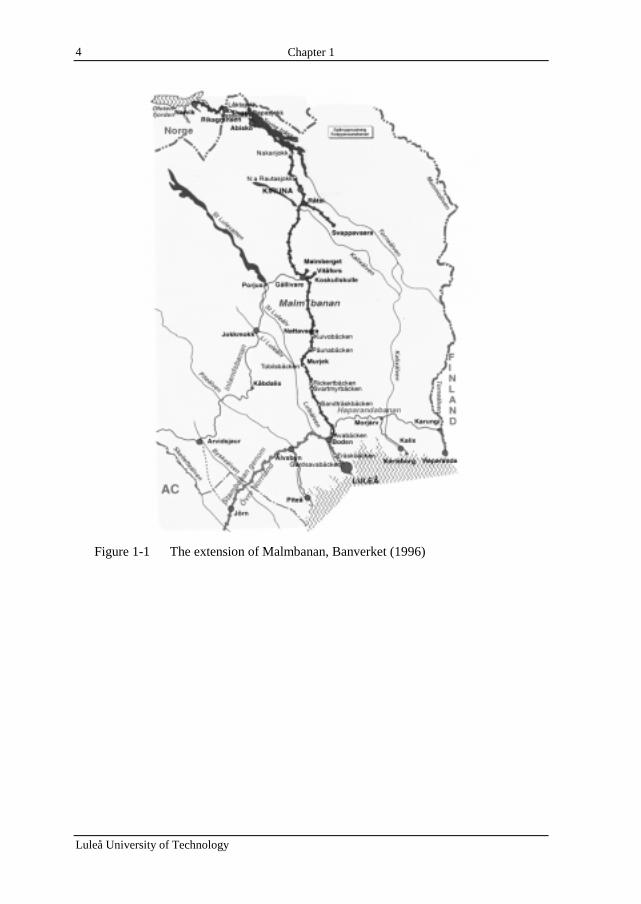
Figure 1-2 Location of the Railroad Bridge at Kallkällan in Luleå, Telia (1999)
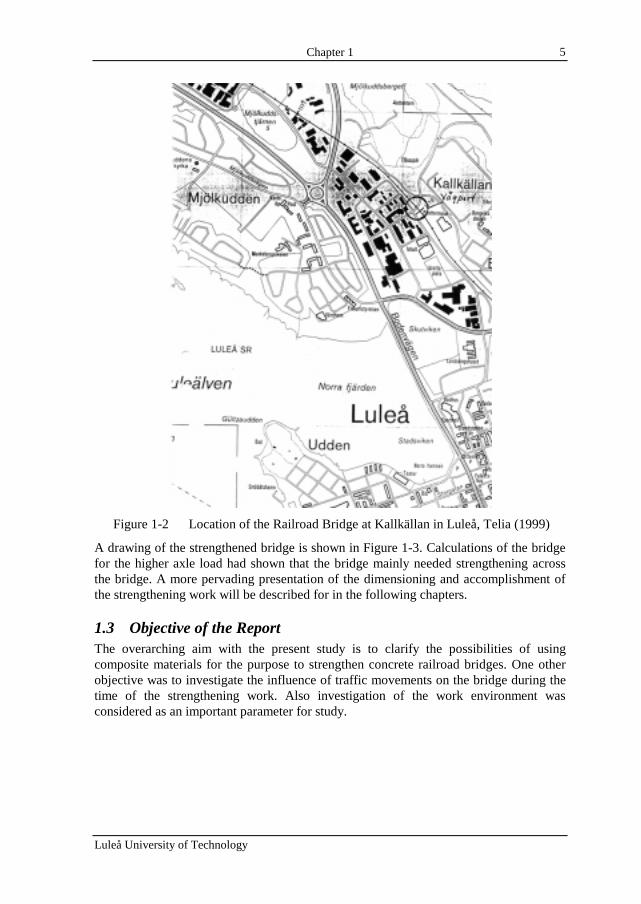
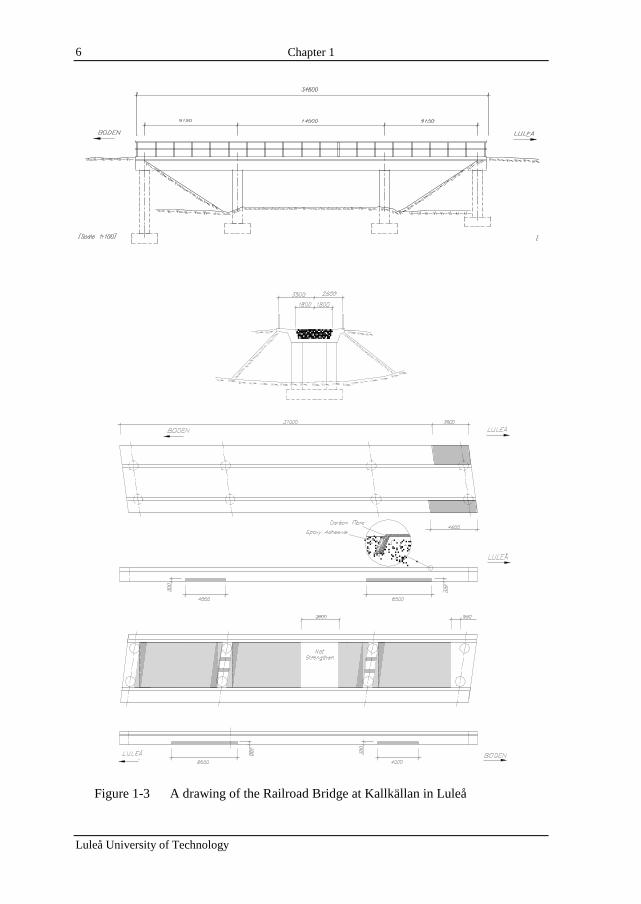
A drawing of the strengthened bridge is shown in Figure 1-3. Calculations of the bridgefor the higher axle load had shown that the bridge mainly needed strengthening acrossthe bridge. A more pervading presentation of the dimensioning and accomplishment ofthe strengthening work will be described for in the following chapters.
1.3 Objective of the ReportThe overarching aim with the present study is to clarify the possibilities of usingcomposite materials for the purpose to strengthen concrete railroad bridges. One otherobjective was to investigate the influence of traffic movements on the bridge during thetime of the strengthening work. Also investigation of the work environment wasconsidered as an important parameter for study.
Chapter 1
Luleå University of Technology
6
Figure 1-3 A drawing of the Railroad Bridge at Kallkällan in Luleå

Luleå University of Technology
7
Chapter 2
Luleå University of Technology
8
2 THEORETICAL WORK
2.1 GeneralToday there is a need all over the world to strengthen and repair existing buildingstructures. There exists many methods to do so, for example shotcrete, injection withcement or polymers, concrete claddings, post tension cables and so on. During the lastfive years, it has becoming more and more customary to strengthen concrete structuresby bonding advanced composite materials to their surfaces. The most common materialto use is carbon fibre fabrics or laminates. It is important that the linear elastic behaviourand the anisotropy of the composite material are considered in the design phase.
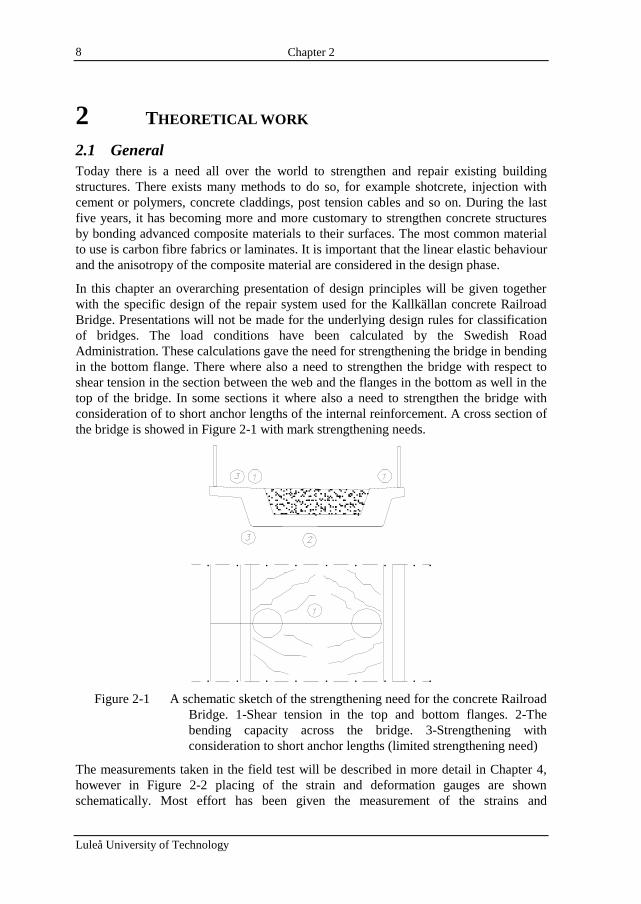
In this chapter an overarching presentation of design principles will be given togetherwith the specific design of the repair system used for the Kallkällan concrete RailroadBridge. Presentations will not be made for the underlying design rules for classificationof bridges. The load conditions have been calculated by the Swedish RoadAdministration. These calculations gave the need for strengthening the bridge in bendingin the bottom flange. There where also a need to strengthen the bridge with respect toshear tension in the section between the web and the flanges in the bottom as well in thetop of the bridge. In some sections it where also a need to strengthen the bridge withconsideration of to short anchor lengths of the internal reinforcement. A cross section ofthe bridge is showed in Figure 2-1 with mark strengthening needs.
Figure 2-1 A schematic sketch of the strengthening need for the concrete RailroadBridge. 1-Shear tension in the top and bottom flanges. 2-Thebending capacity across the bridge. 3-Strengthening withconsideration to short anchor lengths (limited strengthening need)
The measurements taken in the field test will be described in more detail in Chapter 4,however in Figure 2-2 placing of the strain and deformation gauges are shownschematically. Most effort has been given the measurement of the strains and
Chapter 2
Luleå University of Technology
9
deformations in the cross direction of the bridge since the need of strengthening wheremostly needed in this direction.
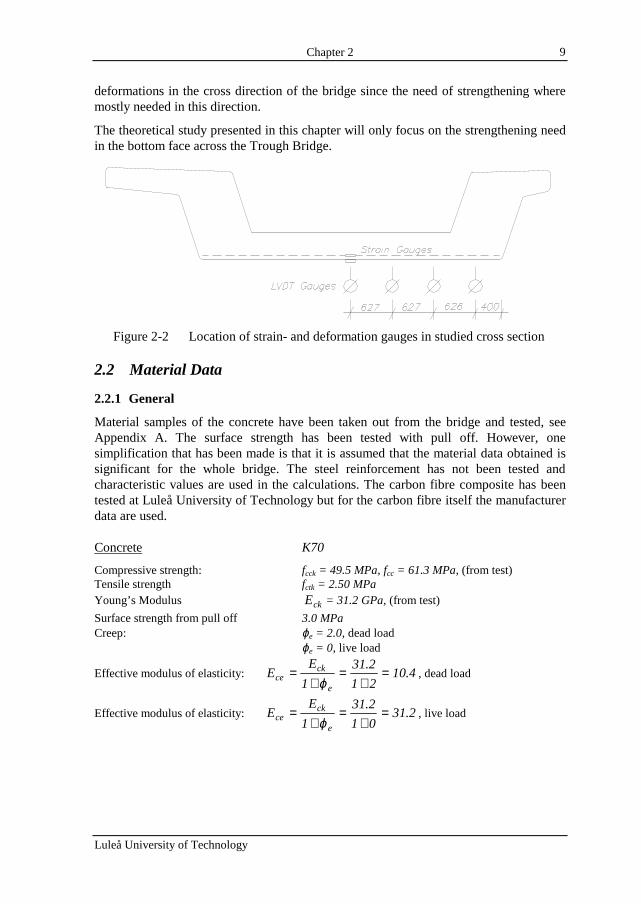
The theoretical study presented in this chapter will only focus on the strengthening needin the bottom face across the Trough Bridge.
Figure 2-2 Location of strain- and deformation gauges in studied cross section
2.2 Material Data
2.2.1 General
Material samples of the concrete have been taken out from the bridge and tested, seeAppendix A. The surface strength has been tested with pull off. However, onesimplification that has been made is that it is assumed that the material data obtained issignificant for the whole bridge. The steel reinforcement has not been tested andcharacteristic values are used in the calculations. The carbon fibre composite has beentested at Luleå University of Technology but for the carbon fibre itself the manufacturerdata are used.
Concrete K70
Compressive strength: fcck = 49.5 MPa, fcc = 61.3 MPa, (from test)Tensile strength fctk = 2.50 MPaYoung’s Modulus ckE = 31.2 GPa, (from test)
Surface strength from pull off 3.0 MPaCreep: ϕe = 2.0, dead load
ϕe = 0, live load
Effective modulus of elasticity: 4.1021
2.31
1
EE
e
ckce =
+=
+=
ϕ, dead load
Effective modulus of elasticity: 2.3101
2.31
1
EE
e
ckce =
+=
+=
ϕ, live load
Chapter 2
Luleå University of Technology
10
Steel Reinforcement
Type of reinforcement: Ks40, φ 16 mmTensile strength: fyk = 400 MPaYoung’s Modulus: Esk = 200 GPaConcrete cover: 30 mm
Scale factor 2.194.10
200EE cesks ===α , dead load
Scale factor 4.62.31
200EE cesks ===α , live load
Carbon Fibre Reinforcement
Tensile strength: ffu = 4465 MPaElongation: εfu > 15 ‰Module of Elasticity Ef = 235 GPaFactor of reduction: µ = 0.35 (from tests)
Scale factor 6.224.10
235EE ceff ===α , dead load
Scale factor 5.72.31
235EE ceff ===α , live load
2.3 Design Principles
2.3.1 General
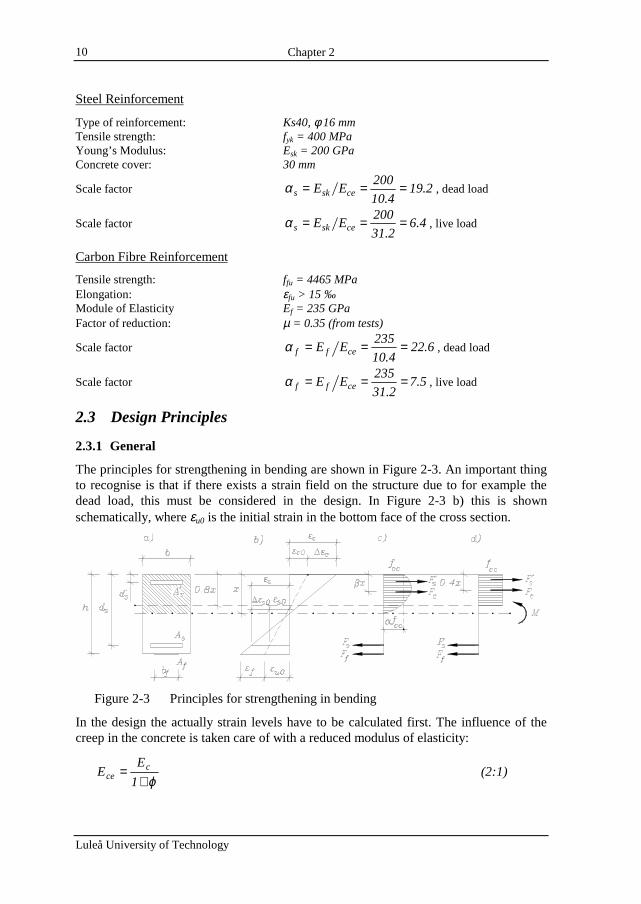
The principles for strengthening in bending are shown in Figure 2-3. An important thingto recognise is that if there exists a strain field on the structure due to for example thedead load, this must be considered in the design. In Figure 2-3 b) this is shownschematically, where εu0 is the initial strain in the bottom face of the cross section.
Figure 2-3 Principles for strengthening in bending
In the design the actually strain levels have to be calculated first. The influence of thecreep in the concrete is taken care of with a reduced modulus of elasticity:
ϕ+=
1
EE c
ce (2:1)
Chapter 2
Luleå University of Technology
11
The studied section can be consider uncracked if the tensile capacity of the concrete notexceeds:
ζζctk
4ctk
cbtf
h
4.06.0
fkf
+== (2:2)
This is controlled through calculation of the concrete tensile stress in the bottom of thestudied section:
0ssc
0c y
II
M
ασ
+= (2:3)
where Ic, and Is is the moment of inertia for the concrete and steel respectively. Thedistance from the centre of gravity to the top of the studied cross section can in thegeneral case be calculated as:
( )( ) ssc
sssc,tpc0 A1A
dA1yAy
−+−+
=αα
(2:4)
The ideal moment of inertia for a rectangular cross section can then be calculated asfollows:
( ) ( )20sss
2
0
3
ssc1 ydA12
hybh
12
bhIII −−+
−+=+= αα (2:5)
The next step is to calculate the stresses over the cross section. First at the top andbottom of the studied section:
01
0ct y
I
M=σ(2:6a)
( )01
0cb yh
I
M −=σ (2:6b)
and in the steel:
( )0s1
ss ydI
M −= ασ (2:6c)
The strains over the studied section can then very easily be calculated:
ce
ctct E
σε = (2:7a)
ce
cbcb E
σε = (2:7b)
However, if the cross section is cracked, stadium II, should only the concrete area thattakes compressive stresses be used in the calculation, and the expression for the momentof inertia becomes different, see Figure 2-4,
Chapter 2
Luleå University of Technology
12
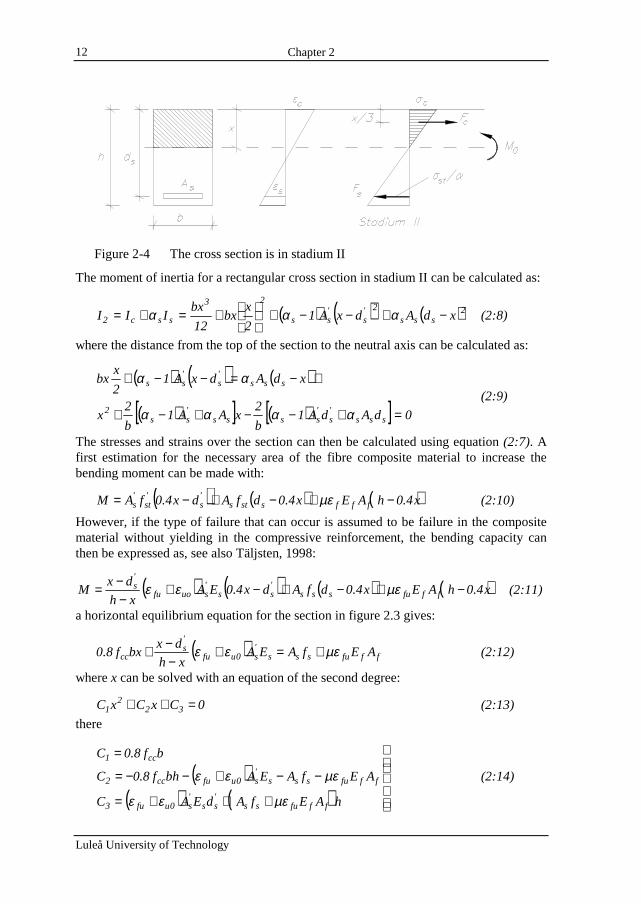
Figure 2-4 The cross section is in stadium II
The moment of inertia for a rectangular cross section in stadium II can be calculated as:
( ) ( ) ( )2sss
2's
'ss
23
ssc2 xdAdxA12
xbx
12
bxIII −+−−+
+=+= ααα (2:8)
where the distance from the top of the section to the neutral axis can be calculated as:
( ) ( ) ( )
( )[ ] ( )[ ] 0dAdA1b
2xAA1
b
2x
xdAdxA12
xbx
sss's
'ssss
'ss
2
sss's
'ss
=+−−+−+
⇒−=−−+
αααα
αα(2:9)
The stresses and strains over the section can then be calculated using equation (2:7). Afirst estimation for the necessary area of the fibre composite material to increase thebending moment can be made with:
( ) ( ) ( )x4.0hAEx4.0dfAdx4.0fAM fffssts's
'st
's −+−+−= µε (2:10)
However, if the type of failure that can occur is assumed to be failure in the compositematerial without yielding in the compressive reinforcement, the bending capacity canthen be expressed as, see also Täljsten, 1998:
( ) ( ) ( ) ( )x4.0hAEx4.0dfAdx4.0EAxh
dxM fffusss
'ss
'suofu
's −+−+−+
−−= µεεε (2:11)
a horizontal equilibrium equation for the section in figure 2.3 gives:
( ) fffusss's0ufu
's
cc AEfAEAxh
dxbxf8.0 µεεε +=+
−−+ (2:12)
where x can be solved with an equation of the second degree:
0CxCxC 322
1 =++ (2:13)
there
( )( ) ( )
+++=
−−+−−=
=
hAEfAdEAC
AEfAEAbhf8.0C
bf8.0C
fffuss'ss
's0ufu3
fffusss's0ufucc2
cc1
µεεε
µεεε (2:14)
Chapter 2
Luleå University of Technology
13
2.4 Estimation of the Ultimate Bending Moment at Failure
2.4.1 General
It is assumed that the most probable failure for the studied cross section of the bridgewould be failure in the composite material without yielding in the compressivereinforcement, see also Täljsten, 1999. In these calculations the material values fromtests have been used when available, if not the characteristic value of the material hasbeen used.
2.4.2 Calculation of Strain and Stresses for the Dead Load
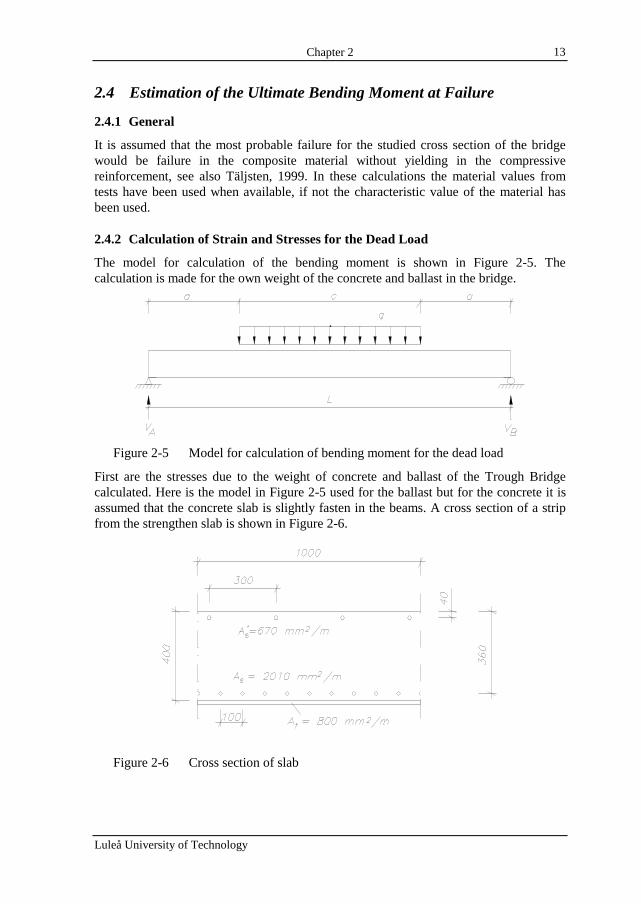
The model for calculation of the bending moment is shown in Figure 2-5. Thecalculation is made for the own weight of the concrete and ballast in the bridge.
Figure 2-5 Model for calculation of bending moment for the dead load
First are the stresses due to the weight of concrete and ballast of the Trough Bridgecalculated. Here is the model in Figure 2-5 used for the ballast but for the concrete it isassumed that the concrete slab is slightly fasten in the beams. A cross section of a stripfrom the strengthen slab is shown in Figure 2-6.
Figure 2-6 Cross section of slab

Chapter 2
Luleå University of Technology
14
The dead loads of the slab are:Concrete: 9.6 kN/mBallast: 19.8 kN/m
The moments due to dead load can hence be calculated:
( ) ( ) m/kNm6.3545.09.12
8.199.17.29ax
2
qxVM 22
Aballast =−−⋅=−−=
m/kNm1.916
9.36.9
16
qLM
22
concrete =⋅=≈
The total moment of the dead load is then approximately 45 kNm/m. The next step is toinvestigate if the slab is cracked. The distance to the neutral axis can be calculated asfollows:
( )( )
( ) ( )( ) ( ) m209.0
1067012.1910201012.1914.0
04.01067012.1936.010201012.192.04.00.1
A1A
dA1yAy
66
66
ssc
sssc,tpc0
=⋅⋅−+⋅⋅−+⋅
⋅⋅⋅−+⋅⋅⋅−+⋅⋅=
=−+−+
=
−−
−−
αα
The ideal moment of inertia can the be calculated:
( ) ( )
( ) ( )
( ) ( ) 4326
2623
20sss
2
0
3
ssc1
m1055.6209.004.01067012.19
209.036.010201012.192
4.0209.04.00.1
12
4.00.1
ydA12
hybh
12
bhIII
−−
−
⋅=−⋅⋅⋅−
+−⋅⋅⋅−+
−⋅+⋅=
=−−+
−+=+= αα
Thereafter can the stresses and strains over the cross section be calculated:
MPa4.1209.01055.6
1045y
I
My
II
M3
3
01
00
sc
0c =⋅
⋅⋅==
+= −α
σ
( ) ( ) ( ) MPa1.21209.004.01055.6
10452.18yd
I
M1
3
3
0's
1
0s
's −=−⋅
⋅⋅⋅=−−= −ασ
( ) ( ) ( ) MPa9.18209.036.01055.6
10452.18yd
I
M1
3
3
0s1
0ss =−⋅
⋅⋅⋅=−−= −ασ
( ) ( ) ( ) MPa3.1209.04.01055.6
1045yh
I
Myh
II
M3
3
01
00
sc
0cb =−⋅
⋅⋅=−=−
+= −α
σ
Chapter 2
Luleå University of Technology
15
13.0104.10
104.1
E 9
6
ce
cc =
⋅⋅== σε ‰
10.010200
101.21
E 9
6
s
's'
s =⋅⋅== σε ‰
09.010200
109.18
E 9
6
s
ss =
⋅⋅== σε ‰
12.0104.10
103.1
E 9
6
ce
cbcb =
⋅⋅== σε ‰
The tensile stress in the bottom face of the slab shall then be compared with theexpression for the stress at cracking.
MPa30.22.1
105.2
4.0
4.06.0
fkf
6
4ctk
cbt =⋅
+==
ζSince cbtcb f<σ can the section be assumed uncracked for the dead load.
2.4.3 Calculation of the Theoretical Bending Moment at Failure
First the constants C1, C2 and C3 needs to be calculated:
( )( ) ( )
+++=
−−+−−=
=
hAEfAdEAC
AEfAEAbhf8.0C
bf8.0C
fcffuss'ss
's0ufu3
fcffusss's0ufucc2
cc1
µεεε
µεεε
76cc1 1090.40.1103.618.0bf8.0C ⋅=⋅⋅⋅==
( )( )
769366
96336
fcffusss's0ufucc2
1042.21080010235101935.010400102010
1020010670101.010194.00.1103.618.0
AEfAEAbhf8.0C
⋅−=⋅⋅⋅⋅⋅⋅−⋅⋅⋅−
−⋅⋅⋅⋅⋅+⋅−⋅⋅⋅⋅−=
=−−+−−=
−−−
−−−
µεεε
( ) ( )( )( ) 569366
39633
fcffuss'ss
's0ufu3
1024.94.01080010235101935.010400102010
10401020010670101.01019
hAEfAdEAC
⋅=⋅⋅⋅⋅⋅⋅⋅+⋅⋅⋅+
+⋅⋅⋅⋅⋅⋅⋅+⋅=
=+++=
−−−
−−−−
µεεε
the distance to the neutral axis can then found by solving the second degree equation:
mm42x
0019.0x494.0x0CxCxC 232
21
==+−⇒=++
Chapter 2
Luleå University of Technology
16
The ultimate bending moment at failure can then be calculated:
( ) ( ) ( ) ( )
( ) ( )
( )( )
MNm7544782763.0
042.04.04.01080010235101935.0
042.04.036.010400102010
040.0042.04.01020010670101.0100.19042.04.0
040.0042.0
x4.0hAEx4.0dfAdx4.0EAxh
dxM
693
66
9633
fcffusss'ss
'suofu
's
=++−==⋅−⋅⋅⋅⋅⋅⋅⋅+
+⋅−⋅⋅⋅⋅+
+−⋅⋅⋅⋅⋅⋅⋅+⋅⋅−−=
=−+−+−+−
−=
−−
−
−−−
µεεε
This bending moment is well above necessary levels of loading. However, in real designthese utilisation levels are not permitted. Nevertheless, for the full-scale test real valuesof the materials are used but the load level is in comparison quite low. In the next part ofthe report theoretical calculations for stresses and strains for the full-scale test arepresented.
2.5 Estimation of the Strain and Stresses for the Full Scale Test
2.5.1 General
In the study of the full-scale test only live loads in addition are considered. Noconsideration has been taken to the initial stresses and strains due to the dead load. Thetheoretical study is only performed across the bridge and in the bottom face of thetrough bridge.
2.5.2 Bending Moment at Loading
The bending moment due to the live load of the iron ore trains is first calculated.However, it can be difficult to precisely determine whether the load are taken in the slabonly or in the beams and slab together. There is also very likely that the slab is clampedinto the beams to certain degree. The level of this is difficult to foresee. Nevertheless, inthe calculations full clamping in the longitudinal beams as well as placed on free supporthas been considered for the slab.
Furthermore, the actual measured axial load from the iron ore trains has been used in thecoming calculations. The results are summarised in table format.
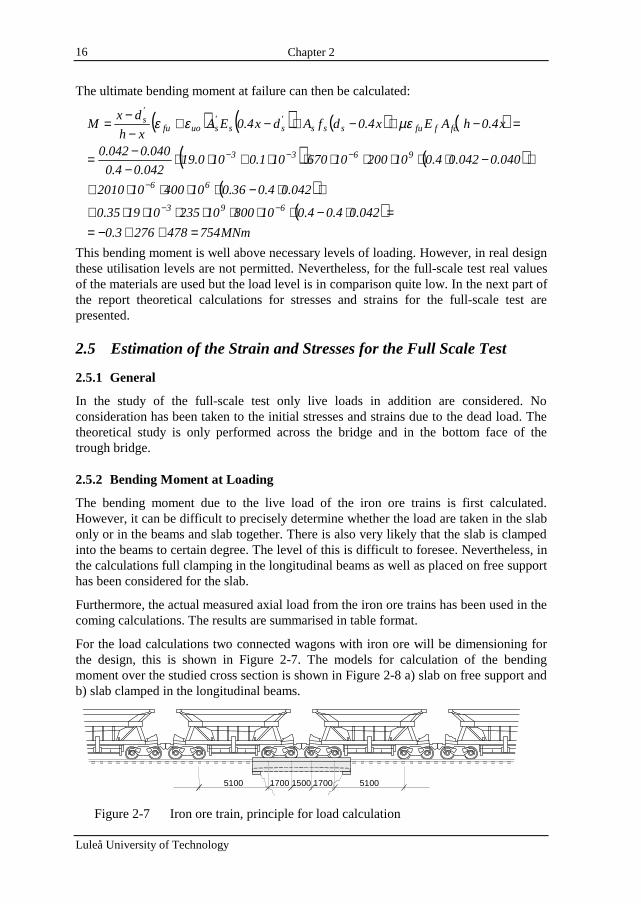
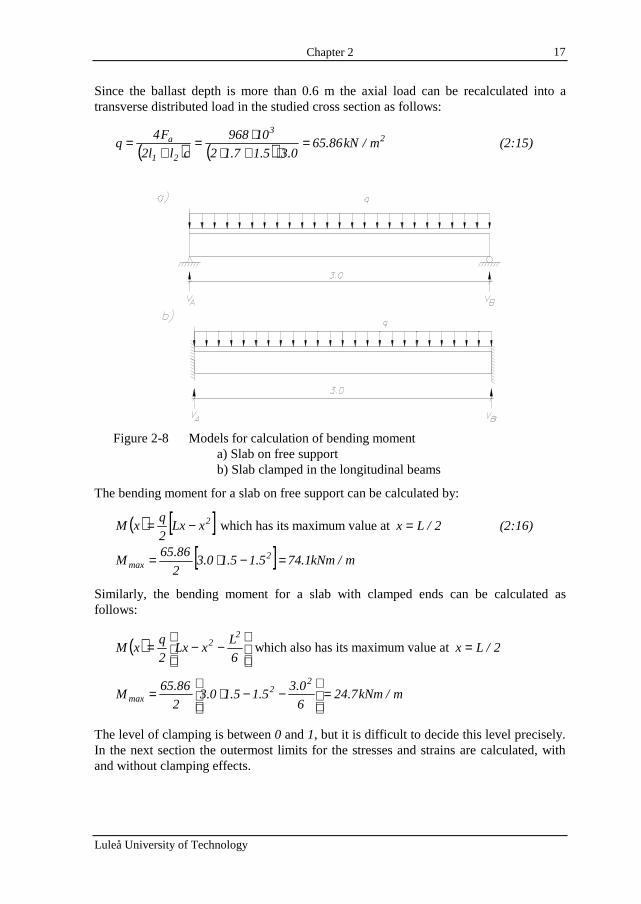
For the load calculations two connected wagons with iron ore will be dimensioning forthe design, this is shown in Figure 2-7. The models for calculation of the bendingmoment over the studied cross section is shown in Figure 2-8 a) slab on free support andb) slab clamped in the longitudinal beams.
510015005100 1700 1700
Figure 2-7 Iron ore train, principle for load calculation
Chapter 2
Luleå University of Technology
17
Since the ballast depth is more than 0.6 m the axial load can be recalculated into atransverse distributed load in the studied cross section as follows:
( ) ( )2
3
21
a m/kN86.650.35.17.12
10968
cll2
F4q =
⋅+⋅⋅=
+= (2:15)
Figure 2-8 Models for calculation of bending momenta) Slab on free supportb) Slab clamped in the longitudinal beams
The bending moment for a slab on free support can be calculated by:
( ) [ ]2xLx2
qxM −= which has its maximum value at 2/Lx = (2:16)
[ ] m/kNm1.745.15.10.32
86.65M 2
max =−⋅=
Similarly, the bending moment for a slab with clamped ends can be calculated asfollows:
( )
−−=
6
LxLx
2
qxM
22 which also has its maximum value at 2/Lx =
m/kNm7.246
0.35.15.10.3
2
86.65M
22
max =
−−⋅=
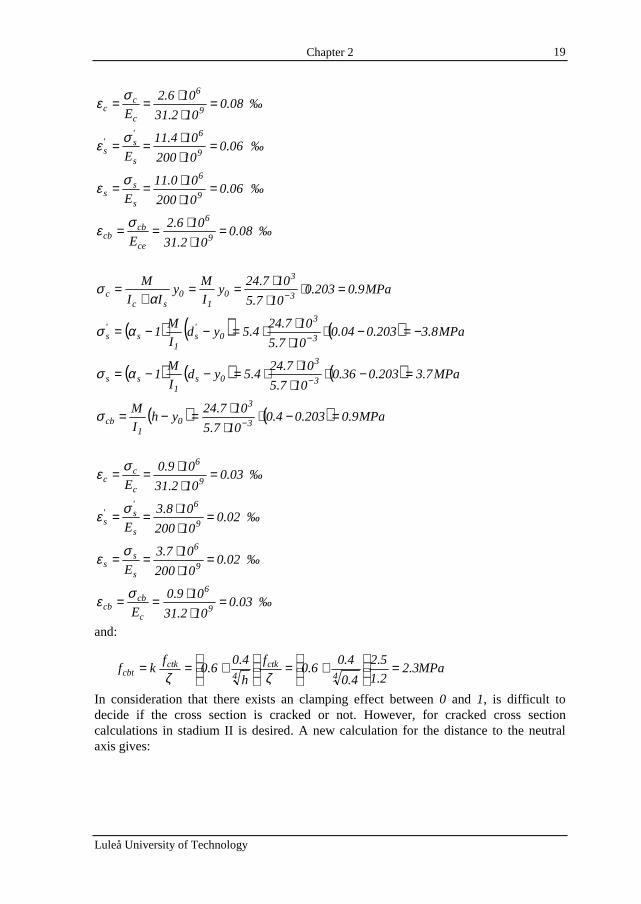
The level of clamping is between 0 and 1, but it is difficult to decide this level precisely.In the next section the outermost limits for the stresses and strains are calculated, withand without clamping effects.

Chapter 2
Luleå University of Technology
18
2.5.3 Calculations of Stresses and Strains Over the Studied Cross Section
Eight special extreme cases can be discerned. First the slab can be assumed placed onfree supports or clamped in the longitudinal beams. Furthermore the cross section canbe:
1. Uncracked without composite2. Cracked without composite3. Uncracked with composite4. Cracked with composite
Uncracked without composite
First the distance to the neutral axis must be calculated:
( ) ( )( ) ( )( ) ( )
( ) ( ) m203.01067014.610201014.614.0
04.01067014.636.010201014.62.04.00.1
AA1A1A
hAdA1dA1yAy
66
66
ff'ssssc
ff's
'ssss1c,tpc
0
=⋅⋅−+⋅⋅−+⋅
⋅⋅⋅−+⋅⋅⋅−+⋅⋅=
=+−+−+
+−+−+=
−−
−−
µαααµααα
and the ideal moment of inertia can be obtained as follows:
( ) ( ) ( ) ( )
( ) ( )
( ) ( ) 4326
2623
2
0's
'ss
20ss1
2
0
3
ffssc1
m107.5203.004.01067014.6
203.036.010201014.62
4.0203.04.00.1
12
4.00.1
ydA1ydA12
hybh
12
bhIIII
−−
−
⋅=−⋅⋅⋅−+
+−⋅⋅⋅−+
−⋅+⋅=
=−−+−−+
−+=++= αααα
The tensile stresses in the bottom face of the slab can then be calculated without andwith clamping, the dead load should be added:
MPa6.2203.0107.5
101.74y
I
My
II
M3
3
01
0sc
c =⋅⋅⋅==
+= −α
σ
( ) ( ) ( ) MPa4.11203.004.0107.5
101.744.5yd
I
M1
3
3
0's
1s
's −=−⋅
⋅⋅⋅=−−= −ασ
( ) ( ) ( ) MPa0.11203.036.0107.5
101.744.5yd
I
M1
3
3
0s1
ss =−⋅⋅⋅⋅=−−= −ασ
( ) ( ) MPa6.2203.04.0107.5
106.74yh
I
M3
3
01
cb =−⋅⋅⋅=−= −σ
Chapter 2
Luleå University of Technology
19
08.0102.31
106.2
E 9
6
c
cc =
⋅⋅== σε ‰
06.010200
104.11
E 9
6
s
's'
s =⋅⋅== σε ‰
06.010200
100.11
E 9
6
s
ss =
⋅⋅== σε ‰
08.0102.31
106.2
E 9
6
ce
cbcb =
⋅⋅== σε ‰
MPa9.0203.0107.5
107.24y
I
My
II
M3
3
01
0sc
c =⋅⋅⋅==
+= −α
σ
( ) ( ) ( ) MPa8.3203.004.0107.5
107.244.5yd
I
M1
3
3
0's
1s
's −=−⋅
⋅⋅⋅=−−= −ασ
( ) ( ) ( ) MPa7.3203.036.0107.5
107.244.5yd
I
M1
3
3
0s1
ss =−⋅⋅⋅⋅=−−= −ασ
( ) ( ) MPa9.0203.04.0107.5
107.24yh
I
M3
3
01
cb =−⋅⋅⋅=−= −σ
03.0102.31
109.0
E 9
6
c
cc =
⋅⋅== σε ‰
02.010200
108.3
E 9
6
s
's'
s =⋅⋅== σε ‰
02.010200
107.3
E 9
6
s
ss =
⋅⋅== σε ‰
03.0102.31
109.0
E 9
6
c
cbcb =
⋅⋅== σε ‰
and:
MPa3.22.1
5.2
4.0
4.06.0
f
h
4.06.0
fkf
4ctk
4ctk
cbt =
+=
+==
ζζIn consideration that there exists an clamping effect between 0 and 1, is difficult todecide if the cross section is cracked or not. However, for cracked cross sectioncalculations in stadium II is desired. A new calculation for the distance to the neutralaxis gives:

Chapter 2
Luleå University of Technology
20
Cracked without composite
( ) ( ) ( )
( )[ ] ( )[ ]( )[ ]
( )[ ]01055.9x033.0x
036.01020104.604.01067014.60.1
2
x1020104.61067014.60.1
2x
dAdA1b
2xAA1
b
2x
xdAdxA12
xbx
32
66
662
sss's
'ssss
'ss
2
sss's
'ss
=⋅−+⇒
⇒=⋅⋅⋅+⋅⋅⋅−−
−⋅⋅+⋅⋅−+
=+−−+−+
⇒−=−−+
−
−−
−−
αααα
αα
solving the second order equation gives x = 82 mm. The moment of inertia in stadium IIcan then be calculated as follows:
( ) ( ) ( )
( ) ( )
( ) 4326
2623
2sss
2's
'ss
23
ssc2
m102.1082.036.01020104.6
040.0082.0.01067014.62
082.0082.00.1
12
082.00.1
xdAdxA12
xbx
12
bxIII
−−
−
⋅=−⋅⋅
+−⋅⋅⋅−+
⋅+⋅=
=−+−−+
+=+= ααα
The stresses over the cross section can then be calculated, however, here only live loadare considered, first for the slab on free support:
MPa1.5082.0102.1
101.74x
I
M3
3
2c =⋅
⋅⋅== −σ
( ) ( ) ( ) MPa1.14082.0040.0102.1
106.744.5xd
I
M1
3
3's
2s
's −=−⋅
⋅⋅⋅=−−= −ασ
( ) ( ) MPa8.109082.036.0102.1
106.744.6xd
I
M3
3
s2
ss =−⋅⋅⋅⋅=−= −ασ
and the corresponding strain levels
16.0102.31
101.5
E 9
6
c
cc =
⋅⋅== σε ‰
08.010200
101.14
E 9
6
s
's'
s =⋅⋅== σε ‰
55.010200
108.109
E 9
6
s
ss =
⋅⋅== σε ‰
Chapter 2
Luleå University of Technology
21
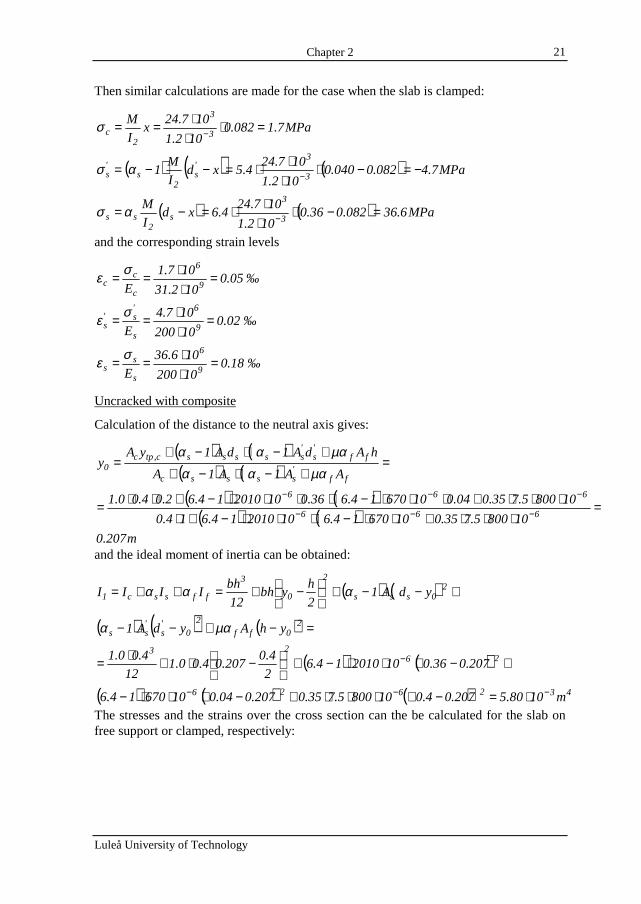
Then similar calculations are made for the case when the slab is clamped:
MPa7.1082.0102.1
107.24x
I
M3
3
2c =⋅
⋅⋅== −σ
( ) ( ) ( ) MPa7.4082.0040.0102.1
107.244.5xd
I
M1
3
3's
2s
's −=−⋅
⋅⋅⋅=−−= −ασ
( ) ( ) MPa6.36082.036.0102.1
107.244.6xd
I
M3
3
s2
ss =−⋅⋅
⋅⋅=−= −ασ
and the corresponding strain levels
05.0102.31
107.1
E 9
6
c
cc =
⋅⋅== σε ‰
02.010200
107.4
E 9
6
s
's'
s =⋅⋅== σε ‰
18.010200
106.36
E 9
6
s
ss =
⋅⋅== σε ‰
Uncracked with composite
Calculation of the distance to the neutral axis gives:
( ) ( )( ) ( )( ) ( )
( ) ( )m207.0
108005.735.01067014.610201014.614.0
108005.735.004.01067014.636.010201014.62.04.00.1
AA1A1A
hAdA1dA1yAy
666
666
ff'ssssc
ff's
'sssssc,tpc
0
=⋅⋅⋅+⋅⋅−+⋅⋅−+⋅
⋅⋅⋅+⋅⋅⋅−+⋅⋅⋅−+⋅⋅=
=+−+−+
+−+−+=
−−−
−−−
µαααµααα
and the ideal moment of inertia can be obtained:
( ) ( )
( ) ( ) ( )
( ) ( )
( ) ( ) ( ) 432626
2623
20ff
2
0's
'ss
20sss
2
0
3
ffssc1
m1080.5207.04.0108005.735.0207.004.01067014.6
207.036.010201014.62
4.0207.04.00.1
12
4.00.1
yhAydA1
ydA12
hybh
12
bhIIII
−−−
−
⋅=−⋅⋅⋅⋅+−⋅⋅⋅−
+−⋅⋅⋅−+
−⋅+⋅=
=−+−−
+−−+
−+=++=
µαα
ααα
The stresses and the strains over the cross section can the be calculated for the slab onfree support or clamped, respectively:
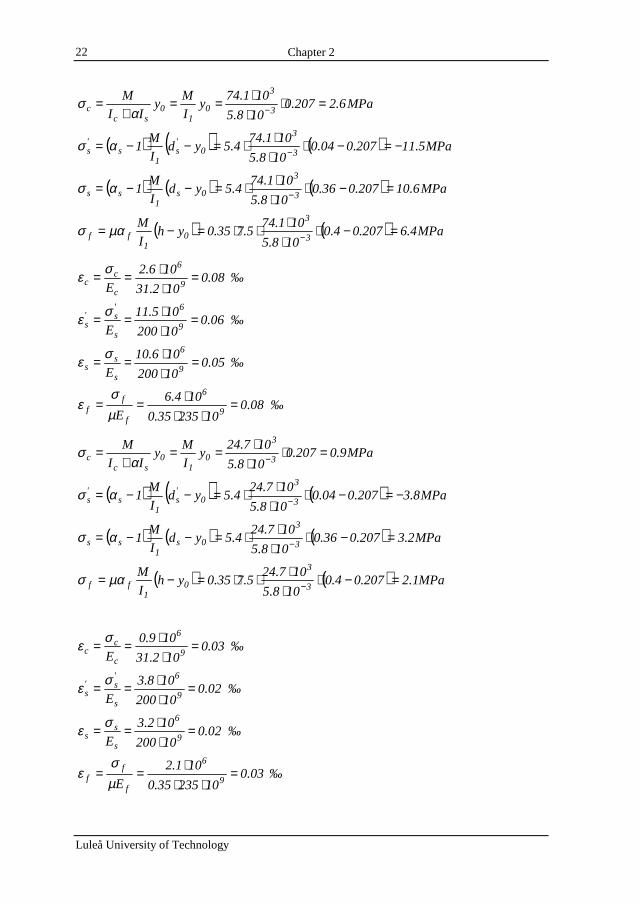
Chapter 2
Luleå University of Technology
22
MPa6.2207.0108.5
101.74y
I
My
II
M3
3
01
0sc
c =⋅⋅⋅==
+= −α
σ
( ) ( ) ( ) MPa5.11207.004.0108.5
101.744.5yd
I
M1
3
3
0's
1s
's −=−⋅
⋅⋅⋅=−−= −ασ
( ) ( ) ( ) MPa6.10207.036.0108.5
101.744.5yd
I
M1
3
3
0s1
ss =−⋅⋅⋅⋅=−−= −ασ
( ) ( ) MPa4.6207.04.0108.5
101.745.735.0yh
I
M3
3
01
ff =−⋅⋅⋅⋅⋅=−= −µασ
08.0102.31
106.2
E 9
6
c
cc =
⋅⋅== σε ‰
06.010200
105.11
E 9
6
s
's'
s =⋅⋅== σε ‰
05.010200
106.10
E 9
6
s
ss =
⋅⋅== σε ‰
08.01023535.0
104.6
E 9
6
f
ff =
⋅⋅⋅==
µσ
ε ‰
MPa9.0207.0108.5
107.24y
I
My
II
M3
3
01
0sc
c =⋅⋅
⋅==+
= −ασ
( ) ( ) ( ) MPa8.3207.004.0108.5
107.244.5yd
I
M1
3
3
0's
1s
's −=−⋅
⋅⋅⋅=−−= −ασ
( ) ( ) ( ) MPa2.3207.036.0108.5
107.244.5yd
I
M1
3
3
0s1
ss =−⋅⋅⋅⋅=−−= −ασ
( ) ( ) MPa1.2207.04.0108.5
107.245.735.0yh
I
M3
3
01
ff =−⋅⋅
⋅⋅⋅=−= −µασ
03.0102.31
109.0
E 9
6
c
cc =
⋅⋅== σε ‰
02.010200
108.3
E 9
6
s
's'
s =⋅⋅== σε ‰
02.010200
102.3
E 9
6
s
ss =
⋅⋅== σε ‰
03.01023535.0
101.2
E 9
6
f
ff =
⋅⋅⋅==
µσ
ε ‰

Chapter 2
Luleå University of Technology
23
Cracked with composite
If the cross section is in stadium II, the calculation to the neutral axis gives:
( ) ( ) ( ) ( )
( )[ ] ( )[ ]( )[ ]
( )[ ]01015.1x1078.3x
04.0108005.735.036.01020104.604.01067014.60.1
2
x108005.735.01020104.61067014.60.1
2x
hAdAdA1b
2xAAA1
b
2x
xhAxdAdxA12
xbx
222
666
6662
fcfsss's
'ssfcfss
'ss
2
fcfsss's
'ss
=⋅−⋅+⇒
⇒=⋅⋅⋅⋅+⋅⋅⋅+⋅⋅⋅−
−⋅⋅⋅+⋅⋅+⋅⋅−+
=++−−++−+
⇒−+−=−−+
−−
−−−
−−−
µαααµααα
µααα
solving this second order equation gives x = 90 mm.
The moment of inertia in stadium II can then be calculated as follows:
( ) ( )( ) ( )
( ) ( )
( ) ( ) 432626
2623
2fcf
2sss
2's
'ss
23
ffssc2
m1042.1090.04.0108005.735.0090.036.01020104.6
040.0090.01067014.62
090.0090.00.1
12
090.00.1
xhAxdA
dxA12
xbx
12
bxIIII
−−−
−
⋅=−⋅⋅⋅⋅+−⋅⋅⋅
+−⋅⋅⋅−+
⋅+⋅=
=−+−
+−−+
+=++=
µαα
ααα
The stresses and strains over the cross section can then be calculated:
MPa7.4090.01042.1
101.74x
I
M3
3
2c =⋅
⋅⋅== −σ
( ) ( ) ( ) MPa1.14090.0040.01042.1
101.744.5xd
I
M1
3
3's
2s
's −=−⋅
⋅⋅⋅=−−= −ασ
( ) ( ) MPa2.90090.036.01042.1
101.744.6xd
I
M3
3
s2
ss =−⋅⋅⋅⋅=−= −ασ
( ) ( ) MPa5.42090.040.01042.1
101.745.735.0xh
I
M3
3
2ff =−⋅
⋅⋅⋅⋅=−= −µασ
15.0102.31
107.4
E 9
6
c
cc =
⋅⋅== σε ‰
07.010200
101.14
E 9
6
s
's'
s =⋅⋅== σε ‰
45.010200
102.90
E 9
6
s
ss =
⋅⋅== σε ‰
Chapter 2
Luleå University of Technology
24
51.01023535.0
105.42
E 9
6
f
ff =
⋅⋅⋅==
µσ
ε ‰
Then similar calculations for the stresses and strains are made for the case when the slabis clamped:
MPa6.1090.01042.1
107.24x
I
M3
3
2c =⋅
⋅⋅== −σ
( ) ( ) ( ) MPa7.4090.0040.01042.1
107.244.5xd
I
M1
3
3's
2s
's −=−⋅
⋅⋅⋅=−−= −ασ
( ) ( ) MPa0.30090.036.01042.1
107.244.6xd
I
M3
3
s2
ss =−⋅⋅⋅⋅=−= −ασ
( ) ( ) MPa2.14090.040.01042.1
107.245.735.0xh
I
M3
3
2ff =−⋅
⋅⋅⋅⋅=−= −µασ
05.0102.31
106.1
E 9
6
c
cc =
⋅⋅== σε ‰
02.010200
107.4
E 9
6
s
's'
s =⋅⋅== σε ‰
15.010200
100.30
E 9
6
s
ss =
⋅⋅== σε ‰
17.01023535.0
102.14
E 9
6
f
ff =
⋅⋅⋅==
µσ
ε ‰
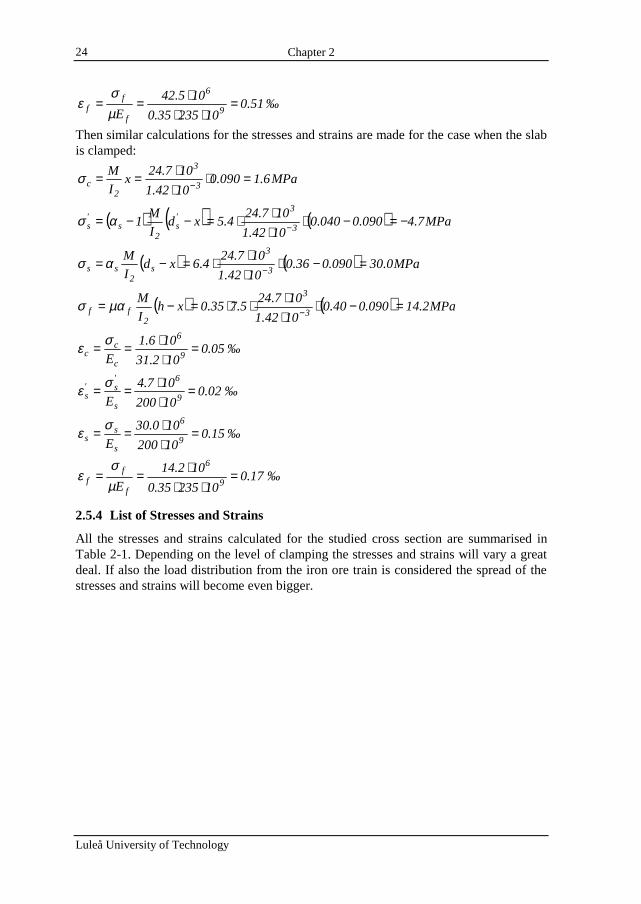
2.5.4 List of Stresses and Strains
All the stresses and strains calculated for the studied cross section are summarised inTable 2-1. Depending on the level of clamping the stresses and strains will vary a greatdeal. If also the load distribution from the iron ore train is considered the spread of thestresses and strains will become even bigger.
Chapter 2
Luleå University of Technology
25
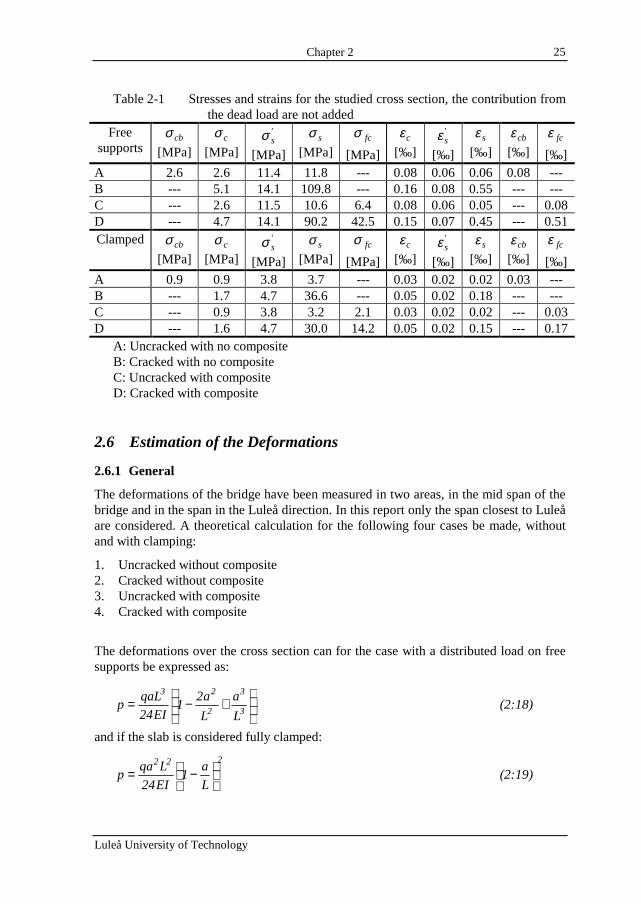
Table 2-1 Stresses and strains for the studied cross section, the contribution fromthe dead load are not added
Freesupports
cbσ[MPa]
cσ[MPa]
'sσ
[MPa]
sσ[MPa]
fcσ[MPa]
cε[‰]
'sε
[‰]
sε[‰]
cbε[‰]
fcε[‰]
A 2.6 2.6 11.4 11.8 --- 0.08 0.06 0.06 0.08 ---B --- 5.1 14.1 109.8 --- 0.16 0.08 0.55 --- ---C --- 2.6 11.5 10.6 6.4 0.08 0.06 0.05 --- 0.08D --- 4.7 14.1 90.2 42.5 0.15 0.07 0.45 --- 0.51Clamped cbσ
[MPa]cσ
[MPa]
'sσ
[MPa]
sσ[MPa]
fcσ[MPa]
cε[‰]
'sε
[‰]
sε[‰]
cbε[‰]
fcε[‰]
A 0.9 0.9 3.8 3.7 --- 0.03 0.02 0.02 0.03 ---B --- 1.7 4.7 36.6 --- 0.05 0.02 0.18 --- ---C --- 0.9 3.8 3.2 2.1 0.03 0.02 0.02 --- 0.03D --- 1.6 4.7 30.0 14.2 0.05 0.02 0.15 --- 0.17
A: Uncracked with no compositeB: Cracked with no compositeC: Uncracked with compositeD: Cracked with composite
2.6 Estimation of the Deformations
2.6.1 General
The deformations of the bridge have been measured in two areas, in the mid span of thebridge and in the span in the Luleå direction. In this report only the span closest to Luleåare considered. A theoretical calculation for the following four cases be made, withoutand with clamping:
1. Uncracked without composite2. Cracked without composite3. Uncracked with composite4. Cracked with composite
The deformations over the cross section can for the case with a distributed load on freesupports be expressed as:
+−=
3
3
2
23
L
a
L
a21
EI24
qaLp (2:18)
and if the slab is considered fully clamped:
222
L
a1
EI24
Lqap
−= (2:19)
Chapter 2
Luleå University of Technology
26
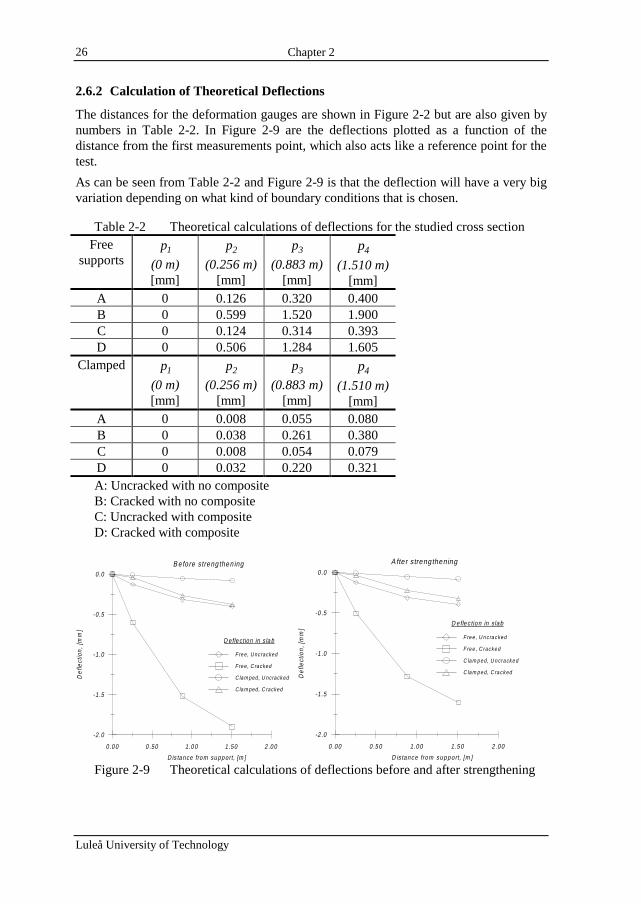
2.6.2 Calculation of Theoretical Deflections
The distances for the deformation gauges are shown in Figure 2-2 but are also given bynumbers in Table 2-2. In Figure 2-9 are the deflections plotted as a function of thedistance from the first measurements point, which also acts like a reference point for thetest.
As can be seen from Table 2-2 and Figure 2-9 is that the deflection will have a very bigvariation depending on what kind of boundary conditions that is chosen.
Table 2-2 Theoretical calculations of deflections for the studied cross sectionFree
supports1p
(0 m)[mm]
2p
(0.256 m)[mm]
3p
(0.883 m)[mm]
4p
(1.510 m)[mm]
A 0 0.126 0.320 0.400B 0 0.599 1.520 1.900C 0 0.124 0.314 0.393D 0 0.506 1.284 1.605
Clamped 1p
(0 m)[mm]
2p
(0.256 m)[mm]
3p
(0.883 m)[mm]
4p
(1.510 m)[mm]
A 0 0.008 0.055 0.080B 0 0.038 0.261 0.380C 0 0.008 0.054 0.079D 0 0.032 0.220 0.321A: Uncracked with no compositeB: Cracked with no compositeC: Uncracked with compositeD: Cracked with composite
0.0 0 0 .50 1.0 0 1.50 2 .0 0
-2 .0
-1 .5
-1 .0
-0 .5
0 .0
Def
lect
ion,
[mm
]
D is ta nce fro m su pp ort, [m ]
D efle c tion in s la b
Fre e, U ncracked
Fre e, C racked
C la m ped, U ncracked
C la m ped, C racked
B e fo re s treng then ing
0 .00 0 .50 1 .00 1 .50 2 .00
-2 .0
-1 .5
-1 .0
-0 .5
0 .0
Def
lect
ion,
[mm
]
D is tance from support, [m ]
D e flec tion in s lab
F re e , U n c ra cke d
F re e , C racke d
C la m p e d, U n cra cke d
C la m p e d, C ra cked
A fte r s treng thening
Figure 2-9 Theoretical calculations of deflections before and after strengthening

Luleå University of Technology
27
Chapter 3
Luleå University of Technology
28
3 EXECUTION OF STRENGTHENING
3.1 GeneralStrengthening with carbon fibre involves in rough outline three main moments;preparing work, strengthening and finishing work. Preparing means sand blasting, andgrinding, application of putty and grinding once more. Before the mounting of carbonfibre can be done a primer need also to be applied. Strengthening involves application ofepoxy and mounting of carbon fibre. Finishing work, such as for example a hard paint isnecessary to get protection for the strengthening system and to reach an aestheticallyattractive surface.
3.2 Preparing WorkTo ensure sufficient adhesion between the carbon fibre and the concrete there are somedemands for the concrete surface, i.e. low quality concrete must be removed and theaggregates must be uncovered. For structural reasons there are some demands of themaximum roughness. The concrete surface must be so smooth that the carbon fibresheets will not be bonded in a buckled position. These two demands together imply thatthe surface must be sand blasted and often ground before the strengthening work cancommence.
At the underpass for Kallkällevägen the concrete was of high quality and the sandblasting was not enough to uncover the aggregates in the concrete. Further more thesurface was rough that means grinding was necessary to achieve the desired smoothness.The roughness was due to the use of board mould when casting. The grinding was hardmanual work and time consuming. This part of the preparing work will properly becamemuch more effective after development of machine operated equipment.
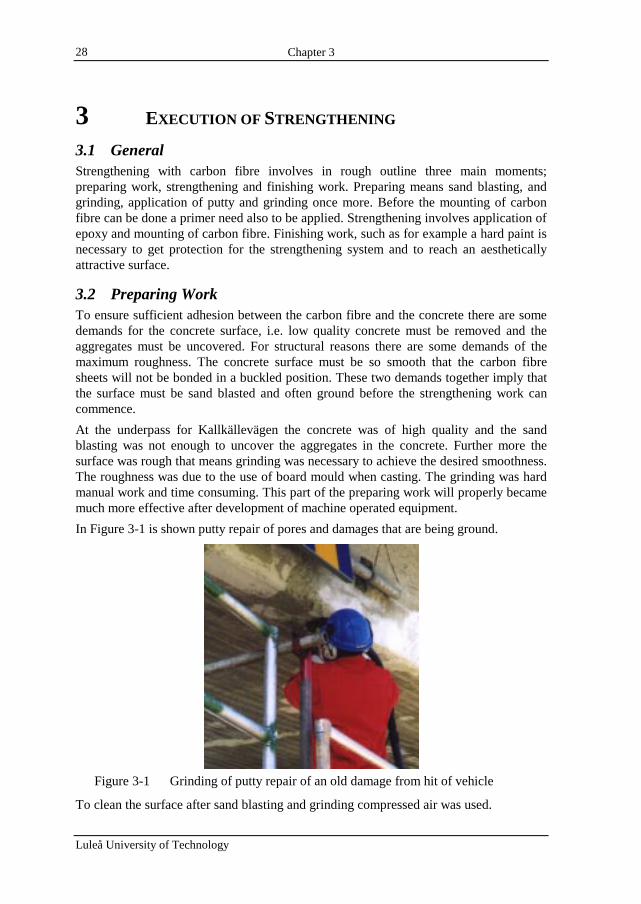
In Figure 3-1 is shown putty repair of pores and damages that are being ground.
Figure 3-1 Grinding of putty repair of an old damage from hit of vehicle
To clean the surface after sand blasting and grinding compressed air was used.
Chapter 3
Luleå University of Technology
29
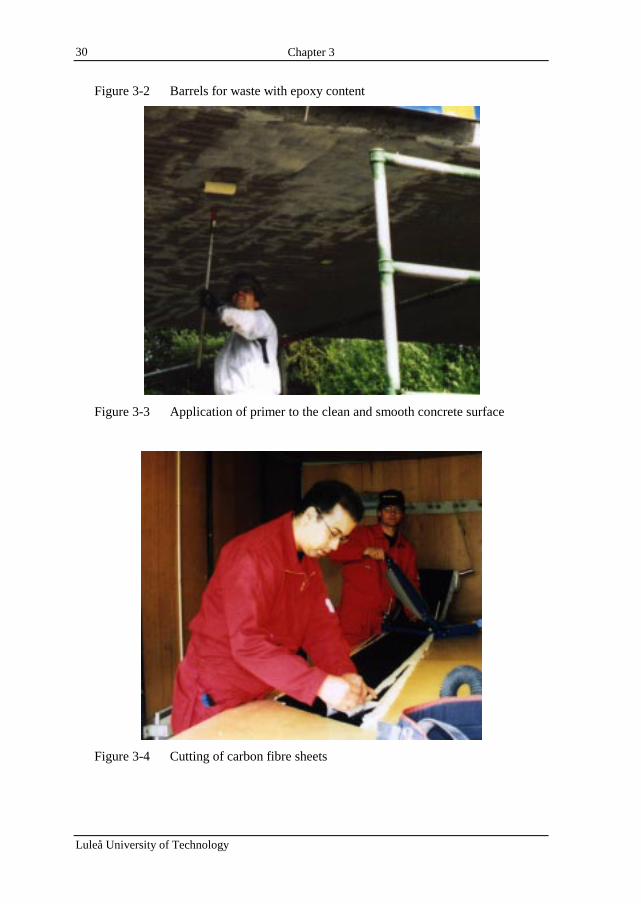
3.3 StrengtheningTo distribute the forces between the fibres and to make full connection with the concretean epoxy resin is used. To prevent the epoxy to penetrate into the concrete withoutwetting the fibres sufficiently a two component primer of the strengthening system isfirst applied to the concrete surface. The primer penetrates the concrete and increase theadhesion for the epoxy adhesive, Augustsson, 1995. However it is important that thepores are diffusion open for water vapour. The primer is fast and easy applied to theconcrete with a soft roller, see Figure 3-3.
When the primer has cured it is time to apply epoxy and the carbon fibres. The fibreswere pre-cut into desired lengths by help of a cutting board, see Figure 3-4.
3.4 Completing WorkAfter that the epoxy has hardened starts the finish work. In this case a grey polyurethanepaint developed for the strengthening system was used for protection and aestheticfinish. The paint is design for outdoor use and gives a very hard and tough surfacesimilar to the surface on garage floors. It will also protect the system against UV-radiation.
3.5 Environmental AspectsEpoxy is a thermosetting plastic that consists of two parts, a resin and a hardener. Thefully cured product involve no environmental or health problems and are in many casesused as package of food. On the other hand if the two compounds are improperlyhandled they can cause allergy and irritations. That is also valid for washing detergentand other chemical products that are daily used, but in those cases there is a goodknowledge of how the materials should be handled, Augustsson (1995). Anyhow, thereare no problems with epoxy or the components if the advises from supplier and thelabour welfare act are prescribed. For example should larger quantities of epoxy alwaysbe handle with care, protection gloves and face protection.
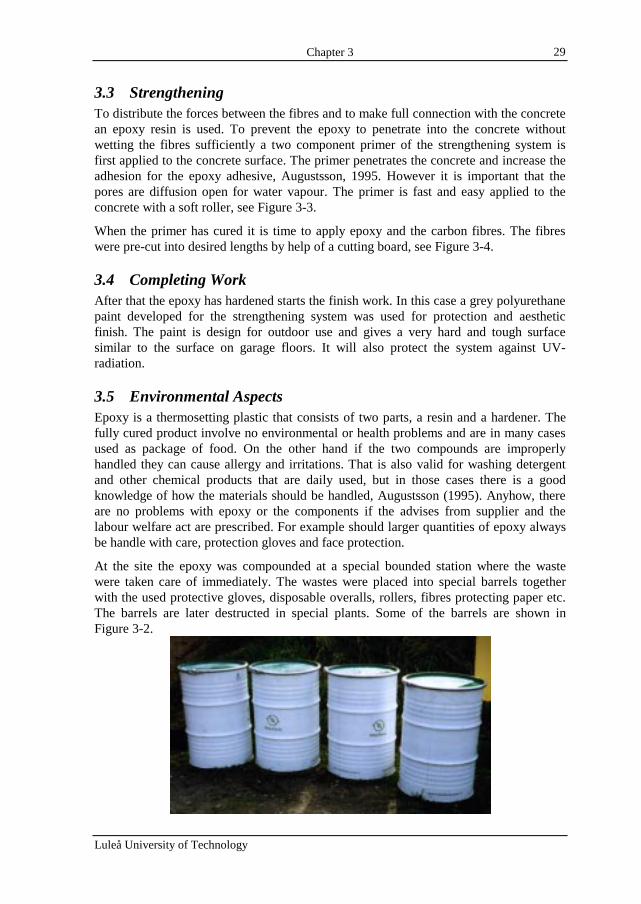
At the site the epoxy was compounded at a special bounded station where the wastewere taken care of immediately. The wastes were placed into special barrels togetherwith the used protective gloves, disposable overalls, rollers, fibres protecting paper etc.The barrels are later destructed in special plants. Some of the barrels are shown inFigure 3-2.
Chapter 3
Luleå University of Technology
30
Figure 3-2 Barrels for waste with epoxy content
Figure 3-3 Application of primer to the clean and smooth concrete surface
Figure 3-4 Cutting of carbon fibre sheets
Chapter 3
Luleå University of Technology
31
3.6 Control of the Strengthening WorkThe reaction of the epoxy will not be satisfactory if the temperature is too low or if therelative humidity is too high. Both relative humidities in the air and in the concrete havecertain critical levels. The demands that must be full filled are, Augustsson (1995):
• The relative humidity on the concrete surface must not be over 80 % at time forapplication of primer, epoxy and paint
• The temperature in the air must be at least 3 °C over actual dew point
• Temperature in the air should not be below 10 °C.
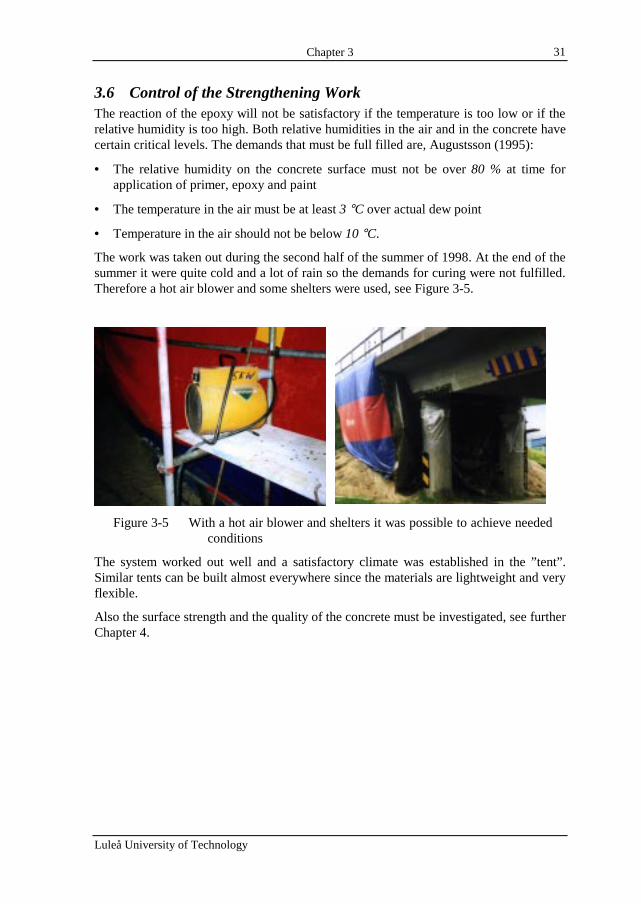
The work was taken out during the second half of the summer of 1998. At the end of thesummer it were quite cold and a lot of rain so the demands for curing were not fulfilled.Therefore a hot air blower and some shelters were used, see Figure 3-5.
Figure 3-5 With a hot air blower and shelters it was possible to achieve neededconditions
The system worked out well and a satisfactory climate was established in the ”tent”.Similar tents can be built almost everywhere since the materials are lightweight and veryflexible.
Also the surface strength and the quality of the concrete must be investigated, see furtherChapter 4.
Chapter 4
Luleå University of Technology
32
4 MEASUREMENTS AND CONDITION OF THE BRIDGEMeasurements of deformations and strains have been undertaken on the bridge beforeand after strengthening. Also the loads on the bridge are measured. Measurements areessential for the evaluation of the strengthening effect. Also an investigation of the crackpattern, the concrete quality and the surface strength of the concrete has been made.
4.1 GeneralWhen a construction is changed, for example, by means of strengthening is it importantto know in which way the modification will effect the whole structure. Of this reason itis very motivated to do measurements on the construction. The purpose of thesemeasurements in this particular case is to investigate the function of the carboncomposite, the structural function of the strengthened bridge and that the strengtheningeffects are achieved.
The best way to investigate whether the strengthening work gives the desired effect is todo measurements before and after the bonding of the strengthening material. Bothstrains and deformations are registered when trains are passing the bridge. Stresses inthe concrete can be calculated from strains if the Young’s module of the concrete isknown. The strain measurements also serve as a guide to the level of composite actionbetween concrete and carbon fibre composite. Deformation measurements are necessaryfor structural understanding of the bridge and they also contribute with information ofthe strengthening effect.
It is also important to know the material quality of the structure. Of that reason it isimportant to test the concrete. Also the structural condition of the bridge can have animportant role for the strengthening effect. Cracks and other damages should thereforebe documented.
4.2 Survey of CracksWhen a bridge is going to be modified it is necessary to analyse the condition of thebridge. As many as possible of the parameters that can effect the strengthening resultshould be ensured. This is because old defects can be reasons to phenomena that canoccur in the future for the strengthened structure. One important thing can be cracks inthe concrete from the time before strengthening. Therefore a survey of cracks had beenmade. Since most of the strengthening is at the bottom face of the bridge most effort hadbeen done at mapping that area. The cracks had only been detected visibly with thenaked eye and position has been estimated approximately. No crack widths had beenmeasured because it was hard to get close enough without scaffolding. Some crackswere not visible before the sand blasting was completed. However after sand blasting itwas hard to estimate the width of the cracks because the sandblasting rounded off theedges of the cracks. All the detected cracks are shown in Figure 4-1.

Chapter 4
Luleå University of Technology
Figure 4-1 Survey of cracks. ”Bdn” and ”Lle” stand for Boden respectively Luleå end of the bridge. The last figure shows the bridgefrom underneath
Chapter 4
Luleå University of Technology
33
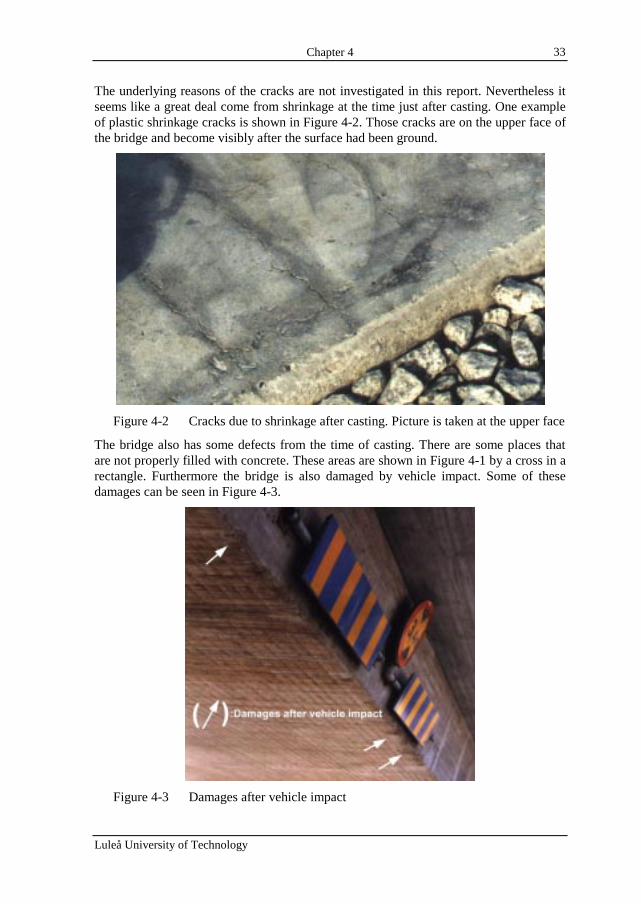
The underlying reasons of the cracks are not investigated in this report. Nevertheless itseems like a great deal come from shrinkage at the time just after casting. One exampleof plastic shrinkage cracks is shown in Figure 4-2. Those cracks are on the upper face ofthe bridge and become visibly after the surface had been ground.
Figure 4-2 Cracks due to shrinkage after casting. Picture is taken at the upper face
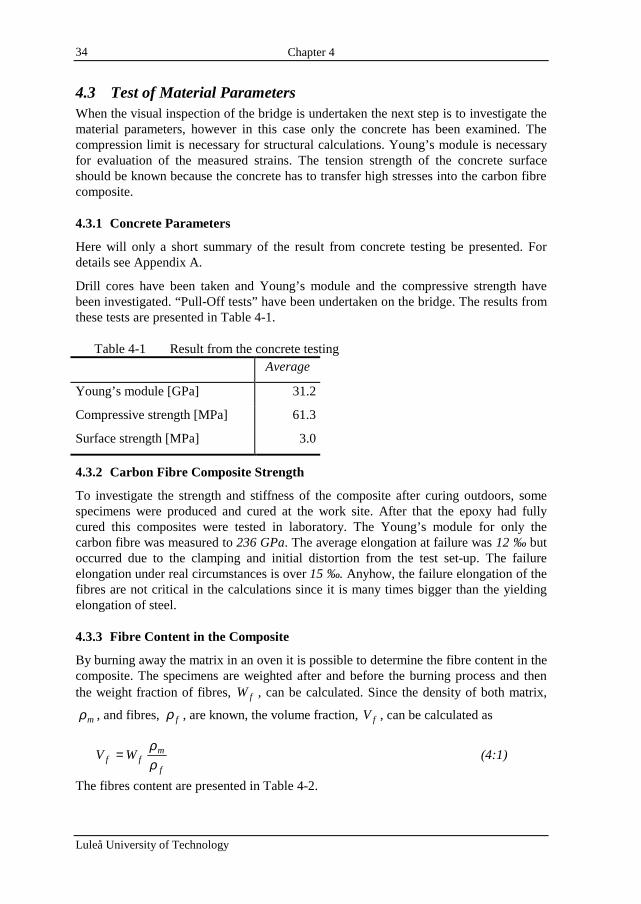
The bridge also has some defects from the time of casting. There are some places thatare not properly filled with concrete. These areas are shown in Figure 4-1 by a cross in arectangle. Furthermore the bridge is also damaged by vehicle impact. Some of thesedamages can be seen in Figure 4-3.
Figure 4-3 Damages after vehicle impact
Chapter 4
Luleå University of Technology
34
4.3 Test of Material ParametersWhen the visual inspection of the bridge is undertaken the next step is to investigate thematerial parameters, however in this case only the concrete has been examined. Thecompression limit is necessary for structural calculations. Young’s module is necessaryfor evaluation of the measured strains. The tension strength of the concrete surfaceshould be known because the concrete has to transfer high stresses into the carbon fibrecomposite.
4.3.1 Concrete Parameters
Here will only a short summary of the result from concrete testing be presented. Fordetails see Appendix A.
Drill cores have been taken and Young’s module and the compressive strength havebeen investigated. “Pull-Off tests” have been undertaken on the bridge. The results fromthese tests are presented in Table 4-1.
Table 4-1 Result from the concrete testingAverage
Young’s module [GPa] 31.2
Compressive strength [MPa] 61.3
Surface strength [MPa] 3.0
4.3.2 Carbon Fibre Composite Strength
To investigate the strength and stiffness of the composite after curing outdoors, somespecimens were produced and cured at the work site. After that the epoxy had fullycured this composites were tested in laboratory. The Young’s module for only thecarbon fibre was measured to 236 GPa. The average elongation at failure was 12 ‰ butoccurred due to the clamping and initial distortion from the test set-up. The failureelongation under real circumstances is over 15 ‰. Anyhow, the failure elongation of thefibres are not critical in the calculations since it is many times bigger than the yieldingelongation of steel.
4.3.3 Fibre Content in the Composite
By burning away the matrix in an oven it is possible to determine the fibre content in thecomposite. The specimens are weighted after and before the burning process and thenthe weight fraction of fibres, fW , can be calculated. Since the density of both matrix,
mρ , and fibres, fρ , are known, the volume fraction, fV , can be calculated as
f
mff WV
ρρ
= (4:1)
The fibres content are presented in Table 4-2.
Chapter 4
Luleå University of Technology
35
Table 4-2 Fibre content out of four samples from each fibre sheet typeFibre sheet type [gr/m2] 200 300 Average
Weight fraction [%] 39 43
Volume fraction [%] 34 38 36
4.4 Strains and DeformationsAn extensive program of measurement has been performed on the bridge. Both strainsand deformations have been measured. A quite large system of steel beams was mountedon the top of the columns under the bridge. This was done to support the deformationgauges and minimise the interference from ground movement and column deformations.Due to resonance the beams needed to be considerable large. To ensure themeasurements they are carried out for different train speeds. Different trains can becompared because the mass of each wagon is known. All work is done to avoidresonance in the measurement equipment and in the bridge itself.
For comparison measurements have been undertaken before and after strengthening. Theregistered values of strains should not be taken as absolute values. They should insteadbe used in a comparison between values before respectively after strengthening.
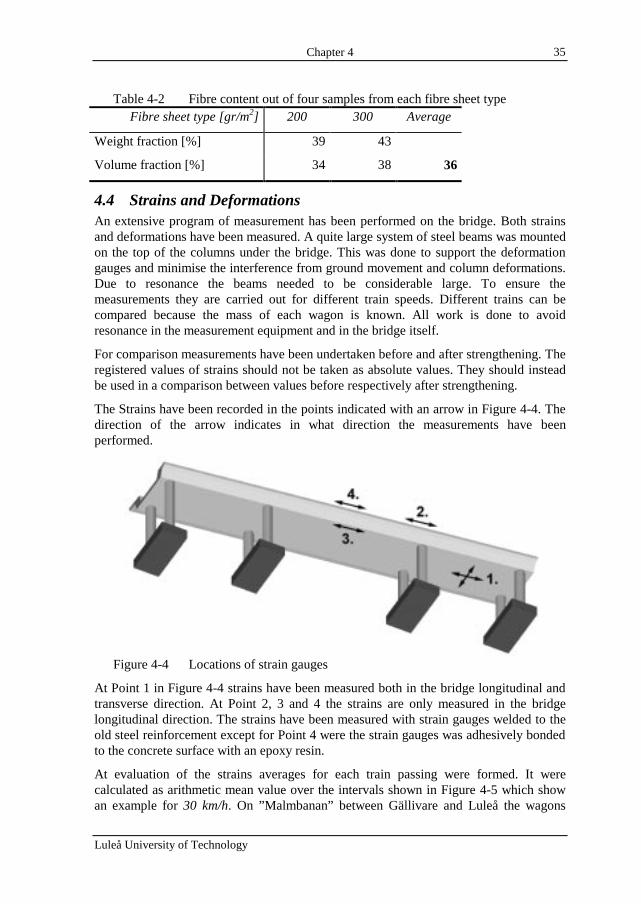
The Strains have been recorded in the points indicated with an arrow in Figure 4-4. Thedirection of the arrow indicates in what direction the measurements have beenperformed.
Figure 4-4 Locations of strain gauges
At Point 1 in Figure 4-4 strains have been measured both in the bridge longitudinal andtransverse direction. At Point 2, 3 and 4 the strains are only measured in the bridgelongitudinal direction. The strains have been measured with strain gauges welded to theold steel reinforcement except for Point 4 were the strain gauges was adhesively bondedto the concrete surface with an epoxy resin.
At evaluation of the strains averages for each train passing were formed. It werecalculated as arithmetic mean value over the intervals shown in Figure 4-5 which showan example for 30 km/h. On ”Malmbanan” between Gällivare and Luleå the wagons
Chapter 4
Luleå University of Technology
36
chassis are almost identical. The divergences between single wagon baskets areinsignificant in most cases and will in extreme cases not affect the average because thelarge amount of measured wagons in each train.
Figure 4-5 Method for calculating average strains
The switchback that is shown in the figures comes from that each wagon is representedas a pair of a dip and a top. The small registering at the beginning of each train set is thelocomotive that runs over the bridge. The discontinuous parts of the graphs are due tothe used equipment and should not be seemed as a perplexity. The measure wasnecessary to achieve desired accuracy.
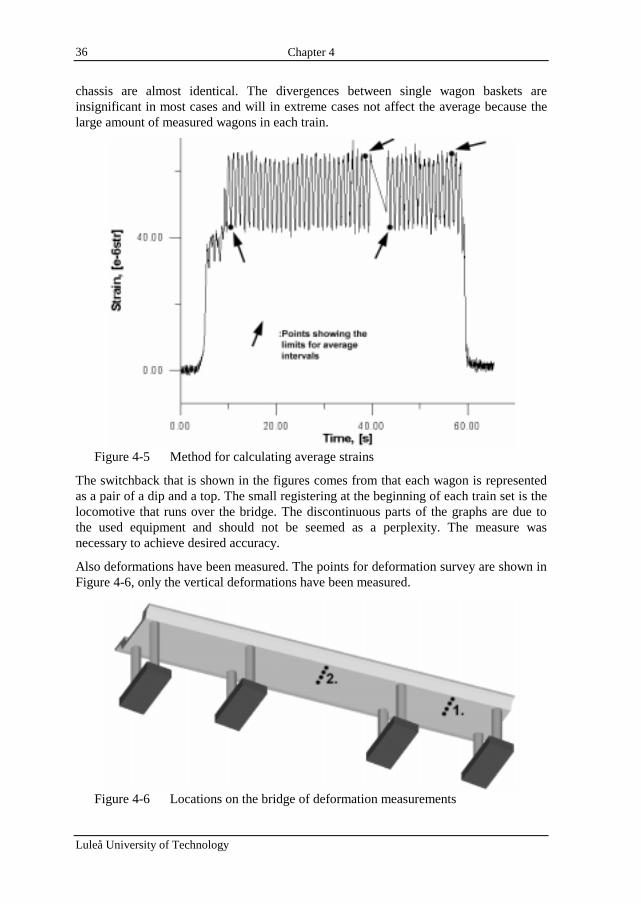
Also deformations have been measured. The points for deformation survey are shown inFigure 4-6, only the vertical deformations have been measured.
Figure 4-6 Locations on the bridge of deformation measurements
Chapter 4
Luleå University of Technology
37
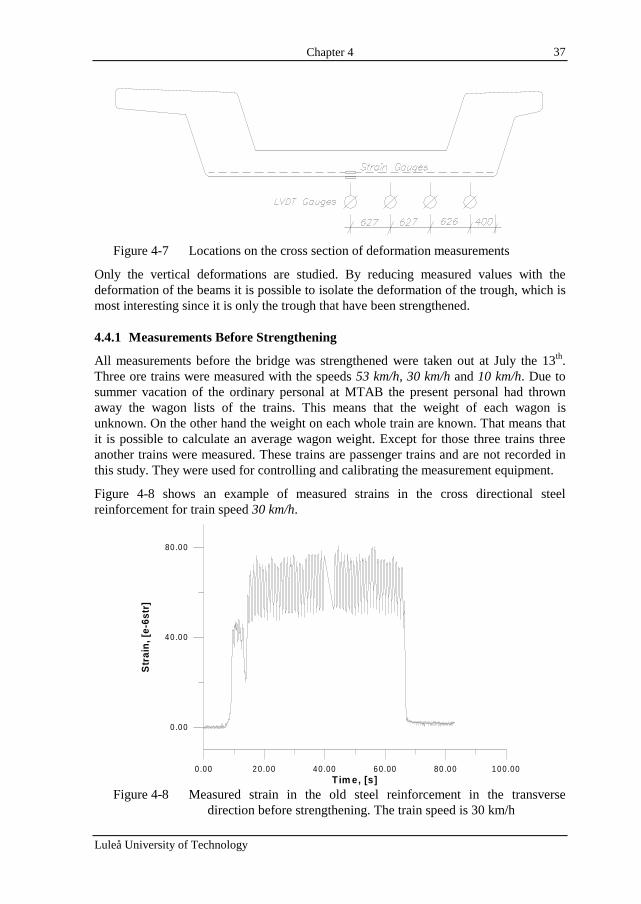
Figure 4-7 Locations on the cross section of deformation measurements
Only the vertical deformations are studied. By reducing measured values with thedeformation of the beams it is possible to isolate the deformation of the trough, which ismost interesting since it is only the trough that have been strengthened.
4.4.1 Measurements Before Strengthening
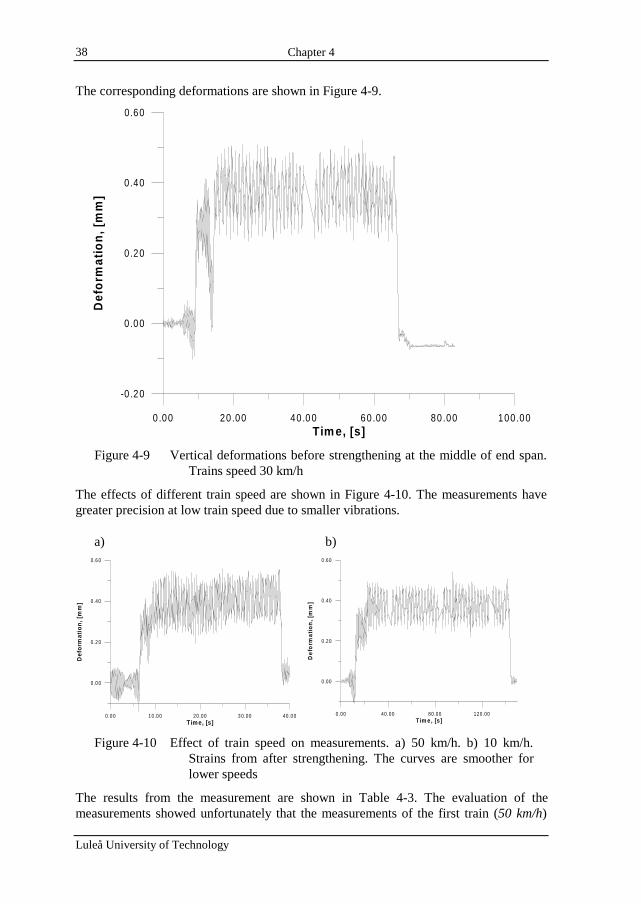
All measurements before the bridge was strengthened were taken out at July the 13th.Three ore trains were measured with the speeds 53 km/h, 30 km/h and 10 km/h. Due tosummer vacation of the ordinary personal at MTAB the present personal had thrownaway the wagon lists of the trains. This means that the weight of each wagon isunknown. On the other hand the weight on each whole train are known. That means thatit is possible to calculate an average wagon weight. Except for those three trains threeanother trains were measured. These trains are passenger trains and are not recorded inthis study. They were used for controlling and calibrating the measurement equipment.
Figure 4-8 shows an example of measured strains in the cross directional steelreinforcement for train speed 30 km/h.
0.00 20.00 40 .00 60.00 80 .00 100.00Tim e, [s ]
0 .00
40 .00
80 .00
Str
ain,
[e-6
str]
Figure 4-8 Measured strain in the old steel reinforcement in the transversedirection before strengthening. The train speed is 30 km/h
Chapter 4
Luleå University of Technology
38
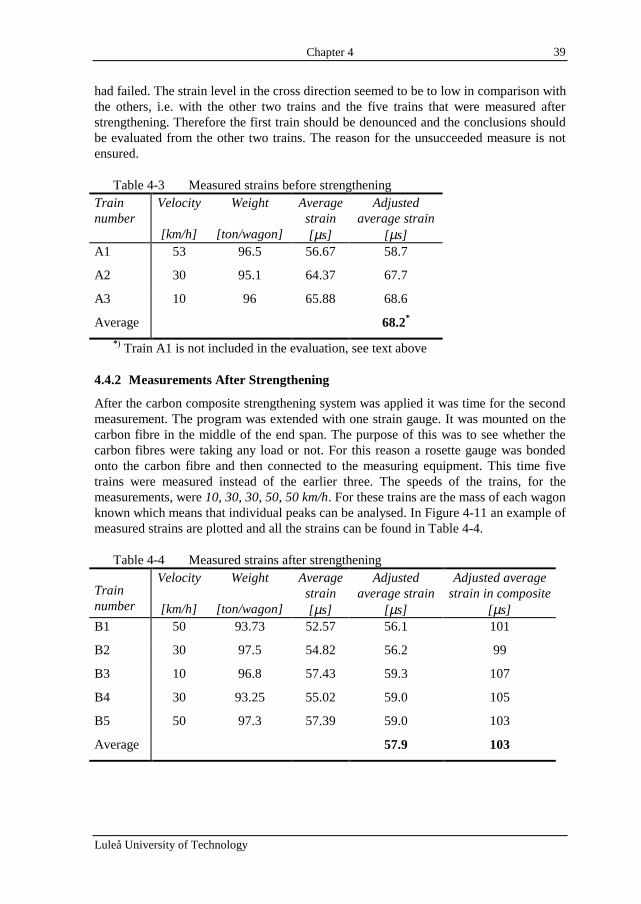
The corresponding deformations are shown in Figure 4-9.
0.00 20.00 40.0 0 60.00 80.00 100.00Tim e, [s]
-0 .20
0 .00
0 .20
0 .40
0.60D
efor
mat
ion,
[mm
]
Figure 4-9 Vertical deformations before strengthening at the middle of end span.Trains speed 30 km/h
The effects of different train speed are shown in Figure 4-10. The measurements havegreater precision at low train speed due to smaller vibrations.
a)
0.0 0 10 .0 0 20.00 3 0.00 40.0 0Tim e, [s]
0 .0 0
0 .2 0
0 .40
0 .6 0
Def
orm
atio
n, [m
m]
b)
0.00 40.00 80.00 120.00Tim e, [s ]
0.00
0 .20
0 .40
0 .60
Def
orm
atio
n, [m
m]
Figure 4-10 Effect of train speed on measurements. a) 50 km/h. b) 10 km/h.Strains from after strengthening. The curves are smoother forlower speeds
The results from the measurement are shown in Table 4-3. The evaluation of themeasurements showed unfortunately that the measurements of the first train (50 km/h)
Chapter 4
Luleå University of Technology
39
had failed. The strain level in the cross direction seemed to be to low in comparison withthe others, i.e. with the other two trains and the five trains that were measured afterstrengthening. Therefore the first train should be denounced and the conclusions shouldbe evaluated from the other two trains. The reason for the unsucceeded measure is notensured.
Table 4-3 Measured strains before strengtheningTrainnumber
Velocity
[km/h]
Weight
[ton/wagon]
Averagestrain[µs]
Adjustedaverage strain
[µs]A1 53 96.5 56.67 58.7
A2 30 95.1 64.37 67.7
A3 10 96 65.88 68.6
Average 68.2*
* ) Train A1 is not included in the evaluation, see text above
4.4.2 Measurements After Strengthening
After the carbon composite strengthening system was applied it was time for the secondmeasurement. The program was extended with one strain gauge. It was mounted on thecarbon fibre in the middle of the end span. The purpose of this was to see whether thecarbon fibres were taking any load or not. For this reason a rosette gauge was bondedonto the carbon fibre and then connected to the measuring equipment. This time fivetrains were measured instead of the earlier three. The speeds of the trains, for themeasurements, were 10, 30, 30, 50, 50 km/h. For these trains are the mass of each wagonknown which means that individual peaks can be analysed. In Figure 4-11 an example ofmeasured strains are plotted and all the strains can be found in Table 4-4.
Table 4-4 Measured strains after strengthening
Trainnumber
Velocity
[km/h]
Weight
[ton/wagon]
Averagestrain[µs]
Adjustedaverage strain
[µs]
Adjusted averagestrain in composite
[µs]B1 50 93.73 52.57 56.1 101
B2 30 97.5 54.82 56.2 99
B3 10 96.8 57.43 59.3 107
B4 30 93.25 55.02 59.0 105
B5 50 97.3 57.39 59.0 103
Average 57.9 103
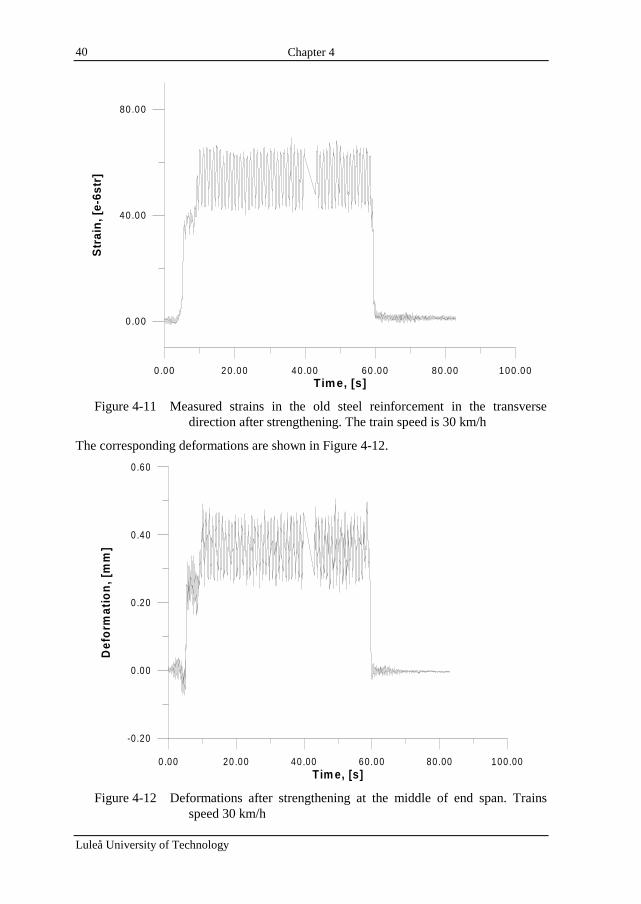
Chapter 4
Luleå University of Technology
40
0.00 20.00 40.00 60.00 80.00 100.00Tim e, [s]
0.00
40.00
80.00S
trai
n, [e
-6st
r]
Figure 4-11 Measured strains in the old steel reinforcement in the transversedirection after strengthening. The train speed is 30 km/h
The corresponding deformations are shown in Figure 4-12.
0 .00 20 .00 40 .00 60.00 80 .00 100.00Tim e, [s]
-0 .20
0 .00
0 .20
0 .40
0 .60
Def
orm
atio
n, [m
m]
Figure 4-12 Deformations after strengthening at the middle of end span. Trainsspeed 30 km/h
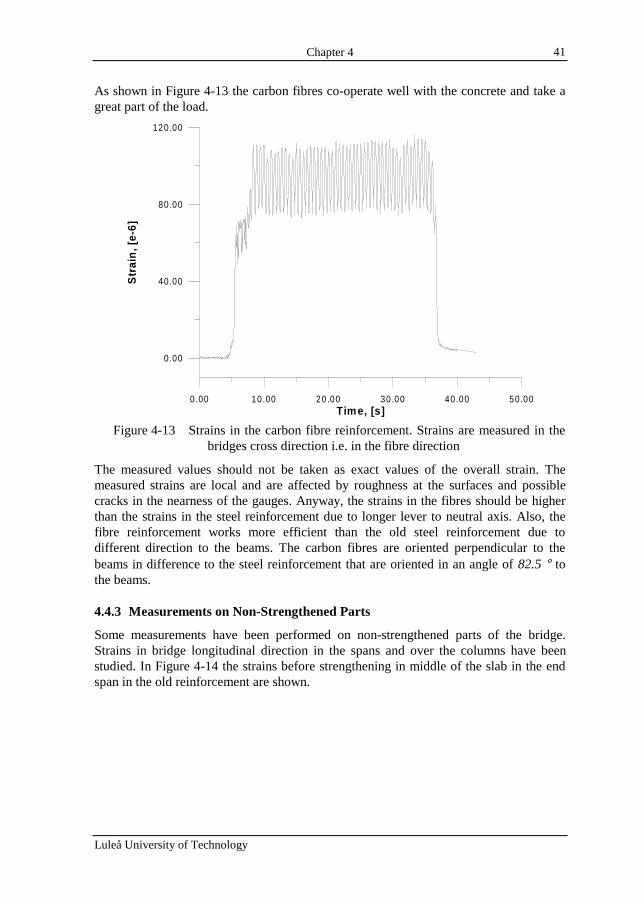
Chapter 4
Luleå University of Technology
41
As shown in Figure 4-13 the carbon fibres co-operate well with the concrete and take agreat part of the load.
0.00 10.00 20.00 30.00 40.00 50.00Time, [s]
0.00
40.00
80.00
120.00S
trai
n, [e
-6]
Figure 4-13 Strains in the carbon fibre reinforcement. Strains are measured in thebridges cross direction i.e. in the fibre direction
The measured values should not be taken as exact values of the overall strain. Themeasured strains are local and are affected by roughness at the surfaces and possiblecracks in the nearness of the gauges. Anyway, the strains in the fibres should be higherthan the strains in the steel reinforcement due to longer lever to neutral axis. Also, thefibre reinforcement works more efficient than the old steel reinforcement due todifferent direction to the beams. The carbon fibres are oriented perpendicular to thebeams in difference to the steel reinforcement that are oriented in an angle of 82.5 ° tothe beams.
4.4.3 Measurements on Non-Strengthened Parts
Some measurements have been performed on non-strengthened parts of the bridge.Strains in bridge longitudinal direction in the spans and over the columns have beenstudied. In Figure 4-14 the strains before strengthening in middle of the slab in the endspan in the old reinforcement are shown.
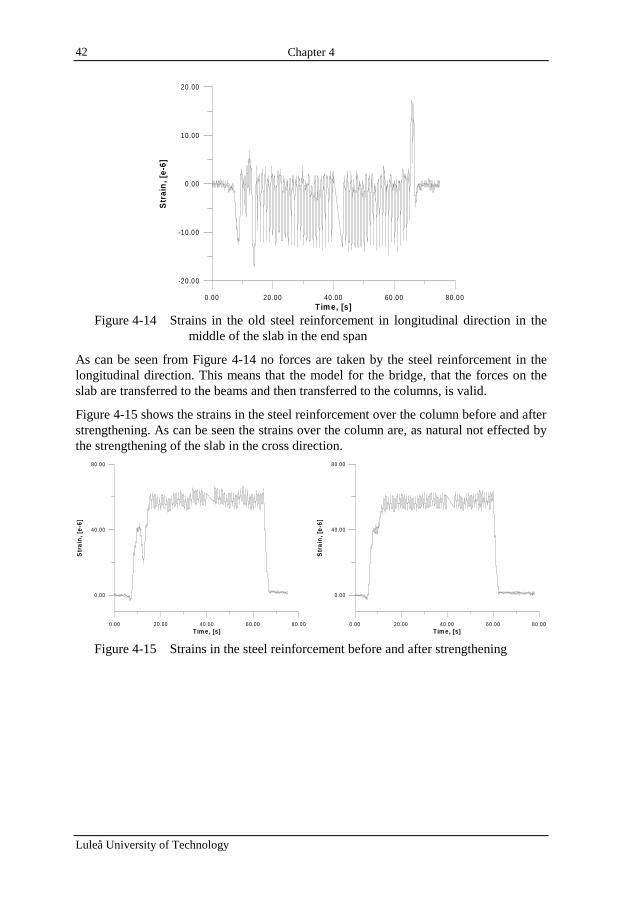
Chapter 4
Luleå University of Technology
42
0 .00 20.00 40.00 60 .00 80.00Time, [s]
-20.00
-10.00
0.00
10.00
20.00
Str
ain
, [e-
6]
Figure 4-14 Strains in the old steel reinforcement in longitudinal direction in themiddle of the slab in the end span
As can be seen from Figure 4-14 no forces are taken by the steel reinforcement in thelongitudinal direction. This means that the model for the bridge, that the forces on theslab are transferred to the beams and then transferred to the columns, is valid.
Figure 4-15 shows the strains in the steel reinforcement over the column before and afterstrengthening. As can be seen the strains over the column are, as natural not effected bythe strengthening of the slab in the cross direction.
0.00 20.00 40.00 60.00 80.00Tim e, [s]
0.00
40.00
80.00
Str
ain,
[e-6
]
0.00 20.00 40.00 60.00 80.00Tim e, [s]
0.00
40.00
80.00
Str
ain,
[e-6
]
Figure 4-15 Strains in the steel reinforcement before and after strengthening
Chapter 5
Luleå University of Technology
43
5 COMPARISON BETWEEN THEORY AND TEST
5.1 GeneralThe results from the measurements look good overall. The stiffness of the bridge in thestudied cross section has been increased substantially for such a relatively smallstrengthening of the structure that was made, only approximately 0.8 mm carbon fibrecomposite was used in the cross direction on the tension side of the slab.
In the test the bridge has been loaded with iron ore trains passing the bridge at differentspeeds, 10, 30 and 50 km/h. The approximately load of the whole train set was 5 000tons, or 100 tons per wagon. At lower speeds the gathering measuring values from thestrains- and deformation gauges were most stable.
Nevertheless, it is not easy to compare the theoretical calculations of the strain levelsand the deformations with the ones measured from the test. The reasons for this aremany. One such reason is the degree of clamping in the primary load bearing beams.Another reason is the difficulties to distribute the axial load from the iron ore traincorrectly. A third reason is the difficulty to calculate the moment of inertia. Here thecontribution from concrete that is not fully cracked will have a big influence of theresult.
The comparison emphasises therefore mainly on the differences of the strain levels anddeformations before and after strengthening. Even though measurements have beentaken on many locations on the bridge, in this report the evaluation of the test results islimited for the slab in the cross direction. The reason for this on the whole that themeasurements taken in the longitudinal direction didn’t show any significant differencesbefore and after strengthening depending on the fact that no carbon fibres were placed inthis direction.
5.2 Results from TestsThe bridge is mainly strengthened in the cross direction and also most of themeasurements were undertaken in this direction. Of that reason is that most interesting tostudy the changes before and after strengthening in the cross direction. To clarify thepresentation only typical results from the test are presented in this section, the rest of thesampled results in the cross direction of the bridge are placed together in Appendix B.
The effect on strain levels in the existing steel reinforcement due to strengthening wasconsiderably. At a mean level a decrease in strain level of 15 % could be noticed in theinternal steel reinforcement. When it comes to the deflections almost a 16 % decrease indeflection could be observed.
The deformations before and after strengthening are presented in Table 5-1. Thedeflection values presented are the one for the train speed 10 km/h, adjusted for differentweights.
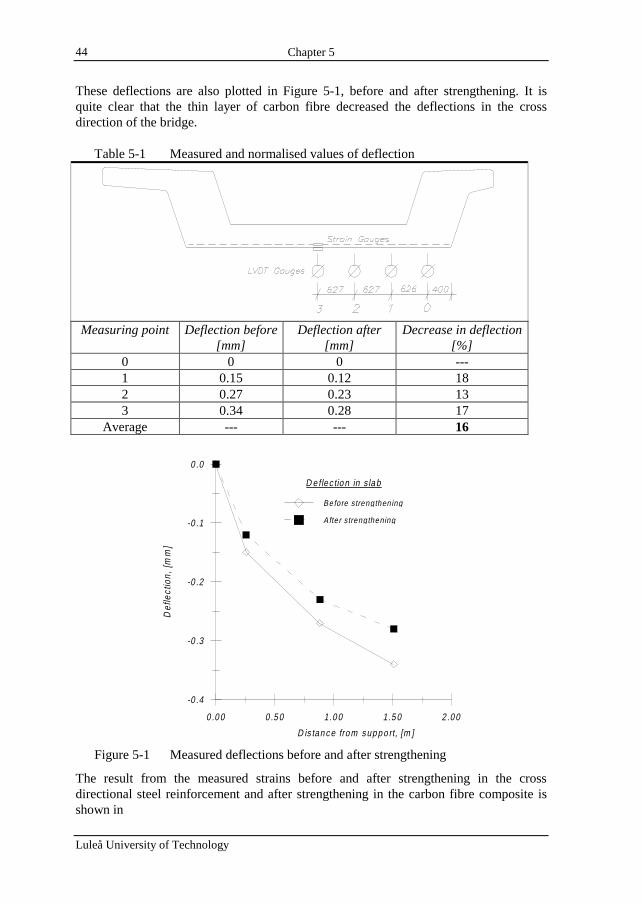
Chapter 5
Luleå University of Technology
44
These deflections are also plotted in Figure 5-1, before and after strengthening. It isquite clear that the thin layer of carbon fibre decreased the deflections in the crossdirection of the bridge.
Table 5-1 Measured and normalised values of deflection
Measuring point Deflection before[mm]
Deflection after[mm]
Decrease in deflection[%]
0 0 0 ---1 0.15 0.12 182 0.27 0.23 133 0.34 0.28 17
Average --- --- 16
0 .0 0 0 .5 0 1 .0 0 1 .5 0 2 .0 0
-0 .4
-0 .3
-0 .2
-0 .1
0 .0
Def
lect
ion,
[mm
]
D is tan c e fro m s up p o rt, [m ]
D e flec tio n in s la b
Be fore strengthening
After strengthening
Figure 5-1 Measured deflections before and after strengthening
The result from the measured strains before and after strengthening in the crossdirectional steel reinforcement and after strengthening in the carbon fibre composite isshown in
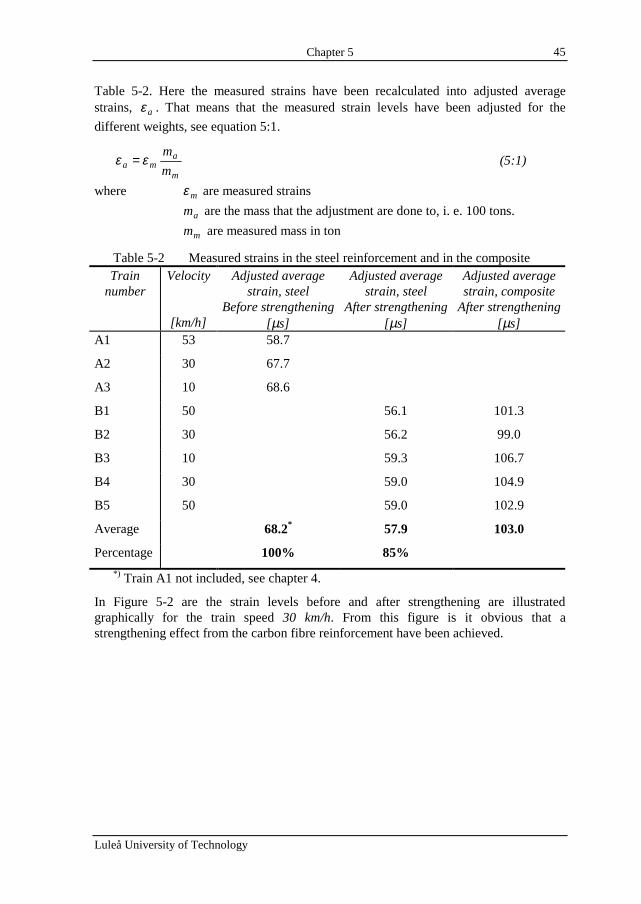
Chapter 5
Luleå University of Technology
45
Table 5-2. Here the measured strains have been recalculated into adjusted averagestrains, aε . That means that the measured strain levels have been adjusted for the
different weights, see equation 5:1.
m
ama m
mεε = (5:1)
where mε are measured strains
am are the mass that the adjustment are done to, i. e. 100 tons.
mm are measured mass in ton
Table 5-2 Measured strains in the steel reinforcement and in the compositeTrain
numberVelocity
[km/h]
Adjusted averagestrain, steel
Before strengthening[µs]
Adjusted averagestrain, steel
After strengthening[µs]
Adjusted averagestrain, composite
After strengthening[µs]
A1 53 58.7
A2 30 67.7
A3 10 68.6
B1 50 56.1 101.3
B2 30 56.2 99.0
B3 10 59.3 106.7
B4 30 59.0 104.9
B5 50 59.0 102.9
Average 68.2* 57.9 103.0
Percentage 100% 85%
*) Train A1 not included, see chapter 4.
In Figure 5-2 are the strain levels before and after strengthening are illustratedgraphically for the train speed 30 km/h. From this figure is it obvious that astrengthening effect from the carbon fibre reinforcement have been achieved.
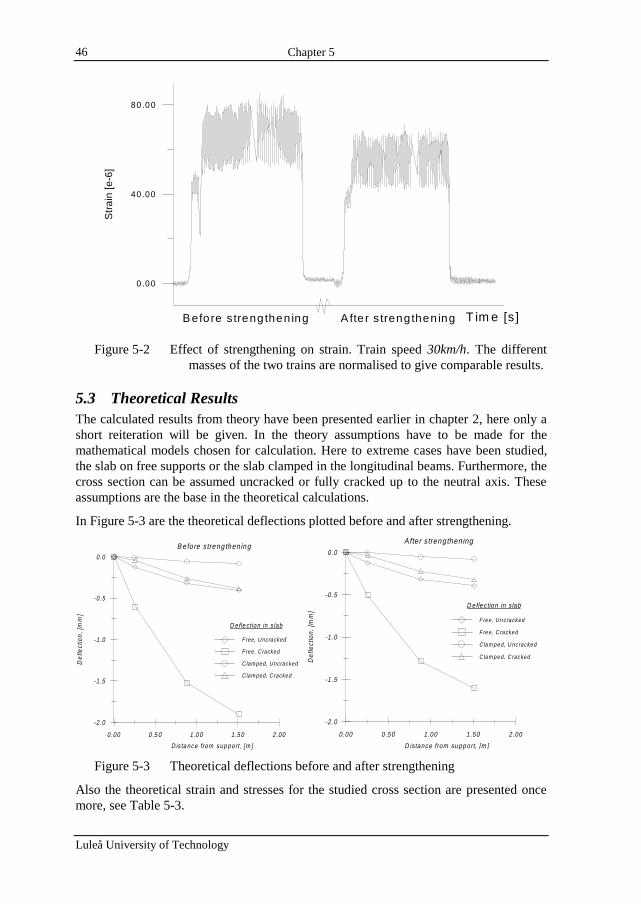
Chapter 5
Luleå University of Technology
46
0 .00
40 .00
80 .00S
trai
n [e
-6]
T im e [s]Before strengthen ing A fte r s trengthen ing
Figure 5-2 Effect of strengthening on strain. Train speed 30km/h. The differentmasses of the two trains are normalised to give comparable results.
5.3 Theoretical ResultsThe calculated results from theory have been presented earlier in chapter 2, here only ashort reiteration will be given. In the theory assumptions have to be made for themathematical models chosen for calculation. Here to extreme cases have been studied,the slab on free supports or the slab clamped in the longitudinal beams. Furthermore, thecross section can be assumed uncracked or fully cracked up to the neutral axis. Theseassumptions are the base in the theoretical calculations.
In Figure 5-3 are the theoretical deflections plotted before and after strengthening.
0 .00 0 .5 0 1 .0 0 1 .5 0 2 .00
-2 .0
-1 .5
-1 .0
-0 .5
0 .0
Def
lect
ion,
[mm
]
D is ta nce from sup port, [m ]
D e fle c tion in s lab
Free, Uncracked
Free, Cracked
Clamped, Uncracked
Clamped, Cracked
B e fo re s treng then ing
0.00 0.50 1.00 1.50 2.00
-2 .0
-1 .5
-1 .0
-0 .5
0 .0
Def
lect
ion,
[mm
]
D istance from su pport, [m ]
D eflec tion in slab
F ree , U ncracked
F ree , C racked
C lam ped, U ncracked
C lam ped, C racked
A fte r s trengthen ing
Figure 5-3 Theoretical deflections before and after strengthening
Also the theoretical strain and stresses for the studied cross section are presented oncemore, see Table 5-3.
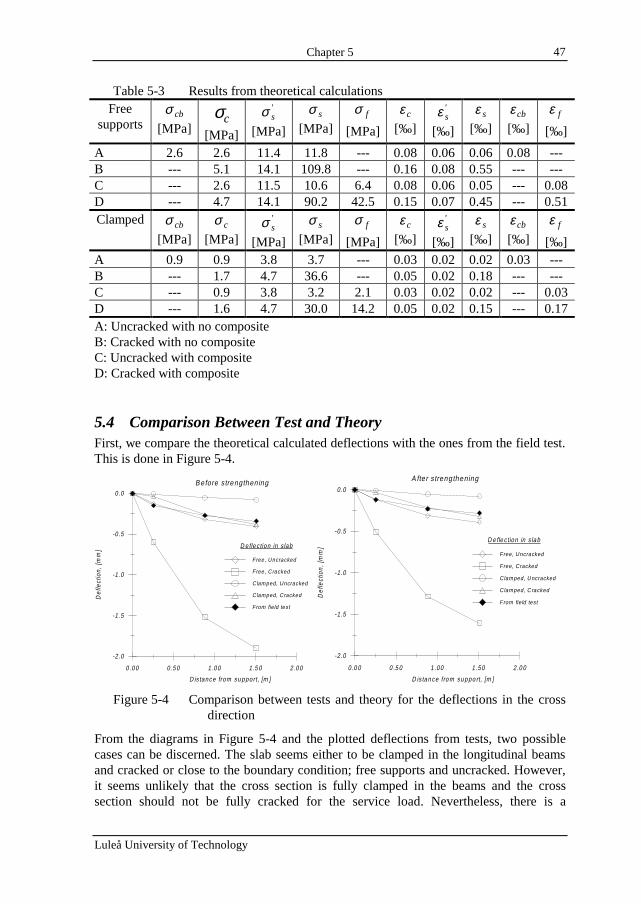
Chapter 5
Luleå University of Technology
47
Table 5-3 Results from theoretical calculationsFree
supportscbσ
[MPa]cσ
[MPa]
'sσ
[MPa]
sσ[MPa]
fσ[MPa]
cε[‰]
'sε
[‰]
sε[‰]
cbε[‰]
fε[‰]
A 2.6 2.6 11.4 11.8 --- 0.08 0.06 0.06 0.08 ---B --- 5.1 14.1 109.8 --- 0.16 0.08 0.55 --- ---C --- 2.6 11.5 10.6 6.4 0.08 0.06 0.05 --- 0.08D --- 4.7 14.1 90.2 42.5 0.15 0.07 0.45 --- 0.51Clamped cbσ
[MPa]cσ
[MPa]
'sσ
[MPa]
sσ[MPa]
fσ[MPa]
cε[‰]
'sε
[‰]
sε[‰]
cbε[‰]
fε[‰]
A 0.9 0.9 3.8 3.7 --- 0.03 0.02 0.02 0.03 ---B --- 1.7 4.7 36.6 --- 0.05 0.02 0.18 --- ---C --- 0.9 3.8 3.2 2.1 0.03 0.02 0.02 --- 0.03D --- 1.6 4.7 30.0 14.2 0.05 0.02 0.15 --- 0.17A: Uncracked with no compositeB: Cracked with no compositeC: Uncracked with compositeD: Cracked with composite
5.4 Comparison Between Test and TheoryFirst, we compare the theoretical calculated deflections with the ones from the field test.This is done in Figure 5-4.
0 .00 0 .50 1 .00 1 .5 0 2 .00
-2 .0
-1 .5
-1 .0
-0 .5
0 .0
Def
lect
ion,
[mm
]
D is tance from su pport, [m ]
D e flec tion in s lab
Free, Uncracked
Free, Cracked
Clamped, Uncracked
Clamped, Cracked
From field test
Be fore s trengthen ing
0 .0 0 0 .5 0 1 .00 1 .50 2 .0 0
-2 .0
-1 .5
-1 .0
-0 .5
0 .0
Def
lect
ion,
[mm
]
D is tan ce fro m su ppo rt, [m ]
D e fle c tion in s lab
Free, Uncracked
Free, Cracked
Clamped, U ncracked
Clamped, C racked
From fie ld test
A fte r s treng thening
Figure 5-4 Comparison between tests and theory for the deflections in the crossdirection
From the diagrams in Figure 5-4 and the plotted deflections from tests, two possiblecases can be discerned. The slab seems either to be clamped in the longitudinal beamsand cracked or close to the boundary condition; free supports and uncracked. However,it seems unlikely that the cross section is fully clamped in the beams and the crosssection should not be fully cracked for the service load. Nevertheless, there is a
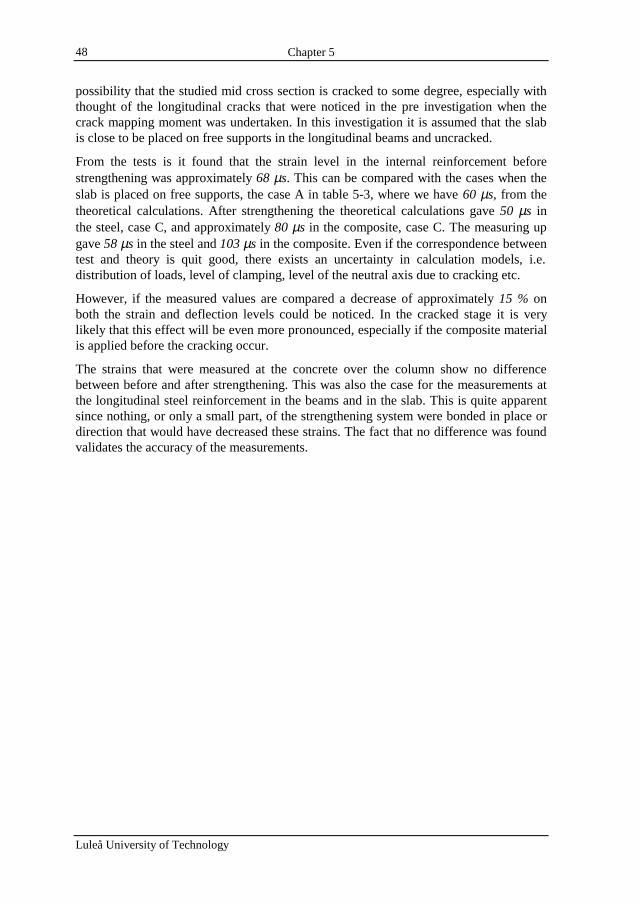
Chapter 5
Luleå University of Technology
48
possibility that the studied mid cross section is cracked to some degree, especially withthought of the longitudinal cracks that were noticed in the pre investigation when thecrack mapping moment was undertaken. In this investigation it is assumed that the slabis close to be placed on free supports in the longitudinal beams and uncracked.
From the tests is it found that the strain level in the internal reinforcement beforestrengthening was approximately 68 µs. This can be compared with the cases when theslab is placed on free supports, the case A in table 5-3, where we have 60 µs, from thetheoretical calculations. After strengthening the theoretical calculations gave 50 µs inthe steel, case C, and approximately 80 µs in the composite, case C. The measuring upgave 58 µs in the steel and 103 µs in the composite. Even if the correspondence betweentest and theory is quit good, there exists an uncertainty in calculation models, i.e.distribution of loads, level of clamping, level of the neutral axis due to cracking etc.
However, if the measured values are compared a decrease of approximately 15 % onboth the strain and deflection levels could be noticed. In the cracked stage it is verylikely that this effect will be even more pronounced, especially if the composite materialis applied before the cracking occur.
The strains that were measured at the concrete over the column show no differencebetween before and after strengthening. This was also the case for the measurements atthe longitudinal steel reinforcement in the beams and in the slab. This is quite apparentsince nothing, or only a small part, of the strengthening system were bonded in place ordirection that would have decreased these strains. The fact that no difference was foundvalidates the accuracy of the measurements.
Chapter 6
Luleå University of Technology
49
6 CONCLUSIONS
6.1 GeneralFrom the performed field test it is confirmed that it is fully possible to strengthenconcrete railroad trough bridges with carbon fibre composites.
Before the strengthening work can be performed an elaborate investigation of thestructure has to be undertaken. In this particular case the crack pattern has been mappedand the concrete strength tested. Removing the latiance layer of the concrete to uncoverthe aggregates started the strengthening work. The surface also needed a levelling andcleaning. This is an important moment in the strengthening work since to bigirregularities can reduce the strengthening effect. After this the carbon fibre sheets wereput in place. A finishing layer of protecting paint completed the strengthening work. Themost time consuming moment in the strengthening project was sandblasting andgrinding of the concrete surface. To make this method more effective this part needs tobe developed.
Parts of the strengthening work that can be critical if not given special attention are allthe works where the components for the thermosetting polymers are used. Here, a greatrespect has been given to handle these components in a professional and secure way. Allthe workers use disposable overalls and gloves together with prescribed safetyequipment. To avoid discharge of epoxy waste special barrels for collection were used.These barrels were then sent to destruction.
The strengthening work performed passed without any larger problems. However, it wasstopped for some days due to bad weather conditions and the pre-treatment of theconcrete surface was more time consuming than expected.
6.2 Field TestIn the field test, measurements of deflections and strains were done both before and afterstrengthening. The deflections were measured across the bridge. The strains weremeasured in the steel reinforcement across and along the bridge. Also the strain level inthe concrete was measured. After strengthening also the strain level across the bridge inthe composite was measured.
From the tests no differences before and after strengthening in the longitudinal directioncould be found.
Nevertheless, in the crosswise direction considerable differences both in deflection andstrain could be observed. A average level on 16 % reduction in deflection and 15 %reduction on the strain level at the internal reinforcement in the studied cross sectioncould be noticed and this only with 0.8 mm thickness of carbon fibre composite.
In this study the cross-section was assumed uncracked. In the case with a cracked crosssection the contribution from the carbon fibre composite will be substantially higher,especially in the case when the structure is uncracked before application of thecomposite material.
Finally, it was not necessary to close the bridge for whether car or train traffics duringstrengthening.

Luleå University of Technology
50
Chapter 7
Luleå University of Technology
51
7 FURTHER WORK
7.1 GeneralThe method of strengthening structures with carbon fibre is in focus of intensiveresearch all over the world. At Luleå University of Technology research in this area hasbeen going on since 1993. The fundamental knowledge has here been obtained fromtheoretical models in close connection to laboratory tests. Suitable carbon fibre fabricsand epoxy systems have been developed in collaboration with the manufacturers tocreate a strengthening system. Up to date most of the effort have been in investigatingthe major mechanical behaviour through half scale tests in bending, shear and torsionand to compare these results with theoretical models.
From these investigations, and from several field applications, have the suitability of themethod for strengthening purposes been shown. Nevertheless, there are still unsolvedquestions to be solved. Here can the influence of the curing process during fatigue beementioned and also the influence on the strengthening effect of the roughness of theconcrete surface. For example if bigger unevenness could be allowed money would besaved in the production process.
Another interesting application could be pre-stressed laminates for strengtheningpurposes, here anchorage systems and mechanical equipment for pre-stressing must bedeveloped.
Below are three short suggestions for further studies presented.
7.2 Fatigue Load During CuringWhen a bridge is strengthened it is preferable if the traffic can run without any changes.When the bridge at the underpass for Kallkällevägen was strengthened the railroadtraffic were going on as usual. Even the traffic under the bridge went on as usual exceptfor some shorter periods when one lane was closed. Anyway the effect of dynamic loads,such as traffic, during curing should be investigated to document the effect.
7.3 Roughness of Concrete SurfaceWhen the bridge at Kallkällan was strengthened a large amount of work were consumedat making the surface smooth. Money can probably be saved if it is clear how rough thesurface can be without loosing any strengthening effect from the composite.

Chapter 7
Luleå University of Technology
52
7.4 Pre-Stressing of Carbon Fibre LaminatesTo increase the number of different applications where carbon fibre composites could beused it would be interesting to investigate the possibility to use pre-stressing in thelaminate as a complement. Here the compressive force from the pre-stressing wouldincrease the shear capacity as well as decrease the effect of the dead load.
Here, special devices for the pre-stressing force and anchorage needs to be developed aswell as theoretical calculation models for design.
However, if this is possible the strengthen method would be even more suitable forstrengthening, especially for structures that needs to be unloaded due to for example thedead load.
References
Luleå University of Technology
53
REFERENCESAgarwal B.D. and Broutman L.J., 1990, “Analysis and Performance of Fibre
Composites”, John Wiley & Sons Inc., ISBN 0-471-51152-8, 1990, p 449.Augustsson, Curt. (1995), Nils Malmgren AB ”NM Epoxi handbok”, Rollsbo: Tryck &
Reklam AB, In Swedish.B1634-1, (1965), Blueprint, “Vägport för Kallkällevägen Bandelen Boden-Luleå
KM1177+969 –Huvudritning” Stockholm, Kungliga järnvägs-styrelsen.B1634-2, (1966), Blueprint, “Vägport för Kallkällevägen Bandelen Boden-Luleå
KM1177+969 –Mått, Grunden” Stockholm, Kungliga järnvägs-styrelsen.B1634-3, (1966), Blueprint, “Vägport för Kallkällevägen Bandelen Boden-Luleå
KM1177+969 –Mått, Överbyggnaden” Stockholm, Kungliga järnvägs-styrelsen.B1634-5, (1966), Blueprint, “Vägport för Kallkällevägen Bandelen Boden-Luleå
KM1177+969 –Armering, Huvudarmering i balkar” Stockholm, Kungligajärnvägs-styrelsen.
B1634-6, (1966), Blueprint, “Vägport för Kallkällevägen Bandelen Boden-LuleåKM1177+969 –Armering, Brobaneplattan” Stockholm, Kungliga järnvägs-styrelsen.
Banverket, (1996), “30 ton på malmbanan”, Banverket: Luleå.Bresson J., (1971), “Nouvelles reshershes et applications concernant lútilisation des
collages dan les structures”, Beton plaque annales de línstitute technicue, No.278, 1971.
BST Byggstandardiseringen ”Betongprovning med svensk standard”, 1991, BST Hb126th Edition. Lidköping: Grunditz & Forsberg tryckeri ab, ISBN 91-7162-325-6.In Swedish.
Busel J. P. and Barno D., (1996), ”Composites Extend the Life of Concrete Structures”,Composites Design & Application, Winter, 1996, pp 12-14.
Carolin A. (1999), “Improvement of Load-Bearing Capacity of Existing Bridges-Litterature review”, Luleå: Luleå University of Technology. ISSN 1402-1532.
Deuring M., (1993), ”Verstärken von Stahlbeton mit gespanntenFaserverbundwerkstoffen”, Abhandlung zur Erlangung des Titles Doktor derTechnischen Wissenschaften der Eidgenössischen Technischen HochschuleZürich, 1993, p 279.
Dussek I.J., (1974), “Strengthening of bridge beams and similar structures by means ofepoxy-resin-bonded external reinforcement”, Transport and research record 785,Whasington, USA, 1974, pp 21-24.
L´Hermite, (1967), “Lápplication des colles et resines dans la construction”, La betonga coffrage portant, Annales línstitute technique, No. 239, 1967.
Iyer S.L., Sivaramakrishnan C. and Amaram S., (1989), “Testing of reinforced concretebridges for external reinforcement”, Proceedings Relating to StructuralMaterials, Structures Conference, ASCE New York, May 1989, pp 116-122.
References
Luleå University of Technology
54
Jasienko J. and Leszczynski J., (1990), “Examination of ferro-concrete beamsstrengthen with externally bonded reinforcement in compressed zone”, Int.Seminar Structural Repairs/Strengthening by the Plate Bonding Technique,University of Sheffield, sept. 1990, p. 6.
Klaiber F.W., Dunker K.F., Wipf T.J. and Sanders JR W.W:, (1987), “Methods ofstrengthening existing highway bridges”, Transportation Research Board,Washington D.C., Sept. 1987, p. 16.
Ladner M. und Flueler P., (1974), “Versuche an Stahlbetonbauteilen mit geklebterArmierung”, Schweizerische Bauzeitung, Heft 19, Mai 1974, pp 9-16.
Lerchental H., (1967), “Bonded sheet metal reinforcement for concrete slabs”,Bullentin in RILEM, No. 37, December 1967, pp 263-269.
Meier U., Deuring M., Meier H. and Schwegler G.(1992), ”Strengthening of Structureswith CFRP laminates, Research and Applications in Switzerland”, AdvancedComposite Materials in Bridges and Structures, Proceedings ACMBS 1, des K.Neal and P. Labossière, Canadian Society for Civil Engineering, 1992, pp 243-251.
Nilsson, M., Ohlsson, U., Elfgren, L. (1998), ”Dimensionerande betonghållfasthet ibefintliga betongbroar” Luleå: Luleå University of Technology, Technicalreport. In Swedish. Under printing.
Noghabai, K. (1998), ”Effect on the performance of concrete structures” Luleå: LuleåUniversity of Technology, Doctoral Thesis 1998:21.
Palmer P.M., (1979), “Repair and maintenance of concrete bridges with particularreference to the use of epoxies”, Tech. Report No. 14, Main Roads Dept., Perth,Western Australia, august 1979.
Raithby K.D., (1980), “External strengthening of bridges with bonded steel plates”,Transport and road research laboratory, Report 612, Crowthorne, Berkshire,1980, p 21.
Swamy R.N. and Jones R., (1980), “Technical notes – Behaviour of plated reinforcedconcrete beams subjected to cyclic loading during glue hardening”, The int.Journal of Cement Composites, Vol. 2, No. 4, Nov. 1980, pp 741-755.
Telia, (1999), “Telefonkatalogen-Luleå”, Telia InfoMedia Reklam AB: Elanderstryckeri AB .
Täljsten B., (1990), “Förstärkning av betongkonstruktioner genom pålimning avstålplåtar” (Strengthening of concrete structures by bonded steel plates, InSwedish), Tekniska Högskolan i Luleå, Avdelningen för konstruktionsteknik,Licentiatuppsats 1990:06L, p 212.
Täljsten B., (1997), ”Strengthening of concrete structures for shear with bonded CFRP-fabrics”, Recent advances in bridge engineering, Advanced rehabilitation,durable materials, nondestructive evaluation and mangement, Eds. U. Meier andR. Bettid, Dubendorf July 1997, pp 57-64.
Täljsten B., (1999), ”Förstärkning av befintliga betongkonstruktioner med kolfiberväveller kolfiberlaminat”, Luleå: Luleå University of Technology. ISSN: 1402-1536
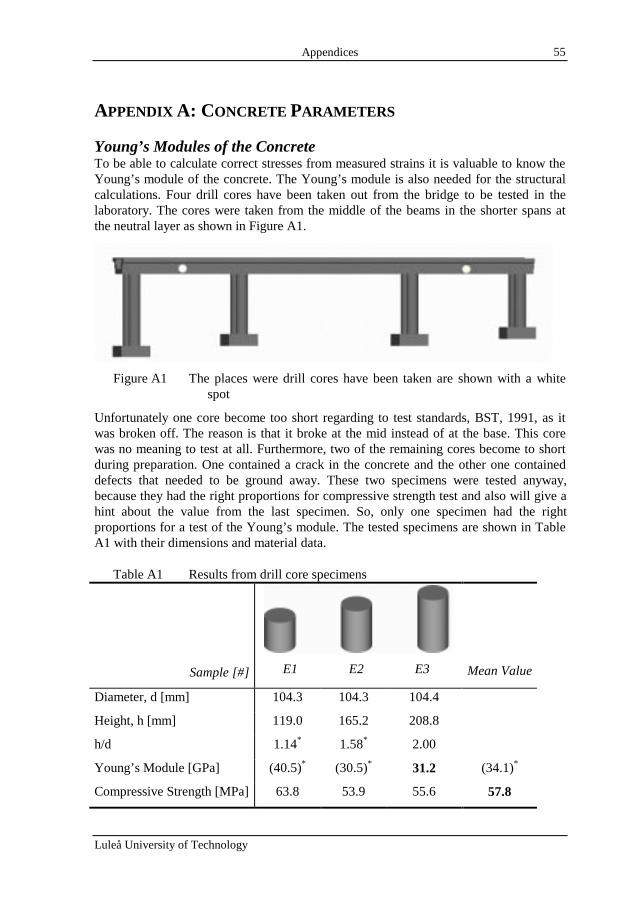
Appendices
Luleå University of Technology
55
APPENDIX A: CONCRETE PARAMETERS
Young’s Modules of the ConcreteTo be able to calculate correct stresses from measured strains it is valuable to know theYoung’s module of the concrete. The Young’s module is also needed for the structuralcalculations. Four drill cores have been taken out from the bridge to be tested in thelaboratory. The cores were taken from the middle of the beams in the shorter spans atthe neutral layer as shown in Figure A1.
Figure A1 The places were drill cores have been taken are shown with a whitespot
Unfortunately one core become too short regarding to test standards, BST, 1991, as itwas broken off. The reason is that it broke at the mid instead of at the base. This corewas no meaning to test at all. Furthermore, two of the remaining cores become to shortduring preparation. One contained a crack in the concrete and the other one containeddefects that needed to be ground away. These two specimens were tested anyway,because they had the right proportions for compressive strength test and also will give ahint about the value from the last specimen. So, only one specimen had the rightproportions for a test of the Young’s module. The tested specimens are shown in TableA1 with their dimensions and material data.
Table A1 Results from drill core specimens
Sample [#] E1 E2 E3 Mean Value
Diameter, d [mm] 104.3 104.3 104.4
Height, h [mm] 119.0 165.2 208.8
h/d 1.14* 1.58* 2.00
Young’s Module [GPa] (40.5)* (30.5)* 31.2 (34.1)*
Compressive Strength [MPa] 63.8 53.9 55.6 57.8
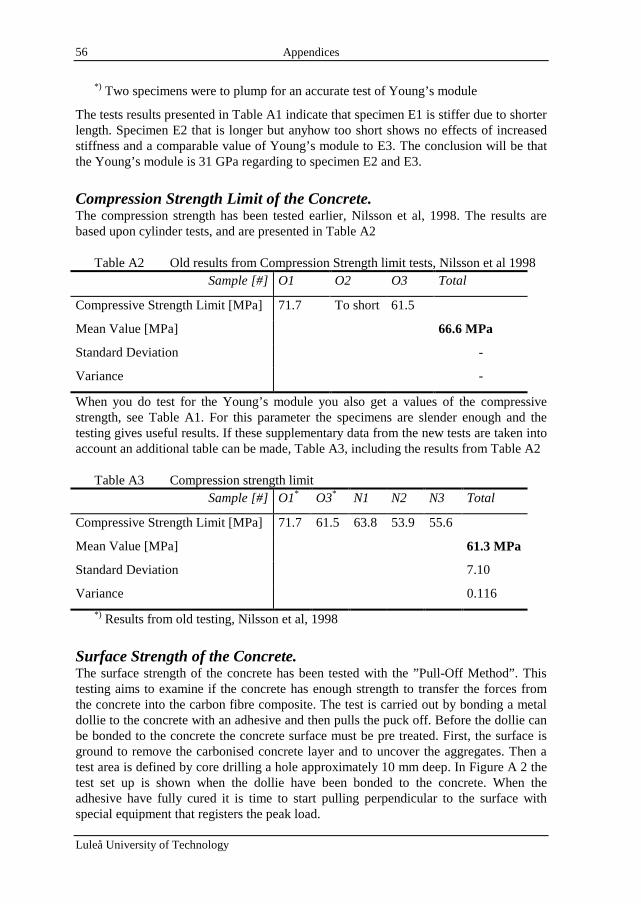
Appendices
Luleå University of Technology
56
*) Two specimens were to plump for an accurate test of Young’s module
The tests results presented in Table A1 indicate that specimen E1 is stiffer due to shorterlength. Specimen E2 that is longer but anyhow too short shows no effects of increasedstiffness and a comparable value of Young’s module to E3. The conclusion will be thatthe Young’s module is 31 GPa regarding to specimen E2 and E3.
Compression Strength Limit of the Concrete.The compression strength has been tested earlier, Nilsson et al, 1998. The results arebased upon cylinder tests, and are presented in Table A2
Table A2 Old results from Compression Strength limit tests, Nilsson et al 1998Sample [#] O1 O2 O3 Total
Compressive Strength Limit [MPa] 71.7 To short 61.5
Mean Value [MPa] 66.6 MPa
Standard Deviation -
Variance -
When you do test for the Young’s module you also get a values of the compressivestrength, see Table A1. For this parameter the specimens are slender enough and thetesting gives useful results. If these supplementary data from the new tests are taken intoaccount an additional table can be made, Table A3, including the results from Table A2
Table A3 Compression strength limitSample [#] O1* O3* N1 N2 N3 Total
Compressive Strength Limit [MPa] 71.7 61.5 63.8 53.9 55.6
Mean Value [MPa] 61.3 MPa
Standard Deviation 7.10
Variance 0.116
*) Results from old testing, Nilsson et al, 1998
Surface Strength of the Concrete.The surface strength of the concrete has been tested with the ”Pull-Off Method”. Thistesting aims to examine if the concrete has enough strength to transfer the forces fromthe concrete into the carbon fibre composite. The test is carried out by bonding a metaldollie to the concrete with an adhesive and then pulls the puck off. Before the dollie canbe bonded to the concrete the concrete surface must be pre treated. First, the surface isground to remove the carbonised concrete layer and to uncover the aggregates. Then atest area is defined by core drilling a hole approximately 10 mm deep. In Figure A 2 thetest set up is shown when the dollie have been bonded to the concrete. When theadhesive have fully cured it is time to start pulling perpendicular to the surface withspecial equipment that registers the peak load.
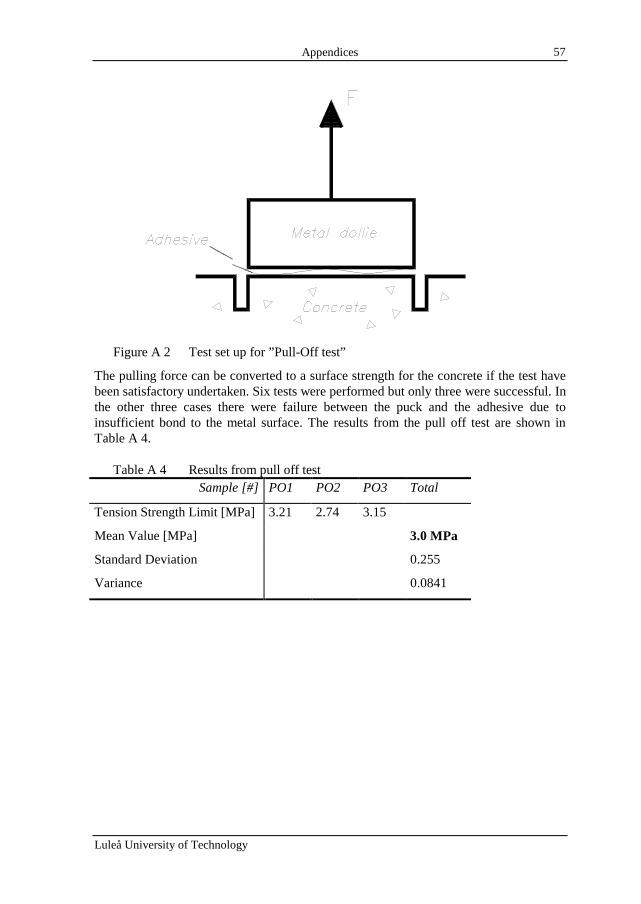
Appendices
Luleå University of Technology
57
Figure A 2 Test set up for ”Pull-Off test”
The pulling force can be converted to a surface strength for the concrete if the test havebeen satisfactory undertaken. Six tests were performed but only three were successful. Inthe other three cases there were failure between the puck and the adhesive due toinsufficient bond to the metal surface. The results from the pull off test are shown inTable A 4.
Table A 4 Results from pull off testSample [#] PO1 PO2 PO3 Total
Tension Strength Limit [MPa] 3.21 2.74 3.15
Mean Value [MPa] 3.0 MPa
Standard Deviation 0.255
Variance 0.0841
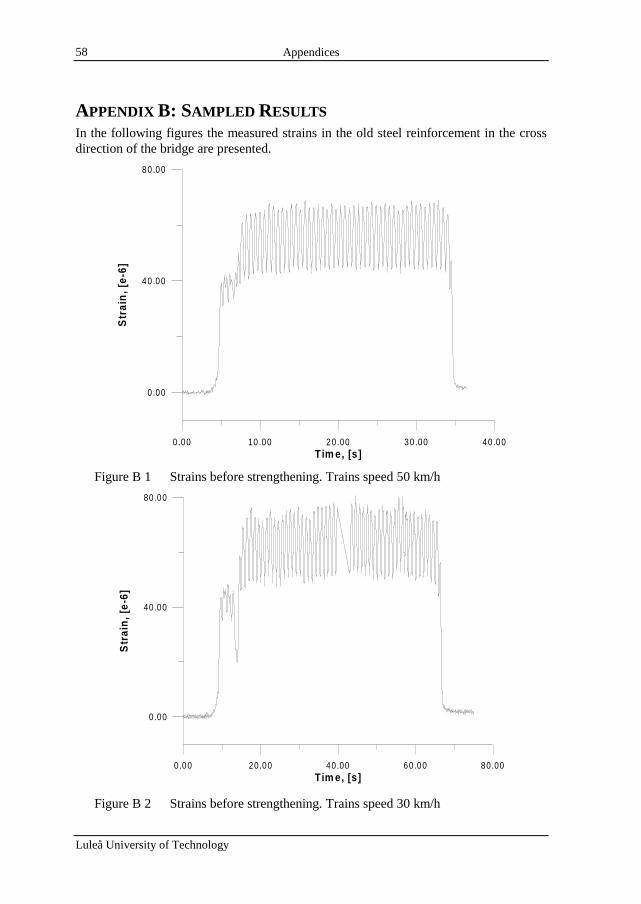
Appendices
Luleå University of Technology
58
APPENDIX B: SAMPLED RESULTSIn the following figures the measured strains in the old steel reinforcement in the crossdirection of the bridge are presented.
0.00 10 .00 20 .00 30 .00 40.00Tim e, [s ]
0.00
40 .00
80 .00
Str
ain
, [e-
6]
Figure B 1 Strains before strengthening. Trains speed 50 km/h
0.00 20.00 40.00 60.00 80.00Tim e, [s]
0.00
40.00
80.00
Str
ain,
[e-6
]
Figure B 2 Strains before strengthening. Trains speed 30 km/h
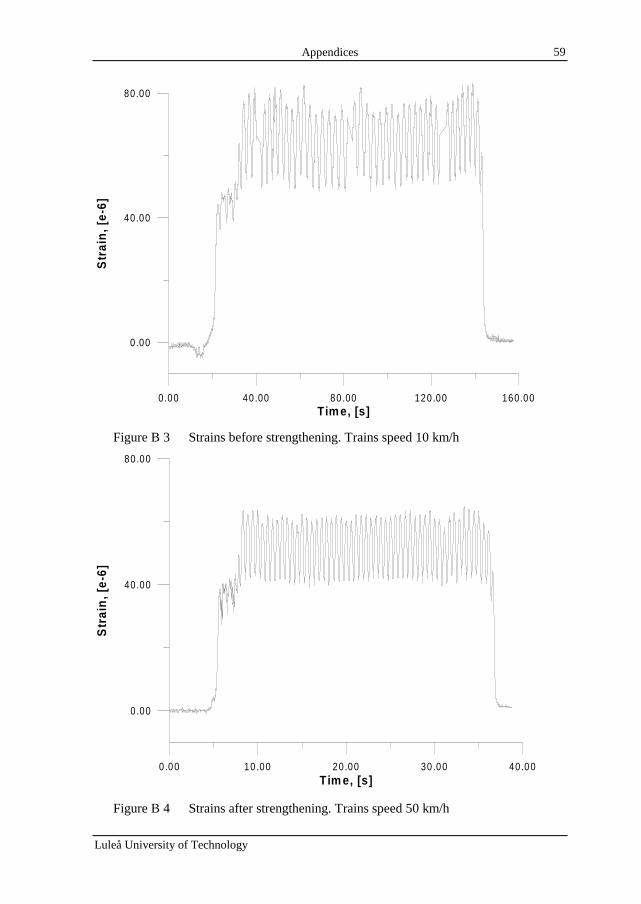
Appendices
Luleå University of Technology
59
0.00 40.00 80.00 120.00 160.00Tim e, [s]
0.00
40.00
80.00S
trai
n, [e
-6]
Figure B 3 Strains before strengthening. Trains speed 10 km/h
0.0 0 10 .00 20.00 30.0 0 40.0 0Tim e, [s]
0.00
40.00
80.00
Str
ain,
[e-6
]
Figure B 4 Strains after strengthening. Trains speed 50 km/h
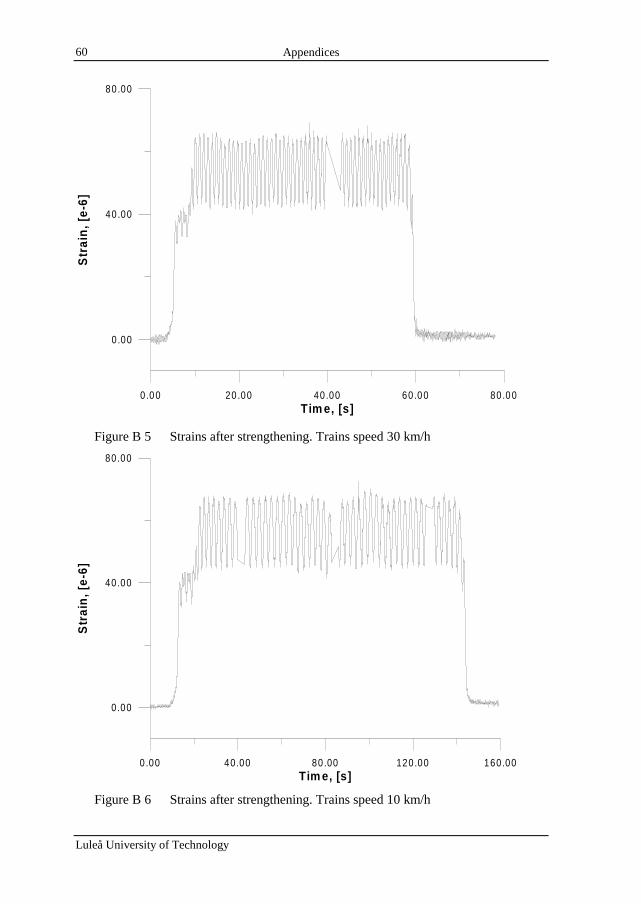
Appendices
Luleå University of Technology
60
0.0 0 20 .00 40.00 60.0 0 80.0 0Tim e, [s]
0.00
40.00
80.00S
trai
n, [e
-6]
Figure B 5 Strains after strengthening. Trains speed 30 km/h
0.00 40.00 80.00 120.00 160.00Tim e, [s]
0.00
40.00
80.00
Str
ain,
[e-6
]
Figure B 6 Strains after strengthening. Trains speed 10 km/h
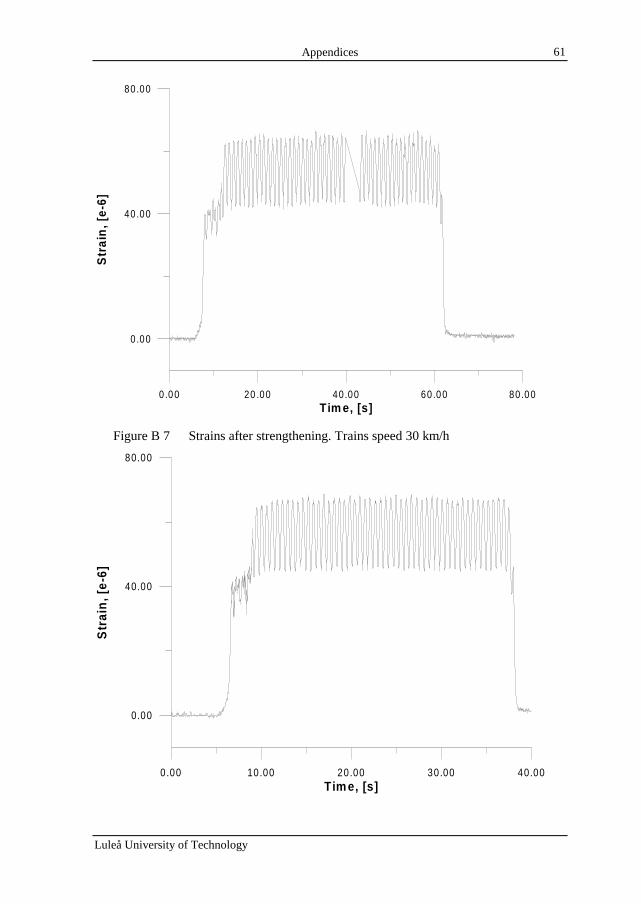
Appendices
Luleå University of Technology
61
0.0 0 20 .00 40.00 60.0 0 80.0 0Tim e, [s]
0.00
40.00
80.00S
trai
n, [e
-6]
Figure B 7 Strains after strengthening. Trains speed 30 km/h
0.00 10.00 20.00 30.00 40.00Tim e, [s]
0.00
40.00
80.00
Str
ain,
[e-6
]

Appendices
Luleå University of Technology
62
Figure B 8 Strains after strengthening. Trains speed 50 km/h