Embed Size (px)
Citation preview

Small Business & Agricultural Advisory Board
Federal Reserve Bank of New York
33 Liberty Street
10F, Paul Volcker Boardroom
Tuesday, November 15, 2016
AGENDA
10:30am
10:35am
Welcome, Claire Kramer Mills, AVP
Introductory Remarks, Kausar Hamdani, Senior Vice President
10:40am-11:10am
The National Economy, Richard Peach, Senior Vice President
11:10am-11:40am
International Update, Matthew Higgins, Vice President
11:40am-12:00pm
Regional Update, Jason Bram, Officer
12:00pm
12:15pm
12:15pm-1:55pm
Adjourn to NWC Room-10F
Lunch
Round Table Discussion with William Dudley, President and Michael
Strine, First Vice President
Your experience and that of your customers and suppliers can give us
insight into current economic conditions.
Questions for discussion with President Dudley:
1. Has your firm’s sales volume increased, decreased, or stayed the
same in the second half of 2016?
2. Do you expect your firm’s sales to increase, decrease, or stay
the same in the first quarter of 2017?
3. Do you plan to increase investment in your firm (plant &
equipment) in the first half of 2017?
4. Has your firm faced any recent shortage of labor that has limited
your ability to meet demand?
5. Do you plan to increase employment in 2017? Why or why not?
6. Do you expect input prices to increase in 2017? Do you expect
prices of products/services sold to increase?
7. Over the past two quarters, have you made any recent changes to
your firm’s financing? How have the terms and conditions for
obtaining financing changed (tightened, eased, not changed)?
2:00 pm Adjourn

Small Business & Agricultural Advisory Council Federal Reserve Bank of New York
33 Liberty Street New York, NY
Tuesday, November 15 2016
ATTENDEE LIST Council Members Michael Arnoff President Arnoff Moving & Storage Adenah Bayoh Co-Founder Kapwood, LLC Eric Caslow President Acme Smoked Fish Corporation Kevin Ellis Chief Executive Officer Cayuga Milk Industries
Charles Feit President and Founder OnForce Solar Gabriel Hernández Co-Founder and Head of Tax Division BDO Puerto Rico Deborah Leo President Retail Solutions, Inc.
Federal Reserve Bank of New York
William Dudley Michael Strine Richard Peach Kausar Hamdani Matthew Higgins Anand Marri Claire Kramer Mills Jason Bram Luis Uranga Javier Silva Edison Reyes Angela Sun
President First Vice President SVP, Research & Statistics SVP, Communications & Outreach VP, Integrated Policy Analysis VP, Outreach & Education AVP, Outreach & Education Officer, Research & Statistics Officer, Chief of Staff’s Office Senior Associate, Outreach & Education Associate, Outreach & Education Associate, Legal

US Macro Overview Richard Peach, Senior Vice President
November 15, 2016

-5
-4
-3
-2
-1
0
1
2
3
4
5
6
-5
-4
-3
-2
-1
0
1
2
3
4
5
6
2000 2002 2004 2006 2008 2010 2012 2014 2016
Growth of Real GDP
Four Quarter Percent Change Four Quarter Percent Change
Source: Bureau of Economic Analysis
Note: Shading shows NBER recessions.
Series 1
(Left Axis)
Series 2
(Right Axis)
Series 3
(Left Axis)
Series 4
(Right Axis)
Series 5
(Left Axis)
Series 6
(Right Axis)
1

80
90
100
110
120
130
140
0
200
400
600
800
1000
1200
1400
1600
1800
2011 2012 2013 2014 2015
Broad Trade-Weighted Exchange Value of US $ (right axis)
Nominal Trade-Weighted Value of US$ and Rig Count
Active Oil Rigs Index
Source: Federal Reserve Board and Baker
Hughes
Series 1
(Left Axis)
Series 2
(Right Axis)
Series 3
(Left Axis)
Series 4
(Right Axis)
Series 5
(Left Axis)
Series 6
(Right Axis)
Rig Count (left axis)
2

Manufacturing Output and Real I/S Ratio
Quarterly Growth (Annualized) Real I/S Ratio
Source: Federal Reserve Board and Bureau
of Economic Analysis via Haver Analytics
Series 1
(Left Axis)
Series 2
(Right Axis)
Series 3
(Left Axis)
Series 4
(Right Axis)
Series 5
(Left Axis)
Series 6
(Right Axis)
3
1.3
1.35
1.4
1.45
1.5
1.55
1.6
-25
-20
-15
-10
-5
0
5
10
15
1985 1990 1995 2000 2005 2010 2015

-1
0
1
2
3
4
5
6
-1
0
1
2
3
4
5
6
2012 2013 2014 2015 2016
Aggregate Weekly Hours Worked
Y/Y % Change Y/Y % Change
Source: Bureau of Labor Statistics
Goods-Producing
Industries
Private
Service-Providing
Industries Series 3
(Left Axis)
Series 4
(Right Axis)
Series 5
(Left Axis)
Series 6
(Right Axis)
4

0
2
4
6
8
10
12
56
58
60
62
64
66
68
2000 2002 2004 2006 2008 2010 2012 2014 2016
Percent Percent
Source: Bureau of Labor Statistics,
via Haver Analytics Note: Shading shows NBER recessions.
Labor Force
Participation Rate
(Left Axis)
Unemployment
Rate
(Right Axis)
Employment-Population
Ratio
(Left Axis)
Labor Market Indicators
5

170
190
210
230
250
5
5.3
5.6
5.9
6.2
6.5
2014 2015 2016
Personal Saving Rate and Energy Price Index Energy Price Index Personal Saving Rate
Sources: Bureau of Economic Analysis and Bureau of Labor Statistics via Haver Analytics
Personal Saving Rate
(left axis)
Energy Price Index
(right axis)
Series 3
(Left Axis)
Series 4
(Right Axis)
Series 5
(Left Axis)
Series 6
(Right Axis)
12-month Change
(left axis)
Monthly Change
(right axis)
12-month Percent Change Monthly Percent Change (Annualized) Real Personal Consumption Expenditures
6
-4
-2
0
2
4
6
8
10
00.5
11.5
22.5
33.5
44.5
2014 2015 2016

-15
-10
-5
0
5
10
15
20
25
30
-15
-10
-5
0
5
10
15
20
25
30
2000 2002 2004 2006 2008 2010 2012 2014 2016
> 803
754 - 803
688 - 753
606-687
< 606
Consumer Debt by Credit Score
% Change – Year to Year % Change – Year to Year
Source: FRBNY Consumer Credit Panel
1st Quintile
(Highest)
2nd Quintile
3rd Quintile 4th
Quintile
5th Quintile
(Lowest)
Note: Includes Student Loans 8
7
0
0.005
0.01
0.015
0.02
0.025
0.03
0
0.005
0.01
0.015
0.02
0.025
0.03
1968 1978 1988 1998 2008
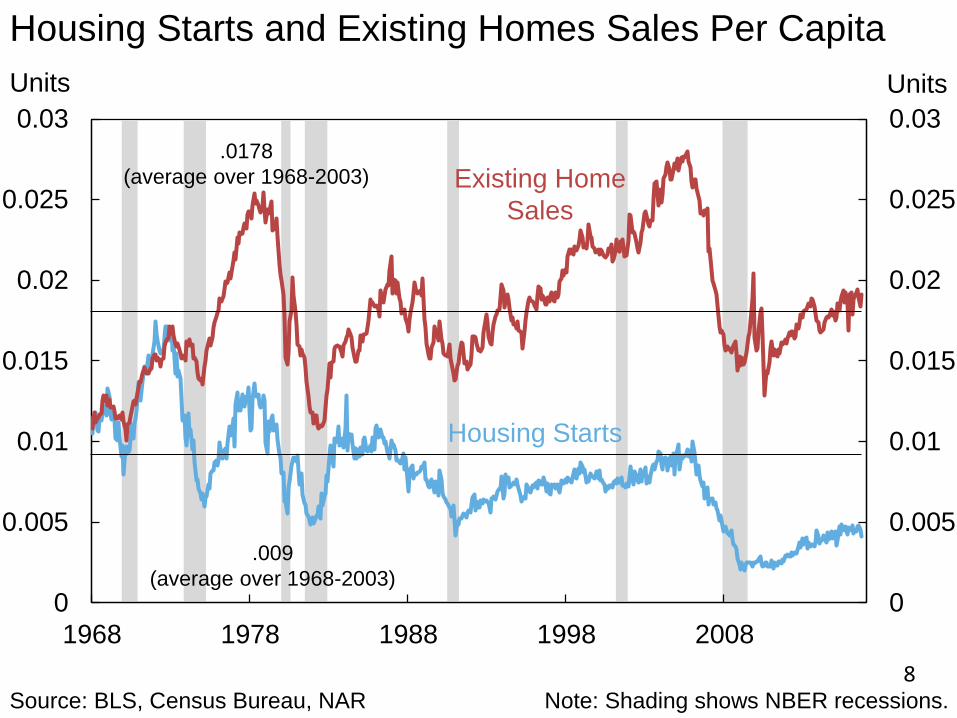
Housing Starts and Existing Homes Sales Per Capita
Units Units
Source: BLS, Census Bureau, NAR
Note: Shading shows NBER recessions.
Housing Starts
Existing Home
Sales
Series 3
(Left Axis)
Series 4
(Right Axis)
Series 5
(Left Axis)
Series 6
(Right Axis)
.0178
(average over 1968-2003)
.009
(average over 1968-2003)
8

500
550
600
650
700
750
800
500
550
600
650
700
750
800
1999 2001 2003 2005 2007 2009 2011 2013 2015
Credit Score at Mortgage Origination: All First Mortgages
Credit Score Credit Score
Source: FRBNY / Consumer Credit Panel
Note: Shading shows NBER recessions.
Median
10th Percentile
25th Percentile
Series 4
(Right Axis)
Series 5
(Left Axis)
Series 6
(Right Axis)
About 20 – 25 Million People
9

-20
-15
-10
-5
0
5
10
15
-20
-15
-10
-5
0
5
10
15
2000 2002 2004 2006 2008 2010 2012 2014 2016
Real Business Fixed Investment
4Q % Change 4Q % Change
Source: Bureau of Economic Analysis
Note: Shading shows NBER recessions.
Series 1
(Left Axis)
Series 2
(Right Axis)
Series 3
(Left Axis)
Series 4
(Right Axis)
Series 5
(Left Axis)
Series 6
(Right Axis)
10
-30
-20
-10
0
10
20
30
-30
-20
-10
0
10
20
30
60 65 70 75 80 85 90
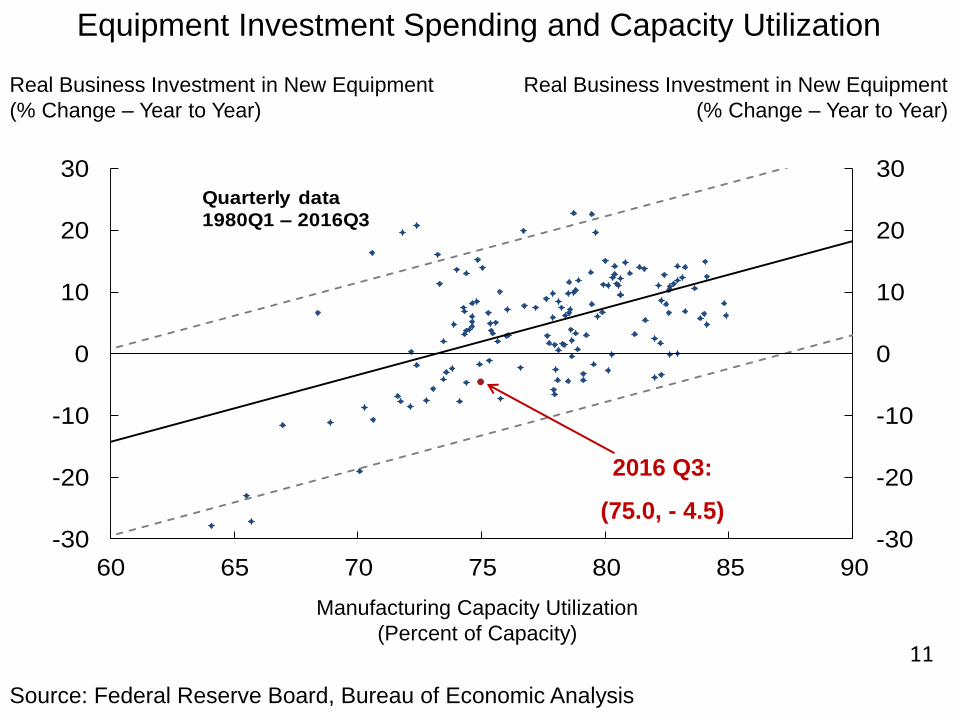
Quarterly data
1980Q1 – 2016Q3
Equipment Investment Spending and Capacity Utilization
Real Business Investment in New Equipment
(% Change – Year to Year)
Real Business Investment in New Equipment
(% Change – Year to Year)
Source: Federal Reserve Board, Bureau of Economic Analysis
Manufacturing Capacity Utilization
(Percent of Capacity)
2016 Q3:
(75.0, - 4.5)
11

-8
-6
-4
-2
0
2
4
6
8
10
-8
-6
-4
-2
0
2
4
6
8
10
2000 2002 2004 2006 2008 2010 2012 2014 2016
Real Government Consumption and Gross Investment
4 Quarter % Change 4 Quarter % Change
Source: Bureau of Economic Analysis Note: Shading shows NBER recessions.
Federal
(Left Axis)
State & Local
(Right Axis)
12

-2
-1
0
1
2
3
4
5
-2
-1
0
1
2
3
4
5
2000 2002 2004 2006 2008 2010 2012 2014 2016
12 Month % Change 12 Month % Change
Source: Bureau of Economic Analysis,
via Haver Analytics Note: Shading shows NBER recessions.
Total PCE
Core PCE
FOMC Objective
PCE Deflator
13

-3
-2
-1
0
1
2
3
4
5
-3
-2
-1
0
1
2
3
4
5
2000 2002 2004 2006 2008 2010 2012 2014 2016
CPI Inflation: Core Goods and Core Services
12 Month % Change 12 Month % Change
Source: Bureau of Labor Statistics
Note: Shading shows NBER recessions.
Core Goods
Core Services
Total Core CPI
Series 4
(Right Axis)
Series 5
(Left Axis)
Series 6
(Right Axis)
14

-1
0
1
2
3
4
5
6
7
8
9
10
11
12
2000 2002 2004 2006 2008 2010 2012 2014 2016
Rental Vacancy Rate and Rent of Primary Residence
Percent 12 Month % Change
Source: Census Bureau, BLS Note: Shading shows NBER recessions.
Rental
Vacancy Rate
(Left Axis)
Rent of Primary
Residence
(Right Axis)
15

-10
-8
-6
-4
-2
0
2
4
6
8
10
-30
-25
-20
-15
-10
-5
0
5
10
15
20
25
30
2000 2002 2004 2006 2008 2010 2012 2014 2016
Dollar Exchange Rate and Nonoil Import Prices
12 Month % Change 12 Month % Change
Note: Shading shows NBER recession and
dollar is Board’s trade-weighted measure.
Dollar
(Left Axis)
Nonoil Import
Prices
(Right Axis)
Series 3
(Left Axis)
Series 4
(Right Axis)
Series 5
(Left Axis)
Series 6
(Right Axis)
Source: Federal Reserve Board, Bureau of
Labor Statistics via Haver Analytics
16

Reference Charts
17

0
0.5
1
1.5
2
2.5
3
3.5
4
4.5
0
0.5
1
1.5
2
2.5
3
3.5
4
4.5
1995 1997 1999 2001 2003 2005 2007 2009 2011 2013 2015
Personal Consumption Expenditures: Health Care Price
Index 12 Month % Change 12 Month % Change
Source: Bureau of Economic Analysis Note: Shading shows NBER recessions.
17% of total PCE deflator
19% of core PCE deflator
18

-25
-20
-15
-10
-5
0
5
10
15
20
25
-25
-20
-15
-10
-5
0
5
10
15
20
25
2005 2007 2009 2011 2013 2015
Bank Assets: Domestically and Foreign Chartered Banks
% Change Year-to-Year % Change Year-to-Year
Source: Federal Reserve Board Note: Shading shows NBER recessions.
Commercial and
Industrial Loans
(Left Axis)
Residential Real
Estate Loans
(Right Axis)
Commercial Real
Estate Loans
(Left Axis)
Series 4
(Right Axis)
19

0
2
4
6
8
10
12
60
62
64
66
68
70
195
5
195
9
196
3
196
7
197
1
197
5
197
9
198
3
1987
199
1
199
5
1999
200
3
200
7
201
1
201
5
Labor Share of National Income and Unemployment Rate
Percent Rate
Source: Bureau of Economic Analysis,
Bureau of Labor Statistics Note: Shading shows NBER recessions.
Labor Share of
National
Income
(Left Axis)
Unemployment
Rate
(Right Axis)
Series 3
(Left Axis)
Series 4
(Right Axis)
20

-1000
-500
0
500
1000
1500
2000
-1000
-500
0
500
1000
1500
2000
1999 2001 2003 2005 2007 2009 2011 2013 2015 2017
Household Formations
2 Year Avg. Change 2 Year Avg. Change
Source: Bureau of the Census Note: Shading shows NBER recessions.
Total
(Left Axis) Renter
(Left Axis)
Owner
(Right Axis)
21

60
62
64
66
68
70
1965 1971 1977 1983 1989 1995 2001 2007 2013
60
62
64
66
68
70Percent Percent
Source: Census Bureau
Aggregate Homeownership Rate*
*Owner-occupied housing units divided by total occupied housing units.
Contribution to Decline by Age of Household Head: Under 35: 23.7% 35 to 44: 35.4% 45 to 54: 29.1% 55 to 64: 11.7% 65 plus: -0.9%
22

-500
0
500
1000
1500
2000
2500
3000
3500
1997 1999 2001 2003 2005 2007 2009 2011 2013 2015
-500
0
500
1000
1500
2000
2500
3000
3500
Excess Supply of Housing
Source: US Bureau of the Census, Housing Vacancy Survey, and author’s calculations.
Note: Shading represents NBER recessions.
Owner (For Sale)
Held Off Market
Renter (For
Rent)
Excess Units: Total
Thousands of Units Thousands of Units
23

Single Family Housing Market
3
4
5
6
7
8
9
10
11
12
13
-20
-15
-10
-5
0
5
10
15
20
25
2000 2002 2004 2006 2008 2010 2012 2014 2016
12 Month % Change Months
Source: CoreLogic, National Association of
Realtors, via Haver Analytics Note: Shading shows NBER recessions.
Single Family
House Price Index
(Left Axis)
Months’
Supply
(Right Axis)
“Normal” Range for
Months’ Supply
24

0
10
20
30
40
50
60
2000 2001 2002 2003 2004 2005 2006 2007 2008 2009 2010 2011 2012 2013 2014 2015 2016
0
10
20
30
40
50
60
Transition of Mortgage Accounts from 30-60 Days Late Percent Percent
Source: FRBNY Consumer Credit Panel
To Current
To 90+ Days Late
25

-5.0
-4.0
-3.0
-2.0
-1.0
0.0
1.0
2.0
3.0
4.0
5.0
6.0
7.0
-5.0
-4.0
-3.0
-2.0
-1.0
0.0
1.0
2.0
3.0
4.0
5.0
6.0
7.0
60 65 70 75 80 85 90 95
Data from 2015Q1 to 2016Q3 are in red.
Dashed lines represent 95% CI of predicted values.
2001Q1
2001Q3
2001Q4
2001Q2
Unemp. Rate – CBO NAIRU vs. Capacity Utilization PPT Difference (Unemp. Rate – NAIRU)
Source: BLS, CBO, Federal Reserve Board
Series 1
(Left Axis)
Series 3
(Left Axis)
Series 4
(Right Axis)
Series 5
(Left Axis)
Series 6
(Right Axis)
PPT Difference
Capacity Utilization: Manufacturing (Percent)
Note: Data spans from 1950Q1 to 2016Q3.
26
0
0.2
0.4
0.6
0.8
1
1.2
1.4
0
0.2
0.4
0.6
0.8
1
1.2
1.4
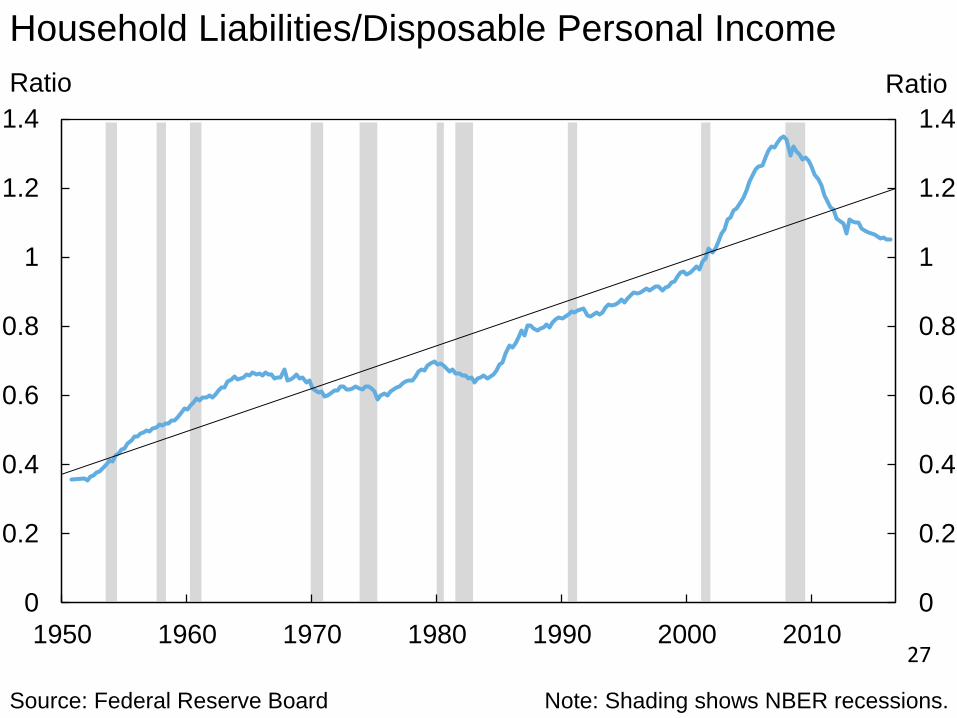
1950 1960 1970 1980 1990 2000 2010
Household Liabilities/Disposable Personal Income
Ratio Ratio
Source: Federal Reserve Board
Note: Shading shows NBER recessions.
Series 1
(Left Axis)
Series 2
(Right Axis)
Series 3
(Left Axis)
Series 4
(Right Axis)
Series 5
(Left Axis)
Series 6
(Right Axis)
27

11/14/2016
1
Global Economic Outlook
Small Business and Agricultural Advisory Council Matthew Higgins, November 2016
The views expressed here are those of the author, and do not necessarily reflect those of the Federal Reserve Bank of New York or the Federal Reserve System.
Roadmap
Recent global economic performance
Foreign advanced economies’ struggle to escape“lowflation”
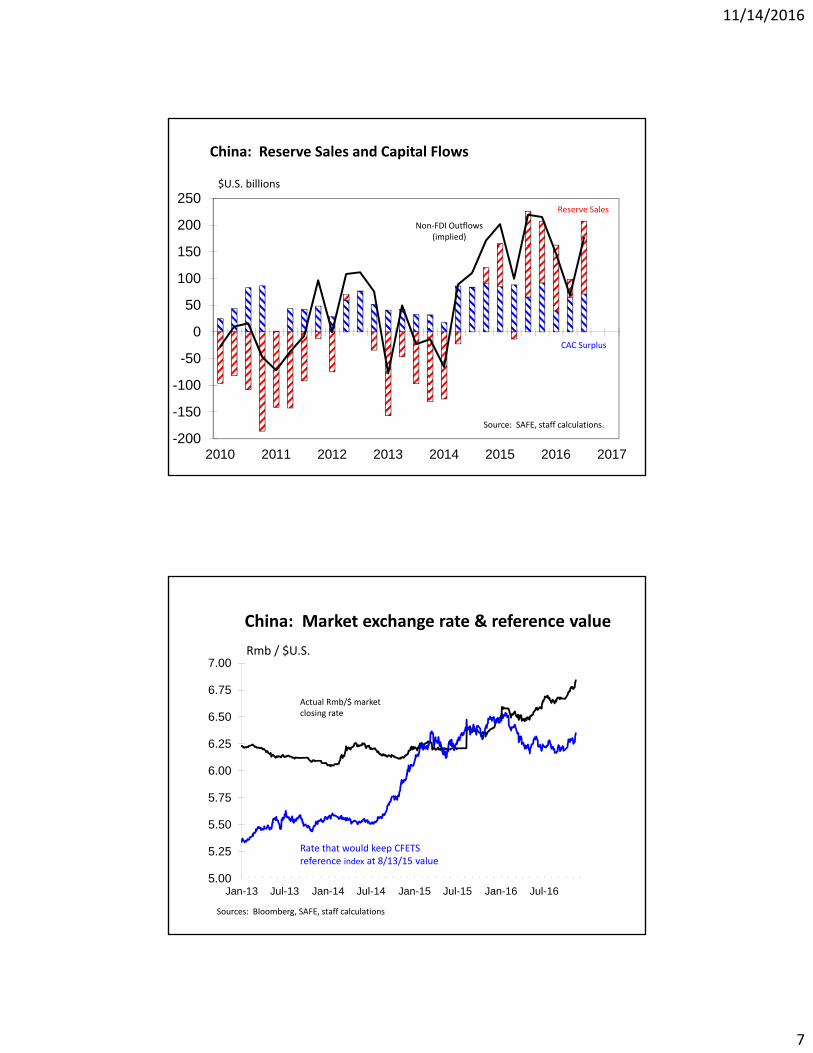
Capital outflows and pressures on China’sexchange rate
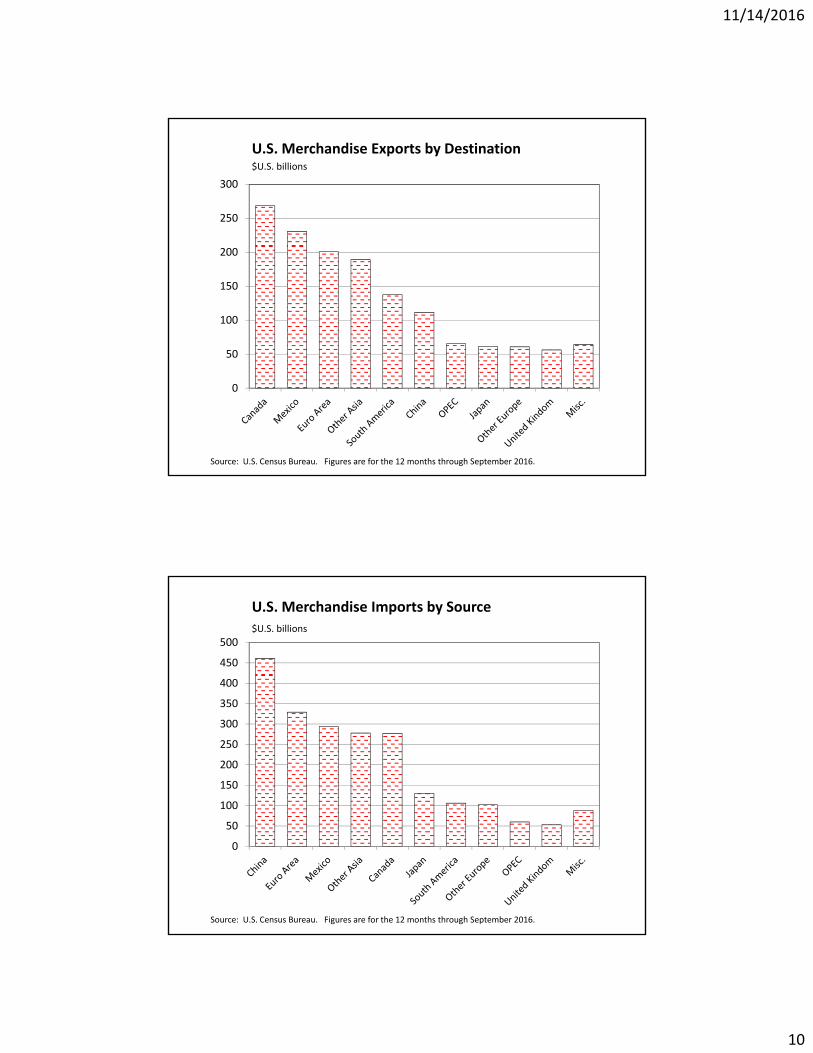
U.S. international trade by geography and producttype
11/14/2016
2
0
2
4
6
8
10
12
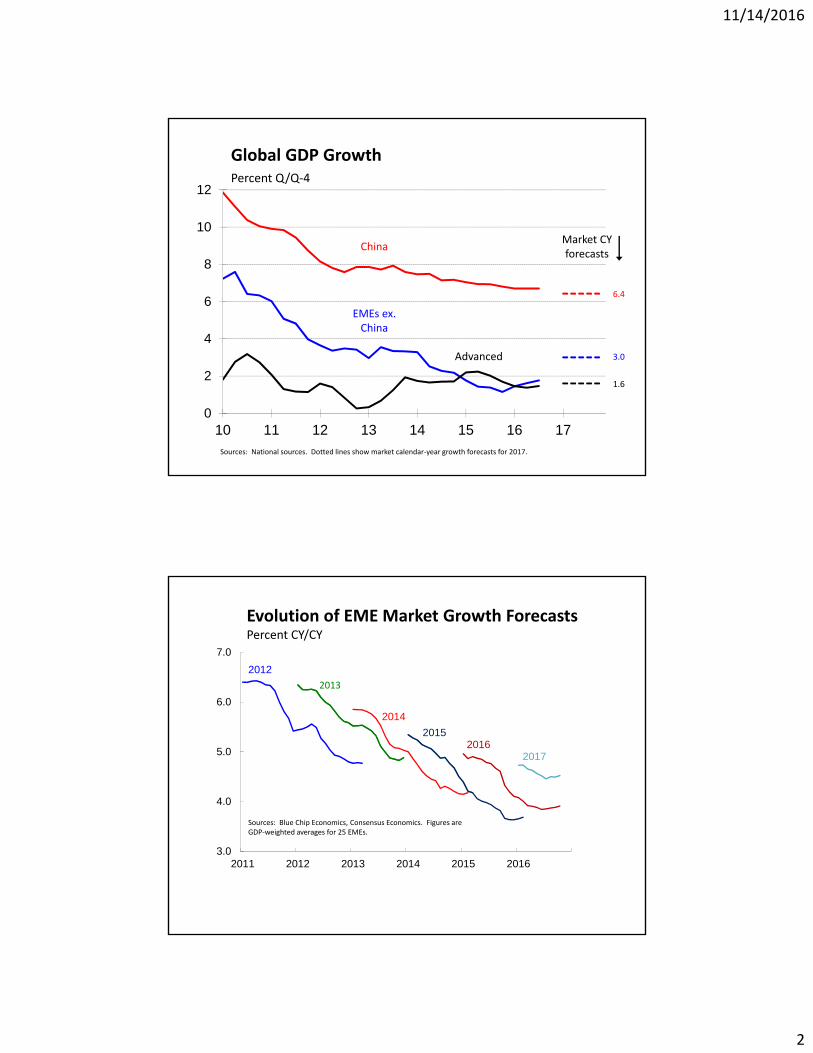
10 11 12 13 14 15 16 17
Global GDP GrowthPercent Q/Q‐4
6.4
1.6
3.0
EMEs ex. China
China
Advanced
Sources: National sources. Dotted lines show market calendar‐year growth forecasts for 2017.
Market CY forecasts
Evolution of EME Market Growth ForecastsPercent CY/CY
3.0
4.0
5.0
6.0
7.0
2011 2012 2013 2014 2015 2016
2013
2014
20152016
2012
2017
Sources: Blue Chip Economics, Consensus Economics. Figures are GDP‐weighted averages for 25 EMEs.

11/14/2016
3
-40
-30
-20
-10
0
10
20
30
16:01 16:03 16:05 16:07 16:09 16:11
Percent positive or negative*
Citigroup Economic Surprise Indexes
Advanced Economies
Emerging Economies
*Weighted by series’ historical FX impact
35
40
45
50
55
60
65
-6
-4
-2
0
2
4
6
99 00 01 02 03 04 05 06 07 08 09 10 11 12 13 14 15 16 17
Percent SAAR
AE GDP Growth and Composite PMI
GDP Growth
Composite PMI
Correlation = 0.85
Sources: Markit Economics, national authorities.
Oct.

11/14/2016
4
40.0
42.5
45.0
47.5
50.0
52.5
55.0
57.5
60.0
-4
-2
0
2
4
6
8
10
99 00 01 02 03 04 05 06 07 08 09 10 11 12 13 14 15 16 17
Percent SAAR
EME GDP Growth and Composite PMI
GDP Growth
Composite PMI
Correlation = 0.89
Sources: Markit Economics, national sources.
Oct.
7.5
8.0
8.5
9.0
9.5
10.0
10.5
11.0
11.5
98 99 00 01 02 03 04 05 06 07 08 09 10 11 12 13 14 15 16 17
Real GDP
EC Potential Estimate
Linear Trend, 1998‐2005
EC forecasts
Sources: Eurostat, EC CIRCA database.
2016
2017
Trillions of 2010 euros
Euro area real GDP and European Commission Forecast

11/14/2016
5
460
480
500
520
540
560
580
98 99 00 01 02 03 04 05 06 07 08 09 10 11 12 13 14 15 16 17 18
Real GDP
BoJ Potential Estimate
Linear Trend, 1998‐2005
BoJ projections
Sources: Bank of Japan. Calendar‐year GDP forecast inferred from central tendency of fiscal‐year growth projections of BoJ board members. BoJ staff potential growth forecast for 2016 carried forward to 2017.
2016
2017
Trillions of 2005 yen
Japanese Real GDP and Bank of Japan Projection
-1.0
-0.5
0.0
0.5
1.0
1.5
2.0
2.5
12 13 14 15 16
Percent change from year ago
G‐3: Core Consumer Price Inflation
Japan
U.S.
Euro Area
Sources: BEA, Eurostat, BoJ. U.S. inflation measured using the PCE index.
1.7
0.8
0.2

11/14/2016
6
0
20
40
60
80
100
08 09 10 11 12 13 14 15 16 17
Percent
Central Bank Credit as a Share of GDP
Japan
United States
Euro Area
Sources: BoJ, ECB, Federal Reserve.
AE Core Inflation Performance with Negative Policy Rates
Country Date AdoptedInitial Core
InflationCurrent Core
Inflation
Japan January 2016 1.1 0.2
Sweden February 2015 1.0 0.7
Switzerland December 2014 0.4 -0.3
Denmark September 2014 0.7 0.1
Euro Area June 2014 0.8 0.8
Sources: National sources, OECD. Policy rates are as follows: Japan, marginal current account balances; Sweden, repo rate; Switzerland, 3‐mo. LIBOR target; Denmark, CD rate; Euro Area, deposit rate.
11/14/2016
7
-200
-150
-100
-50
0
50
100
150
200
250
2010 2011 2012 2013 2014 2015 2016 2017
China: Reserve Sales and Capital Flows
Reserve Sales
$U.S. billions
Source: SAFE, staff calculations.
CAC Surplus
Non‐FDI Outflows (implied)
5.00
5.25
5.50
5.75
6.00
6.25
6.50
6.75
7.00
Jan-13 Jul-13 Jan-14 Jul-14 Jan-15 Jul-15 Jan-16 Jul-16
China: Market exchange rate & reference value
Rmb / $U.S.
Actual Rmb/$ market closing rate
Rate that would keep CFETS reference index at 8/13/15 value
Sources: Bloomberg, SAFE, staff calculations

11/14/2016
8
U.S. Merchandise Trade Flows ( $U.S. bn. )
Country or Region Exports Imports Balance
World 1,446 2,178 -733
Canada 269 277 -8Mexico 231 294 -63Euro area 201 329 -128Asia ex. China, Japan 189 278 -89South America 132 106 26China 112 461 -350OPEC 71 60 11Japan 61 130 -69Europe ex. EMU, UK 61 102 -41United Kingdom 56 53 3
Miscellaneous 64 88 -24
Source: U.S. Census Bureau. Figures are for the 12 months through September2016, and at customs values.
U.S. Merchandise Trade by End-Use ( $U.S. bn. )
Country or Region Exports Imports Balance
Total 1,449 2,173 -724
Capital Goods 520 583 -63Industrial Supplies 392 433 -42 Petrol. & Gas Products 92 148 -56Consumer Goods 194 583 -389Motor Vehicles & Parts 151 350 -199Food, Feeds and Bev. 132 128 3
Miscellaneous 61 96 -34
Source: U.S. Census Bureau. Figures are for the 12 months through Sep. 2016, at customs value. Consumer goods are ex. food and autos.

11/14/2016
9
0
500
1000
1500
2000
70 74 78 82 86 90 94 98 02 06 10 14
Domestic plus foreign profits
Domestic profits (net)
Q2: $682 billion
Source: BEA. Domestic profits are net of payments to foreign equity holders.
U.S. Corporate Profits by Source$U.S. billions, annual rate
Reference Charts
11/14/2016
10
Source: U.S. Census Bureau. Figures are for the 12 months through September 2016.
U.S. Merchandise Exports by Destination$U.S. billions
0
50
100
150
200
250
300
Source: U.S. Census Bureau. Figures are for the 12 months through September 2016.
U.S. Merchandise Imports by Source
$U.S. billions
0
50
100
150
200
250
300
350
400
450
500

11/14/2016
11
0
2,000
4,000
6,000
8,000
10,000
12,000
14,000
16,000
2007:Q4 2016:Q2
Foreign private
Sources: U.S. Treasury, Federal Reserve Board.
U.S. private
Federal Reserve
Holdings of U.S. Treasury Securities
$U.S. billions
Foreign official
$2,243
$4,038
$2,462
$5,189

Regional Economic Outlook Presentation to the Advisory Council on Small Business and Agriculture
Jason Bram, Research Officer November 15, 2016
The views expressed here are those of the presenter and do not necessarily represent the views of the Federal Reserve Bank of New York or the Federal Reserve System.

Overview of Regional Conditions
• New York City’s economy continues to lead the region in growth, led by the outer boroughs.
• While NYC’s key finance sector has been sluggish, tech (which tends to pay fairly well) has been booming.
• New Jersey’s economy continues to grow modestly.
• Job trends in much of upstate NY look much stronger than current data suggest. Upstate housing markets strengthening, especially in metro Buffalo.
• Puerto Rico’s economy remains depressed.
FEDERAL RESERVE BANK OF NEW YORK 2

Down more than 1% Down 0.6% to 1% Down 0.1% to 0.5% Unchanged Up 0.1% to 0.5% Up 0.6% to 1% Up more than 1%
3
State Coincident Indexes Three-Month Change Ending September 2016
Source: Federal Reserve Bank of Philadelphia

80
90
100
110
120
Sep
130
140
2007 2008 2009
Shading indicates NBER recession
2010 2011 2012 2013 2014 2015 2016 2017
New York State
New Jersey
New York City
Regional Economic Activity Index of Coincident Economic Indicators (CEI)
Index (Dec2007=100)
Source: Federal Reserve Bank of New York 4

-60
-40
-20
0
Oct
20
40
60
2007 2008 2009
Shading indicates NBER recession
2010 2011 2012 2013 2014 2015 2016 2017
Empire State Manufacturing Survey
Business Leaders Survey
Current Economic Conditions FRBNY Business Surveys, Current Conditions
Diffusion Index
Source: Federal Reserve Bank of New York 5

Recent Private Sector Job Trends Percent Change from September 2015 to September 2016
Source: Bureau of Labor Statistics and Moody's Economy.com
Down Flat to up 1.5% Up 1.5% to 2% Up more than 2%
6

Longer-Term Private Sector Job Trends Percent Change From Previous Peak to September 2016
Source: Bureau of Labor Statistics and Moody's Economy.com
Down more than 2% Within 2% Up 2% to 5% Up more than 5%
7

88
92
96
100
104
108
112
116
120
2007 2008 2009
Shading indicates NBER recession
2010 2011 2012 2013 2014 2015 2016 2017
New York State
New York City
United States
New Jersey
Puerto Rico
Private-Sector Employment Seasonally Adjusted Index
Index (Dec2007=100)
Oct
Source: Bureau of Labor Statistics and Moody's Economy.com
Sep
8

88
92
96
100
2007 2008 2009
Shading indicates NBER recession
2010 2011 2012 2013 2014 2015 2016 2017
Glens Falls
United States
Utica
116
112 108
Oct
104
Sep
120
Albany
Private-Sector Employment Seasonally Adjusted Index
Index (Dec2007=100)
Source: Bureau of Labor Statistics and Moody's Economy.com 9

88
92
96
100
2007 2008 2009
Shading indicates NBER recession
2010 2011 2012 2013 2014 2015 2016 2017
Rochester
United States
Syracuse
116
112 108
Oct
104
Sep
120
Buffalo
Private-Sector Employment Seasonally Adjusted Index
Index (Dec2007=100)
Source: Bureau of Labor Statistics and Moody's Economy.com 10

Source: U.S. Bureau of Labor Statistics, Moody’s Economy.com, and FRBNY Staff Calculations.
440
445
450
455
460
465
2012 2013 2014 2015 2016
Thousands
Preliminary
Expected Revision
Albany Employment Preliminary vs Expected Revision
11

540
545
550
555
560
565
570
2012 2013 2014 2015 2016
Thousands
Preliminary
Buffalo Employment Preliminary vs Expected Revision
Expected Revision
Source: U.S. Bureau of Labor Statistics, Moody’s Economy.com, and FRBNY Staff Calculations. 12
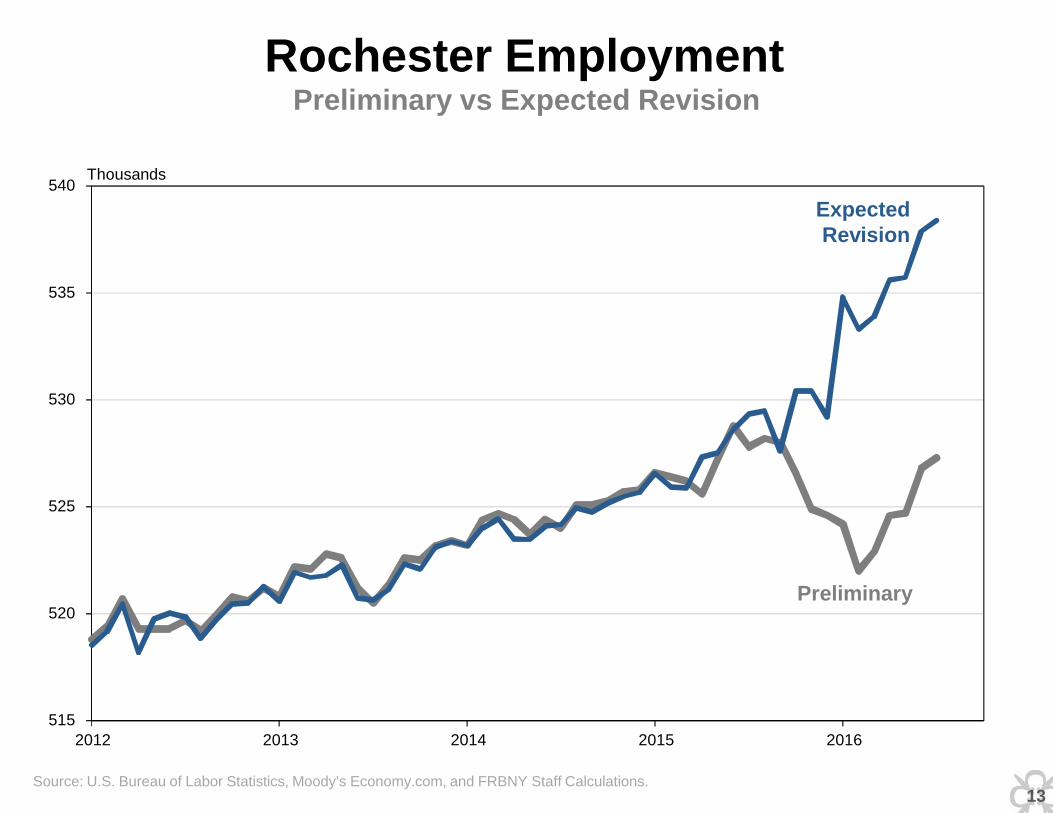
515
520
525
530
535
540
2012 2013 2014 2015 2016
Thousands
Preliminary
Rochester Employment Preliminary vs Expected Revision
Expected Revision
Source: U.S. Bureau of Labor Statistics, Moody’s Economy.com, and FRBNY Staff Calculations. 13
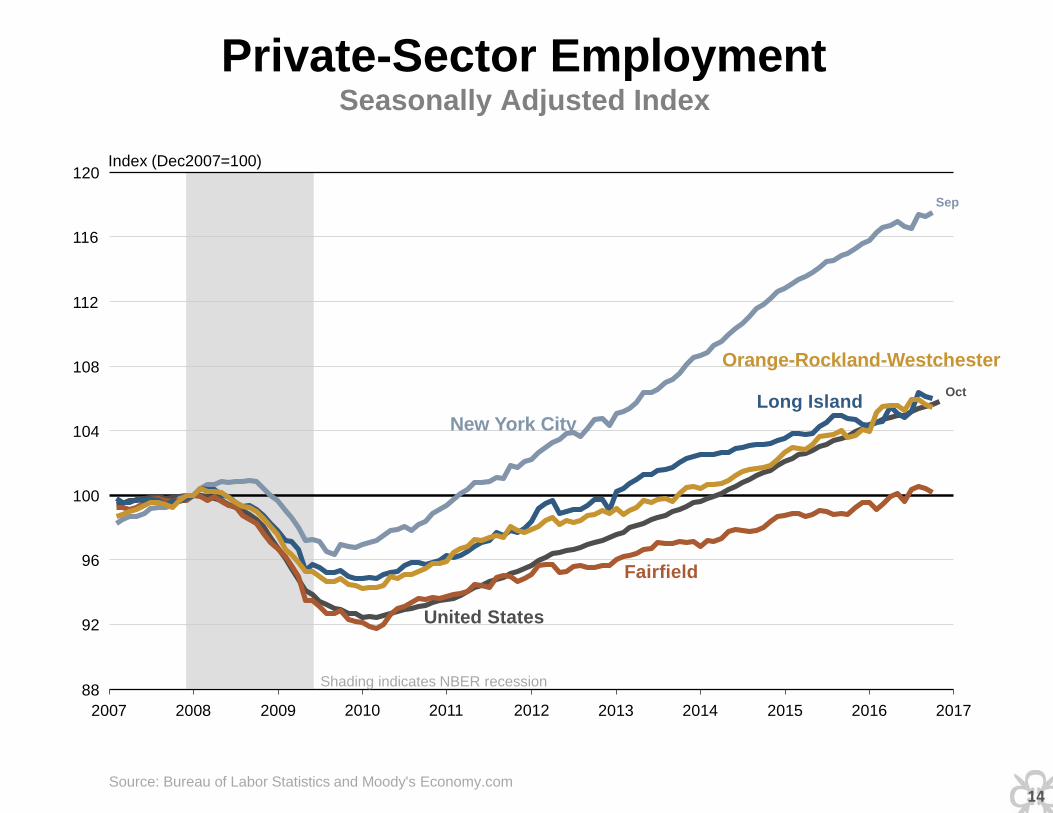
88
92
96
100
104
108
112
116
120
2007 2008 2009
Shading indicates NBER recession
2010 2011 2012 2013 2014 2015 2016 2017
New York City Long Island
United States
Fairfield
Orange-Rockland-Westchester
Private-Sector Employment Seasonally Adjusted Index
Index (Dec2007=100)
Oct
Source: Bureau of Labor Statistics and Moody's Economy.com
Sep
14

60
90
120
150
180
210
240
270
1965 1970 1975 1980 1985 1990 1995 2000 2005 2010 2015 2020 2,500
2,750
3,000
3,250
3,500
3,750
4,000
4,250 Shading indicates time between securities
peak and trough
Securities Employment
(left axis)
Total Employment Minus Securities
(right axis)
NYC Securities Employment Seasonally Adjusted Levels
Thousands Thousands
Sep
Source: Bureau of Labor Statistics, Moody's Economy.com, and FRBNY calculations 15

NYC Finance and Securities Sectors’ Share of NYC Employment and Earnings
Source: Bureau of Labor Statistics (QCEW). 16
0%
10%
20%
30%
40%
1972 1987 2001 2007 2015 1972 1987 2001 2007 2015
Finance Ex-Securities Securities

NYC Tech and Securities Employment Thousands of Jobs
Source: Bureau of Labor Statistics and Moody’s Economy.com.
0
50
100
150
200
1990 1992 1994 1996 1998 2000 2002 2004 2006 2008 2010 2012 2014 2016
Securities Employment
Technology Employment
Thousands
+53,000
+12,000
2010 to 2015
17
Technology Employment • Computer manufacturing • Electronic shopping • Software publishing • Data processing, hosting, etc. • Internet/web search portals • Computer systems design • Scientific R&D services
Shading indicates NBER recession

60
70
80
90
100
110
120
2006 2007 2008 2009
Shading indicates NBER recession
2010 2011 2012 2013 2014 2015 2016 2017
United States
NYC Metro
Downstate NY
Upstate NY
New York State
Home Prices CoreLogic Home Price Index, Seasonally Adjusted
Index (Mar2006=100)
Sep
Source: CoreLogic Home Price Index (including distressed sales) 18

60
70
80
90
100
110
120
2006 2007 2008 2009
Shading indicates NBER recession
2010 2011 2012 2013 2014 2015 2016 2017
United States
NYC Metro
Fairfield
Westchester
Rockland
Home Prices CoreLogic Home Price Index, Seasonally Adjusted
Index (Mar2006=100)
Sep
Source: CoreLogic Home Price Index (including distressed sales) 19

60
70
80
90
100
110
120
2006 2007 2008 2009
Shading indicates NBER recession
2010 2011 2012 2013 2014 2015 2016 2017
United States
Bergen
Hudson
Passaic
Essex
Union
Home Prices CoreLogic Home Price Index, Seasonally Adjusted
Index (Mar2006=100)
Sep
Source: CoreLogic Home Price Index (including distressed sales) HPI_5 13NOV2016 20

60
70
80
Sep
90
100
110
120
130
2006 2007 2008 2009
Shading indicates NBER recession
2010 2011 2012 2013 2014 2015 2016 2017
United States
Albany
Rochester
Upstate NY
Buffalo
Home Prices CoreLogic Home Price Index, Seasonally Adjusted
Index (Mar2006=100)
Source: CoreLogic Home Price Index (including distressed sales) 21

60
80
100
120
140
160
2006 2007 2008 2009
United States
Shading indicates NBER recession
2010 2011 2012 2013 2014 2015 2016 2017
Brooklyn
Nassau County
Suffolk County
Queens
Manhattan
Home Prices CoreLogic Home Price Index, Seasonally Adjusted
Index (Mar2006=100)
Sep
Source: CoreLogic Home Price Index (including distressed sales) 22

0
5
10
15
20
25
2000 2001 2002 2003 2004 2005 2006 2007 2008 2009 2010 2011 2012 2013 2014 2015 2016 2017
Shading indicates NBER recessions
NYC Downtown
NYC Midtown
Central NJ
Northern NJ
Office Vacancy Rates Overall Vacancy Rates
Percent
Q3
Source: Cushman & Wakefield 23

0
5
10
15
20
25
2000 2001 2002 2003 2004 2005 2006 2007 2008 2009 2010 2011 2012 2013 2014 2015 2016 2017
Shading indicates NBER recessions
Westchester County
Long Island
Fairfield County
Office Vacancy Rates Overall Vacancy Rates
Percent
Q3
Source: Cushman & Wakefield 24