Embed Size (px)
Citation preview
HAL Id: hal-01147926https://hal.archives-ouvertes.fr/hal-01147926
Submitted on 3 May 2015
HAL is a multi-disciplinary open accessarchive for the deposit and dissemination of sci-entific research documents, whether they are pub-lished or not. The documents may come fromteaching and research institutions in France orabroad, or from public or private research centers.
L’archive ouverte pluridisciplinaire HAL, estdestinée au dépôt et à la diffusion de documentsscientifiques de niveau recherche, publiés ou non,émanant des établissements d’enseignement et derecherche français ou étrangers, des laboratoirespublics ou privés.
Small pelagic fish feeding patterns in relation to foodresource variability: an isotopic investigation for Sardina
pilchardus and Engraulis encrasicolus from the Bay ofBiscay (north-east Atlantic)
Tiphaine Chouvelon, Laurie Violamer, Aurélie Dessier, Paco Bustamante,Françoise Mornet, Cécilia Pignon-Mussaud, Dupuy Christine
To cite this version:Tiphaine Chouvelon, Laurie Violamer, Aurélie Dessier, Paco Bustamante, Françoise Mornet, et al..Small pelagic fish feeding patterns in relation to food resource variability: an isotopic investigation forSardina pilchardus and Engraulis encrasicolus from the Bay of Biscay (north-east Atlantic). MarineBiology, Springer Verlag, 2015, 162, pp.15-37. <10.1007/s00227-014-2577-5>. <hal-01147926>
Small pelagic fish feeding patterns in relation to food resource variability: an isotopic
investigation for Sardina pilchardus and Engraulis encrasicolus from the Bay of Biscay
(North-East Atlantic)
Chouvelon T1†*, Violamer L1†, Dessier A1, Bustamante P1, Mornet F2, Pignon‑Mussaud
C1, Dupuy C1
1 Littoral Environnement et Sociétés, UMR 7266 CNRS - Université de La Rochelle, 2 rue
Olympe de Gouges, F-17000 La Rochelle Cedex 01, France
2 IFREMER, Laboratoire Ressources Halieutiques de La Rochelle, Place Gaby Coll, F-17087
L’Houmeau, France
† These authors contributed equally to this work.
* Corresponding author: Dr. Tiphaine Chouvelon
Littoral, Environnement et Sociétés
UMR 7266 CNRS-Université de La Rochelle
2 rue Olympe de Gouges
F-17000 La Rochelle (France)
Tel.: (+33) 546 458 388
E-mails: [email protected]
Abstract: Small pelagic fish represent an essential link between lower and upper trophic levels
in marine pelagic ecosystems and often support important fisheries. In the Bay of Biscay in the
north-east Atlantic, no obvious controlling factors have yet been described that explain
observed fluctuations in European sardine Sardina pilchardus and European anchovy Engraulis
encrasicolus stocks, in contrast to other systems. The aim of this study was therefore to
investigate to which extent these fluctuations could be trophodynamically mediated. The
trophic ecology of both fish species was characterised over three contrasting periods (spring
2010 and 2011 and autumn 2011) in the area, in relation to potential variation in the abundance
and composition of the mesozooplankton resource. Stable isotope analyses of carbon (δ13C) and
nitrogen (δ15N) were performed on potential mesozoplanktonic prey items and in the muscle of
adult fish, as well as in the liver whenever available, and mixing models were applied. In both
springs, the mesozooplankton resource was abundant but qualitatively different. During this
period of the year, results based on muscle isotope values in particular showed that S. pilchardus
and E. encrasicolus likely do not compete strongly for food. On the medium term, E.
encrasicolus always presented a greater trophic plasticity than S. pilchardus, both in terms of
feeding areas and in the size of the mesozooplanktonic prey consumed. In autumn,
mesozooplankton abundances were lower, and it was likely that S. pilchardus and E.
encrasicolus share food resources during this period. No clear links between the variation in
the mesozooplanktonic resource and the trophic segregation maintained between adults of both
fish species in spring could be made. Although a certain potential exists for trophodynamically
mediated fluctuations of both species under specific abiotic conditions (i.e. due to the existing
trophic segregation in spring in particular), the overall results suggest that fluctuations in
abundance of both fish species are probably not directly linked to their trophic ecology in the
Bay of Biscay, at least at the level of adult individuals.
Keywords: plankton-feeding fish; mesozooplankton; copepods; stable isotopes; trophic
interactions; temperate ecosystem

1. Introduction
Forage fish such as sardines and anchovies have a key role in marine pelagic
ecosystems, representing the main pathway by which energy and nutrients are transported from
lower (i.e. plankton) to upper trophic levels (i.e. marine mammals, large fish and seabirds)
(Cury et al. 2000). However, the stocks of these small pelagic fish can be highly variable over
time (e.g. Schwartzlose et al. 1999). These fluctuations can lead to considerable changes in the
structure and function of marine ecosystems and in turn impact fisheries (FAO 2012).
Understanding the processes involved in the fluctuations of forage fish abundance therefore
appears critical to maintain marine ecosystem services.
For many years, in several marine ecosystems and notably those subjected to upwelling
events where sardines and anchovies cohabit (e.g. Benguela Current ecosystem on the South
African coast or Humboldt Current ecosystem on the Peruvian coast), alternative abundance
fluctuations in the populations of both species have been reported (e.g. Lluch-Belda et al. 1989;
Barange et al. 2009). Several hypotheses have been proposed to explain these sardine-anchovy
fluctuations. Some of these hypotheses rely on the effects of physical, atmospheric and
oceanographic regime such as climatic oscillations that potentially control the survival and/or
recruitment of one of the other species (e.g. Lluch-Belda et al. 1992; Chavez et al. 2003; Alheit
et al. 2012). Takasuka et al. (2007) also proposed that both species display differential ‘optimal
growth temperatures’, so that different climatic conditions can favour one species or the other
during early life stages. This hypothesis extends the ‘optimal environmental window’ theory of
Cury and Roy (1989), establishing the conditions for the recruitment success of pelagic fish in
upwelling areas. Other hypotheses proposed for explaining sardine-anchovy alternations
include biological controlling factors, such as intra-guild predation (e.g. Irigoien and De Roos
2011), or trophodynamically mediated fluctuations with the resource’s variability favouring one
species or the other (e.g. Van der Lingen et al. 2006). Some studies that have investigated the
diet of both species simultaneously (e.g. Louw et al. 1998; Van der Lingen et al. 2006; Espinoza
et al. 2009) have effectively demonstrated that sardines and anchovies (generally adult
individuals) show distinct feeding strategies, especially in terms of the size of copepod they
preferentially consume. Hence, warmer or cooler oceanographic regimes would favour the
development of small or larger planktonic prey species, and thus one or other small pelagic
predator. Simply determining the effects of abiotic factors influencing both the recruitment and
survival of early life stages is thus not sufficient to understand fluctuations in the abundance of
small pelagic fish. The knowledge of trophic interactions between species as well as
fluctuations in food resource and their impact on trophic interactions also appears a crucial step.
Stable isotope analysis (SIA) of carbon (δ13C) and nitrogen (δ15N) of the tissues of
consumers and their putative prey has proven to be a powerful tool to describe the trophic
ecology of marine organisms, representing an alternative or complementary tool to the
traditional methods of dietary studies such as the analysis of stomach contents (Michener and
Kaufman 2007). Primary producers of an ecosystem generally display different isotopic
compositions (Peterson and Fry 1987; France 1995), and the enrichment in 13C and 15N between
a source and its consumer (also called trophic enrichment factor, TEF) is relatively predictable.
This enrichment is less important in 13C (≤1 ‰) than in 15N (3.4 ‰ on average) (De Niro and
Epstein 1978, 1981; Post 2002). Hence, δ13C values are generally considered as a conservative
tracer of the primary producer at the base of the food web supporting consumers, and
consequently a tracer of their foraging habitat (France 1995; Hobson 1999). Alternatively, δ15N
values are generally used as a proxy of their trophic position (Vander Zanden et al. 1997; Post
2002). Furthermore, for some years, mixing models integrating δ13C and δ15N values of prey
and predators have proved their utility to decipher the contribution of different prey items in
the diet of a predator (Parnell et al. 2010, 2013; Phillips et al. 2014). This may be particularly
useful when studying the trophic links between plankton and small pelagic planktivorous fish
(e.g. Costalago et al. 2012), because of the peculiar difficulty in observing direct interactions
between these organisms in the open water environment, and because the small size of plankton
can make stomach content analysis particularly difficult. Moreover, isotope values provide
information on the food assimilated at a time scale that depends on the turnover of the tissue
analysed (Tieszen et al. 1983; Hobson and Clark 1992; Sponheimer et al. 2006). For instance,
carbon and nitrogen half-lives in fish tissues were shown to vary from 5–14 days in the liver to
19–21 days in the muscle of the juvenile Japanese bass Lateolabrax japonicus (Suzuki et al.
2005), from 3–9 days in the liver to 25–28 days in the muscle of the juvenile sand goby
Pomatoschistus minutus (Guelinckx et al. 2007) and from 10–20 days in the liver to 49–107
days in the muscle of the flat fish Paralichthys dentatus (Buchheister and Latour 2010).
The Bay of Biscay is a very large bay located in the north-east Atlantic Ocean. It
supports a rich fauna including many protected species, e.g. marine mammals, seabirds, sharks
and rays, and is subjected to numerous anthropogenic activities including important fisheries
(Lorance et al. 2009; OSPAR 2010). In particular, European sardine (Sardina pilchardus) and
European anchovy (Engraulis encrasicolus) fisheries are of major importance in the area (ICES
2010a). No quota currently exists for sardine despite an observed decrease in their catches in
this area (OSPAR 2010). Conversely, a decrease in anchovy stocks during the 2000s led to the
closing of its fishery in 2005. The moratorium ended in 2010 and finally resulted in the
establishment of quotas for this species (ICES 2010a, b). In the Bay of Biscay, strong
fluctuations in the abundance of small pelagic fish such as sardines and anchovies have been
observed for several years (ICES 2010a). However, in contrast to upwelling areas where
alternative abundance fluctuations have been demonstrated and/or linked to climatic events or
biological controlling factors (see above), no clear relationships between both fish species have
yet been shown in the Bay of Biscay ecosystem. Sardine and anchovy have always
demonstrated both alternation and co-occurrence in spring-survey data (ICES 2010b), and no
obvious controlling factors have been identified to-date explaining general fluctuations in the
abundances of small pelagic fish in the area. Besides, an ecological network analysis of the Bay
of Biscay continental food web provided evidence that bottom-up processes play a significant
role in the population dynamics of upper trophic levels and in the global structuring of this
marine ecosystem (Lassalle et al. 2011).
In a previous study in the area, Chouvelon et al. (2014) examined the trophic ecology
of adults of the two fish species by SIA during a single specific period (spring 2010). The
authors highlighted a trophic segregation between species during the study period. This may
support the hypothesis that fluctuations of both fish species’ abundances could be, at least in
part, trophodynamically mediated, if the food environment on the medium to long term would
tend to favour one species or the other, as a function of their respective dietary preferences (Van
der Lingen et al. 2006). However, no link could be made with food resource composition and
availability in this previous study (Chouvelon et al. 2014), because only one period of sampling
and a single tissue (muscle tissue, i.e. medium- to long-term integrator of the food assimilated)
were considered. Demonstration of such a link could highlight a strong dependency of one or
both fish species to resource composition and availability, and/or reveal a relative trophic
plasticity in one or both species relative to food resource variability. This may finally help to
understand to which extent fluctuations and/or alternations of both species may be strongly
trophodynamically mediated or not in the area.
In this general context, the aim of this study was twofold: (1) investigating intra-
(seasonal) and inter-annual variations in the trophic ecology of adult sardines and anchovies
from the Bay of Biscay; and (2) linking potential temporal variation in the diet of both fish
species with variations in the mesozooplankton resource, to depict potential differential feeding
strategies in both fish species in relation to resource variability. Several studies have highlighted
that zooplankton (and notably copepods belonging to the mesozooplankton community) are by
far the most important dietary component for sardines and anchovies compared with
phytoplankton (e.g. Van der Lingen et al. 2006; Espinoza et al. 2009; Nikolioudakis et al. 2012).
As such, we focused on mesozooplanktonic prey as the major food resource for both fish species
in the present study. Three different periods of sampling with contrasting abiotic conditions
were considered, with one of these periods referring to those investigated by Chouvelon et al.
(2014). SIA was undertaken on identified mesozooplanktonic prey and predators and mixing
models used to estimate consumption patterns. The results obtained provide some
understanding as to what extent potential trophodynamic differences and/or dependence on
food resource variability (composition and availability) can influence fluctuations and/or
alternations of both fish species abundances in the highly productive Bay of Biscay area.
2. Materials and Methods
Mesozooplankton and fish samples were collected in the spring of 2010 and 2011 and
autumn of 2011, during sea surveys conducted by the French Research Institute for the
Exploitation of the Sea (IFREMER) on the continental shelf to the shelf-edge of the Bay of
Biscay: PELGAS 2010 and PELGAS 2011 surveys (25 April–5 June 2010 and 26 April–4 June
2011, respectively) and EVHOE 2011 survey (18 October–30 November 2011). As noted
above, isotope values of samples from the PELGAS 2010 survey were presented in a previous
study in the area (Chouvelon et al. 2014), as well as the methodological aspects related to the
study of trophic relationships between mesozooplankton and planktivorous fish through SIA.
Isotope results of the spring 2010 survey are thus only used here for direct comparison with the
two other periods examined (i.e. spring and autumn 2011) and further link with the variation in
resource abundance between the three periods.
These seasons were selected for sampling for various reasons regarding the objectives of
the study. First, it was hypothesised that food resource abundance and composition would
greatly differ between spring and autumn, i.e. between seasons presenting different
environmental conditions in temperate areas such as the Bay of Biscay (Villate et al. 1997;
Valdés and Moral 1998; Zarauz et al. 2007). Moreover, survey data indicated that both
springtime periods were different in terms of temperature and salinity patterns in particular,
potentially leading to different food resource availability as well (i.e. warmer sea surface
temperatures during the spring 2011 campaign, in comparison with the spring 2010 campaign;
IFREMER survey data, see also www.previmer.org/observations). Finally, sampling seasons
were chosen with regard to the main spawning period of both fish species, potentially driving
different feeding strategies in the study fishes. Indeed, for the Bay of Biscay anchovy, the peak
spawning period has been reported to be in spring (i.e. May–June; Motos 1996), and the onset
of spawning is concurrent with the sharp seasonal increase in surface temperature (ICES
2010b). Even though feeding migrations would occur after spawning (i.e. in summer and
autumn), with fat content increasing during these seasons (Dubreuil and Petitgas 2009),
anchovy continue to feed during the spawning season (Plounevez and Champalbert 1999), with
the duration of the spawning season depending on energy intake during this period (ICES
2010b). For the Atlanto-Iberian and Biscay sardine, the main spawning period is between
October and June and thus partly overlaps with those of anchovy in the Bay of Biscay (ICES
2010b). As for anchovy, fat content peaks in early autumn (i.e. beginning of the spawning
season), although sardines also feed throughout the year (ICES 2010b).
Mesozooplankton were collected by vertical trawls of 200-μm mesh-size WP2 nets, from
100 m depth (or bottom depth for inshore stations) to the surface. 10–16 stations were selected
depending on the survey (Fig. 1). During PELGAS (spring) surveys, the stations followed
transects used for the hydroacoustic assessment of small pelagic fish biomass. They were thus
distributed from the north to the south of the Bay of Biscay and from the coastline (C) to the
continental slope (Sl) including stations over the continental shelf (Sh) (Fig. 1a). During
PELGAS 2011, one oceanic (O) station was also considered (Fig. 1b). During EVHOE 2011
survey, stations followed randomly distributed fishing trawls, although as in PELGAS the
stations were selected in order to cover all the Bay of Biscay area (Fig. 1c). After collection,
mesozooplankton samples were concentrated on a 200 μm mesh and preserved in 70 % ethanol
for further taxonomic identification and stable isotope analysis.
Adult sardines and anchovies were collected by pelagic trawls during PELGAS surveys
(76 × 70 trawl with vertical opening of ~25 m or 57 × 52 trawl with vertical opening 15–20
m) and by bottom trawls during EVHOE survey (large vertical opening (GOV) trawl 36/47).
This is due to a difference in the main initial objectives of the surveys (i.e. assessing abundance
and distribution of pelagic fish in the Bay of Biscay using acoustic method during PELGAS;
and assessing abundance and distribution of demersal and benthic resources using bottom trawl
during EVHOE). During each survey and for each fish species, individuals were collected in
7–8 trawls over the continental shelf (Fig. 1). In some trawls, both species occurred at the same
time; however, this does not indicate that they come from the same shoal given the duration of
each trawl (between 30 and 60 min). Fish were immediately frozen at −20 °C until further
dissection and analyses back to the laboratory.
2.1 Taxonomic determination of mesozooplankton and preparation for analysis
Taxonomic identification of mesozooplankton was carried out at the laboratory with a
Leica M3Z stereo microscope (mag. ×65 to ×160), to genus and to species level whenever
possible. For each spring station, identified taxa contributing at least 5 % of the total abundance
of the sample both in number (individuals m−3) and in biomass (mg m−3) (i.e. ‘dominant taxa’),
and likely to be part of the diet of sardines and anchovies (i.e. species that may be found in
stomach contents of anchovies from the Bay of Biscay area as reported by Plounevez and
Champalbert (1999)), were sorted for further SIA. For each autumn station, as the diversity was
lower, only identified taxa contributing at least to 10 % of the total abundance of the sample
both in number and in biomass were subsequently sorted for SIA. As such, one to four
‘dominant taxa’ were analysed for stable isotope ratios within each of the stations sampled over
the three periods. Details for the calculation of the relative abundance of each identified taxa in
number and in biomass can be found in Chouvelon et al. (2014).
Depending on their size, 20–350 individuals belonging to each of the ‘dominant taxa’
were taken out from ethanol and carefully washed with distilled water in order to completely
remove the ethanol, detritus and phytoplankton. Sorted and washed organisms were finally
frozen at −80 °C for 48 h to be freeze-dried (24 h). A pool of individuals for each species sorted
by station was then packed into 2 tin capsules for stable isotope analysis (i.e. half of sorted
organisms within each capsule), and the mean value of the two capsules was used in further
data analyses (Chouvelon et al. 2014).
For each fish species and for each survey, 30 to 40 adult individuals of similar size
classes (average total length ± standard deviation (SD) of 18.1 ± 2.2 and 13.9 ± 1.6 cm for
sardines and anchovies, respectively) were defrosted and dissected at the laboratory to obtain
portions of dorsal white muscle as well as the liver (Pinnegar and Polunin 1999). Specifically,
the average total length for sardines was of 17.3 ± 2.6, 18.7 ± 0.7 and 18.4 ± 2.6 cm for
individuals collected in spring 2010, spring 2011 and autumn 2011, respectively. The average
total length for anchovies was of 14.6 ± 1.8, 13.3 ± 1.1 and 13.7 ± 1.5 cm for individuals
collected in spring 2010, spring 2011 and autumn 2011, respectively. Within each species and
at each season, these sizes corresponded to mature individuals and allowed comparison of
morphologically similar fishes (i.e. adult individuals) at the three seasons investigated. Also,
sardines were larger than anchovies, because the size at maturity is higher for sardines (i.e.
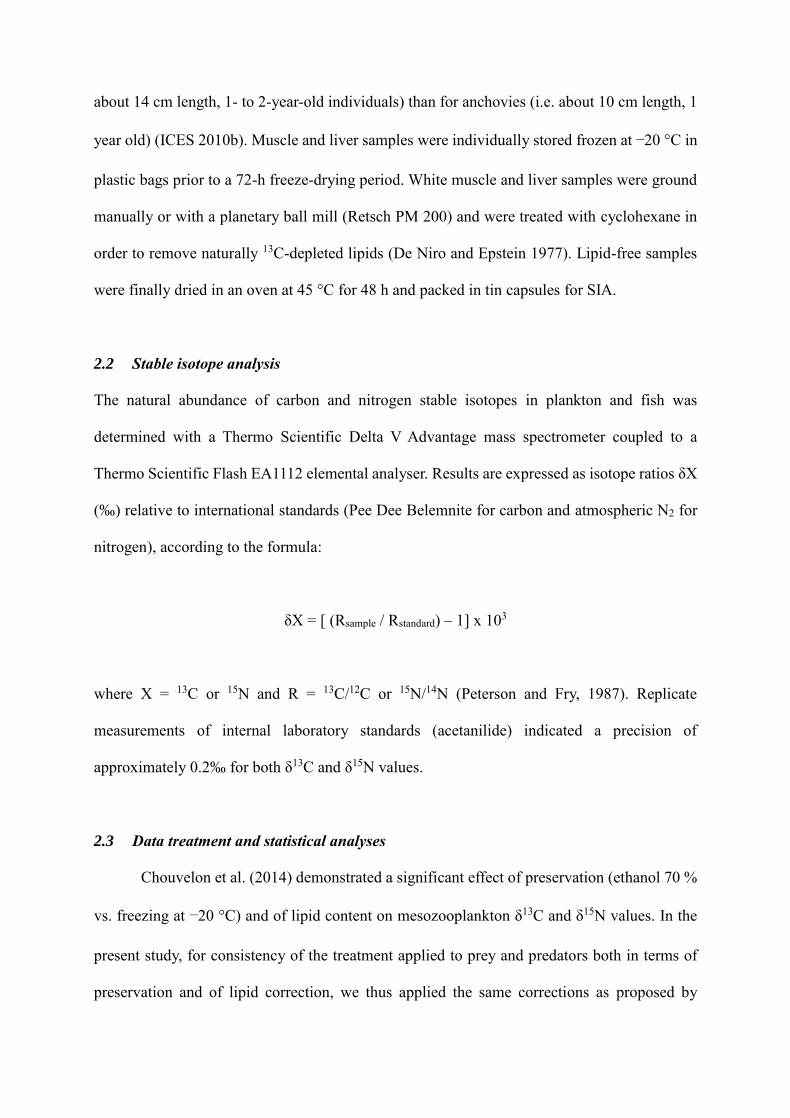
about 14 cm length, 1- to 2-year-old individuals) than for anchovies (i.e. about 10 cm length, 1
year old) (ICES 2010b). Muscle and liver samples were individually stored frozen at −20 °C in
plastic bags prior to a 72-h freeze-drying period. White muscle and liver samples were ground
manually or with a planetary ball mill (Retsch PM 200) and were treated with cyclohexane in
order to remove naturally 13C-depleted lipids (De Niro and Epstein 1977). Lipid-free samples
were finally dried in an oven at 45 °C for 48 h and packed in tin capsules for SIA.
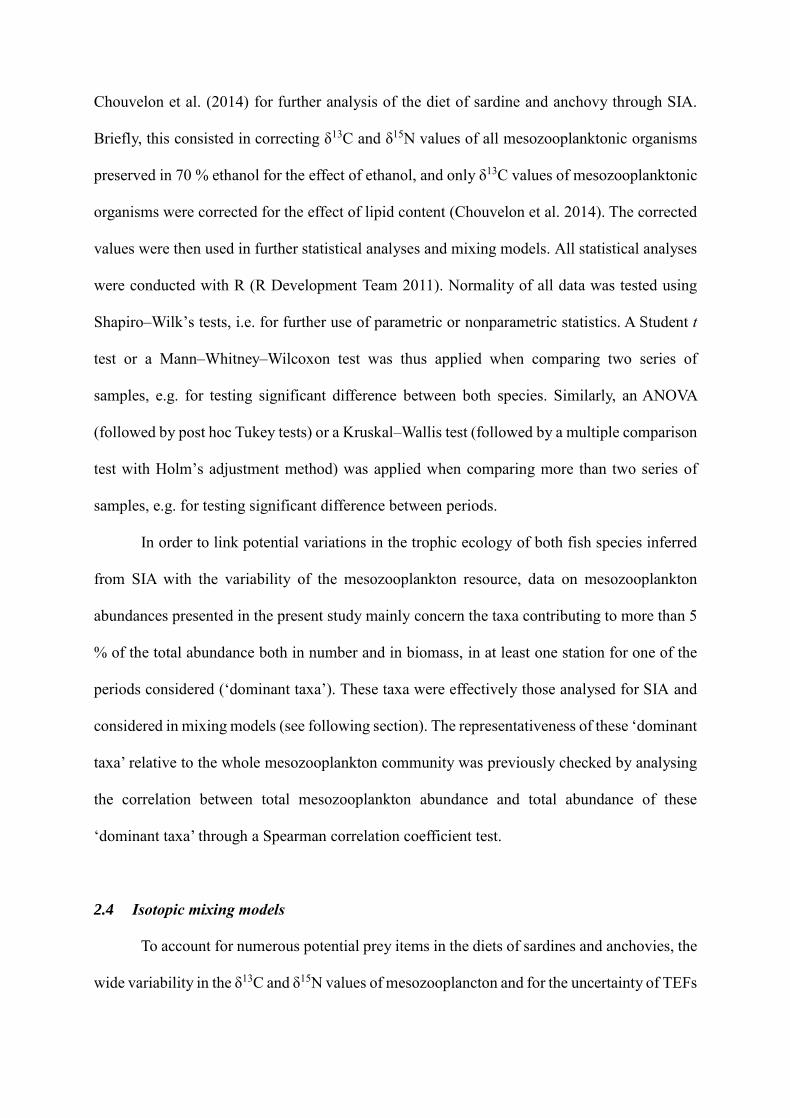
2.2 Stable isotope analysis
The natural abundance of carbon and nitrogen stable isotopes in plankton and fish was
determined with a Thermo Scientific Delta V Advantage mass spectrometer coupled to a
Thermo Scientific Flash EA1112 elemental analyser. Results are expressed as isotope ratios δX
(‰) relative to international standards (Pee Dee Belemnite for carbon and atmospheric N2 for
nitrogen), according to the formula:
δX = [ (Rsample / Rstandard) – 1] x 103
where X = 13C or 15N and R = 13C/12C or 15N/14N (Peterson and Fry, 1987). Replicate
measurements of internal laboratory standards (acetanilide) indicated a precision of
approximately 0.2‰ for both δ13C and δ15N values.
2.3 Data treatment and statistical analyses
Chouvelon et al. (2014) demonstrated a significant effect of preservation (ethanol 70 %
vs. freezing at −20 °C) and of lipid content on mesozooplankton δ13C and δ15N values. In the
present study, for consistency of the treatment applied to prey and predators both in terms of
preservation and of lipid correction, we thus applied the same corrections as proposed by
Chouvelon et al. (2014) for further analysis of the diet of sardine and anchovy through SIA.
Briefly, this consisted in correcting δ13C and δ15N values of all mesozooplanktonic organisms
preserved in 70 % ethanol for the effect of ethanol, and only δ13C values of mesozooplanktonic
organisms were corrected for the effect of lipid content (Chouvelon et al. 2014). The corrected
values were then used in further statistical analyses and mixing models. All statistical analyses
were conducted with R (R Development Team 2011). Normality of all data was tested using
Shapiro–Wilk’s tests, i.e. for further use of parametric or nonparametric statistics. A Student t
test or a Mann–Whitney–Wilcoxon test was thus applied when comparing two series of
samples, e.g. for testing significant difference between both species. Similarly, an ANOVA
(followed by post hoc Tukey tests) or a Kruskal–Wallis test (followed by a multiple comparison
test with Holm’s adjustment method) was applied when comparing more than two series of
samples, e.g. for testing significant difference between periods.
In order to link potential variations in the trophic ecology of both fish species inferred
from SIA with the variability of the mesozooplankton resource, data on mesozooplankton
abundances presented in the present study mainly concern the taxa contributing to more than 5
% of the total abundance both in number and in biomass, in at least one station for one of the
periods considered (‘dominant taxa’). These taxa were effectively those analysed for SIA and
considered in mixing models (see following section). The representativeness of these ‘dominant
taxa’ relative to the whole mesozooplankton community was previously checked by analysing
the correlation between total mesozooplankton abundance and total abundance of these
‘dominant taxa’ through a Spearman correlation coefficient test.
2.4 Isotopic mixing models
To account for numerous potential prey items in the diets of sardines and anchovies, the
wide variability in the δ13C and δ15N values of mesozooplancton and for the uncertainty of TEFs
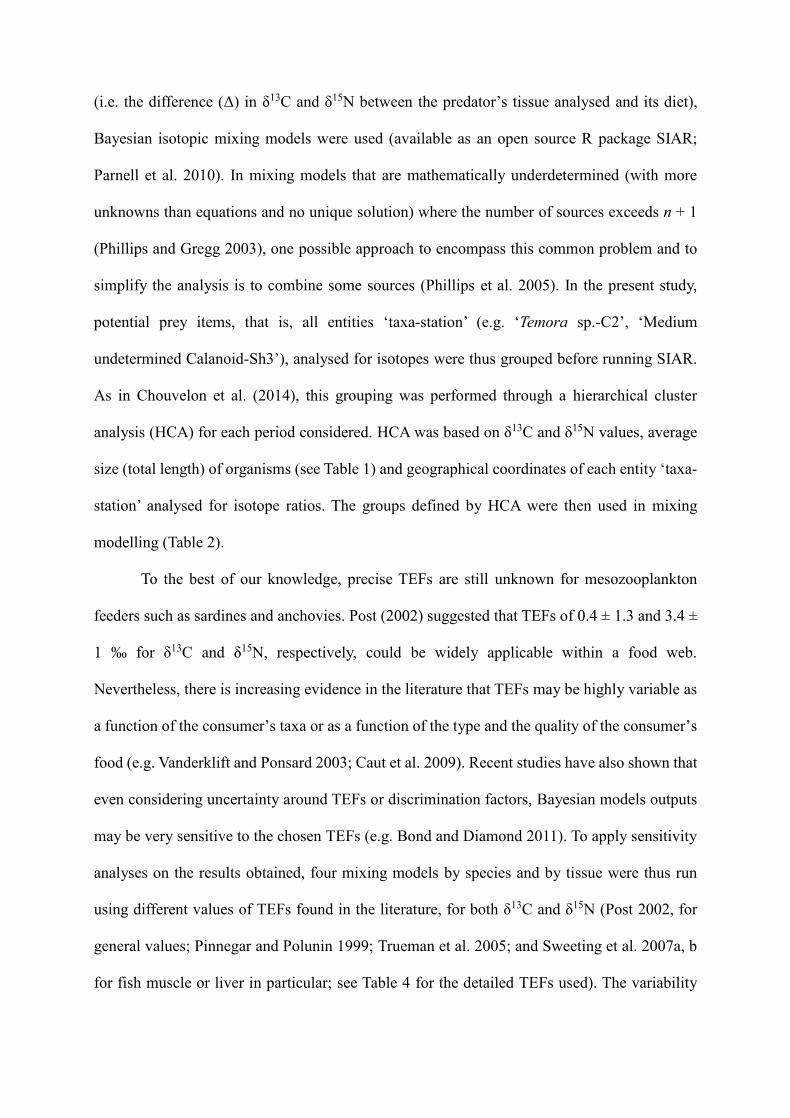
(i.e. the difference (Δ) in δ13C and δ15N between the predator’s tissue analysed and its diet),
Bayesian isotopic mixing models were used (available as an open source R package SIAR;
Parnell et al. 2010). In mixing models that are mathematically underdetermined (with more
unknowns than equations and no unique solution) where the number of sources exceeds n + 1
(Phillips and Gregg 2003), one possible approach to encompass this common problem and to
simplify the analysis is to combine some sources (Phillips et al. 2005). In the present study,
potential prey items, that is, all entities ‘taxa-station’ (e.g. ‘Temora sp.-C2’, ‘Medium
undetermined Calanoid-Sh3’), analysed for isotopes were thus grouped before running SIAR.
As in Chouvelon et al. (2014), this grouping was performed through a hierarchical cluster
analysis (HCA) for each period considered. HCA was based on δ13C and δ15N values, average
size (total length) of organisms (see Table 1) and geographical coordinates of each entity ‘taxa-
station’ analysed for isotope ratios. The groups defined by HCA were then used in mixing
modelling (Table 2).
To the best of our knowledge, precise TEFs are still unknown for mesozooplankton
feeders such as sardines and anchovies. Post (2002) suggested that TEFs of 0.4 ± 1.3 and 3.4 ±
1 ‰ for δ13C and δ15N, respectively, could be widely applicable within a food web.
Nevertheless, there is increasing evidence in the literature that TEFs may be highly variable as
a function of the consumer’s taxa or as a function of the type and the quality of the consumer’s
food (e.g. Vanderklift and Ponsard 2003; Caut et al. 2009). Recent studies have also shown that
even considering uncertainty around TEFs or discrimination factors, Bayesian models outputs
may be very sensitive to the chosen TEFs (e.g. Bond and Diamond 2011). To apply sensitivity
analyses on the results obtained, four mixing models by species and by tissue were thus run
using different values of TEFs found in the literature, for both δ13C and δ15N (Post 2002, for
general values; Pinnegar and Polunin 1999; Trueman et al. 2005; and Sweeting et al. 2007a, b
for fish muscle or liver in particular; see Table 4 for the detailed TEFs used). The variability
around δ13C and δ15N values of each source taken into account in the mixing models
corresponded to the standard deviation around the mean of each source group (i.e. SD given in
Table 2). For each period considered, for each tissue and for each species, an average value of
the estimated contribution of each group of mesozooplankonic prey was finally calculated from
the four mixing models applied (Table 4).
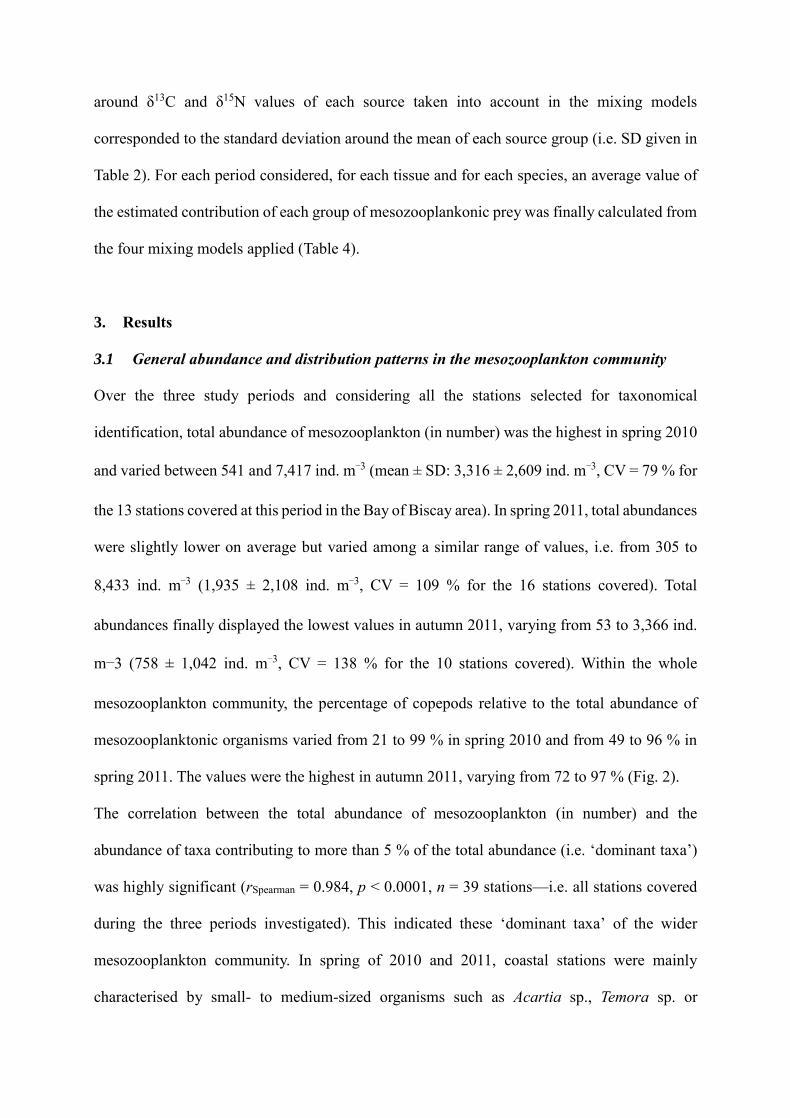
3. Results
3.1 General abundance and distribution patterns in the mesozooplankton community
Over the three study periods and considering all the stations selected for taxonomical
identification, total abundance of mesozooplankton (in number) was the highest in spring 2010
and varied between 541 and 7,417 ind. m−3 (mean ± SD: 3,316 ± 2,609 ind. m−3, CV = 79 % for
the 13 stations covered at this period in the Bay of Biscay area). In spring 2011, total abundances
were slightly lower on average but varied among a similar range of values, i.e. from 305 to
8,433 ind. m−3 (1,935 ± 2,108 ind. m−3, CV = 109 % for the 16 stations covered). Total
abundances finally displayed the lowest values in autumn 2011, varying from 53 to 3,366 ind.
m−3 (758 ± 1,042 ind. m−3, CV = 138 % for the 10 stations covered). Within the whole
mesozooplankton community, the percentage of copepods relative to the total abundance of
mesozooplanktonic organisms varied from 21 to 99 % in spring 2010 and from 49 to 96 % in
spring 2011. The values were the highest in autumn 2011, varying from 72 to 97 % (Fig. 2).
The correlation between the total abundance of mesozooplankton (in number) and the
abundance of taxa contributing to more than 5 % of the total abundance (i.e. ‘dominant taxa’)
was highly significant (rSpearman = 0.984, p < 0.0001, n = 39 stations—i.e. all stations covered
during the three periods investigated). This indicated these ‘dominant taxa’ of the wider
mesozooplankton community. In spring of 2010 and 2011, coastal stations were mainly
characterised by small- to medium-sized organisms such as Acartia sp., Temora sp. or
Appendicularia (Fig. 3a). The large copepod C. helgolandicus (especially abundant in spring
2010) or the smaller Oithona sp. were more abundant in stations from the shelf and/or from the
slope, or in the station O4 from the oceanic area sampled in spring 2011. In autumn 2011, the
copepods Oncaea sp. and Temora sp. were the most abundant in stations located near the coast
and/or on the shelf, while large decapod larvae were abundant in two out of the ten stations
analysed. Total abundances in stations located on or near the slope were very low at this period
(Fig. 3).
Finally, the proportion of small organisms (see Table 1 for size ranges) was relatively stable
throughout the three periods considered, varying between 51 and 55 % relative to the whole
mesozooplankton community (i.e. community now represented by the ‘dominant taxa’) (Fig.
4a). The proportion of medium-sized organisms was higher in both spring and autumn 2011 (44
and 43 %, respectively) than in spring 2010 (34 %), whereas the proportion of large organisms
such as C. helgolandicus was the highest in spring 2010 (16 vs. 4 and 2 % in spring and autumn
2011, respectively) (Fig. 4a). Abundances of organisms were the highest in stations from the
coast and from the shelf both in spring and autumn 2011 (Figs. 3, 4). However, in spring 2011,
a non-negligible part of the total abundance of mesozooplankton also belonged to stations from
the slope (i.e. 21 %), as well as in spring 2010 where high abundances of organisms were found
in the more oceanic stations (i.e. 32 %) (Figs. 3, 4).
3.2 Definition of prey groups and variability of mesozooplankton 13C and 15N values
The HCA defined eight, nine and six groups of prey for spring 2010, spring 2011 and autumn
2011, respectively (Table 2). As such, the groups respected a certain ecological significance for
further interpretation of the results of isotopic models, both in terms of sizes of organisms and
in terms of their sampling location. Isotope values of the different groups were relatively distinct
from each other (Table 2). Average δ15N values varied from 4.2 ± 0.6 (group 1) to 7.2 ± 0.9 ‰
(group 8) in spring 2010, from 4.6 ± 0.3 (group 1) to 8.9 ± 0.6 ‰ (group 6) in spring 2011 and
from 2.4 ± 0.2 (group 1) to 7.0 ± 0.4 ‰ (group 4) in autumn 2011. Average δ13C values varied
from −22.2 ± 0.1 (group 6) to −19.4 ± 0.3 ‰ (group 2) in spring 2010, from −21.8 ± 0.4 (group
1) to −19.0 ± 0.6 ‰ (group 7) in spring 2011 and from −20.9 ± 0.0 (group 4) to −20.2 ± 0.2 ‰
(group 5) in autumn 2011 (Table 2). Groups with large-bodied organisms generally displayed
higher δ15N values than those containing small- to medium-sized organisms within a same area.
Also, within a same range of sizes, organisms collected in coastal waters generally displayed
higher δ15N values than those collected in more oceanic waters (Table 2). For instance, in spring
2010, large organisms from the shelf to the slope in the northern part (group 5) showed an
average δ15N value of 7.1 ± 0.9 ‰. On the contrary, the average δ15N value of small- to medium-
sized organisms from the slope in the northern part (group 1) was of 4.2 ± 0.6 ‰, and in the
same area, small- to medium-sized organisms from the coast to the shelf in the northern part
(group 4) displayed an average δ15N value of 7.0 ± 0.6 ‰. In spring 2011, the same pattern of
differences could be observed between these three types of groups collected in the northern part
(corresponding to group 3, groups 1 and 2 considered together and group 6, respectively). This
was also the case of groups from the southern area. Large organisms from the shelf to the slope
(group 7) showed an average δ15N value of 7.6 ± 0.7 ‰, while those of small- to medium-sized
organisms from shelf to the slope (group 4) was of 5.6 ± 0.5 ‰. Small- to medium-sized
organisms from the coast to the shelf (group 8) displayed an average δ15N value of 7.2 ± 0.3 ‰
(Table 2).
3.3 Fish muscle 13C and 15N values and isotopic mixing models
Within each of the three periods considered, S. pilchardus and E. encrasicolus differed
significantly for both muscle δ13C and δ15N values (all p values <0.05; Table 3). E. encrasicolus
always had lower δ13C and δ15N values on average than S. pilchardus (Table 3; Fig. 5). In S.
pilchardus, individuals sampled in autumn 2011 displayed significantly lower muscle δ13C
values than individuals sampled in both spring 2010 and 2011, while δ15N values were not
significantly different between periods (p values >0.05, Table 3). In contrast to E. encrasicolus,
muscle δ13C values were not significantly different between individuals collected at the three
periods, but individuals collected in autumn 2011 showed significantly higher δ15N values than
those sampled in springs 2010 and 2011 (Table 3; Fig. 5).
In spring 2010, three groups out of the eight previously defined mainly contributed to the
diet of S. pilchardus, whatever the TEF used: group 8 corresponding to small- to medium-sized
organisms from the coast to the shelf in the central to southern part (average mean contribution
± SD = 43.7 ± 5.9 %), group 4 corresponding to small- to medium-sized organisms from the
coast to the shelf in the northern part (28.9 ± 9.6 %) and in lower proportion group 5
corresponding to large organisms from the shelf to the slope in the northern part (14.7 ± 9.5 %;
Table 4). The same three groups presented the highest estimated contribution in the diet of E.
encrasicolus as well (22.3 ± 7.7, 19.3 ± 7.7 and 17.6 ± 10.0 % for groups 8, 4 and 5,
respectively). However, in the latter species, two other groups also contributed significantly to
its diet (i.e. average contribution close to or ≥10 %), namely group 6 corresponding to large
organisms from the slope in the central to southern part (13.1 ± 11.8 %) and group 2 containing
medium-sized organisms from the coast to the shelf in the central to northern part (11.3 ± 10.8
%; Table 4).
In spring 2011, four groups out of the nine defined mainly contributed to the diet of S.
pilchardus and E. encrasicolus (i.e. average contribution ≥10 % in both species): group 6
containing small- to medium-sized organisms from the coast in the northern part (40.8 ± 16.0
and 11.2 ± 8.1 % in S. pilchardus and E. encrasicolus, respectively), group 3 corresponding to
large organisms from the shelf to the slope in the northern part (17.4 ± 13.8 and 29.6 ± 24.8 %
in S. pilchardus and E. encrasicolus, respectively), group 8 corresponding to small- to medium-
sized organisms from the coast to the shelf in the southern part (12.4 ± 13.0 and 11.7 ± 14.7 %
in S. pilchardus and E. encrasicolus, respectively) and finally group 7 including large organisms
from the shelf to the slope in the southern part (12.1 ± 12.1 and 9.5 ± 9.8 % in S. pilchardus
and E. encrasicolus, respectively). In total, these four groups (i.e. groups 3, 6, 7 and 8)
contributed on average to 82.7 and 62.0 % to the diet of S. pilchardus and E. encrasicolus,
respectively (Table 4). However, group 6 presented the highest contribution in S. pilchardus
(40.8 ± 16.0 %) whatever the TEF used, the group 3 was the most significant group in the diet
of E. encrasicolus (29.6 ± 24.8 %) in three out of the four models performed (Table 4).
Mixing models performed on δ13C and δ15N values in the muscle of the fish sampled in
autumn 2011 highlighted the major contribution of three of the six groups defined in the diet of
both species. In total, group 4 (corresponding to small- to medium-sized organisms from the
coast to the shelf in the northern part) and group 5 (containing small- to medium-sized
organisms from the coast to the shelf in the central part) both contributed on average 76.5 and
69.7 % to the diet of S. pilchardus and E. encrasicolus, respectively (Table 4). Group 6
including small- to medium-sized organisms from the coast to the slope in the southern part
was the third contributor to the diet of both species, with an average contribution of 12.6 ± 7.2
and 14.0 ± 6.8 % in S. pilchardus and E. encrasicolus, respectively (Table 4).
3.4 Fish liver 13C and 15N values and isotopic mixing models
In both spring and autumn 2011, S. pilchardus and E. encrasicolus differed significantly in
liver δ13C values (both p values <0.05). E. encrasicolus always displayed lower δ13C values on
average than S. pilchardus (Table 3; Fig. 5). However, liver δ15N values did not differ
significantly between both species at both periods. In S. pilchardus, individuals sampled in
autumn 2011 showed significantly lower δ13C values and higher δ15N values than those sampled
in spring 2011. In E. encrasicolus, individuals collected in autumn 2011 had higher average
δ15N values than those sampled in spring 2011, but δ13C values did not differ between seasons
(Table 3, Fig. 5).
Interestingly, in both species, mixing models performed on liver δ13C and δ15N values of
the fish sampled in spring 2011 showed an average contribution of all the defined prey groups
≥5 % (Table 4). Four to five groups out of the nine defined presented an average contribution ≥
10 % in both species, with group 6 (containing small- to medium-sized organisms from the
coast in the northern part), group 3 (including large organisms from the shelf to the slope in the
northern part) and group 9 (corresponding to small- to medium-sized organisms from the
oceanic area) being common major groups (given here in the increasing order of contribution)
for both fish species. Other major groups contributing to their short-term diet were group 4
(including small- to medium-sized organisms from the shelf to the slope in the central to
southern part) and group 8 (corresponding to small- to medium-sized organisms from the coast
to the shelf in the northern part) in S. pilchardus, and the group 1 in E. encrasicolus (containing
small- to medium-sized organisms from the slope in the northern part) (Table 4).
In autumn 2011, the results of the mixing models based on liver tissues were quite similar
to those obtained with models performed on muscle δ13C and δ15N values. The same three
groups out of the six defined contributed significantly to the diet of both species (i.e. groups 4,
5 and 6). Group 4 (corresponding to small- to medium-sized organisms from the coast to the
shelf in the northern part) contributed more than 50 % on average to the diet of both species
(53.7 ± 20.6 and 53.0 ± 28.3 % in S. pilchardus and E. encrasicolus, respectively; Table 4).
Group 2 including small- to medium-sized organisms from the slope in the northern part also
contributed 10.7 ± 5.3 % on average to the short-term diet of E. encrasicolus.
4. Discussion
4.1 Spatial, temporal and size-related variability of mesozooplankton abundances and
isotope values over time
With all stations taken into account within a given period, the average total abundances
of mesozooplankton showed a general decreasing trend over the three periods considered with
spring 2010 > spring 2011 > autumn 2011. In all cases, copepods dominated the
mesozooplankton community, with the exception of some coastal stations (e.g. C4) that
sometimes displayed a relatively high percentage of meroplankton or other taxa (e.g.
Appendicularia, Cladocerans), especially in spring. These general patterns in the composition
of the mesozooplankton community analysed here are consistent with the current knowledge
on this compartment concerning European shelf seas (Williams et al. 1994) and more
specifically concerning the Bay of Biscay area (Villate et al. 1997; Valdés and Moral 1998;
Plounevez and Champalbert 1999; Albaina and Irigoien 2004). When focusing on abundances
and distribution of the ‘dominant taxa’, which were well correlated with total mesozooplankton
abundances, the abundances were generally higher in coastal stations and notably in autumn.
This is quite common for neritic areas at this latitude; i.e. maximum densities are generally
observed in late spring extending into summer, a secondary peak of high biomass occurs in
autumn and values are minimum in winter. In contrast, oceanic areas generally present a single
annual peak in spring, there is no autumn peak or it is very weak, and generally low summer
values are observed (Valdés and Moral 1998). In the Bay of Biscay and especially in spring,
Plounevez and Champalbert (1999) and Dupuy et al. (2011) effectively reported higher
zooplankton biomass in neritic stations and notably those located in the water plume of the
Gironde estuary, relative to more oceanic stations. However, in our study, abundances were also
quite high in stations from the slope relative to coastal stations in spring 2010, with high
densities of the copepod C. helgolandicus in particular when compared to spring 2011 (Fig. 3).
Spatio-temporal variation in mesozooplankton abundance and composition, especially
inter-annual variations (i.e. between two consecutive springs), can be directly related to spatial
and year-to-year variations in water temperature and salinity (Villate et al. 1997, Zarauz et al.
2007). Moreover, in the Bay of Biscay, the plumes of the Gironde and the Loire Rivers
considerably influence the hydrological structure and the primary production on the continental
shelf, all along the year (Planque et al. 2004; Puillat et al. 2004, 2006; Loyer et al. 2006; Dupuy
et al. 2011). Slope currents occurring on the shelf break (Koutsikopoulos and Le Cann 1996)
can also favour primary production in these waters due to nutrients inputs (e.g. Holligan and
Groom 1986). For instance, Albaina and Irigoien (2004) related peaks of mesozooplankton
abundance and distinct mesozooplankton assemblages with the plume of the Gironde River (i.e.
nutrients discharge) and the frontal structure associated with the shelf break (i.e. internal wave
generation) in the area. In our study, inter-annual variations in mesozooplankton abundances
and composition between both springtime periods can be directly linked to temperature and
salinity patterns observed during the sampling campaigns as well, and consequently to a
temporal lag between both years in the ecological processes occurring in this area in spring (i.e.
water stratification and planktonic blooms). Indeed, during the survey in spring 2010, sea
surface temperatures were low, especially in the northern part of the area (from 12 to 14.5 °C),
and river discharges were low too (IFREMER survey data; previsions for sea surface physico-
chemical parameters by date in the Bay of Biscay may be also found at
www.previmer.org/observations). Surface temperatures increased and stratification
strengthened only during the second half of the sampling campaign in spring 2010. On the
contrary, during the spring 2011 survey, sea surface temperatures over the Bay of Biscay area
were high (above the average on the time series PELGAS) and relatively homogeneous over
the whole Bay of Biscay area (from 15.5 to 17 °C on average). River discharges were as low as
in 2010, but temperature depth profiles showed a strong stratification of the water column
(IFREMER survey data). Furthermore, there was evidence that a spring bloom had occurred
before the survey in 2011. Between both surveys in springs 2010 and 2011, abiotic conditions
were thus totally different. Furthermore, the Bay of Biscay is known to face late winter
phytoplankton blooms, mainly constituted of diatoms, and this within both the Gironde and
Loire Rivers plumes (Herbland et al. 1998; Labry et al. 2001; Gohin et al. 2003; Dupuy et al.
2011). This results in early phosphorus limitation in spring that subsequently favours the
development of small autotrophic unicellular species on which microzooplankton feeds
(Sautour et al. 2000; Dupuy et al. 2011). Interestingly, in spring 2010, while temperatures were
particularly low and the spring bloom had not already occurred, large organisms such as the
copepod C. helgolandicus were more abundant than in 2011, and notably in stations from the
slope. Coastal zones effectively generally show a larger ratio of small organisms (Sourisseau
and Carlotti 2006; Irigoien et al. 2009), and neritic species of copepods are generally smaller in
body size than offshore species (Williams et al. 1994). Moreover, C. helgolandicus
preferentially feeds on diatoms (Irigoien et al. 2000), such as those that can develop in late
winter phytoplankton blooms. Differences in hydrological characteristics (e.g. temperature,
salinity and water stratification) as well as associated ecological processes described in the
literature for the Bay of Biscay area (e.g. different phytoplankton blooms between winter and
spring) may thus explain the mesozooplankton variability especially found between both
consecutive spring surveys studied here (i.e. late winter conditions in spring 2010 vs. advanced
spring conditions in spring 2011).
Alternatively, even though mesozooplankton varied greatly over the three periods
considered in terms of abundances and composition, patterns of isotopic values within this
planktonic compartment were similar from one period to another. There was some inter-specific
variability of isotope values linked to the size of organisms, as described previously in
Chouvelon et al. (2014). Larger organisms displayed higher δ15N values than smaller organisms
in a given area, reflecting an a priori higher trophic level of larger organisms in the planktonic
food web. The only exception consisted in particularly low δ15N values measured in large
decapod larvae analysed as a whole in autumn 2011. In arthropods, crude exoskeleton chitin is
effectively depleted in 15N but not in 13C (Schimmelmann and De Niro 1986). As described in
Chouvelon et al. (2014), there was also an intra-taxa variability of isotope values linked to
spatial patterns in the area, especially concerning δ15N values that were more variable than δ13C
values between mesozooplanktonic groups of prey. The temporal variability of plankton
isotopic signatures, which could have constrained the use of mixing models on liver and muscle
data from planktonic prey sampled at only one period (those of the survey), was thus negligible,
at least at the scale of the Bay of Biscay ecosystem. In fact, spatial differences in δ15N values
in particular are more likely linked to processes occurring at the dissolved inorganic nitrogen
(DIN) level (for a complete review on this subject see Sherwood and Rose 2005; Montoya
2007; and references therein). Many processes can effectively lead to enriched 15N values of
the available DIN pool, and the following general conclusions can be drawn: (1) when DIN
demand is higher than the supply of nutrients, primary producers may be faced with a 15N-
enriched nitrogen source (e.g. ‘recycled’or ammonium-enriched, especially if it comes from
higher trophic levels), which is then reflected in the local food chain. Alternatively, during
upwelling events for instance (in areas subject to this), the physical supply of ‘new’ nutrients
overwhelms the biological uptake rate and favours15N-depleted nitrogen sources (at least non-
enriched) for producers of this environment. Moreover, high primary production (blooms)
during spring on the continental shelf reduces nutrient quantities, thus favouring 15N-
enrichment of the available DIN. Even if short-lived, this effect may be lasting for benthic
consumers in particular due to the sinking of particles to the bottom; (2) rivers may be a vector
of 15N-enriched organic matter into coastal waters as well (Fry 1988; McClelland et al. 1997;
Vizzini and Mazzola 2006). All these processes can be involved in the Bay of Biscay; however,
the derived spatial patterns of δ15N values from the base of the food chain (i.e. investigated at
the mesozooplankton level here) were thus similar from one period to another.
4.2 Linking resource variability and feeding patterns of sardines and anchovies over time
During the three study periods, S. pilchardus and E. encrasicolus were well segregated by both
their δ13C and δ15N values as measured in the muscle of individuals. Moreover, mixing models
applied on this tissue (medium-term integrator of the food consumed) emphasised different
feeding strategies of the two fish species. In both spring periods surveyed (2010 and 2011), E.
encrasicolus showed a greater trophic plasticity than S. pilchardus, both in terms of feeding
areas and in terms of sizes of prey organisms among the mesozooplankton resource (i.e.
zooplankton >200 μm). Indeed, almost all the defined groups of mesozooplankton prey
presented an average contribution ≥5 % in E. encrasicolus, while only some of the defined
groups presented such a contribution to the diet of S. pilchardus in both spring periods. In terms
of feeding areas, groups 8 and 6 (in Spring 2010 and Spring 2011, respectively) containing
organisms from the coast to the slope effectively showed the highest contribution to the diet of
sardines (i.e. 43.7 ± 5.9 and 40.8 ± 16.0 %, respectively). It suggests that sardines are more
limited to coastal areas and the mesozooplanktonic species of these waters for feeding than
anchovies. Besides, these groups showed the highest δ15N values at both periods, which is in
accordance with the highest δ15N values measured in muscle tissue of S. pilchardus at the two
periods and which also suggests that the feeding pattern of pelagic fish is constrained spatially.
Indeed, in terms of sizes of prey, significantly lower δ13C and δ15N values measured in the
muscle of anchovies collected in both springs 2010 and 2011 could have been related, at first
sight, to the consumption of lower trophic level organisms in anchovies. However, the spatial
variability of δ13C and δ15N values from the base of the different food webs in the area
(Chouvelon et al. 2012), and also shown here with isotope values of mesozooplanktonic species,
rather supports the hypothesis of more offshore feeding habits for anchovies than the hypothesis
of a lower trophic level. Anchovies would effectively be able to capture larger particles than
sardines (Louw et al. 1998; Van der Lingen et al. 2006), thanks to differences in gill raker
morphology between both species and the existence of a larger branchial apparatus in anchovies
(James and Findlay 1989). In several cases, anchovies have thus been found to feed at a slightly
higher trophic level than sardines (e.g. Stergiou and Karpouzi 2002), and specifically in the Bay
of Biscay (i.e. data from Ecopath modelling; Lassalle et al. 2011). Moreover, this morphological
difference would lead anchovies to be opportunistic and efficient planktivores (James and
Probyn 1989) on prey species from the mesozooplankton compartment at least and would
confirm that E. encrasicolus is not specialist feeder in the Bay of Biscay area, as already
reported for the North and Baltic Seas (Raab et al. 2011). Such particulate feeding in anchovies
allows for a rapid and efficient intake of prey minimising metabolic costs and is thus the main
feeding mode in this species (James and Probyn 1989; Van der Lingen 1994). In contrast, filter
feeding on smaller zooplanktonic prey and/or phytoplankton would be the major feeding mode
in sardines (Van der Lingen 1994; Garrido et al. 2007). However, most dietary carbon and/or
nitrogen is obtained from zooplanktonic prey (and not phytoplankton) in adult sardines in
general (Van der Lingen 1994; Bode et al. 2004; Nikolioudakis et al. 2011; Costalago et al.
2012), and the contribution of phytoplankton to sardine diet can vary greatly at small spatial
scales and seasonally (Garrido et al. 2008).
Medium-term feeding preferences of sardines and anchovies differed within both spring periods
studied here. Alternatively, their diets were relatively similar during the autumn period
following our mixing model results, whereas average isotope values were significantly different
(although associated standard deviations were large). This may be due to the fact that the
isotopic mixing models used here consider individual fish values (i.e. consumers) and not mean
values ± SD as for prey (Parnell et al. 2010). As such, mixing models based on muscle tissues
highlighted a preference of both species for small- to medium-sized organisms from neritic
waters (i.e. from the coast to the shelf) in central and northern parts of the Bay of Biscay, which
notably corresponds to the autumn-/winter-feeding grounds described for anchovies in this area
(ICES 2010b). In fact, it appeared that the more abundant and diversified the mesozooplankton
resource is in terms of prey sizes available (i.e. with spring 2010 > spring 2011 > autumn 2011),
and the more sardines are specialised on fewer prey groups compared with anchovies (Table 2).
Indeed, 25 % of the groups of prey (i.e. three out of the eight defined) contributed on average
to 87.3 % to the medium-term diet of S. pilchardus in spring 2010, while 45 % of the groups
contributed to 82.4 % to its diet in spring 2011, and 50 % of the groups contributed to 89.1 %
to its diet in autumn 2011. In autumn 2011, the same groups contributed to 83.7 % to the
medium-term diet of E. encrasicolus. Thus, when the mesozooplankton resource is abundant
and diversified (i.e. in both springs compared with the autumn period), and while potential
competition could be high because of some spawning overlap between the two species (ICES
2010b), it is likely that the high degree of specialisation shown by sardines limits competition
with anchovies (and with other small pelagic fish in general) in spring. On the contrary, trophic
overlap could occur in autumn, when the resource is less abundant and diversified, leading to
potential competition for food between both fish species. Moreover, during this period, it has
been reported that the fat content of both species peaks (ICES 2010b), indicating a common
period of need for reserve storages before the beginning of the spawning season (i.e. for sardine)
or before winter (for anchovy). However, both species are able to feed throughout the year and
notably during the spawning season, which may limit the competition for resource in autumn
as well.
In spring 2010, major contributing groups of prey to the medium-term diet of both fish species
were mostly constituted of small- to medium-sized organisms from neritic waters, despite a
wider range of prey sizes and of feeding areas for E. encrasicolus as noticed above. In contrast,
in spring 2011, two out of the four major groups of prey for both species (i.e. contributing more
than 10 % to the medium-term diet of both species) contained large organisms from the shelf
to slope areas. Interestingly, this was not in accordance with the reported differences in
abundance and diversity of mesozooplanktonic prey between the two consecutive springs, both
in terms of sizes available (i.e. abundance of larger prey in spring 2010 > spring 2011) and in
terms of mesozooplankton distribution in the area (i.e. abundant species were more fairly
distributed between coastal and shelf to slope areas in spring 2010, whereas abundances were
slightly higher in coastal areas in spring 2011). Furthermore, if the mesozooplankton
community showed variation from one spring to another, this did not visibly impact the
medium-term feeding strategies of both species, which remained the same (i.e. general
segregation). Therefore, our results do not highlight any obvious link between variation
observed in the mesozooplankton resource and the trophic ecology of both fish species depicted
through SIA, at least concerning both spring periods studied. In autumn 2011, the spread of
isotope values for anchovies was relatively large. Chouvelon et al. (2012) already reported such
a wide range of δ15N values in anchovies sampled in the autumns of 2009 and 2010 in the Bay
of Biscay, in comparison with individuals sampled in springs 2009 and 2010 and in comparison
with sardines sampled at the same periods. As a potential explanation, the authors argued for
two different hypotheses. The first one is related to the high mobility of most small pelagic fish
species (e.g. Nøttestad et al. 1999). Indeed, we cannot exclude here a potential mixing of
individuals and/or part of the population that have fed in different areas presenting different
baseline signatures in δ15N in the Bay of Biscay, particularly in autumn when food supply is
less abundant in neritic waters. The second hypothesis refers to a possible greater trophic
plasticity of anchovies so as to avoid competition with sardines at this period of the year, as an
adjustment on behalf of the species facing variations in the food supply (e.g. Lefebvre et al.
2009). In autumn, abundances of mesozooplankton may effectively stay at levels that anyway
sustain energetic needs of both species and other plankton feeders. For instance, Plounevez and
Champalbert (1999) already suggested that feeding efficiency in E. encrasicolus would be more
related to zooplanktonspecific composition than to zooplankton abundance, even if the results
of our study cannot confirm or invalidate this hypothesis. Marquis et al. (2011) also reported
that small pelagic fish only represent 30 % of the total predation on the mesozooplanktonic
compartment in coastal stations in the Bay of Biscay (from spring data), and 60 and 65 % at the
mid-shelf and the slope stations, respectively. These authors suggested that a large fraction of
the mesozooplankton production would be then available for other planktivorous organisms
such as suprabenthic zooplankton (euphausiids and mysids) or macrozooplankton (medusa or
large tunicates) in the Bay of Biscay (Marquis et al. 2011). Finally, this could also explain why
the variations observed in the mesozooplanktonic community in the present study do not fully
correlate with the trophic ecology of adult anchovies and sardines, depicted here through SIA
over the three periods investigated.
The lack of relationships between variations in the mesozooplankton resource and the trophic
ecology of both species may be also due to the fact that until now, only the trophic ecology
inferred from muscle isotope values (i.e. a medium-term integrator of the food assimilated) was
considered because this was the tissue commonly sampled over the three periods. Indeed, as
described above, variation in the plankton community a priori depends on short-term events
such as phytoplankton blooms; so analysis of liver stable isotope values (a shorter-term
integrative tissue) could be more relevant for comparison with resource variability. As such, in
spring 2011, contrary to values measured in the muscle, δ15N values in particular measured in
the liver did not differ significantly between both species. Moreover, mixing models highlighted
a common predominant group of prey (i.e. group 6), contributing to more than 20 % in both
species and corresponding to small- to medium-sized organisms from the coast in the northern
part. In the liver tissue of fish, carbon and nitrogen half-lives were shown to be considerably
lower than in the muscle (e.g. Buchheister and Latour 2010 for flatfish) and in fact, from hepatic
results, it was likely that both sardines and anchovies appeared to be short-term opportunistic
feeders in spring 2011 (i.e. all prey groups contribution ≥5 %). Although this pattern of quite
similar average contributions for most prey groups may be an indication that the model cannot
reliably find a fit for the data, this could be also related, in terms of ecological interpretation, to
a temporary opportunistic behaviour of both species that arefacing short-term variation in food
availability. This would be also quite consistent with the fact that both species may feed during
spawning season, with the spawning season potentially overlapping between the two species
during this period (spring). However, the main contributing prey groups revealed by mixing
models based on liver isotope values did not fully correspond to the most abundant prey items
available in the Bay of Biscay at the period of sampling. So, results of mixing models performed
on the liver tissue did not reveal any clear relationships between either the food available or
that assimilated by the two fish species. Nonetheless, in autumn 2011, results obtained in the
livers corroborated those obtained in the muscles, with an apparent sharing of the
mesozooplankton resource at this period. Finally, the lack of precise TEFs for planktivorous
fish may be also responsible of potentially imprecise results, highlighting the recurrent crucial
needs for more experimental studies in isotopic ecology (Martínez del Rio et al. 2009). This is
particularly true for isotope values measured in fish liver, as many dedicated studies focus on
the muscle tissue as the reference tissue for the study of trophic interactions (Pinnegar and
Polunin 1999).
4.3 Concluding remarks and further work for understanding small pelagic fish
fluctuations
SIA represents an alternative and/or complementary method for determining the diets and
feeding strategies of small sympatric pelagic fish species (e.g. Costalago et al. 2012). The
results of the present study highlighted that it also provides useful information on potential
trophic overlap between species in the very general context of understanding forage fish
alternations and/or co-occurrence in a given area. In the Bay of Biscay, it effectively appeared
that adults of sardines and anchovies do not compete strongly for the mesozooplankton resource
in spring, where the spawning season of both species overlap and during which their energetic
needs may be increased. In autumn, potential competition for the mesozooplankton resource
may occur, although this may be compensated by the fact that both species feed throughout the
year (ICES 2010b) and notably in spring when the food resource is abundant. Alternatively, in
the present study, no clear relationships were revealed between the trophic ecology of adult
sardines and anchovies depicted through SIA, and variations in the mesozooplankton resource
in the Bay of Biscay area over the three different periods were investigated. Other food
resources than mesozooplankton (i.e. microplankton) may also contribute to their diet, and the
lack of consideration of this compartment here may contribute to explain the lack of
relationships (in addition to the other elements described above such as imprecise TEFs for
plankton-feeding fish, for instance). However, in the Bay of Biscay, the microplankton fraction
(i.e. 50–200 μm) appears in fact to be mainly constituted by phytoplankton (unpublished data).
Moreover, several studies demonstrated that zooplankton, and notably copepods belonging to
the mesozooplankton community, are by far the most important dietary component for both fish
species compared with phytoplankton (e.g. Van der Lingen et al. 2006; Espinoza et al. 2009;
Nikolioudakis et al. 2012). Furthermore, this is not the first time that a lack of relationship
between food concentration and food ingestion in such small plankton-feeding fish is found in
the Bay of Biscay (e.g. Plounevez and Champalbert 1999; Bachiller et al. 2012). Interestingly,
in other systems, some authors have however already shown that feeding mode and food
consumption in adult sardines, for instance, can be highly dependent on food density (Garrido
et al. 2007), notably in the Mediterranean Sea (Nikolioudakis et al. 2011; Costalago et al. 2012).
Differences in the general function of the different systems may induce such differences in the
feeding strategies of small pelagic fish between systems. Indeed, in upwelling systems for
instance, alternative abundance fluctuations of sardines and anchovies have been demonstrated
and partly explained by both climatic (e.g. Lluch-Belda et al. 1989; Schwartzlose et al. 1999)
and/or biological factors (e.g. trophodynamic mediation suggested by Louw et al. 1998; Van
der Lingen et al. 2006). When two predator species show clear trophodynamic differences, as
demonstrated for sardines and anchovies in various ecosystems and notably in upwelling
systems in terms of size of prey, there is effectively a high potential for trophodynamically
mediated fluctuations of both species abundances if a peculiar food environment (dominated
by either small or large particles) persists either spatially or temporally under specific abiotic
conditions. Indeed, it may favour the occurrence/maintenance of one of the predator species
relative to the other in the area, a phenomena that would be enhanced by concurrent better
reproductive success of this predator (Van der Lingen et al. 2006). In the Bay of Biscay case
study, sardines and anchovies are generally segregated in terms of trophic ecology, highlighting
a potential for trophodynamically fluctuations of both species’ abundances in the area at first
sight. However, they both showed at the same time a certain trophic plasticity relative to the
composition of the mesozooplankton resource available, although this trophic plasticity
appeared to be higher in anchovy than in sardine. As such here, while anchovies were shown to
efficiently remove large particles in various systems (see Van der Lingen et al. 2006 for a
review, and the present study for the Bay of Biscay area), large organisms did not necessarily
dominate the diet of anchovies when the mesozooplankton resource contained a higher
proportion of large organisms (such as in spring 2010). Conversely, while sardines were shown
to efficiently remove or favour smaller particles in various systems (see Van der Lingen et al.
2006 for a general review, and the present study for the Bay of Biscay area), large organisms
could also contribute to their diets when the mesozooplankton resource was largely dominated
by small- to medium-sized organisms (such as in spring 2011).
In the Bay of Biscay ecosystem, no clear patterns of abundances of both fish species and no
potential explanation for fluctuations of their stocks have been reported yet. The present study
therefore emphasised that fluctuations in sardines and anchovies from the Bay of Biscay cannot
also be totally explained by the trophic ecology of adults of both species. Indeed, adult sardines
and anchovies do not compete strongly for food resource in the Bay of Biscay area.
Furthermore, species segregate diets, and although this can represent a potential for
trophodynamically mediated fluctuations under specific abiotic conditions, no clear link was
made between food resource availability and fish diets (i.e. no strict dependency of both species
relative to the composition and availability of the mesozooplankton resource). In this sense, our
results seem to corroborate those of Irigoien et al. (2009) who found a negative correlation
between anchovy recruitment and zooplankton biomass in the Bay of Biscay, suggesting then
that the 2002–2006 failures in anchovy recruitment in the area were not due to a decrease in
mesozooplankton biomass.
Through the results of the present study, we provide further evidence that alternations of species
should be considered in conjunction with spawning success and year class formation (Van der
Lingen et al. 2006). Besides, a focus on the trophic ecology of larvae of both species may also
constitute a next step. This should be then coupled to an analysis of long-term fluctuations in
mesozooplankton and microplankton (may be preyed on by larvae as well) composition and
abundance, with consideration of abiotic factors too. Changes in the plankton community, in
relation to environmental parameters, have effectively been shown to directly affect survival of
larvae and consequently fish recruitment (e.g. Beaugrand et al. 2003). From a more theoretical
ecological point of view, investigating what maintains the trophic segregation between adults
of both species, despite variations in abundance and composition of the mesozooplankton
community, should be also of interest.
Acknowledgements:
This work was supported by the European project REPRODUCE (EratNet-Marifish, FP7).
Authors are very grateful to J. Massé, P. Petitgas, and M. Doray from IFREMER for facilitating
the sampling during PELGAS surveys. Many thanks to M. Huret and P. Bourriau (IFREMER)
too for their help during plankton sample collection, and P. Lespagnol (IFREMER) for fish
sampling. Authors also thank G. Guillou and P. Richard (UMR LIENSs) for assistance in stable
isotope analysis and finally the anonymous reviewers of the earlier version of the manuscript
for facilitating its improvement.
References
Albaina, A., Irigoien, X., 2004. Relationships between frontal structures and zooplankton
communities along a cross-shelf transect in the Bay of Biscay (1995 to 2003). Mar. Ecol.
Prog. Ser. 284, 65-75.
Alheit, J., Pohlmann, T., Casini, M., Greve, W., Hinrichs, R., Mathis, M., O’Driscoll, K.,
Vorberg, R., Wagner, C., 2012. Climate variability drives anchovies and sardines into the
North and Baltic Seas. Prog. Oceanogr. 96, 128-139.
Bachiller, E., Cotano, U., Boyra, G., Irigoien, X., 2012. Spatial distribution of the stomach
weights of juvenile anchovy (Engraulis encrasicolus L.) in the Bay of Biscay. ICES J. Mar
Sci., doi.10.1093/icesjms/fss176.
Barange, M., Coetzee, J., Takasuka, A., Hill, K., Gutierrez, M., Oozeki, Y., Van der Lingen, C.,
Agostini, V., 2009. Habitat expansion and contraction in anchovy and sardine populations.
Prog. Oceanogr. 83: 251-260.
Beaugrand, G., Brander, K. M., Lindley, J. A., Souissi, S., and Reid, P. C. 2003. Plankton effect
on cod recruitment in the North Sea. Nature 426, 661-664.
Bode, A., Álvarez-Ossorio, M.T., Carrera, P., Lorenzo, J., 2004. Reconstruction of trophic
pathways between plankton and the North Iberian sardine (Sardina pilchardus) using stable
isotopes. Sci. Mar. 68, 165-178.
Bond, A.L., Diamond, A.W., 2011. Recent Bayesian stable-isotope mixing models are highly
sensitive to variation in discrimination factors. Ecol. Appl. 21, 1017-1023.
Buchheister, A., Latour, R.J., 2010. Turnover and fractionation of carbon and nitrogen stable
isotopes in tissues of a migratory coastal predator, summer flounder (Paralichthys
dentatus). Can. J. Fish. Aquat. Sci. 67, 445-461.
Cabal, J., González-Nuevo, G., Nogueira, E., 2008. Mesozooplankton species distribution in
the NW and N Iberian shelf during spring 2004: Relationship with frontal structures. J.
Mar. Syst. 72, 282-297.
Caut, S., Angulo, E., Courchamp, F., 2009. Variation in discrimination factors (Δ15N and
Δ13C): the effect of diet isotopic values and applications for diet reconstruction. J. Appl.
Ecol. 46, 443-453.
Chavez, F.P., Ryan, J., Lluch-Cota, S.E., Ñiquen, C.M., 2003. From anchovies to sardines and
back: multidecadal change in the Pacific Ocean. Science 299, 217-221.
Chouvelon, T., Chappuis, A., Bustamante, P., Lefebvre, S., Mornet, F., Guillou, G., Violamer,
L., Dupuy, C., under review. Trophic ecology of European sardine Sardina pilchardus and
European anchovy Engraulis encrasicolus in the Bay of Biscay (North-East Atlantic)
inferred from δ13C and δ15N values of fishes and identified mesozooplanktonic organisms.
J. Sea Res.
Chouvelon, T., Spitz, J., Caurant, F., Mèndez-Fernandez, P., Chappuis, A., Laugier, F., Le Goff,
E., Bustamante, P., 2012b. Revisiting the use of δ15N in meso-scale studies of marine food
webs by considering spatio-temporal variations in stable isotopic signatures – The case of
an open ecosystem: the Bay of Biscay (North-East Atlantic). Prog. Oceanogr. 101, 92-105.
Costalago, D., Navarro, J., Álvarez-Calleja, I., Palomera, I., 2012. Ontogenetic and seasonal
changes in the feeding habits and trophic levels of two small pelagic fish species. Mar.
Ecol. Prog. Ser. 460, 169-181.
Cury, P., Bakun, A., Crawford, R.J.M., Jarre, A., Quiñones, R.A., Shannon, L.J., Verheye, H.M.,
2000. Small pelagics in upwelling systems: patterns of interaction and structural changes
in “wasp-waist” ecosystems. ICES J. Mar. Sci. 57, 603-618.
Cury, P., Roy, C., 1989. Optimal environmental window and pelagic fish recruitment success
in upwelling areas. Can. J. Fish. Aquat. Sci. 46, 670-680.
De Niro, M.J., Epstein, S., 1977. Mechanism of carbon fractionation associated with lipid
synthesis. Science 197, 261-263.
De Niro, M.J., Epstein, S., 1978. Influence of diet on the distribution of carbon isotopes in
animals. Geochim. Cosmochim. Acta 42, 495-506.
De Niro, M.J., Epstein, S., 1981. Influence of diet on the distribution of nitrogen isotopes in
animals. Geochim. Cosmochim. Acta 45, 341-351.
Espinoza, P., Bertrand, A., Van der Lingen, C.D., Garrido, S., Rojas de Mendiola, B., 2009. Diet
of sardine (Sardinops sagax) in the northern Humboldt Current system and comparison
with the diets of clupeoids in this and other eastern boundary upwelling systems. Prog.
Oceanogr. 83, 242-250.
FAO (Food and Agriculture Organization of the United Nations), 2012. The state of world
fisheries and aquaculture 2010. Rome, FAO, 2012, 209 p.
France, R.L., 1995. Carbon-13 enrichment in benthic compared to planktonic algae: food web
implications. Mar. Ecol. Prog. Ser. 124, 307-312.
Fry, B., 1988. Food web structure on Georges Bank from stable C, N, and S isotopic
compositions. Limnology and Oceanography 33, 1182-1190.
Garrido, S., Marçalo, A., Zwolinski, J., Van der Lingen, C.D. 2007. Laboratory investigations
on the effect of prey size and concentration on the feeding behaviour of Sardina pilchardus.
Mar. Ecol. Prog. Ser. 330, 189-199.
Garrido, S., Rosa, R., Ben-Hamadou, R., Cunha, M.E., Chícharo, M.A., Van der Lingen, C.D.,
2008. Spatio-temporal variability in fatty acid trophic biomarkers in stomach contents and
muscle of Iberian sardine (Sardina pilchardus) and its relationship with spawning. Mar.
Biol. 154, 1053-1065.
Gohin, F., Lampert, L., Guillaud, J.F., Herbland, A., Nézan, E., 2003. Satellite and in situ
observations of a late winter phytoplankton bloom, in the northern Bay of Biscay. Cont.
Shelf Res. 23, 1117-1141.
Herbland, A., Delmas, D., Laborde, P., Sautour, B., Artigas, F., 1998. Phytoplankton spring
bloom of the Gironde plume waters in the Bay of Biscay: early phosphorus limitation and
food web consequences. Oceanol. Acta 21, 279-291.
Hobson, K.A., 1999. Tracing origins and migration of wildlife using stable isotopes: a review.
Oecologia 120, 314-326.
Hobson, K.A., Clark, R.G., 1992. Assessing avian diets using stable isotopes. I: Turnover of C
in tissues. Condor 94, 181-188.
Holligan, P.M., Groom, S.B., 1986. Phytoplankton distributions along the shelf break. P. Roy.
Soc. Edinb. B 88, 239-263.
ICES, 2010a. Report of the Working Group on Anchovy and Sardine (WGANSA). ICES
WGANSA Report 2010, ICES, 289 p.
ICES, 2010b. Life-cycle spatial patterns of small pelagic fish in the Northeast Atlantic. ICES
Cooperative Research Report, ICES, 94 p.
Irigoien, X., Fernandes, J.A., Grosjean, P., Denis, K., Albaina, A., Santos, M., 2009. Spring
zooplankton distribution in the Bay of Biscay from 1998 to 2006 in relation with anchovy
recruitment. J. Plankton Res. 31, 1-17.
Irigoien, X., Head, R. N., Harris, R. P., Cummings, D., Harbour, D., & Meyer-Harms, B. (2000).
Feeding selectivity and egg production of Calanus helgolandicus in the English Channel.
Limnol. Oceanogr. 45, 44-54.
Irigoien, X., De Roos, A., 2011. The role of intraguild predation in the population dynamics of
small pelagic fish. Mar. Biol. 158, 1683-1690.
Isla, J.A., Ceballos, S., Huskin, I., Anadón, R., Álvarez-Marqués, F., 2004. Mesozooplankton
distribution, metabolism and grazing in an anticyclonic slope water oceanic eddy
(SWODDY) in the Bay of Biscay. Mar. Biol. 145, 1201-1212.
James, A.G., Findlay, K.P., 1989. Effect of particle size and concentration on feeding behavior,
selectivity and rates of food ingestion by the Cape anchovy Engraulis capensis. Mar. Ecol.
Prog. Ser. 50, 275-294.
James, A.G., Probyn, T., 1989. The relationship between respiration rate, swimming speed and
feeding behaviour in the Cape anchovy Engraulis capensis Gilchrist. J. Exp. Mar. Biol.
Ecol. 131, 81-100.
Koutsikopoulos, C., Le Cann, B., 1996. Physical processes and hydrological structures related
to the Bay of Biscay anchovy. Sci. Mar. 60, 9-19.
Labry, C., Herbland, A., Delmas, D., Laborde, P., Lazure, P., Froidefond, J.M., Jégou, A.M.,
Sautour, B., 2001. Initiation of winter phytoplankton blooms within the Gironde plume
waters in the Bay of Biscay. Mar. Ecol. Prog. Ser. 212, 117-130.
Lassalle, G., Lobry, J., Le Loc’h, F., Bustamante, P., Certain, G., Delmas, D., Dupuy, C., Hily,
C., Labry, C., Le Pape, O., Marquis, E., Petitgas, P., Pusineri, C., Ridoux, V., Spitz, J.,
Niquil, N., 2011. Lower trophic levels and detrital biomass control the Bay of Biscay
continental shelf food web: implications for ecosystem management. Prog. Oceanogr. 91,
561-575.
Lluch-Belda, D., Crawford, R.J.M., Kawasaki, T., MacCall, A.D., Parrish, R.H., Schwartzlose,
R.A., Smith, P.E., 1989. World-wide fluctuations of sardine and anchovy stocks: the regime
problem. S. Afr. J. Mar. Sci. 8, 195-205.
Lluch-Belda, D., Schwartzlose, R.A., Serra, R., Parrish, R., Kawasaki, T., Hedgecock, D.,
Crawford, R.J.M., 1992. Sardine and anchovy regime fluctuations of abundance in four
regions of the world oceans: a workshop report. Fish. Oceanogr. 1, 339-347.
Lorance, P., Bertrand, J.A., Brind'Amour, A., Rochet, M.J., Trenkel, V.M., 2009. Assessment
of impacts from human activities on ecosystem components in the Bay of Biscay in the
early 1990s. Aquat. Living Resour. 22, 409-431.
Louw, G.G, Van der Lingen, C.D., Gibbons, M.J., 1998. Differential feeding by sardine
Sardinops Sagax and anchovy Engraulis capensis recruits in mixed shoals. S. Afr. J. Mar.
Sci. 19, 227-232.
Loyer, S., Lampert, L., Menesguen, A., Cann, P., Labasque, T., 2006. Seasonal evolution of the
nutrient pattern on Biscay Bay continental shelf over the years 1999-2000. Sci. Mar. 70,
31-46.
Marquis, E., Niquil, N., Vézina, A.F., Petitgas, P., Dupuy, C., 2011. Influence of planktonic food
web structure on a system’s capacity to support pelagic production: an inverse analysis
approach. ICES J. Mar. Sci. 68, 803-812.
Martínez del Rio, C., Wolf, N., Carleton, S.A., Gannes, L.Z., 2009. Isotopic ecology ten years
after a call for more laboratory experiments. Biol. Rev. 84, 91-111.
McClellan, C.M., Braun-McNeill, J., Avens, L., Wallace, B.P., Read, A.J., 2010. Stable isotopes
confirm a foraging dichotomy in juvenile loggerhead sea turtles. J. Exp. Mar. Biol. Ecol.
387, 44-51.
McClelland, J.M., Valiela, I., Michener, R.H., 1997. Nitrogen-stable isotope signatures in
estuarine food webs: a record of increasing urbanization in coastal watersheds. Limnol.
Oceanogr. 42, 930-937.
Mèndez-Fernandez, P., Bustamante, P., Bode, A., Chouvelon, T., Ferreira, M., López, A., Pierce,
G.J., Santos, M.B., Spitz, J., Vingada, J.V., Caurant, F., 2012. Trophic ecology of five
toothed whale species inhabiting the waters of the Northwest of the Iberian Peninsula using
d13C and d15N isotopic signatures. J. Exp. Mar. Biol. Ecol. 413, 150-158.
Michener, R.H., Kaufman, L., 2007. Stable isotope ratios as tracers in marine food webs: an
update, in: Michener, R., Lajtha, K. (Eds.), Stable isotopes in ecology and environmental
science. Blackwell Publishing Ltd, pp. 238-282.
Montoya, J.P., 2007. Natural abundance of 15N in marine planktonic ecosystems, in: Michener,
R., Lajtha, K. (Eds.), Stable isotopes in ecology and environmental science. Blackwell
Publishing Ltd, pp. 76-201.
Morote, E., Olivar, M.P., Villate, F., Uriarte, I., 2010. A comparison of anchovy (Engraulis
encrasicolus) and sardine (Sardina pilchardus) larvae feeding in the Northwest
Mediterranean: influence of prey availability and ontogeny. ICES J. Mar. Sci. 67, 897-908.
Nikolioudakis, N., Isari, S., Pitta, P., Somarakis, S., 2012a. Diet of sardine Sardina pilchardus:
an “end-to-end” field study. Mar. Ecol. Prog. Ser. 453, 173-188.
Nikolioudakis, N., Palomera, I., Machias, A., Somarakis, S., 2012b. Diel feeding intensity and
daily ration of the sardine Sardina pilchardus. Mar. Ecol. Prog. Ser. 437, 215-228.
OSPAR, 2010. Quality Status Report 2010. OSPAR Commission, London, 176 p.
Parnell, A.C., Inger, R., Bearhop, S., Jackson, A.L., 2010. Source partitioning using stable
isotopes: coping with too much variation. Plos One 5: e9672,
doi:10.1371/journal.pone.0009672.
Peterson, B.J., Fry, B., 1987. Stable isotopes in ecosystem studies. Annu. Rev. Ecol. Syst. 18,
293- 320.
Phillips, D.L., Newsome, S.D., Gregg, J.W., 2005. Combining sources in stable isotope mixing
models: alternative methods. Oecologia 144, 520-527.
Pinnegar, J.K., Polunin, N.V.C., 1999. Differential fractionation of δ13C and δ15N among fish
tissues: implications for the study of trophic interactions. Funct. Ecol. 13, 225-231.
Planque, B., Lazure, P., Jégou, A.M., 2004. Detecting hydrological landscapes over the Bay of
Biscay continental shelf in spring. Climate Res. 28, 41-52.
Plounevez, S., Champalbert, G., 1999. Feeding behaviour and trophic environment of Engraulis
encrasicolus (L.) in the Bay of Biscay. Estuar. Coast. Shelf S. 49, 177-191.
Post, D.M., 2002. Using stable isotopes to estimate trophic position: models, methods and
assumptions. Ecology 83, 703-718.
Puillat, I., Lazure, P., Jégou, A.M., Lampert, L., Miller, P.I., 2004. Hydrographical variability
on the French continental shelf in the Bay of Biscay, during the 1990s. Cont. Shelf Res. 24,
1143-1163.
Puillat, I., Lazure, P., Jégou, A.M., Lampert, L., Miller, P.I., 2006. Mesoscale hydrological
variability induced by northwesterly wind on the French continental shelf of the Bay of
Biscay. Sci. Mar. 70S1, 15-26.
Raab, K., Nagelkerke, L.A.J., Boerée, C., Rijnsdorp, A.D., Temming, A., Dickey-Collas, M.,
2011. Anchovy Engraulis encrasicolus diet in the North and Baltic Seas. J. Sea. Res. 65, 131-
140.
Rose, M., 1933. Copépodes pélagiques. Faune de France, 26, Paris.
Sautour, B., Artigas, L.F., Delmas, D., Herbland, A., Laborde, P., 2000. Grazing impact of
micro and mesozooplankton during a spring situation in coastal waters off the Gironde
estuary. J. Plankton Res. 22, 531-552.
Schimmelmann, A., De Niro, M.J., 1986. Stable isotopic studies on chitin. II. The 13C/12C and 15N/14N ratios in arthropod chitin. Contrib. Mar. Sci. 29, 113-130.
Schwartzlose, R.A., Alheit, J., Bakun, A., Baumgartner, T.R., Cloete, R., Crawford, R.J.M.,
Fltechern, W.J., Green-Ruiz, Y., Hagen, E., Kawasaki, T., Lluch-Belda, D., Lluch-Cota,
S.E., MacCall, A.D., Matsuura, Y., Nevarez-Martinez, M.O., Parrish, R.H., Roy, C., Serra,
R., Shust, K.V., Ward, M.N., Zuzunaga, J.Z., 1999. Worlwide large-scale fluctuations of
sardine and anchovy populations. S. Afr. J. Mar. Sci. 21, 289-347.
Sherwood, G.D., Rose, G.A., 2005. Stable isotope analysis of some representative fish and
invertebrates of the Newfoundland and Labrador continental shelf food web. Estuar. Coast.
Shelf S. 63, 537-549.
Sourisseau, M., Carlotti, F., 2006. Spatial distribution of zooplankton size spectra on the French
continental shelf of the Bay of Biscay during spring 2000 and 2001. J. Geophys. Res.
Oceans 111, C05S09.
Sponheimer, M., Robinson, T.F., Cerling, T.E., Tegland, L., Roeder, B.L., Ayliffe, L., Dearing,
M.D., Ehleringer, J.R., 2006. Turnover of stable carbon isotopes in the muscle, liver, and
breath CO of alpacas (Lama pacos). Rapid. Commun. Mass Spectrom. 20, 1395-1399.
Sweeting, C.J., Barry, J.T., Barnes, C., Polunin, N.V.C., Jennings, S., 2007a. Effects of body
size and environment on diet-tissue δ15N fractionation in fishes. J. Exp. Mar. Biol. Ecol.
340, 1-10.
Sweeting, C.J., Barry, J.T., Barnes, C., Polunin, N.V.C., Jennings, S., 2007b. Effects of body
size and environment on diet-tissue δ13C fractionation in fishes. J. Exp. Mar. Biol. Ecol.
352, 165-176.
Takasuka, A., Oozeki, Y., Aoki, I., 2007. Optimal growth temperature hypothesis: why do
anchovy flourish and sardine collapse or vice versa under the same ocean regime? Can. J.
Fish. Aquat. Sci. 64, 768-776.
Tieszen, L.L., Boutton, T.W., Tesdahl, K.G., Slade, N.A., 1983. Fractionation and turnover of
stable carbon isotopes in animal tissues: implications for δ13C analysis of diet. Oecologia
57, 32-37.
Trueman, C.N., McGill, R.A.R., Guyard, P.H., 2005. The effect of growth rate on tissue-diet
isotopic spacing in rapidly growing animals. An experimental study with Atlantic salmon
(Salmo salar). Rapid. Commun. Mass Spectrom. 19, 3239-3247.
Valdés, L., López-Urrutia, A., Cabal, J., Alvarez-Ossorio, M., Bode, A., Miranda, A., Cabanas,
M., Huskin, I., Anadón, R., Alvarez-Marqués, F., Llope, M., Rodríguez, N., 2007. A decade
of sampling in the Bay of Biscay: What are the zooplankton time series telling us? Prog.
Oceanogr. 74: 98-114.
Valdés, L., Moral, M., 1998. Time-series analysis of copepod diversity and species richness in
the southern Bay of Biscay off Santander, Spain, in relation to environmental conditions.
ICES J. Mar. Sci. 55, 783-792.
Vanderklift, M.A., Ponsard, S., 2003. Source of variation in consumer-diet δ15N enrichment: a
meta-analysis. Oecologia 136, 169-182.
Van der Lingen, C.D., 1994. Effect of particle size and concentration on the feeding behaviour
of adult pilchard Sardinops sagax. Mar. Ecol. Prog. Ser. 109, 1-13.
Van der Lingen, C.D., Hutchings, L., Field, J.G., 2006. Comparative trophodynamics of
anchovy Engraulis encrasicolus and sardine Sardinops sagax in the southern Benguela: are
species alternations between small pelagic fish trophodinamically mediated? Afr. J. Mar.
Sci. 28, 465-478.
Vander Zanden, M.J., Cabana, G., Rasmussen, J.B., 1997. Comparing trophic position of
freshwater fish calculated using stable nitrogen isotope ratios (δ15N) and literature dietary
data. Can. J. Fish. Aquat. Sci. 54, 1142-1158.
Villate, F., Moral, M., Valencia, V., 1997. Mesozooplankton community indicates climate
changes in a shelf area of the inner Bay of Biscay throughout 1988 to 1990. J. Plankton
Res. 19, 1617-1636.
Vizzini, S., Mazzola, A., 2006. The effects of anthropogenic organic matter inputs on stable
carbon and nitrogen isotopes in organisms from different trophic levels in a southern
Mediterranean coastal area. Sci. Total Environ. 368, 723-731.
Williams, R., Conway, D.V.P., Hunt, H.G., 1994. The role of copepods in the planktonic
ecosystems of mixed and stratified waters of the European shelf seas. Hydrobiologia
292/293, 521-530.
Zarauz, L., Irigoien, X., Urtizberea, A., Gonzalez, M., 2007. Mapping plankton distribution in
the Bay of Biscay during three consecutive spring surveys. Mar. Ecol. Prog. Ser. 345, 27-
39.
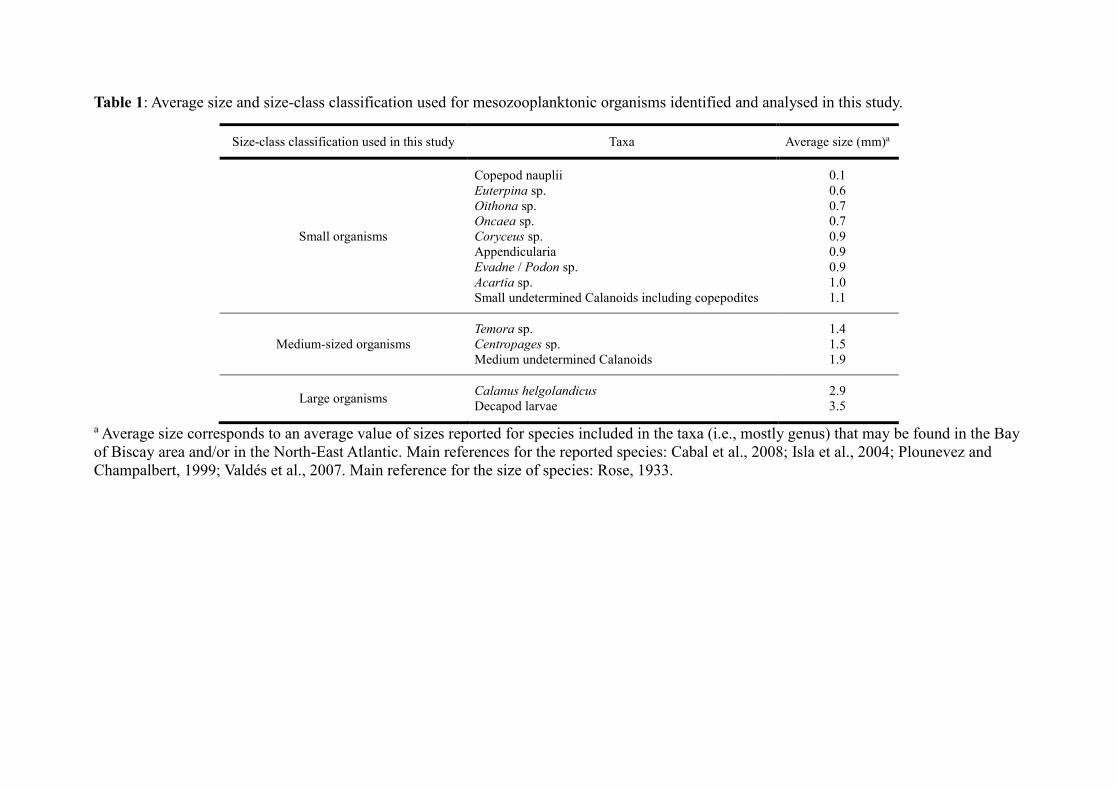
Table 1: Average size and size-class classification used for mesozooplanktonic organisms identified and analysed in this study.
Size-class classification used in this study Taxa Average size (mm)a
Small organisms
Copepod nauplii 0.1
Euterpina sp. 0.6
Oithona sp. 0.7
Oncaea sp. 0.7
Coryceus sp. 0.9
Appendicularia 0.9
Evadne / Podon sp. 0.9
Acartia sp. 1.0
Small undetermined Calanoids including copepodites 1.1
Medium-sized organisms
Temora sp. 1.4
Centropages sp. 1.5
Medium undetermined Calanoids 1.9
Large organisms Calanus helgolandicus 2.9
Decapod larvae 3.5
a Average size corresponds to an average value of sizes reported for species included in the taxa (i.e., mostly genus) that may be found in the Bay
of Biscay area and/or in the North-East Atlantic. Main references for the reported species: Cabal et al., 2008; Isla et al., 2004; Plounevez and
Champalbert, 1999; Valdés et al., 2007. Main reference for the size of species: Rose, 1933.
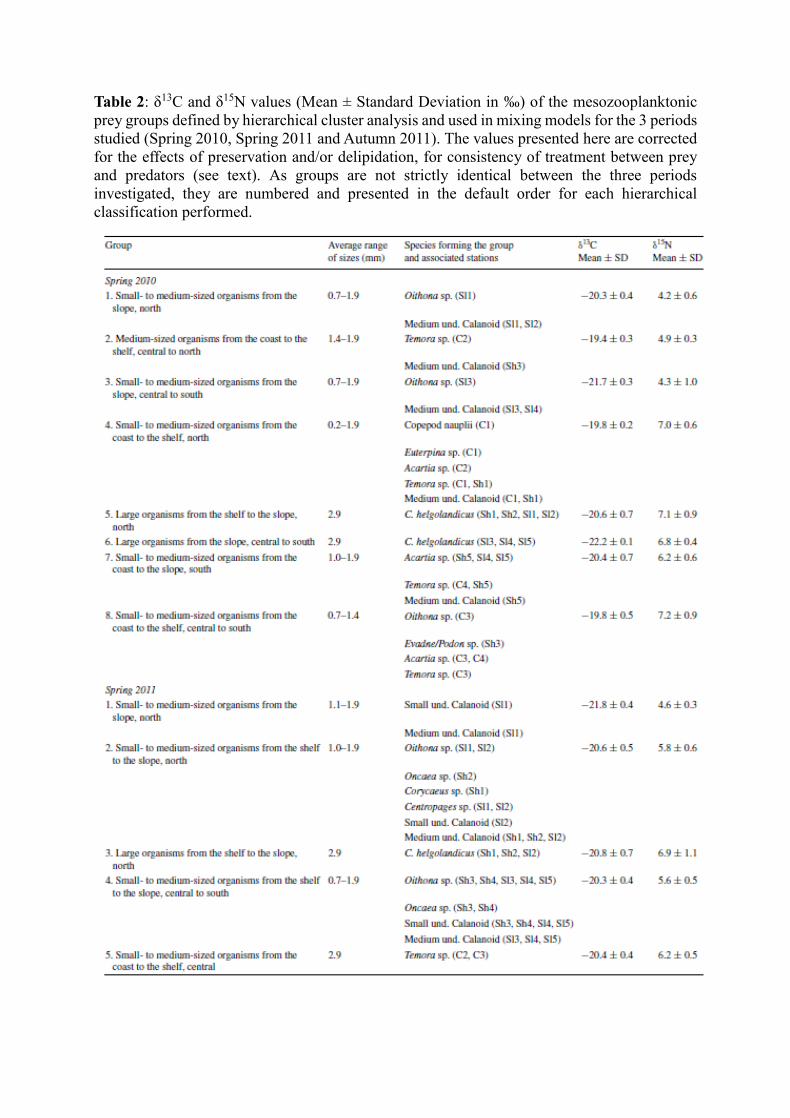
Table 2: δ13C and δ15N values (Mean ± Standard Deviation in ‰) of the mesozooplanktonic
prey groups defined by hierarchical cluster analysis and used in mixing models for the 3 periods
studied (Spring 2010, Spring 2011 and Autumn 2011). The values presented here are corrected
for the effects of preservation and/or delipidation, for consistency of treatment between prey
and predators (see text). As groups are not strictly identical between the three periods
investigated, they are numbered and presented in the default order for each hierarchical
classification performed.
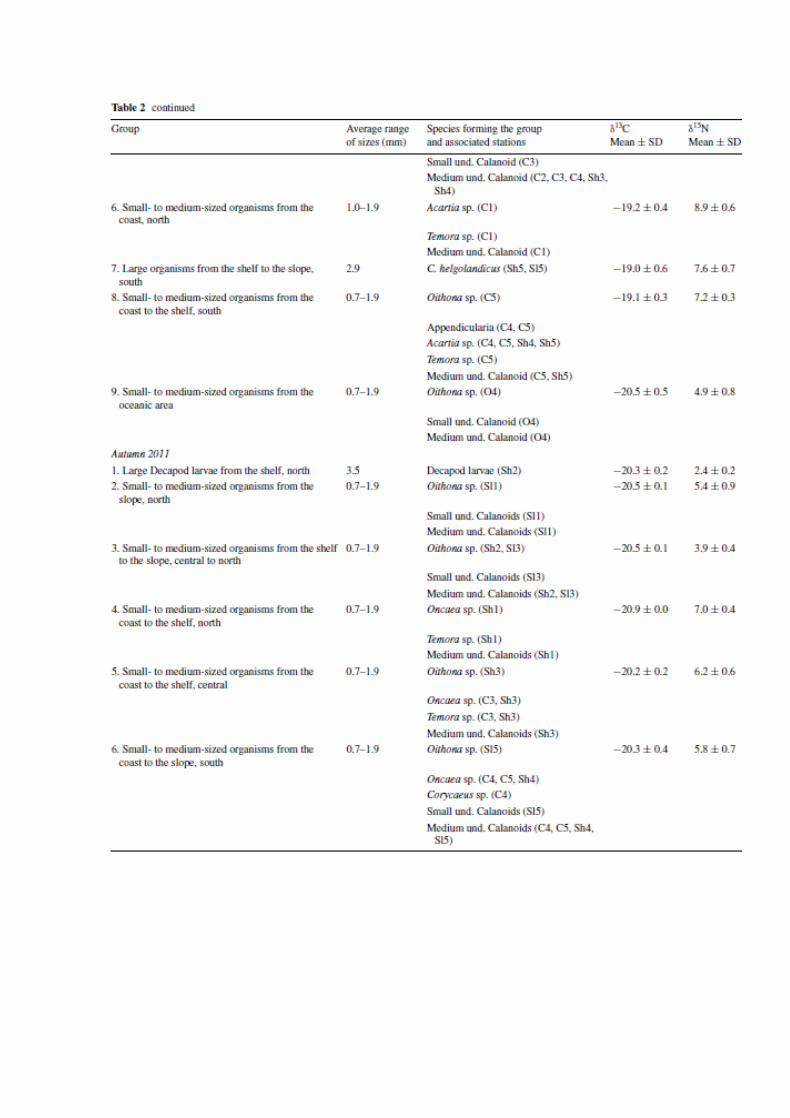
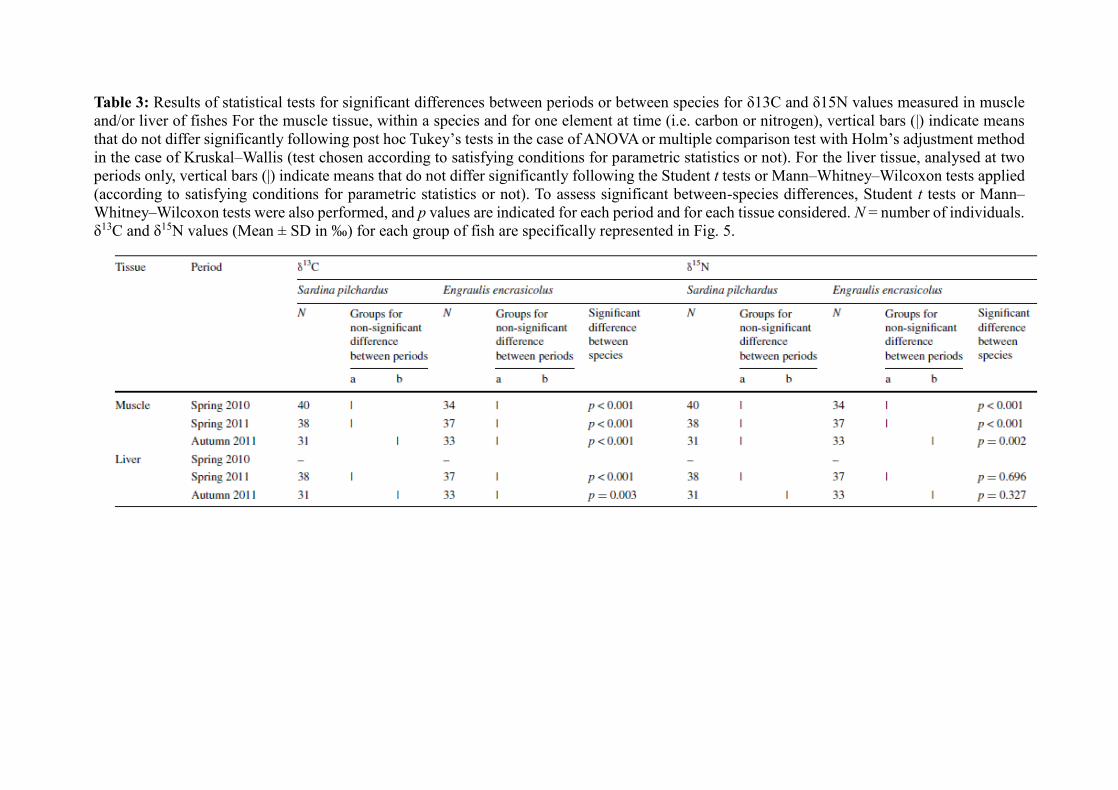
Table 3: Results of statistical tests for significant differences between periods or between species for δ13C and δ15N values measured in muscle
and/or liver of fishes For the muscle tissue, within a species and for one element at time (i.e. carbon or nitrogen), vertical bars (|) indicate means
that do not differ significantly following post hoc Tukey’s tests in the case of ANOVA or multiple comparison test with Holm’s adjustment method
in the case of Kruskal–Wallis (test chosen according to satisfying conditions for parametric statistics or not). For the liver tissue, analysed at two
periods only, vertical bars (|) indicate means that do not differ significantly following the Student t tests or Mann–Whitney–Wilcoxon tests applied
(according to satisfying conditions for parametric statistics or not). To assess significant between-species differences, Student t tests or Mann–
Whitney–Wilcoxon tests were also performed, and p values are indicated for each period and for each tissue considered. N = number of individuals.
δ13C and δ15N values (Mean ± SD in ‰) for each group of fish are specifically represented in Fig. 5.
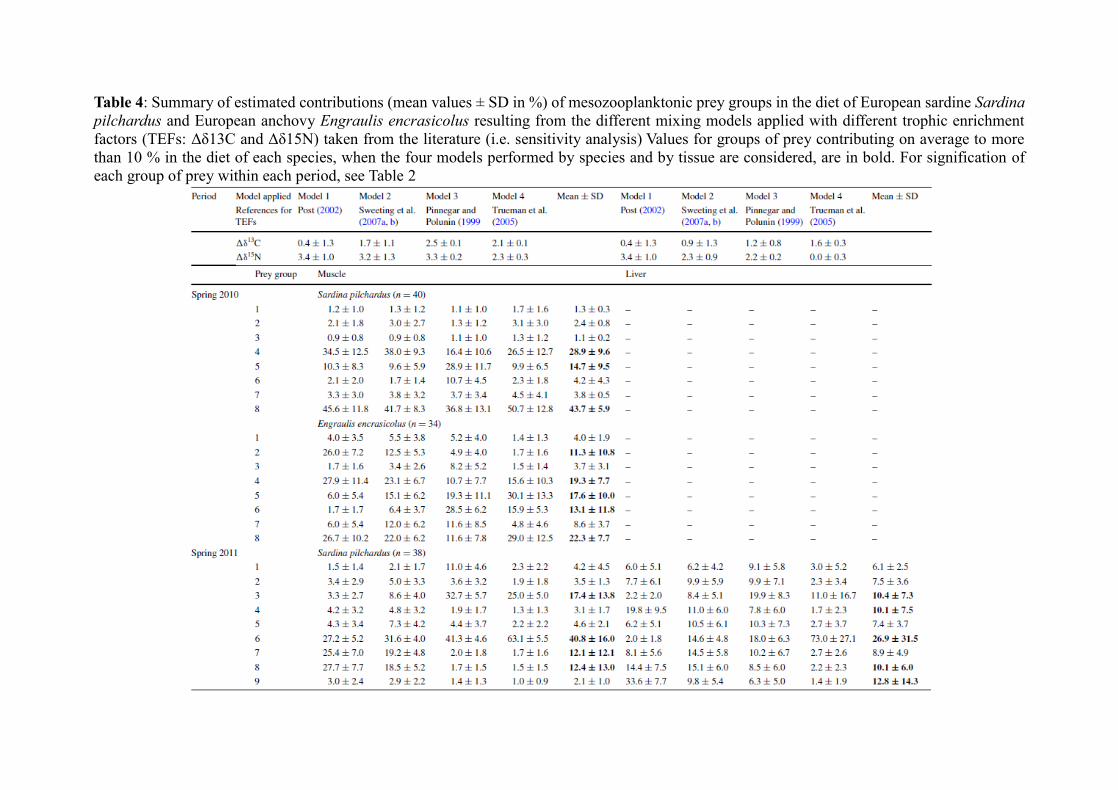
Table 4: Summary of estimated contributions (mean values ± SD in %) of mesozooplanktonic prey groups in the diet of European sardine Sardina
pilchardus and European anchovy Engraulis encrasicolus resulting from the different mixing models applied with different trophic enrichment
factors (TEFs: Δδ13C and Δδ15N) taken from the literature (i.e. sensitivity analysis) Values for groups of prey contributing on average to more
than 10 % in the diet of each species, when the four models performed by species and by tissue are considered, are in bold. For signification of
each group of prey within each period, see Table 2
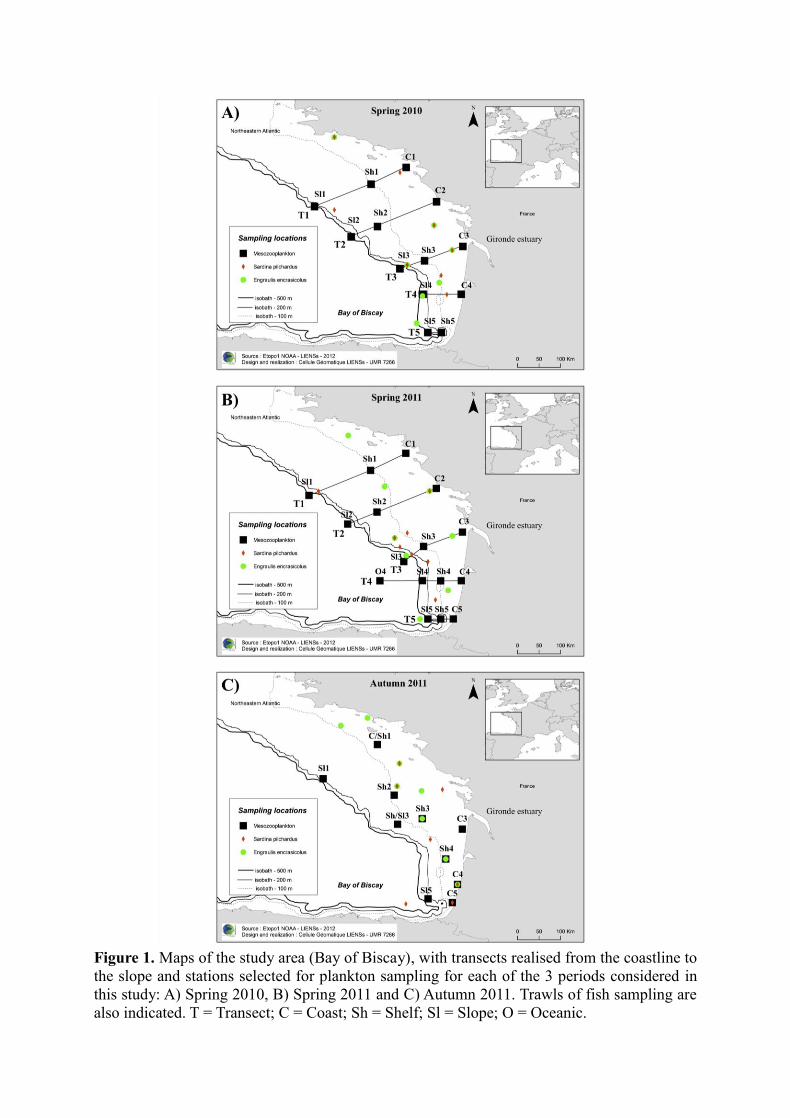
Figure 1. Maps of the study area (Bay of Biscay), with transects realised from the coastline to
the slope and stations selected for plankton sampling for each of the 3 periods considered in
this study: A) Spring 2010, B) Spring 2011 and C) Autumn 2011. Trawls of fish sampling are
also indicated. T = Transect; C = Coast; Sh = Shelf; Sl = Slope; O = Oceanic.
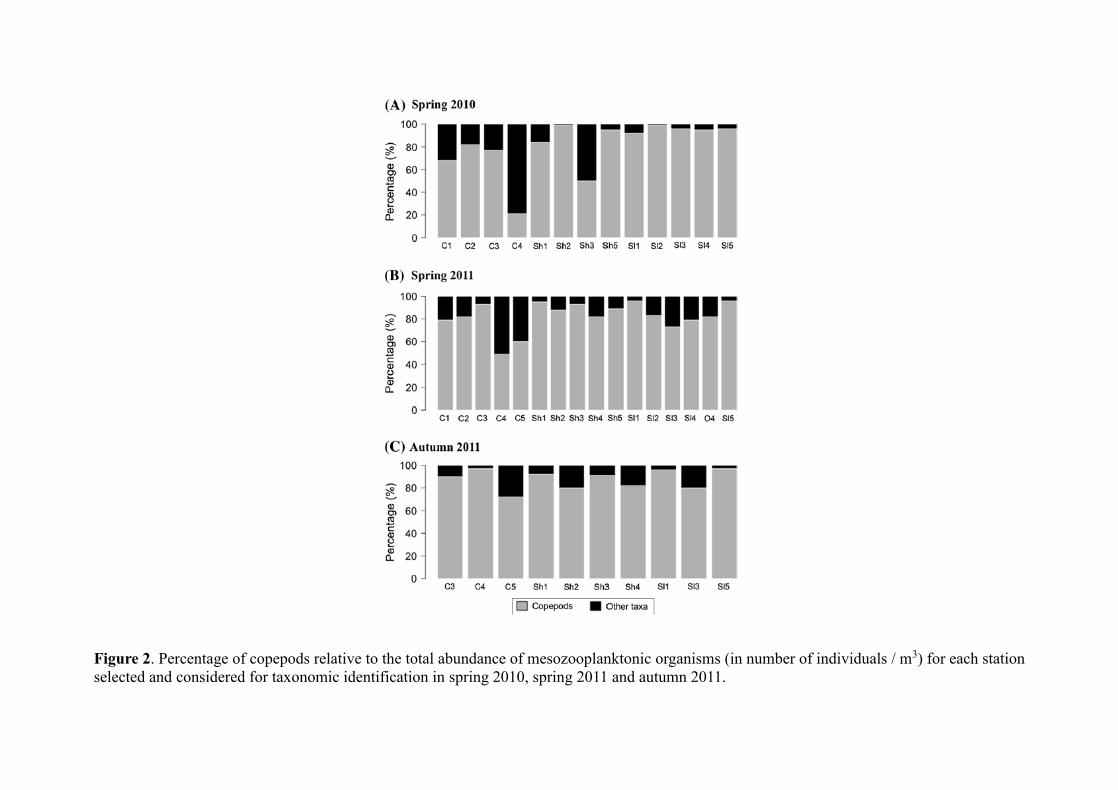
Figure 2. Percentage of copepods relative to the total abundance of mesozooplanktonic organisms (in number of individuals / m3) for each station
selected and considered for taxonomic identification in spring 2010, spring 2011 and autumn 2011.
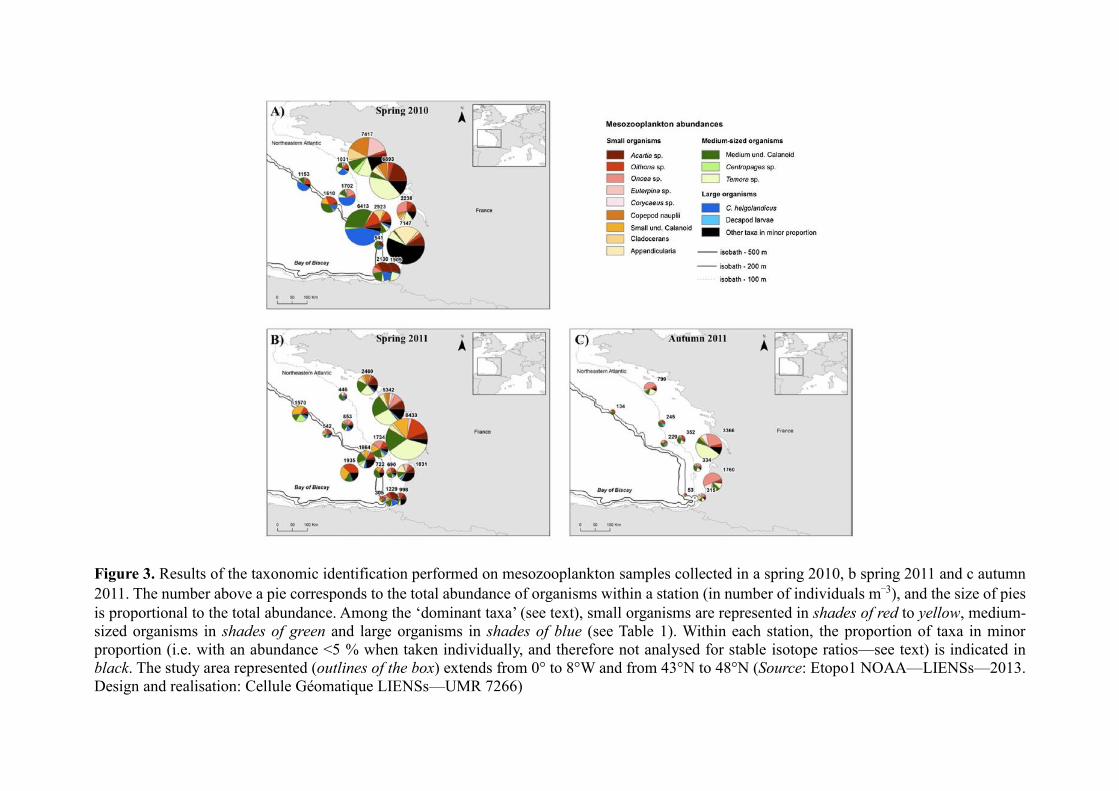
Figure 3. Results of the taxonomic identification performed on mesozooplankton samples collected in a spring 2010, b spring 2011 and c autumn
2011. The number above a pie corresponds to the total abundance of organisms within a station (in number of individuals m−3), and the size of pies
is proportional to the total abundance. Among the ‘dominant taxa’ (see text), small organisms are represented in shades of red to yellow, medium-
sized organisms in shades of green and large organisms in shades of blue (see Table 1). Within each station, the proportion of taxa in minor
proportion (i.e. with an abundance <5 % when taken individually, and therefore not analysed for stable isotope ratios—see text) is indicated in
black. The study area represented (outlines of the box) extends from 0° to 8°W and from 43°N to 48°N (Source: Etopo1 NOAA—LIENSs—2013.
Design and realisation: Cellule Géomatique LIENSs—UMR 7266)
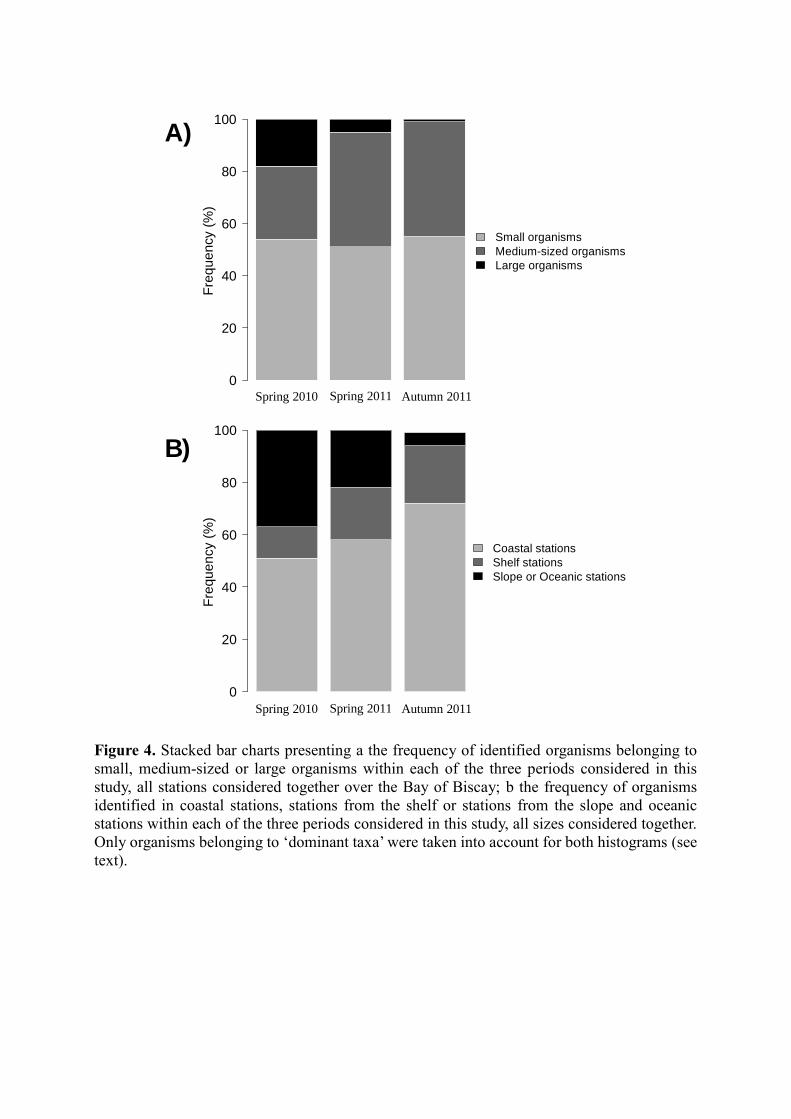
Figure 4. Stacked bar charts presenting a the frequency of identified organisms belonging to
small, medium-sized or large organisms within each of the three periods considered in this
study, all stations considered together over the Bay of Biscay; b the frequency of organisms
identified in coastal stations, stations from the shelf or stations from the slope and oceanic
stations within each of the three periods considered in this study, all sizes considered together.
Only organisms belonging to ‘dominant taxa’ were taken into account for both histograms (see
text).
Spring.2010 Spring.2011 Autumn.2011
Fre
qu
en
cy (
%)
0
20
40
60
80
100
Coastal stations
Shelf stations
Slope or Oceanic stations
Spring.2010 Spring.2011 Autumn.2011
Fre
qu
en
cy (
%)
0
20
40
60
80
100
Small organisms
Medium-sized organisms
Large organisms
Spring 2011 Spring 2010 Autumn 2011
B)
A)
Spring 2011 Spring 2010 Autumn 2011
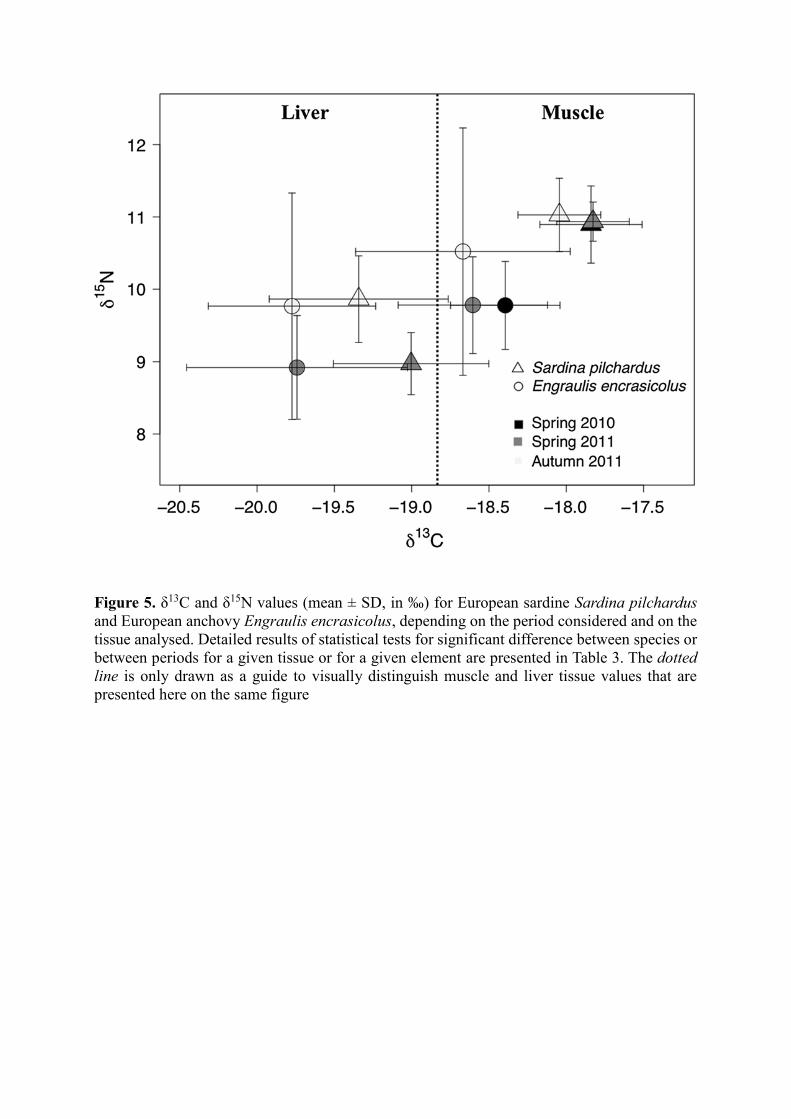
Figure 5. δ13C and δ15N values (mean ± SD, in ‰) for European sardine Sardina pilchardus
and European anchovy Engraulis encrasicolus, depending on the period considered and on the
tissue analysed. Detailed results of statistical tests for significant difference between species or
between periods for a given tissue or for a given element are presented in Table 3. The dotted
line is only drawn as a guide to visually distinguish muscle and liver tissue values that are
presented here on the same figure