Embed Size (px)
Citation preview

Small-Scale
Paper Fiber Recovery

Small-Scale
Paper Fiber Recovery
FINAL REPORT
Prepared for
Recycling Technology Assistance Partnership (ReTAP)
A program of the Clean Washington Center,
a division of the Pacific Northwest Economic Region (PNWER)
2200 Alaskan Way, Suite 460
Seattle, Washington 98121
December, 1995
Prepared by
Weyerhauser Research & Development
Integrated Recycling & Materials Utilization
Tacoma, Washington 98477
This recycled paper is recyclable
Copyright ©1995 by Clean Washington Center
Report No. PA-95-1

SMALL-SCALE PAPER FIBER RECOVERY
FINAL REPORT
CONTENTS
PageEXECUTIVE SUMMARY 1
1.0 BACKGROUND 4
2.0 TEST PROCEDURE 4
2.1 Process Description 42.2 Sampling Description 8
3.0 TEST RESULTS 9
3.1 Pulp Quality 103.2 Effluent Characteristics 113.3 Operating Costs 13
4.0 CONCLUSIONS AND RECOMMENDATIONS 16
APPENDICES
Appendix A
Process Flow Diagram
Appendix B
Effluent/Sludge Test Results and Polymer Applications
Appendix C
TAPPI Test Methods
Appendix D
Operating Cost DataUnits of ConsumptionUnit CostMajorAssumptions

1
EXECUTIVE SUMMARY
The lack of affordable, efficient, small-scale technologies for recovery of high-value, low-volumefiber, such as from poly-coated bleached paperboard, poses a significant technological barrier totheir recycling. This report details the evaluation of a small-scale system for fiber recovery frommilk carton/drink boxes (MCDBs). Pulp characteristics, effluent characteristics, and operatingcosts were monitored during the system's trial.
Typically, only large-scale paper producers/recyclers are able to sustain the high capitalexpenditures and low return on investment that are characteristic of most fiber recoveryoperations. Regenex L.L.C. (a spin-off company of Pellerin Milnor Corporation, a leadingmanufacturer of commercial laundry equipment) has developed a modular fiber recovery systemthat is a variation of an established Pellerin Milnor product line known as the continuous batchTunnel Washer system. Due to the unique material transfer methods of the Tunnel Washer system,several process functions are combined in a single piece of equipment. The new technology alsoallows reasonable return on investment for value-added processing of MCDBs on a scalesignificantly smaller than conventional paper mill technology allows (e.g., on the order of 3 bone-dry-tons/day versus 300 bone-dry-tons/day). The modular system is characterized by both lowcapital cost and low operating expenses, thus making small-scale fiber recovery operationsfeasible.
Prototype Testing and Evaluation
The prototype system consisted of one seven-module continuous batch Tunnel Washer system.Monitored functions included loading, pulping, separating, reject handling, screening,washing/thickening, clarification of liquid streams, and overall system fluid flow. Post-consumerMCDB material from the Louisiana area was the feedstock for this trial.
Pulp Quality
Selected pulp characteristics were evaluated, including optical properties (brightness, dirt count,debris) and strength properties (freeness, burst index, tear index, tensile strength). Theseproperties were compared to typical deink pulp specifications and historical MCDB recoveredpulp.
Effluents
Effluent streams before and after clarification were evaluated for the following characteristics:Biological Oxygen Demand, Silica, Total Suspended Solids, Total Dissolved Solids, Chlorine,Total Metals

2
CONCLUSIONS
The following is a summary of the conclusions based on the results of the tests conducted on thecontinuous batch Tunnel Washer system offered by Pellerin Milnor's RE GENEX Division.
• System yield was 63.8% BDT to BDT for post-consumer MCDB.
• For variable costs to be comparable to a state of the art, optimum sized, market deink pulpmill, the yield on milk carton must be about 73% BDT to BDT. This will need to be re-evaluated when quality targets have been achieved.
• Performance/strength properties, with the exception of freeness, did not meet typical deinkpulp specifications for fine paper applications, but did fall within typical historical parametersfor post-consumer MCDB pulp.
• Strength properties of the post-consumer MCDB may have been influenced by the advancedstate of bio-decomposition of the feed stock, which was over 6 months old.
• Loss of fines at the three sequential pulp sampling stages across the system resulted in aprogressive reduction in all strength properties except tear index. Freeness increase acrosssystem also supports this theory.
• Fiber and poly-coat percentages in the composite system reject stream were 35% and 65%respectively, by dry weight.
• The only optical property to exceed typical deink pulp specifications for printing and writingand tissue grades was brightness.
• When Weyerhaeuser tested the Clarifier Feed Sample, it's pH registered 12.0, which was thesame as the target pH.
• The TSS particles, in the system effluent stream, are easily floated and removed at theclarifier, visual inspection found a large portion of the TSS to be fiber.
• BOD values reported are questionable due to wide variability of values obtained duringtesting.
• Total Metals Analysis values show a large decrease from clarifier feed to effluent.
• No concerns were raised about the levels of metals present in the sludge from this trial.
RECOMMENDATIONS
• Need further testing/study to reduce dirt count and increase strength properties.

3
• Need to increase yield to a minimum of 73% BDT to BDT in order for the system to beeconomically viable.
• Screw press should be sized for the typical load size of 80 to 100 pounds (direct feed ofrejects to a screw press for dewatering is currently dependent on running loads of ( 60pounds).
Analysis, and pH. Effluent characteristics of the MCDB system were comparable to those for atypical mixed office waste (MOW) deink system. The total metal content values from both thesystem effluent and the system sludge were within acceptable limits.
Operating Costs
Baseline data includes stream flow rates, operating temperatures and times, and chemical dosages.Operating costs are extrapolated to compare a Tunnel Washer system processing MCDBs with astate-of-the-art deink system processing MOW. References to operating costs include onlyvariable cost and labor. Semi-variable costs (operating and maintenance supplies) and fixed costs(depreciation, taxes, salaried labor) are not included. The MCDB system is penalized for labordue to lower production capacity; however, the system is more cost effective than a state-of-the-artdeink system for chemicals and energy. Effluent treatment and residual disposal are comparablebetween the two systems. The test system yield was 63.8% BDT to BDT (bone dry ton of feedstock to bone dry ton of pulp product) for post-consumer MCDB. For variable costs to becomparable to a state of the art, optimum sized, market deink pulp mill, the yield on milk cartonwould need to be approximately 73% BDT to BDT.
Future Development
Further development work by Regenex L.L.C. has resulted in significant optical propertyimprovements: a dirt count of 10 PPM and debris level of 0.03%. Additional testing must beperformed to demonstrate improved strength properties. (Strength properties, with the exceptionoffreeness, did not meet typical deink pulp specifications for fine printing/writing grade paper,but did fall within typical historical parameters for post-consumer MCDB pulp.) Work iscurrently underway to process other waste paper feedstocks, in addition to MCDBs.
Equipment Availability
Regenex L. L. C. markets modular fiber recovery systems that can be sized to produce from 3 to250 tons per day. For more information on current product offerings, contact: Dan Mulligan,Regenex L.L.C.; P.O. Box 400, Kenner, LA (504) 467-9591; or (206) 869-8648 (in WashingtonState).
Acknowledgments
The support of this project by Weyerhaeuser Company and Pellerin Milnor Corporation is

4
gratefully acknowledged.
1.0 BACKGROUND
Pellerin Milnor (PM) is located in Kenner, Louisiana, just outside of New Orleans. They
engineer, manufacture, install, and service industrial size laundry equipment. It has been proposed
that with a few modifications, the continuous batch Tunnel Washer system offered by Pellerin
Milnor’s newly established RE GENEX Division can be used to recycle milk carton/drink boxes
(MCDB’ s). Initial trials for this application were conducted in September of 1994. Based on the
data generated in that trial, modifications were made to the Tunnel Washer system to prepare for
additional testing.
The Clean Washington Center is engaged in investigating promising recycling technologies for
various types of recovered paper, including poly-coated bleached paperboard. The lack of
affordable, efficient, small-scale technologies to recover high-value, lower volume fiber, such as
poly-coated bleached paperboard led the Clean Washington Center to provide funds for the
evaluation of PM's Tunnel Washer system. Weyerhaeuser provided the necessary expertise and
resources to evaluate the system prototype for operating costs, effluent characteristics and pulp
characteristics using MCDB feed stock.
During discussions of the data generated from the September trials, Weyerhaeuser and PM decided
to focus follow-up testing on pulp quality from various stages of the PM system, and on identifying
any additional processing which would be needed. Rather than the two four-module systems used
in the September trial (one to simulate pulping and separating, one to simulate cleaning), this
evaluation used one seven-module continuous batch Tunnel Washer system to simulate pulping and
separating. Post consumer MCDB material, collected from areas around Louisiana, were used in
this trial. Five 100 pound batches were processed to assure that the system would reach a steady
state.
2.0 TEST PROCEDURE
This section describes the work completed by Weyerhaeuser and PM to test the Tunnel Washer
system for its potential to process MCDB's. Section 2.1, Process Description, provides a
description of the Tunnel Washer system and the feedstock processing methodology. A description

5
of the tests and sampling methodology used to evaluated the pulp and effluent quality of the MCDB
feedstock is provided in section 2.2, Sampling Description.
2.1 PROCESS DESCRIPTION
This section describes the batch system used to process MCDB's. Rather than the two four-module
systems used in the September trial (one to simulate pulping and separating, one to simulate
cleaning), this evaluation used one seven-module continuous batch Tunnel Washer system to
simulate pulping and separating. The MCDB processing system includes the following component
parts: loading; pulping and separating; rejects handling; screening; washing/thickening;
clarification of liquid streams; and flow rates. Post consumer MCDB material, collected from
areas around Louisiana, were used in this trial. Five 100 pound batches were processed to assure
that the system would reach a steady state. Figure 1, in Appendix A shows the process flow
diagram for the system under test.
2.1.1 Loading
Five 100 pound batches of Milk Carton (MC) material were weighed and placed in plastic bags.
A bag of MC was dumped onto a scoop that was hydraulically raised to deliver the material to
module 1. In a commercial installation, bales of MC material would be broken and dumped onto a
weight sensitive conveyor that would carry the material to the first module. The conveyor is
sensitive to +/-10 pounds.
2.1.2 Pulping and Separating
A seven-module continuous batch tunnel washer system was used to achieve pulping and
separating (Figure 1). The entire system is enclosed, therefore no sampling can take place until
after these two operations have been completed. As can be seen in Table 1, the first four modules
have baskets with ribs to provide additional mechanical action to facilitate poly/fiber separation.
A change from 0.25 inch holes to 0.03 inch screen is made between modules 1 and 2 to prevent
loss of fiber that has already broken down in module 1. The change from 0.03 inch screen to 0.25
inch holes from module four to modules five, six, and seven insures removal of all pulp that has
been separated from the poly-coating.

6
Table 1. Mechanical Configuration
Module Drum Configuration Screen or Basket Hole Size (in.)
1 Ribs and holes 0.252 Ribs and Screen 0.033 Ribs and Screen 0.034 Ribs and Screen 0 035 Holes 0.256 Holes 0.257 Holes 0.25
Pulping pH is controlled by the addition of sodium hydroxide (caustic), target pH which is
monitored at each of the four pulping modules was 12. The pH measured, on site, at the clarifier,
was 10.7. This pH value was less than the target of 12 because the drain trough effluent is diluted
by reject water, very dirty water from module one (R), and what normally would be counter-flow
water from module two to module one (W), (in this trial this water went to the trough). By the time
this water gets to the clarifier, it is thoroughly mixed and diluted, resulting in a lower pH. Fresh
chemicals (bleach H2O2 and caustic) are added to modules 1-4 only, any chemicals associated
with modules 5-7 occurs due to the chemical residue in the clarified water recirculated to these
modules. As seen in Table 2, pulping temperatures are higher than separation temperatures. The
system is capable of maintaining different temperatures and chemical compositions in each
module. As the number of modules in the system increases the residence time in each module
decreases, keeping the overall time for pulping and separating constant.
Table 2: Pulping Parameters
Module Temperature F Residence Time(min.)
1 200 222 200 223 200 224 200 225 125 226 125 227 125 22

7
Modules 1-4 are pre-dosed with bleach (H2O2) and caustic upon start-up of the equipment.
During operation, each of these pulping modules that contains material receives and additional half
pound of H2O2 (1 pound of caustic in module 1, 3/4 pound in module 2, 3, and 4) every time a
load is transferred forward. By the time each 100 pounds of MC enters Module 5, it has received
a total of 2 pounds of H2O2 and 3.25 pounds of caustic. The amount of caustic addition will drop
off considerably the longer the system is run due to re-circulation of chemically rich water from
the clarifier.
2.1.3 Rejects Handling
Rejects from the pulping/separating system dump out of Module 7, at location (M) into a
perforated dumpster, each time a load is transferred. Due to the limitations of the existing screw
press used in the system under test, if loads of material ( 60 pounds are run, rejects from the system
and the vibrating screen can be fed directly to a screw press and dewatered to 25-30%
consistency. For the 100 pound loads run in this trial, rejects were removed from the perforated
dumpster by hand and fed to the screw press. This restriction could be eliminated by the
installation of a larger capacity screw press. Screw press effluent (V) flows into the effluent
trough underneath the pulping/separating system and is pumped to the clarifier. Screw press solids
(poly and fiber) are collected in a dumpster for disposal at a landfill (S).
2.1.4 Screening
Pulp flows through the 0.25 inch holes of the separation section (Modules 5-7) and is pumped
onto a vibrating screen at 0.540 % consistency, at location (A). The vibrating screen is equipped
with 0.059 inch slits for removal of remaining poly-coat. Rejects move along the top of the
vibrating screen and pile up in a trough at the end, at location (N), they then slide down a tube to
combine with system rejects from Module 7.
2.1.5 Washing/Thickening
Pulp from the vibrating screen, at location (B), is fed to a side hill screen at 0.37 % consistency.
As the pulp flows down the screen dirt is removed and the pulp is thickened to 6.20 %
consistency. The finished pulp “product” accumulates, at location (C), in a trough at the bottom of
the screen where it is diluted and pumped to a holding tank. Effluent from the screen, at location
(F), flows to a concrete trough underneath the pulping/separating system where it mixes with the
other system effluents before being pumped to the clarifier.

8
2.1.6 Clarification of Liquid Streams
System effluents are mixed in a trough, at location (F), underneath the 7 module system and then
pumped to a Krofta clarifier at 53.89 gpm. Clarifier Filtrate is pumped, at location (J), from a tank
adjacent to the clarifier to a tank adjacent to Module 1 where it is mixed with fresh make-up water.
Clarifier sludge is deposited into a tank adjacent to the clarifier before being pumped to a
dumpster, at location (L). A Cytec Chemicals representative was on hand to monitor chemical
application, and a Krofta representative monitored the clarifier operation. A copy of the report
and data on the polymer usage are included in Appendix 3.
2.1.7 Flow Rates
The letters in Table 3 correspond with the process flow diagram in Figure 1, and Appendix 4.
Fresh water enters the system at K, all other water used by the system is clarified water from the
Krofta. Water loss from the system occurs in the clarified sludge, final pulp product, and screw
press rejects.
Table 3: Process Diagram Location
Letter FlowRate
(See Figure 1) (gpm) Description
A 55.00 Separation module accepts / vibratingscreen feed (pulp+water)
B 54.98 Vibrating screen accepts / side hill feed(pulp + water)
C 6.83 Side hill screen accepts (pulp + water)
F 48.15 Side hill screen effluent - to clarifier
G 3.00 Pulping section input - clarified water
H 1.25 Flushes loads into module 1 - clarifiedwater
I 53.89 Effluent mixture from trough - clarifierfeed
J 51.20 Clarifier Filtrate - to tank for systemwater supply
K 8.05 Fresh make-up water - mixed withclarifier filtrate to supply system

9
L 2.69 Sludge from clarifier - to landfill
N 0.02 Pulping / Separating Rejects Poly,water, and some fiber - to screw pressfor dewatering
M 1.50 Vibrating Screen Rejects Poly, water,and some fiber - to screw press fordewatering
S 0.01 Dewatered rejects - to landfill
R 1.00 Very dirty water from module 1
W 3.00 Usually counter-flow water, fiber - wentto clarifier in this trial
P 55.00 Clarified water back to separating andpulping sections
V 1.49 Screw press effluent - to clarifier
2.2 SAMPLING DESCRIPTION
Samples were taken after each of the three stages of the PM system (A, B, and C) to evaluate the
improvement in pulp quality after each stage, and to determine the necessity for supplementing the
PM system with conventional cleaners or screens. Small samples were taken at each stage, every
20 minutes, and deposited into a 5 gallon bucket to generate composite samples.
The Vibrating Screen Feed sample represents the accepts from the 7 module pulping/separating
system. Pulp was collected into a cup, then emptied into a bucket, as it flowed onto the vibrating
screen (A). Vibrating Screen Accepts/Side Hill Feed samples were taken at the side hill before
the pulp was deposited onto the top of the side hill (B). Side Hill Accepts were sampled by
scooping the pulp off of the bottom of the side hill screen before they fell into the trough. This
sample represents the “final product” (C).
Clarifier Feed (I), Filtrate (J), and Sludge (L) samples were also composite samples. Clarifier
feed samples were taken from the trough underneath the 7 module system. Clarifier filtrate
samples were taken from the pipe coming out of the clarifier. Sludge samples were taken from the
tank adjacent to the clarifier.
Strength testing includes: TAPPI brightness, basis weight, caliper, density, burst index, tear index,
tensile index, tensile energy absorption, elongation, and breaking length (Table 4). Environmental

10
testing on the sludge consisted of a total metals analysis. Clarifier Feed and Filtrate were tested
for BOD, Silica, Total Suspended Solids, Total Dissolved Solids, Chlorine, Total Metals
Analysis, and pH.
Table 4: Sampling and Testing
DirtSample ID Consistency Freeness Count Debris *Strength Environmental
Vibrating ScreenFeed
Yes Yes Yes Yes Yes No
Vibrating CreenAccepts
Yes Yes Yes Yes Yes No
Side HillAccepts
Yes Yes Yes Yes Yes No
Clarifier Feed Yes No No No No YesFlarifier Filtrate Yes No No No No Yes
Sludge Yes No No No No Yes
Appendix C contains a copy of the TAPPI test methods.
3.0 TEST RESULTS
This section describes the results of the MCDB feedstock sampling for each of the parameters
described in Section 2.2. Test results were compared against typical specifications for both pulp
and effluent quality. Specifications for pulp quality include optical properties (i.e., brightness, dirt
count), and performance/strength properties (i.e., burst index, tensile, elongation, tensile index,
TEA, breaking length, tear index, and freeness).
These results will help determine the effectiveness of the Tunnel Washer system in processing
MCDB's for use as pulp feedstock. Specifications for effluent quality are derived from local
water quality control regulations and criteria set by state and local governments. These
parameters include pH, TDS, total suspended solids, BOD (biological oxygen demand), and total
metals.
This section also provides estimated operating costs associated with a commercial scale system
for processing MCDB's using this technology.
3.1 PULP QUALITY

11
Table 5: Testing Results and Comparison to Typical Deink Pulp Specifications
Typical ValuesSeparation Vibrating Side MCDB Med. Printing/Module Screen Hill Histo- Grade WritingAccepts Accepts Accepts rical Tissue GradeVibrating (B) (C) DataScreen
Test Performed Feed (A)
Optical Properties
Brightness (TAPPI) 81.77 82.95 84.6 65-80 75 80-84Dirt Count (PPM) 1757.35 1229.43 261.62 5-1600 <30 <10Debris (%) 0.784 0.05 0.1 <0.15 <0.1
Performance Strength Properties
Freeness (CSF, ml.) 522 546 673 570-650 500 500Consistency (%) 0.54 0.37 6.2Basis weight (g/m2) 63.4 64.95 65.17Caliper (mm) 0.115 0.12058 0.12484Density (kg/m3) 551.465 538.707 522.12Bulk (cm3/kg) 1.81387 1.8565 1.9156Burst Index (kN/g) 1.1092 1.0297 0.86756 0.6-2.2 1.42-2.51Tear Index(mN*m2/g)
60.321 6.1299 6.2897 4-10 7.23-10.06
Tensile (kN/m) 1.452 1.431 1.304 0.6 - 2.2 1.4 - 2.52Tensile Index(Nm/g)
22.91 22.03 20.01 31.8-46
Elongation (5) 2.17 2.119 1.876 2.39-4.38TEA (J/m2) 26.08 25.16 20.61 33.5-88Breaking Length(km)
2.336 2.246 2.04 1.1-3.5 3.24-4.69
3.1.1 Optical Properties
Dirt and debris removal across the system resulted in an increase in brightness. The small
increase in debris across the side hill screen (from 0.05 to 0.1%) is insignificant. All of the
samples exceeded the brightness specifications for typical deink pulp for use in printing and
writing grade papers. Dirt count numbers are too high to meet specifications for any of the above
deink pulps. Typical debris specifications were met by the vibrating screen and side hill accepts
samples. MCDB historical data dirt count and brightness ranges are broad because these qualities
are highly dependent on how the MCDB material is collected and processed.

12
3.1.2 Performance/Strength Properties
Several solutions have been proposed to increase the consistency of the final product for shipment.
Pellerin Milnor has proposed using a press currently used in the laundry industry that can dewater
to 50% consistency. Re-pulping may be a problem at this high consistency. Another solution,
proposed by Weyerhaeuser, is to use a screw press to generate “noodle pulp” at about 25-30%
consistency.
Burst Index, Tensile, Elongation, Tensile Index, TEA, and Breaking Length saw decreases of
21.8%, 10.2%, 13.5%, 12.7%, 21%, and 12.7% respectively, while Tear Index increased 4.1%,
across the entire system. These results indicate the loss of short fibers “fines” across the system,
and since fines are the “bridges” that promote fiber-to-fiber bonding, strength properties that are
more dependent on this type of bonding suffer. A Kajaani test of average fiber length would be
needed to confirm this theory.
The freeness increase from 522 to 673 ml. also supports the loss of fines theory. The milliliters of
fluid collected from the fiber mat contained in the freeness test apparatus increases as the amount
of short fibers in that mat decreases. The short fibers fill in the “holes” in the mat and impede
drainage.
Freeness was the only performance/strength property that met the typical deink pulp specifications.
Rejects from module 7 were dried to determine the amount of oven dry (OD) fiber and poly-coat.
The rejects consisted of 35% fiber and 65% poly-coat.
3.2 EFFLUENT CHARACTERISTICS
A copy of the Clarifier Feed, Clarifier Effluent, and Sludge analysis can be found in Appendix 3.
Values that were well above the quantitation limit are summarized in Tables 7 and 8. The
quantitation limit represents the lowest detection level possible. As test values approach the
quantitation limit, their accuracy becomes less reliable.
The MCDB Clarifier Feed sample in Table 6 was taken from the effluent trough and registered a
pH of 12, which was the target pH for this trial. As mentioned earlier, the on-site pH of this
sample was 10.7 due to dilution of the sample. The high TDS are probably due to the residual
pulping chemicals. Total Suspended Solids represents the fiber, poly, etc. that make it through the

13
system. The large reduction in TSS from clarifier feed to effluent shows that these particles are
easily floated to the top of the clarifier and removed. Visual inspection revealed that a large
portion of the TSS are fibers. The BOD samples tested had a large amount of variability, the
accuracy of the values in Table 6 are therefore questionable. Due to the absence of ground wood
in the MCDB material, no Sodium Silicate was needed in the pulper, resulting in lower silica
values than the MOW samples.
Table 6: Effluent Characteristics - Clarifier Feed and Effluent Samples
MCDB Clarifier MCDB Clarifier MOW ClarifierTest Unit Feed Effluent Feed (For
ComparisonpH mg/L 12.0 11.3 8.2
TDS mg/L 1420 940 460TSS mg/L 870 10 3800BOD mg/L 230 170 890
Cl mg/L 46 42 0.3Si as SiO2 mg/L 1.43 1.17 275
The increase in calcium from the clarifier feed to effluent is questionable, these samples may have
been switched during testing (Table 7). There is a significant drop all of the other metals from
feed to effluent. The high amount of Sodium (Na) in the clarifier feed and effluent samples
represents the sodium portion of the Sodium Hydroxide (Caustic) added to the pulping section.
According to the people testing these samples, none of these metals are at levels that raise
concerns. No data was available from MOW for comparison to the clarifier feed and effluent
values in Table 7. The units used in Table 7 are micro grams per liter.

14
Table 7: Total Metals Analysis - Clarifier Feed and Effluent Samples
Element Unit MCDB ClarifierFeed
MCDB ClarifierEffluent
QuantitationLimit
Al ug/L 2000 900 200Ca ug/L 12900 16100 500Fe ug/L 1100 <100 100Mg ug/L 2000 600 100Mn ug/L 30 <10 10Mo ug/L 50 30 10Na ug/L 473000 273000 1000P ug/L 900 400 200Zn ug/L 120 <20 20
Sludge sample metals that fell above the quantitation limit are summarized in Table 8. MOW
sludge values are shown for comparison. None of the values reported in Table 8 are high enough
to be of concern.
Table 8: Sludge Samples
Element Unit MCDB Sludge QuantitationLimit
MOW Sludge(For
Comparison)Cr mg/kg 4 1 0.3 - 0.6Cu mg/kg 16 2 1.1 - 2.4Pb mg/kg 2.8 0.3 0.3 - 0.7Zn mg/kg 86 2 8.6 - 54.2
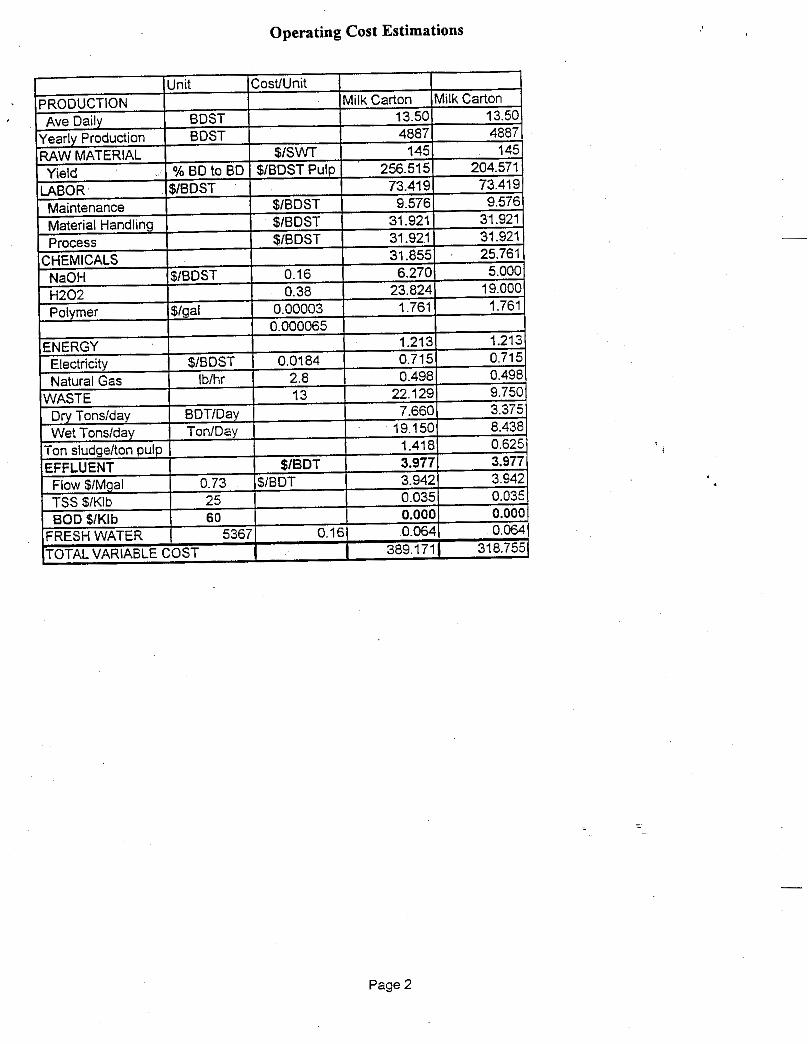
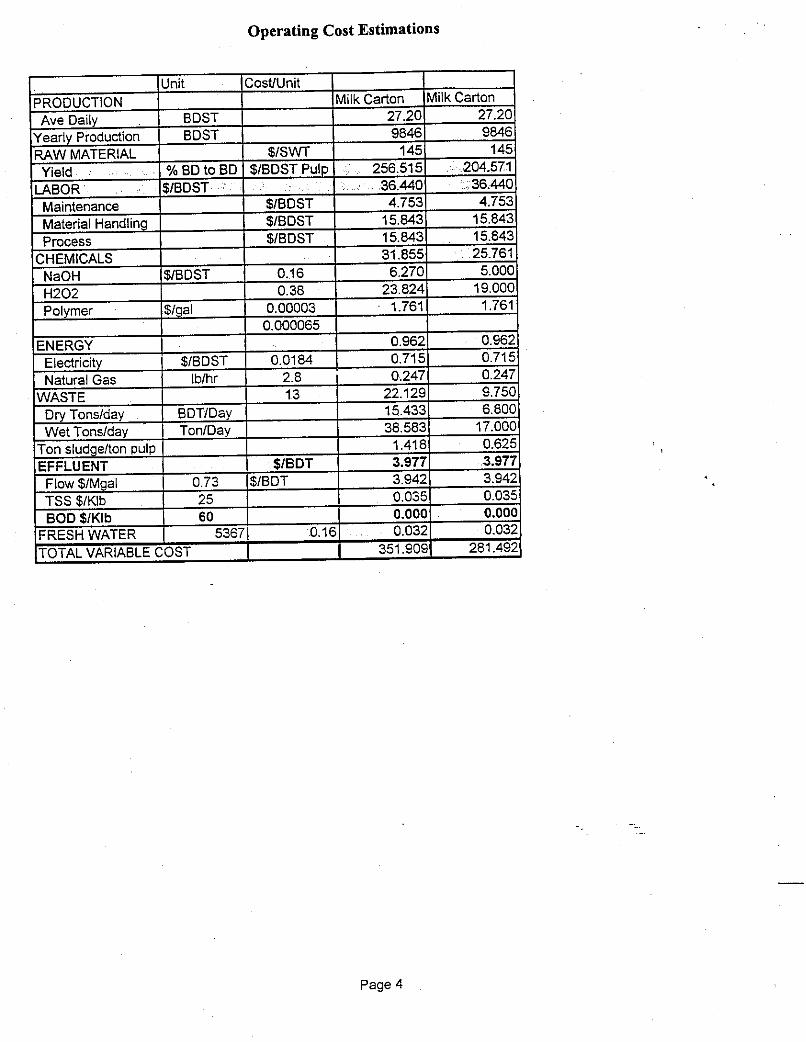
3.3 OPERATING COSTS
Operating costs associated with a commercial scale system have been estimated using data from
Pellerin Milnor, the most recent pilot plant trial, and Weyerhaeuser Paper Company engineering.
Details on the units of consumption, and unit cost are included in Appendix 1.
It is important to note that the operating costs described in this section include only variable cost
and labor. Semi-variable costs (such as operating and maintenance supplies), and fixed costs
(such as depreciation, taxes, salaried labor) are not included.

15
The variable operating costs can be used on a comparable basis, and are a useful tool to evaluate
the impact of a given variable, such as yield or raw material cost, on the variable cost associated
with producing a ton of finished product. However, any economic analysis of the investment such
as net present value (NPV) or return on investment (ROI) would have to include annualized semi
variable and fixed costs.
Three variables have been evaluated for milk carton: yield, raw material cost, and plant capacity.
A brief discussion of each follows.
Yield from the pilot plant trial was calculated at 63.8% (bone dry feed stock to bone dry pulp
product) for milk carton. The impact of yield on operating cost was determined using 63.8%, 80%
(average yield) and 87% (theoretical maximum) for milk carton.
Raw Material - In all cases it was assumed that freight would average $25/SWT (scale weight
ton). Raw material costs of $120/SWT and $150/SWT were used in the operating cost model.
Actual consistency of 88.6% for milk carton was used, from the pilot plant trial, to convert from
SWT to BDT (bone dry ton).
Plant Capacity - All operating costs have been equated to a $/BDST (bone dry short ton) of
product out. Two plant capacities were used based on data supplied by Pellerin Milnor (6
January 1995) for a 24 and 48 module system. For the purpose of the operating cost model it was
assumed that the 24 module system would average 13.5 BDSTPD on milk carton. The 48 module
system capacity is 27.5 BDSTPD (bone dry short ton per day) on milk carton.
As can be seen in Figure 2, the yield has a significant impact on the operating costs associated
with converting milk cartons. The plant capacity also impacts the operating cost as it is assumed
that the labor would remain constant with both 24 modules and 48 modules. All operating cost
data summarized in Figure 2 is based on milk carton stock at a price of $120/SWT.

16
Figure 2: Impact of Yield and Capacity on Operating Cost -$120/SWT MC
200225250275300325350375400425450
63.8 80 87
$/BDST
Yield (% BD to BD)
13.5 TPD 27.2 TPD
The operating cost is reduced by about $37/BDST when the system capacity is increased from
13.5 TPD to 27.2 TPD.
Figure 3 summarizes the same yield and capacity assumptions for milk carton, but assumes that the
value of the milk carton is $150/SWT.
Figure 3: Impact of Yield and Capacity on Operating Cost -$150/SWT MC
200225250275300325350375400425450
63.8 80 87
$/BDST
Yield (% BD to BD)
13.5 TPD 27.2 TPD
The $30/SWT increase in raw material cost equates to an increased operating cost of
approximately $53/BDST, $42/BDST, and $39/BDST for a yield of 63.8%, 80% and 87%
respectively.

17
Summarized in Table 9 is the non-raw material, variable and non-salaried labor costs associated
with the conversion of milk cartons using the ReGenex System and a state of the art deinking
system processing mixed office waste (MOW).
Table 9: Cost Comparison Summary - $/ton
Milk Cartons MOW24 Modules (13.5 TPD) 1 line (270 TPD)
Labor (1) 73.42 14.06Chemicals(2) 25.76 42.84
Energy(3) 1.21 27.56Other(4) 14.25 16.53Total 114.64 100.99
1) Labor rates held constant for both facilities. If union wages were paid at MOW facility, labor wouldincrease by approximately $11/ton.
(2) Assumes cost/unit is the same at both facilities. In actuality because the usage (on a daily basis) would beso much lower, the MCDB chemical costs are artificially low.
(3) Energy cost/unit assumes steam and energy are available from an industrial site, such as a paper mill. If thefacility is required to purchase electricity and steam from a municipality the energy numbers may increasesignificantly.
(4) Other includes BOD, TSS, and effluent flow as well as residual solids disposal and fresh water usage. Again,cost/unit assumes the recycle facility is adjacent to a paper mill.
The milk carton system is penalized for labor due to the limited production. The ReGenex system
is more cost effective than a state of the art deink system for chemicals and energy. Effluent
treatment and residual disposal is comparable between the two systems.
The overall conversion costs are about $14/BDT lower on MOW. Once again, fixed costs and
semi-variable costs, excluding hourly labor, are not included.
Raw material costs are highly volatile, especially for MOW. Assuming the following trend
pricing and yields, we can determine the yield required from milk cartons to be comparable to a
state of the art market pulp mill.
Milk Cartons MOW

18
Moisture (%) 11.4 10Trend Price ($/SWT)* 150 150Yield BDT to BDT ---- 68Yield SWT to BDT ---- 61.2
* This is a long term price, today's price is actually higher
Using these assumptions, the cost to convert MOW is summarized in Table 10 compared to the
cost equivalent yield for milk carton.
Table 10: Conversion Costs
MOW $/BDST Milk Cartons $/BDSTLabor 14.06 73.46
Chemicals 42.84 27.76Energy 27.56 1.21Other 16.53 14.25
Raw Materials 245 231.45Total 346.09 346.09
To achieve a raw material cost of $231.45/BDST of finished product, the milk carton facility must
have a yield of approximately 73% BDT to BDT.
4.0 CONCLUSIONS AND RECOMMENDATIONS
This section presents a summary of conclusions based on the results of the tests conducted on the
Tunnel Washer system.
l System yield was 63.8% BDT to BDT for post-consumer MCDB.
l For variable costs to be comparable to a state of the art, optimum sized, market deink pulp
mill, the yield on milk carton must be about 73% BDT to BDT. This will need to be re-
evaluated when quality targets have been achieved.
l Performance/strength properties, with the exception of freeness, did not meet typical deink
pulp specifications for fine paper applications, but did fall within typical historical parameters
for post-consumer MCDB pulp.

19
l Strength properties of the post-consumer MCDB may have been influenced by the advanced
state of bio-decomposition of the feed stock, which was over 6 months old.
l Loss of fines at the three sequential pulp sampling stages across the system resulted in a
progressive reduction in all strength properties except tear index. Freeness increase across
system also supports this theory.
l Fiber and poly-coat percentages in the composite system reject stream were 35% and 65%
respectively, by dry weight.
l The only optical property to exceed typical deink pulp specifications for printing and writing
and tissue grades was brightness.
l When Weyerhaeuser tested the Clarifier Feed Sample, it’s pH registered 12.0, which was the
same as the target pH.
l The TSS particles, in the system effluent stream, are easily floated and removed at the
clarifier, visual inspection found a large portion of the TSS to be fiber.
l BOD values reported are questionable due to the wide variability of values obtained during
testing.
l Total Metals Analysis values show a large decrease from clarifier feed to effluent.
l No concerns were raised about the levels of metals present in the sludge from this trial
RECOMMENDATIONS
l Need further testing/study to reduce dirt count and increase strength properties.
l Need to increase yield to a minimum of 73% BDT to BDT in order for the system to be
economically viable.
l Screw press should be sized for the typical load size of 80 to 100 pounds (direct feed of
rejects to a screw press for dewatering is currently dependent on running loads of ( 60
pounds).

20

21
5.0 ACKNOWLEDGMENTS
The following organizations contributed their time, effort, support and understanding during the
conduct of this project:
1. Weyerhaeuser Corporation, Research and Development
2. Pellerin Milnor Corporation. (Regenex L.L.C.)
ReTAP is a joint venture of the Clean Washington Center, Washington State’s lead agency for the market
development of recycled materials, and the National Recycling Coalition, a 3,500 member nonprofit
organization committed to maximizing the benefits of recycling. ReTAP is an affiliate of the national
Manufacturing Extension Partnership (MEP), a program of the U.S. Commerce Department’s National
Institute of Standards and Technology. The MEP is a growing nationwide network of extension services to
help smaller U.S. Manufacturers improve their performance and become more competitive. ReTAP is also
sponsored by the U.S. Environmental Protection Agency and the American Plastics Council.

APPENDIX 1
PROCESS FLOW DIAGRAM


h I
P
ELECTRICAL SPECIFICATIONS 480V/3P/60HZ OUTPUT CONTROL BITS
._
Figure 1: Process Diagram


APPENDIX 2
EFlFLUENT/SLUDGE TEST RESULTS & POLYMER APPLICATIONS
L
!


3% 31r7 \ ANALYTICAL LABORATORY SERVICES REQUEST I
N d r o f Sacples: 2
Date Received: 03/13/95
4 x 1 Research and Development - Analysis and Testing I Request "her: 17445
Title: PELLERIN MILNOR SLUDGE - Project "ber: 042-2040 Groups: 3
Date Desired: 04/03/95 Sample Disposition:
Reviewed BY: LANZA M a r y B e t h
Pmject Title: RECYCLE MATLS UTIL IZATN
Suhitted BY: BECK, DARLENE I Location: WTC 2819 I Ph: 924-6112 1 Location: WTC 2F25 Ph: 924-6013/6188
P m j e t Leader: FRIBERG - WTC2C19
Group
copy To:
Series Test kscription
sample Description and History:
Report Range Report Basis Lower Limit o f Sensitivity 1 I I I
3%
Sanvle N d e r Series to Be Evaluated Suhnitters Designation Date Recd
43429 A 43430 A
xeference: 16681
Date Signature Applies t/ 3 / 4 g To Attached Pages:
CUP SLUDGE 03/06/95 MCDB SLUDGE 03/06/95
Record Book:
Page Nlmbers: To:
03/ 13/95 03/13/95


WEYEREIAEUSER COMPANY ANALYTICAL LABORATORIES
ATOMIC SPECTROSCOPY Tacoma, WA
Pellerin Milnor Sludge SR 17'445
Total Metals Analysis
Element 43429 43429D 43430 Quantitation Method Cup Sludge Duplicate MCDB Sludge Limit Number
3/6/95 3/6/95
(mgkg, air dried basis)
Ag
As
Be
Cd
Cr
c u
Hg
Ni
Pb
Sb
Se
T1
Zn
< l
< 0.3
< 1
< 1
2
13
< 0.9
< 3
1.1
< 5
< 0.3
< 0.3
50
< I < 1
< 0.3 < 0.3
< 1 < 1
< 1 < 1
2 4
14 16
< 0.9 < 0.9
< 3 < 3
1.1 2.8
< 5 < 5
< 0.3 < 0.3
< 0.3 < 0.3
49 86
YO Solids @ air dried 2.4 2.6 3.5
O h Solids @ 10% 2.4 2.6 3.8
Approved 0JL-L
1
0.3
1
1
1
2
0.9
3
0.3
5
0.3
0.3
2
Ah41-3050/60 10
AM1-3050/200.9
AM1-3050/60 10
AM1-3O50/60 10
AM1-3050/6010 . AM1-3050/6010
AM1-245.5
AM1-3050/6010
AM1-30501200.9
AM1-3050/60 10
AM1-3050/200.9
AMI-3050/200.9
AM1-3050/6010
AMI-TS-CLP Modified
AM1-TS-CLP
Report Date 4/3/95

Element 43429 Cup Sludge
03/06/95
Ca 6800
Fe 300
Mg 2900
Ni < 30
Ti 400
WEYERHAEUSER COMPANY ANALYTICAL LABORATORIES
ATOMIC SPECTROSCOPY Tacoma, WA
Pellerin Milnor Sludge SR 17445
Total Metals Analysis
43429D 43430 Duplicate MCDB Sludge
03/06/95
(mgtkg, air dried basis)
8300 1100
6800 5600
300 700
2900 2300
< 30 < 30
400 300
Approved pR"'
Quantitation Limit
200
500
100
100
30
100
Method Number
AM5-FBN6010
AM5-FBN60 10
AM5-FBN60 10
AM5-FBp/6010
AM5-FBM6010
AM5-FBN6010
Report Date 4/3/95

Reqwst Nvober: 17407 A ANALYTICAL LABORATORY SERVICES REQUEST .&- Research and Development - Analysis and Testing
.le: PELLERIN MILNOR L I Q U I D SAMPLES
b r o f Samles: 4 1 Project "her: 092-2040 I Groups: %h :e Received: 03/08/95 b t e k i t e d : 03/29/95 S q l e Disposition:
nitted BY: BECK, DARLENE 1 Lccation: WTC 2819
IY To: JAN HUSTON - WTC 2B19 I
PIX 924-6112
Rple Description and History:
tiewed BY: RANTA M a x i n e
iject Title:
IW 1 Series I Test Cescriutim I
Lccation: WTC 2F25 Ph: 924-6149/6289
Project Leader:
Report Range
3 B ICP Scan
3 B S i l i c o n / S i l i c a
1 Q/ BOD5
4
Report Basis Loker Limit o f Sensitivity
! A C h l o r i d e
1 d ~ l ~ d f s ~ ~ ~ ~ : l bi s s o l v e d (TDS)
! &olids, T o t a l Suspended (TSS)
1 1
vrple NuFber ~
Series to Be Evaluated Sutmitters hignation Date Rezd
43241 AB 43242 AB
ference: 15793
sults Appmved: Oate: Signature Applies To Attached Pages:
43243 AB 43244 AB
Record Book:
Page Nvnbers: To:
MCDB CLARIFIER FEED 03/06/95 MCDB CLARIFIER EFFLUENT 03/06/95 CUP CLARIFIER FEED 03/06/95 CUP CLARIFIER EFFLUENT 03/06/95
03/08/95 03/08/95 03/08/95 03/08/95

Request 17407 .
WEYERHAEUSER TECHNOLOGY CENTER Analytical Laboratories
Tacoma, Washington
REPORT
Pellerin Miloor Liquid Samples 03/06/95
Sample Designation MCDB MCDB CUP CUP Clarifier Clarifier Clarifier Clarifier
Feed Effluent Feed Effluent Analytical Lab Code 43241 43242 43243 43244
TEST UNIT Method Used:
Ph 12.0 11.3 10.9 1c.o ; 10.0 EPA 150.1
440 EPA 160.1 TDS mgfl. 1,420 ; 1,380 940 530
TSS m p n 870 ; 870 10 920 40 EPA 160.2
BOD m a 230 170 290 * 49 * SM 5210
CI m p n 46 ; 48 42 27 26 EPA 352.1
* Highest valid value; very eratic values observered
ate 4/18/95

WEYERHAEUSER COMPANY ANALYTICAL LABORATORIES
ATOMIC SPECTROSCOPY Tacoma, WA
Pellerin Milnor Liquid Samples SR 17407
Method: AM1-3010/6010 Total Metals Analysis
Element 43241 MCDB
Clarifier Feed
Ag Al A3 B
Ba Be Bi Ca Cd co C r c u Fe K Li
Mn Mo Na Ni P Pb Sb Se Sn Sr TI V Zn
Mg
< 10 2000 < 100 < 500 < 100 < 10 < 50 12900 < 10 < 10 10 40 1100
< 10000 < 50 2000 30 50
473000 < 30 900 < 50 < 50 < 500 < 50 60
< 500 < 10 120
43241D Duplicate
< 10 1900 < 100 < 500 < 100 < 10 < 50 12700 < 10 < 10 10 40 1000
< 10000 < 50 2000 30 40
485000 < 30 900 < 50 < 50 < 500 < 50 60
< 500 < 10 120
43242 43243 MCDB CUP
Clarifier Clarifier Effluent Feed
(ugn)
< 10 900
< 100 < 500 < 100 < 10 < 50 16100 < 10 < 10 < 10 60
< 100 < 10000
< 50 600 < 10 30
273000 < 30 400 < 50 < 50 < 500 < 50 70
< 500 < 10 < 20
< 10 4000 < 100 < 500 < 100 < 10 < 50 22300 < 10 < 10 < 10 30 200
< 10000 < 50 5400 < 10 40
160000 < 30 500 < 50 < 50 < 500 < 50 100
< 500 10 30
43244 CUP
Clarifier Effluent
< 10 2500 < 100 < 500 < 100 < 10 < 50 18800 < 10 < 10 < 10 < 20 < 100
< 10000 < 50 4500 < 10 20
102000 < 30 300 < 50 < 50 < 500 < 50 90
< 500 < 10 < 20
Quantitation Limit
IO 200 100 500 100 10 50
' 500
10 . 10 a
10 20 100 10000
50 100 10 10 1000 30 200 50 50 500 50 10 500 10 20
Report Date 03/23/95

WEYERHAEUSER COMPANY ANALYTICAL LABORATORIES
ATOMIC SPECTROSCOPY Tacoma, WA
Pellerin Milnor Liquid Samples SR 17407
Method: EPA 200.7 Dissolved Metals Analysis
Element 43241 43242 43243 43244 Quantitation MCDB MCDB Cup CUP Limit
Clarifier Clarifier Clarifier Clarifier Feed Effluent Feed Effluent
( U S n )
Si as Si02 14300 11700 7100 6900 500
Report Date 3/23/95

Process Water Clarification Data for 3/6/95 Pilot Plant Run at Pellerin Milnor for Weyerhaeuser Technical Center
!&€kmQuorllntnrmatlaa: 1. Process water flow to the Krona clarifier = 50 GPM. 2. Main source of process water for clarification is the filtrate from the side-hill screen thickener. 3. Condensadlog of events:
a, Data collected from 10:45 to 1200 was on drink box furnish b. 1045 sample was prior to any significant amounts of pulp passing over the side-hill Screen c. At the 1130 sample, pulp was passing over the rlde-hill screen d. From 11:30 to i2:45, mechanical problems were experienced on the KroRa. This rasulted in intermittent cany-over of the sludga mat to the clarifier effluent.
e. Data collected at 1630 and 17:OO was on cup stock fumlsh.
a. Magnifloc 573C Is a poiyamins based chemistty. It was used as the cationic coagulant. b. Magnifloc AFi26 is an anlonic. palyacrylamldn based. emulsion product. It was used as the flocculanl.
This explains why the 121 5 influent solids to the Krone were so high. For a short period. solids recirculated in the water loop b buill up to higher than normal levels
4. Description of the dual component, clarification treatment program:

March 7. 1995
Ms. Darlene Beck Weyerhaeuser Company Mail Stop 2819 Tacoma, WA 98477
Subject: Process Water Clarification Data for 3/6/95 Pilot Plant Evaluation at Pellerin Milnor
Dear Darlene: I really enjoyed working with you during the pilot plant work at Pellerin Milnor. As you know. during all phases of the evaluation, a Cytec treatment program was used for clarification of the process water., We used a dual component program consisting of: Magnitloc 573C. a cationic coagulant and Magnifloc AF126, an anionic flocculant. The Magnifloc AF126 is relatively new .prcductforCytec. In 1994, we introduced the Magnifloc AFIOO Series to the industry. The series consists of four, differently charged anionicflocculants. The unique characteristic of this group of polymers is that they possess exceptionally high molecular weights (3 to 4 times higher than conventional anionic emulsions). It has been our experience mat this feature allows significant improvements in clarification efficiencies to be obtained. at reduced dosage levels. And, not only is the flocculant dosage requirement reduced, but it also results in lower dosage requirements of the cationic magulant! We are currently using Magnifloc AF100-type programs on 20 clarifiers in the recycling segment of the paper industry. On a daily basis, almost 5000 tons of recycle pulp are manufactured in the facilities where these clarifiers are located.
Darlene. I am attaching a summary of the clarification data collected during the 3/6/95 pilot plant evaluation. If you have any questions regarding this information. please do not hesitate to give me a call. I realize that this project is still in the developmental phases for Weyerhaeuser; however, if it is decided to pursue further pilot studies or to proceed with a full- scale installation. please keep us in mind for the clarification portion of the process.
I look forward to working with~you in the future.
Sincerely yours,
Cytec Industries Inc. Water B Recycle Technology Group Manager
cc: Mr. Chris Kulakowski - Pellerin Milnor Corporation

APPENDIX 3
TAPPI TEST METHOD NUMBERS


Ts&"d Brightness Dirt Count Debris Freeness Consistency Basis weight Caliper Density Bulk Burst Index Tear Index Tensile Elongation Tensile Index TEA Breaking Length
APPENDIX 3
TAPPI TEST METHOD NUMBERS
T 452 om-92 Weyerhaeuser Method D-1 Weyerhaeuser Method W-120-0 Weyerhaeuser Method W-040-2 Weyerhaeuser Method W-025-0 T 410 om-93 T 411 om-89 N/A, Calculated N/A, Calculated T 403 om-91 T 414 om-88 T 404 cm-92 T 404 cm-92 T 404 cm-92 T 404 cm-92 T 404 cm-92


APPENDIX 4
OPERATING COST DATA, UNITS OF CONSUMPTION, & UNIT COST


APPENDIX 4
OPERATING COST DATA, UNITS OF CONSUMPTION, & UNIT COST
The following assumptions have been used to estimate operating costs for a commercial scale installation
estimate it is assumed that output tonnage is held constant based on data supplied by Pellerin Milnor for 24 modules and for 48 modules.
of a Pellerin Milnor continuous batch fiber recovery system. For the purpose of this operating cost -
MAJOR ASSUMPTIONS
0
0
0
0
0
0
0
0
0
Units of consumption for 7 module system will be the same for 24 module system.
System modifications to improve quality will not affect units of consumption.
All tons are short tons, bone dry tons are used for the finish product. Scale weight tons assumes actual measured consistency at the Sept. 94 pilot plant trial of 88.6% for milk carton and 93.4% for cup stock
Raw material pricing is based on scale weight tons (SWT)
System availability is 95%.
Labor requirements. assumes that 1 maintenance person can cover all maintenance. Operations includes 1 material handling person per shift (raw materials, chemicals, rejects, etc.) and one process person per shift.
Labor rate assumes $12.50/hour for process and material handling position and $15.00/hour for maintenance. A loading multiplier of 1.5 is used to account for overtime, and benefits.
It is assumed that no salaried labor is required.
Average freight is assumed at $25/SWT of raw material.
Flow to the clarifier is calculated on a flow per ton basis. The material balance from the pilot plant trial were used to generate these numbers.
Effluent from the system was estimated based on a water balance around the system during the pilot plant.
Clarifier treatment costs are based on the report from Cytex, which included a cost of treatment in $/IO00 gallons (Appendix 3).
..
-

a Effluent treatment costs are based on a fee structure which includes flow, TSS and BOD. treatment costs are from an effluent treatment facility in Washington State and will be site dependent.
Reject disposal cost was estimated at %13/cubic yard. It was assumed that the rejects would be dewatered to 40% consistency prior to disposal.
The operating cost summary includes ONLY variable costs and labor. All fixed costs including maintenance capital, depreciation, taxes, and regulatory fee’s are not included.
It was assumed that performance properties will be the same for a 7 module system as for a 24 or 48
module system.
The
a
a

1 Operating Cost Estimations
60D I #/day 1 I O.OOO( 0.000 I I
Page 1
Operating Cost Estimations
i
Page 2

Operating Cost Estimations
Page 3
Operating Cost Estimations
.. ..
Page 4

Operating Cost Estimations
Page 5

Operating Cost Estimations
Page 6

Operating Cost Estimations
..
Page 7

Operating Cost Estimations
..
Page 8

Operating Cost Estimations
..
Page 9

Operating Cost Estimations
Page 10

Operating Cost Estimations
Page 11

Operating Cost Estimations
..
' " , ,
Page 12

APPENDIX 5
COMPANY INFORMATION


FINALLY A FIBER REcdvEFar
SMSTEMll=WTS COSTEFFMCIENT
Here is breakthrough technology in paper shell and rotating inner cylinder. Each module recycling - a fiber recovery system with both low capital cost and low operating expenses. It's a continuous batch fiber recovery system from Pellerin Milnor. It provides high-dilution fiber washing for deinking. It can also sepa- rate fiber from polyester film used in milk cartons, drink boxes, poly-coated cups, etc.
Continuous batch technology is a system of connected modules, each with an outer
has an integrated transfer scoop, which transfers stock from one stage to the next - simply and efficiently, without pumps. Rejected polyfilm is removed in sheets and/or large pieces (not ground and then separated).
Extensive factory testing has revealed significant advantages. Here is a summary. For more information, please contact us.
AFFORDABLE The . ~~ ~ ~ ~ ~ ~~ ~~~
system's simpiicity helps reduce capital costs. Even the inteqrated solid state controls cosiless than others. LOW OPERATING COSTS Saves water (most is reused in the closed loo0 svstem: tests show consumption of 5 to 1 gal ilb ) and electricity (energy-consuming pumps are not needed for stock transfers within a svstem).
FASTER INSTALLATION Typically. a system can be installed within the range of four weeks. System includes virtually ali internal piping and wiring, as well as controls. There are single-point connections for water, steam, air and electricity (Also reduces construction and engineering fees.) SAVES SPACE Compact desion rewires far less soace
EASY O P E M T I O N B2se s:cc*: s oE:ec cymarera s Pano nG syslems Fror !-ere operation is automatic - controlled by programmable microprocessors with informative data displays EASILY STAGED: You can ~~~ ~ ~~
increase volume as necessary by adding more production lines (or adding modules within one line). You can also segment your operation bene1 by devoting a separate line to a different product.
PROVEN TECHNOLOGY This type of system has been proven in the laundry industry; which has many parallels to the paper industry More than 7,000 modules have been installed worldwide since the late 1970s. TURNKEY INSTALIATION: The complete system is manufactured by Pellew Milnor Even solid state controls are designed and built in-house You deal with a single source
Pellerin Milnor Corporation P.O. Box 400 Kenner. LA 70063 (504) 467-9591, Ext.239 Fax: (504) 469-1849
dl01 lON1IW N183113d 40 NOISlhla

Ireahthrough Technologq in Paper Recqcling ...
TOPTRRNSFER FOR HlCH DILUTION

3. Contominants removed by the process 4. Cleaned pulp from the process. 5. Find results.
From row refuse to high-quolity fiber - outomoticolly ond continuolly.
rantages of continuous hatch fiber recoverq sqstem include: )RDABLE ,implicity of the entire system , reduce capital costs. Even itegrated, solid state controls ess than others. The result is r return on investment par- irly important for smaller
' OPERATING COSTS 5 water (most is reused in the d-loop system; tests show Jmption of .5 to 1 gal./lb.] dectricity (ener y consuming
fers within a system).
stock is loaded by materials lling systems. From there, ation is automatic - con- :d by pro rammable micro-
a s. Versatile and extremely bye user-friend1 controls are le to operate. dor do they ire "babysittin turer. Literally undreds of
controls operate day-in- out in laundries worldwide.
3s are not nee z - ed for stock
r OPERATION
Essors wit 3, informative data
i? by the
CONSISTENT, CONTINUOUS PRODUCTION The system separates contami- nants and washes fiber consis- tently from batch to batch - and continuously.
The result is a stead flow of
mill's roduction at an even, pre- batches of output w K ich keeps the
dictab P e pace.
FASTER INSTALLATION Typically, a system can be installed within the range of four weeks. System includes virtually all internal pipin and wiring, as
point connections for water, steam, air and electricity. The result is ais0 lower construction and engineering fees.
SAVES SPACE The system's compact design requires far less space than other systems - less than half the floor space of some typical systems.
EASILY STAGED You can increase volume as nec- essary by adding more production lines (or adding modules within one line). You can also se ment your operation better b Jevoting
well as controls. B here are single-
a se orate line to a di d erent pr0d)uct.
MAINTENANCE EASE The system requires fewer com- ponents than others. The simple drive, for example, requires only two motors per section of 'several modules. There are no internal seals, and interior components are stainless steel. Simple mechanical design limits wear to components. And components are easily accessible to speed maintenance if it is necessary.
TURNKEY SYSTEMS All elements of this continuous batch fiber recovery s stem are
includins monorail storage sys- tems, fiber recovery systems, materials handling, and controls. The result is an integrated, turnkey installation.
PROVEN TECHNOLOGY This type of system has been proven in the laundry industry, which has many arallels to the
modules have been installed worldwide since the late 1970s.
available from a sing Y e source -
paper industry.. hr ore than 7,000

QUALITY-ENGINEERED SYSTEMS Regenex, the manufacturer, is a division of Pellerin Milnor Corporation, a company that is recognized worldwide as the leader in laundry machinery and systems. Founded in 1947, the company backs its products by extensive engineering and manufacturing capabilities, and unrivaled product support. Computer integration - from conceptual design to manufacturing - i s used in the development of all products. The company employs over 900 in its 400,000 sq. ft. factory and office facility in suburban New Orleans.
- ... Printed ioV.S.4 ~~ ~~ ~~ ~ ~
DlVlSlDN OF PELLERIN MILNOR CORP. Kenner, Louisiono 70063-0400 U.S.A. 504/467-9591, Exl. 1 3 9 . Soles f o x 504/468-3094 Engineering fox: 504/469-1849