Embed Size (px)
Citation preview

Small-Scale Smart Grid Construction and Analysis
By
Nicholas James Surface
Submitted to the graduate degree program in Mechanical Engineering and the Graduate Faculty of the University of Kansas in partial fulfillment of the requirements for the degree of Master of Science.
________________________________
Chairperson Dr. C. Depcik
________________________________
Dr. R. Dougherty
________________________________
Dr. T. Faddis
Date Defended: 18 April 2014

The Thesis Committee for Nicholas James Surface certifies that this is the approved version of the following thesis:
Small-Scale Smart Grid Construction and Analysis
________________________________ Chairperson Dr. C. Depcik
Date approved: 22 April 2014
ii

Abstract
The smart grid (SG) is a commonly used catch-phrase in the energy industry yet there is no universally accepted
definition. The objectives and most useful concepts have been investigated extensively in economic,
environmental and engineering research by applying statistical knowledge and established theories to develop
simulations without constructing physical models. In this study, a small-scale version (SSSG) is constructed to
physically represent these ideas so they can be evaluated. Results of construction show data acquisition three
times more expensive than the grid itself although mainly due to the incapability to downsize 70% of data
acquisition costs to small-scale. Experimentation on the fully assembled grid exposes the limitations of low cost
modified sine wave power, significant enough to recommend pure sine wave investment in future SSSG
iterations. Findings can be projected to full-size SG at a ratio of 1:10, based on the appliance representing
average US household peak daily load. However this exposes disproportionalities in the SSSG compared with
previous SG investigations and recommended changes for future iterations are established to remedy this issue.
Also discussed are other ideas investigated in the literature and their suitability for SSSG incorporation. It is
highly recommended to develop a user-friendly bidirectional charger to more accurately represent vehicle-to-
grid (V2G) infrastructure. Smart homes, BEV swap stations and pumped hydroelectric storage can also be
researched on future iterations of the SSSG.
iii

Acknowledgements
First and foremost, I would especially like to thank to Dr. Chris Depcik for establishing the Ecohawks and this
project, and your tremendous support, knowledge, advice and time over the last four years.
I also wish to thank my entire team at the Ecohawks especially Bryan Strecker, Mickey Clemen and Jon Mattson
for their equal contribution to planning and assembling the SSSG in time and under budget for the EPA P3
competition in Washington DC.
Thanks to the EPA for providing the initial and most significant financial backing to the project. Also to
National Instruments Corp. for providing a 60% discount on all data acquisition modules and free LabVIEW
training.
I would finally like to thank the University of Kansas Mechanical Engineering Department for providing
facilities, support and invaluable advice, including the professors, technicians and support staff.
iv
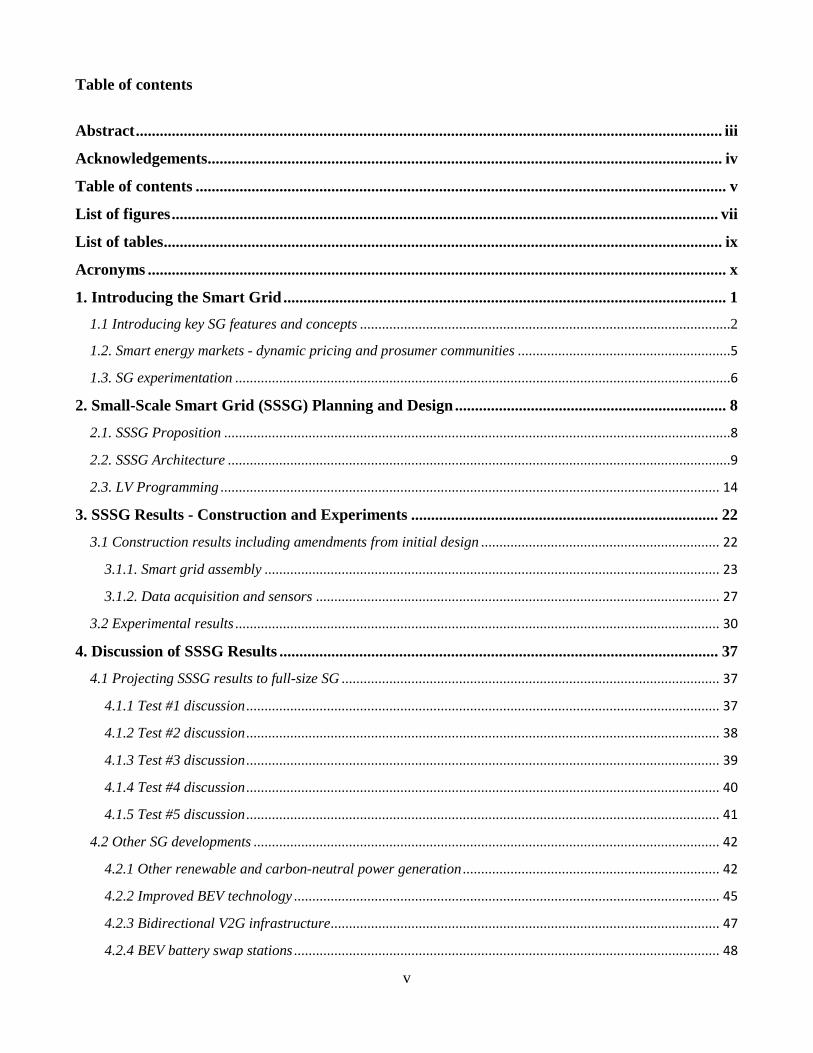
Table of contents
Abstract ................................................................................................................................................... iii
Acknowledgements................................................................................................................................. iv
Table of contents ..................................................................................................................................... v
List of figures ......................................................................................................................................... vii
List of tables ............................................................................................................................................ ix
Acronyms ................................................................................................................................................. x
1. Introducing the Smart Grid ............................................................................................................... 1
1.1 Introducing key SG features and concepts .....................................................................................................2
1.2. Smart energy markets - dynamic pricing and prosumer communities ..........................................................5
1.3. SG experimentation .......................................................................................................................................6
2. Small-Scale Smart Grid (SSSG) Planning and Design .................................................................... 8
2.1. SSSG Proposition ..........................................................................................................................................8
2.2. SSSG Architecture .........................................................................................................................................9
2.3. LV Programming ........................................................................................................................................ 14
3. SSSG Results - Construction and Experiments ............................................................................. 22
3.1 Construction results including amendments from initial design ................................................................. 22
3.1.1. Smart grid assembly ............................................................................................................................ 23
3.1.2. Data acquisition and sensors .............................................................................................................. 27
3.2 Experimental results .................................................................................................................................... 30
4. Discussion of SSSG Results .............................................................................................................. 37
4.1 Projecting SSSG results to full-size SG ....................................................................................................... 37
4.1.1 Test #1 discussion ................................................................................................................................. 37
4.1.2 Test #2 discussion ................................................................................................................................. 38
4.1.3 Test #3 discussion ................................................................................................................................. 39
4.1.4 Test #4 discussion ................................................................................................................................. 40
4.1.5 Test #5 discussion ................................................................................................................................. 41
4.2 Other SG developments ............................................................................................................................... 42
4.2.1 Other renewable and carbon-neutral power generation ...................................................................... 42
4.2.2 Improved BEV technology .................................................................................................................... 45
4.2.3 Bidirectional V2G infrastructure .......................................................................................................... 47
4.2.4 BEV battery swap stations .................................................................................................................... 48
v

4.2.5 Smart homes/buildings ......................................................................................................................... 48
4.2.6 Economic, social, and policy hurdles ................................................................................................... 49
4.3 Future SSSG summary ................................................................................................................................. 51
5. Conclusion.......................................................................................................................................... 53
References .............................................................................................................................................. 55
vi
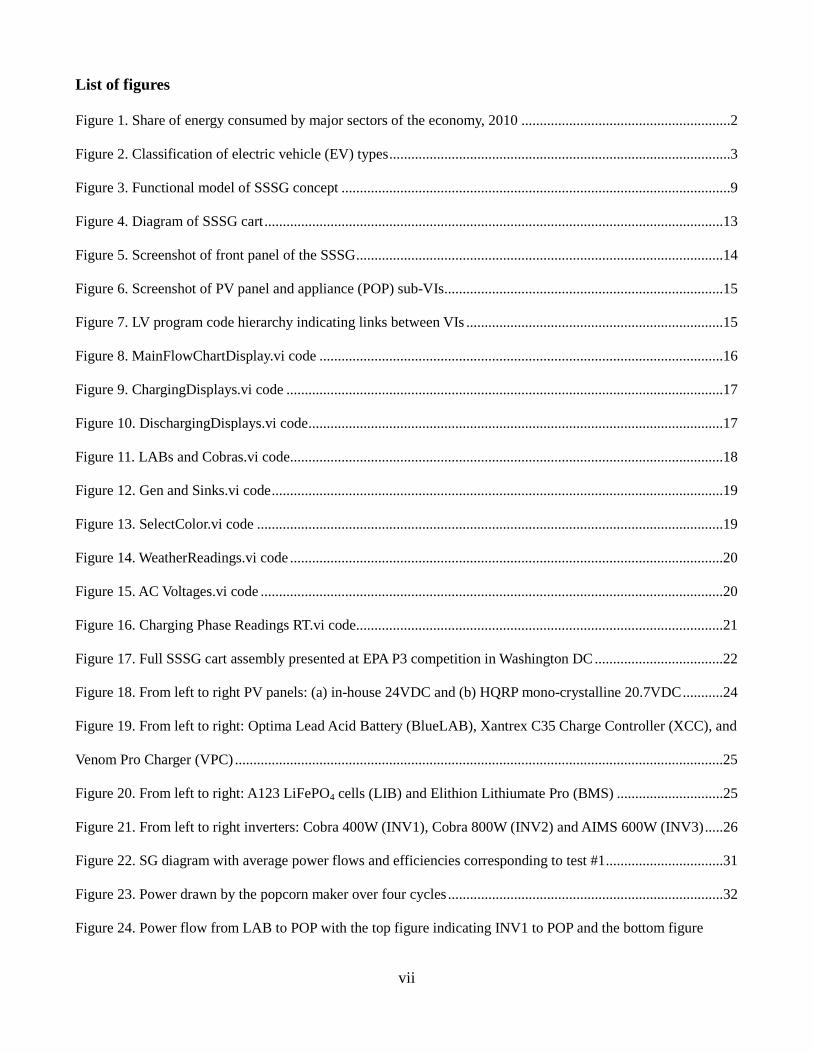
List of figures
Figure 1. Share of energy consumed by major sectors of the economy, 2010 .........................................................2
Figure 2. Classification of electric vehicle (EV) types .............................................................................................3
Figure 3. Functional model of SSSG concept ..........................................................................................................9
Figure 4. Diagram of SSSG cart .............................................................................................................................13
Figure 5. Screenshot of front panel of the SSSG ....................................................................................................14
Figure 6. Screenshot of PV panel and appliance (POP) sub-VIs ............................................................................15
Figure 7. LV program code hierarchy indicating links between VIs ......................................................................15
Figure 8. MainFlowChartDisplay.vi code ..............................................................................................................16
Figure 9. ChargingDisplays.vi code .......................................................................................................................17
Figure 10. DischargingDisplays.vi code .................................................................................................................17
Figure 11. LABs and Cobras.vi code ......................................................................................................................18
Figure 12. Gen and Sinks.vi code ...........................................................................................................................19
Figure 13. SelectColor.vi code ...............................................................................................................................19
Figure 14. WeatherReadings.vi code ......................................................................................................................20
Figure 15. AC Voltages.vi code ..............................................................................................................................20
Figure 16. Charging Phase Readings RT.vi code ....................................................................................................21
Figure 17. Full SSSG cart assembly presented at EPA P3 competition in Washington DC ...................................22
Figure 18. From left to right PV panels: (a) in-house 24VDC and (b) HQRP mono-crystalline 20.7VDC ...........24
Figure 19. From left to right: Optima Lead Acid Battery (BlueLAB), Xantrex C35 Charge Controller (XCC), and
Venom Pro Charger (VPC) .....................................................................................................................................25
Figure 20. From left to right: A123 LiFePO4 cells (LIB) and Elithion Lithiumate Pro (BMS) .............................25
Figure 21. From left to right inverters: Cobra 400W (INV1), Cobra 800W (INV2) and AIMS 600W (INV3) .....26
Figure 22. SG diagram with average power flows and efficiencies corresponding to test #1 ................................31
Figure 23. Power drawn by the popcorn maker over four cycles ...........................................................................32
Figure 24. Power flow from LAB to POP with the top figure indicating INV1 to POP and the bottom figure
vii
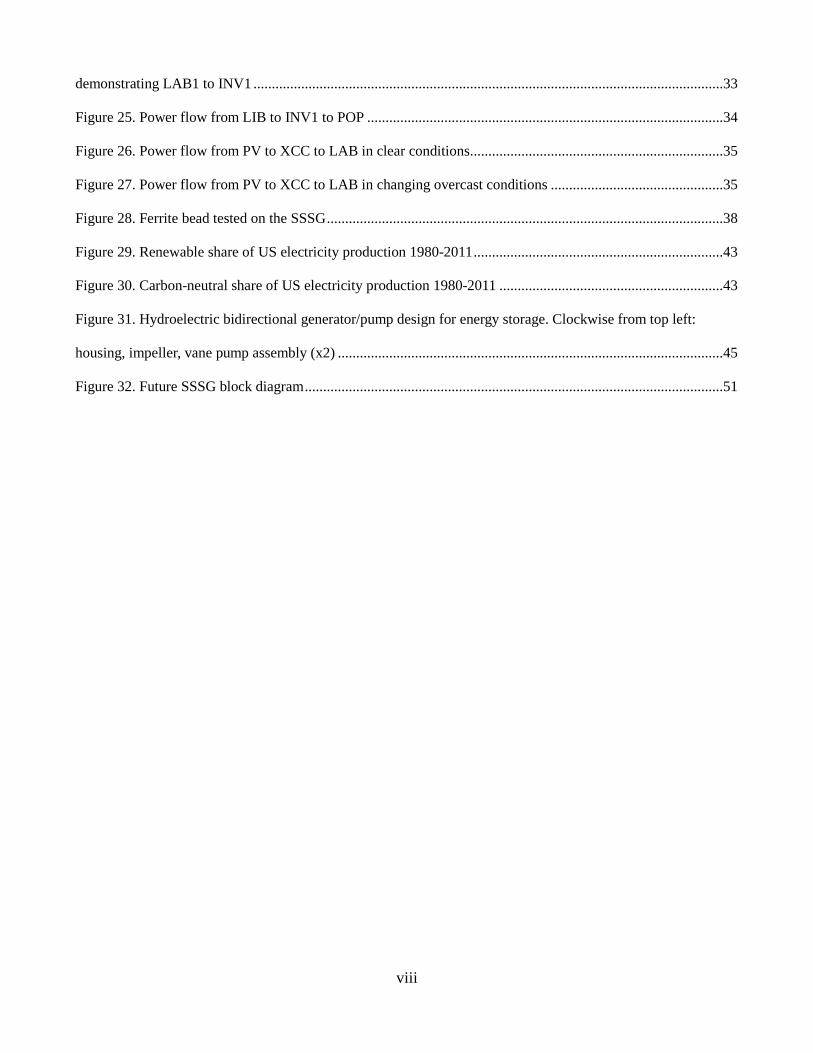
demonstrating LAB1 to INV1 ................................................................................................................................33
Figure 25. Power flow from LIB to INV1 to POP .................................................................................................34
Figure 26. Power flow from PV to XCC to LAB in clear conditions .....................................................................35
Figure 27. Power flow from PV to XCC to LAB in changing overcast conditions ...............................................35
Figure 28. Ferrite bead tested on the SSSG ............................................................................................................38
Figure 29. Renewable share of US electricity production 1980-2011 ....................................................................43
Figure 30. Carbon-neutral share of US electricity production 1980-2011 .............................................................43
Figure 31. Hydroelectric bidirectional generator/pump design for energy storage. Clockwise from top left:
housing, impeller, vane pump assembly (x2) .........................................................................................................45
Figure 32. Future SSSG block diagram ..................................................................................................................51
viii

List of tables
Table 1. Components and their functions ...............................................................................................................10
Table 2. Planned expenditures for the SSSG .......................................................................................................... 11
Table 3. Final expenditures .....................................................................................................................................23
Table 4. CRIO slots and module channel assignments ...........................................................................................28
Table 5. Common battery chemistries and their attributes .....................................................................................41
Table 6. Theoretical and practical energy densities of various chemistries [52] ....................................................46
ix
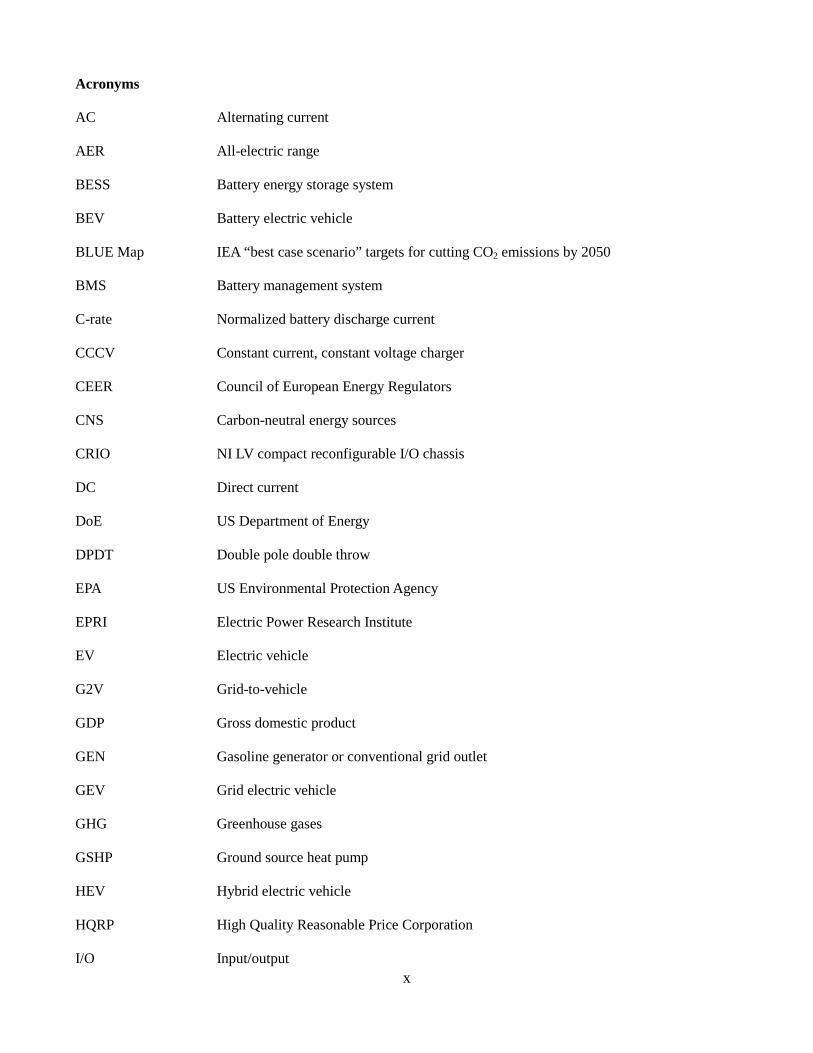
Acronyms
AC Alternating current
AER All-electric range
BESS Battery energy storage system
BEV Battery electric vehicle
BLUE Map IEA “best case scenario” targets for cutting CO2 emissions by 2050
BMS Battery management system
C-rate Normalized battery discharge current
CCCV Constant current, constant voltage charger
CEER Council of European Energy Regulators
CNS Carbon-neutral energy sources
CRIO NI LV compact reconfigurable I/O chassis
DC Direct current
DoE US Department of Energy
DPDT Double pole double throw
EPA US Environmental Protection Agency
EPRI Electric Power Research Institute
EV Electric vehicle
G2V Grid-to-vehicle
GDP Gross domestic product
GEN Gasoline generator or conventional grid outlet
GEV Grid electric vehicle
GHG Greenhouse gases
GSHP Ground source heat pump
HEV Hybrid electric vehicle
HQRP High Quality Reasonable Price Corporation
I/O Input/output x

ICE Internal combustion engine
ICT Information and communication technology
IEA International Energy Agency
INV Inverter
INV1 400W Cobra MSW inverter
INV2 800W Cobra MSW inverter
INV3 600W AIMS PSW inverter
LAB Lead acid battery bank
LAB1 Optima Blue Top LAB
LAB2 AAE Marine LAB
LEM Liaisons Electroniques-Mécaniques Corp. current sensor
LIB Lithium-ion battery
LV NI LabVIEW
MSW Modified sine wave
NI National Instruments Corporation
NI-9201 NI 8-channel 10V sensor module
NI-9211 NI 4-channel 80mV sensor module
NI-9221 NI 8-channel 60V sensor module
NI-9225 NI 3-channel 300V sensor module
NI-9227 NI 4-channel 5A sensor module
NI-9401 NI 8-channel digital I/O module
OECD Organization for Economic Co-operation and Development
PC Personal computer
PHEV Plug-in hybrid electric vehicle
POP Popcorn maker
PSW Pure sine wave
PV Photovoltaic xi

RE Renewable energy
RES Renewable energy sources
REV Range-extended hybrid electric vehicle
RMS Root mean square
RT Real-time
SAE Society of automotive engineers
SC Solar collector
SG Smart grid
SOC Battery state-of-charge
SPDT Single pole double throw
SSSG Small-scale smart grid
T&D Transmission and distribution
TDMS LV technical data management solution
V2G Vehicle-to-grid
V2H Vehicle-to-home
V2V Vehicle-to-vehicle
VI LV virtual instrument
VPC Venom Pro Charger
WT Wind turbine
XCC Xantrex charge controller
xii

1. Introducing the Smart Grid
Political demand for lower reliance on unsustainable fossil fuels and reduction of greenhouse gas (GHG)
emissions has put pressure on the energy industry to become more efficient, while maintaining reliability of
service [1]. As a result, the energy market has undergone fundamental changes in recent years, including the
strong growth of decentralized energy generation including greater reliance on renewable energy sources (RES).
In essence, the energy industry is endeavoring to do more with less and create a smarter connectivity between
conventional and alternative power sources.
The term “smart grid” (SG) is one of the most commonly used catch-phrases in the energy industry and its
concept continues to evolve with developments in various technologies producing lower costs and higher
availability. Although a precise definition does not, and probably cannot exist, several pseudo-official definitions
have been generated [2]. For example, the Council of European Energy Regulators (CEER) defines SG
objectives in terms of improving capacity, flexibility, renewable energy (RE) integration, new storage
technologies, and more active demand-side response [3]. The US Department of Energy (DoE), on the other
hand, has no comprehensive definition but summarizes its vision of making the grid “smarter” by [4]:
• Deploying advanced devices that give real-time (RT) data on system conditions
• Supporting two-way flow of electricity and information between utility and users
• Enabling demand response, outage management and other important capabilities
The overall consensus regarding the usefulness of SGs can be summarized as [2]:
• Integrating RES and energy storage while optimizing their contribution
• Integrating electric vehicles through smart bidirectional charging strategies
• Introducing consumers as more active players in the system
• Promoting innovative new energy products and services related to load handling
• Deploying “smart” agents for greater automation concerning grid operations including optimization
• Enhancing the quality of power supply (fewer outages)
1
• Anticipating outages with necessary upgrading or maintenance of self-adapting networks
• Developing information and communication technology (ICT) including data storage and management
While SGs have been extensively studied, practical models have not been constructed. Instead, theoretical
models have been simulated, such as a direct current (DC) smart home in which a photovoltaic (PV) source was
used to power a battery and heat pump [5]. This example demonstrates one of the key issues with integrating
RES into the conventional grid; the mismatch between supply and demand. Often, solar and wind RES are not
available during the time that they would be needed (e.g., wind at night when grid demand is low). Proper
integration of RES through smoothing the volatile peaks and troughs of both generation and consumption is one
of the most useful features of the SG, known in the business as peak shaving and valley filling. Several studies
have already addressed the issue of utilizing excess RE, both solar and wind, through various schemes [6, 7].
This study will attempt to analyze the full energy cycle from generation to storage to consumption by
constructing an entire SG model.
1.1 Introducing key SG features and concepts
Having established the objectives of the SG, specific ideas and solutions can be developed. Many of these ideas
are not particularly new or innovative but are receiving attention today thanks to modern advances in various
technologies, most notably information and communication technology (ICT); however, others remain limited
by modern battery technology and consumer attitudes.
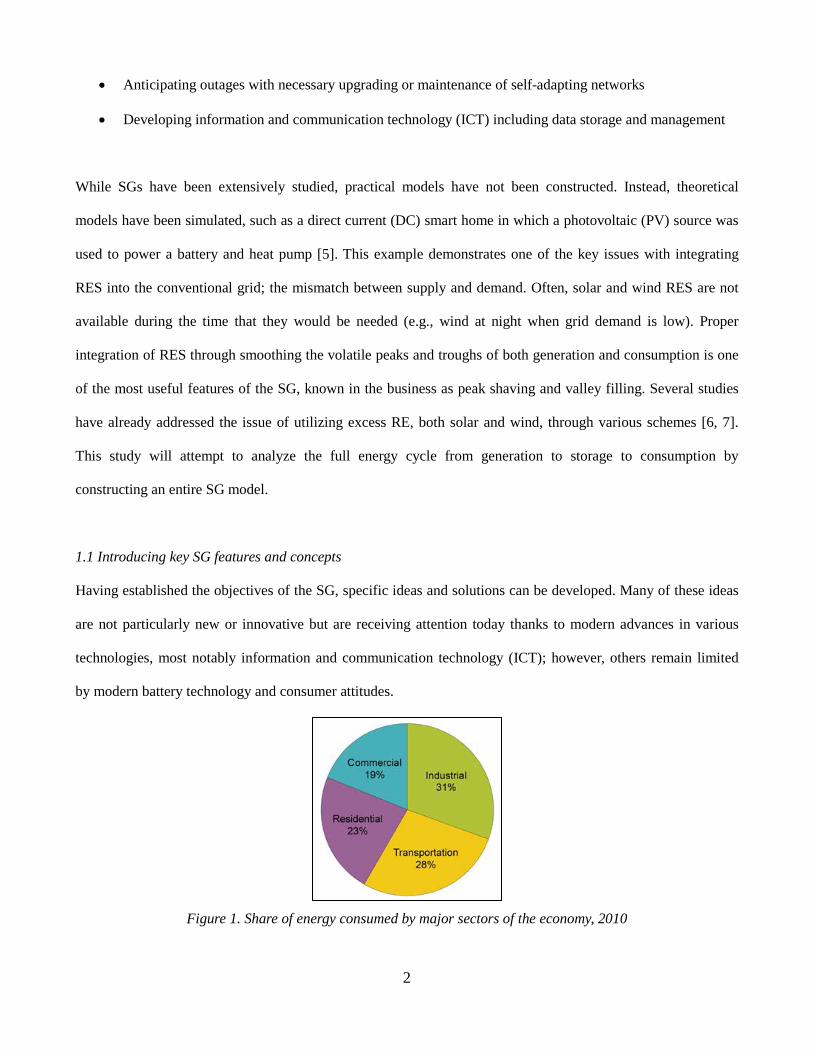
Figure 1. Share of energy consumed by major sectors of the economy, 2010
2
Along with clean and efficient delivery of energy to homes and businesses, transportation is a major consumer of
energy and presents an even greater challenge in converting to more sustainable sources (Figure 1). The
integration of electric vehicles (EV) into the SG will allow for the accountability of all major energy consumers
in the energy life-cycle [8]. Like the SG, EV is a term commonly used in a wide array of contexts and often with
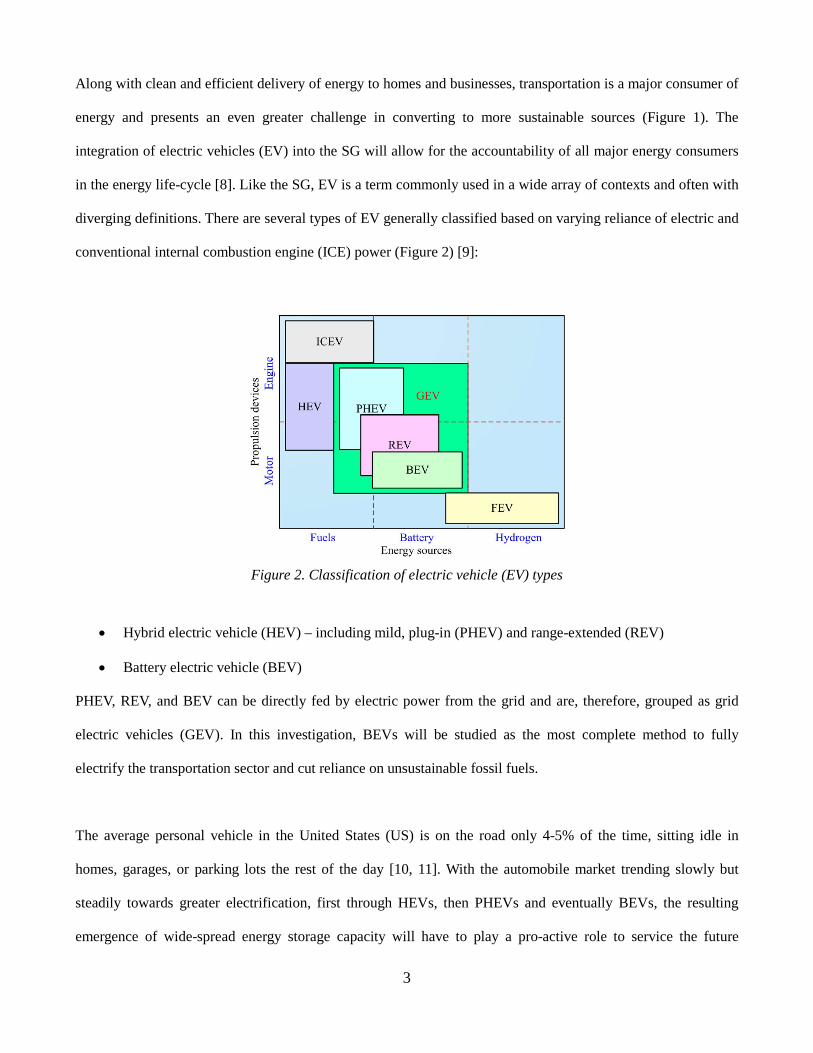
diverging definitions. There are several types of EV generally classified based on varying reliance of electric and
conventional internal combustion engine (ICE) power (Figure 2) [9]:
Figure 2. Classification of electric vehicle (EV) types
• Hybrid electric vehicle (HEV) – including mild, plug-in (PHEV) and range-extended (REV)
• Battery electric vehicle (BEV)
PHEV, REV, and BEV can be directly fed by electric power from the grid and are, therefore, grouped as grid
electric vehicles (GEV). In this investigation, BEVs will be studied as the most complete method to fully
electrify the transportation sector and cut reliance on unsustainable fossil fuels.
The average personal vehicle in the United States (US) is on the road only 4-5% of the time, sitting idle in
homes, garages, or parking lots the rest of the day [10, 11]. With the automobile market trending slowly but
steadily towards greater electrification, first through HEVs, then PHEVs and eventually BEVs, the resulting
emergence of wide-spread energy storage capacity will have to play a pro-active role to service the future
3

electrical grid [11]. As already shown, transportation consumes just as much energy as the other three major
sectors (residential, commercial, and industrial) all of which are predominantly supplied by the existing electric
grid. Shifting the entire automobile demand onto the grid will require nothing short of a revolution to avoid
potential economic and environmental catastrophe.
One of these revolutionary concepts is vehicle-to-grid (V2G), the idea of the grid having access to the vast
emerging supply of energy storage space in BEVs. Hence BEVs can act not only as energy consumers but as a
real energy storage medium for the network [11]. In addition to the ability to charge the BEV battery pack (grid-
to-vehicle, G2V), the grid can draw from the BEV battery pack to power electrical appliances in the building
(V2G). Adding BEVs and V2G to energy systems allows integration of much higher levels of RE production
[12].
Hence, the BEV is not just a means used for transportation but it is a real energy storage system, accumulating
surplus energy produced and giving it back to the grid at times of greatest demand [11]. V2G thus increases
flexibility for the grid to better utilize intermittent RES, matching consumption and generation by discharging
and charging at different times depending on market conditions [10]. Smart homes, parking lots, and public
charge stations can all provide the means by which the BEV obtains or feeds energy back to the grid [13]. To
summarize, the main objectives of V2G ancillary services are [10, 13, 14]:
• RES integration
• Load shifting through peak shaving and valley filling
• Reserve power supply (spinning reserves)
• Reactive power support
• Power quality maintenance through voltage and frequency regulation
In addition, vehicle-to-home (V2H) and vehicle-to-vehicle (V2V) options are defined to more precisely
distinguish between different types of bidirectional energy flow [13]. V2H is the idea of charging and
4

discharging directly to a local home or community microgrid, without necessarily selling back to the broader
utility grid. Similarly with V2V, BEVs can transfer and distribute energy through the local grid, usually by
means of a controller called an aggregator. An aggregator is a control device which collects all information about
a group of BEVs, grid status and executes V2V operation – it is a means by which BEVs interact with each
other.
1.2. Smart energy markets - dynamic pricing and prosumer communities
For a long time, the cost of generation has varied a great deal from hour to hour; however, customers usually do
not see this variability reflected in their bills [15]. As a result, there is little motivation to restrict demand at peak
hours and shift load to off-peak hours [16]. Thus, dynamic pricing is a popular new solution that is discussed
widely in economic research, taking advantage of modern ICT [16-18]. Schemes based on dynamic pricing are
an incentive for consumers to adjust demand in response to price signals with costs varying depending on period
of use and system stress [19]. Of the possible tariffing systems, real-time (RT) pricing that fully reflects
operational costs would carry the highest incentives, reducing demand or shifting consumption to an off-peak
period. Hence, generators and suppliers can better manage periods of tension and peak demand thanks to
dynamic tariffing, as well as various demand response technologies [16].
The type of energy user who both consumes and generates energy is called the “prosumer”. Generally,
prosumers produce solar and/or wind power while consuming and/or storing it for future use. Moreover, they can
share excess energy generation with possible buyers including the national grid, private retailers, and other
consumers. Furthermore, prosumers can retain a portion of energy in smart storage systems (e.g., battery pack in
a BEV) for future use or consent to share by varying his/her own preferences. Hence, the prosumer is
empowered to choose the most profitable energy trading method, either through direct selling (negotiating price
per kWh) or through an auction market. One method proposed is to connect a group of prosumers, collaborating
in energy auctioning, to form a “virtual power plant” (VPP) that is managed to interact and negotiate with other
utility participants. Building on this idea is the “virtual community” established by combining prosumers of
similar interests and behaviors, instead of geographical location [11, 20]. 5

This SG energy sharing involves different technical infrastructures such as RES systems, smart metering, smart
sensors and actuators, and ICT [20]. The smart meter is an advanced energy meter that measures energy
consumption and provides added information to the utility company including voltage, phase angle, and
frequency. Benefits include efficient power system control and monitoring, operational decisions to minimize
outages and losses, energy cost allocation, fault analysis, demand control, and power quality analysis. Present
meters are designed for centralized generation, control, transmission and distribution (T&D), and unidirectional
power flow that are not sufficient for intermittent decentralized RES without compromising grid stability [21].
Mass load-shifting can be achieved in a system that allows intelligent agents to be inserted both at the grid and
household level. Intelligent optimization must include new degrees of freedom offered by breakthroughs in
technology controlling flows of electricity [15]. It has been estimated the effective use of new phasors and
sensors could cut cost of transmission lines for RES in half [22].
The progress of ICT has been rapid and holds great potential in providing solutions for optimizing all elements
of the power value chain - generation, transmission and reserve power, distribution, and metering [15, 18, 23].
Computational intelligence will play a crucial role in maximizing PHEV and BEV technology, both at the grid
level and within the cars themselves [15]. Information is necessary for energy players and regulators to provide a
competitive market and allow SGs to achieve optimal efficiency. The fitting of sensors to the grid will also mean
data on failures will be more readily available and that the grid can be reorganized after an outage [16].
1.3. SG experimentation
Much of the research already discussed is based on macro-economic data and theoretical models. Individual SG
concepts (i.e., V2G, load shifting, smart storage) have also been studied separately without combining into a
complete system. It is understandably difficult to physically simulate macro-economic concepts, such as
dynamic pricing and wholesale energy markets, but individual microgrid features can be constructed within a
reasonable research time and budget. For instance, bidirectional V2G requires simply a BEV battery pack and
two transmission lines to the grid. RES load shifting can be tested with an intermittent source (e.g., wind or 6

solar) and storage device (e.g., battery pack or pumped hydro). Smart metering can be simulated for an
individual home or business with the integration of a local sensor network and control system. These are the
main SG concepts that will be the focus of this investigation.
In specific, Chapter 2 presents the concept of a small-scale model and the design of the physical grid and control
program coding. Chapter 3 presents the fully constructed grid, experimentation conducted with the control
program and results from the experimentation. Chapter 4 discusses the results, how they relate to other SG
investigations and ideas, and recommendations for future SSSG iterations. Chapter 5 reviews the investigation
and draws conclusions.
7

2. Small-Scale Smart Grid (SSSG) Planning and Design
This chapter follows the design process from proposal and specification requirements to a conceptual design of
the physical smart electrical grid. The data acquisition system is also presented with the LabVIEW program
design including coding.
2.1. SSSG Proposition
Having established the motives and ideas behind the SG concept, the next logical step is to build one and turn
virtual ideas into actual solutions. Many SG ideas have been discussed and modeled several times without
testing real components or piecing together full assemblies. While backed up by perfectly reasonable
assumptions, these results are purely theoretical and, therefore, limited in value. In an idea as advanced and
complex as the SG, unpredictable issues will arise when several apparently simple solutions (e.g., bidirectional
V2G, V2H, advanced ICT, reserve power, etc.) are combined. The experience of a real SG model can provide
invaluable understanding of a relatively new and unknown concept.
Ideally, a large-scale model provides the most accurate simulation; however, the cost and size of a full-scale SG
is of macro-economic proportion and beyond the scope of an investigation of this manner. Downsizing to a
small-scale smart grid (SSSG) not only cuts cost and complexity immensely, it is far more practical for
experimentation. The logistics of data acquisition and the ability to observe the arrangement in its entirety are of
utmost importance in researching and developing the system. Of importance, the setup must remain dynamic to
accommodate frequent progressive changes and upgrades.
Safety is also imperative and unpredictable issues are a recipe for disaster at the large-scale with amplified
current and voltage magnitudes. Even with secure protection, the full-scale power flows implemented in the
industry and standardized by the Society of Automotive Engineers (SAE - over 6 kW in the case of BEV
charging) are extremely hazardous and cannot be perfectly isolated in a research and development project
requiring continuous tinkering, updating, and maintenance [24-28].
8
2.2. SSSG Architecture
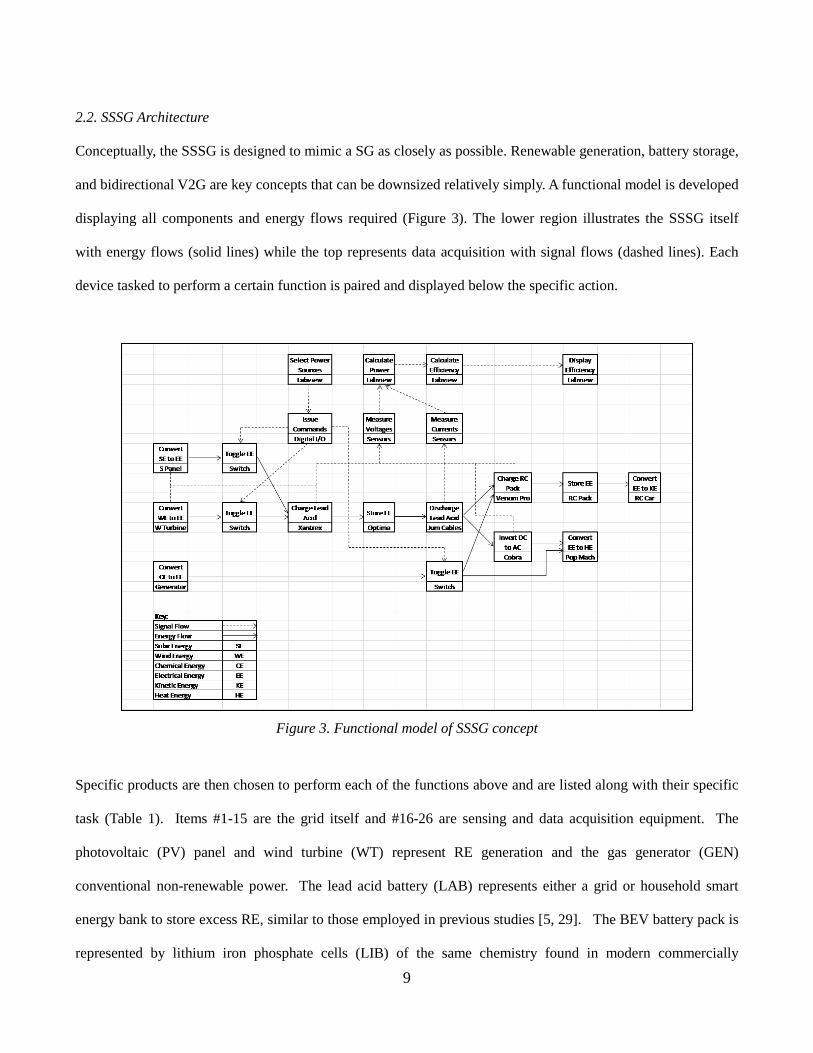
Conceptually, the SSSG is designed to mimic a SG as closely as possible. Renewable generation, battery storage,
and bidirectional V2G are key concepts that can be downsized relatively simply. A functional model is developed
displaying all components and energy flows required (Figure 3). The lower region illustrates the SSSG itself
with energy flows (solid lines) while the top represents data acquisition with signal flows (dashed lines). Each
device tasked to perform a certain function is paired and displayed below the specific action.
Figure 3. Functional model of SSSG concept
Specific products are then chosen to perform each of the functions above and are listed along with their specific
task (Table 1). Items #1-15 are the grid itself and #16-26 are sensing and data acquisition equipment. The
photovoltaic (PV) panel and wind turbine (WT) represent RE generation and the gas generator (GEN)
conventional non-renewable power. The lead acid battery (LAB) represents either a grid or household smart
energy bank to store excess RE, similar to those employed in previous studies [5, 29]. The BEV battery pack is
represented by lithium iron phosphate cells (LIB) of the same chemistry found in modern commercially
9
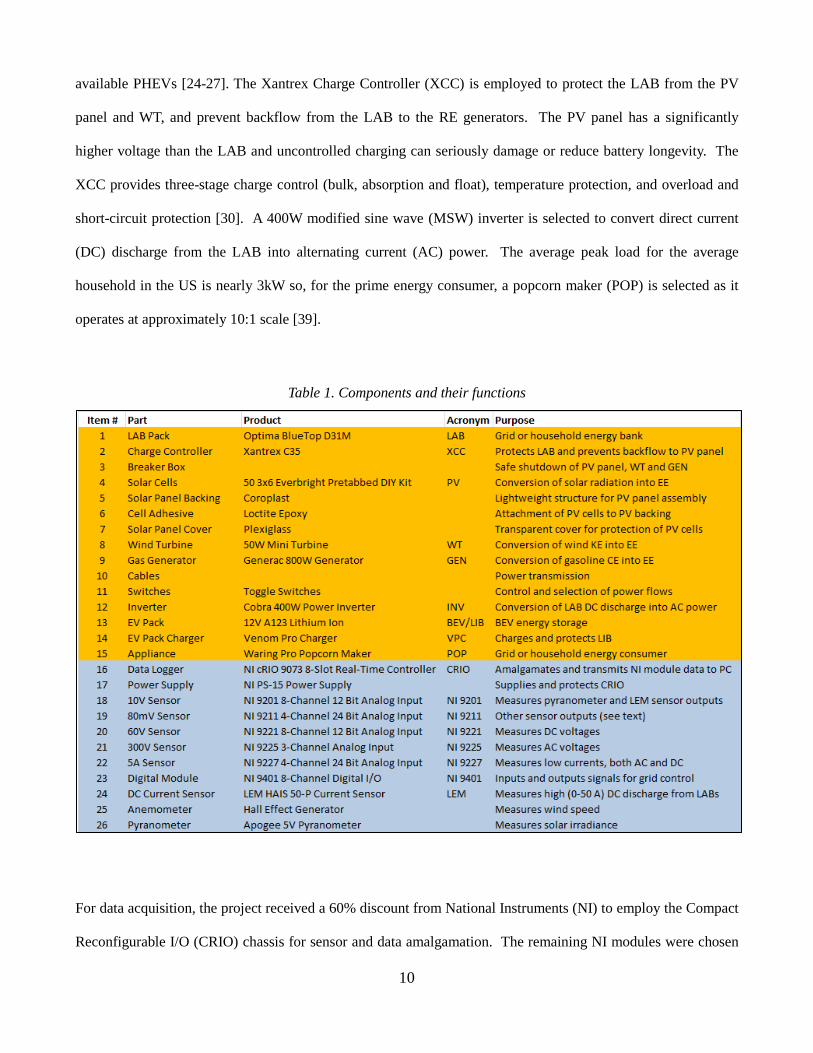
available PHEVs [24-27]. The Xantrex Charge Controller (XCC) is employed to protect the LAB from the PV
panel and WT, and prevent backflow from the LAB to the RE generators. The PV panel has a significantly
higher voltage than the LAB and uncontrolled charging can seriously damage or reduce battery longevity. The
XCC provides three-stage charge control (bulk, absorption and float), temperature protection, and overload and
short-circuit protection [30]. A 400W modified sine wave (MSW) inverter is selected to convert direct current
(DC) discharge from the LAB into alternating current (AC) power. The average peak load for the average
household in the US is nearly 3kW so, for the prime energy consumer, a popcorn maker (POP) is selected as it
operates at approximately 10:1 scale [39].
Table 1. Components and their functions
For data acquisition, the project received a 60% discount from National Instruments (NI) to employ the Compact
Reconfigurable I/O (CRIO) chassis for sensor and data amalgamation. The remaining NI modules were chosen
10

to cover all voltage ranges for various sensors as well as direct measurement of AC and DC voltages in the grid.
The NI-9227 was the only current sensing module available and could measure low AC and DC currents. The
NI-9211 was chosen to read the original pyranometer, which was donated to the project but deemed too heavy
and complex to integrate into the SSSG. Nonetheless, the module would eventually be employed for the current
shunts, discussed in section 3.1.2. LEM hall-effect current sensors were originally chosen to measure the high
current DC flows since they output an easily readable DC voltage and do not interfere with the measured
discharge. They were also affordable as can be seen in Table 2.
Table 2. Planned expenditures for the SSSG
11

Following the choice of the components, a cost projection can be made including an estimate for all sensors,
wiring, and switches (Table 2). It can be seen sensing and data acquisition equipment take up 85% of total
expenditure, dwarfing the cost of the grid itself. This is chiefly because the CRIO, voltage, I/O module and
weather sensors are not downsized on the small-scale so at least $6,000, or 70%, of data acquisition expenditures
are equal to large-scale. However current sensing expense, already significant on the small-scale, would be
inflated considering the NI-9227 is inadequate for most large-scale nodes. It must be reiterated this budget was
an original proposal based on retail prices of the components in Table 1 and intuitive guesstimates of other
expenses such as cables and switches. As will be shown in the next section, continuous adjustments were made
during the iterative design process.
A more detailed design is conceived with a sketch mapping the expected layout of the SSSG (Figure 4). The
components are organized into shelved compartments in a mobile cart. The portability of the SSSG is important
for the sake of conducting outdoor RE testing and for transportation to demonstration events, such as the EPA P3
contest (the original funding for this project). This initial sketch already demonstrates some of the complexities
involved with SG bidirectional power flow. Connections to and from one component cannot be limited to
adjacent components. For instance, powering the household appliance (popcorn maker - POP) directly from the
grid requires an extra line, not shown, to avoid the inefficiencies of the smart charger, EV pack and inverter.
Also not shown, the smart charger cannot be powered directly from the LAB. It must be connected via the
inverter in the top compartment to receive AC energy. As it turned out, three inverters were required to handle all
the DC-AC energy flows and are discussed in detail later.
12
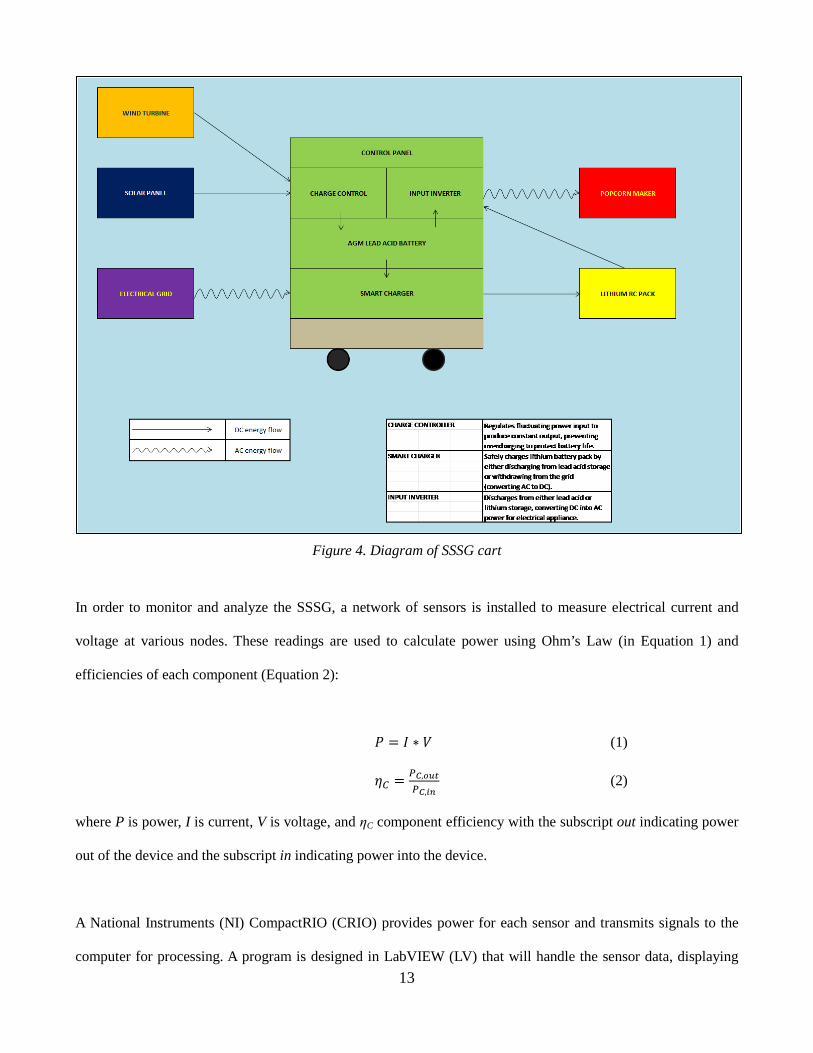
Figure 4. Diagram of SSSG cart
In order to monitor and analyze the SSSG, a network of sensors is installed to measure electrical current and
voltage at various nodes. These readings are used to calculate power using Ohm’s Law (in Equation 1) and
efficiencies of each component (Equation 2):
𝑃𝑃 = 𝐼𝐼 ∗ 𝑉𝑉 (1)
𝜂𝜂𝐶𝐶 = 𝑃𝑃𝐶𝐶,𝑜𝑜𝑜𝑜𝑜𝑜𝑃𝑃𝐶𝐶,𝑖𝑖𝑖𝑖
(2)
where P is power, I is current, V is voltage, and ηC component efficiency with the subscript out indicating power
out of the device and the subscript in indicating power into the device.
A National Instruments (NI) CompactRIO (CRIO) provides power for each sensor and transmits signals to the
computer for processing. A program is designed in LabVIEW (LV) that will handle the sensor data, displaying 13

grid activity to the user mid-experiment and saving the results for post-experimental analysis.
2.3. LV Programming
LV programs and functions are called virtual instruments (VI) because their appearance and operation imitate
physical instruments [31]. Each VI contains three main components – the front panel window, the block diagram
(the programming code) and the icon/connector pane (for a VI to be used in another VI). The front panel of the
SSSG program is a wiring diagram displaying the full structure of the SSSG (Figure 5). The idea is to present
grid status to the user as clearly as possible within one window. Each block represents a device with its
connections to other components including energy flows displayed in color-coded form. Clicking on a block
brings up detailed information for that particular device in the form of charts covering current, voltage, power,
and efficiency over time (Figure 6). The data itself is stored in memory and saved to an NI technical data
management solution (TDMS) file, which is later converted to standard spreadsheet form, specified by the user
at the start of the program [32].
Figure 5. Screenshot of front panel of the SSSG
14
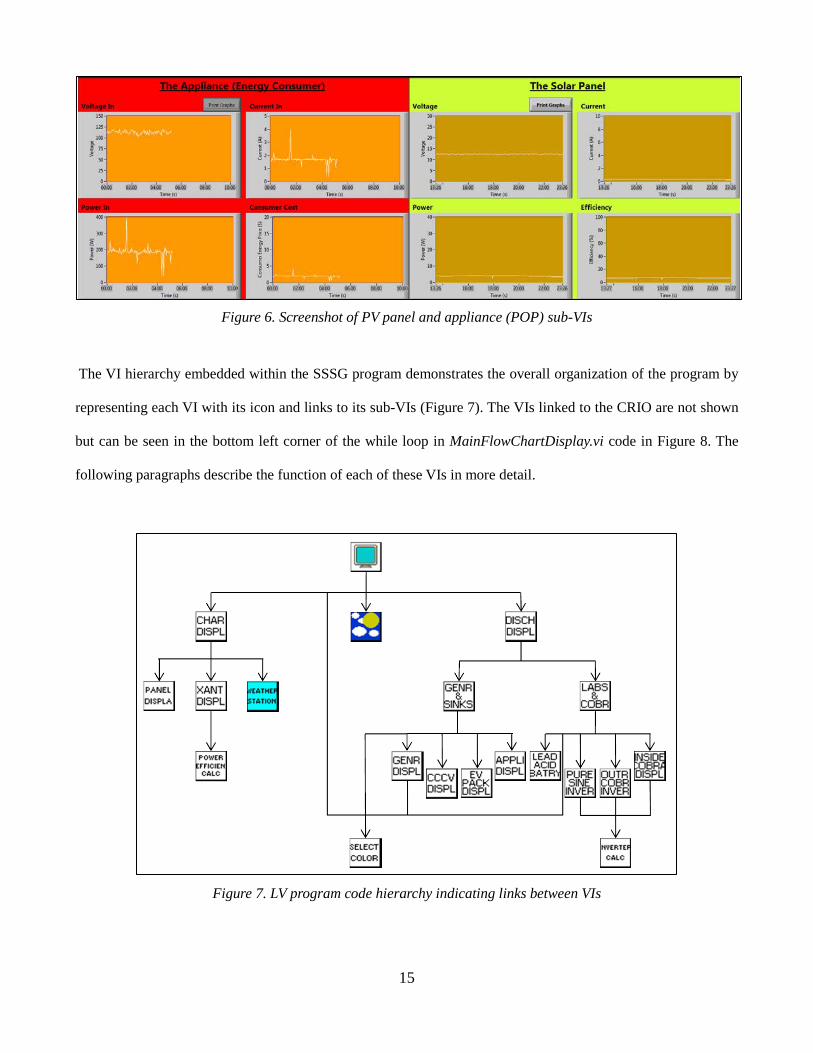
Figure 6. Screenshot of PV panel and appliance (POP) sub-VIs
The VI hierarchy embedded within the SSSG program demonstrates the overall organization of the program by
representing each VI with its icon and links to its sub-VIs (Figure 7). The VIs linked to the CRIO are not shown
but can be seen in the bottom left corner of the while loop in MainFlowChartDisplay.vi code in Figure 8. The
following paragraphs describe the function of each of these VIs in more detail.
Figure 7. LV program code hierarchy indicating links between VIs
15
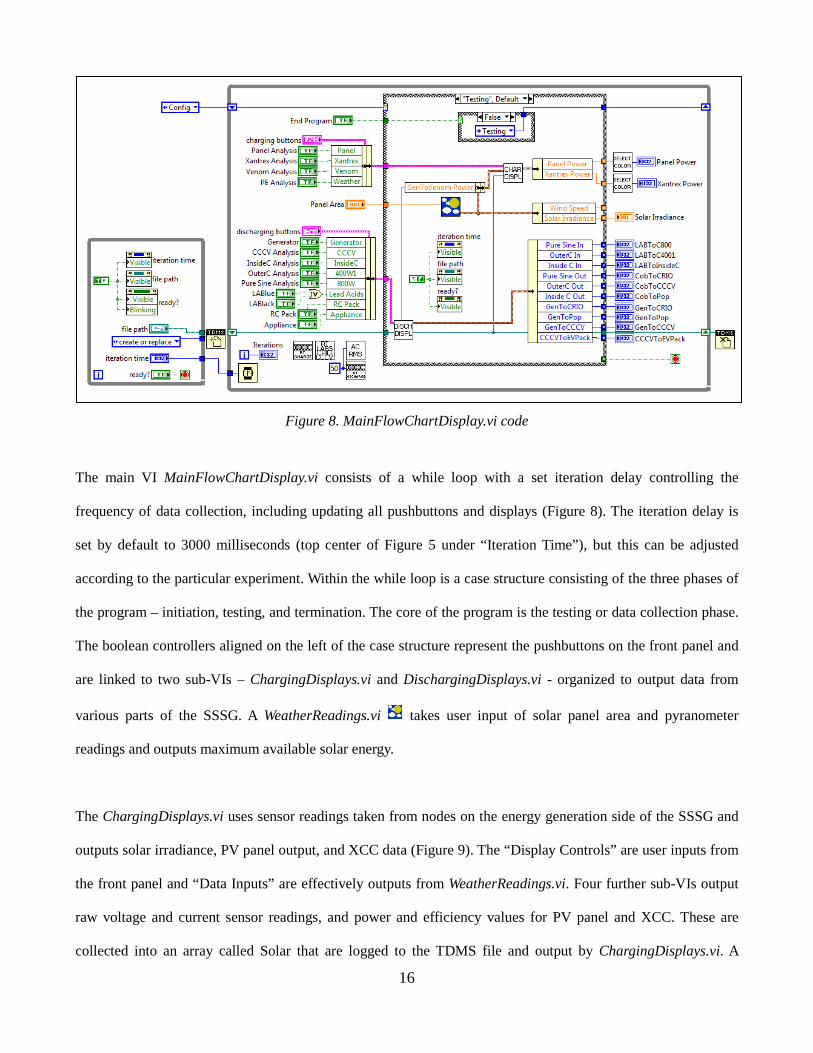
Figure 8. MainFlowChartDisplay.vi code
The main VI MainFlowChartDisplay.vi consists of a while loop with a set iteration delay controlling the
frequency of data collection, including updating all pushbuttons and displays (Figure 8). The iteration delay is
set by default to 3000 milliseconds (top center of Figure 5 under “Iteration Time”), but this can be adjusted
according to the particular experiment. Within the while loop is a case structure consisting of the three phases of
the program – initiation, testing, and termination. The core of the program is the testing or data collection phase.
The boolean controllers aligned on the left of the case structure represent the pushbuttons on the front panel and
are linked to two sub-VIs – ChargingDisplays.vi and DischargingDisplays.vi - organized to output data from
various parts of the SSSG. A WeatherReadings.vi takes user input of solar panel area and pyranometer
readings and outputs maximum available solar energy.
The ChargingDisplays.vi uses sensor readings taken from nodes on the energy generation side of the SSSG and
outputs solar irradiance, PV panel output, and XCC data (Figure 9). The “Display Controls” are user inputs from
the front panel and “Data Inputs” are effectively outputs from WeatherReadings.vi. Four further sub-VIs output
raw voltage and current sensor readings, and power and efficiency values for PV panel and XCC. These are
collected into an array called Solar that are logged to the TDMS file and output by ChargingDisplays.vi. A
16
function called PowerEffCalc.vi is employed by PanelDisplay.vi, XantrexDisplay.vi, and TurbineDisplay.vi to
compute power output and efficiency of each device.
Figure 9. ChargingDisplays.vi code
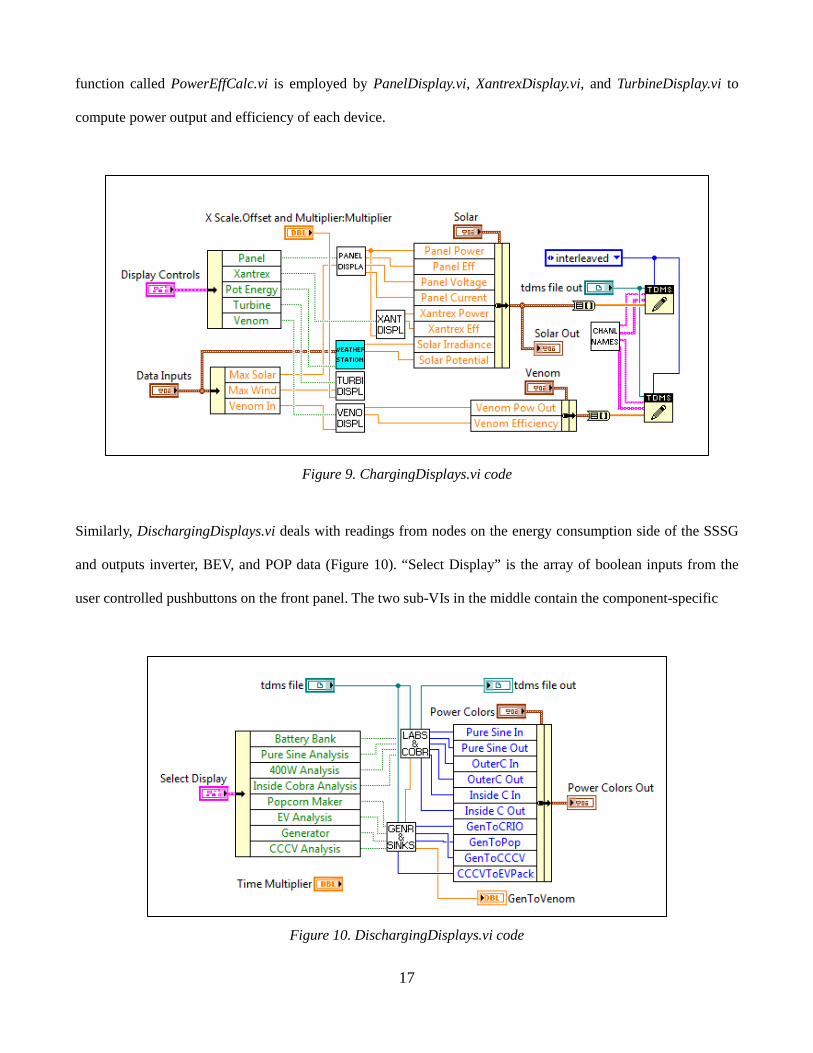
Similarly, DischargingDisplays.vi deals with readings from nodes on the energy consumption side of the SSSG
and outputs inverter, BEV, and POP data (Figure 10). “Select Display” is the array of boolean inputs from the
user controlled pushbuttons on the front panel. The two sub-VIs in the middle contain the component-specific
Figure 10. DischargingDisplays.vi code
17
sub-VIs (see Figure 10) and output an array of colors to be displayed on the front panel at the various nodes.
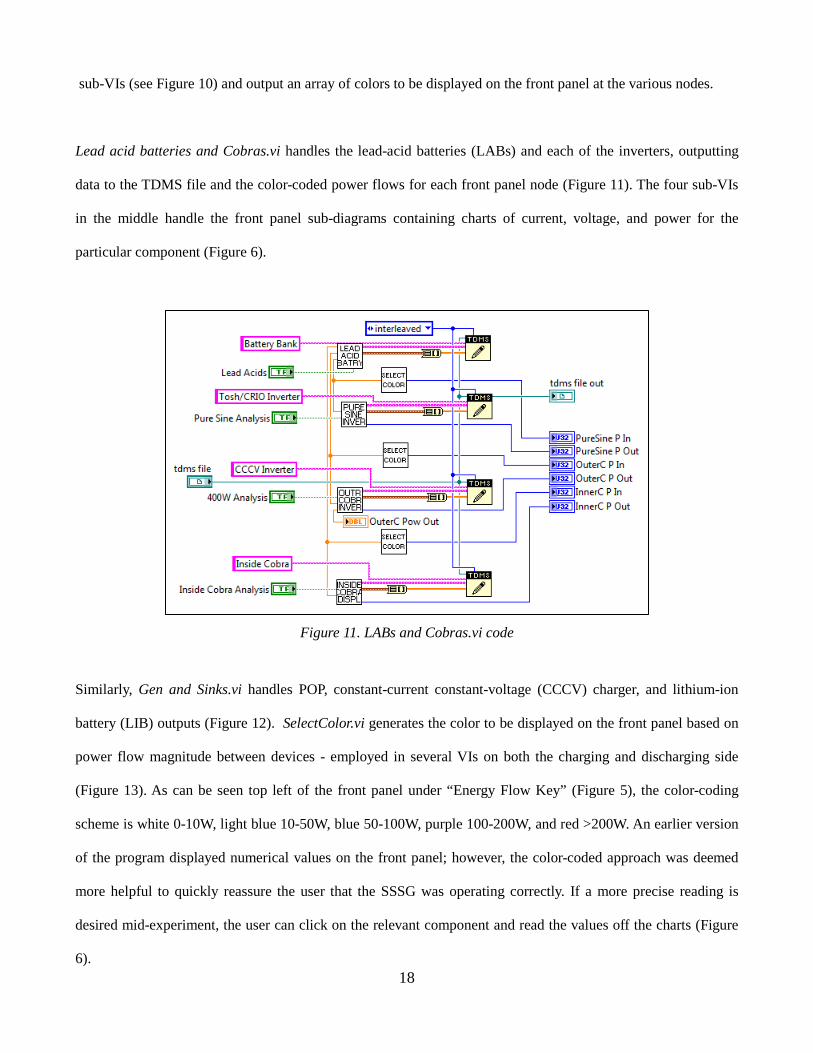
Lead acid batteries and Cobras.vi handles the lead-acid batteries (LABs) and each of the inverters, outputting
data to the TDMS file and the color-coded power flows for each front panel node (Figure 11). The four sub-VIs
in the middle handle the front panel sub-diagrams containing charts of current, voltage, and power for the
particular component (Figure 6).
Figure 11. LABs and Cobras.vi code
Similarly, Gen and Sinks.vi handles POP, constant-current constant-voltage (CCCV) charger, and lithium-ion
battery (LIB) outputs (Figure 12). SelectColor.vi generates the color to be displayed on the front panel based on
power flow magnitude between devices - employed in several VIs on both the charging and discharging side
(Figure 13). As can be seen top left of the front panel under “Energy Flow Key” (Figure 5), the color-coding
scheme is white 0-10W, light blue 10-50W, blue 50-100W, purple 100-200W, and red >200W. An earlier version
of the program displayed numerical values on the front panel; however, the color-coded approach was deemed
more helpful to quickly reassure the user that the SSSG was operating correctly. If a more precise reading is
desired mid-experiment, the user can click on the relevant component and read the values off the charts (Figure
6). 18
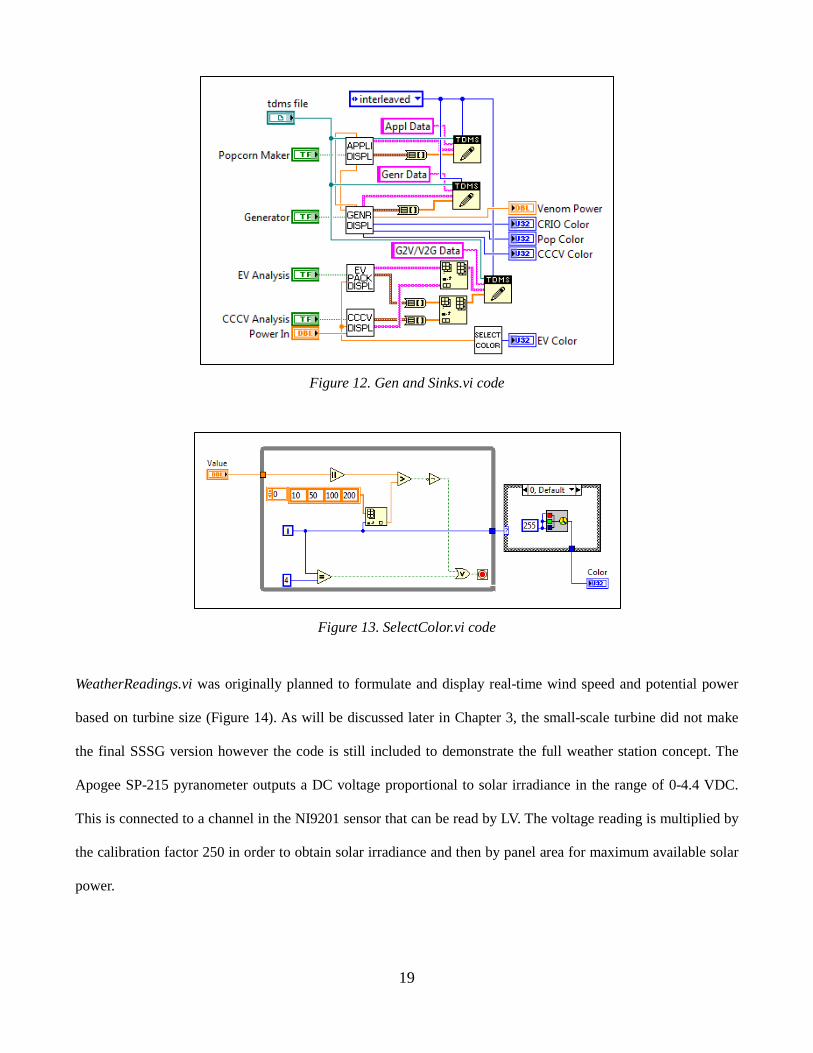
Figure 12. Gen and Sinks.vi code
Figure 13. SelectColor.vi code
WeatherReadings.vi was originally planned to formulate and display real-time wind speed and potential power
based on turbine size (Figure 14). As will be discussed later in Chapter 3, the small-scale turbine did not make
the final SSSG version however the code is still included to demonstrate the full weather station concept. The
Apogee SP-215 pyranometer outputs a DC voltage proportional to solar irradiance in the range of 0-4.4 VDC.
This is connected to a channel in the NI9201 sensor that can be read by LV. The voltage reading is multiplied by
the calibration factor 250 in order to obtain solar irradiance and then by panel area for maximum available solar
power.
19
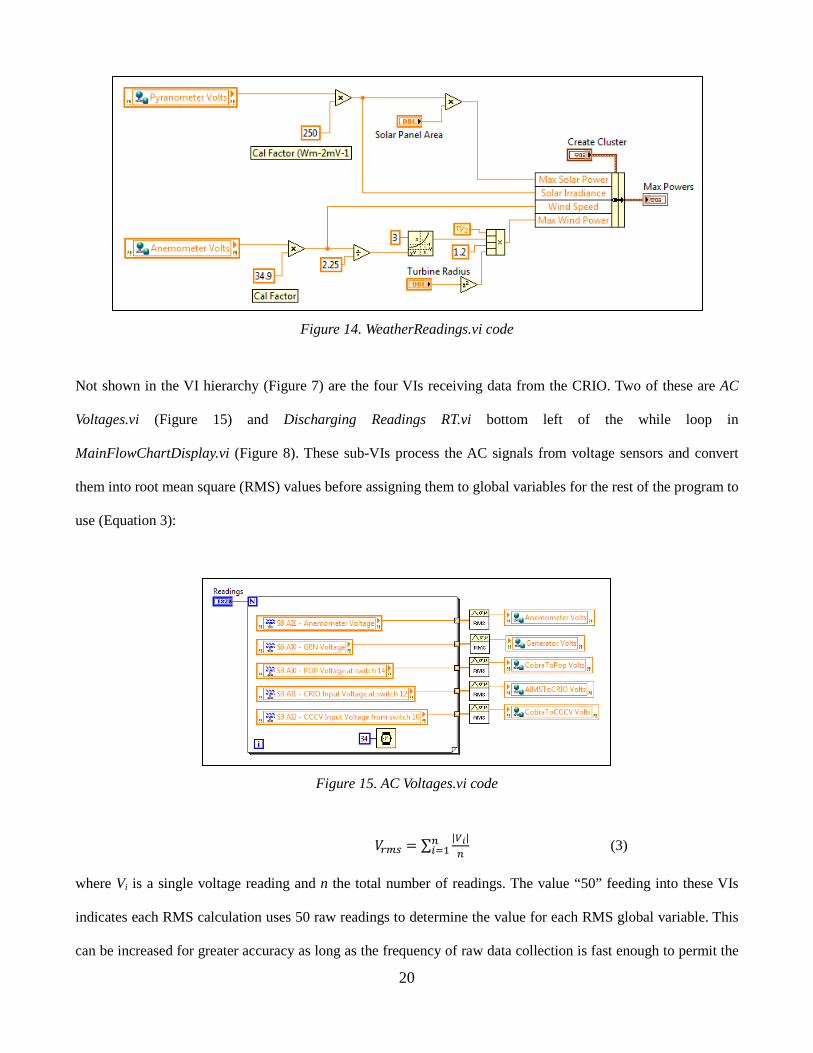
Figure 14. WeatherReadings.vi code
Not shown in the VI hierarchy (Figure 7) are the four VIs receiving data from the CRIO. Two of these are AC
Voltages.vi (Figure 15) and Discharging Readings RT.vi bottom left of the while loop in
MainFlowChartDisplay.vi (Figure 8). These sub-VIs process the AC signals from voltage sensors and convert
them into root mean square (RMS) values before assigning them to global variables for the rest of the program to
use (Equation 3):
Figure 15. AC Voltages.vi code
𝑉𝑉𝑟𝑟𝑟𝑟𝑟𝑟 = ∑ |𝑉𝑉𝑖𝑖|𝑛𝑛
𝑛𝑛𝑖𝑖=1 (3)
where Vi is a single voltage reading and n the total number of readings. The value “50” feeding into these VIs
indicates each RMS calculation uses 50 raw readings to determine the value for each RMS global variable. This
can be increased for greater accuracy as long as the frequency of raw data collection is fast enough to permit the
20
number of values in one while loop iteration.
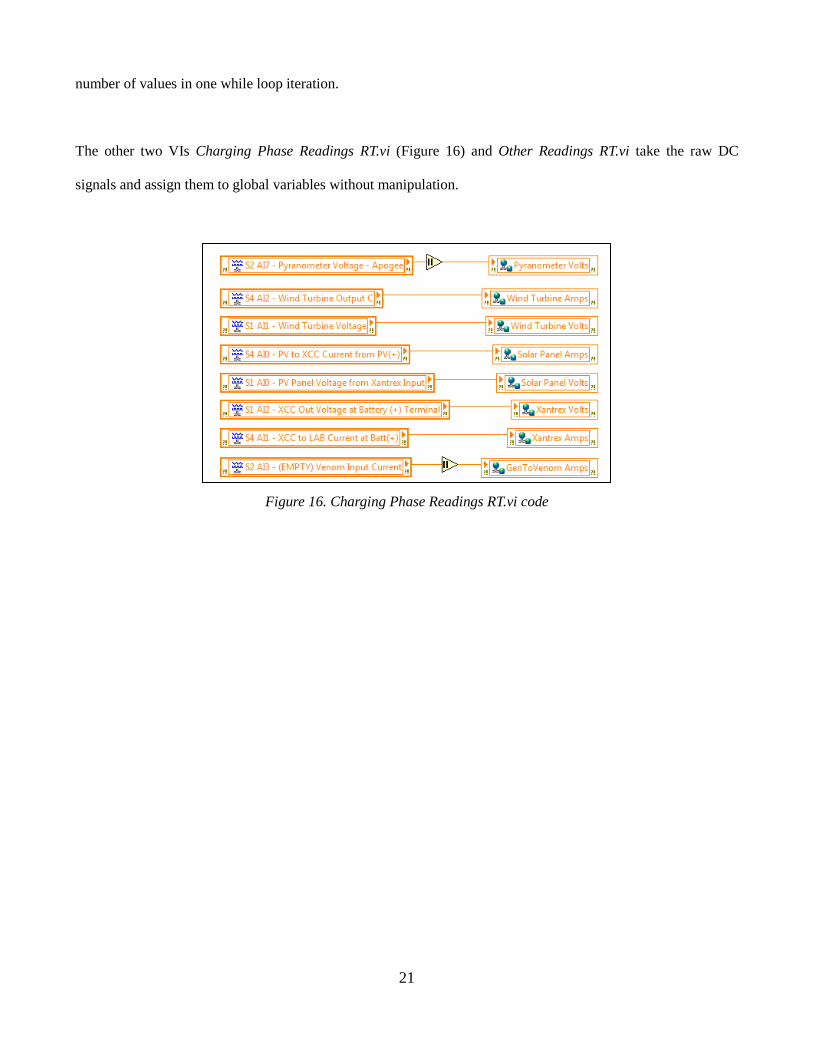
The other two VIs Charging Phase Readings RT.vi (Figure 16) and Other Readings RT.vi take the raw DC
signals and assign them to global variables without manipulation.
Figure 16. Charging Phase Readings RT.vi code
21
3. SSSG Results - Construction and Experiments
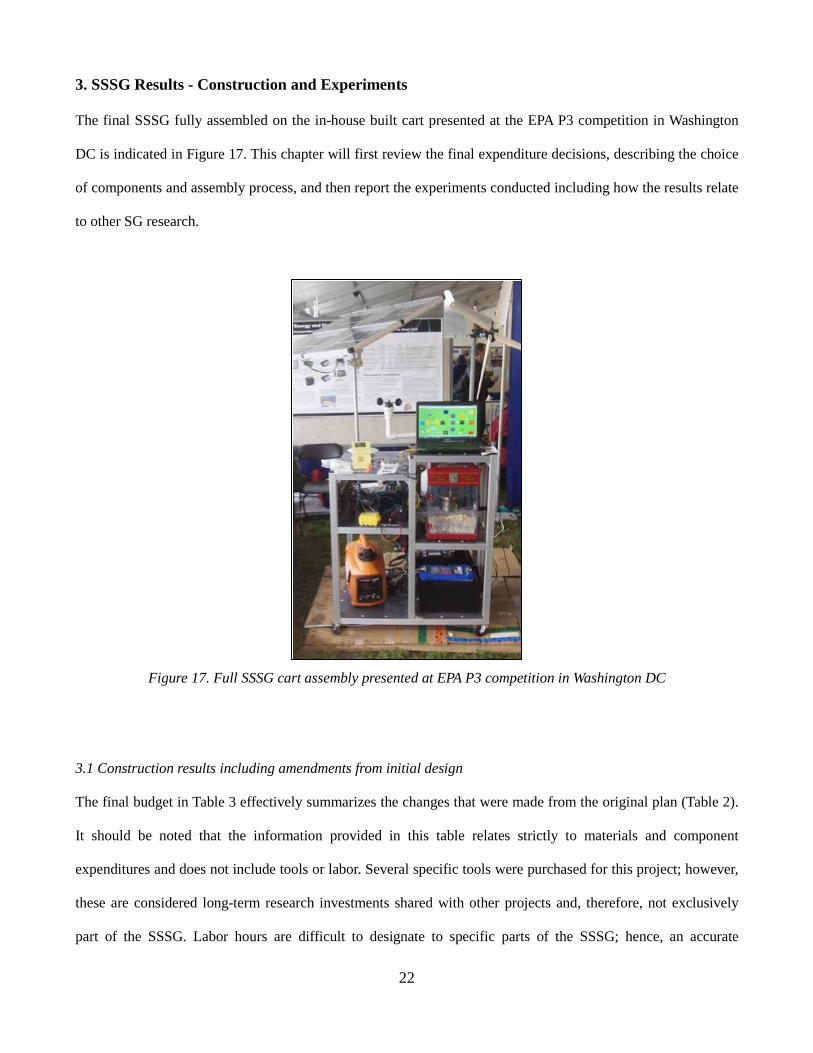
The final SSSG fully assembled on the in-house built cart presented at the EPA P3 competition in Washington
DC is indicated in Figure 17. This chapter will first review the final expenditure decisions, describing the choice
of components and assembly process, and then report the experiments conducted including how the results relate
to other SG research.
Figure 17. Full SSSG cart assembly presented at EPA P3 competition in Washington DC
3.1 Construction results including amendments from initial design
The final budget in Table 3 effectively summarizes the changes that were made from the original plan (Table 2).
It should be noted that the information provided in this table relates strictly to materials and component
expenditures and does not include tools or labor. Several specific tools were purchased for this project; however,
these are considered long-term research investments shared with other projects and, therefore, not exclusively
part of the SSSG. Labor hours are difficult to designate to specific parts of the SSSG; hence, an accurate
22
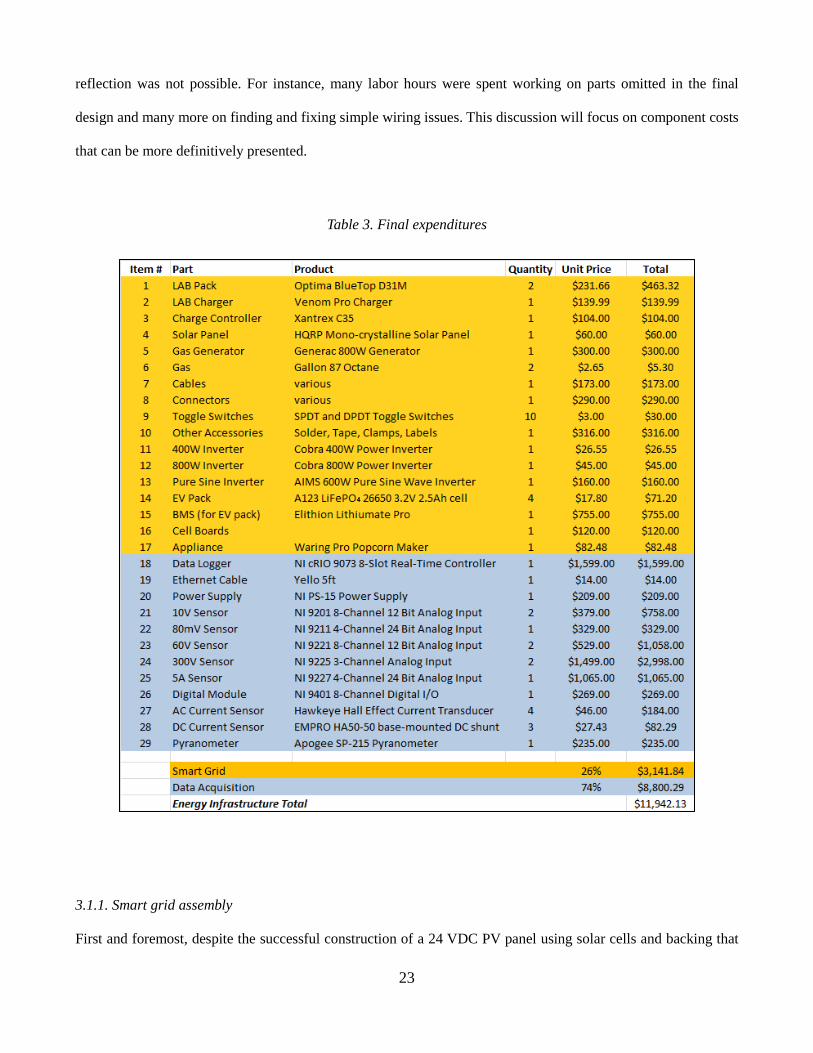
reflection was not possible. For instance, many labor hours were spent working on parts omitted in the final
design and many more on finding and fixing simple wiring issues. This discussion will focus on component costs
that can be more definitively presented.
Table 3. Final expenditures
3.1.1. Smart grid assembly
First and foremost, despite the successful construction of a 24 VDC PV panel using solar cells and backing that
23
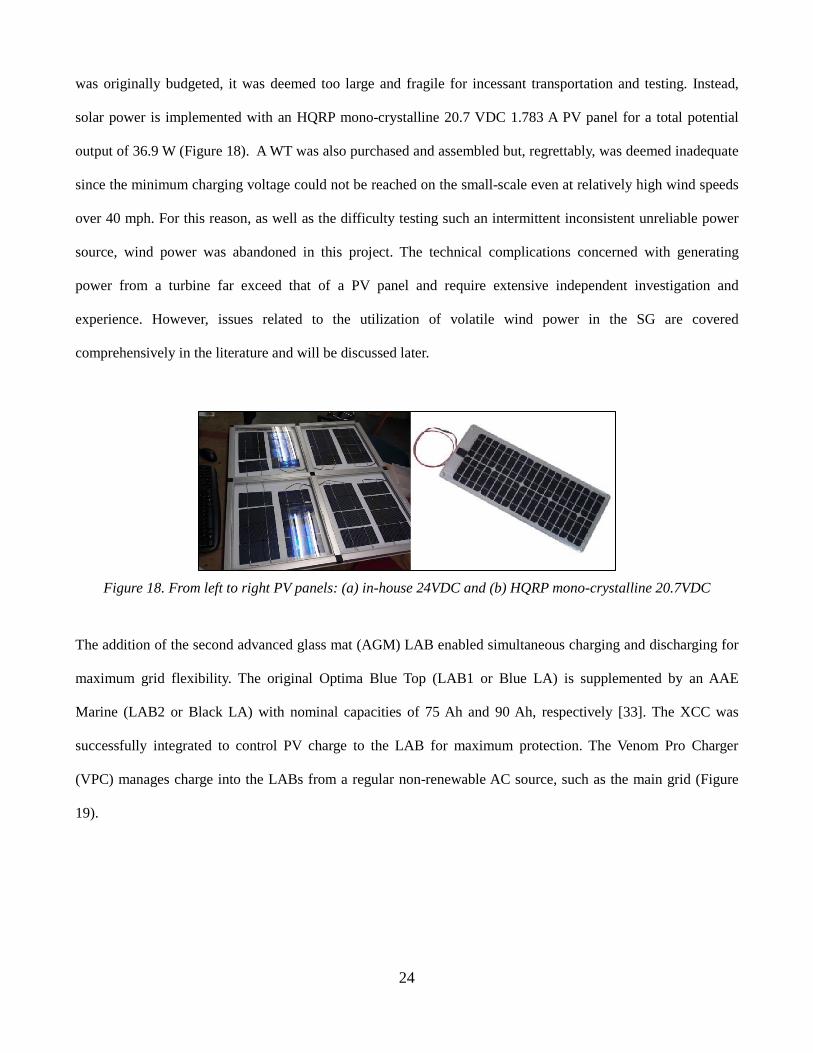
was originally budgeted, it was deemed too large and fragile for incessant transportation and testing. Instead,
solar power is implemented with an HQRP mono-crystalline 20.7 VDC 1.783 A PV panel for a total potential
output of 36.9 W (Figure 18). A WT was also purchased and assembled but, regrettably, was deemed inadequate
since the minimum charging voltage could not be reached on the small-scale even at relatively high wind speeds
over 40 mph. For this reason, as well as the difficulty testing such an intermittent inconsistent unreliable power
source, wind power was abandoned in this project. The technical complications concerned with generating
power from a turbine far exceed that of a PV panel and require extensive independent investigation and
experience. However, issues related to the utilization of volatile wind power in the SG are covered
comprehensively in the literature and will be discussed later.
Figure 18. From left to right PV panels: (a) in-house 24VDC and (b) HQRP mono-crystalline 20.7VDC
The addition of the second advanced glass mat (AGM) LAB enabled simultaneous charging and discharging for
maximum grid flexibility. The original Optima Blue Top (LAB1 or Blue LA) is supplemented by an AAE
Marine (LAB2 or Black LA) with nominal capacities of 75 Ah and 90 Ah, respectively [33]. The XCC was
successfully integrated to control PV charge to the LAB for maximum protection. The Venom Pro Charger
(VPC) manages charge into the LABs from a regular non-renewable AC source, such as the main grid (Figure
19).
24

Figure 19. From left to right: Optima Lead Acid Battery (BlueLAB), Xantrex C35 Charge Controller (XCC), and
Venom Pro Charger (VPC)
The LIB was integrated successfully to represent BEV battery storage. Ideally, the BEV would be charged
directly from the LAB and if possible straight from the PV panel. However, the sensitive chemistry of the LIB is
such that it requires a battery management system (BMS) to monitor and protect the pack (Figure 20). The four
3.3 VDC cells are wired in series and must be balanced precisely in order to maintain integrity and maximize
durability. This, unfortunately, leads to an inefficient transmission process of LAB to inverter, inverter to
charger, charger to LIB, and LIB re-balancing by BMS. While each of these components exhibit relatively high
efficiencies >90%, the cumulative losses are significant and unavoidable without a uniquely designed device that
can charge directly from LAB to LIB and accurately balance the cells.
Figure 20. From left to right: A123 LiFePO4 cells (LIB) and Elithion Lithiumate Pro (BMS)
The inverter capacity was significantly greater than originally considered. On top of the 400W Cobra Inverter
(INV1) supplying AC power for POP (see Figure 21), an 800W Inverter (INV2) supplies CCCV with both
inverters of the MSW variety. It was hoped to supply CCCV, PC and CRIO simultaneously off INV2 however it
was found the PC and CRIO would not operate under MSW supply. Thus, in addition, a 600W Pure Sine Wave
25
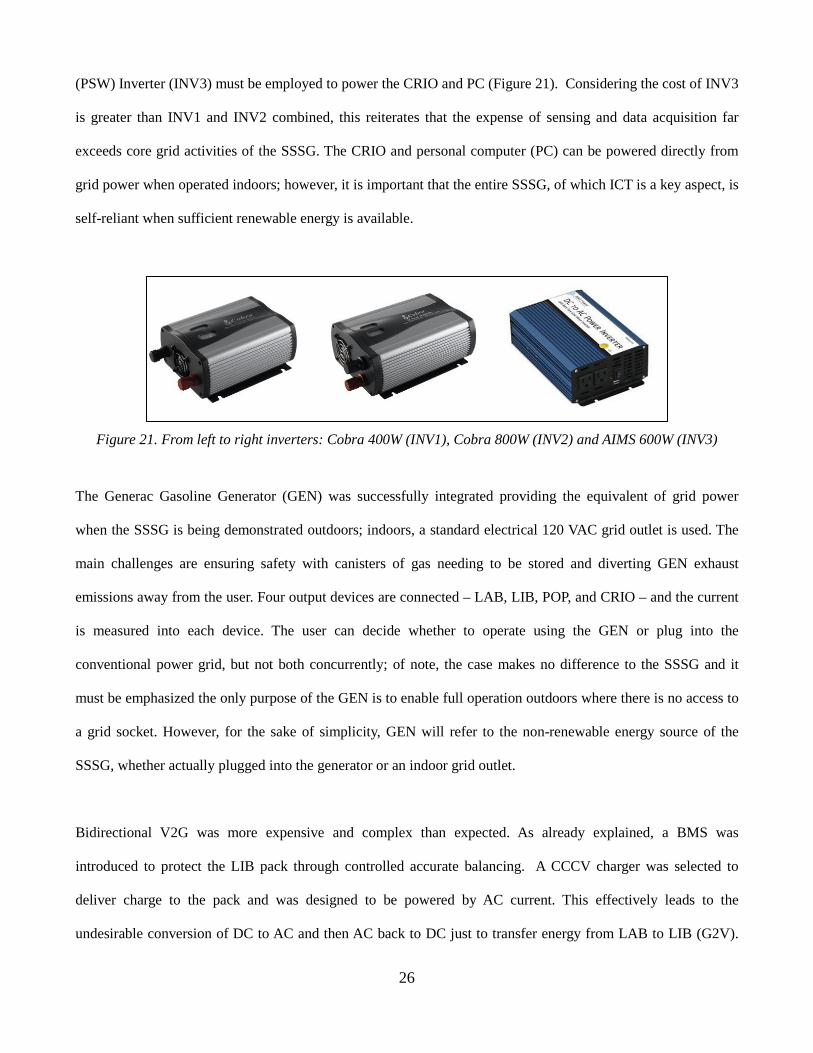
(PSW) Inverter (INV3) must be employed to power the CRIO and PC (Figure 21). Considering the cost of INV3
is greater than INV1 and INV2 combined, this reiterates that the expense of sensing and data acquisition far
exceeds core grid activities of the SSSG. The CRIO and personal computer (PC) can be powered directly from
grid power when operated indoors; however, it is important that the entire SSSG, of which ICT is a key aspect, is
self-reliant when sufficient renewable energy is available.
Figure 21. From left to right inverters: Cobra 400W (INV1), Cobra 800W (INV2) and AIMS 600W (INV3)
The Generac Gasoline Generator (GEN) was successfully integrated providing the equivalent of grid power
when the SSSG is being demonstrated outdoors; indoors, a standard electrical 120 VAC grid outlet is used. The
main challenges are ensuring safety with canisters of gas needing to be stored and diverting GEN exhaust
emissions away from the user. Four output devices are connected – LAB, LIB, POP, and CRIO – and the current
is measured into each device. The user can decide whether to operate using the GEN or plug into the
conventional power grid, but not both concurrently; of note, the case makes no difference to the SSSG and it
must be emphasized the only purpose of the GEN is to enable full operation outdoors where there is no access to
a grid socket. However, for the sake of simplicity, GEN will refer to the non-renewable energy source of the
SSSG, whether actually plugged into the generator or an indoor grid outlet.
Bidirectional V2G was more expensive and complex than expected. As already explained, a BMS was
introduced to protect the LIB pack through controlled accurate balancing. A CCCV charger was selected to
deliver charge to the pack and was designed to be powered by AC current. This effectively leads to the
undesirable conversion of DC to AC and then AC back to DC just to transfer energy from LAB to LIB (G2V).
26

Discharging back to the LAB (V2G) would require setting up another input to the VPC via one of the inverters.
A failsafe would also have to be installed to ensure both GEN and LIB are not supplying power simultaneously.
Regrettably, this was not incorporated in the SSSG in time for this report; however, V2G is adequately covered
by LIB to POP.
Time and budget limitations restrict control to a manual switchboard setup rather than a LV automated system
for this early iteration of the SSSG design. Double pole double throw (DPDT) switches select XCC or INV
(charging or discharging) to LAB, GEN or INV1 into POP, GEN or INV2 into CCCV, GEN or INV3 into CRIO,
LAB or LIB into INV1 in situations where an available off position is important for component protection.
Single pole double throw (SPDT) switches are employed to choose between XCC or VPC into LAB, and LAB1
or LAB2 grid connection. Wiring all components, sensors and switches together develops into an extremely
complex exercise with items connected indirectly to each other via a current and a voltage sensor, as well as a
toggle switch. This effectively made it unnecessary to cautiously pre-plan and position components on the cart
for efficient wiring.
3.1.2. Data acquisition and sensors
The organization of the data acquisition slots and module channels in the CRIO are summarized in the system
setup (Table 4). It can be seen the bulk of the channels are reserved for current and voltage for the sake of
calculating power flows around the SSSG.
27
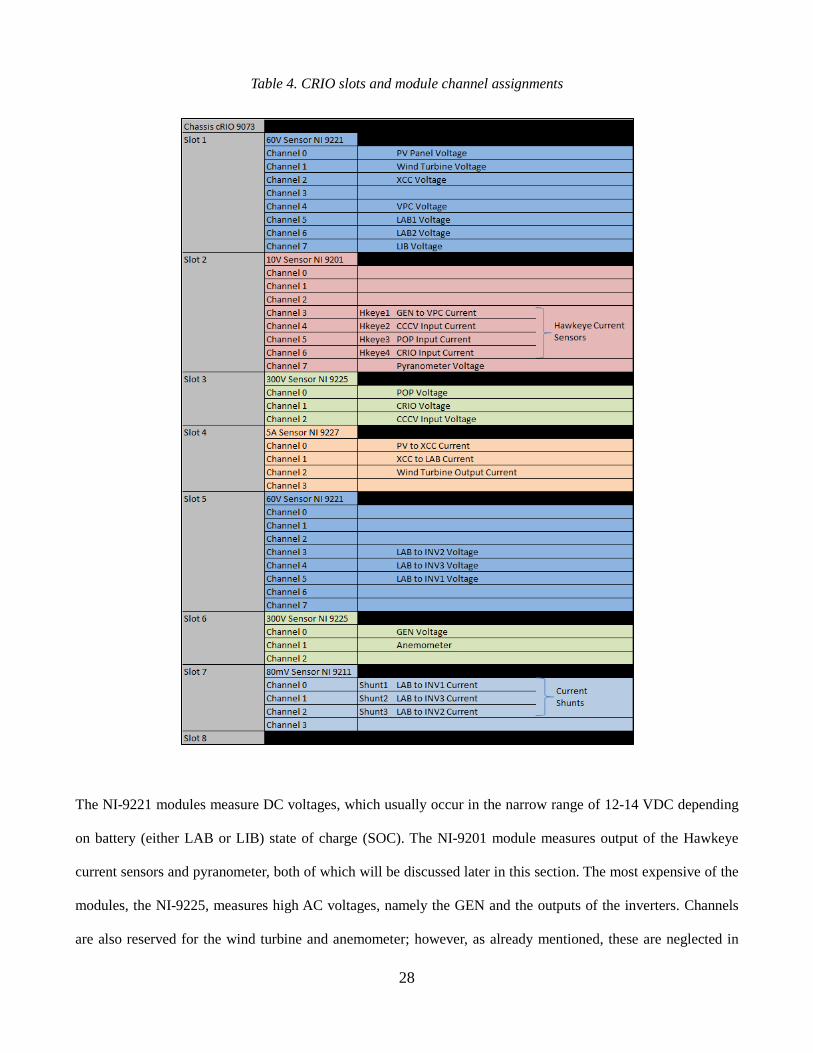
Table 4. CRIO slots and module channel assignments
The NI-9221 modules measure DC voltages, which usually occur in the narrow range of 12-14 VDC depending
on battery (either LAB or LIB) state of charge (SOC). The NI-9201 module measures output of the Hawkeye
current sensors and pyranometer, both of which will be discussed later in this section. The most expensive of the
modules, the NI-9225, measures high AC voltages, namely the GEN and the outputs of the inverters. Channels
are also reserved for the wind turbine and anemometer; however, as already mentioned, these are neglected in
28

this report.
The NI-9227 5A module measures relatively low current with strong 24-bit accuracy, but is limited to 4 channels
and is the second most expensive after the NI-9225. The nodes chosen for this module are PV to XCC, XCC to
LAB and WT output current. This leaves the four AC currents and three high current DC flows from either LAB
into INV1, INV2, and INV3.
High current DC sensors were difficult to find, expensive, and generally lack the accuracy of low current
sensors. Initially, three LEM HAIS 50-P current transducers were employed owing to their high current tolerance
(50 A), low cost, and non-invasive design. These measure current through the hall-effect and output a 0-5 VDC
signal to be read by the NI-9201 module for LV to convert back into the measured value [34]. However, the
complexity of installation is high with an independent 22 mA 5VDC power supply required while including four
pins at the bottom for powering the device and outputting the signal that was deemed incompatible with any
circuit board. Ultimately, too many issues arose attempting to mount the device securely to the grid and solder
solid connections to the pins so the LEM transducers were scrapped in favor of Empro HA50-50 DC shunts. The
disadvantage of these is their invasive nature, effectively extracting power from the flow being measured.
However, their cost is relatively low and both installation and operation are simple with the voltage output signal
in the range 0-50 mVDC proportional to the 0-50 A measurable current [35]. These are connected to the NI 9211
module to be read by LV.
Four Hawkeye hall-effect current sensors are employed to measure the AC currents, outputting a proportional
voltage to be read by NI-9201. LV converts these back into currents (IHE) using the following relation:
𝐼𝐼𝐻𝐻𝐻𝐻 = 𝑉𝑉𝐻𝐻𝐻𝐻∗𝐶𝐶1𝑁𝑁
(4)
where VHE is the read voltage, C1 is the correction factor and N is the number of turns around the sensor – the
wire can be wrapped several times to magnify voltage output.
29
Finally, the Apogee SP-215 pyranometer measures solar irradiance (Irr) in the range of 0-1100W m-2 and outputs
0-4.4 VDC to be read by module NI-9201 [36]. The correlation is linear with conversion factor C2 equal to 250
Wm-2 V-1:
𝐼𝐼𝐼𝐼𝐼𝐼 = 𝑉𝑉𝑝𝑝𝑝𝑝𝑟𝑟 ∗ 𝐶𝐶2 (5)
where Vpyr is the voltage read by the module. This equation is implemented in WeatherReadings.vi (Figure 14).
3.2 Experimental results
Several experiments were conducted to test power and efficiency of SSSG components. Various SG features
were simulated and results gathered using the tools incorporated in the LV program described in Section 2.3. The
analysis can be categorized into the following five tests:
1. Average power flows and efficiencies – SSSG summary
2. GEN to POP – conventional power generation and consumption
3. LAB to POP – smart storage and consumption
4. LIB to POP – V2G or V2H
5. PV to LAB – intermittent RE generation and storage
Test #1 effectively includes the averages calculated from the results of all tests, including #1-4. LV program data
was recorded to TDMS files and converted to spreadsheet form for post-processing, including calculation of
average power flows and efficiencies. These are presented in Figure 22 along with the approximate capacities of
each LAB. The battery capacities were measured by fully charging each LAB and discharging to the POP until
INV1 cuts out. Hence, with a discharge rate of around 300 W, this equates to the capacity at a C-rate of 1.
These capacities are significantly lower than advertised because both units had undergone two years of
continuous usage and cycling [33]. For faster charging, to conduct discharge experiments, the VPC was
employed, not the PV panel. The VPC itself reports current and voltage into the battery but as a component was
not perminently integrated into the grid to be measured by NI modules so no efficiency values were obtained.
The capacity of the remote-control (RC) car or BEV LIB pack will be discussed in test #4. The CRIO drew 50
30
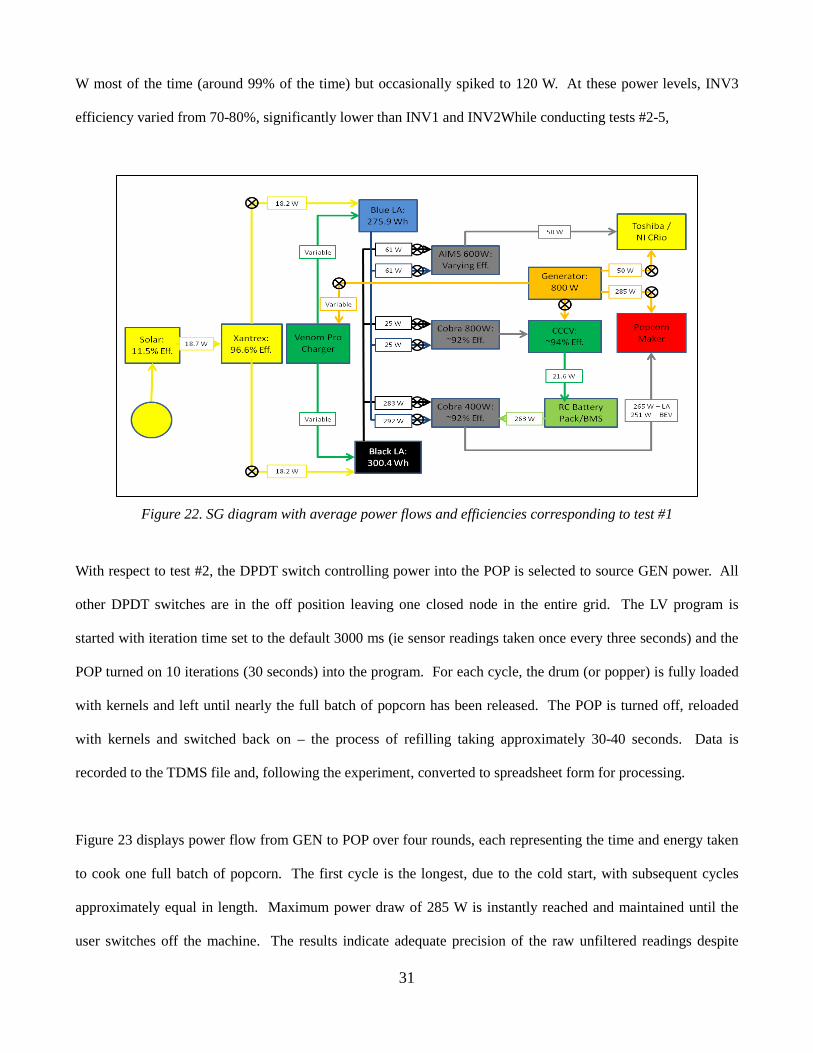
W most of the time (around 99% of the time) but occasionally spiked to 120 W. At these power levels, INV3
efficiency varied from 70-80%, significantly lower than INV1 and INV2While conducting tests #2-5,
Figure 22. SG diagram with average power flows and efficiencies corresponding to test #1
With respect to test #2, the DPDT switch controlling power into the POP is selected to source GEN power. All
other DPDT switches are in the off position leaving one closed node in the entire grid. The LV program is
started with iteration time set to the default 3000 ms (ie sensor readings taken once every three seconds) and the
POP turned on 10 iterations (30 seconds) into the program. For each cycle, the drum (or popper) is fully loaded
with kernels and left until nearly the full batch of popcorn has been released. The POP is turned off, reloaded
with kernels and switched back on – the process of refilling taking approximately 30-40 seconds. Data is
recorded to the TDMS file and, following the experiment, converted to spreadsheet form for processing.
Figure 23 displays power flow from GEN to POP over four rounds, each representing the time and energy taken
to cook one full batch of popcorn. The first cycle is the longest, due to the cold start, with subsequent cycles
approximately equal in length. Maximum power draw of 285 W is instantly reached and maintained until the
user switches off the machine. The results indicate adequate precision of the raw unfiltered readings despite
31
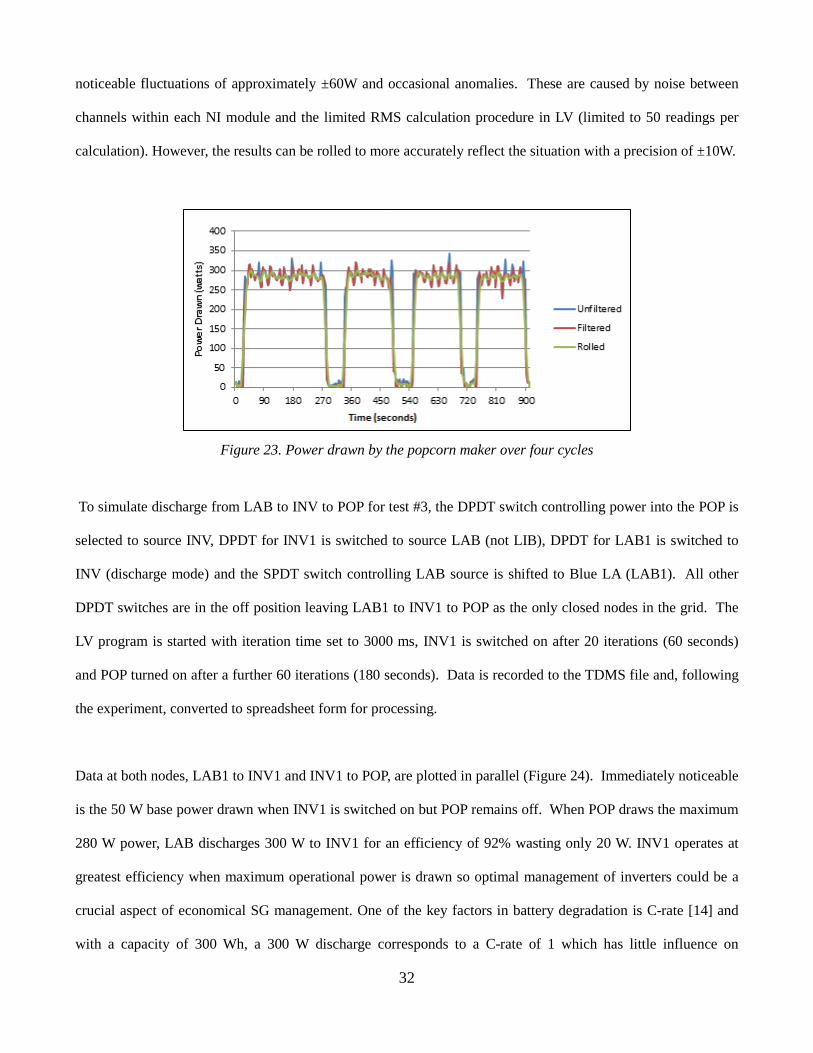
noticeable fluctuations of approximately ±60W and occasional anomalies. These are caused by noise between
channels within each NI module and the limited RMS calculation procedure in LV (limited to 50 readings per
calculation). However, the results can be rolled to more accurately reflect the situation with a precision of ±10W.
Figure 23. Power drawn by the popcorn maker over four cycles
To simulate discharge from LAB to INV to POP for test #3, the DPDT switch controlling power into the POP is
selected to source INV, DPDT for INV1 is switched to source LAB (not LIB), DPDT for LAB1 is switched to
INV (discharge mode) and the SPDT switch controlling LAB source is shifted to Blue LA (LAB1). All other
DPDT switches are in the off position leaving LAB1 to INV1 to POP as the only closed nodes in the grid. The
LV program is started with iteration time set to 3000 ms, INV1 is switched on after 20 iterations (60 seconds)
and POP turned on after a further 60 iterations (180 seconds). Data is recorded to the TDMS file and, following
the experiment, converted to spreadsheet form for processing.
Data at both nodes, LAB1 to INV1 and INV1 to POP, are plotted in parallel (Figure 24). Immediately noticeable
is the 50 W base power drawn when INV1 is switched on but POP remains off. When POP draws the maximum
280 W power, LAB discharges 300 W to INV1 for an efficiency of 92% wasting only 20 W. INV1 operates at
greatest efficiency when maximum operational power is drawn so optimal management of inverters could be a
crucial aspect of economical SG management. One of the key factors in battery degradation is C-rate [14] and
with a capacity of 300 Wh, a 300 W discharge corresponds to a C-rate of 1 which has little influence on
32
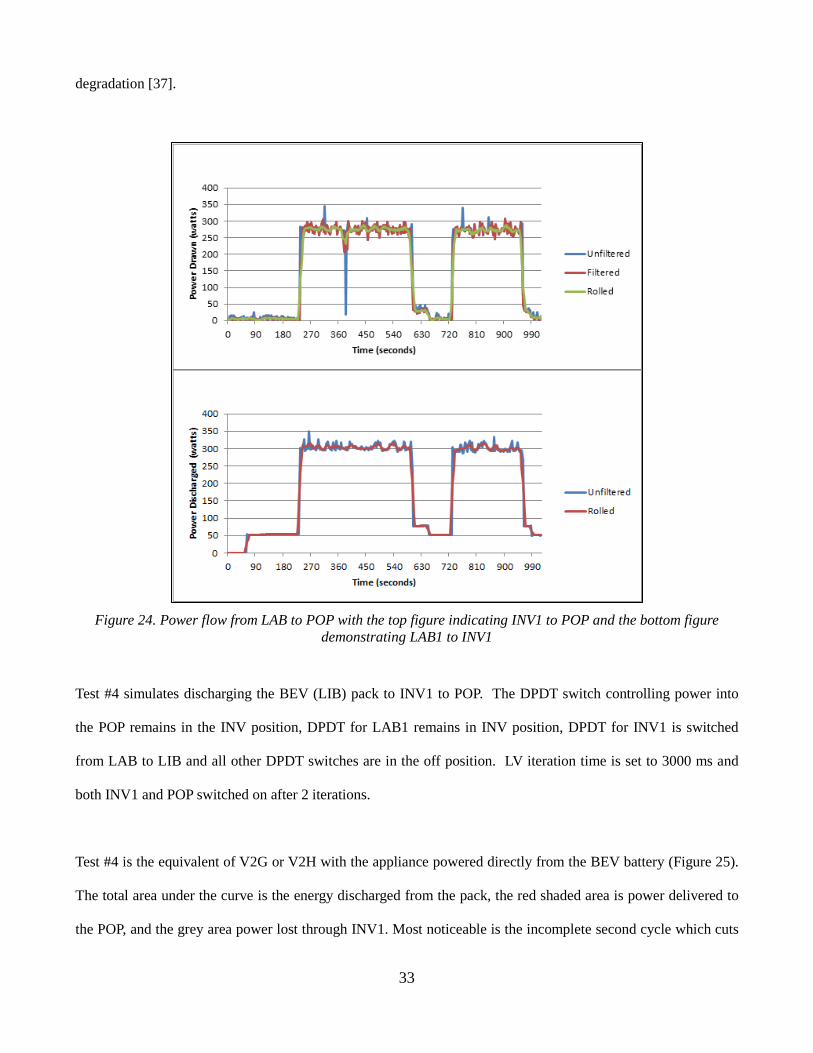
degradation [37].
Figure 24. Power flow from LAB to POP with the top figure indicating INV1 to POP and the bottom figure
demonstrating LAB1 to INV1
Test #4 simulates discharging the BEV (LIB) pack to INV1 to POP. The DPDT switch controlling power into
the POP remains in the INV position, DPDT for LAB1 remains in INV position, DPDT for INV1 is switched
from LAB to LIB and all other DPDT switches are in the off position. LV iteration time is set to 3000 ms and
both INV1 and POP switched on after 2 iterations.
Test #4 is the equivalent of V2G or V2H with the appliance powered directly from the BEV battery (Figure 25).
The total area under the curve is the energy discharged from the pack, the red shaded area is power delivered to
the POP, and the grey area power lost through INV1. Most noticeable is the incomplete second cycle which cuts
33
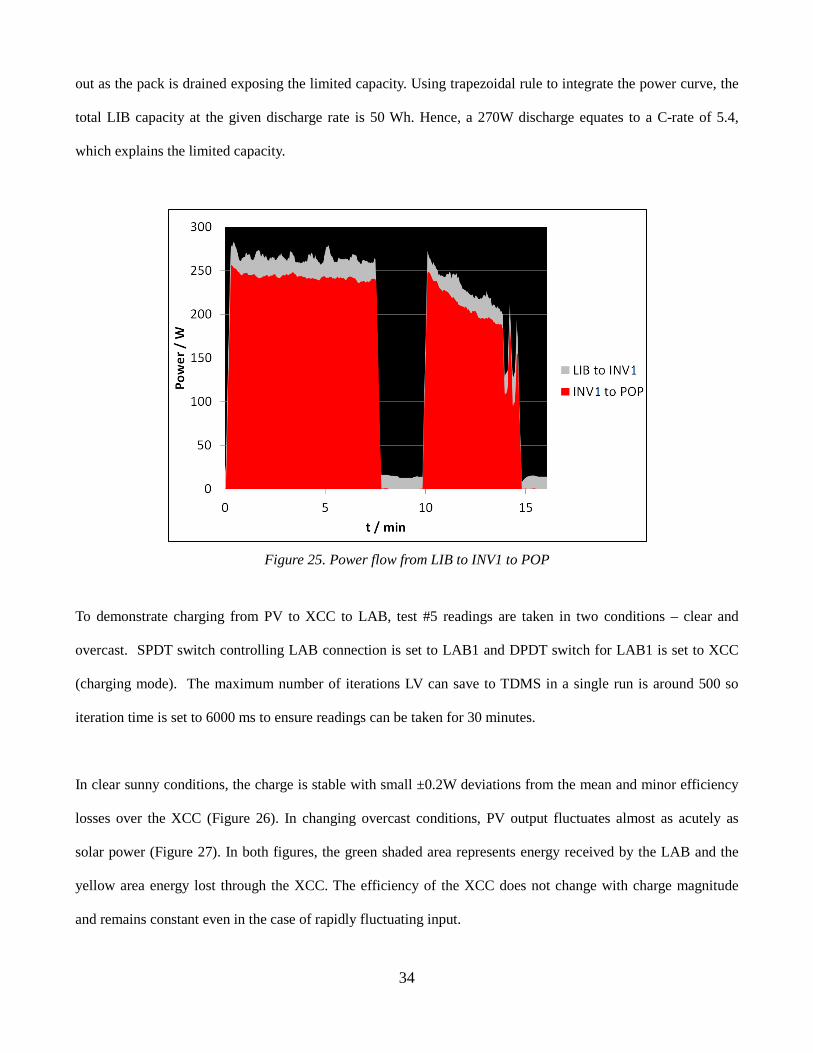
out as the pack is drained exposing the limited capacity. Using trapezoidal rule to integrate the power curve, the
total LIB capacity at the given discharge rate is 50 Wh. Hence, a 270W discharge equates to a C-rate of 5.4,
which explains the limited capacity.
Figure 25. Power flow from LIB to INV1 to POP
To demonstrate charging from PV to XCC to LAB, test #5 readings are taken in two conditions – clear and
overcast. SPDT switch controlling LAB connection is set to LAB1 and DPDT switch for LAB1 is set to XCC
(charging mode). The maximum number of iterations LV can save to TDMS in a single run is around 500 so
iteration time is set to 6000 ms to ensure readings can be taken for 30 minutes.
In clear sunny conditions, the charge is stable with small ±0.2W deviations from the mean and minor efficiency
losses over the XCC (Figure 26). In changing overcast conditions, PV output fluctuates almost as acutely as
solar power (Figure 27). In both figures, the green shaded area represents energy received by the LAB and the
yellow area energy lost through the XCC. The efficiency of the XCC does not change with charge magnitude
and remains constant even in the case of rapidly fluctuating input.
34
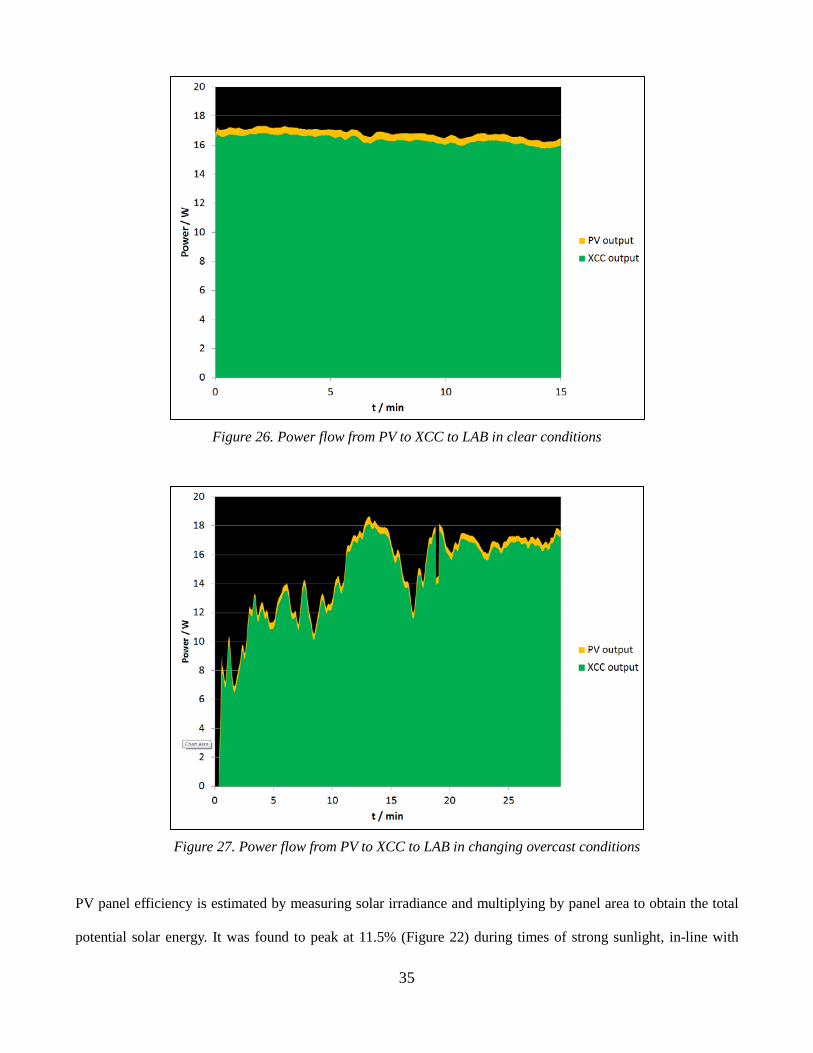
Figure 26. Power flow from PV to XCC to LAB in clear conditions
Figure 27. Power flow from PV to XCC to LAB in changing overcast conditions
PV panel efficiency is estimated by measuring solar irradiance and multiplying by panel area to obtain the total
potential solar energy. It was found to peak at 11.5% (Figure 22) during times of strong sunlight, in-line with
35

typical commercial cell efficiency under normal operating conditions, but could drop as low as 8.5% in the late
evening [38]. Efficiency can be maximized by varying the angle of the panel throughout the day to ensure it
faces directly towards the solar radiation. The XCC operated at 96-98% efficiency, irrespective of PV power
output. With a LAB capacity of 300 Wh, an 18.1 W charge equates to around 16 hours of charging time.
36

4. Discussion of SSSG Results
This chapter will explain experimental results in terms of how they can be projected onto large-scale SG. The
first section relates established SG concepts with the experiments from this investigation and the second section
explores other SG ideas and whether they can be simulated on the SSSG.
4.1 Projecting SSSG results to full-size SG
This section discusses the 5 tests from Chapter 3 and their results, and how they are applicable to full-size SG
issues.
4.1.1 Test #1 discussion
With respect to test #1 involving the power flows and efficiencies given in Figure 22, it will be difficult to
project these figures for a full-size SG. The average peak load for the average household in the US is nearly
3kW but this varies dramatically depending on size, location, and time of year [39]. Hence, the 300W POP
approximately represents peak load at a scale of 1:10. Keeping with this scale, the 0.34 m² 18.7W PV panel
represents a 3.4 m² 187 W panel and the LABs a 6 kWh battery bank. One study estimates 5 kW PV panel size
for average detached homes in the US, 3 kW for average attached homes, and 2 kW for other homes [40]. So for
a consistent 1:10 scale, it could be reasonable to expand to 3-7 m2 (200-500W) PV size for the SSSG. Another
study employs 5 m2 PV panels with 30 kWh battery capacity for a simulated full-size DC smart house system
[5]. Large-scale BEV projections are discussed in more detail as follows but immediately noticeable from
Figure 22 is the mismatch between charge and discharge power – most studies take G2V and V2G power
magnitudes as equal.
Figure 22 emphasizes the complexity and difficulty of simulating simple SG concepts. In specific, the role of
energy conversion (AC/DC) adds significantly to efficiency losses, especially charging LIB from LAB. The
CCCV and BMS limit charge into the LIB to 25 W to ensure cells are balanced. Fortunately the 800 W MSW
INV2 maintains adequate efficiency at low power operation unlike its 400 W counterpart INV1. The CCCV
37
appears to operate at around 94% efficiency whether converting MSW AC from INV2 or PSW AC from GEN
into DC. However net efficiency from LAB to LIB is 86% and PV to LAB is 96.6% so even neglecting LAB
cycling losses, overall efficiency from PV to LIB is 83.5% compared with 94% from GEN to LIB. This is an
expected issue RE generation and storage faces for full-size SGs. Future SSSG research should consider
designing a device that converts LAB discharge straight into LIB charge, without conversion to AC. With a
BMS protecting the pack, it may be possible to keep the entire LAB-LIB node in DC with a DC-DC converter.
Further testing has to investigate target output voltages which cause least damage to the LIB.
4.1.2 Test #2 discussion
In regards to test #2, GEN to POP in Figure 23, conventional power generation is simulated as a reference or
base scenario for other experimental results to be compared. As already discussed, this is for measuring accuracy
and precision of the sensors and data acquisition methods employed. Unfiltered raw data fluctuates dramatically
and produces several anomalous spikes so for practical analysis the results have to be rolled into local averages.
Even in the most simple single node test, readings are volatile and care has to be taken to reduce noise. In
“Smart Grid Automation” [41], the solution is to attach Ferrite beads to magnetically absorb unwanted electrical
interference (Figure 28). They can be simply snapped over wires with high noise, significantly cleaning up the
signal. It is highly recommended to employ these in future SSSG iterations since noise can cause reading error
over ±10%.
Figure 28. Ferrite bead tested on the SSSG
To summarize test #2 results, the first batch takes approximately 250 seconds cooking at 285 W which equals 20 38
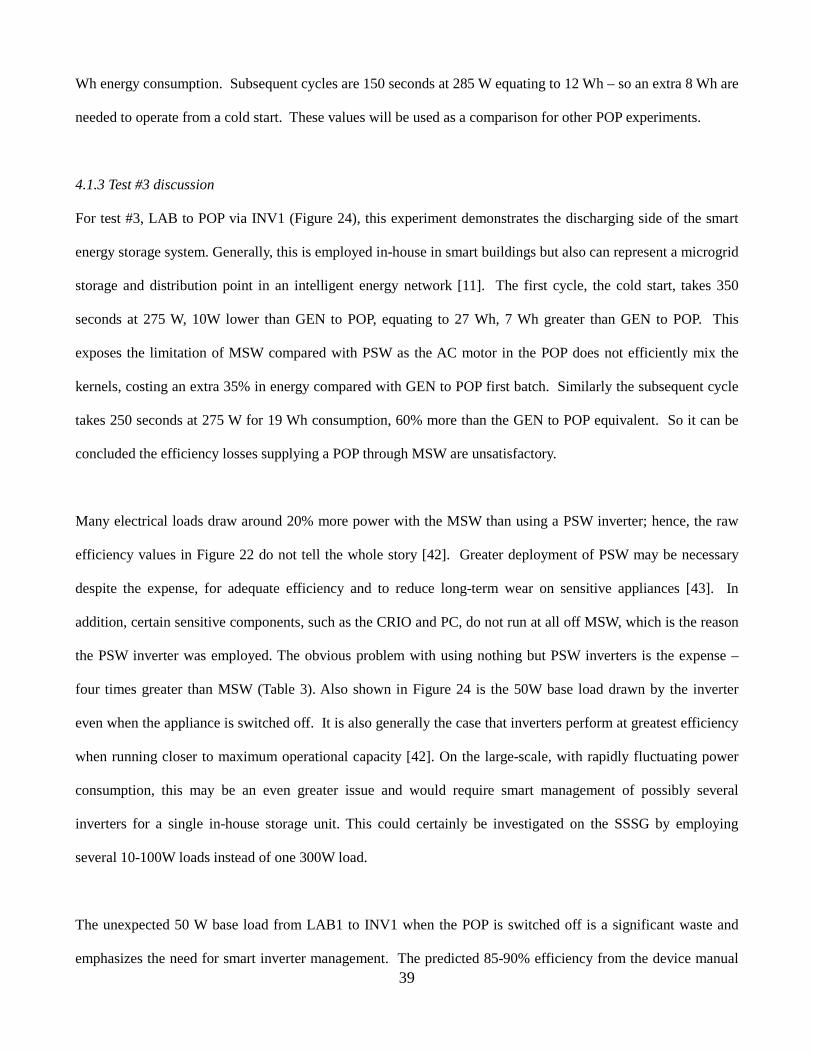
Wh energy consumption. Subsequent cycles are 150 seconds at 285 W equating to 12 Wh – so an extra 8 Wh are
needed to operate from a cold start. These values will be used as a comparison for other POP experiments.
4.1.3 Test #3 discussion
For test #3, LAB to POP via INV1 (Figure 24), this experiment demonstrates the discharging side of the smart
energy storage system. Generally, this is employed in-house in smart buildings but also can represent a microgrid
storage and distribution point in an intelligent energy network [11]. The first cycle, the cold start, takes 350
seconds at 275 W, 10W lower than GEN to POP, equating to 27 Wh, 7 Wh greater than GEN to POP. This
exposes the limitation of MSW compared with PSW as the AC motor in the POP does not efficiently mix the
kernels, costing an extra 35% in energy compared with GEN to POP first batch. Similarly the subsequent cycle
takes 250 seconds at 275 W for 19 Wh consumption, 60% more than the GEN to POP equivalent. So it can be
concluded the efficiency losses supplying a POP through MSW are unsatisfactory.
Many electrical loads draw around 20% more power with the MSW than using a PSW inverter; hence, the raw
efficiency values in Figure 22 do not tell the whole story [42]. Greater deployment of PSW may be necessary
despite the expense, for adequate efficiency and to reduce long-term wear on sensitive appliances [43]. In
addition, certain sensitive components, such as the CRIO and PC, do not run at all off MSW, which is the reason
the PSW inverter was employed. The obvious problem with using nothing but PSW inverters is the expense –
four times greater than MSW (Table 3). Also shown in Figure 24 is the 50W base load drawn by the inverter
even when the appliance is switched off. It is also generally the case that inverters perform at greatest efficiency
when running closer to maximum operational capacity [42]. On the large-scale, with rapidly fluctuating power
consumption, this may be an even greater issue and would require smart management of possibly several
inverters for a single in-house storage unit. This could certainly be investigated on the SSSG by employing
several 10-100W loads instead of one 300W load.
The unexpected 50 W base load from LAB1 to INV1 when the POP is switched off is a significant waste and
emphasizes the need for smart inverter management. The predicted 85-90% efficiency from the device manual 39
[44] appears marginally pessimistic when the POP drew 275 W. On the other hand, even 85-90% may be
optimistic for appliances more sensitive to MSW such as microwaves, drills, clocks or speed motors [43]. Some
of these have to draw more than usual due to the poor quality of MSW, not accounted for in the INV efficiency
calculation. Top of the line PSW inverters can convert DC to AC as efficiently as MSW but more importantly
they deliver high quality power allowing optimal operation of household appliances. However the expense is
significant, as mentioned previously, and even an inverter like the AIMS (INV3) needs to run close to maximum
operational power for maximum efficiency. Hence the design and development of a smart inverter system,
possibly as part of the smart metering system, will have to be investigated to optimize DC-AC conversion
efficiency.
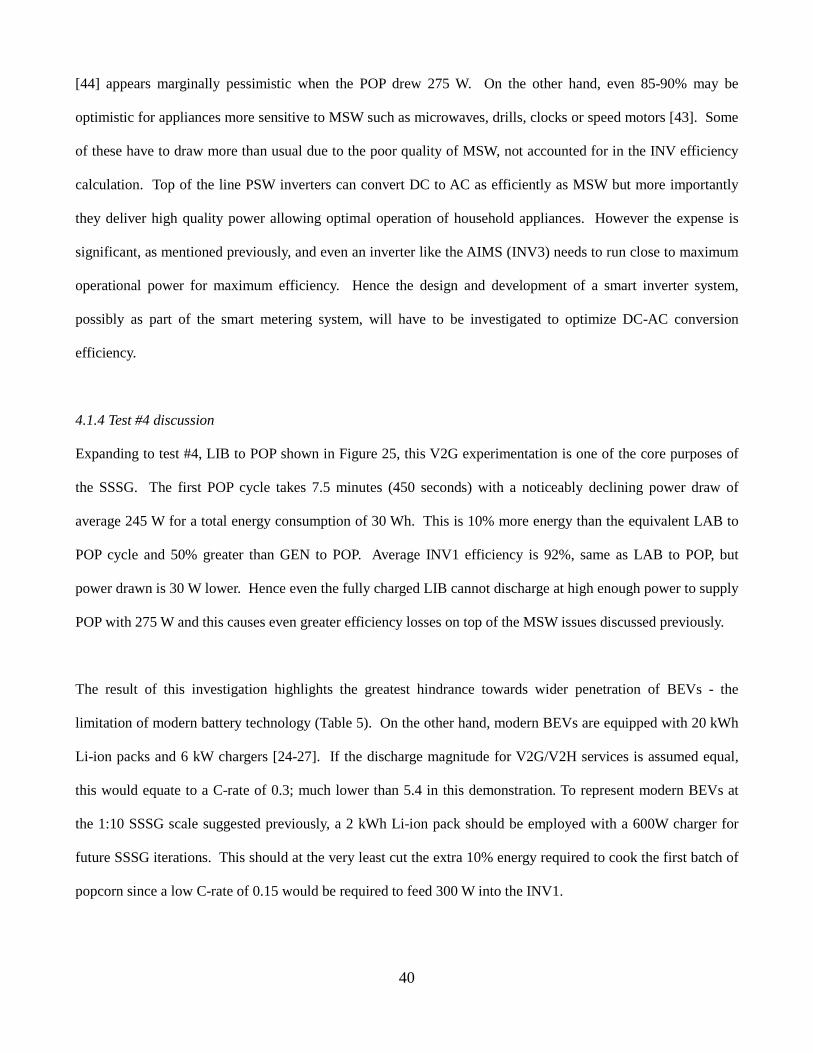
4.1.4 Test #4 discussion
Expanding to test #4, LIB to POP shown in Figure 25, this V2G experimentation is one of the core purposes of
the SSSG. The first POP cycle takes 7.5 minutes (450 seconds) with a noticeably declining power draw of
average 245 W for a total energy consumption of 30 Wh. This is 10% more energy than the equivalent LAB to
POP cycle and 50% greater than GEN to POP. Average INV1 efficiency is 92%, same as LAB to POP, but
power drawn is 30 W lower. Hence even the fully charged LIB cannot discharge at high enough power to supply
POP with 275 W and this causes even greater efficiency losses on top of the MSW issues discussed previously.
The result of this investigation highlights the greatest hindrance towards wider penetration of BEVs - the
limitation of modern battery technology (Table 5). On the other hand, modern BEVs are equipped with 20 kWh
Li-ion packs and 6 kW chargers [24-27]. If the discharge magnitude for V2G/V2H services is assumed equal,
this would equate to a C-rate of 0.3; much lower than 5.4 in this demonstration. To represent modern BEVs at
the 1:10 SSSG scale suggested previously, a 2 kWh Li-ion pack should be employed with a 600W charger for
future SSSG iterations. This should at the very least cut the extra 10% energy required to cook the first batch of
popcorn since a low C-rate of 0.15 would be required to feed 300 W into the INV1.
40

Table 5. Common battery chemistries and their attributes
4.1.5 Test #5 discussion
Finally test #5, the PV to LAB in Figure 26 and Figure 27, finds that approximately two days of 18.1W charging
is required to fully charge a depleted 300 Wh LAB unit. This is extremely tedious for cyclic battery testing and
determining charge/discharge efficiency. For a full efficiency analysis of PV to POP, it may be desirable to
employ greater PV capacity in the SSSG for fast LAB charging in less than four hours, as long as C-rate is kept
at a safe level – less than C/3 is recommended for LABs [33, 45]. Also noteworthy, the volatile PV output in
Figure 27 does not hinder LAB charge since the XCC maintains voltage at a steady level despite variable power
input. The graph also demonstrates the sustained efficiency of the XCC, even under relatively low levels of
charge.
It should be noted that to maintain cyclic life and performance, state-of-charge (SOC) should be kept within a
range of 25-95%, leaving 70% of total capacity usable [46]. In the DC smart house model, continuous
generation and consumption kept the in-house battery within 25-75% SOC in almost all scenarios employing 5
m2 (~ 400W) PV panels and a 30 kWh battery [5]. For this purpose, it could be useful to add a feature to the LV
program which estimates battery SOC. Each cell type has a predictable pattern in terms of bulk, absorption and
float stage voltages when charging and similar models for discharging. These can be incorporated into the
program along with input and output power readings from NI module sensors.
Combining these last two ideas for future SSSG iterations, if a 1 kWh LAB is employed, a 200 W PV panel
would charge from 25% to 95% SOC in three and a half hours – much more convenient for cyclic efficiency
experimentation. Another study analyses a utility scale PV plant with battery energy storage; however, this
41

assumes most PV generation is immediately consumed by the grid and employs battery capacity equivalent to 38
minutes of total peak PV generation [6]. Overall, the PV and LAB setup in this SSSG investigation is more
equivalent to a smart home or VPP than a utility scale PV plant but the two setups discussed in [6] could be
tested in a future SSSG iteration.
4.2 Other SG developments
Several SG ideas have been discussed in the literature, some of which can be incorporated and tested in the
SSSG but others are of macro-economic proportion and cannot be simulated using a simple model.
4.2.1 Other renewable and carbon-neutral power generation
Without renewable and carbon-neutral generation, the purpose of the SG and BEV concepts effectively become
obsolete; hence, greater deployments of wind, solar, tidal, and hydroelectric power are essential. Nuclear,
geothermal, and biomass sources can also be considered depending on the given priority, whether it is for
continuous long term energy production or reduction of greenhouse gas (GHG) emissions. It is important to
distinguish between RES, which are naturally replenished on a human timescale, and carbon-neutral sources
(CNS), which emit no GHG. For instance, biomass and geothermal power are RES but not CNS; whereas, the
reverse is true for nuclear. As a proportion of total electricity production, RES market share in the US actually
fell in the period 1980-2001 from 15% to 8% but recovered in 2007-2011 to 12% thanks to a sharp recent rise in
wind generation (Figure 29) [47]. CNS has flat-lined in the same period at around 25-30%, but could possibly be
seeing the start of a long term rise, again thanks to greater wind penetration (Figure 30) [47]. In terms of the
most sustainable sources (both CNS and RES) hydroelectric has flat-lined but wind, solar, and tidal are showing
sharp rises thanks to government subsidies and research and development progress. However, for the most part,
these sources remain insufficient and unprofitable without financial support. For instance, solar and wind power
were subsidized by $60 billion in 2012 [48]. The SG attempts to address some of these issues, including
inconsistent supply, with advanced infrastructure but this effectively becomes a chicken and egg problem.
Without RES, the SG does not solve the sustainability issue and, without the SG, RES remains inefficient.
Deploying both simultaneously may be premature and economically reckless if reliable technology is not 42
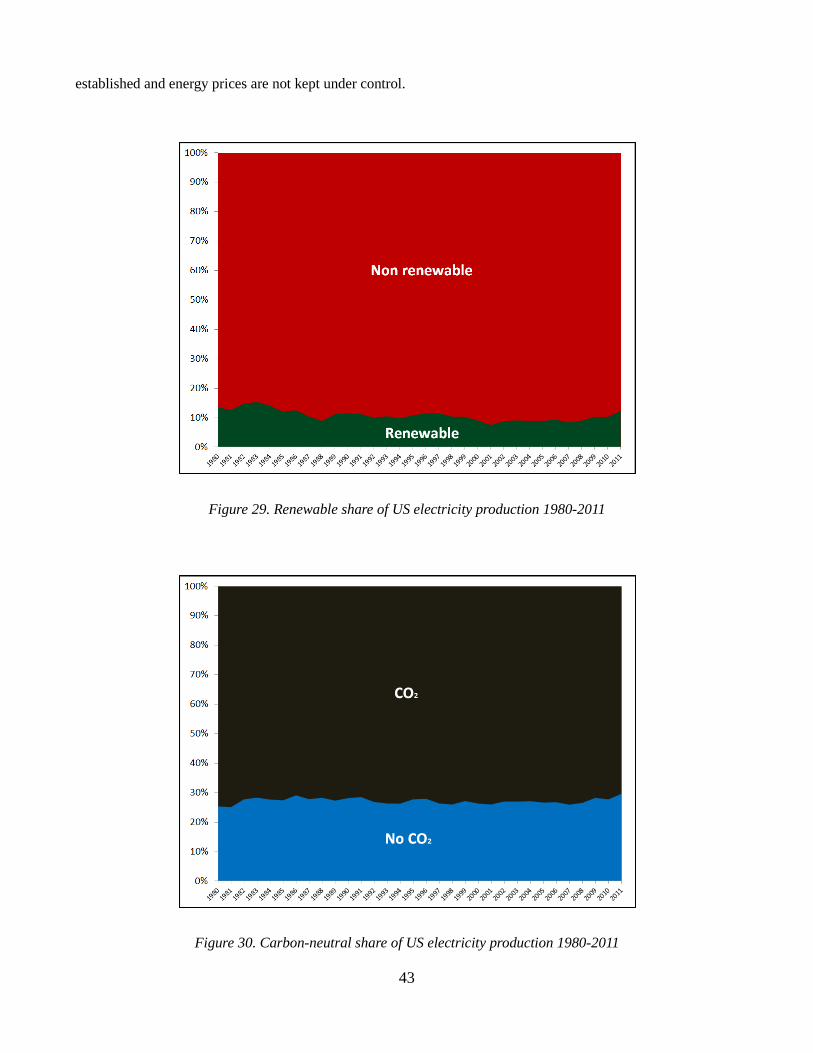
established and energy prices are not kept under control.
Figure 29. Renewable share of US electricity production 1980-2011
Figure 30. Carbon-neutral share of US electricity production 1980-2011
43

As already mentioned in Section 3.1.1, the original SSSG design attempted to incorporate wind energy (Figure
4) but the minimum voltage required to charge LAB could not be reached. However, the issues with SSSG wind
turbine integration run far deeper. Modern commercial turbine requirements include [49]:
• Yaw system to keep the rotor in-line with the wind
• Gear box to generate 1000-3000 rpm demand of electric generator
• Actuators to adjust blade pitch, change angle of attack and adjust shaft power
• Advanced structural support and aerodynamic design
In addition, the intermittent unpredictable nature of wind makes it excessively laborious to incorporate into the
SSSG. Although on the large-scale, policy studies have shown T&D load can be controlled by shifting charging
into off-peak times with a relatively simple control algorithm [7].
Nuclear, geothermal, and tidal are also unworkable on the small-scale, for obvious reasons. Hydroelectric, on the
other hand, can be accommodated if only for the purpose of SG storage. Pumped-storage hydroelectric schemes
are already widely implemented to support national grid fast reserve or reactive services for sudden spikes in
demand [50, 51]. With wider implementation and capacity it can also be employed for smart storage of excess
renewable generation and does not comprise toxic battery chemicals or cyclic durability issues.
Pumped hydroelectric storage can be simulated on the SSSG with two large reservoirs of water and a
bidirectional generator and pump assembly, such as a vane pump with DC motor (Figure 31).
44

Figure 31. Hydroelectric bidirectional generator/pump design for energy storage. Clockwise from top left:
housing, impeller, vane pump assembly (x2)
However, energy density is very low and representing a large-scale plant, such as the electric mountain [50],
requires significant tank or upper reservoir capacity. Gravitational potential energy can be estimated as follows:
𝐺𝐺.𝑃𝑃.𝐸𝐸 = 𝑚𝑚𝑔𝑔ℎ (6)
where m is mass of water, g the gravitational constant and h vertical distance between reservoirs. Hence for, say,
a 10 m3 tank suspended 1 m above a lake or another tank, total potential energy storage is about 27 Wh –
probably less taking into account pump efficiency losses. However this could be the SSSG equivalent of a grid’s
fast reserve service demonstrating rapid, flexible and sustainable prevention of black-outs in cases such as Figure
25 when battery storage is depleted.
4.2.2 Improved BEV technology
Energy density severely restricts the all-electric range (AER) of a BEV to around 100-120 miles [24-27]. In
order to make serious in-roads into the automotive market, it has been suggested energy density must increase to
ten times the current level resulting in more than a 500 mile AER [52]. However, even a tenfold improvement in
45

energy density will be useless unless accompanied by solid reliability in terms of cycle life, temperature, and
vibration resistance. Since many cells are stacked in series in order to achieve the required voltage, battery
reliability depends on the dependability of several hundred cells [13]. As could be expected, substantial
resources are being invested to explore potential battery chemistries with greater specific energies [53]. Lithium-
air has theoretical potential to be almost as energy dense as gasoline (Table 6) [54, 55]; however, this is based
strictly on thermodynamics and there are several serious obstacles before this chemistry can become practically
viable for BEVs [55].
Table 6. Theoretical and practical energy densities of various chemistries [55]
Of interest, current lithium ion technology remains adequate for modern SSSG research as it addresses the
delicate issue of maintaining precise cell balance for optimal battery longevity. However, if other BEV battery
technologies wished to be integrated, the SSSG could be utilized to analyze capacity, cell balancing, charge and
discharge rates, and cyclic efficiency with the proposed LV additions mentioned in section 4.1.5.
To complete the SSSG setup, especially for visual and demonstration purposes, it could be beneficial to
incorporate a small-scale RC BEV car. This could also aid in researching ideas discussed in the following
sections; although downsizing the on-board BMS design could be difficult.
46

4.2.3 Bidirectional V2G infrastructure
The V2G concept explored in the experiments is entirely dependent on BEV battery capabilities and can only
become a reality once the hurdles mentioned prior are overcome. Moreover, despite strong theoretical
advantages – both environmental and economic [16, 56, 57] – even more issues arise. Providing V2G ancillary
services introduce additional wear on BEV batteries and accelerate replacement frequency [14]. Furthermore,
significant investment and regulation is required to introduce consumer-friendly bidirectional charging
infrastructure, including industry standards for manufacturers to follow [10, 13]. Without central planning and
control, as well as customer cooperation, grid stability is at serious risk; converse to one of the main purposes of
V2G [10]. Smart metering and ICT are essential to encourage passive consumers to become active producers by
selling energy back to the grid when demand is high [58].
Upgrading grid infrastructure to accommodate bidirectional power flow will be significantly expensive and take
time. Each BEV must be designed with a bidirectional charger compatible with grid infrastructure. Each
building, whether residential or commercial, must incorporate appropriate transmission lines and possibly
storage banks for maximum local efficiency and flexibility. Since efficiency losses are proportional to
transmission distance and number of conversion components (inverters, transformers, etc.), a local battery bank
may be required to maximize local excess renewable generation. Hence, the LAB in this investigation could
represent either external grid or in-house storage. This, however, creates an extra upfront expenditure, further
reducing the economic argument for full-scale conversion.
The SSSG could be employed to experiment with more user-friendly V2G charger designs. The current SAE
industry standard J1772 charger is for unidirectional purposes only so there remains a need to investigate
practical bidirectional concepts [28]. Initially, a small-scale unidirectional charger, equivalent to the J1772, can
be implemented as a precursor before the bidirectional charger is developed for the SSSG. This could avoid the
safety issues and expense of experimenting with proposed high-voltage requirements (240-600 VAC/VDC) for
full-size BEVs [10, 13].
47

4.2.4 BEV battery swap stations
Current battery technology does not allow charging in less than half an hour (at best), so charging stations
analogous to gas stations, are not currently feasible. In this alternate strategy, depleted batteries are swapped with
a fresh pack in a fully automated process, comparable to conventional refueling. This method reduces impact on
distribution systems since flexible charge timing becomes possible [10]. A discharged battery can be replaced
with a fully charged pack relatively rapidly in a fully standardized transaction. Further testing on proposed
models is required to solve the ultimate problem of how many batteries a swap station should hold in stock and
the tradeoff between responding to dynamic electricity prices and charging batteries just when they are needed
[59]. While the economic research takes place, the SSSG can be employed to design and test automated battery
exchange stations. Small-scale BEV packs and robotic substitution programs can be more affordably and safely
researched than on the large-scale.
4.2.5 Smart homes/buildings
Both commercial and residential buildings have to play a more active role in the SG world. They are the means
by which BEVs connect with the grid. However, as has been demonstrated in this investigation, the concomitant
sensing and ICT networks can be an even greater expenditure than the grid itself. The initial cost of a personal
PV and battery energy storage systems (BESS) is, under present market prices and technological capabilities, not
recuperated through long-term savings in energy bills [5, 6]. However, a smart all-electric home with hybrid
PV/solar collector (SC) system, a ground source heat pump (GSHP), and a feed-in tariff system (allowing among
other things the sale of excess energy) can cut long term bills dramatically [60]. Of note, this referenced study
was conducted in a sub-tropical region with greater solar potential and less central heating demand. A similar
study investigated a small community of smart houses in a SG topology with the addition of wind generation and
battery storage [5]. The results of the simulation are also positive but no discussion of initial infrastructure and
potential maintenance costs are made.
It may be possible to simulate the DC smart house study using the SSSG at, say, 1:10 scale employing 0.5 m2 PV
panels with 3 kWh BESS capacity [5]. However the study took place in a sub-tropical region with above 48

average solar irradiance so 0.7-1 m2 panel may be more appropriate. A small-scale DC GSHP could be
implemented along with DC lights for energy consumers. This however may not be useful for researching US
homes which entirely depend on AC power. The role of DC/AC conversion is one of the main features of the
SSSG so converting to DC smart home could be too laborious. A more conventional AC smart home could be
simulated with much less conversion and comparison with the DC smart home research may be useful.
4.2.6 Economic, social, and policy hurdles
Economic and environmental research has yielded positive but also cautious analysis of the SG concept. One
study presents a plan for making Croatia almost entirely self-sufficient in terms of energy supply through
integration of greater wind capacity, pumped hydro storage, battery storage, heat storage, heat pumps, and BEVs
[56]. Another study investigates the potential of RES in Denmark and concludes 100% dependence is possible
with greater deployment of smart flexible technologies, especially into the transport system [61]. Grid flexibility
is a common theme in many economic studies and dynamic tariffs accommodated through greater deployment of
advanced smart metering is considered one of the keys to unlocking greater investment [17]. A German
investigation looks into the obstacles and options for overcoming them for wide-spread implementation of ICT,
applicable in any market [62].
Despite a strong long-term economic case, the initial investment required putting in place the necessary
infrastructure for ICT, bidirectional V2G, and storage is of macro-economic proportion. According to the IEA,
US investment to achieve BLUE Map energy targets would amount to $5.8 trillion over 40 years [39]. However,
this is to accomplish the significantly ambitious target of cutting carbon dioxide (CO2) emissions 81% by 2050
and is considered the best case scenario, although most likely unrealistic. EPRI on the other hand estimate $340-
480 billion over 20 years with a potential net benefit of $1.3-2 trillion [63]. The OECD has calculated that
stabilizing and especially cutting CO2 emissions may result in a substantial loss in GDP [39]. On the other hand,
some studies show the cost of inaction would outweigh the cost of reducing CO2 emissions over the longer term
[39].
49

Uncertainty regarding the gains achieved by this technology and unpredictable consumer behavior make
investors especially skeptical [16]. Even in a competitive energy market with several competing players,
regulatory constraints and marginal costs (when one player is under constraint) may push prices out of control
[16]. The “Smart Paradox” discusses the issues of effective regulation and incentives, and the importance of
encouraging the right type of investments [64]. It has been shown the quality of service can often be negatively
impacted by premature investment misdirected by incentive regulation.
Resistance from industry is also substantial considering how much oil and gas producers have to lose, and
manufacturers are especially fearful of the risks involved in energy revolution. Oil and automobile companies
allege BEVs have a net negative environmental impact because of chemical discharges from battery
manufacturing facilities and disposal. This conflicts with existing lead-acid battery marketplace results and the
subsequent movement towards lower toxicity lithium-based batteries [10]. However, there can be no doubt
reliable affordable energy supply is indispensable in every industry of a modern developed economy.
Public perception towards the SG revolution is mixed. Despite ambitious targets for cutting carbon emissions
and reliance on foreign oil [65-67], skepticism remains over the capabilities of renewable energy and the urgency
of combating climate change [68-72]. Household energy prices have seen a sharp rise in European Union
countries, most notably Germany, with the most ambitious environmental targets [73-75]. However, even
disregarding the issue of climate change, the benefits of long term sustainable energy independence are
irrefutable. Many modern international disputes and conflicts can be at least partially attributed to the issue of oil
and gas trading [76-80]. The international price of oil and gas fluctuates on a daily basis and has seen a long term
rise over the last 30 years, including several unpredictable spikes [81]. It is speculated the price of a barrel of oil
will reach $312 in nominal terms by 2050 [39].
The SSSG can be used to design potential smart meters for consumers, providing RT market energy price, local
VPP status and household consumption. The prosumer can utilize the smart meter to specify his/her preferences
of what to do with excess domestic RE generation, such as energy storage in the domestic or local BESS, share 50
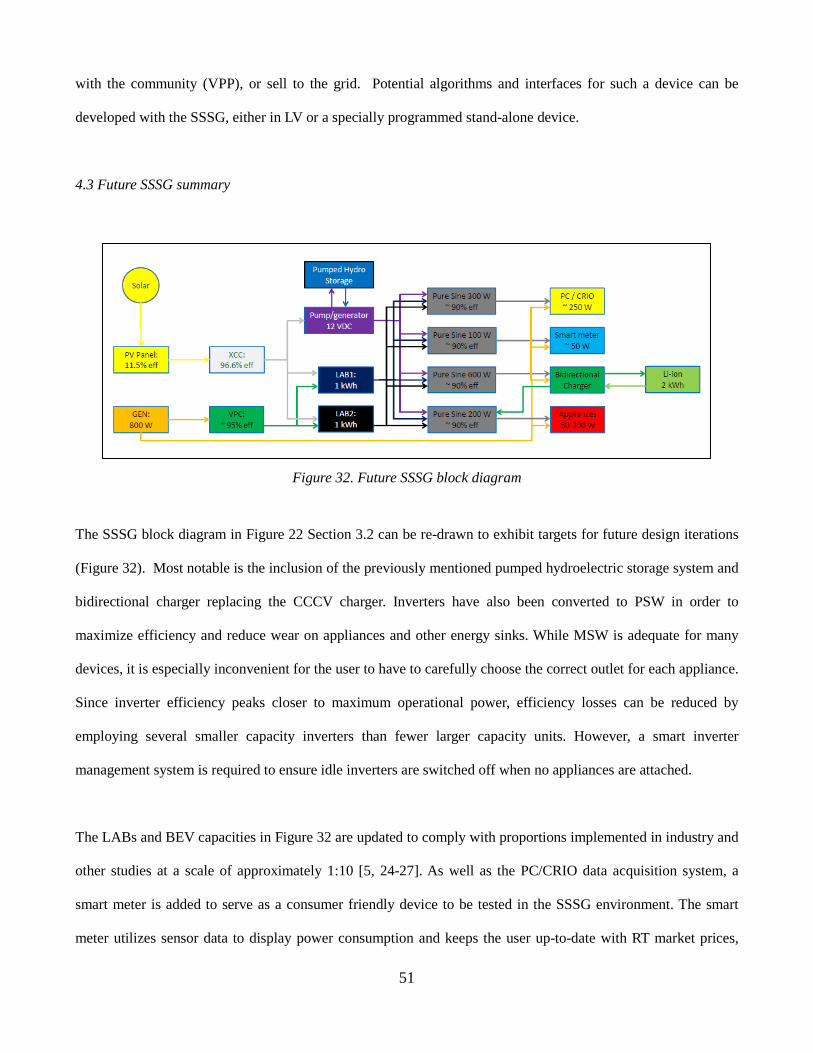
with the community (VPP), or sell to the grid. Potential algorithms and interfaces for such a device can be
developed with the SSSG, either in LV or a specially programmed stand-alone device.
4.3 Future SSSG summary
Figure 32. Future SSSG block diagram
The SSSG block diagram in Figure 22 Section 3.2 can be re-drawn to exhibit targets for future design iterations
(Figure 32). Most notable is the inclusion of the previously mentioned pumped hydroelectric storage system and
bidirectional charger replacing the CCCV charger. Inverters have also been converted to PSW in order to
maximize efficiency and reduce wear on appliances and other energy sinks. While MSW is adequate for many
devices, it is especially inconvenient for the user to have to carefully choose the correct outlet for each appliance.
Since inverter efficiency peaks closer to maximum operational power, efficiency losses can be reduced by
employing several smaller capacity inverters than fewer larger capacity units. However, a smart inverter
management system is required to ensure idle inverters are switched off when no appliances are attached.
The LABs and BEV capacities in Figure 32 are updated to comply with proportions implemented in industry and
other studies at a scale of approximately 1:10 [5, 24-27]. As well as the PC/CRIO data acquisition system, a
smart meter is added to serve as a consumer friendly device to be tested in the SSSG environment. The smart
meter utilizes sensor data to display power consumption and keeps the user up-to-date with RT market prices,
51

and LAB and BEV charge status.
52
5. Conclusion
The SSSG was constructed and assembled for the EPA P3 contest in Washington DC. Table 3 in Section 3.1
reveals some of the greatest expenses, including the BMS and cell boards for the lithium-ion BEV pack. This
highlights the greatest hurdle facing wider market penetration of BEVs; i.e., the cost and immaturity of modern
battery technology. Also striking is the significantly greater proportion of resources spent on data acquisition.
Smart meters and advanced ICT have been repeatedly proposed in the literature as one of the keys to unlocking
substantial energy savings [15, 17, 18, 21]. Extensive RT sensing and data acquisition is essential for the
development of competitive dynamic energy pricing to encourage sustainable consumer behaviour. However, at
74% of total SSSG expenditures, the development of such advanced RT grid monitoring may be unaffordable at
the large-scale. As with BEVs, data acquisition technology will require significant research and development
before it can become economically viable.
The PC program designed in LV is the main tool with which the SSSG is analyzed. Power and efficiency
readings are computed from raw current and voltage sensor data, as well as solar irradiance for PV efficiency.
Displaying grid status to the user in a convenient manner is accomplished through a block diagram with
indicators displaying power flows. Experimentation is conducted by specifying file location for the TDMS file
and iteration time, with the program automatically accumulating and organizing data into manageable groups for
spreasheet analysis. Future iterations of the program should adopt estimation algorithms of battery capacity,
both LAB and BEV LIB, and automated control of power flow through the NI-9401 I/O module rather than
employing SPDT and DPDT manual switches.
Figure 22 in Section 3.2 effectively summarizes the simulation of the SSSG. PV generation appears too low,
even for a small-scale model. If the POP represents consumer load of a single home, PV panel output can be
anywhere from 50-500 W based on previous studies [5, 40]. Similarly, if representing a community VPP, both
generation and consumption can remain at the same proportion [5, 20]. V2G (LIB to POP) power appears more
than ten times greater than G2V (LAB or GEN to LIB). This should be alleviated in future SSSG iterations by
53

designing and simulating a bidirectional V2G charger, similar to the SAE standard J1772 and upgrading BEV
pack to 2 kWh.
Inverter management is a key factor for improving SSSG efficiency. MSW wastes up to 60% more energy
cooking batches of popcorn than the PSW GEN and efficiency of the INV iteself is 92% but only when operating
close to maximum. Leaving the inverter switched on without any appliance running wastes up to 50 W so
household smart meter systems may have to manage inverters to minimize losses. Future SSSG iterations
should be utilized to explore and design smart meters to perform such automatic management functions as well
as allow prosumers to control domestic RE sources. A real small-scale BEV may also aid in smart home
research and development.
A proposed block diagram for the next SSSG iteration is presented in Figure 32 Section 4.3. This SSSG
approach can be exploited to cost-effectively research and develop important concepts and technologies to help
secure sustainable grid operation and energy supply for the future.
54
References
1. Richter, B., et al., How America can look within to achieve energy security and reduce global warming, in Energy Future: Think Efficiency2008, American Physical Society. p. S1-S107.
2. Perez-Arriaga, I.J., Regulatory Instruments for Deployment of Clean Energy Technologies. MIT Center for Energy and Environmental Policy Research, 2009.
3. CEER, 2013 Annual Report, 2013, Council of European Energy Regulators. 4. US-DoE. Answering your questions about grid modernization. 2014; Available from:
http://www.energy.gov/articles/answering-your-questions-about-grid-modernization. 5. Tanaka, K., et al., Optimal operation of DC smart house system by controllable loads based on smart
grid topology. Renewable Energy, 2012. 39(1): p. 132-139. 6. Rudolf, V. and K.D. Papastergiou, Financial analysis of utility scale photovoltaic plants with battery
energy storage. Energy Policy, 2013. 63(0): p. 139-146. 7. Hennings, W., S. Mischinger, and J. Linssen, Utilization of excess wind power in electric vehicles.
Energy Policy, 2013. 62(0): p. 139-144. 8. US-DoE, A Vision for the Smart Grid, D.o. Energy, Editor 2009, Office of Electricity Delivery and
Energy Reliabiltiy. 9. Chau, K.T. and C.C. Chan, Emerging Energy-Efficient Technologies for Hybrid Electric Vehicles.
Proceedings of the IEEE, 2007. 95(4): p. 821-835. 10. Yilmaz, M. and P.T. Krein, Review of the Impact of Vehicle-to-Grid Technologies on Distribution
Systems and Utility Interfaces. Power Electronics, IEEE Transactions on, 2013. 28(12): p. 5673-5689. 11. Orecchini, F. and A. Santiangeli, Beyond smart grids - The need of intelligent energy networks for a
higher global efficiency through energy vectors integration. International Journal of Hydrogen Energy, 2011. 36(13): p. 8126-8133.
12. Lund, H. and W. Kempton, Integration of renewable energy into the transport and electricity sectors through V2G. Energy Policy, 2008. 36(9): p. 3578-3587.
13. Chunhua, L., et al., Opportunities and Challenges of Vehicle-to-Home, Vehicle-to-Vehicle, and Vehicle-to-Grid Technologies. Proceedings of the IEEE, 2013. 101(11): p. 2409-2427.
14. Bishop, J.D.K., et al., Evaluating the impact of V2G services on the degradation of batteries in PHEV and EV. Applied Energy, 2013. 111(0): p. 206-218.
15. Werbos, P.J., Computational Intelligence for the Smart Grid-History, Challenges and Opportunities. Ieee Computational Intelligence Magazine, 2011. 6(3): p. 14-21.
16. Clastres, C., Smart grids: Another step towards competition, energy security and climate change objectives. 2011.
17. Faruqui, A., Unlocking the €53billion savings from smart meters in the EU: How increasing the adoption of dynamic tariffs could make or break the EU's smart grid investment. 2010. 38.
18. Wissner, M., ICT, growth and productivity in the German energy sector - On the way to a smart grid? 2011. 19.
19. Storelli, S. and G. Pillet, La tarafication dynamique de l'électricité. Bulletin SEV/VSE, 1997. 20. Rathnayaka, A.J.D., et al. Identifying prosumer's energy sharing behaviours for forming optimal
prosumer-communities. in Cloud and Service Computing (CSC), 2011 International Conference on. 2011.
21. Depuru, S., L.F. Wang, and V. Devabhaktuni, Smart meters for power grid: Challenges, issues, advantages and status. Renewable & Sustainable Energy Reviews, 2011. 15(6): p. 2736-2742.
22. Kreikebaum, F., D. Das, and D. Divan. Reducing transmission investment to meet Renewable Portfolio Standards using Controlled Energy Flows. in Innovative Smart Grid Technologies (ISGT), 2010. 2010.
23. Gharavi, H., Multigate communication network for smart grid. 2011. 24. Chevrolet. Volt EV specs. 2014; Available from: http://www.chevrolet.com/volt-electric-
car/specs/trims.html. 25. Honda. Fit EV. 2014 [cited 2014; Available from: http://automobiles.honda.com/fit-ev/. 26. Tesla. Model S features. 2014; Available from: http://www.teslamotors.com/models/features#/. 27. Nissan. LEAF specs. 2014; Available from: http://www.nissanusa.com/electric-cars/leaf/versions-specs/.
55
28. SAE. SAE Standards on EV charging connector approved. 2010 [cited 2014; Available from: http://articles.sae.org/7479/.
29. Yamauchi, H., et al. Advanced Smart House. in Harmonics and Quality of Power (ICHQP), 2012 IEEE 15th International Conference on. 2012.
30. Xantrex, C-series Multifunction DC controller: Owner's Manual. 2010: Xantrex. 31. Instruments, N., LabVIEW Core 1 Course Manual. 2010. 32. TDMS File Format Internal Structure, in NI web site2012. 33. Optima. Bluetop specs. 2010 [cited 2010; Available from: http://www.optimabatteries.com/en-
us/shop/bluetop/bluetop-group-31-dual-purpose-deep-cycle-and-starting/. 34. Farnell. LEM Current Transducer HAIS. 2011; Available from:
http://www.farnell.com/datasheets/51649.pdf. 35. Empro. Empro Shunts: Type HA. 2011; Available from:
http://www.emproshunts.com/product.aspx?Category=7. 36. Apogee. Owner's Manual: Pyranometer Model SP-215. 2012; Available from:
http://www.apogeeinstruments.com/content/SP-212_215manual.pdf. 37. Serrao, L., et al. Optimal energy management of hybrid electric vehicles including battery aging. in
American Control Conference (ACC), 2011. 2011. 38. Mitchell, K.W. and M.L. Tatro, Solar cell, in Access Science2014. 39. IEA, Energy Technology Perspective: Scenarios & Strategies to 2050, 2010, International Energy
Agency. 40. Denholm, P. and R. Margolis, Supply Curves for Rooftop Solar PV-Generated Electricity for the United
States, 2008, National Renewable Energy Laboratory. 41. Strecker, B., Smart Grid Automation, 2013, University of Kansas. 42. Solar-facts.com. How much of your DC power comes out as AC power. 2014; Available from:
http://www.solar-facts.com/inverters/inverter-efficiency.php. 43. Wilson, D. Sine Wave vs Modified Sine Wave: Which is better? Tech Doctor, 2011. 44. Cobra, 400 Watt Power Inverter Operating Instructions, Cobra, Editor 2010. 45. PowerStream. SLA Battery Quick-Charging. 2014; Available from: http://www.powerstream.com/SLA-
fast-charge.htm. 46. Marano, V., et al. Lithium-ion batteries life estimation for plug-in hybrid electric vehicles. in Vehicle
Power and Propulsion Conference, 2009. VPPC '09. IEEE. 2009. 47. Portal, T.D. Browse Energy and Climate Data. [cited 2014; Available from: http://www.tsp-data-
portal.org/Breakdown-of-Electricity-Generation-by-Energy-Source#tspQvChart. 48. World Energy Outlook 2013, 2013, International Energy Agency. 49. Flumerfelt, R.W. and S.S. Wang, Wind turbines, in AccessScience2013. 50. electricmountain.co.uk. Welcome to Electric Mountain. 2014; Available from:
http://www.electricmountain.co.uk/. 51. UK-National-Grid, Fast Reserve Service Description, in National Grid Electricity Transmission2013,
National Grid. 52. Sperling, D. and D. Gordon, Two Billion Cars: Driving Toward Sustainability. 2009: Oxford University
Press. 53. Lithium/Air Battery Project (Battery 500). 2010; Available from:
http://researcher.watson.ibm.com/researcher/view_project.php?id=3203. 54. Kopera, J. Inside the Nickel Metal Hydride Battery. 2004; Available from:
http://www.cobasys.com/pdf/tutorial/InsideNimhBattery/inside_nimh_battery_technology.html. 55. Girishkumar, G., et al., Lithium - Air Battery: Promise and Challenges. Journal of Physical Chemistry
Letters, 2010. 1(14): p. 2193-2203. 56. Krajacic, G., et al., Planning for a 100% independent energy system based on smart energy storage for
integration of renewables and CO2 emissions reduction. Applied Thermal Engineering, 2011. 31(13): p. 2073-2083.
57. Peterson, S.B., J.F. Whitacre, and J. Apt, The economics of using plug-in hybrid electric vehicle battery packs for grid storage. Journal of Power Sources, 2010. 195(8): p. 2377-2384.
58. Rathnayaka, D., et al., Identifying Prosumer's Energy Sharing Behaviours for Forming Optimal 56
Prosumer-Communities, in International Conference on Cloud and Service Computing2011, IEEE. 59. Worley, O. and D. Klabjan. Optimization of battery charging and purchasing at electric vehicle battery
swap stations. in Vehicle Power and Propulsion Conference (VPPC), 2011 IEEE. 2011. 60. Uchida, K., et al. Effect of energy conservation by adopted PV/SC system in subtropical regions. in
Industrial Electronics and Applications (ICIEA), 2010 the 5th IEEE Conference on. 2010. 61. Lund, H., Renewable energy strategies for sustainable development. Energy, 2007. 32(6): p. 912-919. 62. Wissner, M., The Smart Grid - A saucerful of secrets? Applied Energy, 2011. 88: p. 2509-2518. 63. EPRI, Estimating the Costs and Benefits of the Smart Grid, 2011, Electric Power Research Institute. 64. Marques, V., N. Bento, and P.M. Costa, The “Smart Paradox”: Stimulate the deployment of smart grids
with effective regulatory instruments. Energy, (0). 65. Obama, U.P. Securing American Energy. 2012; Available from:
http://www.whitehouse.gov/energy/securing-american-energy#energy-menu. 66. Reducing the UK's greenhouse gas emissions by 80% by 2050. 2014; Available from:
https://www.gov.uk/government/policies/reducing-the-uk-s-greenhouse-gas-emissions-by-80-by-2050. 67. EU greenhouse gas emissions and targets. 2014; Available from: http://ec.europa.eu/clima/policies/g-
gas/index_en.htm. 68. Lomborg, B., The Poverty of Renewables, in Project Syndicate2014: Miami. 69. Political leadership is lacking: Desertec founder laments lack of support, in Spiegel2012. 70. The Global Warming Policy Foundation. 2014; Available from: http://www.thegwpf.org/. 71. Schmeller, J., Germans grow sceptical over shift to renewables, in Deutsche Welle2013. 72. John Howard: One religion is enough, 2013, GWPF: London. 73. Birnbaum, M., Germany faces energy balancing act, in The Washington Post2012: Berlin. 74. Faiola, A., In Germany, going green gets expensive, in The Washington Post2009: Gelsenkirchen,
Germany. 75. Lomborg, B., Germany's energy policy is expensive, harmful and short-sighted, in Financial Times2014. 76. S Sudan "will not go to war" over oil dispute, in Al Jazeera2013. 77. Oil theft in Nigeria: A murky business, in The Economist2013. 78. Ukraine crisis: EU and US impose sanctions over Crimea, in BBC2014. 79. Schipani, A. and J.P. Rathbone, Oil at the heart of Venezuela's turmoil, in The Financial Times2014. 80. Crimean crisis. 2014; Available from: http://en.wikipedia.org/wiki/2014_Crimean_crisis. 81. US-EIA. WTI Spot Price FOB. 2014.
57


![[Smart Grid Market Research] India: Smart Grid Legacy, Zpryme Smart Grid Insights, September 2011](https://img.pdfslide.net/doc/110x75/541402518d7f7294698b47d4/smart-grid-market-research-india-smart-grid-legacy-zpryme-smart-grid-insights-september-2011.jpg)


![[Smart Grid Market Research] Smart Grid Index: November 2012 - Zpryme Smart Grid Insights](https://img.pdfslide.net/doc/110x75/541402018d7f728a698b47a5/smart-grid-market-research-smart-grid-index-november-2012-zpryme-smart-grid-insights.jpg)


![[Smart Grid Market Research] Brazil: The Smart Grid Network, Zpryme Smart Grid Insights, October 2011](https://img.pdfslide.net/doc/110x75/577d20871a28ab4e1e931ff6/smart-grid-market-research-brazil-the-smart-grid-network-zpryme-smart-grid.jpg)


![[Smart Grid Market Research] The Optimized Grid - Zpryme Smart Grid Insights](https://img.pdfslide.net/doc/110x75/541402188d7f7294698b47d2/smart-grid-market-research-the-optimized-grid-zpryme-smart-grid-insights.jpg)