Embed Size (px)
Citation preview
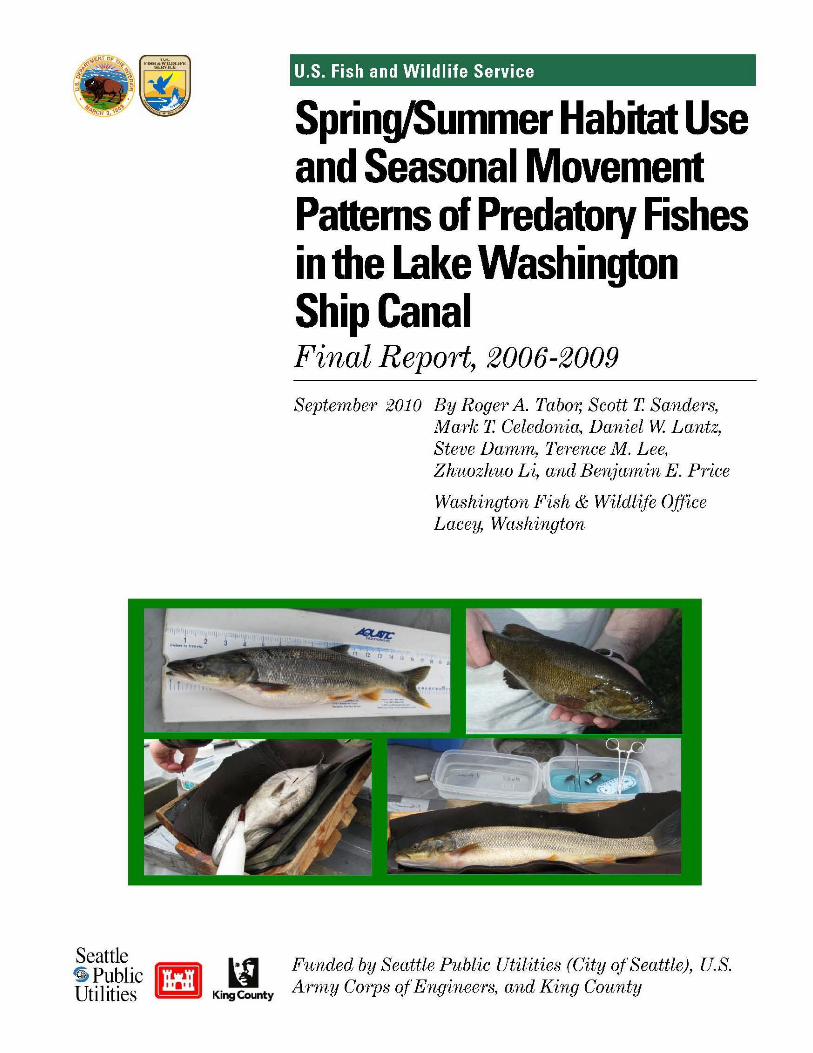


SPRING/SUMMER HABITAT USE AND SEASONAL MOVEMENT PATTERNS
OF PREDATORY FISHES IN THE LAKE WASHINGTON SHIP CANAL
FINAL REPORT, 2006-2009
to SEATTLE PUBLIC UTILITIES
by
Roger A. Tabor, Scott T. Sanders, Mark T. Celedonia, Daniel W. Lantz, Steve Damm,
Terence M. Lee, Zhuozhuo Li, and Benjamin E. Price
U.S. Fish and Wildlife Service
Washington Fish and Wildlife Office
Fisheries Division
510 Desmond Drive SE, Suite 102
Lacey, Washington 98503


LWSC Predator Acoustic Tracking, 2006-2009
FINAL DRAFT September 2010
ii
EXECUTIVE SUMMARY
Federally-protected Chinook salmon Oncorhynchus tshawytscha and other juvenile salmon
in the Lake Washington basin must migrate through the Lake Washington Ship Canal (LWSC), a
narrow, low-velocity artificial waterway. In this waterway, juvenile salmon are vulnerable to
predatory fishes, including the non-native smallmouth bass Micropterus dolomieu and
largemouth bass M. salmoides, and the native northern pikeminnow Ptychocheilus oregonensis.
Some diet and abundance information on these predatory fish has been collected (e.g., Fayram
and Sibley 2000; Tabor et al. 2004) but little is known about their habitat use and movement
patterns. Chinook salmon habitat use patterns in the LWSC have been characterized in
Celedonia et al. 2008b and Celedonia et al. 2010. The relationship between juvenile Chinook
salmon habitat use and predator habitat use is important to understand for management of
Chinook salmon in the Lake Washington system. This study used acoustic tracking methods to
define habitat use and movement of these juvenile salmon predatory fishes.
The objectives of this study were to 1) describe the habitat use patterns of smallmouth bass,
largemouth bass, and northern pikeminnow and determine their relationship to existing
overwater and in-water structures; and, 2) determine seasonal movement patterns of these
species, with particular emphasis on if and when they move between the LWSC and Lake
Washington.
To address these objectives, we conducted an acoustic tracking study to determine the spring
and summer habitat use and seasonal movement patterns of predatory fishes in the LWSC in
2006-2009. We used two separate systems to address our objectives: a fine-scale system to track

LWSC Predator Acoustic Tracking, 2006-2009
FINAL DRAFT September 2010
iii
fish over a small area in the LWSC and a course-scale system to track fish over a large area
within the LWSC, Union Bay, and Lake Washington for a longer time period.
The most intensive, fine-scale tracking was conducted at Gas Works Park and under the I-5
and University Bridges. Most tagged fish were smallmouth bass. Results showed smallmouth
bass inhabiting these sites areas commonly used overwater structures, areas of sparse vegetation,
vegetation edges, and areas with gravel and sand substrate. Smallmouth bass use primarily used
2-4 m deep water and were rarely in water that was more than 12 m deep. These are also areas
used occasionally by juvenile Chinook salmon during outmigration (Celedonia et al 2008b;
Celedonia et al. 2010).
Course-scale tracking revealed that predatory fish species exhibit varying movement
patterns. During most of the year, northern pikeminnow inhabit Lake Washington. However,
from May through August some of the tagged northern pikeminnow moved into the LWSC.
Here, they were concentrated close to shore during the day and were often associated with
vegetation. At night, northerm pikeminnow occupy a wide range of depths. It is possible that
northern pikeminnown in the LWSC may overlap with outmigrating juvenile Chinook salmon
habitats. However, because of the small number of northern pikeminnow moving into the
LWSC and their varied behaviors, this study implies that northern pikeminnow are generally not
a major predator of juvenile salmonids in the LWSC.
Course-scale tracking showed smallmouth bass have strong seasonal migration patterns. A
large portion of smallmouth bass in the LWSC migrate into Lake Washington between June and

LWSC Predator Acoustic Tracking, 2006-2009
FINAL DRAFT September 2010
iv
October and remain there until early spring. Smallmouth bass size is linked to these migrations,
with smaller fish being less likely to migrate into Lake Washington for overwintering.
Smallmouth bass return to the LWSC from Lake Washington between March and mid-April.
While smallmouth bass migrations may be partially driven by spawning behavior, their return to
the LWSC each year ensures that smallmouth bass inhabit the LWSC during the juvenile
Chinook salmon outmigration period.
The five largemouth bass tagged in the LWSC generally stayed in the LWSC or made
occasional forays into Union Bay. Their overlap with juvenile Chinook salmon in the LWSC is
still unknown. However, due the small number of largemouth bass successfully tagged and
tracked, more research is necessary on this predatory fish.
In improving habitat conditions for juvenile Chinook salmon in the LWSC, managers should
look to avoid improving habitat for predatory fishes, if possible. Efforts should focus on
reducing habitat for smallmouth bass. Unfortunately, smallmouth bass use a variety of habitat
types from open beaches to areas with overwater structures. However, large offshore, deep
structures like the University Bridge appear to attract smallmouth bass and probably increase the
overlap between smallmouth bass and juvenile salmonids. Because smallmouth bass appear to
have a discrete population in the LWSC, efforts to remove them could have positive effects on
salmonid populations. However, a high removal rate may be impractical and a removal program
may have to be continued over a long time period. Additional research is needed to look at the
density of smallmouth bass in different areas of the LWSC and in different habitats as well as
examine differences in diet.

LWSC Predator Acoustic Tracking, 2006-2009
FINAL DRAFT September 2010
v

LWSC Predator Acoustic Tracking, 2006-2009
FINAL DRAFT September 2010
vi
TABLE OF CONTENTS
EXECUTIVE SUMMARY .......................................................................................................... ii
LIST OF FIGURES .................................................................................................................... vii
LIST OF TABLES ....................................................................................................................... ix
LIST OF APPENDICES .............................................................................................................. x
INTRODUCTION......................................................................................................................... 1
STUDY SITE ................................................................................................................................. 2
HTI tracking system .................................................................................................................... 5
Vemco hydrophones/receivers .................................................................................................... 7
Fish collection and tagging ........................................................................................................ 8
Macrophyte surveys .................................................................................................................... 9
Data analysis-HTI ..................................................................................................................... 10
Data analysis-Vemco ................................................................................................................ 17
RESULTS .................................................................................................................................... 18
Spring/summer habitat use – smallmouth bass ......................................................................... 18
Seasonal movement patterns ..................................................................................................... 30
Northern pikeminnow............................................................................................................ 30
Smallmouth bass ................................................................................................................... 39
Largemouth bass ................................................................................................................... 49
DISCUSSION .............................................................................................................................. 51
Spring/summer habitat use - smallmouth bass ......................................................................... 51
Seasonal movements ................................................................................................................. 53
Northern pikeminnow............................................................................................................ 54
Smallmouth bass ................................................................................................................... 56
Largemouth bass ................................................................................................................... 59
Conclusions ............................................................................................................................... 60
ACKNOWLEDGEMENTS ....................................................................................................... 61
REFERENCES ............................................................................................................................ 62
APPENDICES ............................................................................................................................. 69
LWSC Predator Acoustic Tracking, 2006-2009
FINAL DRAFT September 2010
vii
LIST OF FIGURES
FIGURE 1. Map of lower Lake Washington basin displaying the various sections of the Lake Washington Ship Canal
(LWSC).. ..................................................................................................................................................... 3
FIGURE 2. Maps of lower Lake Washington basin displaying HTI tracking sites (Gas Works Park [orange] and I-
5/University Bridge site [yellow]) and Vemco receiver sites (numbers 1-11). ........................................... 6
FIGURE 3. Map of Gas Works Park site (top panel) and I-5/University Bridge site (bottom panel) showing depth
intervals (2-m contours) and hydrophone locations (X’s), May to August, 2007 and 2008. ..................... 13
FIGURE 4. Map of the I-5/University Bridge site showing the various habitat types, May to August, 2007 and 2008.
Descriptions of habitat types are given in Table 4. ................................................................................... 14
FIGURE 5. Map of the Gas Works Park site showing various habitat types, May to August, 2007 (top panel) and
2008 (bottom panel). ................................................................................................................................. 15
FIGURE 6. Map of the Gas Works Park site showing substrate (top panel) and shoreline types (bottom panel), May
to August, 2007 and 2008. ......................................................................................................................... 16
FIGURE 7. Length frequency (50-mm FL increments) of smallmouth bass collected and tagged (HTI acoustic tags)
at two sites in the Lake Washington Ship Canal, May-July 2007-2008.. .................................................. 19
FIGURE 8. Number and size category of acoustic-tagged smallmouth bass collected for two different years ............ 19
FIGURE 9. Mean proportion (± SE) of eight bottom depth categories (m) used by three size classes (mm FL) of
smallmouth bass at Gas Works Park, May-August 2007 and 2008. .......................................................... 21
FIGURE 10. Mean proportion (± SE) of five bottom depth categories (m) used by three size classes (mm FL) of
smallmouth bass at the I-5/University Bridge site, May-August 2007 and 2008. ..................................... 22
FIGURE 11. Percent of smallmouth bass with a positive selection ratio (ŵi > 1) for different depth categories (m) at
Gas Works Park and the I-5/University Bridge site, May-August 2007 and 2008 .................................... 23
FIGURE 12. Percent of smallmouth bass with a positive selection ratio (ŵi > 1) for five habitat types at Gas Works
Park, May-August 2007 and 2008. ............................................................................................................ 24
FIGURE 13. Percent of smallmouth bass with a positive selection ratio (ŵi > 1) for nine habitat types at the I-
5/University Bridge site, May-August 2007 and 2008 .............................................................................. 24
FIGURE 14. Day (yellow-red) and night (blue-purple) density plots of smallmouth bass 150-349 mm FL (day, n =
10; night, n = 7) at the I-5/University Bridge site, May-August 2007 and 2008 ....................................... 25
FIGURE 15. Day (yellow-red) and night (blue-purple) density plots of smallmouth bass 350-470 mm FL (day, n =
16; night, n = 10) at the I-5/University Bridge site, May-August 2007 and 2008 ..................................... 26
FIGURE 16. Percent of smallmouth bass with a positive selection ratio (ŵi > 1) for four substrate types at Gas Works
Park, May-August 2007 and 2008 ............................................................................................................. 27
FIGURE 17. Day (yellow-red) and night (blue-purple) density plots of two sizes of smallmouth bass at Gas Works
Park site, May-August 2007 and 2008 ..................................................................................................... 28
FIGURE 18. Percent of smallmouth bass with a positive selection ratio (ŵi > 1) for three shoreline types at Gas
Works Park, May-August 2007 and 2008 ................................................................................................ 29
FIGURE 19. Number and size category of acoustic-tagged northern pikeminnow collected for three different years.
................................................................................................................................................................... 31
FIGURE 20. Number of tagged northern pikeminnow that moved to Lake Washington after release ......................... 31
FIGURE 21. Daily (top panel) and hourly (bottom panel) movement of northern pikeminnow #17222 between Lake
Washington and the LWSC, July 2006 – February 2008 ......................................................................... 32
FIGURE 22. Daily (top panel) and hourly (bottom two panels) movement of northern pikeminnow #22507 between
Lake Washington and the LWSC, May 2008 – July 2009. ....................................................................... 33
LWSC Predator Acoustic Tracking, 2006-2009
FINAL DRAFT September 2010
viii
FIGURE 23. Hourly locations of northern pikeminnow #22506 based on four fixed receivers, June-July 2008. The
receiver locations are arranged (top to bottom) from the furthest east to furthest west ............................. 34
FIGURE 24. Hourly locations of northern pikeminnow #221 and #4355 based on four fixed receivers, May-June
2007 ........................................................................................................................................................... 34
FIGURE 25. Hourly movements of northern pikeminnow #22506 based on three fixed receivers, June 16-June 21,
2008. Shaded bars indicate times of low light conditions (dusk to dawn) ............................................... 36
FIGURE 26. Depth distribution (m) of northern pikeminnow #221, May 30 – June 10, 2007 .................................... 37
FIGURE 27. Mean daily depth (m) of northern pikeminnow in Lake Washington, May – December 2007 ............... 37
FIGURE 28. Depth distribution (m) of northern pikeminnow #111 and #112 in Lake Washington, 2007 .................. 38
FIGURE 29. Mean monthly depth (m) of northern pikeminnow #119 in Lake Washington, 2007 .............................. 39
FIGURE 30. Number and size category of acoustic-tagged smallmouth bass collected for three different years ....... 40
FIGURE 31. Number of tagged LWSC smallmouth bass (n = 72) that either migrated to Lake Washington (migrants),
remained in the LWSC (residents), or their seasonal movements could not be determined (other) .......... 40
FIGURE 32. Relationship between smallmouth bass fork length (mm) and date they left the LWSC and migrated to
Lake Washington. Fish were divided into the three areas where they were captured and released. .......... 41
FIGURE 33. Weekly number of tagged smallmouth bass (SMB, solid lines) that returned to the LWSC and water
temperatures (temp., dashed lines) in Montlake Cut (1 m depth; King County water quality station) ....... 42
FIGURE 34. Daily movement of two smallmouth bass between Lake Washington and the LWSC, May 2006 – June
2008. Union Bay denotes that the fish was detected at the west end of Union Bay ................................... 43
FIGURE 35. Furthest west detection of smallmouth bass (2007 and 2008) that returned to the LWSC from tagging
the previous year ........................................................................................................................................ 44
FIGURE 36. Photo of smallmouth bass #210 that was recaptured in north Portage Bay, LWSC, June 4, 2007 .......... 44
FIGURE 37. Percent of smallmouth bass (n = 39) that were located (mobile tracking) in different areas of Lake
Washington, 2006 and 2007 ........................................................................................................................ 46
FIGURE 38. Mean daily depth (m) of smallmouth bass #117 in three areas of the lower Lake Washington basin, May
– December 2007. ....................................................................................................................................... 47
FIGURE 39. Mean daily depth (m) of eight smallmouth bass in the Lake Washington Ship Canal (SC; dashes) and
Lake Washington (Lk; diamonds) ............................................................................................................... 47
FIGURE 40. Depth distribution (m) of four smallmouth bass in the Lake Washington Ship Canal, 2007 ................... 48
FIGURE 41. Hourly locations (black line) of largemouth bass #17188 based on seven fixed receivers, July 2006 –
September 2008 ........................................................................................................................................... 50
FIGURE 42. Water column depth distribution of two smallmouth bass near the west end of the SR 520 bridge, Lake
Washington, May-June 2007 ....................................................................................................................... 53

LWSC Predator Acoustic Tracking, 2006-2009
FINAL DRAFT September 2010
ix
LIST OF TABLES
TABLE 1. List of locations where a Vemco VR2 fixed receiver was deployed. ............................................................ 7
TABLE 2. Vemco acoustic tag specifications and the number deployed. ...................................................................... 8
TABLE 3. Five littoral (< 10 m deep) habitat types used to determine habitat selection at the Gas Works Park site,
May-August, 2007 and 2008. ...................................................................................................................... 11
TABLE 4. Nine habitat types used to determine habitat selection at the I-5/University Bridge site, May-August, 2007
and 2008. ..................................................................................................................................................... 12
TABLE 5. Number of predatory fish that were tagged with HTI acoustic tags at two study sites in the Lake
Washington Ship Canal, May-July 2007-2008. ........................................................................................... 18
TABLE 6. Largemouth bass tagged with HTI acoustic tags in the LWSC in 2007. ..................................................... 29
TABLE 7. Largemouth bass tagged with Vemco acoustic tags in the LWSC in 2006 ................................................. 49
LWSC Predator Acoustic Tracking, 2006-2009
FINAL DRAFT September 2010
x
LIST OF APPENDICES
APPENDIX 1. Smallmouth bass tagged with HTI acoustic tags in the LWSC in 2007 and 2008. Release site is the
area where the fish were captured and released.. .................................................................................. 70
APPENDIX 2. Northern pikeminnow tagged with Vemco acoustic tags in the LWSC, 2006-2008. ........................... 71
APPENDIX 3. Smallmouth bass tagged with Vemco acoustic tags in the LWSC in 2006. ......................................... 72
APPENDIX 4. Smallmouth bass tagged with Vemco acoustic tags in the LWSC in 2007 and 2008. .......................... 73

LWSC Predator Acoustic Tracking, 2006-2009
FINAL DRAFT September 2010
xi

LWSC Predator Acoustic Tracking, 2006-2009
FINAL DRAFT September 2010
1
INTRODUCTION
The Lake Washington Ship Canal (LWSC) is a narrow, low-velocity artificial waterway at
the downstream end of the Lake Washington basin that juvenile salmonids must pass through to
reach the marine environment. Juvenile salmonids that pass through this waterway include
Chinook salmon Oncorhynchus tshawytscha which is part of the Puget Sound evolutionarily
significant unit and are considered threatened under the federal Endangered Species Act. The
LWSC is in a highly urbanized area with numerous commercial and recreational activities and
information on the relationship between these activities and juvenile Chinook salmon is needed
to improve shoreline management. Part of the basic information needed on juvenile Chinook
salmon is information on their predators. For example, there are several proposed development
projects in the LWSC, and in planning for these projects, shoreline and land use planners and
fishery managers also need to assess how the projects will influence predators of juvenile
Chinook salmon. Also, planners need to look for potential restoration projects in the LWSC that
could improve juvenile salmonid habitat and reduce predator habitat.
As salmon smolts outmigrate to the marine environment, they are vulnerable to a variety of
predators including birds, mammals, and fishes. Predation levels can be high because the high
abundance of salmon smolts can alter the functional (increase in predation rates) and numerical
(increase in predator abundance) responses of predators. Additionally, anthropogenic changes
such as dams and streamflow changes can exacerbate the vulnerability of smolts to predation.
As juvenile salmonids pass through the LWSC they are vulnerable to a variety of predators.
Principal predators include two species of introduced black bass (smallmouth bass Micropterus
dolomieu, and largemouth bass M. salmoides) and a native cyprinid (northern pikeminnow
Ptychocheilus oregonensis)(Tabor et al. 2004). Other predators such as cutthroat trout and
piscivorous birds are abundant in nearby Lake Washington but their abundance in the LWSC is
not well known. Anecdotally, they appear to be present in the LWSC but not abundant and may
have a minimal impact on salmon populations in this area.
The habitat use and movement patterns of predatory fishes in the LWSC are not well known.
Initial research was conducted in 2004 and 2005 but few fish were successfully tracked
(Celedonia et al. 2008b). Additionally, the movement patterns of predatory fishes between Lake
Washington and the LWSC are not known.
Smallmouth bass are native to the Great Lakes and Mississippi River basins and have been
introduced widely throughout temperate North America including the Pacific Northwest
(MacCrimmon and Robbins 1975). In some cases, they have been shown to have serious
negative impacts on native fish populations (Vander Zanden et al. 1999; MacRae and Jackson
2001; Jackson 2002; Weidel et al. 2007). In rivers and lakes of the Pacific Northwest, they often
consume juvenile salmonids. However, their overall impact on salmonid populations is usually
not well understood (Bennett et al. 1991; Fayram and Sibley 2000). In the LWSC, salmonids
comprise approximately half of their overall diet from May through July (Tabor et al. 2007). An
estimated 11,550 Chinook salmon Oncorhynchus tshawytscha, 10,700 coho salmon O. kisutch,
and 9,150 sockeye salmon O. nerka are consumed annually by smallmouth bass in the LWSC
(Tabor et al. 2007).

LWSC Predator Acoustic Tracking, 2006-2009
FINAL DRAFT September 2010
2
Largemouth bass are native to much of eastern North America and have been widely
introduced in North America including the Pacific Northwest (MacCrimmon and Robbins 1975).
Because they are not common in rivers of the Pacific Northwest, their overlap with juvenile
salmonids is generally much less than that of smallmouth bass. Their greatest impact appears to
be in rearing lakes of juvenile coho salmon (Reimers 1989; Bonar et al. 2005). In the LWSC,
nonsalmonid fishes make up most of the diet of largemouth bass with juvenile salmonids
comprising less than 20% of the overall diet from May to July. An estimated 650 Chinook
salmon, 2,050 coho salmon, and 3,900 sockeye salmon are consumed annually by largemouth
bass in the LWSC (Tabor et al. 2007).
Because northern pikeminnow are abundant in Lake Washington (Brocksmith 1999) and
known congregate in areas where juvenile salmonids are abundant, they may be an important
predator in the LWSC. Northern pikeminnow are a native piscivore that inhabits lakes and large
rivers in the Pacific Northwest. Because they can be abundant and often prey heavily on juvenile
salmonids, they are considered the principal predator of juvenile salmonids is many areas. They
have been shown to especially congregate around dams (Beamesderfer and Reiman 1991) and at
the outlets of hatchery facilities (Collis et al. 1995) to prey on juvenile salmonids. Northern
pikeminnow are an opportunistic predator that consumes a wide variety of prey types including
fish, invertebrates, plant material, and dead animals (Tabor et al. 1993; Petersen et al. 1994;
Shively et al 1996). In the LWSC, their diet consists primarily of either signal crayfish
Pacifastacus leniusculus or juvenile salmonids (Tabor et al. 2004). However, little information
is available on their abundance in the LWSC and their overall consumption of smolts is not
known (Tabor et al. 2004; Beauchamp et al. 2007).
Objectives: Our objectives of this study were to 1) describe the habitat use patterns of
smallmouth bass, largemouth bass, and northern pikeminnow and determine their relationship to
existing overwater and in-water structures; and, 2) determine seasonal movement patterns of
these species, with particular emphasis on if and when they move between the LWSC and Lake
Washington. To answer these questions, we tagged predatory fishes in 2006-2008 with acoustic
tags and documented their spring/summer habitat use and seasonal movements.
STUDY SITE
The LWSC and Lake Washington comprise the lower portion of the Lake Washington basin,
which is approximately 1,570 km2 and ranges in elevation from 6 to 1,650 m. The eastern 14%
(by area) of the basin lies within the Cascade Range, while the western 86% is part of the Puget
Sound lowlands. Much of the basin is heavily urbanized with over a million people inhabiting
the basin. Much of the City of Seattle is within the basin. The basin has undergone numerous
anthropogenic changes over the past 150 years.
The LWSC is a 13.8-km-long artificial waterway that is located between Lake Washington
and Puget Sound. The LWSC consists of five sections: Montlake Cut, Portage Bay, Lake Union,
Fremont Cut, and the Salmon Bay waterway (Figure 1). The largest part of the LWSC is Lake
Union, which is 235 ha in size and has a mean depth of 9.8 m. The shorelines of Portage Bay,
Lake Union, and Salmon Bay are highly developed with numerous marinas, commercial
shipyards, and house boat communities. The Fremont Cut and Montlake Cut are narrow

LWSC Predator Acoustic Tracking, 2006-2009
FINAL DRAFT September 2010
3
channels with steep banks. The Ballard Locks, located at the downstream end of the LWSC,
controls the water level of the LWSC as well as Lake Washington. During winter (December to
February) the water level is kept low at an elevation of 6.1 m. Starting in late February the water
level is slowly raised from 6.1 m in January to 6.6 m by May 1 and 6.7 m by June 1.
FIGURE 1. Map of lower Lake Washington basin displaying the various sections of the Lake Washington Ship
Canal (LWSC). Location of study area in western Washington is also shown.
LWSC Predator Acoustic Tracking, 2006-2009
FINAL DRAFT September 2010
4
Upstream of the LWSC is Lake Washington, a large monomictic lake with a total surface
area of 9,495 hectares and a mean depth of 33 m. The lake typically stratifies from June through
October. Surface water temperatures range from 6-7oC in winter to over 20 C in summer. Over
78% of the shoreline is comprised of residential land use. The largest tributary to Lake
Washington is the Cedar River which enters the lake at the south end. The other major tributary
to Lake Washington is the Sammamish River, whose watershed includes Bear Creek, Lake
Sammamish, Issaquah Creek, and several small tributaries.
Compared to other similar-sized basins in the Pacific Northwest, the Lake Washington basin
is inhabited by a relatively large number of fish species, including 25 native species (primarily
salmonids, cottids Cottus spp., and cyprinids) and at least 15 introduced species. Large
populations of the native cyprinids, peamouth Mylocheilus caurinus and northern pikeminnow,
occur in Lake Washington and Lake Sammamish. Largemouth bass were initially planted in the
system in 1890 (Stein 1970). The history of smallmouth bass planting in Lake Washington is
less clear, but records suggest that smallmouth bass have been present since at least 1930
(Lampman 1946).
Anadromous salmonids in the Lake Washington basin include sockeye salmon, Chinook
salmon, coho salmon, and steelhead. Sockeye salmon are by far the most abundant anadromous
salmonid in the basin with adult returns of sockeye salmon exceeding 350,000 fish in some years
(Fresh and Lucchetti 2000). The major source of natural production is the Cedar River with
additional production from smaller tributaries in the north end of the basin. The sockeye salmon
run is also supplemented with fry production from the Washington Department of Fish and
Wildlife (WDFW) Cedar River Hatchery. The largest run of naturally-produced Chinook
salmon in the Lake Washington basin also occurs in the Cedar River. Adult fish also spawn in
Bear Creek. Adult coho salmon spawn in numerous small tributaries as well as all the major
streams. Hatchery-produced juvenile Chinook salmon and coho salmon are released from the
WDFW Issaquah Creek Hatchery, located near the south end of Lake Sammamish, and from the
University of Washington (UW) Hatchery, located on Portage Bay of the LWSC.
Historically, the Duwamish River watershed, which included the Cedar River, provided both
riverine and estuarine habitat for indigenous anadromous salmonids. Beginning in 1912,
drainage patterns of the Cedar River and Lake Washington were extensively altered (Weitkamp
and Ruggerone 2000). Most importantly, the Cedar River was diverted into Lake Washington
from the Duwamish River watershed, and the outlet of the lake was rerouted through the LWSC.
These activities changed fish migration routes and environmental conditions encountered by
migrants.
METHODS
To determine the spring/summer habitat use and seasonal movement patterns of smallmouth
bass, largemouth bass, and northern pikeminnow in the LWSC, we used two separate tracking
systems. Spring/summer habitat use was determined with a fine-scale tracking system (HTI
tracking system). This system allowed us to obtain exact fish positions (sub-meter resolution)
throughout the day and night. However, because of cost constraints and system limitations, we
LWSC Predator Acoustic Tracking, 2006-2009
FINAL DRAFT September 2010
5
could only track fish in a relatively small area (maximum, approximately 28 ha) over a short
period (1-2 months). A separate system (Vemco receivers) was used to determine seasonal
movement patterns. The use of long-lasting tags (6 months – 2 years) and several independent
receivers placed strategically in the LWSC and Lake Washington enabled us to determine large-
scale movement patterns over a much longer period.
HTI tracking system
Predators were tracked in the LWSC at two locations: 1) I-5/University Bridge area and 2)
Gas Works Park (Figure 2). These sites were chosen because these sites were also Chinook
salmon smolt tracking sites (Celedonia et al. 2010), predators were known to be common, and
they encompassed a relatively large area. Tracking was performed using a fine-scale acoustic
system developed by Hydroacoustic Technology, Inc. (HTI), Seattle, Washington. This system
uses acoustic tag transmitters implanted within the study fish, and a fixed array of
omnidirectional hydrophones to track fish movements in a specific study area. Tag transmitters
are programmed to periodically emit a signal, or ping. The length of time between each ping is
called the ping rate. Each fish is given a unique ping rate so that movements of individual fish
can be tracked. When a tagged fish moves through or near a hydrophone array, each ping is
detected by the hydrophones at slightly different times depending on how far the fish is from
each hydrophone. The system then uses these time differentials to triangulate a 3-dimensional
position for the origin of each ping. Calculated positions are relatively accurate, estimated to be
0.5 m in the horizontal plane when the fish is within the perimeter of the hydrophone array.
Accuracy declines outside the array perimeter, but has been estimated to be approximately 3 m
in the horizontal plane at a distance of 1 array width from the array perimeter. In general, we
accepted calculated fish positions from both within and outside the array perimeters. We
excluded positions that were apparently beyond the area that the equipment could effectively
track.
All of the hydrophones in a given array are cabled into a shared receiver (HTI Model 290
Acoustic Tag System) which processes tag pings and other acoustic signals detected by the
hydrophones. Each receiver is connected to a personal computer that logs the acoustic data.
We either used HTI Model 795E tags (20 day; 1.5 g) or Model 795M tags (12 day; 0.75 g) to
tag small-sized bass (< 200 mm FL). For larger bass and northern pikeminnow, we primarily
used HTI Model 795G tags (60 day; 4.4 g). In 2007, tags were single-pulsed; whereas, in 2008
they were double-pulsed. Double-pulsing the tags reduces the battery life approximately 30-40%
but the data files can be processed reliably with HTI autotracking software, which significantly
reduces the amount of data processing. Data files for single-pulse tags generally need to be
processed manually, especially for an area like LWSC, which has a large amount of background
noise due to boating activity. The HTI autotracking software searched data files from both sites
for all smallmouth bass tagged in the LWSC, regardless of where they were tagged.
Additionally, we also searched for predatory fish captured and released at the west end of the SR
520 bridge (Celedonia et al. 2009). In 2007, we searched for tagged fish released at Gas Works
Park in the I-5/University Bridge data files, but due to time constraints, we did not look for I-
5/University Bridge fish in Gas Works Park data files.
LWSC Predator Acoustic Tracking, 2006-2009
FINAL DRAFT September 2010
6
FIGURE 2. Maps of lower Lake Washington basin displaying HTI tracking sites (Gas Works Park [orange] and I-
5/University Bridge site [yellow]) and Vemco receiver sites (numbers 1-11). The area around each Vemco receiver
indicates the approximate coverage area (approximately 350 m from receiver). Description of each Vemco site is
given in Table 1. Five areas of Lake Washington are also shown.
LWSC Predator Acoustic Tracking, 2006-2009
FINAL DRAFT September 2010
7
Vemco hydrophones/receivers
To track the seasonal movements of predatory fishes and movement between the LWSC and
Lake Washington, we deployed Vemco VR2 receivers. The VR2 is a self-contained,
submersible unit with a built-in omni-directional hydrophone and has a lithium battery that lasts
approximately 15 months. Receivers logged the date, time, identification code, and depth of any
acoustic tag in its listening range. In general, the VR2s can detect tags that are within 300-400
m. We deployed six receivers throughout the LWSC (Table 1; Figure 2). Another receiver was
deployed at the west end of Union Bay, which is a transition area between Lake Washington and
the LWSC. Two additional receivers were deployed in Lake Washington at the east end of
Union Bay (Figure 2). The VR2s were typically downloaded once every one to two months.
The VR2 in Salmon Bay was removed in 2007 because few fish were detected at this site. As
part of an adult sockeye salmon tracking project, the Muckleshoot Indian Tribe (MIT) also had
two additional VR2s in Lake Washington (Table 1) which could also detect our tags. These data
were added to our dataset.
TABLE 1. List of locations where a Vemco VR2 fixed receiver was deployed. The receiver numbers correspond
to the locations shown in Figure 2. LWSC = Lake Washington Ship Canal; USFWS = U.S. Fish and Wildlife
Service, MIT = Muckleshoot Indian Tribe.
Number Site name Water body Agency Start date End date Days (Dates) not functioning
1 Fishermen's Terminal LWSC - Salmon Bay USFWS 20-Apr-06 5-Feb-07
2 King County Lab LWSC - Fremont Cut USFWS 2-May-06 27-Apr-09 15 (18-Apr to 3-May-07)
3 Northwest Lake Union LWSC - Lake Union USFWS 20-Apr-06 27-Apr-09 20 (18-Apr to 8-May-07)
4 South Lake Union LWSC - Lake Union USFWS 8-May-06 4-Sep-08
5 University Bridge LWSC - Lake Union USFWS 21-Jun-06 15-Sep-09
6 UW Hatchery LWSC - Portage Bay USFWS 2-May-06 15-Sep-09
7 UW Rowing Center Transition - L. Washington/LWSC USFWS 1-May-06 22-Jun-09 59 (20-Nov-07 to 18-Jan-08)
8 Webster Point Lake Washington USFWS 31-May-06 15-Sep-09 13 (11 to 24-Apr-07)
9 Lakeshore Condos Lake Washington USFWS 2-May-06 15-Sep-09 14 (11 to 25-Apr-07)
10 West I-90 Bridge Lake Washington MIT 20-Apr-06 15-Sep-09 253 (1-Jan to 10-Sep-08)
11 St. Edwards Park Lake Washington MIT 21-Jul-06 5-Nov-07 180 (11-Nov-06 to 10-May-07)
To supplement data from the fixed VR2s, we periodically conducted mobile surveys of
LWSC and Lake Washington. In most cases, we slowly boated along the shoreline
(approximately 30 m from shore) of the LWSC and Lake Washington. We attempted to survey
at least once every three months (January-March; April-June; July-September; October-
December). We typically did not survey Salmon Bay in the LWSC and the north (north of St.
Edwards Park) and south (south of Mercer Island) end of Lake Washington because of time
constraints and few fish were detected. Each time a fish was detected, a GPS location was
obtained. The boat location was used as the approximate location of the fish. The mobile
receiver and omni-directional hydrophone have a listening range of approximately 300 m. The
MIT also conducted weekly mobile surveys of the LWSC and Lake Washington from July to
October in 2006 and 2007. Detections of our fish by their mobile receiver were incorporated
into our dataset.

LWSC Predator Acoustic Tracking, 2006-2009
FINAL DRAFT September 2010
8
We used both regular Vemco coded tags and depth (pressure) tags (Table 2). We used coded
Vemco tags that were programmed to emit an identification signal at random intervals (most tags
were set at 30-90 seconds). Each tag had a unique code. All Vemco tags were on the same
frequency: 69.0 kHz. Depth tags had an accuracy of ± 0.3 m. Depth tags used in 2007 had two
alternating identification codes; the first code provided the depth information and the second
code provided the unique code. In general, bass < 300 mm FL and northern pikeminnow < 400
mm FL were implanted with V9 and V9P (depth) tags, while larger fish were often implanted
with V13 and V13P tags. Because of tag availability and several fish were implanted with two
tags (a Vemco and a HTI tag), the exact tag size used varied. Except for a few fish, the total tag
weight was less than 3% of the body weight.
TABLE 2. Vemco acoustic tag specifications and the number deployed. Weight is the weight in air. Delay is the
minimum and maximum number of seconds between when an identification signal was emitted. Battery life is the
minimum tag life listed by the manufacturer; in some cases, the actual battery life was substantially longer.
Type Diameter Length Weight Output Delay Battery life
model (mm) (mm) (g) (dB at 1 m) (s) (days) 2006 2007 2008
Regular coded tags
V9-1L 9 24 3.6 142 30-90 157 8 0 0
V9-2L 9 29 4.7 142 20-60 156 5 0 0
30-90 290 0 11 0
60-120 417 0 4 3
V9-6L 9 21 2.9 142 30-90 79 5 0 0
V13-1L 13 36 11.0 147 20-60 334 24 1 0
30-90 616 0 13 7
Totals 42 29 10
Depth tags
V9P-1L 9 40 5.2 143 20-60 72 5 0 0
V9P-2L 9 47 6.4 143 30-90 249 0 10 0
V13P-1L 13 45 12.0 150 20-60 280 0 12 0
30-90 518 1 2 0
Totals 6 24 0
Number deployed
Fish collection and tagging
A variety of techniques were used to collect predatory fishes. Fish were collected through
angling, gill nets, beach seines, or baited trot lines. Smallmouth bass were collected primarily
through angling, while northern pikeminnow were collected primarily with gill nets. Catch rates
of largemouth bass were low for each gear type; however, most were collected during beach
seining.
We used variable-mesh, monofilament nylon gill nets, which consisted of 2.5, 3.2, 3.8, 5.1,
and 6.4-cm square-mesh panels. The nets were 38 m long and 2.4 m high. Two or three nets
were set each sampling night. Nets were set at dusk or night and retrieved 1.5 to 2 h later to
minimize the amount of time fish were in the net. Nets were set in approximately 5 to 10 m deep
water. To minimize stress to fish, we slowly brought the nets to the boat. When we observed a
LWSC Predator Acoustic Tracking, 2006-2009
FINAL DRAFT September 2010
9
predatory fish in the net, we left the net in the water and put a landing net under the fish. The
gill-net mesh around the fish was then cut to free the fish.
Additionally, we used a beach seine that was 30-m long and 3.7 m deep with 38-mm stretch
mesh in the wings and 9-mm stretch mesh in the wings. We identified four locations where we
could effectively use a beach seine: 1) east side of Gas Works Park, 2) south shoreline under I-5
Bridge, 3) North Portage Bay along UW shoreline, and 4) West Montlake Park. Beach seining
was done at night to increase the probability of encircling large predatory fish. In 2006, we also
attempted to increase our catch of northern pikeminnow by setting a baited trot line. The trot
line consisted of a series of baited hooks that were attached to lead line and set on the bottom
where the depth was 5-10 m deep. Earthworms were used as bait.
Collection efforts for fish to be implanted with HTI tags were conducted within the coverage
area of the HTI hydrophone array. For fish to be implanted with Vemco tags, most collection
efforts occurred in the LWSC between Fremont Cut and Montlake Cut; however, to increase our
sample size of northern pikeminnow, we did tag some that were caught in Lake Washington near
Union Bay as part of another study (Celedonia et al. 2008b).
After capture, fish were placed in an aerated cooler and transported to the University of
Washington (UW) pier where they were tagged. All tags were implanted using a surgical
procedure. All surgical instruments and tags were sterilized in a solution of distilled water and
2-5% Nolvasan ® disinfectant. Instruments and tags were allowed to soak for ≥ 5 min, then
rinsed in a 5-10% saline bath. Fish were anesthetized in a solution of MS-222 buffered with
sodium bicarbonate. Most fish were adequately anesthetized within 3 min. Anesthetized fish
were removed from the MS-222 solution, washed with cool fresh water, and measured for length
and weight. Fish were placed in a customized surgical platform with their ventral side facing
upwards. During the surgery, the gills were irrigated with MS-222 solution at 15-30 s intervals.
An incision approximately 10-20 mm long was made between the pectoral and pelvic fins. One
or two tags were then inserted into the peritoneal cavity through the incision. Two or three
sutures of 3-0 coated Vicryl® braided suture material were used to close the incision. Fish were
then placed in a recovery tank of fresh water. The entire operation was usually completed in 5-8
min. Fish were allowed to recover before being released at their approximate capture location.
Macrophyte surveys
To assess habitat use of predatory fishes, we also collected field data on aquatic macrophytes
in 2007 and 2008. We used a point-intercept method to survey macrophytes. Transects were
established at approximate 20-m intervals perpendicular to shore, and survey points were
established at approximate 15-m intervals along each transect. A GPS unit was used to navigate
a boat to each pre-established point. At each point, an underwater camera was lowered from the
boat and the following data were collected: presence/absence of macrophytes; density of
macrophytes; species of macrophyte(s) present; water column depth to top of macrophytes; and
total water column depth. Macrophyte density was categorized according to ocular coverage
within the viewing area of the camera: > 75% cover was categorized as “dense”; 25-75% was
“moderate”; and 1-25% was sparse. Areas with < 1% cover were considered unvegetated.
Transects were surveyed to a depth of 10-11 m, which was the maximum depth macrophytes

LWSC Predator Acoustic Tracking, 2006-2009
FINAL DRAFT September 2010
10
were expected. When presence/absence of macrophytes differed between two sequential points
(e.g., present at one point, but not at the next), we attempted to locate a more precise location for
the edge. The following numbers of points were surveyed: University Bridge, n2007 = 117, n2008=
175; Gas Works Park, n2007 = 170, n2008= 188. We used the Spatial Analyst Spline tool in
ArcGIS 9.2 to generate macrophyte density contours based on survey point data. For splining,
we used n = 5 points and regularized with a weight value of 0.1.
In 2007, macrophyte surveys were conducted July 17-18 at the Gas Works Park site and
August 7-8 at the I-5/University Bridge site. In 2008, surveys were conducted August 12-13 at
the Gas Works Park site and July 22 and 28 at the I-5/University Bridge site. Additionally,
macrophyte distribution and growth was monitored at a few locations at the I-5/University
Bridge site. This sampling was conducted once per week in 2008 from June 19 to July 16. This
monitoring as well as monitoring at a site on the west end of the SR 520 bridge (Celedonia et al.
2009), indicated there was limited horizontal change in the size of macrophtye beds from mid-
June to late-July. There was no discernable change in macrophyte density during the study
period. At both sites, aquatic macrophytes grew 0.4-1.2 m closer to the surface of the water
during the study period. Overall, we felt macrophyte growth may have some effect of habitat
selection but its effect would be small in comparison to the main habitat effects and could be
easily confounded by other variables (e.g., spawning activity, prey availability, water
temperature and other environmental conditions); therefore, we pooled data across the sampling
period.
Data analysis-HTI
Raw fish location point data output from the AcousticTag software was imported into
ArcMap 9.2 Geographic Information System (GIS) software. Fish tracks were graphically
represented and analyzed by overlaying them on an orthophoto with bathymetry and vegetation
contours. Orthophoto and bathymetry data were obtained from Seattle Public Utilities (SPU).
Bathymetry was checked against depth measurements collected during aquatic macrophyte
surveys. SPU bathymetry data were generally accurate; however, some adjustments were
necessary at depths ≤ 4 m.
The total horizontal area of each habitat category contained within the tracking area was
considered the availability of that category. For each fish, the proportion of points lying within
each habitat or depth category was used as a surrogate for the amount of time spent in that
habitat or water column depth. This assumes that the probability of obtaining a data point is
equal throughout the array coverage area, and that array coverage is not biased for or against any
habitat types or depth categories. The point data for each fish were separated into appropriate
habitat and depth categories using standard tools in ArcMap 9.2.
Data points for the first 24 h after release were not used to allow time for the fish to recover
and start to behave naturally. Predator tracking data were separated into dawn, day, dusk, and
night time periods to examine diel behavior. Selection for the various habitat features (habitat
type, shoreline type, substrate, and depth selection) was estimated by comparing the number of
LWSC Predator Acoustic Tracking, 2006-2009
FINAL DRAFT September 2010
11
data points observed in each habitat category to the amount that was available. Selection ratios
(Manly et al. 2002) were calculated for each fish as:
)/()/(ˆiii uuw ,
where ui+ is the amount of time spent by all fish in habitat or depth i, u++ is the amount of time
spent by all fish in all habitats or depths within the study area, and i is the proportion of
available habitat feature in category i relative to all available habitats at the study site.
For depth selection (inshore versus offshore), the tracking area was segregated into water
column depths at 2 m intervals (i.e., 0-2 m, 2-4 m, etc.; Figure 3). The water level in the LWSC
remains the same in May and June and then slowly decreases by 0.1 m during July. We assumed
that water level fluctuations had a minimal effect on our depth selection calculations. Habitat
selection was determined by dividing the tracking areas into various habitat types based on
density of aquatic macrophytes and proximity to overwater structures (Tables 3 and 4; Figures 4
and 5). We also determined substrate selection for the Gas Works Park site. We used data
collected by Floyd/Snider and SPU. We combined their data into four categories (silt, sand/silt,
gravel/sand, and cobble/boulder; Figure 6). For habitat and substrate selection, we only included
areas where the depth was 0-10 m deep; smallmouth bass were rarely in areas outside of this
depth interval. No substrate information was available for the I-5/University site.
TABLE 3. Five littoral (< 10 m deep) habitat types used to determine habitat selection at the Gas Works Park site,
May-August, 2007 and 2008. The total area of these habitats was 2.73 ha in 2007 and 3.42 ha in 2008. The large,
open offshore area (> 10 m deep) within our coverage area was not considered in our analysis because smallmouth
bass rarely used that area.
Habitat type Description 2007 2008 2007 2008
Dense vegetation Area of dense macrophytes 0.061 0.260 2.23 7.61
Moderate vegetation Area of moderate macrophytes 0.126 0.208 4.61 6.09
Sparse vegetation Area of sparse macrophytes 0.218 0.285 7.97 8.34
Vegetation edge Area that is within 5 m of macrophytes 0.239 0.327 8.74 9.57
Open areas Open area that is not near vegetation 2.090 2.336 76.44 68.38
Area (ha) Percent
LWSC Predator Acoustic Tracking, 2006-2009
FINAL DRAFT September 2010
12
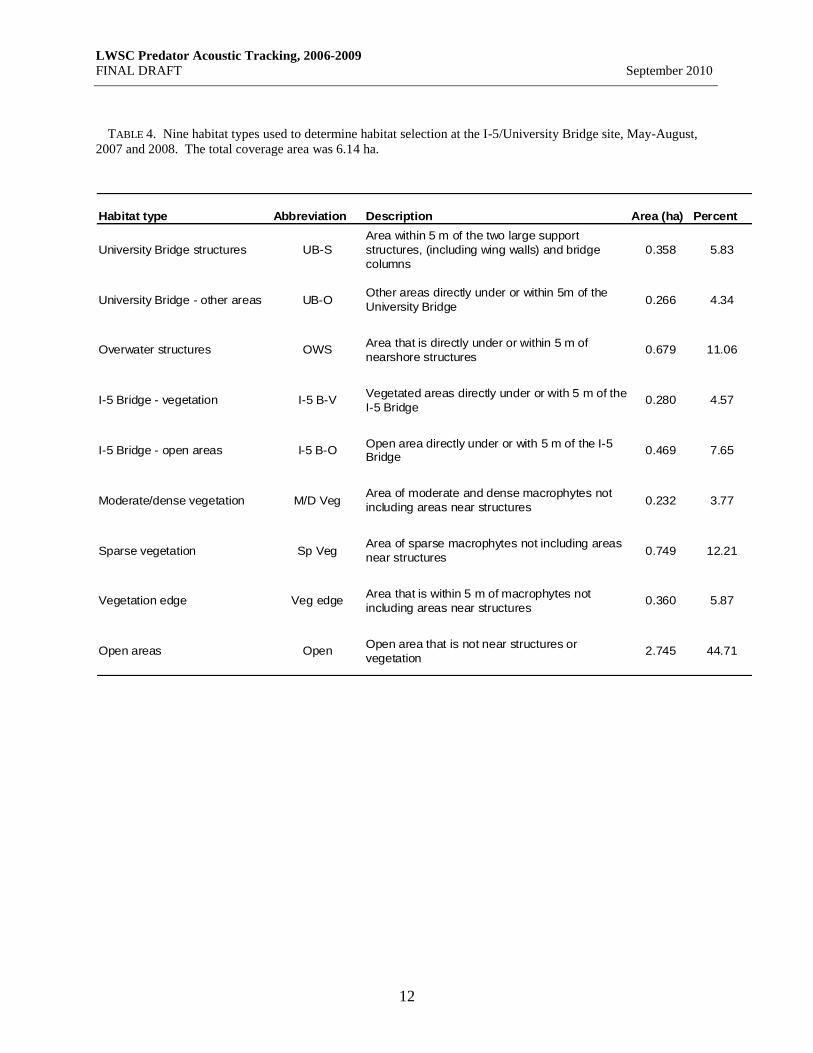
TABLE 4. Nine habitat types used to determine habitat selection at the I-5/University Bridge site, May-August,
2007 and 2008. The total coverage area was 6.14 ha.
Habitat type Abbreviation Description Area (ha) Percent
University Bridge structures UB-S
Area within 5 m of the two large support
structures, (including wing walls) and bridge
columns
0.358 5.83
University Bridge - other areas UB-OOther areas directly under or within 5m of the
University Bridge 0.266 4.34
Overwater structures OWSArea that is directly under or within 5 m of
nearshore structures0.679 11.06
I-5 Bridge - vegetation I-5 B-VVegetated areas directly under or with 5 m of the
I-5 Bridge0.280 4.57
I-5 Bridge - open areas I-5 B-OOpen area directly under or with 5 m of the I-5 Bridge
0.469 7.65
Moderate/dense vegetation M/D VegArea of moderate and dense macrophytes not
including areas near structures0.232 3.77
Sparse vegetation Sp VegArea of sparse macrophytes not including areas
near structures0.749 12.21
Vegetation edge Veg edgeArea that is within 5 m of macrophytes not
including areas near structures0.360 5.87
Open areas OpenOpen area that is not near structures or
vegetation2.745 44.71

LWSC Predator Acoustic Tracking, 2006-2009
FINAL DRAFT September 2010
13
FIGURE 3. Map of Gas Works Park site (top panel) and I-5/University Bridge site (bottom panel) showing depth
intervals (2-m contours) and hydrophone locations (X’s), May to August, 2007 and 2008.

LWSC Predator Acoustic Tracking, 2006-2009
FINAL DRAFT September 2010
14
FIGURE 4. Map of the I-5/University Bridge site showing the various habitat types, May to August, 2007 and
2008. Descriptions of habitat types are given in Table 4.

LWSC Predator Acoustic Tracking, 2006-2009
FINAL DRAFT September 2010
15
FIGURE 5. Map of the Gas Works Park site showing various habitat types, May to August, 2007 (top panel) and
2008 (bottom panel). Descriptions of habitat types are given in Table 3. Habitat selection analysis only included
areas where the depth was 0-10 m deep (offshore contour line) because smallmouth bass were rarely in areas deeper
than this depth interval.

LWSC Predator Acoustic Tracking, 2006-2009
FINAL DRAFT September 2010
16
FIGURE 6. Map of the Gas Works Park site showing substrate (top panel) and shoreline types (bottom panel), May
to August, 2007 and 2008. Both panels only show the inshore part of the coverage area. Substrate in the offshore
area of the coverage area (not shown) was all silt. Substrate selection analysis only included areas where the depth
was 0-10 m deep (blue contour line) because smallmouth bass were rarely in areas outside of this depth interval. In
the bottom panel, the offshore contour line is at 4-m depth. The area between 0 and 4 m depth was used to
determine selection of the three shoreline types (rip rap, bulkhead, and beach).

LWSC Predator Acoustic Tracking, 2006-2009
FINAL DRAFT September 2010
17
To estimate shoreline type selection, we divided Gas Works Park shoreline into three
shoreline types: beach, rip rap, and bulkhead (Figure 6). We only included detection points that
were in water less than 4 m deep. Fish in deeper water were considered as being offshore and
not in close contact with the shoreline. Shoreline availability was based on the area between 0
and 4 m depth. Shoreline analysis was not done for the I-5/University site because most of the
shoreline in our coverage area was relatively uniform (mostly overwater structures).
Differences in use between habitat categories for habitat type, shoreline type (Gas Works
Park only), substrate type (Gas Works Park only), and depth selection were compared with a
non-parametric Friedman test and multiple comparisons procedure (Conover 1999). Individual
fish were used as the blocking variable. This statistical test allowed us to combine results of
2007 and 2008 (different habitat availability) and have a larger sample size. For each diel
period, we only included the results of fish that had more than 200 data points.
Data analysis-Vemco
All data from VR2s were combined into an Access database and subsequently queried to
produce the number of detections per hour at each receiver for each fish. We evaluated tracking
information for each fish and categorized their seasonal movements as either 1) resident fish that
remained in the LWSC; 2) left the LWSC and moved into Lake Washington; 3) not enough data
to determine their seasonal movement; 4) fish died or tag was expelled; tag remained in one
location over an extended period of time; and 5) other, movement pattern unclear. Resident fish
were defined as fish that remained in the LWSC throughout the summer and were still present on
October 15 (water temperature at 1 m depth was approximately 12oC). To define when fish left
or entered the LWSC, we used the UW Rowing Center VR2 (west end of Union Bay) as the
boundary between LWSC and Lake Washington. Data points from this site and nearby VR2s at
UW Hatchery, Webster Point, and Lakeshore Condos were used to determine which direction the
fish was moving. If the fish was moving to Lake Washington, we used the date of the first
detection at the UW Rowing Center VR2 and if the fish was moving into the LWSC we used the
date of the last detection at the UW Rowing Center. Regression analysis was used determine if
there was a relationship between smallmouth bass size and when they left the LWSC. Also, we
determined the percent of smallmouth bass that left the LWSC based on three capture and release
categories: Portage Bay, Gas Works Park, and Aurora Bridge area. Hourly detections of
northern pikeminnow were also used to determine their diel movement in and out the LWSC.
Depth information was examined for both seasonal use and diel patterns (dawn, day, dusk
and night). Seasonal depth use was overlaid with temperature data from King County
monitoring stations.
Each mobile-tracking detection in Lake Washington was assigned to one of the five standard
sampling areas of Lake Washington (Figure 2). For each fish, the primary lake area was defined
as the area that had the majority of detections. Secondary areas were other lake areas where each
fish was found. Mobile-tracking detections in the LWSC were used in combination with fixed-
receiver data to determine if there was any site fidelity between years of smallmouth bass

LWSC Predator Acoustic Tracking, 2006-2009
FINAL DRAFT September 2010
18
returning to the LWSC from Lake Washington. We examined the furthest west each fish was
detected and compared that to their capture and release location.
RESULTS
Spring/summer habitat use – smallmouth bass
A total of 57 fish were tagged with HTI acoustic tags (Table 5). Fifty of the fish were
smallmouth bass. All but two of the smallmouth bass were collected by angling. Smallmouth
bass collected at the I-5/University Bridge site (n = 28; mean, 358.2 mm FL) were significantly
larger than those collected at the Gas Works Park site (n = 22; mean, 302.2 mm FL; Mann-
Whitney U test; P = 0.05; Figure 7). Thirty smallmouth bass were tagged in 2007 and 20 were
tagged in 2008 (Figure 8). The mean length tagged was smaller in 2007 (mean, 316.6 mm FL)
than 2008 (mean, 342.3 mm FL) but there was no statistical difference in fish size between years
(Mann-Whitney U test; P = 0.17).
Four northern pikeminnow (range, 314-360 mm FL; mean, 339.8 mm FL) were implanted
with HTI acoustic tags. Northern pikeminnow were collected through either angling (n = 1) or
gill nets (n = 3). We also tagged three largemouth bass; all were relatively small fish (range,
113-170 mm FL; mean, 168.2 mm FL). Two were collected with beach seines at the I-
5/University Bridge site and the other fish was collected through angling at the Gas Works Park
site.
During the tagging on June 28, 2007 at both sites, a different tag encoding was accidentally
used than the setting used on the tracking receiver system. Four northern pikeminnow, three
smallmouth bass, and one largemouth bass were tagged on that date. Although these tags were
detected, the signal was weak and we obtained few positions. Therefore, these fish were not
used in any analysis. For 2007 and 2008 combined, all of our northern pikeminnow were tagged
on this date and thus we did not obtain any useful northern pikeminnow tracking data.
TABLE 5. Number of predatory fish that were tagged with HTI acoustic tags at two study sites in the Lake
Washington Ship Canal, May-July 2007-2008.
Location
Species 2007 2008 Total
I-5/University Bridges
Northern pikeminnow 1 1
Largemouth bass 2 2
Smallmouth bass 14 8 22
Gas Works Park
Northern pikeminnow 3 3
Largemouth bass 1 1
Smallmouth bass 16 12 28
Year

LWSC Predator Acoustic Tracking, 2006-2009
FINAL DRAFT September 2010
19
0
5
10
15
20
25
30
35
40
45
150-199 200-249 250-299 300-349 350-399 400-449 450-500
Size category (FL mm)
Perc
en
t
Gas Works Park
I-5/University Bridges
FIGURE 7. Length frequency (50-mm FL increments) of smallmouth bass collected and tagged (HTI acoustic tags)
at two sites in the Lake Washington Ship Canal, May-July 2007-2008. N = 50.
0
2
4
6
8
10
12
14
150-199 200-249 250-299 300-349 350-399 400-449 450-500
Size category (FL mm)
Nu
mb
er
2008
2007
FIGURE 8. Number and size category of acoustic-tagged smallmouth bass collected for two different years.
Smallmouth bass were tagged with HTI acoustic tags at two study sites in the Lake Washington Ship Canal, May-
July 2007-2008.
Smallmouth bass – Length frequency
Smallmouth bass – Length frequency

LWSC Predator Acoustic Tracking, 2006-2009
FINAL DRAFT September 2010
20
We were able to effectively track 84% (42 of 50 fish) of the smallmouth bass at the site they
were released. We obtained at least 10,000 data points for 35 fish (Appendix 1). One
smallmouth bass from our SR 520 bridge tracking project was tracked at the I-5/University
Bridge site for seven days and briefly at the Gas Works Park. Also some smallmouth bass from
Gas Works Park were tracked at the I-5/University Bridge site. Only one I-5/University Bridge
fish was extensively tracked at Gas Works Park.
At both tracking sites, smallmouth bass 250-349 and > 350 mm FL were concentrated in
areas that were 2-4 m deep (Figures 9 and 10); however, at the I-5/University Bridge site they
were commonly in deeper areas. Smallmouth bass 150-249 mm FL at Gas Works Park were
spread out over a wide range of bottom depths (0-12 m bottom depth). At the I-5/University
Bridge site, we only tracked two smallmouth bass 150-249 mm FL and both were rarely outside
of the area that was 2-6 m deep. There was no noticeable change in depth between diel periods
for all three size categories at either site.
During each diel period, smallmouth bass at Gas Works Park primarily selected areas of the
study site that were 2-4 m deep (Figure 11). Areas that were 0-2 and 4-6 m also had a positive
selection for most fish. Areas that were more than 12 m deep were rarely used. This area
represented 83.1% of the coverage area but only 0.14% of the smallmouth bass positions.
Smallmouth bass 150-249 mm FL generally had a higher selection of areas that were 0-2 m;
however, the overall bottom depth selection was similar between the three size classes.
Bottom depth use at the I-5/University Bridge site was generally similar to Gas Works Park.
The 2-4 m depth interval was the highest ranked depth interval for dawn, dusk, and night (Figure
11). However, during the day there was a tendency for smallmouth bass to use areas with deeper
water than at Gas Works Park. During the day, all bottom depth categories were similar except
the 0-2 m interval which was little used. At night, smallmouth bass were primarily in the 2-4 and
4-6 m bottom depth intervals.
Overall, we observed little difference in the use of the five habitat categories at Gas Works
Park (Figure 12). No significant difference was observed during dawn, day, and night periods
(Friedman test, P > 0.05). At dusk, the use of dense and moderate vegetation was higher than in
the open water area (Friedman test, P < 0.05).
At the I-5/University Bridge site there were significant differences in habitat selection for all
diel periods (Friedman test, P < 0.05). The highest ranked habitat types at the I-5/University
Bridge site were the University Bridge structures, sparse vegetation, and vegetation edge (Figure
13). This was particularly evident during the day (Figures 14 and 15). Fifty-four percent of
smallmouth bass had a positive selection ratio for nearshore overwater structures (OWS) during
at least one diel period. This was most evident at night when 41% had a positive selection ratio.
Use of nearshore overwater structures (OWS) was most evident in smaller fish during the day.
Forty percent of bass 150-349 mm FL exhibited a positive selection ratio during day, while at
night only 19% of bass 350-470 mm FL had a positive selection. Both fish 150-249 mm FL
strongly selected nearshore overwater structures (OWS) during the day. Habitat types generally
not used in relation to their availability were open areas and the two I-5 Bridge habitats.

LWSC Predator Acoustic Tracking, 2006-2009
FINAL DRAFT September 2010
21
0
0.2
0.4
0.6
0.8
150-249 mm
250-349 mm
> 350 mm
0
0.2
0.4
0.6
0
0.2
0.4
0.6
0
0.2
0.4
0.6
0-2 2-4 4-6 6-8 8-10 10-12 12-14 > 14
Me
an
pro
po
rtio
n
Depth category (m)
Dawn
Night
Dusk
Day
FIGURE 9. Mean proportion (± SE) of eight bottom depth categories (m) used by three size classes (mm FL) of
smallmouth bass at Gas Works Park, May-August 2007 and 2008. Sample sizes: A) 150-249 mm: n = 7 for each
diel period; B) 250-349 mm: n = 6 for day and night, n = 5 for dawn and dusk; C) < 350 mm: n = 9 for each diel
period.
Gas Works Park

LWSC Predator Acoustic Tracking, 2006-2009
FINAL DRAFT September 2010
22
0
0.2
0.4
0.6
0.8150-249 mm
250-349 mm
> 350 mm
0
0.2
0.4
0.6
0.8
0
0.2
0.4
0.6
0.8
0
0.2
0.4
0.6
0.8
0-2 2-4 4-6 6-8 8-10
Me
an
pro
po
rtio
n
Depth category (m)
Dawn
Night
Dusk
Day
FIGURE 10. Mean proportion (± SE) of five bottom depth categories (m) used by three size classes (mm FL) of
smallmouth bass at the I-5/University Bridge site, May-August 2007 and 2008. Sample sizes: A) 150-249 mm: n =
2 for each diel period; B) 250-349 mm: n = 7 for day, n = 6 for dawn and dusk, n = 5 for night; C) < 350 mm: n = 9
for dawn, n = 16 for day, n = 8 for dusk, n = 10 for night.
I-5/University Bridges

LWSC Predator Acoustic Tracking, 2006-2009
FINAL DRAFT September 2010
23
0
10
20
30
40
50
60
70
80
90
Dawn Day Dusk Night
Perc
en
t p
osit
ive s
ele
cti
on
0-2 m
2-4 m
4-6 m
6-8 m
8-10 m
10-12 m
12-14 m
> 14 m
n = 21 n = 21 n = 21 n = 22
b
a
b
b
d
c
d
c
b
dd
c
a
ab
c
bc
a
b
c
f
de
ef
cd
b
a
b
c
e
cd
de
c
0
10
20
30
40
50
60
70
80
90
Dawn Day Dusk Night
Perc
en
t p
osit
ive s
ele
cti
on
0-2 m
2-4 m
4-6 m
6-8 m
8-10 m
n = 17 n = 25 n = 16 n = 17
c
a
ab
bc
ab
c
ab
a
b
ab
c
a
ab
abbc
c
a
abbc
c
FIGURE 11. Percent of smallmouth bass with a positive selection ratio (ŵi > 1) for different depth categories (m) at
Gas Works Park and the I-5/University Bridge site, May-August 2007 and 2008. Selection ratios were calculated
within each diel period and thus statistical comparisons were only made within each diel period. Letters above bars
are the results of Friedman multiple comparisons procedure within each diel period; bars with different letters are
significantly different; n = the number of tagged smallmouth bass available (> 200 data points) within each diel
period. Fish from both years were combined.
I-5/University Bridges
Gas Works Park

LWSC Predator Acoustic Tracking, 2006-2009
FINAL DRAFT September 2010
24
FIGURE 12. Percent of smallmouth bass with a positive selection ratio (ŵi > 1) for five habitat types at Gas Works
Park, May-August 2007 and 2008. Selection ratios were calculated within each diel period and thus statistical
comparisons were only made within each diel period. Letters above bars are the results of Friedman multiple
comparisons procedure within each diel period; bars with different letters are significantly different; no letters
indicate there was no significant difference for that diel period; n = the number of tagged smallmouth bass available
(> 200 data points) within each diel period. Fish from both years were combined. Veg. = vegetation.
0
10
20
30
40
50
60
70
80
90
Dawn Day Dusk Night
Perc
en
t p
osit
ive s
ele
cti
on
UB-S
UB-O
OWS
I-5 B-V
I-5 B-O
M/D Veg
Sp Veg
Veg Edge
Open
a
abcd
bcd
de
e
cde
ab
abc
cd
a
b
b
b
b
b
a
a
b
a
bcde
ef
f
c
abc
ab
cd
a
bc
ab
cd
d
bc
a
ab
bcd
n = 17 n = 26 n = 16 n = 17
FIGURE 13. Percent of smallmouth bass with a positive selection ratio (ŵi > 1) for nine habitat types at the I-
5/University Bridge site, May-August 2007 and 2008. Selection ratios were calculated within each diel period and
thus statistical comparisons were only made within each diel period. Letters above bars are the results of Friedman
multiple comparisons procedure within each diel period; bars with different letters are significantly different; n = the
number of tagged smallmouth bass available (> 200 data points) within each diel period. Fish from both years were
combined. UB-S = University Bridge structures; UB-O = University Bridge – other areas; OWS = overwater
structures; I-5 B-V = I- 5 Bridge – vegetation; I-5 B-O = I-5 Bridge – open areas; M/D Veg = moderate/dense
vegetation; Sp Veg = sparse vegetation; Veg Edge = vegetation edge; and Open = open areas. Habitat descriptions
are listed in Table 4.
0
10
20
30
40
50
Dawn Day Dusk Night
Diel period
Per
cen
t p
osi
tive
sel
ecti
on
Dense veg.
Moderate veg.
Sparse veg.
Veg. edge
Open water
n = 21 n = 22 n = 20 n = 22
a
a
ab
ab
b
Gas Works Park – Habitat selection
I-5/University Bridges - Habitat selection
LWSC Predator Acoustic Tracking, 2006-2009
FINAL DRAFT September 2010
25
FIGURE 14. Day (yellow-red) and night (blue-purple) density plots of smallmouth bass 150-349 mm FL (day, n =
10; night, n = 7) at the I-5/University Bridge site, May-August 2007 and 2008. Each bass was weighted equally for
the density plot calculation. The yellow (top) and green (bottom) lines are the coverage areas of the hydrophone
array. The data presented on the two images are the same but are displayed in 2D on the top and 3D on the bottom.
On the 3D image, daylight values are positive and night values are negative. Light green area on the 3D image is
the macrophyte beds.
Smallmouth bass 150-349 mm FL

LWSC Predator Acoustic Tracking, 2006-2009
FINAL DRAFT September 2010
26
FIGURE 15. Day (yellow-red) and night (blue-purple) density plots of smallmouth bass 350-470 mm FL (day, n =
16; night, n = 10) at the I-5/University Bridge site, May-August 2007 and 2008. Each bass was weighted equally for
the density plot calculation. The yellow (top) and green (bottom) lines are the coverage areas of the hydrophone
array. The data presented on the two images are the same but are displayed in 2D on the top and 3D on the bottom.
On the 3D image, daylight values are positive and night values are negative. Light green area on the 3D image is
the macrophyte beds.
Smallmouth bass 350-470 mm FL

LWSC Predator Acoustic Tracking, 2006-2009
FINAL DRAFT September 2010
27
At Gas Works Park, gravel/sand areas were strongly selected over the other substrate types
during dawn and night (Figure 16). During the day, gravel/sand areas were significantly
different than sand/silt and cobble/boulders areas but not silt areas. At dusk, gravel/sand was the
highest ranked substrate category but differences were not significant (Friedman test, P = 0.055).
Density plots of smallmouth bass at Gas Works Park indicated they were primarily located in
two areas: at the southeast corner where the shore is a beach or at the western end where the
shoreline is rip rap (Figure 17). Smallmouth bass showed a strong positive selection for beach
shoreline during all diel periods (Friedman test, P < 0.05; Figure 18). Four smallmouth bass
showed a strong positive selection for rip rap during the day, all of these fish were 150-250 mm
FL. One of these fish moved to bulkhead or beach shoreline during the other three diel periods.
The other three fish remained closely associated with rip rap throughout all diel periods.
FIGURE 16. Percent of smallmouth bass with a positive selection ratio (ŵi > 1) for four substrate types at Gas
Works Park, May-August 2007 and 2008. Selection ratios were calculated within each diel period and thus
statistical comparisons were only made within each diel period. Letters above bars are the results of Friedman
multiple comparisons procedure within each diel period; bars with different letters are significantly different; no
letters indicate there was no significant difference within that diel period. Fish from both years were combined. n =
the number of tagged smallmouth bass available (> 200 data points) during each diel period.
0
10
20
30
40
50
60
70
80
Dawn Day Dusk Night
Diel period
Perc
en
t p
osit
ive s
ele
cti
on
Silt
Sand/Silt
Gravel/Sand
Cobble/Boulders
n = 21 n = 22 n = 20 n = 22
a
b b
b
b b
ab
a
a
b
b
b
Gas Works Park – Substrate selection

LWSC Predator Acoustic Tracking, 2006-2009
FINAL DRAFT September 2010
28
FIGURE 17. Day (yellow-red) and night (blue-purple) density plots of two sizes of smallmouth bass at Gas Works
Park site, May-August 2007 and 2008. The top two images (2D and 3D) are for bass 150-349 mm FL and the
bottom two images (2D and 3D) are for bass 350-470 mm FL. Each bass was weighted equally for the density plot
calculation. The yellow (2D images) and orange (3D images) lines are the coverage areas of the hydrophone array.
The coverage area extends substantially to the south; however, smallmouth bass rarely used this area and had a
density value of 0. On the 3D image, daylight values are positive and night values are negative. Light green area on
the 3D images is the macrophyte beds. The three shoreline types are shown on the 2D images.
Beach
Bulkhead
Rip rap
Bulkhead
Rip rap Beach
Smallmouth bass 150-349 mm FL
Smallmouth bass 350-470 mm FL

LWSC Predator Acoustic Tracking, 2006-2009
FINAL DRAFT September 2010
29
FIGURE 18. Percent of smallmouth bass with a positive selection ratio (ŵi > 1) for three shoreline types at Gas
Works Park, May-August 2007 and 2008. Selection ratios were calculated within each diel period and thus
statistical comparisons were only made within each diel period. Letters above bars are the results of Friedman
multiple comparisons procedure within each diel period; bars with different letters are significantly different. Fish
from both years were combined. n = the number of tagged smallmouth bass available (> 200 data points) during
each diel period. Data only represents fish that are in less than 4 m depth; fish in deeper water were not considered
in close association with the shoreline.
Three small largemouth bass were tagged with HTI acoustic tags (Table 6); however, we
were only able to get useful tracking data on one fish (#5127; 113 mm FL). This fish was
captured under the I-5 Bridge and appeared to remain in this area for the duration of the tag life.
The fish was closely associated with macrophytes; either macrophyte areas under the bridge
(72.9% of all data points) or macrophyte areas close to the bridge (23.8% of all data points).
This fish was never tracked at night; it may have retreated to some protective area (e.g., next to a
large boulder) where we were unable to effectively receive the tag signal or perhaps its nighttime
habitats were outside of our coverage area.
TABLE 6. Largemouth bass tagged with HTI acoustic tags in the LWSC in 2007. Release site is the area where
the fish were captured and released. GWP = Gas Works Park; I-5/UB = I-5 and University Bridges. E tags are 20-
day, 1.5 g tags and M tags are 12-day, 0.75 g tags. The number of days tracked is the number of days at least one
data point was obtained. The first 24 hours after release was not used.
Release Tag Tag period
Fork
length Weight Date of first Date of last Number of Number of
Date released site type (msec) (mm) (g) data point data point days tracked data points
28-Jun I-5/UB E 5097 170 61 30-Jun 2-Jul 3 8
29-Jun I-5/UB M 5127 113 21 30-Jun 11-Jul 12 3,526
9-Jul GWP E 5297 161 68 -- -- 0 0
0
10
20
30
40
50
60
70
80
90
Dawn Day Dusk Night
Diel period
Perc
en
t p
osit
ive s
ele
cti
on
Beach
Bulkhead
Rip rap
a
b
b
a
c
b
a
b
b
n = 16 n = 18 n = 16 n = 18
a
b
b
Gas Works Park – Shoreline selection
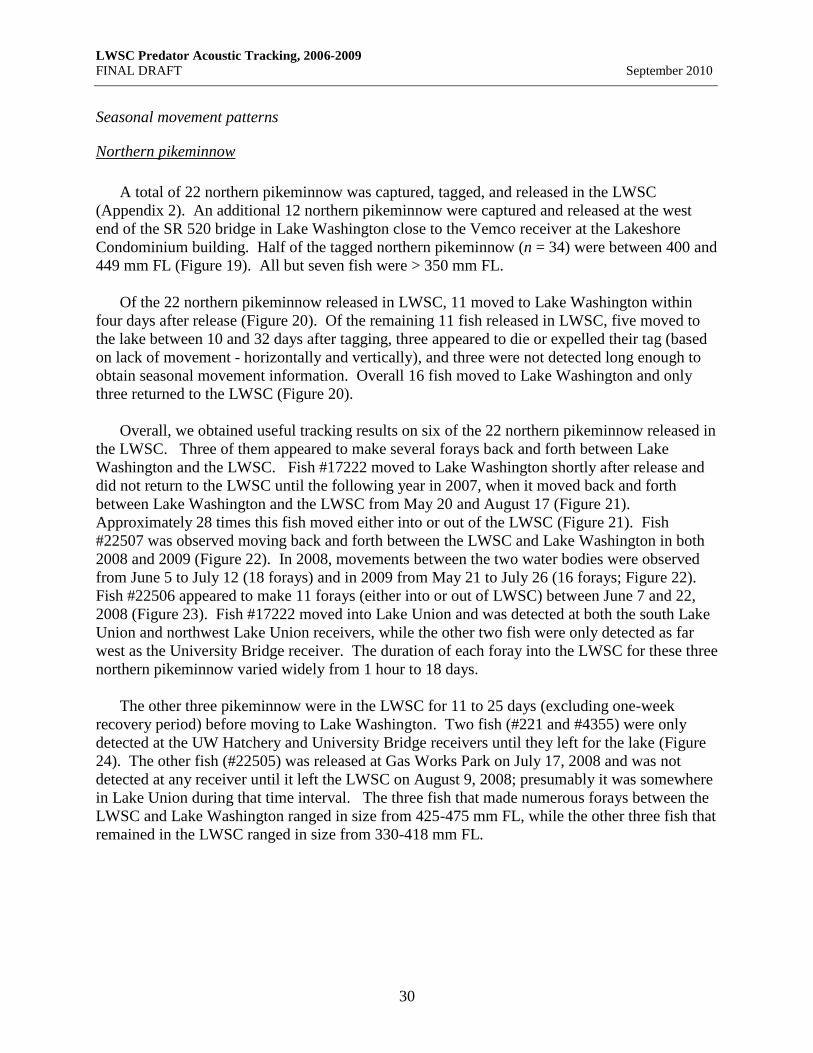
LWSC Predator Acoustic Tracking, 2006-2009
FINAL DRAFT September 2010
30
Seasonal movement patterns
Northern pikeminnow
A total of 22 northern pikeminnow was captured, tagged, and released in the LWSC
(Appendix 2). An additional 12 northern pikeminnow were captured and released at the west
end of the SR 520 bridge in Lake Washington close to the Vemco receiver at the Lakeshore
Condominium building. Half of the tagged northern pikeminnow (n = 34) were between 400 and
449 mm FL (Figure 19). All but seven fish were > 350 mm FL.
Of the 22 northern pikeminnow released in LWSC, 11 moved to Lake Washington within
four days after release (Figure 20). Of the remaining 11 fish released in LWSC, five moved to
the lake between 10 and 32 days after tagging, three appeared to die or expelled their tag (based
on lack of movement - horizontally and vertically), and three were not detected long enough to
obtain seasonal movement information. Overall 16 fish moved to Lake Washington and only
three returned to the LWSC (Figure 20).
Overall, we obtained useful tracking results on six of the 22 northern pikeminnow released in
the LWSC. Three of them appeared to make several forays back and forth between Lake
Washington and the LWSC. Fish #17222 moved to Lake Washington shortly after release and
did not return to the LWSC until the following year in 2007, when it moved back and forth
between Lake Washington and the LWSC from May 20 and August 17 (Figure 21).
Approximately 28 times this fish moved either into or out of the LWSC (Figure 21). Fish
#22507 was observed moving back and forth between the LWSC and Lake Washington in both
2008 and 2009 (Figure 22). In 2008, movements between the two water bodies were observed
from June 5 to July 12 (18 forays) and in 2009 from May 21 to July 26 (16 forays; Figure 22).
Fish #22506 appeared to make 11 forays (either into or out of LWSC) between June 7 and 22,
2008 (Figure 23). Fish #17222 moved into Lake Union and was detected at both the south Lake
Union and northwest Lake Union receivers, while the other two fish were only detected as far
west as the University Bridge receiver. The duration of each foray into the LWSC for these three
northern pikeminnow varied widely from 1 hour to 18 days.
The other three pikeminnow were in the LWSC for 11 to 25 days (excluding one-week
recovery period) before moving to Lake Washington. Two fish (#221 and #4355) were only
detected at the UW Hatchery and University Bridge receivers until they left for the lake (Figure
24). The other fish (#22505) was released at Gas Works Park on July 17, 2008 and was not
detected at any receiver until it left the LWSC on August 9, 2008; presumably it was somewhere
in Lake Union during that time interval. The three fish that made numerous forays between the
LWSC and Lake Washington ranged in size from 425-475 mm FL, while the other three fish that
remained in the LWSC ranged in size from 330-418 mm FL.
LWSC Predator Acoustic Tracking, 2006-2009
FINAL DRAFT September 2010
31
0
2
4
6
8
10
12
14
16
18
200-249 250-299 300-349 350-399 400-449 450-500
Size category (FL mm)
Nu
mb
er
2008
2007
2006
FIGURE 19. Number and size category of acoustic-tagged northern pikeminnow collected for three different years.
Northern pikeminnow were tagged with Vemco acoustic tags at several sites in the Lake Washington Ship Canal as
well as at the west end of the SR 520 bridge, May-July 2006-2008.
0
2
4
6
8
10
12
Moved to lake within 4 days Moved to lake after > 10 days Not detected moving to lake
Nu
mb
er
of fi
sh
Movement to Lake Washington after release
Returned to LWSC
Never returned to LWSC
Unknown(few detections)
Died or expelled tag
FIGURE 20. Number of tagged northern pikeminnow that moved to Lake Washington after release. All fish (n =
22) displayed were captured and released in the Lake Washington Ship Canal (LWSC), May-July 2006-2008 and
implanted with Vemco acoustic tags.
Northern pikeminnow – Movement categories
Northern pikeminnow – Length frequency

LWSC Predator Acoustic Tracking, 2006-2009
FINAL DRAFT September 2010
32
0.5
1
1.5
2
2.5
3
3.5
7/1
/2006
8/1
/2006
9/1
/2006
10/1
/2006
11/1
/2006
12/1
/2006
1/1
/2007
2/1
/2007
3/1
/2007
4/1
/2007
5/1
/2007
6/1
/2007
7/1
/2007
8/1
/2007
9/1
/2007
10/1
/2007
11/1
/2007
12/1
/2007
1/1
/2008
2/1
/2008
Lake
LWSC
Union Bay(UW Rowing Center)
Date
Jul Sep Nov Jan Mar May Jul Sep Nov Jan
FIGURE 21. Daily (top panel) and hourly (bottom panel) movement of northern pikeminnow #17222 between
Lake Washington and the LWSC, July 2006 – February 2008. Fish # 17222 was released on July 6, 2006 (red
circle) in the LWSC and was 425 mm FL. The dashed red line represents the boundary between Lake Washington
and the LWSC. Lake detections represent Webster Point detections as well as other detections in Lake Washington.
LWSC detections are the combined results of four receivers (UW Hatchery, University Bridge, NW Lake Union,
and South Lake Union). The Webster Point detections represent the combined results of two receivers at the eastern
edge of Union Bay. The receiver locations are arranged (top to bottom) based on their distance from Lake
Washington. See Figure 2 for receiver locations.
0
1
2
3
4
5
6
5/1/2007 0:00 5/31/2007 12:00 7/1/2007 0:00 7/31/2007 12:00
South Lake Union
NW Lake Union
UW Hatchery
University Bridge
May June July August
UW Rowing Center
Webster Point
Date
Northern pikeminnow #17222
2007
2006-2008

LWSC Predator Acoustic Tracking, 2006-2009
FINAL DRAFT September 2010
33
0.5
1
1.5
2
2.5
3
3.5
Lake
LWSC
Union Bay(UW Rowing Center)
May Jun Jul Aug Sep Oct Nov Dec Jan Feb Mar Apr May Jun Jul
Date
FIGURE 22. Daily (top panel) and hourly (bottom two panels) movement of northern pikeminnow #22507 between
Lake Washington and the LWSC, May 2008 – July 2009. Fish #22507 was released on May 21, 2008 (red circle) in
the LWSC and was 475 mm FL. The dashed red line represents the boundary between Lake Washington and the
LWSC. Lake detections represent Webster Point detections as well as other detections in Lake Washington. LWSC
detections are the combined results of two receivers (UW Hatchery and University Bridge). The Webster Point
detections represent the combined results of two receivers at the eastern edge of Union Bay. The receiver locations
are arranged (top to bottom) based on their distance from Lake Washington. See Figure 2 for receiver locations.
Northern pikeminnow #22507
0
1
2
3
4
5/1/2008 0:00 5/31/2008 12:00 7/1/2008 0:00
0
1
2
3
4
5/1/2009 0:00 5/31/2009 12:00 7/1/2009 0:00May June July
Date
UW Rowing Center
Webster Point
UW Hatchery
University Bridge
UW Rowing Center
Webster Point
UW Hatchery
University Bridge
2008
2009

LWSC Predator Acoustic Tracking, 2006-2009
FINAL DRAFT September 2010
34
FIGURE 23. Hourly locations of northern pikeminnow #22506 based on four fixed receivers, June-July 2008. The
receiver locations are arranged (top to bottom) from the furthest east to furthest west. If the fish was detected at two
receivers during the same hour, the detections are indicated by a value midway between the receivers. The dashed
red line represents the boundary between Lake Washington and the LWSC. See Figure 2 for receiver locations.
FIGURE 24. Hourly locations of northern pikeminnow #221 and #4355 based on four fixed receivers, May-June
2007. The receiver locations are arranged (top to bottom) from the furthest east to furthest west. The Webster Point
detections represent the combined results of two receivers at the eastern edge of Union Bay. If a fish was detected
at two receivers during the same hour, the detections are indicated by a value midway between the receivers. The
dashed red line represents the boundary between Lake Washington and the LWSC. See Figure 2 for receiver
locations.
0
1
2
3
4
20-May 25-May 30-May 4-Jun 9-Jun 14-Jun
Date
#221
#4355
UW Rowing Center
Webster Point
UW Hatchery
University Bridge
0
1
2
3
4
1-Jun 8-Jun 15-Jun 22-Jun 29-Jun 6-Jul
UW Rowing Center
Webster Point
UW Hatchery
University Bridge
Date
Northern pikeminnow #22506
Northern pikeminnow #’s 221 and 4355
LWSC Predator Acoustic Tracking, 2006-2009
FINAL DRAFT September 2010
35
The vast majority of movements into and out of the LWSC were at night. The three fish that
moved back and forth typically moved into the LWSC in the late evening and returned shortly
before dawn (Figure 25). The other three fish, which remained in the LWSC after release, all
moved to Lake Washington at night.
Three of the 12 northern pikeminnow released at the SR 520 Bridge were detected in the
LWSC. One appeared to have entered the LWSC and either died or expelled the tag (lack of
horizontal and vertical movements). The other two entered the LWSC within 3 days of release
and were only present for a short time period and thus were not considered part of their normal
behavior.
From the end of August to mid-May, we did not detect any northern pikeminnow in the
LWSC; thus we found no evidence that northern pikeminnow overwinter in the LWSC.
Overall, 15 northern pikeminnow from LWSC were detected moving to Lake Washington.
Six of the 15 were tagged in 2008 when mobile tracking surveys were not frequently conducted
and the St. Edwards receiver was not functioning. Therefore, we were only able to get limited
information on their movements in Lake Washington. However, two fish tagged in 2008 were
detected on the east side of Mercer Island near the I-90 Bridge. Of the remaining nine fish
(tagged before 2008), five were rarely detected in the lake; three appeared to reside within a
confined area (all were somewhere along the west shoreline between I-90 bridge and SR 520
bridge), and one fish (#17222) was found at various locations between I-90 bridge and St.
Edwards Park. Fish#17222 was primarily detected at the Lakeshore Condominium receiver but
appeared to made long forays to various places in the lake. In one case, it moved from the west
I-90 bridge receiver to the St. Edwards Park receiver (approximately 16 km) in a little over two
days (August 12-14, 2006).
We also obtained relatively few detections of SR 520 Bridge fish. Only two fish were
extensively detected (> 14 days) at either the Webster Point or Lakeshore Condos receivers.
Seven fish were detected at the west I-90 receiver and one was detected at the St. Edwards Park
receiver.
Overall, we were only able to find seven of the 20 tagged northern pikeminnow (combined
Lake Washington and LWSC fish) in Lake Washington in 2006 and 2007 with mobile tracking.
Two encounters were recorded in Area 1, one in Area 2, four in Area 3, two in Area 4, and two
in Area 5.
During the first two weeks in June 2007, 15 tagged northern pikeminnow were present (10
from SR 520 bridge and 5 from LWSC) in Lake Washington. Of those, eight were detected at
the receiver on the west end of the I-90 Bridge between June 5 and 11. Most of the detections at
the west end of the I-90 Bridge were at night. Movement of a large percent of the tagged
population suggests some type of spawning aggregation. However, detections of four fish were
made less than one week after release and thus we are unsure if this movement was indicative of
normal behavior.

LWSC Predator Acoustic Tracking, 2006-2009
FINAL DRAFT September 2010
36
FIGURE 25. Hourly movements of northern pikeminnow #22506 based on three fixed receivers, June 16-June 21,
2008. Shaded bars indicate times of low light conditions (dusk to dawn). The receiver locations are arranged (top to
bottom) from the furthest east to furthest west. If the fish was detected at two receivers during the same hour, the
detections are indicated by a value midway between the receivers. The dashed red line represents the boundary
between Lake Washington and the LWSC. See Figure 2 for receiver locations.
Because most northern pikeminnow left the LWSC shortly after release, we were only able to
obtain depth information on one northern pikeminnow (fish #221) in the LWSC. While in the
LWSC, fish #221 was generally in water less than 3 m deep (Figure 26). A few other depth tags
were detected but they were always at the same general location and the depth did not vary and
we assumed the fish had either died or expelled the tag.
Northern pikeminnow in Lake Washington were in shallow water (0-8 m) during the summer
and moved to deeper water (10-18 m deep) in the fall (Figure 27). Fish #119 was also detected
during mobile tracking on February 21, 2008 and was at a depth of 41 m. From October to
December, fish #119 was frequently detected; however, most detections were at night. For
example, during the month of November, fish #119 was detected on 29 of 30 nights (2,475
detections); however, it was only detected on three other dates during other diel periods (21
detections).
We obtained extensive depth data on three fish in 2007: fish #111 (June 14-26; 4,897 data
points), fish #112 (July 16-22; 1,313 data points), and fish #119 (June 1 – December 9; 37,039
data points). Fish #111 and #112 were usually within a narrow depth range (0-5 m deep) during
the day; whereas at night they occurred over a much broader depth range (Figure 28). In June-
August, fish # 119 inhabited a boarder depth range during the day than at night. In September, it
inhabited a narrow range during day and a board range at night. Unlike the other two northern
1
2
3
4
0:00 12:00 0:00 12:00 0:00 12:00 0:00 12:00 0:00 12:00 0:00 12:00 0:00
Time
UW Rowing Center
Webster Point
UW Hatchery
June 16 June 17 June 18 June 19 June 20 June 21
Northern pikeminnow #22506

LWSC Predator Acoustic Tracking, 2006-2009
FINAL DRAFT September 2010
37
pikeminnow, fish #119 was usually in deeper water during the day than at night in June and July
(Figure 29).
FIGURE 26. Depth distribution (m) of northern pikeminnow #221, May 30 – June 10, 2007. Red lines indicate the
average time for dawn and dusk during these dates.
FIGURE 27. Mean daily depth (m) of northern pikeminnow in Lake Washington, May – December 2007. Most
data are from fixed receivers at Webster Point and Lakeshore Condos.
0
1
2
3
4
5
6
7
8
9
0:00 6:00 12:00 18:00 0:00
TimeD
ep
th (
m)
LWSC
Union Bay
Lake Washington
0
2
4
6
8
10
12
14
16
18
20
5/1/2007 5/31/2007 7/1/2007 7/31/2007 8/31/2007 9/30/2007 10/31/2007 11/30/2007 12/31/2007
Date
Dep
th (
m)
0
2
4
6
8
10
12
14
16
18
20
22
24
Tem
pera
ture
(oC
)
111
112
113
134
220
221
230
Temp. at 2 m
Temp. at 14 m
May Jun Jul Aug Sep Oct Nov Dec
0
2
4
6
8
10
12
14
16
18
20
5/1/2007 5/31/2007 7/1/2007 7/31/2007 8/31/2007 9/30/2007 10/31/2007 11/30/2007 12/31/2007
Date
Dep
th (
m)
0
2
4
6
8
10
12
14
16
18
20
22
24
Tem
pera
ture
(oC
)
119
Temp. at 4 m
Temp. at 14 m
May Jun Jul Aug Sep Oct Nov Dec
Northern pikeminnow #221 – Depth use
Northern pikeminnow – Mean daily depth
LWSC Predator Acoustic Tracking, 2006-2009
FINAL DRAFT September 2010
38
FIGURE 28. Depth distribution (m) of northern pikeminnow #111 and #112 in Lake Washington, 2007. Red lines
indicate the average time for dawn and dusk during these dates.
0
2
4
6
8
10
12
0:00 6:00 12:00 18:00 0:00
Time
Dep
th (
m)
0
2
4
6
8
10
12
0:00 6:00 12:00 18:00 0:00
Time
Dep
th (
m)
Fish #111
June 14-26, 2007
Fish #112
July 16-22, 2007
Northern pikeminnow - Depth distribution
LWSC Predator Acoustic Tracking, 2006-2009
FINAL DRAFT September 2010
39
0
2
4
6
8
10
12
14
16
18
June July August September October November December
MonthD
ep
th (
m)
0
2
4
6
8
10
12
14
16
18
20
22
24
Tem
pera
ture
(oC
)
Dawn
Day
Dusk
Night
Temp. at 2 m
Temp. at 12 m
FIGURE 29. Mean monthly depth (m) of northern pikeminnow #119 in Lake Washington, 2007. Data are from
fixed receivers at Webster Point and Lakeshore Condos.
Smallmouth bass
A total of 72 smallmouth bass were captured, implanted with Vemco acoustic tags, and
released in the LWSC (Appendices 3 and 4). Fourteen percent of the tagged fish were 150-249
mm FL, 50% were 249-350, and 36% were > 350 mm FL (Figure 30). Smallmouth bass were
collected in three areas of the LWSC: 1) Aurora Bridge (n = 9), 2) Gas Works Park (n = 35), and
3) Portage Bay (n = 28).
We were unable to get any seasonal movement data on 15 of the tagged fish because we were
only able to track them for a short time, or they did not move and we considered them dead or
had expelled their tag. Of the remaining 57 fish, 47 (82%) left the LWSC and moved into Lake
Washington and 10 (18%) remained in the LWSC and appeared to overwinter there. The percent
of fish that remained in the LWSC appeared to be related to the location where they were
captured. Fifty-six percent of those captured near the Aurora Bridge migrated to the lake, 79%
of those from Gas Works Park migrated, and all of the Portage Bay fish migrated to the lake
(Figure 31). For Lake Union and Aurora Bridge fish combined, the mean length of resident fish
(n = 10; mean, 296 mm FL) was significantly smaller than migrating fish (n = 27; mean, 337 mm
FL)(t-test; P = 0.017).
Timing of smallmouth bass departure from the LWSC appeared to be related to their size and
location (Figure 32). Smallmouth bass from Portage Bay generally moved out earlier than other
smallmouth bass from other locations but there was no relation between fish size and departure
date. Date of departure of fish from Gas Works Park was related to fish size with larger fish
leaving much earlier than smaller fish. Overall, the median date to leave the LWSC was July 8th
for fish > 350 mm FL and August 31th
for fish < 350 mm FL.
Northern pikeminnow #119 – Depth use

LWSC Predator Acoustic Tracking, 2006-2009
FINAL DRAFT September 2010
40
0
2
4
6
8
10
12
14
16
18
20
150-199 200-249 250-299 300-349 350-399 400-450
Size category (FL mm)
Nu
mb
er
2008
2007
2006
FIGURE 30. Number and size category of acoustic-tagged smallmouth bass collected for three different years.
Smallmouth bass were tagged with Vemco acoustic tags at several sites in the Lake Washington Ship Canal, May-
July 2006-2008.
0
5
10
15
20
25
30
35
40
Aurora Bridge Gas Works Portage Bay
Release location
Nu
mb
er
of
fish
Other
Residents
Migrants
FIGURE 31. Number of tagged LWSC smallmouth bass (n = 72) that either migrated to Lake Washington
(migrants), remained in the LWSC (residents), or their seasonal movements could not be determined (other).
Migrants are fish that left the LWSC in the late-spring, summer, or early-fall and migrated to Lake Washington.
Residents are fish that were still in the LWSC as of October 15 and most likely overwintered in the LWSC. Other
includes fish that not enough data was collected to determine their movement patterns or are fish that never moved
and are likely from fish that died or expelled their tag. Fish were divided into three areas of the LWSC where they
were captured and released.
Smallmouth bass – Movement categories
Smallmouth bass – Length frequency
LWSC Predator Acoustic Tracking, 2006-2009
FINAL DRAFT September 2010
41
Overall, movement of smallmouth bass was generally towards Lake Washington. However,
we observed 10 fish that moved downstream from their release site at either Lake Union or
Aurora Bridge to the receiver at the west of Fremont Cut. Six of those 10 fish were also detected
in Salmon Bay, either through mobile tracking or the fixed receiver at Fisherman’s Terminal
(only operated in 2006). Three smallmouth bass (#118 and #252 and #4363) were observed in
the vicinity of Ballard Locks. None of the 25 smallmouth bass from Portage Bay were ever
observed at the Fremont Cut or northwest Lake Union receivers. Detections of these fish in Lake
Union were rare; three fish were occasionally detected at either Gas Works Park or south Lake
Union.
y = -0.103x + 224R² = 0.041
y = -0.41x + 357R2 = 0.37
120
150.5
181
211.5
242
272.5
303
200 250 300 350 400 450 500
En
try d
ate
in
to lake
Fork length (mm)
Portage Bay
Gas Works
Aurora Bridge
May J
un Jul
A
ug
S
ep
O
ct
FIGURE 32. Relationship between smallmouth bass fork length (mm) and date they left the LWSC and migrated to
Lake Washington. Fish were divided into the three areas where they were captured and released. A regression line
was not developed for Aurora Bridge fish because there were only five data points.
Capture and release location Smallmouth bass – Movement to lake
LWSC Predator Acoustic Tracking, 2006-2009
FINAL DRAFT September 2010
42
We were able to detect 23 smallmouth bass returning to the LWSC. One fish (#117) moved
back into the LWSC in October and appeared to spend much of the winter in the LWSC. The
other 22 fish did not return to the LWSC until the next spring. Overall, the median date to return
to the LWSC was April 2 for fish > 350 mm FL (size at tagging) and April 4 for fish < 350 mm
FL. Date of return ranged from March 4 to May 23. Most smallmouth bass returned to the
LWSC when water temperatures were 6-9oC, which was just before the spring warming phase
(Figure 33).
Eleven smallmouth bass were observed to migrate back to Lake Washington a second time.
The median second return date was July 11th
, which was similar to July 8th
observed for the first
return date of fish > 350 mm FL. Only two of the 11 fish were observed to return to the LWSC a
second time (Figure 34); these fish were detected 685 and 758 days from the date of release.
0
2
4
6
8
10
12
14
16
18
20
0
1
2
3
4
5
6
1-Feb 1-Mar 29-Mar 26-Apr 24-MayT
em
pera
ture
(oC
)
Nu
mb
er
of fi
sh
Date
2007 - SMB
2008 - SMB
2007 - temp.
2008 - temp.
FIGURE 33. Weekly number of tagged smallmouth bass (SMB, solid lines) that returned to the LWSC and water
temperatures (temp., dashed lines) in Montlake Cut (1 m depth; King County water quality station). Smallmouth
bass that returned in 2007 were tagged in 2006 (May-July) and those that returned in 2008 were tagged in either
2007 or 2006 (May-July). These smallmouth bass spent the fall and winter in Lake Washington before returning to
the LWSC.
Smallmouth bass – Spring movement into LWSC

LWSC Predator Acoustic Tracking, 2006-2009
FINAL DRAFT September 2010
43
FIGURE 34. Daily movement of two smallmouth bass between Lake Washington and the LWSC, May 2006 –
June 2008. Union Bay denotes that the fish was detected at the west end of Union Bay. Red circles are the date of
release in the LWSC; Fish #192 was 415 mm FL at release and #200 was 408 mm FL. Each data point indicates at
least one detection was made for a particular date. Both fish appeared to inhabit Portage Bay when they were in the
LWSC; #192 was usually found near Stan Sayres Park when it was in Lake Washington while #200 was often
detected by the Lakeshore Condominium receiver as well as near Sand Point.
Smallmouth bass appeared to return to the same general area of the LWSC as they were
captured the previous year. Ten of eleven returning fish that were captured in Portage Bay were
not detected further west than the University Bridge receiver; whereas, those captured at Gas
Works all moved past the University Bridge and most were found at Gas Works Park (Figure
35). Also, two smallmouth bass (# 192 and # 210; Figure 36) that overwintered in Lake
Washington and then were recaptured by anglers in 2007 were found at the same exact location
in the LWSC as they were captured in 2006.
0.5
1
1.5
2
2.5
3
3.5
5/1
/2006
6/1
/2006
7/1
/2006
8/1
/2006
9/1
/2006
10/1
/2006
11/1
/2006
12/1
/2006
1/1
/2007
2/1
/2007
3/1
/2007
4/1
/2007
5/1
/2007
6/1
/2007
7/1
/2007
8/1
/2007
9/1
/2007
10/1
/2007
11/1
/2007
12/1
/2007
1/1
/2008
2/1
/2008
3/1
/2008
4/1
/2008
5/1
/2008
6/1
/2008
Lake
LWSC
ke
Union Bay
Jun Aug Oct Dec Feb Apr Jun Aug Oct Dec Feb Apr Jun
# 192
0.5
1
1.5
2
2.5
3
3.5
5/1
/2006
6/1
/2006
7/1
/2006
8/1
/2006
9/1
/2006
10/1
/2006
11/1
/2006
12/1
/2006
1/1
/2007
2/1
/2007
3/1
/2007
4/1
/2007
5/1
/2007
6/1
/2007
7/1
/2007
8/1
/2007
9/1
/2007
10/1
/2007
11/1
/2007
12/1
/2007
1/1
/2008
2/1
/2008
3/1
/2008
4/1
/2008
5/1
/2008
6/1
/2008
Lake
LWSC
ke
Union Bay
Jun Aug Oct Dec Feb Apr Jun Aug Oct Dec Feb Apr Jun
# 200
Date
Smallmouth bass movements

LWSC Predator Acoustic Tracking, 2006-2009
FINAL DRAFT September 2010
44
0
2
4
6
8
10
12
Portage Bay Gas Works
Release location
Nu
mb
er
of
fish
King County Lab
Northwest Lake Union
Gas Works Park
University Bridge
FIGURE 35. Furthest west detection of smallmouth bass (2007 and 2008) that returned to the LWSC from tagging
the previous year. These fish were captured (tagged with Vemco acoustic tags) and released in the LWSC and then
spent the fall and winter in Lake Washington and returned to the LWSC in the spring. Size at tagging ranged from
260-450 mm FL (mean, 362 mm FL). The return locations are arranged from east (University Bridge is furthest
east) to west (King County Lab is furthest west). Release and return locations are shown in Figure 2.
FIGURE 36. Photo of smallmouth bass #210 that was recaptured in north Portage Bay, LWSC, June 4, 2007. This
fish was recaptured within a few meters of where it was caught and released on May 15, 2006. Between July 9,
2006 and March 4, 2007 this fish was in Lake Washington. The large red scar near the pelvic fins is the location of
the incision where the tag was implanted (note the sutures were still present).
Smallmouth bass – returning fish

LWSC Predator Acoustic Tracking, 2006-2009
FINAL DRAFT September 2010
45
Within Lake Washington, smallmouth bass from LWSC were found in numerous locations
throughout the lake. For example, fish # 212 and #3873 were found at the extreme north end of
the lake, and fish # 196 and #3896 were found in the south end of the lake (#196 near Coleman
Point and fish #3896 at the mouth of Taylor Creek).
Although we did not closely monitor the movements of smallmouth bass in Lake
Washington, we did obtain some general information on their locations and movements. During
the time when both the south (west I-90 Bridge) and north (St. Edwards Park) lake receivers
were operational, 44 tagged smallmouth bass entered the lake from the LWSC. Of those, 16
were never detected at either receiver, five were detected at both receivers, 13 were only detected
at the west I-90 Bridge receiver and 10 were detected just at the St. Edwards Park receiver. The
number of fish at the St. Edwards Park receiver may be underestimated because the receiver was
not operational from Nov 11, 2006 to May 10, 2007.
Results of mobile tracking also indicated smallmouth bass were widespread throughout the
lake. However, most fish were found in either Area 1 or 2 (Figure 37 [see Figure 2 for map]).
The number of fish in areas 1 and 5 is probably underestimated because these areas were not
always surveyed due to time constraints. Two areas of the lake where we found several fish
were the northwest shoreline from Wolf Bay to the north side of Sand Point and the southwest
shoreline from Stan Sayres Park to Seward Park. There was no apparent relation between where
in the lake smallmouth bass were found and their release location or size class.
Combining results of stationary and mobile receivers, each smallmouth bass was often within
a localized area of Lake Washington; however, in some cases they moved a relatively long
distance in a short period of time. For example, fish #4360 moved a distance of approximately
10 km in five days; from Hunts Point (February 21, 2008) to east I-90 Bridge (February 26,
2008). Fish #200 was usually near the Lakeshore Condominium receiver; however, on one
occasion (November 1, 2006) it moved to the west I-90 receiver (approximately 5 km) in less
than one day and then returned to the Lakeshore Condominium receiver five days later.
Of the 11 smallmouth bass we detected migrating back to Lake Washington on the second
year after release, six showed some degree of site fidelity within the lake between years, one did
not, and for the other four we had few lake detections the second year.
Results of Vemco depth tags indicated smallmouth bass generally inhabit shallow water (0-8
m) from May to September. As water temperatures cool, they move to deeper waters.
Smallmouth bass in both the LWSC (Figure 38) and Lake Washington (Figure 39) displayed this
general trend. Fall and winter depth ranged from 10 to 35 m deep.
Based on HTI and Vemco tracking, smallmouth bass appear to often be inactive at night and
remain at the same depth. At dawn, they appear to be more active and range across a wide range
of depths (Figure 40). Most fish occupied a wide range of depths during dawn, day, and dusk;
however, we did observe one fish (#222) that almost always occupied the same depth (Figure
40). This may be indicative of a nest-guarding male.
LWSC Predator Acoustic Tracking, 2006-2009
FINAL DRAFT September 2010
46
0
10
20
30
40
50
60
1 2 3 4 5
Area
Pe
rce
nt
Secondary area
Primary area
FIGURE 37. Percent of smallmouth bass (n = 39) that were located (mobile tracking) in different areas of Lake
Washington, 2006 and 2007. The primary area is the area of the majority of detections for each fish. Secondary
area is the other lake areas where each fish was found. Area locations are shown in Figure 2.
Smallmouth bass – Lake Washington mobile tracking

LWSC Predator Acoustic Tracking, 2006-2009
FINAL DRAFT September 2010
47
FIGURE 38. Mean daily depth (m) of smallmouth bass #117 in three areas of the lower Lake Washington basin,
May – December 2007.
0
5
10
15
20
25
30
35
1-Jan 31-Jan 2-Mar 1-Apr 2-May 1-Jun 1-Jul 1-Aug 31-Aug 30-Sep 31-Oct 30-Nov 30-Dec
Date
Dep
th (
m)
0
2
4
6
8
10
12
14
16
18
20
22
24
Tem
pera
ture
(oC
)
77-Lk 115-Lk 118-Lk 222-Lk223-Lk 224-Lk 231-Lk 253-Lk77-SC 115-SC 118-SC 222-SC223-SC 224-SC 231-SC 253-SCLk temp. at 8 m SC temp. at 3 m
Jan Feb Mar Apr May Jun Jul Aug Sep Oct Nov Dec
FIGURE 39. Mean daily depth (m) of eight smallmouth bass in the Lake Washington Ship Canal (SC; dashes) and
Lake Washington (Lk; diamonds). Data from 2006-2008 were combined.
Smallmouth bass #117 – Depth use
0
2
4
6
8
10
12
5/1/2007 5/31/2007 7/1/2007 7/31/2007 8/31/2007 9/30/2007 10/31/2007 11/30/2007 12/31/2007
DateD
ep
th (
m)
0
2
4
6
8
10
12
14
16
18
20
22
24
Te
mp
era
ture
(oC
)
LWSC
Union Bay
Lake Washington
Lk temp. at 8 m
LWSC temp. at 3 m
May Jun Jul Aug Sep Oct Nov Dec
Smallmouth bass – Mean daily depth

LWSC Predator Acoustic Tracking, 2006-2009
FINAL DRAFT September 2010
48
FIGURE 40. Depth distribution (m) of four smallmouth bass in the Lake Washington Ship Canal, 2007. Red lines
indicate the average time for dawn and dusk during the dates shown.
0
2
4
6
8
10
0:00 3:00 6:00 9:00 12:00 15:00 18:00 21:00 0:00
Time
De
pth
(m
)
0
2
4
6
8
10
0:00 3:00 6:00 9:00 12:00 15:00 18:00 21:00 0:00
Time
De
pth
(m
)
.
0
2
4
6
8
10
0:00 3:00 6:00 9:00 12:00 15:00 18:00 21:00 0:00
Time
De
pth
(m
)
.
0
2
4
6
8
10
0:00 3:00 6:00 9:00 12:00 15:00 18:00 21:00 0:00
Time
De
pth
(m
)
.
Fish #226
June 14-26, 2007
Fish #115
July 7-22, 2007
Fish #222
May 29-June14, 2007
Fish #255
June 14-30, 2007
Smallmouth bass – Depth distribution

LWSC Predator Acoustic Tracking, 2006-2009
FINAL DRAFT September 2010
49
Largemouth bass
All Vemco tagging of largemouth bass was done in 2006 (Table 7). In 2007 and 2008, no
largemouth bass collected were large enough to be tagged. All tagged largemouth bass were
detected at least 97 days (maximum, 743 days) from the date of release. Unlike smallmouth
bass, largemouth bass were never detected in the lake except at the Webster Point and Lakeshore
Condo receivers. Lack of detections in the lake may indicate that they did not move further east
than Union Bay and they rarely moved into other areas of Lake Washington. The three small
largemouth bass from Portage Bay (#215, #3890, and #3894) were primarily detected in Portage
Bay, mostly at the UW Hatchery but occasionally at the University Bridge receiver. The largest
largemouth bass (#197) was captured in Portage Bay and moved to Union Bay six days after
release. It was usually detected at one of the three receivers in the Union Bay area. Although it
occasionally moved back into the LWSC, it was usually only there for a few hours. The other
largemouth bass (#17188) was from Gas Works Park and was detected primarily in Lake Union
(Figure 41). Fish #17188 was detected at each LWSC receiver except the Salmon Bay receiver
over a 743-day period (July 19, 2006 to July 31, 2008). For both 2006 and 2007, detections of
fish #17188 in May to November were widespread across the receivers. In November-March,
when water temperatures were low, almost all detections were only at one receiver, northwest
Lake Union (Figure 41).
TABLE 7. Largemouth bass tagged with Vemco acoustic tags in the LWSC in 2006. Location is the area where
the fish were captured and released. Tag model specifications are given in Table 2. Percent body weight is the tag
weight to fish weight percent.
Tag Fork length Weight Percent
Date released Location model Tag ID (mm) (g) body weight
14-Jun West Montlake Park V13-1L 197 410 1,350 0.81
14-Jun North Portage Bay V9-2L 215 201 123 3.82
21-Jun West Montlake Park V9-1L 3890 215 130 2.77
30-Jun West Montlake Park V9-1L 3894 192 112 3.21
19-Jul Gas Works Park V13-1L 17188 290

LWSC Predator Acoustic Tracking, 2006-2009
FINAL DRAFT September 2010
50
0
5
10
15
20
25
0
1
2
3
4
5
6
7
1-Jul31-Jul31-Aug30-Sep31-Oct30-Nov31-Dec30-Jan2-Mar1-Apr2-May1-Jun2-Jul1-Aug1-Sep1-Oct1-Nov1-Dec1-Jan31-Jan2-Mar1-Apr2-May1-Jun2-Jul1-Aug1-Sep1-Oct1-Nov
Tem
pera
ture
(oC
)
Jul Sep Nov Jan Mar May Jul Sep Nov Jan Mar May Ju l Sep
South Lake Union
NW Lake Union
UW Hatchery
University Bridge
King County Lab
UW Rowing Center
Webster Point
2006 2007 2008
Date
FIGURE 41. Hourly locations (black line) of largemouth bass #17188 based on seven fixed receivers, July 2006 –
September 2008. The receiver locations are arranged (top to bottom) from the furthest east to furthest west. If a fish
was detected at two receivers during the same hour, the detections are indicated by a value midway between the
receivers. See Figure 2 for receiver locations. Temperature data (pink line; 1 m depth) were from a King County
water quality station at the east end of the Fremont Cut.
Largemouth bass #17188

LWSC Predator Acoustic Tracking, 2006-2009
FINAL DRAFT September 2010
51
DISCUSSION
Acoustic tracking techniques proved to be an effective method to determine habitat use
and movement patterns of predatory fish in the LWSC. Due to low catch rates of northern
pikeminnow and largemouth bass, fine-scale tracking was done primarily with smallmouth bass.
For the two tracking sites combined, we obtained fine-scale tracking results for 43 smallmouth
bass, which comprised over 4.9 million data points. For course-scale tracking, we tagged 111
fish, which included 72 smallmouth bass, 34 northern pikeminnow, and 5 largemouth bass. We
were able to get seasonal movement patterns of 57 of 72 (79%) smallmouth bass. Most northern
pikeminnow moved to Lake Washington after tagging and we obtained limited movement
information. Overall, we only obtained good tracking results for six northern pikeminnow, of
which only two produced good long-term (> 3 months) movement data. All largemouth bass
were tracked for at least three months, largely because they remained in the LWSC or only
moved a short distance to Union Bay.
Spring/summer habitat use - smallmouth bass
At the Gas Works Park site, we found smallmouth bass strongly selected gravel/sand
substrate; however, this relationship may be confounded by depth selection. Gravel/sand
substrate at Gas Works Park was generally the dominant substrate type within the 2-6 m depth
range, which is often the preferred depth of smallmouth bass. Larger substrates such as cobbles
and boulders are commonly selected by smallmouth bass (Coble 1975; Fresh et al. 2001) but
because large substrates were primarily in shallow water at Gas Works Park, smallmouth bass
probably did not select large substrates. At our SR 520 bridge site, cobble and boulder substrates
are in deeper waters (4-6 m deep) and smallmouth bass showed a strong positive selection these
substrates (Celedonia et al. 2009). Also, deeper areas at Gas Works Park consisted primarily of
silt. These areas may be avoided because they are either too deep or because of the fine
sediments.
The selection of gravel substrates may also be partly related to spawning. Smallmouth bass
often construct their nests in gravel substrate (Bozek et al. 2002; Orth and Newcomb 2002). The
large area at the southeast point of Gas Works Park may be ideal for spawning because of the
substrate type, slope, and perhaps other factors such as water velocity.
Based on our previous work in the LWSC and Lake Washington (Celedonia et al. 2008b) and
work of other researchers (Sammons and Bettoli 1999), we expected the rip rap area of Gas
Works Park to be selected over other shoreline types. However, we found only 4 of 22 fish
showed any selection for rip rap. Of the fish that selected rip rap, they were all 150-250 mm FL.
The size and depth of the rip rap may create better habitat conditions for smaller bass. Similarly,
smallmouth bass that were closely associated with small, shallow rip rap at the Seattle Tennis
Club shoreline in Lake Washington were also 150-250 mm FL (Celedonia et al. 2008b). Cole
and Moring (1997) found large smallmouth bass (> 400 mm FL) in Green Lake, Maine were
often located in the areas with no cover; whereas smaller fish were usually closely associated
with some type of cover. Sammons and Bettoli (1999) did not find any effect of fish size in the
use of rip rap in a Tennessee reservoir. Larger smallmouth bass may prefer rip rap that extends

LWSC Predator Acoustic Tracking, 2006-2009
FINAL DRAFT September 2010
52
into deeper waters and has larger interstitial spaces. Spawning site selection and prey
availability may also cause some smallmouth bass to prefer other shoreline areas over rip rap.
In reviews of smallmouth bass literature, authors have generally concluded that smallmouth
bass typically prefer rocky shorelines and avoid thick beds of aquatic macrophytes (Hubbs and
Bailey; Coble 1975; Becker 1983). At both HTI tracking sites, we found smallmouth bass were
commonly associated with macrophytes. Smallmouth bass commonly spawn near some type of
cover and macrophytes may provide this cover if other more preferred types (e.g., large wood
debris) are not available; however, macrophytes also provide cover for smaller-bodied nest
predators on bass eggs, larvae, and fry. Additionally, the use of macrophytes may provide
smallmouth bass an ideal location to observe and ambush juvenile salmonids that are in the open
water. Other preferred prey, such as signal crayfish and sculpin Cottus spp., may be abundant in
macrophyte beds.
At the west end of the SR 520 bridge, we found smallmouth bass preferred sparse vegetation
and the offshore edge of vegetation and avoided dense and moderately dense areas of
macrophytes (Celedonia et al. 2009). In contrast, we found few differences between the use of
different densities of macrophytes at Gas Works Park or the I-5/University Bridge site. The
macrophyte beds at the SR 520 bridge were substantially larger and often reached the surface.
The foraging success of smallmouth bass may be greatly reduced in these large beds (Cooper and
Crowder 1979, Wiley et al. 1984). In our LWSC sites, the macrophtye beds may be small
enough that smallmouth bass can still forage effectively. Also, the substrate of the LWSC sites
(i.e., gravel) may be more conducive for spawning than the substrate at the SR 520 bridge, which
is predominantly silt.
At the I-5/University Bridge site, smallmouth bass inhabited somewhat deeper water than at
Gas Works Park. Differences were largely due to the use of the large structures of the University
Bridge which are mostly in water that is 8-10 m deep. Large deep structures such as the
University Bridge may allow smallmouth bass to inhabit deeper water that is further from shore
and have more overlap with juvenile salmonids. At I-5/University Bridge site as well as south
Lake Union and the Lakeshore Condos near the SR 520 bridge, juvenile Chinook salmon have
been observed using the offshore areas of large deep structures (Celedonia et al. 2010; Celedonia
et al. 2009) and probably have some degree of overlap with smallmouth bass. At Gas Works
Park, their overlap may be minimal because juvenile salmonids are offshore where water depths
are > 10 m deep (Celedonia et al. 2010) and smallmouth bass are primarily close to shore in
water that is 0-8 m deep.
Depth of smallmouth bass within the water column (vertical distribution) was unknown at
our study sites. We attempted to reanalyze the I-5/University Bridge data to obtain 3D positions;
however, we only obtained results for one smallmouth bass that was actively migrating through
the middle of the tracking array. The other bass were close to the structures and could not be
tracked in 3D, probably due to the tag signal bouncing off the structures and creating a large
error in the vertical axis calculation. We did examine results from the SR 520 bridge study
(Celedonia et al. 2009) where two double-tagged smallmouth bass were present (HTI tag for the
horizontal axis and a Vemco tag for the vertical axis). Results did show that both smallmouth
bass shifted their vertical distribution to shallower waters when they were close to the bridge

LWSC Predator Acoustic Tracking, 2006-2009
FINAL DRAFT September 2010
53
structures. If there was no effect of the structures on bass vertical distribution, we would have
expected them to be in deeper water near the bridge because the density and height of
macrophytes was substantially less under the bridge. Therefore, these smallmouth bass provide
preliminary evidence that large structures may allow smallmouth bass to inhabit shallow waters
and have greater overlap with salmonids. Under more natural conditions, smallmouth bass
generally are close to the substrate (Emery 1973) but occasionally they may even be at the water
surface (Munther 1970). Further tagging efforts with double-tagged smallmouth bass is probably
needed to get a better picture of their vertical distribution.
0
10
20
30
40
50
60
70
1-2 2-3 3-4 4-5 5-6 6-7 7-8
SR 520 bridge
Open area
0
10
20
30
40
50
60
1-2 2-3 3-4 4-5 5-6 6-7 7-8
Depth category (m)
Perc
en
t
Fish #4547,117
Fish #4627,223
FIGURE 42. Water column depth distribution of two smallmouth bass near the west end of the SR 520 bridge,
Lake Washington, May-June 2007. Shaded bars indicate when fish were directly under or within 5 m of the bridge;
open bars indicate when fish were in areas away from the bridge. Each bass was tagged with a HTI acoustic tag
(first number) and a Vemco depth tag (second number). Horizontal positions were obtained from the HTI tag,
while the depth data was obtained from the Vemco tag. Both fish were primarily in water that was 4-6 m deep. See
Celedonia et al. 2009 for a description of the study area and Appendix 4 for fish information.

LWSC Predator Acoustic Tracking, 2006-2009
FINAL DRAFT September 2010
54
Seasonal movements
Northern pikeminnow
Most northern pikeminnow released in the LWSC with Vemco transmitters moved to Lake
Washington shortly after release and often were not detected again. In an earlier study,
Brocksmith (1999) tagged 19 northern pikeminnow with acoustic tags in a variety of locations in
Lake Washington and found many pikeminnow moved to a new location immediately after
release and then stayed within their new area over the tracking duration (1-5 months). Martinelli
and Shively (1997) also reported that radio-tagged northern pikeminnow in the Columbia River
often were displaced several kilometers from their release site. Therefore, large numbers of
northern pikeminnow may need to be tagged to obtain a reasonable sample size of fish that
display typical movement patterns in and out of the LWSC. Most of our LWSC results were
based on six fish out of the 22 fish tagged and released in the LWSC. Also, there appeared to be
large variability in movement patterns between individuals. Therefore, a large sample is needed
to account for post-tagging movements and natural variability is fish behavior. Perhaps 150-200
fish may be needed for tagging.
In contrast, tagging efforts in Cultus Lake, British Columbia found northern pikeminnow
remained close to their release site and were often recaptured multiple times at that site
(Bradford et al. 2007). In that study, fish were collected with a trap net and were subsequently
externally tagged with a Floy-tag without the use of an anesthetic. Other studies including this
study may have employed more intrusive capture techniques (i.e., gill nets and electrofishing).
As well, surgical procedures and the use of an anesthetic could have profound effects on their
short-term behavior. Martinelli and Shively (2007) suggested that it takes about seven days for
internally-tagged northern pikeminnow to act naturally and forage the same as non-tagged fish.
One unanticipated element of our study was the difficulty collecting northern pikeminnow.
Catch rates during angling and trot line efforts were generally low. The use of bait appeared to
improve catch rates but often the hook was swallowed and the fish was not in good condition.
Beach seining was labor intensive and catch rates were generally low. Also, there are few good
seining sites in the LWSC and often underwater debris becomes entangled in the net. Gill nets
appeared to be the most effective method but sometimes the fish became too entangled and the
fish was injured and could not be tagged. Also, catch rates were generally low until July, which
is the same time when adult anadromous salmonids are present, thus bycatch could be a problem.
Improvements in the methodology of collecting northern pikeminnow need to be found before
any large-scale tagging project is undertaken. For example, Bradford et al. (2007) were able to
collect large numbers of northern pikeminnow in Cultus Lake, British Columbia with a trap net.
Following their initial movements after tagging, many of the northern pikeminnow appeared
to move to a new area in Lake Washington and did not have any large-scale movement patterns.
Results of tracking work at the SR 520 Bridge (Celedonia et al. 2008a; Celedonia et al. 2009)
and other sites in Lake Washington (Brocksmith 1999) indicate northern pikeminnow often
occupy a small, relatively defined area (e.g. 20 ha). In Cultus Lake, they also appear to have
limited movements during the summer (Bradford et al. 2007). Although many northern
pikeminnow appear to be move within a small area, there also appears to be another segment of

LWSC Predator Acoustic Tracking, 2006-2009
FINAL DRAFT September 2010
55
the population that is quite mobile. We documented three northern pikeminnow that made
numerous trips in and out of the LWSC. We were also able to track one of them in the lake,
where it was detected in a wide variety of locations. Gender differences during spawning could
potentially account for this: females may only occupy spawning grounds long enough to spawn,
and might need to return multiple times to spawn out completely; whereas males tend to remain
on the spawning grounds throughout the spawning season.
We observed eight northern pikeminnow migrating from the SR 520 bridge area to the I-90
bridge within a one week period (June 5-11, 2007). Additionally, the northern pikeminnow that
moved in and out of the LWSC all left the LWSC for the first two weeks of June. These
movements could be related to spawning activity. Exact spawning timing is not well known.
Based on a northern pikeminnow maturity index, Olney (1975) felt in Lake Washington they
spawned from early June to early August with a peak in July. They may spawn periodically
during this period based on certain environmental cues such as the lunar cycle.
The locations of northern pikeminnow spawning areas in Lake Washington are also not well
known. Rubble, cobble, and gravel areas have been reported as northern pikeminnow spawning
areas in lakes (Patten and Rodman 1969; Wydoski and Whitney 2003). In general, these
substrate types are rare in the LWSC and therefore it is doubtful they spawn in the LWSC.
Additionally, low catch rates of northern pikeminnow in the LWSC would suggest the LWSC is
not a major spawning area. Because we observed several northern pikeminnow (10 of 21 that
were tagged in or near the LWSC) in the south part of the lake near Mercer Island in June or
July, there may be some major spawning areas in that part of the lake.
Movements of northern pikeminnow into the LWSC may be more related to foraging than
spawning. Northern pikeminnow are known to concentrate in areas where juvenile salmonids or
other prey are abundant (Collis et al. 1995; R. Tabor, unpublished data). Under lab conditions,
northern pikeminnow prey heavily on juvenile salmonids at night and little predation occurs
during the day (Petersen and Gadomski 1994). Therefore, our observed movements into the
LWSC at night might be related to foraging activity.
Initial spring movements of northern pikeminnow into the LWSC were only documented for
two fish; however, both entered about the same time of the year. Fish #17222 moved into the
LWSC on May 20, 2007 and fish #22507 entered on May 21, 2009. Movement of these fish
may have been related to the release of hatchery salmonids from the UW Hatchery which
occurred on May 14 in both years. Similarly, Collis et al. (1995) found the abundance of
northern pikeminnow near Columbia River hatcheries increased following the release of juvenile
salmonids. Within Lake Washington, northern pikeminnow also aggregate in the south end on
the lake at the mouth of the Cedar River in March when adult longfin smelt Spirinchus
thaleichthys are moving upstream to spawn (R. Tabor, unpublished data).
It is unclear if conditions in the LWSC are optimal for northern pikeminnow. In Lake
Washington, northern pikeminnow inhabit shallow water (4-6 m deep) during the day in late-
spring and summer and prefer areas with aquatic macrophytes (Celedonia et al. 2008a; Celedonia
et al. 2009). They do not show any preference for large overwater structures. In the LWSC,
large overwater structures are numerous; in some areas, aquatic macrophtye abundance is
LWSC Predator Acoustic Tracking, 2006-2009
FINAL DRAFT September 2010
56
reduced due to shading from these structures. Also, the relative availability of prey may be
lower in the LWSC than Lake Washington. Juvenile salmonids are abundant in the LWSC but
other prey items (i.e., signal crayfish, longfin smelt, threespine stickleback, and sculpin) may be
more available in Lake Washington than in the LWSC.
The three northern pikeminnow from which we obtained extensive depth information were
all double-tagged with a HTI tag. Results of HTI tracking indicated that during the day, these
northern pikeminnow were concentrated in shallow water close to shore (Celedonia et al. 2008a;
Celedonia et al. 2009). At night, they dispersed over a large area and often moved offshore.
Combining Vemco and HTI tracking data indicates that, at night, two of the fish inhabited mid-
water and surface waters; while the other fish primarily inhabited surface waters. Location of
prey resources may influence their vertical distribution at night.
Results of our tracking work suggest northern pikeminnow primarily inhabit Lake
Washington and occasionally move into the LWSC to forage. Our results in combination with
other studies suggest northern pikeminnow is not a major predator in the LWSC because they do
not appear to be abundant. Gill net catches of northern pikeminnow during our study were
generally low in comparison to catch rates in Lake Washington. During electrofishing sampling
in 1999, catch rates were generally low (Tabor et al. 2004). Gill net catch rates by the
Muckleshoot Indian Tribe in 1997 were also low (B. Footen, unpublished data). Northern
pikeminnow may be at their spawning sites in Lake Washington during June and July when
juvenile salmonids are abundant in the LWSC. Additional sampling (abundance estimates and
additional tracking) is needed to reach more conclusive results but at present they do not appear
to be a major predator of juvenile salmonids in the LWSC.
Smallmouth bass
On a yearly basis, adult smallmouth bass typically have three major phases: 1) spawning in
the spring, 2) summer/fall rearing within a well-defined home range, and 3) overwintering
(Ridgway et al. 2002). In some lakes and rivers, most fish inhabit the same area for all three
phases and have a well-defined home range throughout the year (Todd and Rabeni 1989; Beam
1990). In other systems, major phases may not be in close proximity to each other, and thus,
smallmouth bass make regular, predictable migrations. Smallmouth bass in Embarrass River,
Wisconsin moved 30-100 km downstream in the fall from a small stream to a large deep river to
overwinter (Langhurst and Schoenike 1990). Kraai et al. (1991) found they moved up to 6.5 km
in Meredith Reservoir, Texas apparently to spawning areas. Some lake-dwelling populations
move into tributaries to spawn (Webster 1954; Robbins and MacCrimmon 1977; Gerber and
Haynes 1988) or to the confluence of a tributary (Garren et al. 2001). For example in Lake
Simcoe, Ontario, smallmouth bass migrate upstream 3.5 km from the lake to reach their riverine
spawning area (Robbins and MacCrimmon 1977). In a review of literature of seasonal
movements of smallmouth bass in streams, Lyons and Kanehl (2002) found migration distance
correlated with winter severity; in streams that do not freeze they tend to be sedentary but in
systems with ice they often travel more than 5 km.
Smallmouth bass in a particular water body may often consist of a mixture of fish that are
either sedentary or mobile. In Lake Sammamish, 81% were sedentary and 19% were mobile
LWSC Predator Acoustic Tracking, 2006-2009
FINAL DRAFT September 2010
57
(Pflug and Pauley 1983). VanArum et al. (2004) found that after spawning 57% were migratory
(moved a mean of 5.3 km) and 42% were sedentary. Smallmouth bass in the LWSC appear to be
primarily mobile fish; most left the LWSC in the summer and returned the following year after a
summer/fall rearing phase and an overwintering phase in Lake Washington. Some fish (e.g. fish
#206) that remained in the LWSC year-round were often quite mobile.
During spring and early summer, smallmouth bass in the LWSC appeared to establish
defined home ranges. Results of our tracking research (HTI tags) and a mark-recapture study
(Tabor et al. 2004) indicated that most smallmouth bass in the LWSC did not move substantially
while in the LWSC. Spawning activity, especially nest guarding by males, probably reduces
their movements. Also prey, such as juvenile salmonids, are abundant and bass may only need
to forage over a small area (Savitz et al. 1983).
Although we were unable to determine the exact position of most returning smallmouth bass,
many appeared to return to the same general area of the LWSC as the previous year. Two fish
(#192 and #210) were caught in the LWSC in the same location as in 2006 after overwintering in
Lake Washington. Returning to the same general area each year is probably an indication of nest
site fidelity. In other studies, nest site fidelity has been observed in some proportion of the
spawning population (Robbins and MacCrimmon 1977; Ridgway et al. 1991; Garren et al. 2001).
Ridgway et al. (2002) found nesting males showed a high degree of nest site fidelity, with over
70% returning to within 100 m of the nest site from the previous year, even though their nesting
site was not part of their summer home range.
Most returning smallmouth bass appeared to move into LWSC sometime from early March
to mid-April. Timing of their return to the LWSC appears to correspond somewhat to the initial
warming period in the spring. This appears to be consistent to movements observed by
Montgomery et al. (1980) in Columbia River sloughs where smallmouth bass entered the sloughs
from mid-March to April and returned to the main channel in August. Movements were believed
to be directly related to spawning and the primary stimulus for moving into the sloughs was
temperature. In the LWSC, some of their principal prey items (i.e., sculpin and signal crayfish)
may not be available during this time because of the low water temperatures. Juvenile salmonids
typically do move into the LWSC until late April and May. Also, smallmouth bass should have
low consumption rates during early March to mid-April because of the low water temperatures
(Wydoski and Whitney 2003). Therefore, timing of smallmouth bass entry into the LWSC may
be more related to spawning than foraging.
Generally, smallmouth bass returned to the LWSC a few weeks to a few days before there
was any noticeable increase in temperature. Suski and Ridgway (2009) found smallmouth bass
move quickly from deep water to shallow water once the water temperature warms in the spring.
The one returning smallmouth bass (#231) with a depth tag moved into the LWSC in relatively
deep water (6-10 m) and did not move into shallow water (1-3 m) until the water temperature
had risen substantially. Taken together, this suggests smallmouth bass move into the LWSC
before the spring warming period and stage in deep water and wait until water temperatures
warm (approximately 15oC) to move into shallow warm to spawn. Therefore, other
environmental cues (e.g., day length) may also be important in influencing movement into the
LWSC.

LWSC Predator Acoustic Tracking, 2006-2009
FINAL DRAFT September 2010
58
Within some lakes, smallmouth bass appear to have discrete populations (Stone et al. 1954;
Webster 1954; Fry and Watt 1957). The populations can become reproductively isolated
because spawning occurs in different areas of the lake and they have strong nest site fidelity.
Genetic analyses have also shown that there are differences between spawning populations
(Stepien et al. 2007). Although smallmouth bass have only been in Lake Washington for a
limited number of generations, different spawning populations may exist between Lake
Washington and the LWSC. Although they may intermingle in the summer in the lake, the
LWSC and Lake Washington populations may be reproductively isolated.
Additionally, smallmouth bass in the LWSC may consist of two or more populations. One
population may be an east population in Portage Bay and a west population in Lake Union and
Fremont Cut. The size of smallmouth bass in the west section of the LWSC appears to be
smaller than the east (Tabor et al. 2004), which may be a result of a higher percentage of fish
remaining in the LWSC where foraging conditions during the late summer and fall may not be as
good as in Lake Washington.
Because smallmouth bass populations in the LWSC may be discrete from populations that
remain in Lake Washington year-round, bass removal efforts in the LWSC may have positive
effects on salmonid populations. Smallmouth bass would certainly recolonize vacated habitats
but this may take a few years. However for this to be feasible, a high removal rate would be
necessary.
Most smallmouth bass appear to leave the LWSC between mid-June and September.
Departure from the LWSC may be related to a variety of factors, such as cessation of spawning
activity, water temperature, water quality, and prey availability. Smallmouth bass generally
spawn from late April to June and therefore some fish may leave the LWSC after spawning has
been completed.
Peak surface temperatures in the LWSC are approximately 22-24oC and it is unclear if these
water temperatures would cause them to leave. Optimum temperature for smallmouth bass
growth is 25-27oC (Moyle 2002) and under lab conditions, adults select water that is 27-31
oC
(Armour 1993). However, in many field studies, smallmouth bass occupy areas where
temperatures were 20-22oC and avoid temperatures that exceed 25
oC (Gerber and Haynes 1988).
Savitz and Treat (2007) found summer movements in and out Lake Michigan harbors were
related to water temperature. Smallmouth bass often appear to select coolwater habitats and it is
unclear whether their use of these habitats is related to temperature or other factors.
Smallmouth bass often move to deeper water in the late summer (Cole and Moring 1997).
Low dissolved oxygen levels in these deeper areas in the LWSC may reduce the amount of
preferred habitat available. Other changes in water quality, such as water clarity, could also
influence their preference to return to Lake Washington. Smallmouth bass generally prefer clear
water (Moyle 2002) and because Lake Washington generally has better water clarity than the
LWSC, they may prefer habitat conditions in Lake Washington.
LWSC Predator Acoustic Tracking, 2006-2009
FINAL DRAFT September 2010
59
The availability of principal prey items (juvenile salmonids, sculpin, and signal crayfish) for
smallmouth bass in the LWSC may be greatly reduced in July and August. After mid-July, the
abundance of juvenile salmonids in the LWSC is greatly reduced. Additionally, as water
temperatures warm, prickly sculpin Cottus asper typically move into deeper waters (Rickard
1980) and may be less available to smallmouth bass. In Lake Washington, their summer diet
consists of crayfish, sculpin, and threespine stickleback Gasterosteus aculeatus (Fayram and
Sibley 2000; Mazur 2004). These prey types may be more abundant in Lake Washington than in
the LWSC.
A population estimate of smallmouth bass in the LWSC was conducted in 1999 (Tabor et al.
2007). This estimate was based on a Schnabel multiple-pass mark-recapture effort. A key
assumption of this estimate was that there is minimal immigration and emigration (Ricker 1975).
Based on our observed timing of smallmouth bass returning to the LWSC, there does not appear
to be a substantial amount of immigration from May and July. However, there does appear to be
a substantial amount of emigration. The population estimate will need to be adjusted to take into
account emigration in June and July. Changes in the population estimate will subsequently result
in a change in the overall consumption estimate.
Largemouth bass
Of the three predator species we examined, largemouth bass seasonal movements occurred
over a smaller area. Although we only tagged five largemouth bass, they all appeared to stay in
the LWSC or close by in Union Bay. Home ranges of largemouth bass generally range from
<0.1 to 50 ha. Often largemouth bass have a limited home range (Lewis and Flickinger 1967;
Warden and Lorio 1975); however, home range size may vary depending on temperature
(Sammons and Maciena 2005), prey availability (Savitz et al. 1983), prey location (Sammons
and Maciena 2005), and habitat conditions (Sammons et al. 2003; Ahrenstorff et al. 2009). High
availability of prey fishes, such as juvenile salmonids, and adequate habitat conditions (i.e., silt
substrate with abundant macrophytes and in-water structures) in the LWSC and Union Bay may
reduce their home range size. Because we only tagged five fish and all but one were < 300 mm
FL, additional tagging is needed to reach more conclusive results.
Generally, largemouth bass appear to have restricted movements during the winter
(Karchesky and Bennett 2004; Hunter and Maceina 2008). There is some moderate level of
movement (Hanson et al. 2007) but their home range size is typically smaller than at other times
of the year (Sammons and Maciena 2005). The one largemouth bass (#17188) for which we
were able to obtain extensive seasonal information appeared to follow this general trend. This
fish was consistently found near the northwest Lake Union receiver throughout the winter and
nowhere else; whereas during other seasons it appeared to move to a variety of areas in the
LWSC.

LWSC Predator Acoustic Tracking, 2006-2009
FINAL DRAFT September 2010
60
Conclusions
Smallmouth bass inhabited a wide range of depths between 0 and 10 m deep but were
mostly found in the 2-4 m depth interval. The large area of the Gas Works Park site that was >
12 m deep was rarely used. Smallmouth bass strongly selected the bridge support structures at
the I-5/University Bridge site but also showed some positive selection for sparse vegetation,
vegetation edge, and nearshore overwater structures. At the Gas Works Park site, they showed a
selection for the beach shoreline and gravel/sand substrate. Smallmouth bass inhabited deeper
areas at the I-5/University Bridge site than at Gas Works Park; this was due largely to the use of
the deep support structures of the University Bridge. Large offshore, deep structures like the
University Bridge appear to allow smallmouth bass to inhabit offshore, deeper waters and
probably have greater overlap with juvenile Chinook salmon.
Course-scale tracking of smallmouth bass showed they have a strong seasonal migration
pattern between the LWSC and Lake Washington. Of the smallmouth bass we were able to
obtain seasonal movement information, 82% migrated to Lake Washington sometime between
June and October. Smallmouth bass < 350 mm FL were more likely to overwinter in the LWSC
and if they did migrate to Lake Washington, they migrated later in August-October. Most
returning smallmouth bass appeared to move into LWSC sometime from early March to mid-
April. Timing of their return to the LWSC appears to correspond to the initial warming period in
the spring and may be directly related to spawning. Smallmouth bass often showed some degree
of site fidelity between years for both spring/summer locations in the LWSC and
summer/fall/winter locations in Lake Washington. Because smallmouth bass often have a high
degree of spawning site fidelity, there can be different populations within the same water body.
Smallmouth bass in the LWSC may represent one perhaps two separate populations from
smallmouth bass that inhabit Lake Washington year-round.
Results of course-scale tracking of northern pikeminnow showed they primarily inhabit
Lake Washington and occasionally make forays into the LWSC lasting a few hours to several
days. Movements in and out of the LWSC occur primarily at night. Our results and results of
other studies suggest northern pikeminnow spend most of their time in Lake Washington and a
small portion of the population move into the LWSC for short periods of time. Overall, northern
pikeminnow do not appear to be a major predator of juvenile salmonids in the LWSC; however,
because of our small sample size further tagging is needed.
Only five largemouth bass were implanted with Vemco tags; however, they all appeared to
remain in the LWSC or were nearby in Union Bay. Each largemouth bass were tracked for at
least three months. The one largemouth bass that was tracked for two years appeared to have
restricted movements when water temperatures were cold (November-March) and moved to a
variety of areas in the LWSC during other times of the year.
LWSC Predator Acoustic Tracking, 2006-2009
FINAL DRAFT September 2010
61
ACKNOWLEDGEMENTS
An earlier draft of this report was greatly improved by suggestions from Michele Koehler,
Julie Crittenden, Keith Kurko, Rand Little, Gary Sprague, and Jonathan Frodge, Seattle Public
Utilities (SPU); Dave Beauchamp, University of Washington; Scott Stolnack, WRIA 8; and Brad
Thompson, U.S. Fish and Wildlife Service (USFWS).
We wish to thank the many USFWS employees that helped process the HTI data and assisted
with the field work; they included Andrea Henton, Christine Iverson, Tracey Scalici, Lindsy
Wright, Eleanor Bosman-Clark, James Curtis, Thomas Mohagen, James Steele, Eric Myers,
Jamie Sproul, Nathan Hyde, Becky Braley, Emily Dunklee, Tay Dunklee, Kevin Kennedy, Eric
Tallman, Mathew Wynn, and Matthew Zimmer. Jack Holbrook, Bob Clement, Chris Allar, and
Zuma Martin, USFWS provided technical support on data file transfer via a wireless cell phone
connection. We also wish to thank Bob Wunderlich and Brad Thompson, USFWS for input on
the project proposal and providing technical support.
We greatly appreciate all the assistance from Brian Footen, Eric Warner, and other
Muckleshoot Indian Tribe employees. The tribe provided invaluable assistance with the Vemco
data collections. We also thank Fred Goetz, Chuck Ebel, and other U.S. Army Corps of
Engineers (USACOE) employees for assistance with the Vemco equipment. Fish were collected
with help of government employees and volunteers including: Eric Tallman, USFWS; Danny
Estelle, Washington Department of Fish and Wildlife; and volunteers: Dave Seiler, Ken
Domingo, Dan S., and Scott Berestad. Much of the tracking work in 2007 and 2008 was
conducted in conjunction with another tracking project at the west end of SR 520 bridge; we
thank Phil Bloch and other Washington Department of Transportation employees for all their
assistance to make sure the two studies were compatible. Peter Rude, City of Seattle and Megan
King and Allison Geiselbrecht, Floyd|Snider provided GIS maps of Gas Works Park.
We thank Jon Wittouck, Tom Rogers, and Dave Beauchamp, University of Washington
(UW) for providing logistical support and helping us gain permission to use the UW dock
facilities. Police officers of the Seattle Harbor Patrol provide invaluable logistical support
including scuba diving operations to retrieve lost cables and hydrophones. Reg Reisenbichler
and Steve Rubin, U.S. Geological Survey also conducted scuba diving operations to look for lost
cables and hydrophones. USFWS boats for this project were kept at either the Seattle Harbor
Patrol or UW facilities. Hydroacoustic Technology, Inc. (HTI) provided technical support for
the equipment and tagging operation, as well as placing a HTI receiver at their facility. We
thank the managers of the Lakeshore West Condominiums, AGC Building, and other private
property owners for allowing us to place Vemco and HTI receivers on their property.
Funding for this study was provided by the SPU, USACOE, and King County. The project
was administered by Michele Koehler, Julie Crittenden, and Keith Kurko, SPU. They also made
invaluable contributions throughout the project including study design of this project and
providing logistical support.
LWSC Predator Acoustic Tracking, 2006-2009
FINAL DRAFT September 2010
62
REFERENCES
Ahrenstorff T.D., G.G. Sass and M.R. Helmus. 2009. The influence of littoral zone coarse
woody habitat on home range size, spatial distribution, and feeding ecology of
largemouth bass (Micropterus salmoides). Hydrobiologia 623:23-233.
Armour, C.L. 1993. Evaluating temperature regimes for protecting smallmouth bass. USFWS
Resource Publication 191, Washington, D.C.
Beachamp, D.A., C. Sergeant, N.C. Overman, and M.M. Mazur. 2007. Piscivory on juvenile
salmon and alternative prey in Lake Washington. Draft report – December 17, 2007,
University of Washington, Seattle.
Beam, J.D. 1990. Daily and seasonal movement, as related to habitat use, of smallmouth bass in
the Huron River, Michigan. Master’s thesis, University of Michigan, Ann Arbor.
Beamesderfer, R.C. and B.E. Rieman. 1991. Abundance and distribution of northern squawfish,
walleyes, and smallmouth bass in John Day Reservoir, Columbia River. Transactions of
the American Fisheries Society 120:439-447.
Becker, G.C. 1983. Fishes of Wisconsin. University of Wisconsin Press, Madison, Wisconsin.
Bennett, D.H., J.A. Chandler, and L.K. Dunsmoor. 1991. Smallmouth bass in the Pacific
Northwest: benefit or liability. Pages 126-135 in D.C. Jackson, editor. Proceedings of
the first international smallmouth bass symposium. Mississippi Agricultural and Forestry
Experimental Station, Mississippi State University, Mississippi State.
Bonar, S. A, B. D. Bolding, M. Divens, and W. Meyer. 2005. Effects of introduced fishes on
wild juvenile coho salmon using three shallow Pacific Northwest lakes. Transactions of
the American Fisheries Society 134:641-652.
Bozek, M.A., P.H. Short, C.J. Edwards, M.J. Jennings, and S.P. Newman. 2002. Habitat
selection of nesting smallmouth bass Micropterus dolomieu in two north temperate lakes.
Pages 135-148 in D.P. Philipp and M.S. Ridgway, editors. Black bass, ecology,
conservation and management. American Fisheries Society, Symposium 31, Bethesda,
Maryland.
Bradford, M.J., J. Amos, C.P. Tovey, J.M.B. Hume, S. Grant, and B. Mossop. 2007. Abundance
and migratory behavior of northern pikeminnow in Cultus Lake. Canadian Technical
Report of Fisheries and Aquatic Sciences, Volume 2723.
Brocksmith, R. 1999. Abundance, feeding ecology, and behavior of a native piscivore northern
pikeminnow (Ptychocheilus oregonensis) in Lake Washington. Master’s thesis,
University of Washington, Seattle.
LWSC Predator Acoustic Tracking, 2006-2009
FINAL DRAFT September 2010
63
Celedonia, M.T., Z. Li, S. Sanders, R.A. Tabor, and T. Lee. 2010. Movement and habitat use of
Chinook salmon smolts in the Lake Washington Ship Canal, 2007-2008 acoustic tracking
studies. Final report. U.S. Fish and Wildlife Service, Washington Fish and Wildlife
Office, Lacey, Washington.
Celedonia, M.T., R.A. Tabor, S. Sanders, S. Damm, D.W. Lantz, T.M. Lee, Z. Li, J. Pratt, B.E.
Price, and L. Seyda. 2008a. Movement and habitat use of Chinook salmon smolts,
northern pikeminnow, and smallmouth bass near the SR 520 bridge: 2007 acoustic
tracking study. U.S. Fish and Wildlife Service, Western Washington Fish and Wildlife
Office, Lacey, Washington.
Celedonia, M.T., R.A. Tabor, S. Sanders, S. Damm, D.W. Lantz, T.M. Lee, Z. Li, and B.E.
Price. 2009. Movement and habitat use of Chinook salmon smolts, northern
pikeminnow, and smallmouth bass near the SR 520 bridge, 2008 acoustic tracking study.
Draft report, U.S. Fish and Wildlife Service, Washington Fish and Wildlife Office,
Lacey, Washington.
Celedonia, M.T., R.A. Tabor, S. Sanders, D.W. Lantz, and I. Grettenberger. 2008b. Movement
and habitat use of juvenile Chinook salmon and two predatory fishes in Lake Washington
and the Lake Washington Ship Canal: 2004-05 acoustic tracking studies. U.S. Fish and
Wildlife Service, Western Washington Fish and Wildlife Office, Lacey, Washington.
Coble, D.W. 1975. Smallmouth bass. Pages 21-33 in R.H. Stroud and H. Clepper, editors.
Black bass biology and management. Sport Fishing Institute, Washington, DC.
Cole, M.B. and J.R. Moring. 1997. Relation of adult size to movements of smallmouth bass in a
central Maine lake. Transactions of the American Fisheries Society 126:815-821.
Collis, K, R.E. Beaty, and B.R. Crain. 1995. Changes in catch rate and diet of northern
squawfish associated with the release of hatchery-reared juvenile salmonids in a Columbia
River reservoir. North American Journal of Fisheries Management 15:346-357.
Conover, W.J. 1999. Practical nonparametric statistics. John Wiley and Sons, New York.
Cooper, W.E. and L.B. Crowder. 1979. Patterns of predation in simple and complex
environments. Pages 257-267 in R.H. Stroud and H. Clepper, editors. Predator-prey
systems in fisheries management. Sport Fishing Institute, Washington D.C.
Emery, A.R. 1973. Preliminary comparisons of day and night habits of freshwater fish in
Ontario lakes. Journal of the Fisheries Research Board of Canada 30: 761-774.
Fayram A.H. and T.H. Sibley. 2000. Impact of predation by smallmouth bass on sockeye
salmon in Lake Washington, Washington. North American Journal of Fisheries
Management 20:81-89.

LWSC Predator Acoustic Tracking, 2006-2009
FINAL DRAFT September 2010
64
Fresh, K. L., and G. Lucchetti. 2000. Protecting and restoring the habitats of anadromous
salmonids in the Lake Washington Watershed, an urbanizing ecosystem. Pages 525-544 in
E. E. Knudsen, C. R. Steward, D. D. MacDonald, J. E. Williams, and D. W. Reiser, editors.
Sustainable fisheries management: Pacific salmon. CRC Press (Lewis Publishers), Boca
Raton, Florida.
Fresh, K.L., D. Rothaus, K.W. Mueller, and C. Waldbillig. 2001. Habitat utilization by
predators, with emphasis on smallmouth bass, in the littoral zone of Lake Washington.
Draft report, Washington Department of Fish and Wildlife, Olympia.
Fry, F.E.J. and K.E.F. Watt. 1957. Yields of year classes of the smallmouth bass hatched in the
decade of 1940 in Manitoulin Island waters. Transactions of the American Fisheries
Society 85:135-143.
Garren, D.A., J.J. Ney, and P.E. Bugas, Jr. 2001. Seasonal movement and distribution of
smallmouth bass in a Virginia impoundment. Proceedings of the Annual Conference of
Southeastern Association Fish and Wildlife Agencies 55:165-174.
Gerber, G.P. and J.M. Haynes. 1988. Movements and behavior of smallmouth bass,
Micropterus dolomieui, and rock bass, Ambloplites rupestris, in southcentral Lake
Ontario and two tributaries. Journal of Freshwater Ecology 4:425-439.
Hanson, K.C., S.J. Cooke, C.D. Suski, G. Niezgoda, F.J.S. Phelan, R. Tinline, and D.P. Philipp.
2007. Assessment of largemouth bass (Micropterus salmoides) behaviour and activity at
multiple spatial and temporal scales utilizing a whole-lake telemetry array.
Hydrobiologia 582:243-256.
Hubbs, C.L. and R.M. Bailey. 1938. The small-mouthed bass. Bulletin 10, Cranbrook Institute
of Science, Bloomfield Hills, Michigan.
Hunter, R.W. and M.J. Maceina. 2008. Movements and home ranges of largemouth bass and
Alabama spotted bass in Lake Martin, Alabama. Journal of Freshwater Ecology 23:599-
606.
Jackson, D.A. 2002. Ecological effects of Micropterus introductions: the dark side of black
bass. American Fisheries Society Symposium 31:221-232.
Karchesky, C.M. and D.H. Bennett. 2004. Winter habitat use by adult largemouth bass in the
Pend Oreille River, Idaho. North American Journal of Fisheries Management 24:577-
585.
Kraai, J.E., C.R. Munger, and W.E. Whitworth. 1991. Home range, movements, and habitat
utilization of smallmouth bass in Meredith Reservoir, Texas. Pages 44-48 in D.C.
Jackson, editor. Proceedings of the first international smallmouth bass symposium.
Mississippi Agriculture and Forestry Experiment Station, Mississippi State University.

LWSC Predator Acoustic Tracking, 2006-2009
FINAL DRAFT September 2010
65
Lampman, B. H. 1946. The coming of the pond fishes. Metropolitan Press, Portland, Oregon.
Langhurst, R.W. and D.L. Schoenike. 1990. Seasonal migration of smallmouth bass in the
Embarrass and Wolf Rivers, Wisconsin. North American Journal of Fisheries
Management 10:224-227.
Lewis, W.M. and S. Flickinger. 1967. Home range tendency of the largemouth bass
(Micropterus salmoides). Ecology 48:1020-1023.
Lyons, J. and P. Kanehl. 2002. Seasonal movements of smallmouth bass in streams. Pages 149-
160 in D.P. Philipp and M.S. Ridgway, editors. Black bass, ecology, conservation and
management. American Fisheries Society, Symposium 31, Bethesda, Maryland.
MacCrimmon H.R. and W.H. Robbins. 1975. Distribution of the black basses in North
America. Pages 56-66 in R.H. Stroud and H. Clepper, editors. Black bass biology and
management. Sport Fishing Institute, Washington, DC.
MacRae, P.S.D. and D.A. Jackson. 2001. The influence of smallmouth bass (Micropterus
dolomieu) predation and habitat complexity on the littoral zone fish assemblages.
Canadian Journal of Fisheries and Aquatic Sciences 58:342-351.
Manly, B.F.J., L.L. McDonald, D.L. Thomas, T.L. McDonald, and W.P. Erickson. 2002.
Resource selection by animals: statistical design and analysis for field studies. Kluwer
Academic Publishers, Boston.
Martinelli, T.L. and R.S. Shively. 1997. Seasonal distribution, movements and habitat
associations of northern squawfish in two lower Columbia River reservoirs. Regulated
Rivers: Research and Management 13:543-556.
Mazur, M. M. 2004. Linking visual foraging with temporal prey distributions to model trophic
interactions in Lake Washington. Doctoral dissertation, University of Washington,
Seattle.
Montgomery, J.C., D.H. Fickeisen, and C.D. Becker. 1980. Factors influencing smallmouth
bass production in the Hanford area, Columbia River. Northwest Science 54:296-305.
Moyle, P.B. 2002. Inland fishes of California. University of California Press, Berkeley,
California.
Munther, G.L. 1970. Movement and distribution of smallmouth bass in the middle Snake River.
Transactions of the American Fisheries Society 99:44-53.
Olney, F.E. 1975. Life history and ecology of the northern squawfish Ptychocheilus
oregonensis (Richardson) in Lake Washington. Master's thesis, University of
Washington, Seattle.
LWSC Predator Acoustic Tracking, 2006-2009
FINAL DRAFT September 2010
66
Orth, D.J. and T.J. Newcomb. 2002. Certainties and uncertainties in defining essential habitats
for riverine smallmouth bass. Pages 251-264 in D.P. Philipp and M.S. Ridgway, editors.
Black bass, ecology, conservation and management. American Fisheries Society,
Symposium 31, Bethesda, Maryland.
Patten, B.G. and D.T. Rodman. 1969. Reproductive behavior of northern squawfish,
Ptychocheilus oregonensis. Transactions of the American Fisheries Society 98:108-111.
Petersen. J.H. and D.M. Gadomski. 1994. Light-mediated predation by northern squawfish on
juvenile chinook salmon. Journal of Fish Biology 45(supplement A):227-242.
Petersen, J.H., D.M. Gadomski, and T.P. Poe. 1994. Differential predation by northern
squawfish (Ptychocheilus oregonensis) on live and dead juvenile salmonids in the
Bonneville Dam tailrace (Columbia River). Canadian Journal of Fisheries and Aquatic
Sciences 51:1197-1204.
Pflug D.E. and G.B. Pauley. 1983. The movement and homing of smallmouth bass,
Micropterus dolomieui, in Lake Sammamish, Washington. California Fish and Game
69:207-216.
Reimers, P.E. 1989. Management of wild and hatchery coho salmon in the Tenmile Lakes
system. Information Report 89-5, Oregon Department of Fish and Wildlife, Portland,
Oregon.
Rickard, N.A. 1980. Life history and population characteristics of the prickly sculpin (Cottus
asper Richardson) in Lake Washington. Master's thesis. University of Washington,
Seattle.
Ricker, W.E. 1975. Computation and interpretation of biological statistics of fish populations.
Bulletin of the Fisheries Research Board of Canada 191.
Ridgway, M.S., J.A. MacLean, and J.C. MacLeod. 1991. Nest site fidelity in a centrarchid fish,
smallmouth bass (Micropterus dolomieui). Canadian Journal of Zoology 69:3103-3105.
Ridgway, M.S., B.J. Shuter, T.A. Middel, and M.L. Gross. 2002. Spatial ecology and density-
dependent processes in smallmouth bass: the juvenile transition hypothesis. Pages 47-60
in D.P. Philipp and M.S. Ridgway, editors. Black bass, ecology, conservation and
management. American Fisheries Society, Symposium 31, Bethesda, Maryland.
Robbins, W.H. and H.R. MacCrimmon. 1977. Vital statistics and migratory patterns of a
potamodromous stock of smallmouth bass, Micropterus dolomieui. Journal of the
Fisheries Research Board of Canada 34:142-147.
Sammons, S.M. and P.W. Bettoli. 1999. Spatial and temporal variation in electrofishing catch
rates of three species of black bass (Micropterus spp.) from Normandy Reservoir,
Tennessee. North American Journal of Fisheries Management 19:454-461.

LWSC Predator Acoustic Tracking, 2006-2009
FINAL DRAFT September 2010
67
Sammons, S.M. and M.J. Maceina. 2005. Activity patterns of largemouth bass in a subtropical
US reservoir. Fisheries Management and Ecology 12:331-339.
Sammons, S.M., Maceina M.J. and Partridge D.G. 2003. Changes in behavior, movement, and
home ranges of largemouth bass following large-scale hydrilla removal in Lake
Seminole, Georgia. Journal of Aquatic Plant Management 41:31–38.
Savitz, J., P.A. Fish, and R. Weszely. 1983. Effects of forage on home-range size of largemouth
bass. Transactions of the American Fisheries Society 112:772-776.
Savitz, J. and L. Treat. 2007. Movements and side fidelity of black bass in three harbors along
the Illinois shoreline of Lake Michigan. Journal of Freshwater Ecology 22:267-269.
Shively R.S., T.P. Poe, and S.T. Sauter. 1996. Feeding response by northern squawfish to a
hatchery release of juvenile salmonids in the Clearwater River, Idaho. Transactions of
the American Fisheries Society 125:230-236.
Stein, J.N. 1970. A study of the largemouth bass population in Lake Washington. Master's
thesis. University of Washington, Seattle, Washington.
Stepien, C.A., D.J. Murphy, and R.M. Strange. 2007. Broad- to fine-scale population genetic
patterning in the smallmouth bass Micropterus dolomieu across the Laurentian Great
Lakes and beyond: and interplay of behaviour and geography. Molecular Ecology
16:1605-1624.
Stone, U.B., D.G. Pasko, and R.M. Roecker. 1954. A study of Lake Ontario-St. Lawrence River
smallmouth bass. N.Y. Fish and Game Journal 1(1):1-26.
Suski, C.D. and M.S. Ridgway. 2009. Seasonal pattern of depth selection in smallmouth bass.
Journal of Zoology 2009:1-10,
Tabor, R.A., M.T. Celedonia, F. Mejia, R.M. Piaskowski, D.L. Low, B. Footen, and L. Park.
2004. Predation of juvenile Chinook salmon by predatory fishes in three areas of the
Lake Washington basin. Miscellaneous report. U.S. Fish and Wildlife Service, Western
Washington Fish and Wildlife Office, Lacey, Washington.
Tabor, R.A., B.A. Footen, K.L. Fresh, M.T. Celedonia, F. Mejia, D.L. Low, and L. Park. 2007.
Predation of juvenile Chinook salmon and other salmonids by smallmouth bass and
largemouth bass in the Lake Washington basin. North American Journal of Fisheries
Management 27:1174-1188.
Tabor, R.A., R.S. Shively, and T.P. Poe. 1993. Predation on juvenile salmonids by smallmouth
bass and northern squawfish in the Columbia River near Richland, Washington. North
American Journal of Fisheries Management 13:831-838.
LWSC Predator Acoustic Tracking, 2006-2009
FINAL DRAFT September 2010
68
Todd, B.L. and C.F. Rabeni. 1989. Movement and habitat use by stream-dwelling smallmouth
bass. Transactions of the American Fisheries Society 118:229-242.
VanArnum, C.J.G., G.L. Buynak, and J.R. Ross. 2004. Movement of smallmouth bass in
Elkhorn Creek, Kentucky. North American Journal of Fisheries Management 24:311-
315.
Vander Zanden, M.J., J.M. Casselman, J.B. Rasmussen. 1999. Stable isotope evidence for the
food web consequences of species invasions in lakes. Nature 401:464-467.
Warden, R.L. Jr. and W.J. Lorio. 1975. Movements of largemouth bass (Micropterus
salmoides) in impounded waters as determined by underwater telemetry. Transactions of
the American Fisheries Society 104:696-702.
Webster, D.A. 1954. Smallmouth bass (Micropterus dolomieui) in Cayuga Lake: Part 1: life
history and environment. Agricultural Experiment Station Memoir 327. Cornell
University, Ithaca, New York.
Weidel, B.C., D.C. Josephson, and C.E. Kraft. 2007. Littoral fish community response to
smallmouth bass removal from an Adirondack lake. Transactions of the American
Fisheries Society 136:778-789.
Weitkamp, D. and G. Ruggerone. 2000. Factors affecting chinook populations. Report to the
City of Seattle, Seattle, Washington.
Wiley, M.J., R.W. Gorden, S.W. Waite, and T. Powless. 1984. The relationship between
aquatic macrophytes and sport fish production in Illinois ponds: a simple model. North
American Journal of Fisheries Management 4:111-119.
Wydoski, R.S. and R.R. Whitney. 2003. Inland fishes of Washington. University of
Washington Press, Seattle.

LWSC Predator Acoustic Tracking, 2006-2009
FINAL DRAFT September 2010
69
APPENDICES

LWSC Predator Acoustic Tracking, 2006-2009
FINAL DRAFT September 2010
70
APPENDIX 1. Smallmouth bass tagged with HTI acoustic tags in the LWSC in 2007 and 2008. Release site is the
area where the fish were captured and released. GWP = Gas Works Park; I-5/UB = I-5 and University Bridges. G
tags are 60-day, 4.4 g tags and E tags are 20-day, 1.5 g tags. The number of days tracked is the number of days at
least one data point was obtained. The first 24 hours after release was not used. The number of data points is the
number recorded at the release site; other data points is the number at the other HTI fixed array site in LWSC (the
last fish listed was tagged outside the LWSC and tracked at the I-5/UB site). Tracking was performed from May 18
to August 20 in 2007 and May 20 to August 20 in 2008.
Year Release Tag Tag period
Fork
length Weight Date of first
Date of
last Number of Number of Other data
Date released site type (msec) (mm) (g) data point data point days tracked data points points
2007
18-May GWP G 4557 435 1,580 19-May 15-Jul 54 347,506 0
22-May GWP G 4567 365 760 23-May 16-Jun 22 76,913 15
22-May GWP G 4577 370 800 23-May 17-Jul 51 247,959 427
22-May GWP G 4587 310 520 23-May 20-Jul 41 110,674 1,599
22-May GWP G 4597 340 720 23-May 7-Jun 9 3,346 2
23-May I-5/UB G 4607 340 700 24-May 23-Jun 8 10,067 0
23-May I-5/UB G 4617 318 500 24-May 8-Jun 12 10,994 0
23-May I-5/UB G 4627 348 720 24-May 19-Jun 20 59,087 0
23-May I-5/UB E 4637 235 210 24-May 12-Jun 5 9,087 0
23-May I-5/UB E 4647 183 76 24-May 12-Jun 18 72,817 0
11-Jun I-5/UB G 4897 375 920 12-Jun 13-Jun 2 2,664 0
11-Jun I-5/UB G 4907 380 910 -- -- 0 0 0
11-Jun I-5/UB G 4917 400 900 12-Jun 15-Jul 13 1,927 0
11-Jun I-5/UB E 4927 290 400 12-Jun 1-Jul 15 30,578 0
11-Jun GWP E 4937 360 700 -- -- 0 0 136
20-Jun GWP E 4987 235 211 21-Jun 11-Jul 21 72,885 0
20-Jun GWP E 4997 238 206 -- -- 0 0 0
25-Jun GWP G 5007 450 1,430 26-Jun 8-Jul 13 60,554 37
25-Jun I-5/UB G 5017 315 480 1-Jul 15-Jul 3 3,358 0
28-Jun GWP G 5067 400 1,100 -- -- 0 0 0
28-Jun I-5/UB E 5077 321 470 29-Jun 29-Jun 1 1 0
28-Jun GWP E 5087 185 105 30-Jun 20-Jul 13 322 0
3-Jul I-5/UB G 5157 298 400 4-Jul 20-Aug 35 22,666 0
3-Jul I-5/UB G 5167 425 1,350 4-Jul 15-Jul 12 14,929 0
3-Jul I-5/UB G 5177 413 1,330 7-Jul 24-Jul 17 8,701 0
9-Jul GWP G 5197 283 380 10-Jul 14-Aug 35 87,318 0
9-Jul GWP G 5217 255 269 10-Jul 13-Aug 32 19,699 13
9-Jul GWP G 5237 250 263 19-Jul 14-Aug 11 22,993 0
9-Jul GWP E 5257 215 163 10-Jul 2-Aug 33 129,336 0
9-Jul GWP E 5277 165 71 10-Jul 29-Jul 20 34,526 0
2008
20-May I-5/UB G 4508 400 1,050 21-May 26-Jun 25 328,489 149
20-May I-5/UB G 4518 420 1,250 21-May 1-Jun 27 45,505 13,780
20-May I-5/UB G 4528 380 1,050 21-May 7-Jul 29 12,158 0
20-May I-5/UB G 4538 420 1,600 21-May 6-Jul 42 189,761 269
21-May I-5/UB G 4548 410 1,400 22-May 5-Jul 26 37,133 0
22-May GWP E 4558 210 135 -- -- 0 0 0
23-May I-5/UB G 4568 430 1,420 24-May 3-Jul 15 10,127 0
23-May GWP G 4578 275 355 12-Jun 10-Jul 7 2,168 56,962
23-May GWP G 4588 340 840 24-May 14-Jun 21 532,823 23
23-May GWP G 4598 385 1,080 24-May 14-Jun 21 580,318 19
28-May I-5/UB G 4608 430 1,364 29-May 7-Jul 34 212,321 33
29-May GWP E 4618 153 55 30-May 11-Jun 12 10,759 26
29-May GWP E 4628 160 66 30-May 11-Jun 12 14,559 12
3-Jun GWP G 4668 435 1,337 4-Jun 11-Jun 7 28,982 49
3-Jun GWP G 4678 385 952 4-Jun 11-Jun 7 34 256
3-Jun GWP G 4688 475 1,614 4-Jun 11-Jun 7 32,425 673
3-Jun GWP E 4698 211 147 4-Jun 16-Jun 8 10,973 14
3-Jun GWP E 4708 166 61 4-Jun 18-Jun 13 11,053 20
5-Jun GWP G 4718 410 1,167 6-Jun 28-Jul 52 1,342,742 307
5-Jun I-5/UB G 4728 350 744 8-Jun 28-Jul 11 2,179 42
12-Jun SR 520 G 4808 470 1,865 14-Jun 17-Jul 7 -- 1,884
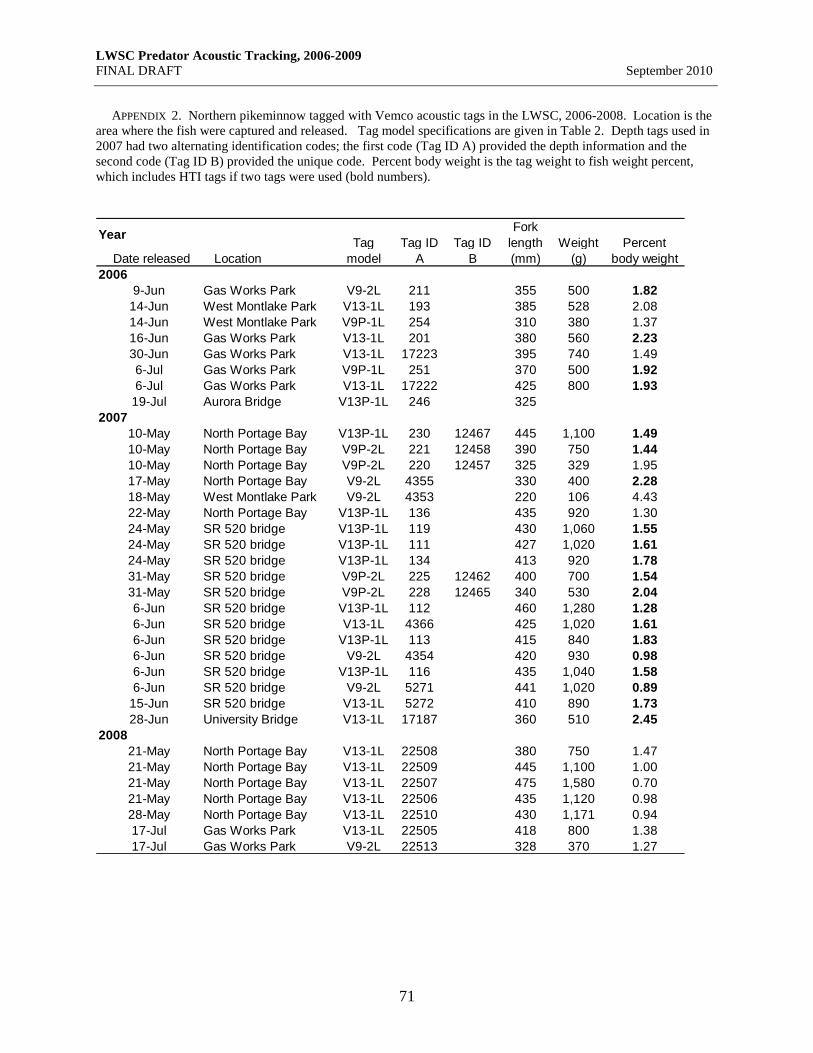
LWSC Predator Acoustic Tracking, 2006-2009
FINAL DRAFT September 2010
71
APPENDIX 2. Northern pikeminnow tagged with Vemco acoustic tags in the LWSC, 2006-2008. Location is the
area where the fish were captured and released. Tag model specifications are given in Table 2. Depth tags used in
2007 had two alternating identification codes; the first code (Tag ID A) provided the depth information and the
second code (Tag ID B) provided the unique code. Percent body weight is the tag weight to fish weight percent,
which includes HTI tags if two tags were used (bold numbers).
Year Tag Tag ID Tag ID
Fork
length Weight Percent
Date released Location model A B (mm) (g) body weight
2006
9-Jun Gas Works Park V9-2L 211 355 500 1.82
14-Jun West Montlake Park V13-1L 193 385 528 2.08
14-Jun West Montlake Park V9P-1L 254 310 380 1.37
16-Jun Gas Works Park V13-1L 201 380 560 2.23
30-Jun Gas Works Park V13-1L 17223 395 740 1.49
6-Jul Gas Works Park V9P-1L 251 370 500 1.92
6-Jul Gas Works Park V13-1L 17222 425 800 1.93
19-Jul Aurora Bridge V13P-1L 246 325
2007
10-May North Portage Bay V13P-1L 230 12467 445 1,100 1.49
10-May North Portage Bay V9P-2L 221 12458 390 750 1.44
10-May North Portage Bay V9P-2L 220 12457 325 329 1.95
17-May North Portage Bay V9-2L 4355 330 400 2.28
18-May West Montlake Park V9-2L 4353 220 106 4.43
22-May North Portage Bay V13P-1L 136 435 920 1.30
24-May SR 520 bridge V13P-1L 119 430 1,060 1.55
24-May SR 520 bridge V13P-1L 111 427 1,020 1.61
24-May SR 520 bridge V13P-1L 134 413 920 1.78
31-May SR 520 bridge V9P-2L 225 12462 400 700 1.54
31-May SR 520 bridge V9P-2L 228 12465 340 530 2.04
6-Jun SR 520 bridge V13P-1L 112 460 1,280 1.28
6-Jun SR 520 bridge V13-1L 4366 425 1,020 1.61
6-Jun SR 520 bridge V13P-1L 113 415 840 1.83
6-Jun SR 520 bridge V9-2L 4354 420 930 0.98
6-Jun SR 520 bridge V13P-1L 116 435 1,040 1.58
6-Jun SR 520 bridge V9-2L 5271 441 1,020 0.89
15-Jun SR 520 bridge V13-1L 5272 410 890 1.73
28-Jun University Bridge V13-1L 17187 360 510 2.45
2008
21-May North Portage Bay V13-1L 22508 380 750 1.47
21-May North Portage Bay V13-1L 22509 445 1,100 1.00
21-May North Portage Bay V13-1L 22507 475 1,580 0.70
21-May North Portage Bay V13-1L 22506 435 1,120 0.98
28-May North Portage Bay V13-1L 22510 430 1,171 0.94
17-Jul Gas Works Park V13-1L 22505 418 800 1.38
17-Jul Gas Works Park V9-2L 22513 328 370 1.27

LWSC Predator Acoustic Tracking, 2006-2009
FINAL DRAFT September 2010
72
APPENDIX 3. Smallmouth bass tagged with Vemco acoustic tags in the LWSC in 2006. Location is the area
where the fish were captured and released. Tag model specifications are given in Table 2. Percent body weight is
the tag weight to fish weight percent, which includes HTI tags if two tags were used (bold numbers).
Tag Fork length Weight Percent
Date released Location model Tag ID (mm) (g) body weight
2-May North Portage Bay V13-1L 208 370 1,020 1.08
4-May North Portage Bay V13-1L 202 385 1,090 1.01
4-May University Bridge V9-2L 213 245 200 2.35
15-May North Portage Bay V13-1L 210 450 1,400 0.79
23-May Gas Works Park V13-1L 192 415 1,440 1.07
23-May Gas Works Park V9-2L 212 327 600 1.52
23-May Gas Works Park V13-1L 205 370 900 1.71
23-May Gas Works Park V9P-1L 253 335 800 0.84
1-Jun Gas Works Park V13-1L 204 370 924 1.35
14-Jun West Montlake Park V9P-1L 255 245 212 2.45
14-Jun North Portage Bay V9-2L 214 193 128 3.67
16-Jun I-5 Bridge V9-1L 3891 250 260 1.96
16-Jun I-5 Bridge V9-1L 3893 230 179 2.44
16-Jun I-5 Bridge V9-1L 3873 230 196 1.84
21-Jun West Montlake Park V13-1L 196 343 580 1.90
21-Jun I-5 Bridge V13-1L 200 408 1,260 1.23
27-Jun Gas Works Park V13-1L 194 340 520 2.40
27-Jun Gas Works Park V13-1L 198 285 376 2.93
27-Jun Gas Works Park V13-1L 206 275 372 2.96
27-Jun Gas Works Park V13-1L 209 285 351 3.13
27-Jun Gas Works Park V13-1L 17192 265 325 3.38
27-Jun Gas Works Park V9P-1L 252 265 272 1.91
27-Jun Gas Works Park V9-1L 3895 260 286 1.26
27-Jun Gas Works Park V9-1L 3898 230 194 1.86
27-Jun Northeast Lake Union V9-1L 3896 262 276 1.30
30-Jun Gas Works Park V9-6L 817 255 278 1.04
30-Jun Gas Works Park V13-1L 17191 270 324 3.40
6-Jul I-5 Bridge V9-6L 825 225 185 2.38
6-Jul I-5 Bridge V13-1L 17190 330 600 2.57
6-Jul Gas Works Park V9-6L 822 280 300 1.47
6-Jul Gas Works Park V9-6L 816 235 221 1.99
6-Jul Gas Works Park V13-1L 17189 395 1,200 1.28
6-Jul Gas Works Park V9-6L 815 290 375 1.17
19-Jul Gas Works Park V13-1L 17186 255
19-Jul Gas Works Park V13-1L 17185 227 733 1.50

LWSC Predator Acoustic Tracking, 2006-2009
FINAL DRAFT September 2010
73
APPENDIX 4. Smallmouth bass tagged with Vemco acoustic tags in the LWSC in 2007 and 2008. Location is the
area where the fish were captured and released. Tag model specifications are given in Table 2. Depth tags used in
2007 had two alternating identification codes; the first code (Tag ID A) provided the depth information and the
second code (Tag ID B) provided the unique code. Percent body weight is the tag weight to fish weight percent,
which includes HTI tags if two tags were used (bold numbers).
Year Tag Tag ID Tag ID
Fork
length Weight Percent
Date released Location model A B (mm) (g) body weight
2007
18-May West Montlake Park V9P-2L 222 12459 370 940 0.84
18-May West Montlake Park V13P-1L 117 425 1,520 1.08
18-May Gas Works Park V13P-1L 231 12468 435 1,580 1.04
22-May North Portage Bay V9P-2L 229 12466 330 520 1.23
22-May Gas Works Park V13-1L 4364 365 760 2.03
22-May Gas Works Park V13-1L 4362 370 800 1.93
22-May Gas Works Park V9-2L 4349 310 520 1.75
22-May Gas Works Park V13-1L 4361 340 720 2.14
22-May Gas Works Park V9-2L 4352 240 209 2.25
23-May University Bridge V13-1L 4360 340 700 2.20
23-May University Bridge V9-2L 4351 318 500 1.82
23-May I-5 Bridge V9P-2L 223 12460 348 720 1.50
24-May North Portage Bay V13-1L 4358 312 480 2.29
24-May North Portage Bay V13-1L 4365 350
7-Jun West Montlake Park V9-2L 4347 265 297 1.58
11-Jun University Bridge V9-2L 4348 375 920 0.99
11-Jun University Bridge V9-2L 5268 380 910 1.00
11-Jun University Bridge V13-1L 5273 400 900 1.71
11-Jun University Bridge V9-2L 4356 290 400 1.55
11-Jun Gas Works Park V13-1L 5274 360 700 1.79
11-Jun Aurora Bridge V13P-1L 118 415 1,250 0.96
11-Jun Aurora Bridge V9P-2L 224 12461 290 350 1.83
11-Jun Aurora Bridge V9P-2L 226 12463 300 400 1.60
11-Jun Aurora Bridge V9-2L 4350 275 250 1.88
11-Jun Aurora Bridge V9-2L 4357 280
11-Jun Aurora Bridge V13-1L 4363 320 450 2.44
11-Jun Aurora Bridge V9-2L 5269 310 400 1.18
11-Jun Aurora Bridge V9-2L 5270 280
11-Jun Aurora Bridge V13-1L 5275 350 600 1.83
21-Jun North Portage Bay V13-1L 4359 317 610 1.80
25-Jun Gas Works Park V13P-1L 77 450 1,430 1.15
25-Jun East Lake Union V9P-2L 227 12464 395 920 0.70
28-Jun Gas Works Park V13P-1L 120 400 1,100 1.49
3-Jul University Bridge V13P-1L 115 413 1,330 1.23
2008
2-Jul Gas Works Park V9-2L 22512 415 1168 0.40
17-Jul Gas Works Park V13-1L 22511 390 1110 0.99
17-Jul Gas Works Park V9-2L 22514 345 733 0.64