Embed Size (px)
Citation preview
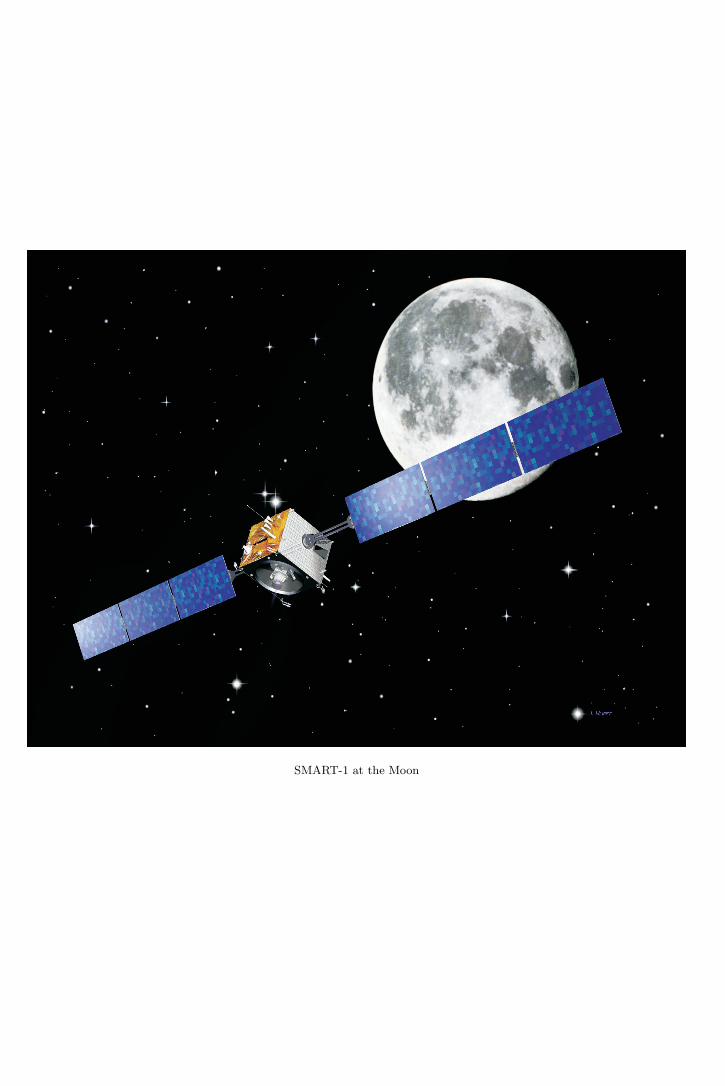
SMART-1 at the Moon

SMART-1 after lunar capture: First resultsand perspectives
B H Foing1,∗, G D Racca2, A Marini2, E Evrard2, L Stagnaro2, M Almeida1,D Koschny1, D Frew1, J Zender1, D Heather1, M Grande3, J Huovelin4,H U Keller5, A Nathues5, J L Josset6, A Malkki7, W Schmidt7, G Noci8,
R Birkl9, L Iess10, Z Sodnik11 and P McManamon11
1ESA Research and Scientific Support Department, ESTEC/SCI-SR, Postbus 299, NL-2200 AG Noordwijk.2ESA Scientific Project Department, ESTEC/SCI-PD.
3Rutherford Appleton Labs, UK.4Helsinki Observatory.
5Max-Planck-Institut fur Aeronomie.6Space-X, Neuchatel.
7Finnish Meteorology Institute.8LABEN SpA.
9Astrium GmbH.10U. of Rome.
11ESA Directorate of Technology, ESTEC/TEC.∗e-mail: [email protected]
SMART-1 is a technology demonstration mission for deep space solar electrical propulsion andtechnologies for the future. SMART-1 is Europe’s first lunar mission and will contribute to develop-ing an international program of lunar exploration. The spacecraft was launched on 27th September2003, as an auxiliary passenger to GTO on Ariane 5, to reach the Moon after a 15-month cruise,with lunar capture on 15th November 2004, just a week before the International Lunar Confer-ence in Udaipur. SMART-1 carries seven experiments, including three remote sensing instrumentsused during the mission’s nominal six months and one year extension in lunar science orbit. Theseinstruments will contribute to key planetary scientific questions, related to theories of lunar originand evolution, the global and local crustal composition, the search for cold traps at the lunar polesand the mapping of potential lunar resources.
1. Solar electric propulsion to the Moon
SMART (Small Missions for Advanced Researchin Technology) are technology demonstration mis-sions offering an early opportunity for scienceas well as a new management approach. ESA’sSMART-1 mission (e.g., Foing et al 2001; Mariniet al 2002; Racca et al 2002) is specifically designedto test technologies to be used on future ESA cor-nerstone programs (figure 1a). Its main rationaleis to demonstrate deep space electric propulsion
and other technologies for future interplanetaryand deep space missions. SMART-1 is the firstapproved European mission to visit the Moon.SMART-1 was launched from Kourou on 27thSeptember 2003 on an Ariane 5 as an auxiliary pas-senger into Geostationary Transfer Orbit (GTO).
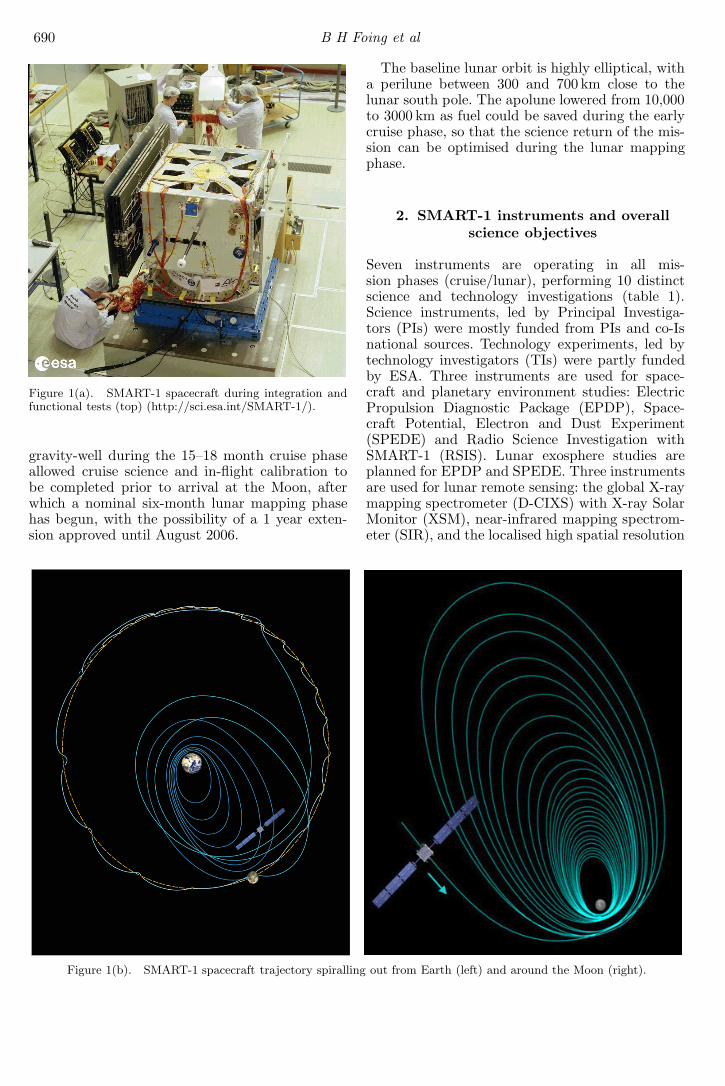
After nominal low earth operations, and spiral-ing out (figure 1b) of the inner radiation belts,the spacecraft and the payload have been commis-sioned successfully. The use of solar electric propul-sion to carry the craft from within the Earth’s
Keywords. SMART-1; planetary exploration technology; surface composition; mineralogy; imaging payloads.
J. Earth Syst. Sci. 114, No. 6, December 2005, pp. 689–697© Printed in India. 689
690 B H Foing et al
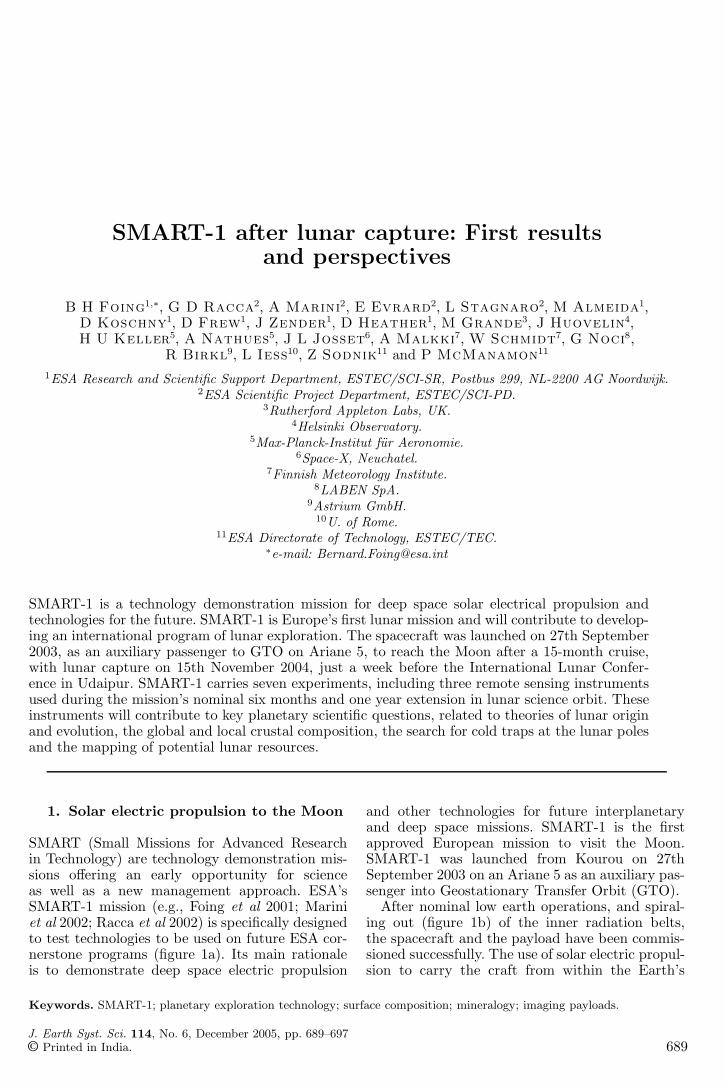
Figure 1(a). SMART-1 spacecraft during integration andfunctional tests (top) (http://sci.esa.int/SMART-1/).
gravity-well during the 15–18 month cruise phaseallowed cruise science and in-flight calibration tobe completed prior to arrival at the Moon, afterwhich a nominal six-month lunar mapping phasehas begun, with the possibility of a 1 year exten-sion approved until August 2006.
Figure 1(b). SMART-1 spacecraft trajectory spiralling out from Earth (left) and around the Moon (right).
The baseline lunar orbit is highly elliptical, witha perilune between 300 and 700 km close to thelunar south pole. The apolune lowered from 10,000to 3000 km as fuel could be saved during the earlycruise phase, so that the science return of the mis-sion can be optimised during the lunar mappingphase.
2. SMART-1 instruments and overallscience objectives
Seven instruments are operating in all mis-sion phases (cruise/lunar), performing 10 distinctscience and technology investigations (table 1).Science instruments, led by Principal Investiga-tors (PIs) were mostly funded from PIs and co-Isnational sources. Technology experiments, led bytechnology investigators (TIs) were partly fundedby ESA. Three instruments are used for space-craft and planetary environment studies: ElectricPropulsion Diagnostic Package (EPDP), Space-craft Potential, Electron and Dust Experiment(SPEDE) and Radio Science Investigation withSMART-1 (RSIS). Lunar exosphere studies areplanned for EPDP and SPEDE. Three instrumentsare used for lunar remote sensing: the global X-raymapping spectrometer (D-CIXS) with X-ray SolarMonitor (XSM), near-infrared mapping spectrom-eter (SIR), and the localised high spatial resolution
SMART-1 at the Moon 691
Table 1. SMART-1 instruments and investigations.
Mass (kg) Power (W)
EPDP (Electric Propulsion Diagnostic Package) 2.4 18SPEDE (Spacecraft Potential Electron and Dust Exp.) 0.8 1.8KATE (Ka-Band TT and C Experiment) 6.2 26RSIS (Radio-Science Investigations for SMART-1) (Using KATE and AMIE)D-CIXS (Demo Compact Imaging X-ray Spectrometer) 5.2 18XSM (X-ray Solar Monitoring) (With D-CIXS)SIR (SMART-1 Infrared Spectrometer) 2.3 4.1AMIE (Advanced Moon micro-Imager Experiment) 2.1 9Laserlink (Experimental Deep-space Laser link) (Using AMIE)OBAN (Onboard Autonomous Navigation Exp.) (Using AMIE)
Table 2. Overall science measurements objectives for SMART-1.
Cruise technology and science:
• Technology demonstration of instruments• Earth imaging and magnetospheric studies• X-ray monitoring of Sun and cosmic sources
Lunar science:
• First global X-ray mapping of Mg, Al, Si (50 km resolution)• First infrared spectral mineralogy mapping 0.9–2.5 µm• Colour imaging via 0.75, 0.9, 0.95 µm+ clear white channels at high resolution (up to 40 m/pixel)• Polar areas illumination and resource mapping
colour imaging camera (AMIE). Overall scienceobjectives for the mission are shown in table 2.
3. D-CIXS (Demonstration of a CompactX-ray Spectrometer)
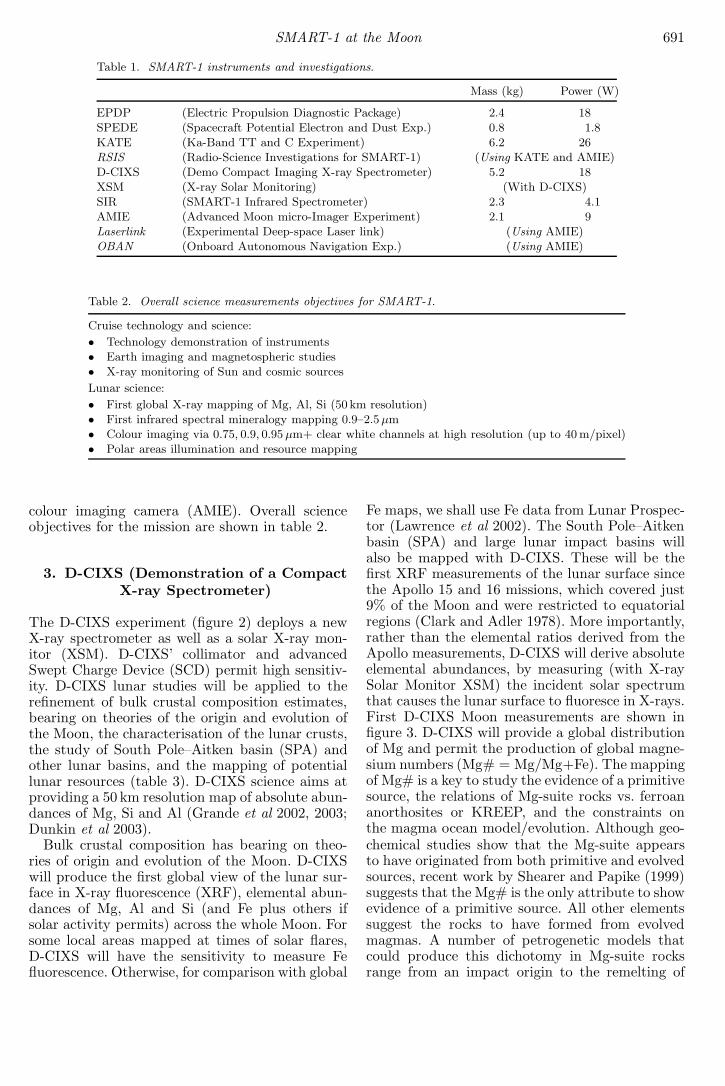
The D-CIXS experiment (figure 2) deploys a newX-ray spectrometer as well as a solar X-ray mon-itor (XSM). D-CIXS’ collimator and advancedSwept Charge Device (SCD) permit high sensitiv-ity. D-CIXS lunar studies will be applied to therefinement of bulk crustal composition estimates,bearing on theories of the origin and evolution ofthe Moon, the characterisation of the lunar crusts,the study of South Pole–Aitken basin (SPA) andother lunar basins, and the mapping of potentiallunar resources (table 3). D-CIXS science aims atproviding a 50 km resolution map of absolute abun-dances of Mg, Si and Al (Grande et al 2002, 2003;Dunkin et al 2003).
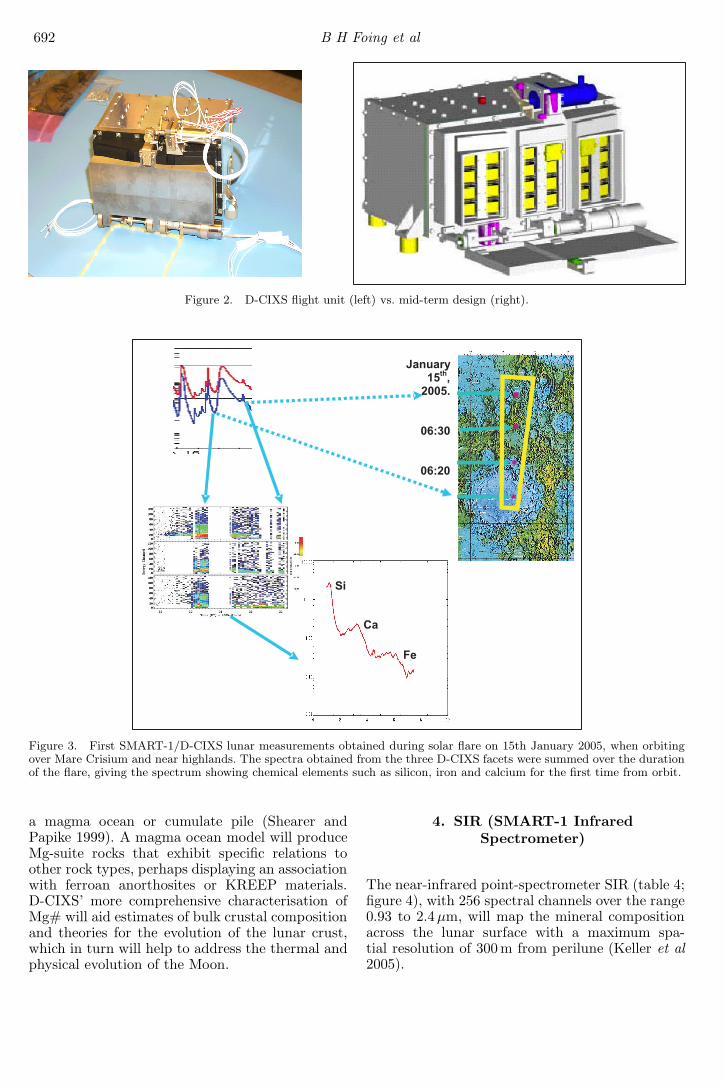
Bulk crustal composition has bearing on theo-ries of origin and evolution of the Moon. D-CIXSwill produce the first global view of the lunar sur-face in X-ray fluorescence (XRF), elemental abun-dances of Mg, Al and Si (and Fe plus others ifsolar activity permits) across the whole Moon. Forsome local areas mapped at times of solar flares,D-CIXS will have the sensitivity to measure Fefluorescence. Otherwise, for comparison with global
Fe maps, we shall use Fe data from Lunar Prospec-tor (Lawrence et al 2002). The South Pole–Aitkenbasin (SPA) and large lunar impact basins willalso be mapped with D-CIXS. These will be thefirst XRF measurements of the lunar surface sincethe Apollo 15 and 16 missions, which covered just9% of the Moon and were restricted to equatorialregions (Clark and Adler 1978). More importantly,rather than the elemental ratios derived from theApollo measurements, D-CIXS will derive absoluteelemental abundances, by measuring (with X-raySolar Monitor XSM) the incident solar spectrumthat causes the lunar surface to fluoresce in X-rays.First D-CIXS Moon measurements are shown infigure 3. D-CIXS will provide a global distributionof Mg and permit the production of global magne-sium numbers (Mg# = Mg/Mg+Fe). The mappingof Mg# is a key to study the evidence of a primitivesource, the relations of Mg-suite rocks vs. ferroananorthosites or KREEP, and the constraints onthe magma ocean model/evolution. Although geo-chemical studies show that the Mg-suite appearsto have originated from both primitive and evolvedsources, recent work by Shearer and Papike (1999)suggests that the Mg# is the only attribute to showevidence of a primitive source. All other elementssuggest the rocks to have formed from evolvedmagmas. A number of petrogenetic models thatcould produce this dichotomy in Mg-suite rocksrange from an impact origin to the remelting of
692 B H Foing et al
Figure 2. D-CIXS flight unit (left) vs. mid-term design (right).
Figure 3. First SMART-1/D-CIXS lunar measurements obtained during solar flare on 15th January 2005, when orbitingover Mare Crisium and near highlands. The spectra obtained from the three D-CIXS facets were summed over the durationof the flare, giving the spectrum showing chemical elements such as silicon, iron and calcium for the first time from orbit.
a magma ocean or cumulate pile (Shearer andPapike 1999). A magma ocean model will produceMg-suite rocks that exhibit specific relations toother rock types, perhaps displaying an associationwith ferroan anorthosites or KREEP materials.D-CIXS’ more comprehensive characterisation ofMg# will aid estimates of bulk crustal compositionand theories for the evolution of the lunar crust,which in turn will help to address the thermal andphysical evolution of the Moon.
4. SIR (SMART-1 InfraredSpectrometer)
The near-infrared point-spectrometer SIR (table 4;figure 4), with 256 spectral channels over the range0.93 to 2.4µm, will map the mineral compositionacross the lunar surface with a maximum spa-tial resolution of 300 m from perilune (Keller et al2005).
SMART-1 at the Moon 693
Table 3. D-CIXS X-ray instrument and solar X-ray monitor (XSM) objectives.
D-CIXS – PI: M. Grande (RAL), Co-I’s UK, FIN, F, E, S, ESA
• Demonstration of a compact X-ray imaging spectrometer (12 × 32◦ FOV)• Global mapping of the lunar surface (elemental composition) via X-ray fluorescence• X-ray celestial sources, Earth aurora and magnetotail• New technologies: Micro-structure collimator• Swept charge devices (detectors) 0.5–10 keV
XSM – PI: J. Huovelin (Observatory Helsinki – FIN)
• Si-pin detectors 104◦ FOV; range: 0.8–20 keV• Solar X-ray flares and coronal monitoring (calibration)
Table 4. SIR infrared mapping spectrometer.
TI: H.U. Keller (MPAe - D); Co-I’s D, Pl, UK, IRL, ESA
Technology objectives:
• Flight qualification of a miniature monolithic grating spectrometer• 0.93–2.4 µm, 256 channels, resolution 6 nm/pixel• Correlation to AMIE colour-filtered images
Science objectives:
• Mapping of the lunar surface in NIR (up to 300 m spatial resolution)• Absolute flux calibration• Spectroscopy of selected surface features (angular resolved in scan mode)
Lunar spectral mapping:
• Discrimination of the major rock forming minerals• Olivine from mantle: Crustal differentiation/evolution• South Pole–Aitken basin exposed materials from mantle• Investigation of space weathering and illumination geometry effects• SIR highest spatial resolution will allow detailed exploration of central peaks, walls, rims and ejecta blankets of large
impact craters, giving the stratigraphy of the lunar crust.
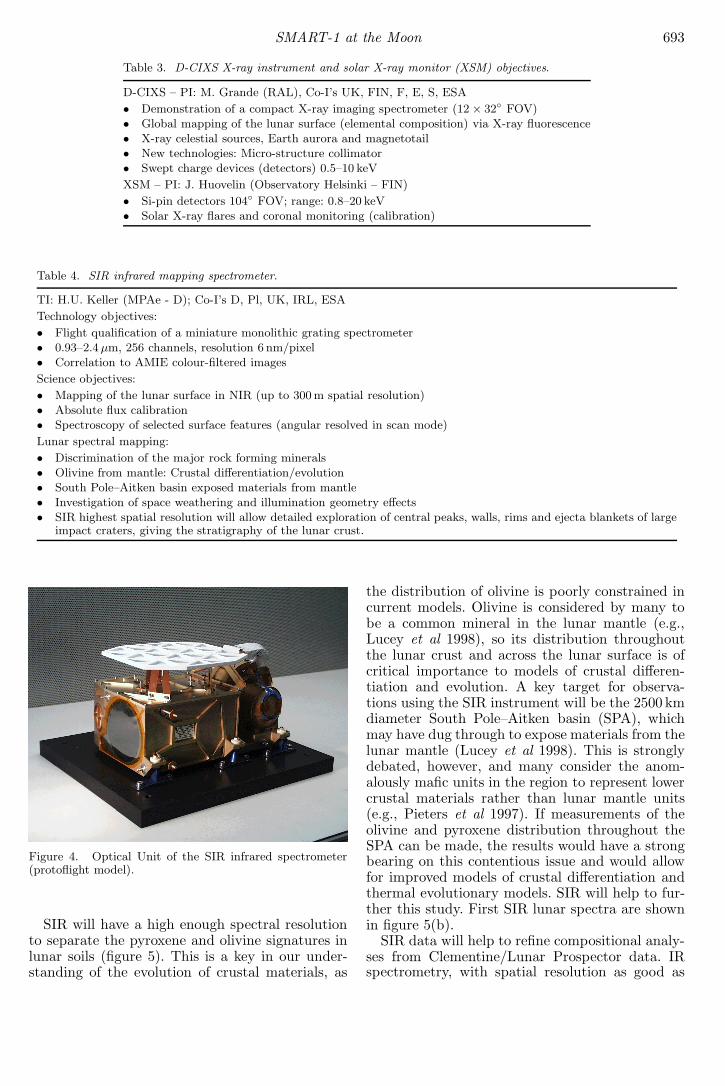
Figure 4. Optical Unit of the SIR infrared spectrometer(protoflight model).
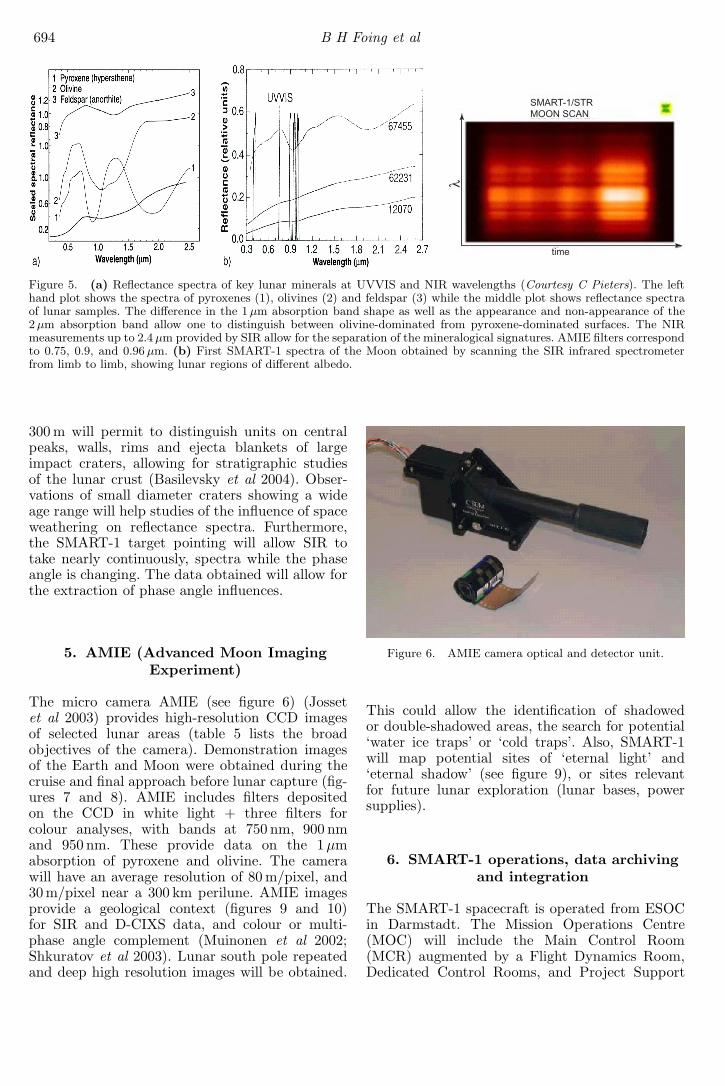
SIR will have a high enough spectral resolutionto separate the pyroxene and olivine signatures inlunar soils (figure 5). This is a key in our under-standing of the evolution of crustal materials, as
the distribution of olivine is poorly constrained incurrent models. Olivine is considered by many tobe a common mineral in the lunar mantle (e.g.,Lucey et al 1998), so its distribution throughoutthe lunar crust and across the lunar surface is ofcritical importance to models of crustal differen-tiation and evolution. A key target for observa-tions using the SIR instrument will be the 2500 kmdiameter South Pole–Aitken basin (SPA), whichmay have dug through to expose materials from thelunar mantle (Lucey et al 1998). This is stronglydebated, however, and many consider the anom-alously mafic units in the region to represent lowercrustal materials rather than lunar mantle units(e.g., Pieters et al 1997). If measurements of theolivine and pyroxene distribution throughout theSPA can be made, the results would have a strongbearing on this contentious issue and would allowfor improved models of crustal differentiation andthermal evolutionary models. SIR will help to fur-ther this study. First SIR lunar spectra are shownin figure 5(b).
SIR data will help to refine compositional analy-ses from Clementine/Lunar Prospector data. IRspectrometry, with spatial resolution as good as
694 B H Foing et al
Figure 5. (a) Reflectance spectra of key lunar minerals at UVVIS and NIR wavelengths (Courtesy C Pieters). The lefthand plot shows the spectra of pyroxenes (1), olivines (2) and feldspar (3) while the middle plot shows reflectance spectraof lunar samples. The difference in the 1 µm absorption band shape as well as the appearance and non-appearance of the2 µm absorption band allow one to distinguish between olivine-dominated from pyroxene-dominated surfaces. The NIRmeasurements up to 2.4 µm provided by SIR allow for the separation of the mineralogical signatures. AMIE filters correspondto 0.75, 0.9, and 0.96 µm. (b) First SMART-1 spectra of the Moon obtained by scanning the SIR infrared spectrometerfrom limb to limb, showing lunar regions of different albedo.
300 m will permit to distinguish units on centralpeaks, walls, rims and ejecta blankets of largeimpact craters, allowing for stratigraphic studiesof the lunar crust (Basilevsky et al 2004). Obser-vations of small diameter craters showing a wideage range will help studies of the influence of spaceweathering on reflectance spectra. Furthermore,the SMART-1 target pointing will allow SIR totake nearly continuously, spectra while the phaseangle is changing. The data obtained will allow forthe extraction of phase angle influences.
5. AMIE (Advanced Moon ImagingExperiment)
The micro camera AMIE (see figure 6) (Jossetet al 2003) provides high-resolution CCD imagesof selected lunar areas (table 5 lists the broadobjectives of the camera). Demonstration imagesof the Earth and Moon were obtained during thecruise and final approach before lunar capture (fig-ures 7 and 8). AMIE includes filters depositedon the CCD in white light + three filters forcolour analyses, with bands at 750 nm, 900 nmand 950 nm. These provide data on the 1µmabsorption of pyroxene and olivine. The camerawill have an average resolution of 80 m/pixel, and30 m/pixel near a 300 km perilune. AMIE imagesprovide a geological context (figures 9 and 10)for SIR and D-CIXS data, and colour or multi-phase angle complement (Muinonen et al 2002;Shkuratov et al 2003). Lunar south pole repeatedand deep high resolution images will be obtained.
Figure 6. AMIE camera optical and detector unit.
This could allow the identification of shadowedor double-shadowed areas, the search for potential‘water ice traps’ or ‘cold traps’. Also, SMART-1will map potential sites of ‘eternal light’ and‘eternal shadow’ (see figure 9), or sites relevantfor future lunar exploration (lunar bases, powersupplies).
6. SMART-1 operations, data archivingand integration
The SMART-1 spacecraft is operated from ESOCin Darmstadt. The Mission Operations Centre(MOC) will include the Main Control Room(MCR) augmented by a Flight Dynamics Room,Dedicated Control Rooms, and Project Support
SMART-1 at the Moon 695
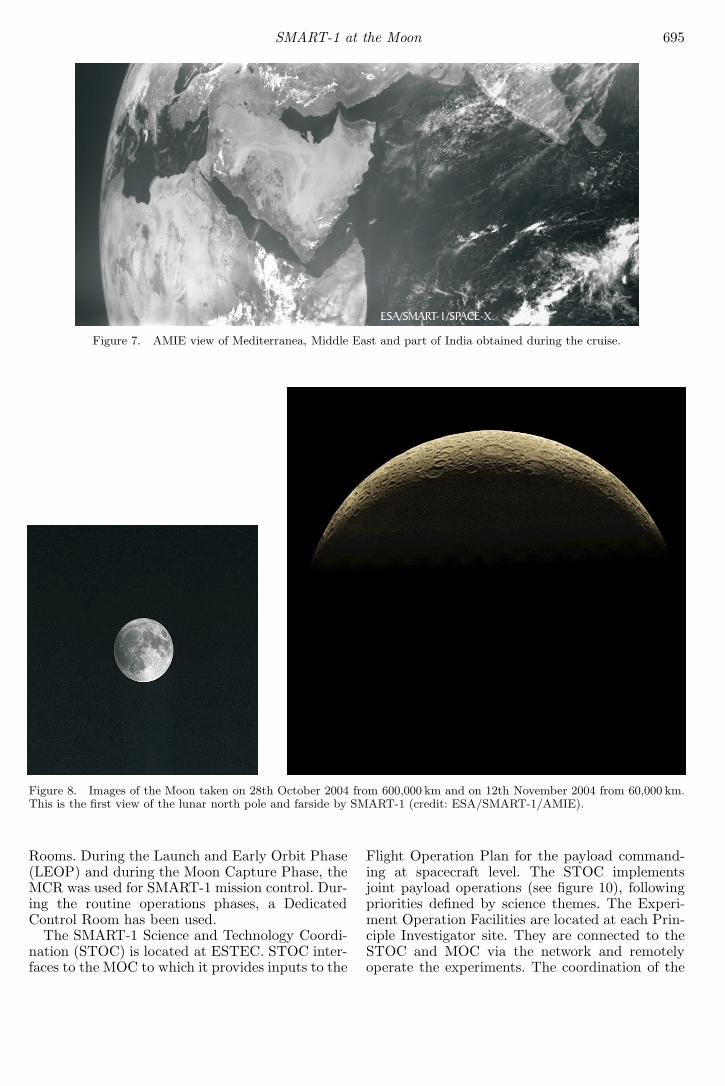
Figure 7. AMIE view of Mediterranea, Middle East and part of India obtained during the cruise.
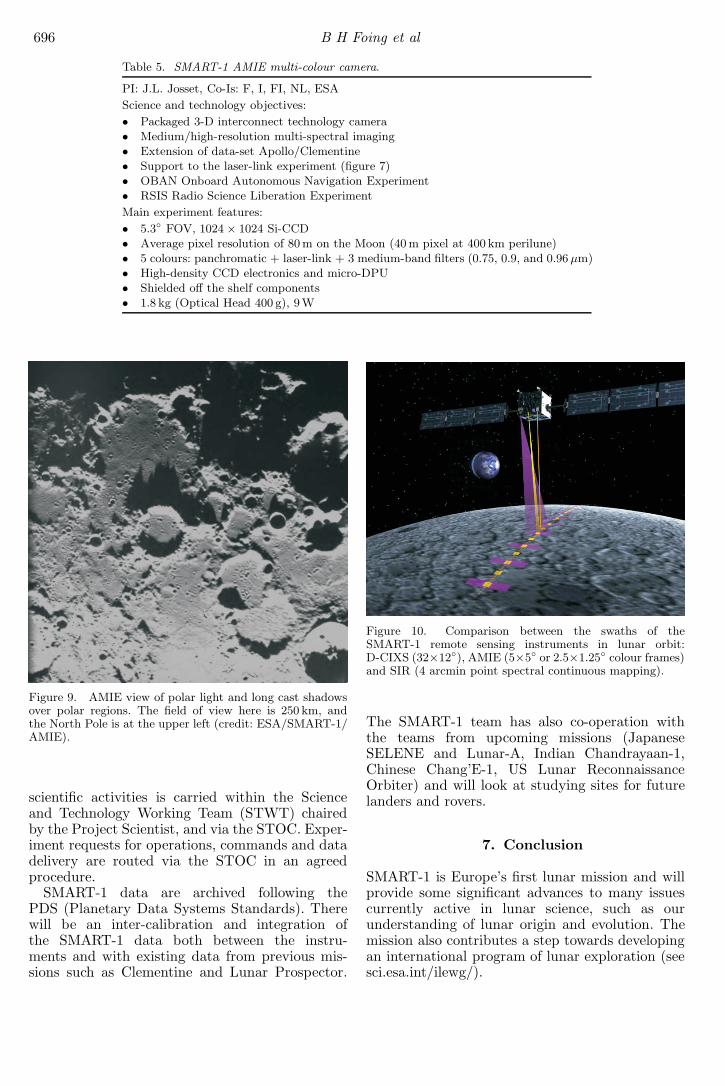
Figure 8. Images of the Moon taken on 28th October 2004 from 600,000 km and on 12th November 2004 from 60,000 km.This is the first view of the lunar north pole and farside by SMART-1 (credit: ESA/SMART-1/AMIE).
Rooms. During the Launch and Early Orbit Phase(LEOP) and during the Moon Capture Phase, theMCR was used for SMART-1 mission control. Dur-ing the routine operations phases, a DedicatedControl Room has been used.
The SMART-1 Science and Technology Coordi-nation (STOC) is located at ESTEC. STOC inter-faces to the MOC to which it provides inputs to the
Flight Operation Plan for the payload command-ing at spacecraft level. The STOC implementsjoint payload operations (see figure 10), followingpriorities defined by science themes. The Experi-ment Operation Facilities are located at each Prin-ciple Investigator site. They are connected to theSTOC and MOC via the network and remotelyoperate the experiments. The coordination of the
696 B H Foing et al
Table 5. SMART-1 AMIE multi-colour camera.
PI: J.L. Josset, Co-Is: F, I, FI, NL, ESA
Science and technology objectives:
• Packaged 3-D interconnect technology camera• Medium/high-resolution multi-spectral imaging• Extension of data-set Apollo/Clementine• Support to the laser-link experiment (figure 7)• OBAN Onboard Autonomous Navigation Experiment• RSIS Radio Science Liberation Experiment
Main experiment features:
• 5.3◦ FOV, 1024 × 1024 Si-CCD• Average pixel resolution of 80 m on the Moon (40 m pixel at 400 km perilune)• 5 colours: panchromatic + laser-link + 3 medium-band filters (0.75, 0.9, and 0.96 µm)• High-density CCD electronics and micro-DPU• Shielded off the shelf components• 1.8 kg (Optical Head 400 g), 9W
Figure 9. AMIE view of polar light and long cast shadowsover polar regions. The field of view here is 250 km, andthe North Pole is at the upper left (credit: ESA/SMART-1/AMIE).
scientific activities is carried within the Scienceand Technology Working Team (STWT) chairedby the Project Scientist, and via the STOC. Exper-iment requests for operations, commands and datadelivery are routed via the STOC in an agreedprocedure.
SMART-1 data are archived following thePDS (Planetary Data Systems Standards). Therewill be an inter-calibration and integration ofthe SMART-1 data both between the instru-ments and with existing data from previous mis-sions such as Clementine and Lunar Prospector.
Figure 10. Comparison between the swaths of theSMART-1 remote sensing instruments in lunar orbit:D-CIXS (32×12◦), AMIE (5×5◦ or 2.5×1.25◦ colour frames)and SIR (4 arcmin point spectral continuous mapping).
The SMART-1 team has also co-operation withthe teams from upcoming missions (JapaneseSELENE and Lunar-A, Indian Chandrayaan-1,Chinese Chang’E-1, US Lunar ReconnaissanceOrbiter) and will look at studying sites for futurelanders and rovers.
7. Conclusion
SMART-1 is Europe’s first lunar mission and willprovide some significant advances to many issuescurrently active in lunar science, such as ourunderstanding of lunar origin and evolution. Themission also contributes a step towards developingan international program of lunar exploration (seesci.esa.int/ilewg/).
SMART-1 at the Moon 697
The spacecraft launched on 23rd September2003 as an Ariane 5 Auxiliary passenger to GTO,reached lunar capture in November 2004, and lunarscience orbit in March 2005.
Three remote sensing instruments, D-CIXS, SIRand AMIE, used during the mission’s nominal sixmonths plus one year extension in lunar orbit,are returning data that will be relevant to abroad range of lunar studies. The mission willprovide the first global X-ray map of the Moon,global high spectral resolution NIR spectrome-try, and high spatial resolution colour imagingof selected regions. With a perilune near thelunar south pole, the South Pole–Aitken basin(SPA) is a prime target for studies using theSMART-1 suite of instruments. Combined, thesewill aid a large number of science studies, frombulk crustal composition and theories of lunar ori-gin/evolution to the search for cold traps at thelunar poles and the mapping of potential lunarresources.
Further information and updates on theSMART-1 mission status can be found on the ESAScience Web pages, at:http://sci.esa.int/SMART-1/.
Acknowledgements
Thanks are extended to the co-investigators of theSMART-1 Science and Technology Working Team(STWT), to the members of the SMART-1 projectand the industrial teams that prepared the space-craft and various aspects of the mission.
References
Basilevsky A T, Keller H U, Nathues A, Mall U, Hiesinger Hand Rosiek M 2004 Scientific objectives and selection oftargets for the SMART-1 Infrared Spectrometer (SIR);Planet. Space Sci. 52 1261.
Clark P E and Adler I 1978 Utilization of independentsolar flux measurements to eliminate non-geochemical
variation in X-ray fluorescence data; Proc. Lunar Planet.Sci. Conf. 12 727–749.
Dunkin S K, Grande M, Casanova I et al 2003 Scientificrationale for the D-CIXS X-ray spectrometer on boardESA’s SMART-1 mission to the Moon; Planet. Space Sci.51 435–442.
Foing B H, Heather D, Almeida M and SMART-1 STWT2001 The Science Goals of SMART-1; Earth, Moon,Planets 85–86 523–531.
Grande M et al 2002 The D-CIXS spectrometer and itscapabilities for lunar science; Adv. Space Res. 30(8)1901–1907.
Grande M, Browning R, Waltham N et al 2003 The D-CIXSX-ray mapping spectrometer on SMART-1; Planet. SpaceSci. 51 427–433.
Josset J L et al 2005 The Advanced Moon Micro ImagerExperiment (AMIE) on SMART-1: A miniaturized imag-ing system for the observation of planetary surfaces;Planet. Space Sci. submitted 2005.
Lawrence D J, Feldman W C, Elphic R C, Little R C,Prettyman T H, Maurice S, Lucey P G and Binder A B2002 Iron abundances on the lunar surface as mea-sured by the Lunar Prospector gamma-ray and neu-tron spectrometers; J. Geophys. Res. 107(E12) 5130,doi:10.1029/2001JE001530.
Lucey P G, Taylor G J and Hawke B R 1998 FeO andTiO2 concentrations in the South Pole–Aitken basin:implications for mantle composition and basin formation;J. Geophys. Res. 103 3701–3708.
Marini A E, Racca G D and Foing B H 2002 SMART-1Technology preparation to future planetary missions;Advances in Space Research 30(8) 1895–1900.
Muinonen K, Shkuratov Y, Ovcharenko A et al 2002The SMART-1 AMIE experiment: implication to thelunar opposition effect; Planet. Space Sci. 50(14–15)1339–1344.
Pieters C M, Tompkins S, He G et al 1997 Mineralogy ofthe mafic anomaly in the South Pole–Aitken basin (SPA):implications for the excavation of the lunar mantle;Geophys. Res. Lett. 24 1903–1906.
Racca G D, Marini A, Stagnaro L et al 2002 SMART-1 Mis-sion Description and Development Status; Planet. SpaceSci. 50 1323–1337.
Shearer C K and Papike J J 1999 Origin of the lunarmare high-titanium basalts: melting of a deep hybridizedsource or shallow assimilation of high-Ti Cumulates?;Lunar. Planet. Sci. Conf. 30 1365.
Shkuratov Y G, Stankevich D G, Kaydash V G, OmelchenkoV V, Pieters C M, Pinet P C, Chevrel S D, Daydou Y H,Foing B H, Sodnik Z et al 2003 Composition of the lunarsurface as will be seen from SMART-1: A simulation usingClementine data; J. Geophys. Res. (Planets) 108(E4) 1.