Embed Size (px)
Citation preview
CONTENTS
Overview
Products
Terms and Definitions
Licenses
Software update
Quick Start
How to use the Trading Simulator
How to use the Strategy Tester
GUI
Toolbar
Simulaton - tab
Zoom In - tab
History - tab
Real Time - tab
Data - tab
Settings - tab
Help - tab
License - tab
Strategy - tab
Tester - tab
Analyzer - tab
Products - tab
Other tabs
Settings
Test Data
Offline (Back testing on historical data)
Online (Streaming real time prices)
Trading Simulation (Manual trading)
Data Speed Control
Order operations
Time shifting (pausing the live data feed)
Orders history and log
Trade Analysis
Strategy Tester (Automated trading)
Strategy editor
Interfaces between a strategy and the Tester
Tester dashboard
Orders history and log

Pivot Points Analyzer
Tick Data Recorder
Semi-Automated Testing
Signals
OVERVIEW
Smart Forex Tester Suite is a set of advanced tools for developing and testing your Forex
trading strategy. It can be used to practice manual trading, both on real live prices and offline.
You can also automate your trading strategy with the standard C++ language and test it on the
variety of market data. A graphical tool is provided for the tick-by-tick analysis of your trades
and the market action. You can prepare the test data for the back testing yourself by recording
the live quotes and editing them. The tool can also be used for the market signals generation.
All the features are using the same GUI and the same simulation module. All the functionality is
divided into separate products.
Products
Any Forex strategy testing tool must have two key elements: a source of market data and a
mechanism to execute the trading commands.
A trading strategy can be executed either manually or automatically. The test data can be either
the real-time price quotes from a live data feed or the historical prices stored in a file.
These different combinations of data feed and trading automation level are enabled in the
different products included in the Suite.
Online Trading Simulator streams live real prices to practice the manual trading when the
Forex markets are open.
Offline Trading Simulator renders historical data to make it possible to practice the manual
trading even when the markets are closed.
Strategy Tester is a tool to develop and evaluate an automated trading strategy. You can test
both on historical prices and on live data feed.
Simulator Plus includes Online and Offline Simulators and adds the Time Shift feature.
Smart Forex Tester Suite is the top of the line product that includes all available features with
more to come.
Terms and Definitions
simulation - modelling the Forex market with the purpose of testing a strategy. Can use the
market data from a file or live data streaming.
offline - a synonym for the back testing, i.e. using historical data for the simulation.
online - a synonym for the forward testing, i.e. using the real-time data from a live stream for the
simulation.
time shift - a technology that enables pausing and resuming the live data feed for the online
simulation.
Back to Table of Contents
Licenses
Note: this help describes all the functionality available in the Suite. Please check your license
description for the information on the features included.
Free licenses only require a (free) subscription. The licenses are tied to the email address used
for subscription. The licenses never expire: as long as you stay subscribed, you can obtain any
free license and switch between them conveniently in the software GUI.
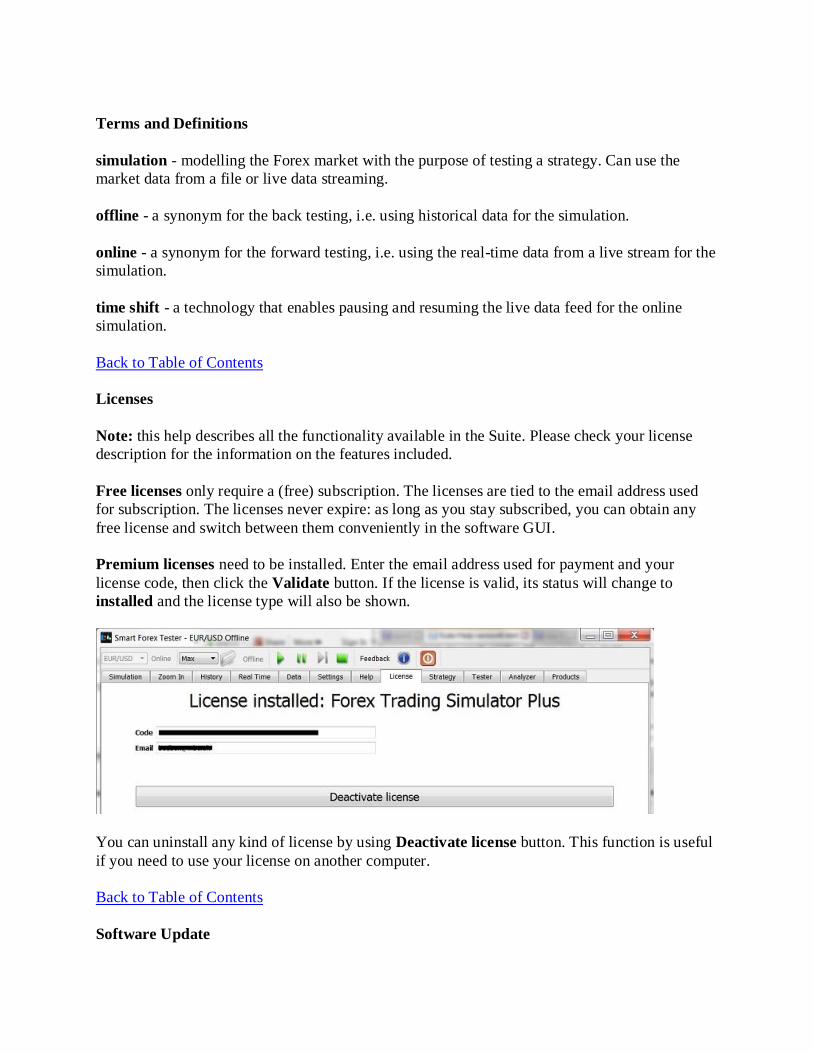
Premium licenses need to be installed. Enter the email address used for payment and your
license code, then click the Validate button. If the license is valid, its status will change to
installed and the license type will also be shown.
You can uninstall any kind of license by using Deactivate license button. This function is useful
if you need to use your license on another computer.
Back to Table of Contents
Software Update

The software is checking for the updates automatically at every start-up. If a new version is
available, a dialog is shown that provides you the link to the update download page. You can
also check the updates manually at any time using the Check now button on the Settings tab.
To install a newer version of the Smart Forex Tester Suite, follow exactly the same procedure
you used to perform the initial installation. Installing updates don't require any license
manipulations - as long as you don't uninstall the software prior to upgrading. In which case, you
will need to install the license again.
Back to Table of Contents
QUICK START
On start-up, the software displays all the available products; those included in your license will
show the Use button. Click it to select a product you want to work with from the list of enabled
ones. If you need a different product, use buttons to acquire a proper license and restart the
software when prompted.
The software can be used for different combinations of data source type (live feed or file) and
trading type (manual or automated).
Manual trading is done with the Simulator. Online Simulator works on live data feed, which it
not available when the markets are closed on weekends. On the contrary, Offline Simulator can
be used any time, anywhere - because it doesn't need an Internet connection.
The trading operations are performed on the Simulation tab.
Automated trading always requires the Tester. The Strategy tab provides a full-fledged C++
environment to develop your trading algorithm. Then you can run the strategy on both live data
feed and offline.
Most frequently used functions related to the data feed (e.g. as pause or stop) are located on the
Toolbar. So they can be accessed from any tab.
Back to Table of Contents
How to use the Trading Simulator
First you need to prepare the data you want to test on.
For the Online Simulation on live market prices, click the Online button, select a currency pair
from the drop-down list. Adjust the account currency if prompted. Account currency is the one
used in the reports to calculate your profit/loss.
For the Offline Simulation on historical data, click the Offline button, then use the File button to

download the historical market data from a file. There is also an option to use an inbuilt test data
file. If preferred, adjust the date and time when to start the test.
When the test data is prepared, click the green Play button to start the Simulator. Now you can
monitor the markets and perform the trading operations.
Back to Table of Contents
How to use the Strategy Tester
Go to the Strategy tab and prepare your C++ trading algorithm: either load it from a .cpp file, or
type it in the editor. If you are not yet comfortable with C++, you can start from our sample 3-
RSI based strategy available on the software download page.
Now prepare the test data. The process is identical to that described above for the Simulator.
When all is ready, navigate to the Tester tab and click the green Play button to start the test. If
you start from another tab, the test won't be run at maximum speed.
Back to Table of Contents
GUI
The GUI consists of the Toolbar and set of Tabs, dedicated to a certain functionality or product.
Toolbar makes some important controls (mostly related to the data feed manipulation)
accessible from any tab.
Simulation is the main tab, which is a combination of the dashboard and the control panel. Here
you can monitor the market data charts and indicators, place or close orders and stops.
Zoom In tab is designed to facilitate analysis of your trades and market action. You can analyze
the price quotes and your orders with an absolute (tick-by-tick) accuracy.
History tab shows full trading logs. In addition, internal software logs are available, which can
be used e.g. for debugging your automated trading strategy.
Real Time tab provides the live market data for 10 main currency pairs. There is also a real-time
latency graph to monitor the quality of the data server connection. Here you can also control the
tick recording.
Data tab is used to prepare the historical data for back testing. You can select the test start
date/time from the loaded tick data file, as well as load an inbuilt test data.
Settings tab provides controls to change all global parameters, e.g. graphics mode or account
currency. You can also check for software updates.
Help tab contains this guide and a set of How to... quick links.
License tab is used to install, validate and upgrade your software license.
Strategy tab provides all you need to develop your automated trading strategy. There is an editor
for the C++ code, as well as the controls for the inbuilt C++ compiler.
Tester tab provides the intormation about the test being run, and also the strategy testing results,
in both graphical and table formats - as well as the test report.
Analyzer tab provides our tool to detect market extremes in real time based on our proprietory
algorithm.
Products tab is a starting tab. Here you can obtain or change a free license, or select which
product to use from already installed ones.
Other Tabs: (to be added in later releases)
Data Manager tab provides the tools to prepare the test data from different sources, including
the real time feeds. (Not ready yet!)
Back to Table of Contents
SETTINGS
On this tab, you can adjust the graphics parameters, select which indicators to show, check for
software updates, etc.
For the tick graphs in the top row, you can select the size of the data window. For the LHS
(close-up) graph, the default value is 10 s, and the max is 120 s. For the RHS graph, the range is
120-7200 s.
For the averaged quote graph in the middle, you can set the data window size and the averaging
interval (M1/M5/M15/M30/H1). You can also select the plotting mode: line or candlesticks. If
the Scale to orders flag is set, the vertical scale is adjusted to make visible all the orders placed
during currently running simulation.
With Plotting accuracy parameter you can adjust the scale of all the price graphs. The parameter
value defines how many digits after decimal point are used. The default value is 4 digits.
Indicator graph in the bottom can plot RSI, ATR or MACD. On the middle hraph, you can
plot the moving averages - (SMA and EMA); the number of periods used in their calculation
can be set in the Awer. window control.
For all the graphs, you can activate the offset view. In this mode, the graphs will be plotted with
a gap between the latest value and the right margin. You might find viewing graphs in this mode
more comfortable.
For the Trading server, you can set the min and max values of the response delay. The
Simulator generates a random delay value for each request. This setting is only available for
Offline (back testing) mode.
Stoplevel (measured in pips, default 5) is a minimum allowed distance to the market when
placing Stop-loss or Take profit orders. The same value is used for both. Order fill will fail if
you try to place the order closer to the market than the minimum distance.
Default Lot size is Mini (10,000). It can be changed between the simulation runs. The deal size
is measured in selected lots. The maximum deal size is 100 lots.
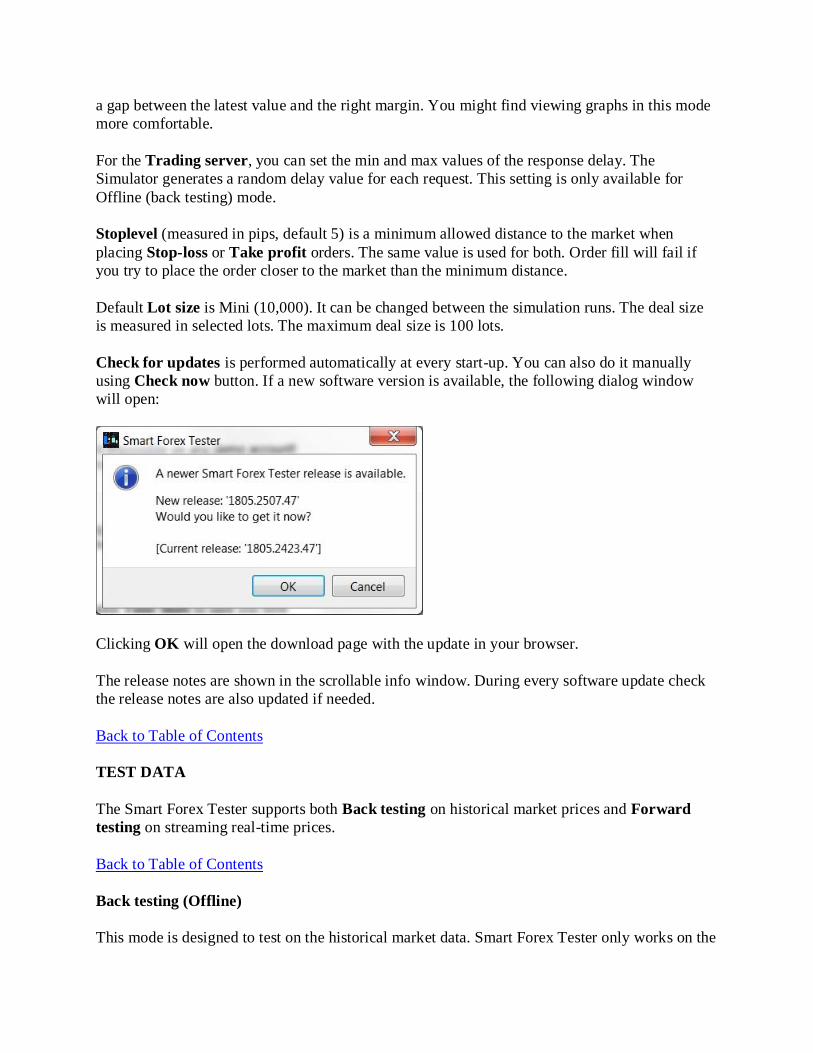
Check for updates is performed automatically at every start-up. You can also do it manually
using Check now button. If a new software version is available, the following dialog window
will open:
Clicking OK will open the download page with the update in your browser.
The release notes are shown in the scrollable info window. During every software update check
the release notes are also updated if needed.
Back to Table of Contents
TEST DATA
The Smart Forex Tester supports both Back testing on historical market prices and Forward
testing on streaming real-time prices.
Back to Table of Contents
Back testing (Offline)
This mode is designed to test on the historical market data. Smart Forex Tester only works on the

tick-by-tick data, which is loaded as a .csv file.
To start the back testing, click on the Offline button on the Toolbar. Then use the File button to
open a tick data file. You can also use the inbuilt test data, which opens by clicking the Load
sample data button on the Data tab.
We recommend using the historical tick-by-tick data from www.truefx.com. The data is free and
high quality; you can get the quotes for 15 main currency pairs since 2009. The price data is
available in monthly files. You need to download them to your computer and unzip before using
in the Tester.
The screenshot below shows how the loaded inbuilt sample data looks like.
When the data file loading is complete, the calendar will show the first tick's date highlighted in
blue (November 2nd). The whole data interval will be light colored (November 2-3). As you can
see, there was over 300K ticks in just 2 days!
NOTE: monthly tick data files are large, so their loading might take a while. You can monitor
the progress of loading in the status bar in the bottom. In the case of any loading errors, they will
be logged on the History tab.
You can select the desired simulation start date by clicking on it in the calendar. You can also
specify the start time. The options available include standard opening times of the trading
sessions - Asian, European and North American, as well as manual time select.
If you don't explicitly select date and time, the simulation will automatically start from the first
tick in the data file.
When the test data is ready, click on the green Play button on the Toolbar to start the simulation.
The focus will switch to the Simulation tab, where you can monitor the markets and place your

orders.
NOTE: While the tab shows the calendar for one month only, it doesn't set a month limit to the
size of the test data file. The calendar always shows the first month, thus only limiting the test
start date. The data file size is only limited by the available RAM. Keep in mind though, that
even one month of ticks requires hundreds of MB.
Back to Table of Contents
Forward testing (Online)
This mode enables you to practice in the real-time, when the Forex market is open. The
streaming price quotes (provided by www.truefx.com) are available for 10 main currency pairs.
To start the live data feed, click the Online button on the Toolbar, select a currency pair from the
drop-down list, and press the green Play button.
NOTE: before each online simulation, the Tester will download the latest price data (3000 ticks
or about 4 hours). So, the price graphs will be plotted with a delay, whose value depends on the
quality of your Internet connection (normally, less than 1 min).
To change the currency pair, stop the running simulation by pressing the Stop button on the
Toolbar, select a new pair as described above and press the green Play button.
Internet access
Real-time simulation requires decent (low latency) Internet connection, as the software is
fetching the prices quotes from the server over the Internet.
To monitor the quality of your connection, Smart Forex Tester constantly measures the round
trip time (RTT) and displays its last minute real-time graph as well as the averages for the longer
term.
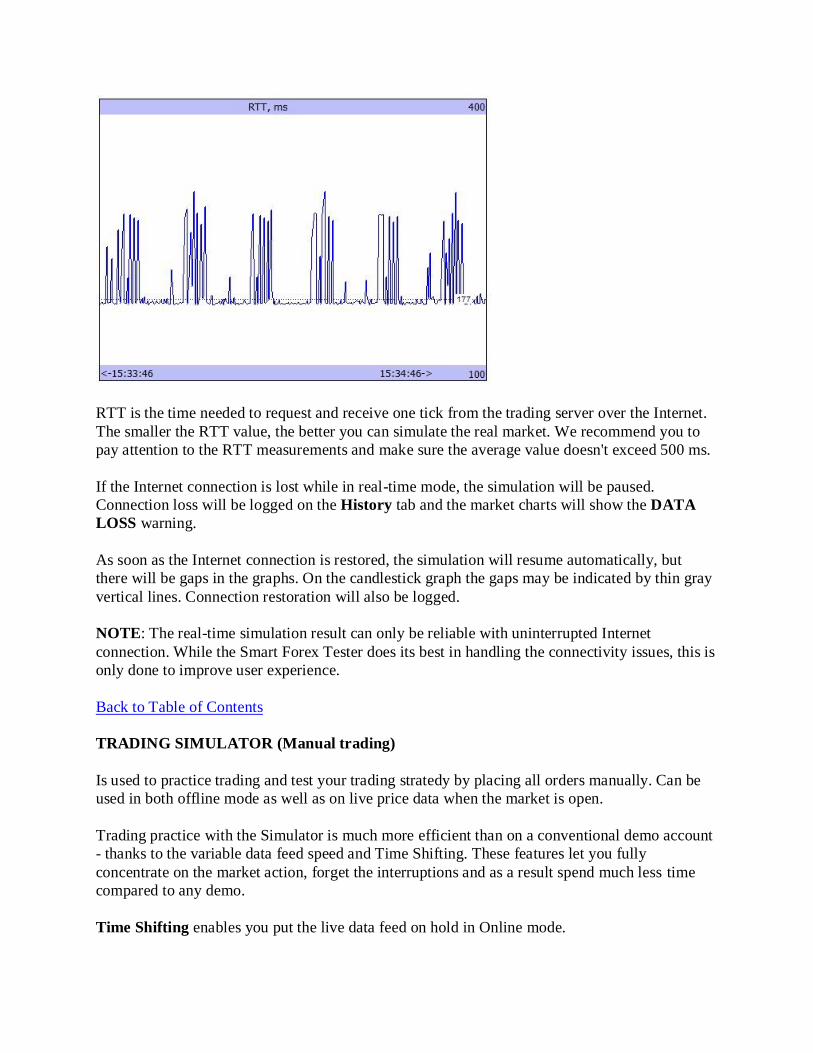
RTT is the time needed to request and receive one tick from the trading server over the Internet.
The smaller the RTT value, the better you can simulate the real market. We recommend you to
pay attention to the RTT measurements and make sure the average value doesn't exceed 500 ms.
If the Internet connection is lost while in real-time mode, the simulation will be paused.
Connection loss will be logged on the History tab and the market charts will show the DATA
LOSS warning.
As soon as the Internet connection is restored, the simulation will resume automatically, but
there will be gaps in the graphs. On the candlestick graph the gaps may be indicated by thin gray
vertical lines. Connection restoration will also be logged.
NOTE: The real-time simulation result can only be reliable with uninterrupted Internet
connection. While the Smart Forex Tester does its best in handling the connectivity issues, this is
only done to improve user experience.
Back to Table of Contents
TRADING SIMULATOR (Manual trading)
Is used to practice trading and test your trading stratedy by placing all orders manually. Can be
used in both offline mode as well as on live price data when the market is open.
Trading practice with the Simulator is much more efficient than on a conventional demo account
- thanks to the variable data feed speed and Time Shifting. These features let you fully
concentrate on the market action, forget the interruptions and as a result spend much less time
compared to any demo.
Time Shifting enables you put the live data feed on hold in Online mode.
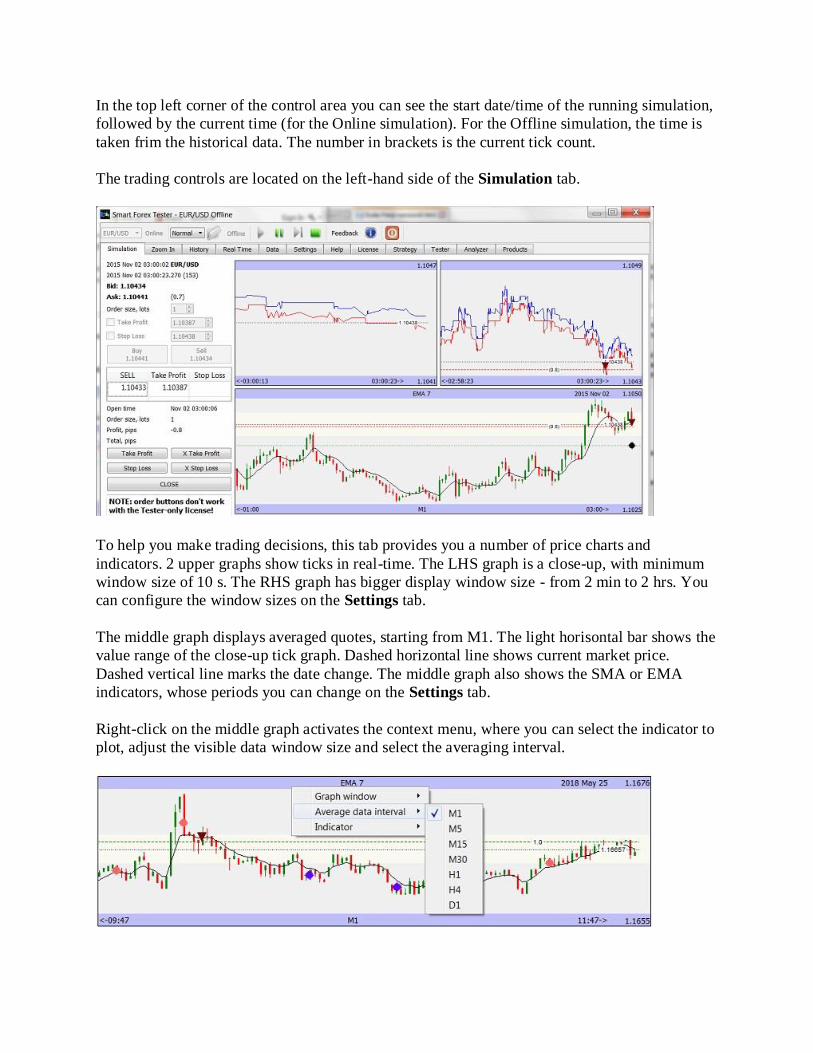
In the top left corner of the control area you can see the start date/time of the running simulation,
followed by the current time (for the Online simulation). For the Offline simulation, the time is
taken frim the historical data. The number in brackets is the current tick count.
The trading controls are located on the left-hand side of the Simulation tab.
To help you make trading decisions, this tab provides you a number of price charts and
indicators. 2 upper graphs show ticks in real-time. The LHS graph is a close-up, with minimum
window size of 10 s. The RHS graph has bigger display window size - from 2 min to 2 hrs. You
can configure the window sizes on the Settings tab.
The middle graph displays averaged quotes, starting from M1. The light horisontal bar shows the
value range of the close-up tick graph. Dashed horizontal line shows current market price.
Dashed vertical line marks the date change. The middle graph also shows the SMA or EMA
indicators, whose periods you can change on the Settings tab.
Right-click on the middle graph activates the context menu, where you can select the indicator to
plot, adjust the visible data window size and select the averaging interval.

You can select the plotting style (line or candles) on the Settings tab. By default, the candles are
used.
NOTE: Left click on the middle graph will switch to the Zoom In tab. Double click there will
bring you back to the main view.
The bottom graph is reserved for the indicators. Currently supported are RSI, ATR and MACD.
Right-click on the bottom graph will activate the context menu to select the indicator to view,
adjust the visible data window size and select the averaging interval.
During the Offline simulation, you can put the current simulation on hold with the green Pause
button. To unhold the simulation, press the button again.
During the Live simulation, you can put the current simulation on hold with the red Record
button. To unhold the simulation, press the blue Play button.
To end the Simulation of any type, use the Stop button.
NOTE: When you start a new simulation, the previous trading history will be deleted.
Back to Table of Contents
Data Feed options
It is possible to vary the speed of the data feed during Offline simulation and when Timeshift is
used.
By default, the data feed is always started in Normal mode. It means that ticks are sourced
at exactly the same intervals as they appeared on the market.

In the 2X (4X) mode, the ticks are sourced twice (4 times) faster compared to the Normal mode.
These modes are useful to save time when practicing trading on quiet markets. E.g. in Asian
sessions the time intervals between ticks can sometimes exceed 1 min.
The Max mode doesn't limit the time intervals between ticks anyhow, so the feed speed depends
solely on your hardware. This option is used mainly for debugging and demonstrations.
In the 1/2X (1/4X) mode, the ticks are sourced twice (4 times) slower compared to the Normal
mode. These modes can be used during fast-paced markets, e.g. to practice news trading.
Back to Table of Contents
Working with orders
Currently Smart Forex Tester supports one active market order, with linked Stop-loss and Take
profit orders. Pending orders and multiple orders will be supported from the release 2.0.
You can place a market order in one click using the BUY and SELL buttons.
On the graph, the orders are marked with a green triange pointing up (BUY) and a black triange
pointing down (SELL). The active order is also marked with a horizontal dashed line drawn at
the price the order was opened. The line is colored green if the position is profitable and red in
the opposite case. The profit (loss) value is written on the line.
You can place the Take profit and Stop Loss orders simultaneously with the market order. For
that, before you press the order button, check the Take Profit or/and Stop Loss boxes located
just above the Buy button. Set the desired price using arrow buttons or by entering it manually.
The solid horizontal line is drawn at the price level entered in the control.
Stop orders can also be placed at any time after the market order using Stop Limit and Stop
Loss buttons. Clicking a button opens a dialog window where you can select the desired price
level using arrow buttons or by entering it manually and press OK button. The solid horizontal
line on the graph helps you adjust the price. When the price is set, press OK button to place the
order.
The same buttons can be used to move active stop orders. With the X Stop Limit and X Stop

Loss buttons you can cancel stops.
NOTE: Every time you try to place or move a stop order, its distance to the market is checked
first. If the price you entered is too close to the current market price, the order fill error will be
returned by the trading server. The minimum distance to the market is configured by the
Stoplevel parameter on the Settings tab.
If you use a dialog box to add or move the stops for the active market order, the Simulator
automatically calculates the minimum distance to the currently effective market price and
doesn’t accept incorrect values. For your convenience, the arrow buttons are also colored. Red
button indicates that the price is too close and order placing command won’t be accepted.
NOTE: It is still possible for a stop order to be declined after the command was accepted - if the
price changed unfavorably before the server receives the command.
All your trading activity is presented on History tab.
Back to Table of Contents
Time shifting
Time shift feature makes it possible to pause/resume the live data feed during the Online
simulation. It is very helpful when your real-time practice is interrupted, e.g. by an important
phone call. Using the time shift feature, you can put the running simulation on hold and resume it
later at any time.
As long as your Internet connection stays active, Smart Forex Tester will continue receiving the
market data and storing it in the memory. The recorded data can be also used offline later.
Time shift both saves your time and helps you use your time very effectively.
To pause the Online simulation, press the red Record button on the Toolbar. The Simulator will
start storing streaming prices internally. The LHS tick graph will show the red recording symbol
and also show its duration.
NOTE: Order operations are not possible during recording.
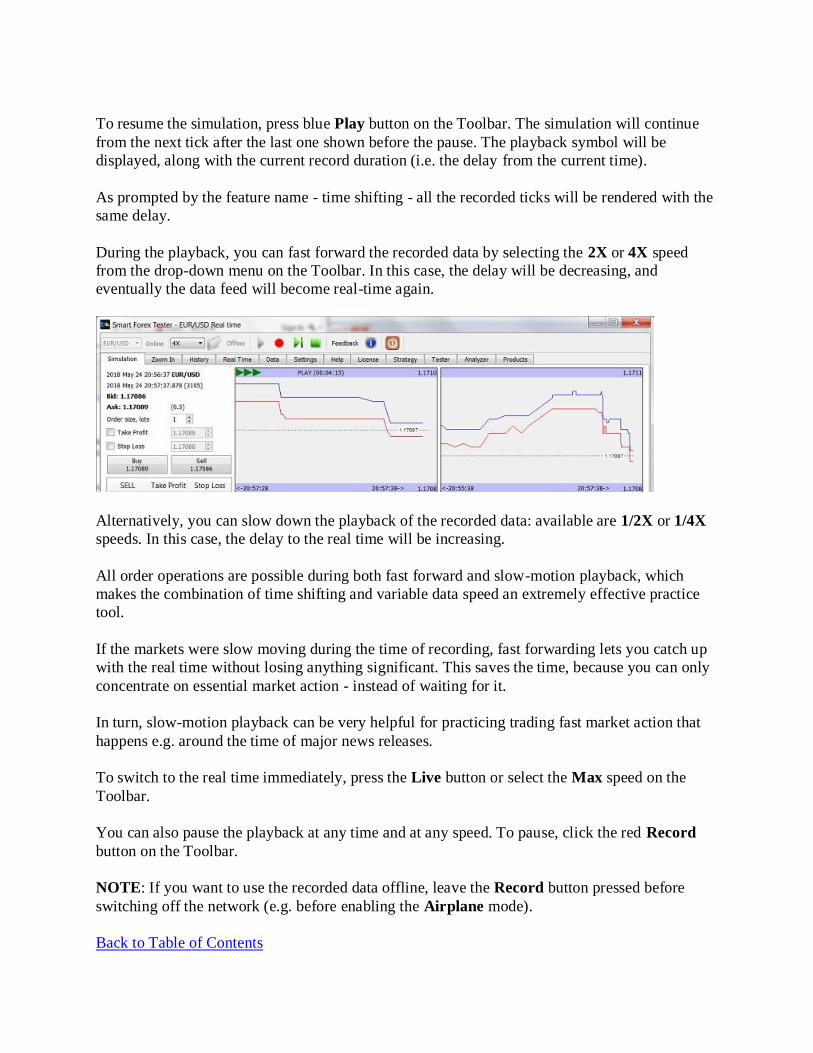
To resume the simulation, press blue Play button on the Toolbar. The simulation will continue
from the next tick after the last one shown before the pause. The playback symbol will be
displayed, along with the current record duration (i.e. the delay from the current time).
As prompted by the feature name - time shifting - all the recorded ticks will be rendered with the
same delay.
During the playback, you can fast forward the recorded data by selecting the 2X or 4X speed
from the drop-down menu on the Toolbar. In this case, the delay will be decreasing, and
eventually the data feed will become real-time again.
Alternatively, you can slow down the playback of the recorded data: available are 1/2X or 1/4X
speeds. In this case, the delay to the real time will be increasing.
All order operations are possible during both fast forward and slow-motion playback, which
makes the combination of time shifting and variable data speed an extremely effective practice
tool.
If the markets were slow moving during the time of recording, fast forwarding lets you catch up
with the real time without losing anything significant. This saves the time, because you can only
concentrate on essential market action - instead of waiting for it.
In turn, slow-motion playback can be very helpful for practicing trading fast market action that
happens e.g. around the time of major news releases.
To switch to the real time immediately, press the Live button or select the Max speed on the
Toolbar.
You can also pause the playback at any time and at any speed. To pause, click the red Record
button on the Toolbar.
NOTE: If you want to use the recorded data offline, leave the Record button pressed before
switching off the network (e.g. before enabling the Airplane mode).
Back to Table of Contents

Orders history and log
The History tab has a table showing all the orders for the current simulation. For each order, its
size, open/close time/price and profit are shown. For the active order, SL and TP values are
shown as well. The profit is shown both in pips and the account currency.
The bottom part of the tab is reserved for the simulation log. Each log record starts with a time
stamp, which in the case of Online simulation corresponds to the current time. In the back testing
mode, the time stamps are taken from the ticks in the historical data file.
The time stamp is followed by the log level (e.g. INF or ERR), or the ID of the product that
printed the message. E.g. on the screenshot below you can see the log lines with the ID PPA -
these are the signals reported by the Pivot Points Analyzer.
In addition to the PPA signals, standard log messages are written during the software start-up,
test data download, trading operations etc.
NOTE: Both the log and the trading history will be rewritten when you start a new simulation.
Back to Table of Contents
TRADE ANALYSIS
To investigate your trades and study the market price action, you can use the zooming
functionality.
To go to the zooming mode, left click on any graph on the Simulation tab.
Alternatively, you can select an area to zoom into by clicking and holding the left mouse button
on the one side and releasing it on the opposite side.
The selected area will be shown on the Zoom In tab as a tick graph, so you can see all the details

with a 100% accuracy.
Once on this tab, you can continue zooming in by selecting a smaller area with the mouse as
described above. To zoom out, use the left click. Double click will return you to the Simulation
tab.
You can also move the graph as a whole by clicking and holding the right button.
The vertical and horizontal lines drawn from the cursor help you find the price quotes and trades.
All the information is shown in the status line in the bottom.
For example, on the above screenshot, the vertical line is set on the SELL order symbol. So we
can see the trade happened at the tick #1039, with bid 1.17185 and ask 1.1719. Other numbers in
square brackets show the ticks interval that is currently plotted (845 thru 1064). The date of the
test is also shown (2018 May, 24).
Back to Table of Contents
STRATEGY TESTER (Automated trading)
It is an advanced tool for automating your trading strategy by programming all the decisions and
trading operations in powerful C++ language. Smart Forex Tester provides a strategy editor and
an inbuilt C++ compiler. Compared to manual testing, automated strategies can be tested much
faster and with much better accuracy.
Back to Table of Contents
STRATEGY
The Smart Forex Tester provides powerful development environment to program your trading
strategy by supporting the standard C++ language.
You have a number of interfaces to the Tester engine to get relevant market data and also send
trading commands to the market simulator.
On this tab, you can load a strategy from a *.cpp file, or type/paste it in the edit window.
Check strategy button starts the inbulilt C++ compiler. The Compiler messages are shown in the
window in the bottom.
Execute flag, if enabled, results in loading the strategy to the Tester after successful compilation;
to be executed immediately.
Reload on the fly flag defines whether to update the recompiled strategy during the running test.
NOTE: the Tester doesn't save the source file automatically before compilation - but it does that
on exit.
Back to Table of Contents
Interfaces between the strategy and the Tester
To program the logic of your strategy, you can use the standard C++ language. But to get the
market data from the Strategy Tester and work with the orders, you need to use the internal
interfaces.
Currently, the following interfaces are supported.
extern double Ask, Bid;
extern int Bars;
extern const char *Symb;
extern void LogPrint(const char *fmt, ...);
enum {
M1 = 60,
M5 = 300,
M15 = 900,
M30 = 1800,
H1 = 3600
H4 = 14400

D1 = 86400};
enum {
OP_BUY = 1,
OP_SELL = 2
};
extern int PlaceOrder(int Operation, int Lots, double Price, double slip, double sl, double
tp);
extern int CloseOrder(int ticket);
extern int Ticket;
extern int OrderType();
extern double OrderPrice();
extern int OrderLots();
extern double RSI(int period, int Idx);
extern double StopLevel();
extern int GetTickCnt();
extern void RefreshRates();
Back to Table of Contents
Tester dashboard
This is a dashboard for testing automated trading strategies. You can see all the test parameters
and monitor the test results.
NOTE: The Tester can be activated on both offline data and the live data feed. You can use the
Online testing mode to generate live Forex signals.
To run the test, you need to select a data source and define your trading strategy.
Strategy control shows the file name of the selected strategy. The procedure of strategy
compilation is described in Strategy chapter.
Offline data control is used in the backtesting mode: you can see the tick data file name, the
currency pair and the time interval for testing. The data selection procedure is described in the
Test Data section.
Test Progress control lets you monitor the percentage of the test completion, the time elapsed in
the historical file, the physical test run time, and the test speed as the ratio of the two. If the
Online (Forward) testing is in progress, it is indicated by the Live sign and the current time is
displayed.
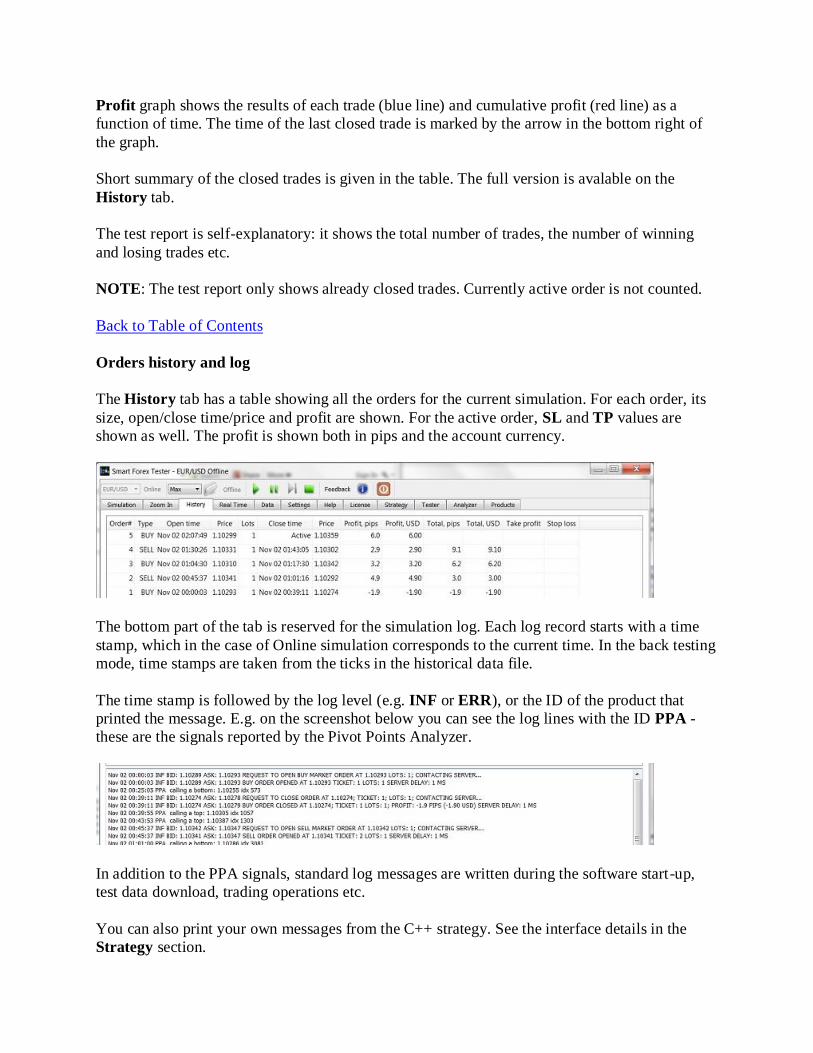
Profit graph shows the results of each trade (blue line) and cumulative profit (red line) as a
function of time. The time of the last closed trade is marked by the arrow in the bottom right of
the graph.
Short summary of the closed trades is given in the table. The full version is avalable on the
History tab.
The test report is self-explanatory: it shows the total number of trades, the number of winning
and losing trades etc.
NOTE: The test report only shows already closed trades. Currently active order is not counted.
Back to Table of Contents
Orders history and log
The History tab has a table showing all the orders for the current simulation. For each order, its
size, open/close time/price and profit are shown. For the active order, SL and TP values are
shown as well. The profit is shown both in pips and the account currency.
The bottom part of the tab is reserved for the simulation log. Each log record starts with a time
stamp, which in the case of Online simulation corresponds to the current time. In the back testing
mode, time stamps are taken from the ticks in the historical data file.
The time stamp is followed by the log level (e.g. INF or ERR), or the ID of the product that
printed the message. E.g. on the screenshot below you can see the log lines with the ID PPA -
these are the signals reported by the Pivot Points Analyzer.
In addition to the PPA signals, standard log messages are written during the software start-up,
test data download, trading operations etc.
You can also print your own messages from the C++ strategy. See the interface details in the
Strategy section.

NOTE: Both the log and the trading history will be rewritten when you start a new simulation.
Back to Table of Contents
PIVOT POINTS ANALYZER
Pivot Points Analyzer (PPA) uses an original algorithm to detect market extremes in real-time.
Its main purpose is to help you better time your market entry and exit.
The PPA signals can be used independently, which is especially useful in day trading (e.g. for
scalping). In addition, you can use them as part of the complex trading strategies, where you can
benefit from combining fast PPA with lagging indicators.
The PPA will plot the detected market extremes as dots. The red dots correspond to market tops,
and the blue dots - to the bottoms.
The PPA signals are duplicated on the Simulation tab.
You can tune the detector sensitivity with the 3 sliders. Increasing the parameters' values will
result in detecting less peaks.
You can pause the analysis clicking the Pause button and investigate the detection results using
zooming features the same way as described in TRADE ANALYSIS section.

You can also access the PPA signals in the C++ environments to use them in your automated
trading strategy. The signals are calculated on every tick and are accessible as follows:
bool isSigMax() { return Signals & SIG_PPA_MAX; }
bool isSigMin() { return Signals & SIG_PPA_MIN; }
The isSigMax() is triggered when a market top is identified, and the isSigMin() signals about a
market bottom.
NOTE: Currently, the PPA signals in an automated trading strategy use the peak detector values
that are set on the Analyzer tab. Later on, it will be possible to change the values from the
strategy.
Back to Table of Contents
TICK DATA RECORDER
It is possible to save the ticks from the live market data feed locally.
To enable the ticks recording, check the Save live tick data box on the Real time tab.
With saving enabled, a file save dialog will open every time you click the Stop button to end the
running Online simulation.
Ticks are saved as .csv file in the same format that Offline simulator supports. So you can keep
Online simulation running for some time, record and save the tick data and use it later for the
Offline testing.
Back to Table of Contents
SEMI-AUTOMATED TESTING
This is the most efficient testing mode when you are developing your automated trading strategy.
The benefit of this approach is convenience and time savings. You don't have to have all the
elements in place to start testing. You can always place an order manually and let the algorithm
to continue, or vice versa.
For a ready strategy, the same mode can be used in trading. It is analogus to flying a modern
aircraft: the autopilot is used in standard predictable situations but is manually overridden by the
pilot when more complicated decision are required.
You can allow an automated strategy to operate on stable markets, and take breaks or just relax
from staring at the monitor. You can always regain controls once things get complicated. You
can also place a trade yourself but let the algorithm follow it up and take the profit or cut the
losses.
Back to Table of Contents
SIGNALS
In Online mode, the Stratery Tester can be configured to generate a sound signal on every trade
executed by the automated strategy. Same can be done in Pivot Point Analyzer. This makes the
Smart Forex Tester a convenient tool to assist the real trading.
Back to Table of Contents