Embed Size (px)
Citation preview
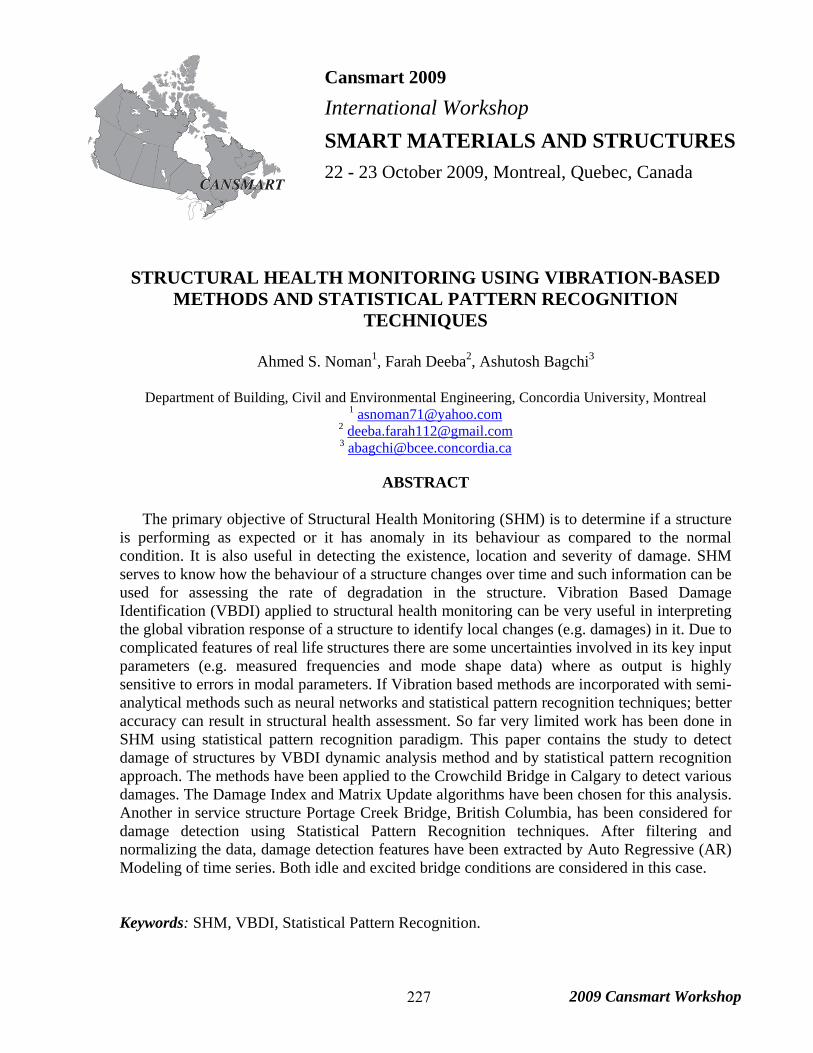
Cansmart 2009
International Workshop SMART MATERIALS AND STRUCTURES 22 - 23 October 2009, Montreal, Quebec, Canada
2009 Cansmart Workshop
STRUCTURAL HEALTH MONITORING USING VIBRATION-BASED
METHODS AND STATISTICAL PATTERN RECOGNITION TECHNIQUES
Ahmed S. Noman1, Farah Deeba2, Ashutosh Bagchi3
Department of Building, Civil and Environmental Engineering, Concordia University, Montreal 1 [email protected]
2 [email protected] [email protected]
ABSTRACT
The primary objective of Structural Health Monitoring (SHM) is to determine if a structure
is performing as expected or it has anomaly in its behaviour as compared to the normal condition. It is also useful in detecting the existence, location and severity of damage. SHM serves to know how the behaviour of a structure changes over time and such information can be used for assessing the rate of degradation in the structure. Vibration Based Damage Identification (VBDI) applied to structural health monitoring can be very useful in interpreting the global vibration response of a structure to identify local changes (e.g. damages) in it. Due to complicated features of real life structures there are some uncertainties involved in its key input parameters (e.g. measured frequencies and mode shape data) where as output is highly sensitive to errors in modal parameters. If Vibration based methods are incorporated with semi-analytical methods such as neural networks and statistical pattern recognition techniques; better accuracy can result in structural health assessment. So far very limited work has been done in SHM using statistical pattern recognition paradigm. This paper contains the study to detect damage of structures by VBDI dynamic analysis method and by statistical pattern recognition approach. The methods have been applied to the Crowchild Bridge in Calgary to detect various damages. The Damage Index and Matrix Update algorithms have been chosen for this analysis. Another in service structure Portage Creek Bridge, British Columbia, has been considered for damage detection using Statistical Pattern Recognition techniques. After filtering and normalizing the data, damage detection features have been extracted by Auto Regressive (AR) Modeling of time series. Both idle and excited bridge conditions are considered in this case. Keywords: SHM, VBDI, Statistical Pattern Recognition.
227
2009 Cansmart Workshop
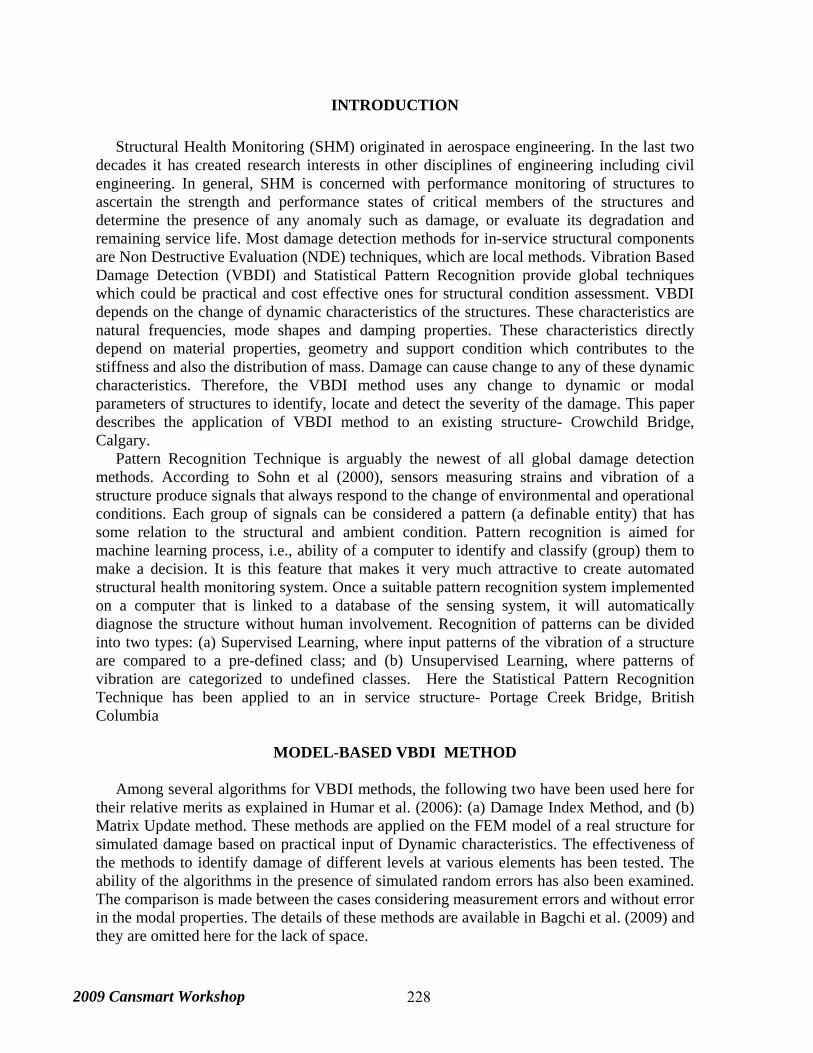
INTRODUCTION Structural Health Monitoring (SHM) originated in aerospace engineering. In the last two decades it has created research interests in other disciplines of engineering including civil engineering. In general, SHM is concerned with performance monitoring of structures to ascertain the strength and performance states of critical members of the structures and determine the presence of any anomaly such as damage, or evaluate its degradation and remaining service life. Most damage detection methods for in-service structural components are Non Destructive Evaluation (NDE) techniques, which are local methods. Vibration Based Damage Detection (VBDI) and Statistical Pattern Recognition provide global techniques which could be practical and cost effective ones for structural condition assessment. VBDI depends on the change of dynamic characteristics of the structures. These characteristics are natural frequencies, mode shapes and damping properties. These characteristics directly depend on material properties, geometry and support condition which contributes to the stiffness and also the distribution of mass. Damage can cause change to any of these dynamic characteristics. Therefore, the VBDI method uses any change to dynamic or modal parameters of structures to identify, locate and detect the severity of the damage. This paper describes the application of VBDI method to an existing structure- Crowchild Bridge, Calgary. Pattern Recognition Technique is arguably the newest of all global damage detection methods. According to Sohn et al (2000), sensors measuring strains and vibration of a structure produce signals that always respond to the change of environmental and operational conditions. Each group of signals can be considered a pattern (a definable entity) that has some relation to the structural and ambient condition. Pattern recognition is aimed for machine learning process, i.e., ability of a computer to identify and classify (group) them to make a decision. It is this feature that makes it very much attractive to create automated structural health monitoring system. Once a suitable pattern recognition system implemented on a computer that is linked to a database of the sensing system, it will automatically diagnose the structure without human involvement. Recognition of patterns can be divided into two types: (a) Supervised Learning, where input patterns of the vibration of a structure are compared to a pre-defined class; and (b) Unsupervised Learning, where patterns of vibration are categorized to undefined classes. Here the Statistical Pattern Recognition Technique has been applied to an in service structure- Portage Creek Bridge, British Columbia
MODEL-BASED VBDI METHOD
Among several algorithms for VBDI methods, the following two have been used here for their relative merits as explained in Humar et al. (2006): (a) Damage Index Method, and (b) Matrix Update method. These methods are applied on the FEM model of a real structure for simulated damage based on practical input of Dynamic characteristics. The effectiveness of the methods to identify damage of different levels at various elements has been tested. The ability of the algorithms in the presence of simulated random errors has also been examined. The comparison is made between the cases considering measurement errors and without error in the modal properties. The details of these methods are available in Bagchi et al. (2009) and they are omitted here for the lack of space.
228
2009 Cansmart Workshop
The case study used in study of VBDI methods is the Crowchild Bridge (ISIS, 2008) located in Calgary, Alberta, which is a two lane traffic overpass with three continuous spans and reported to be the first continuous steel free deck bridge in the world (Tadros et al.,1998). The bridge was constructed without any internal steel reinforcement to avoid the problem of corrosion in steel. The concrete deck is externally constrained by steel strap to provide aching action to resist transverse loads, and nominal amount of fiber reinforced polymer (FRP) reinforcing bars or fiber reinforced concrete are provided for crack control. The cantilever portion of the deck requires flexural reinforcement which is usually provided using FRP bars. Damage detection algorithms have been implemented in a finite element program M-FEM developed by Bagchi et al. (2007).
STATISTICAL PATTERN RECOGNITION METHODS IN SHM
All SHM processes rely on experimental data with inherent uncertainties. Statistical analysis procedures are necessary if one is to identify the dynamic nature of structure including effect of sudden change due to live load and also steady change of temperature over time. The basic components of statistical pattern recognition are: (a) operational evaluation; (b) data acquisition and cleansing; (c) feature extraction; and (d) statistical model development. Feature extraction is the process of the identifying damage-sensitive properties derived from the measured vibration response that allows one to distinguish between the undamaged and damaged structures (Sohn et al 2000). Typically, systematic differences between time series from the undamaged and damaged structures are nearly impossible to detect by human eyes. Therefore, other features of the measured data must be examined for damage detection. Typically mathematical processes for time series analysis are utilized to extract features. Statistical model development is a technique that implements algorithms to analyze the distribution of extracted features to determine the damage state of the structure. The appropriate algorithm to use in statistical model development will depend on the availability of data of damaged states. In this study, data for known damaged state of the structures are not available. Therefore outlier analysis, such as the X-bar Control Chart (Fuget et al. 2000) is performed for feature comparison. Control chart analysis is the most commonly used Statistical Process Control technique for Outlier Analysis, and it is also suitable for automated continuous system monitoring. Statistical Patten recognition technique is tested on Portage Creek Bridge located in Victoria, British Columbia (BC) in Canada. It is disaster Route Bridge and the columns of one of the piers are the bridge has been retrofitted with FRP wraps to improve their seismic performance (Huffman et al., 2006). The data from the strain gauges installed on the columns have used here to evaluate their patterns and condition of the structure.
DAMAGE SIMULATION IN THE CROWCHILD BRIDGE
Description of the finite element model: An analytical model of the Crowchild Bridge is constructed here using three dimensional beam elements for the piers, girders, diaphragms and cross frames including the steel straps, and shell elements for the deck and side barriers. Initially the concrete was assumed to be un-cracked. The model based on this assumption was updated and correlated with the data obtained from the vibration test conducted in 1997 by the University of British Columbia
229
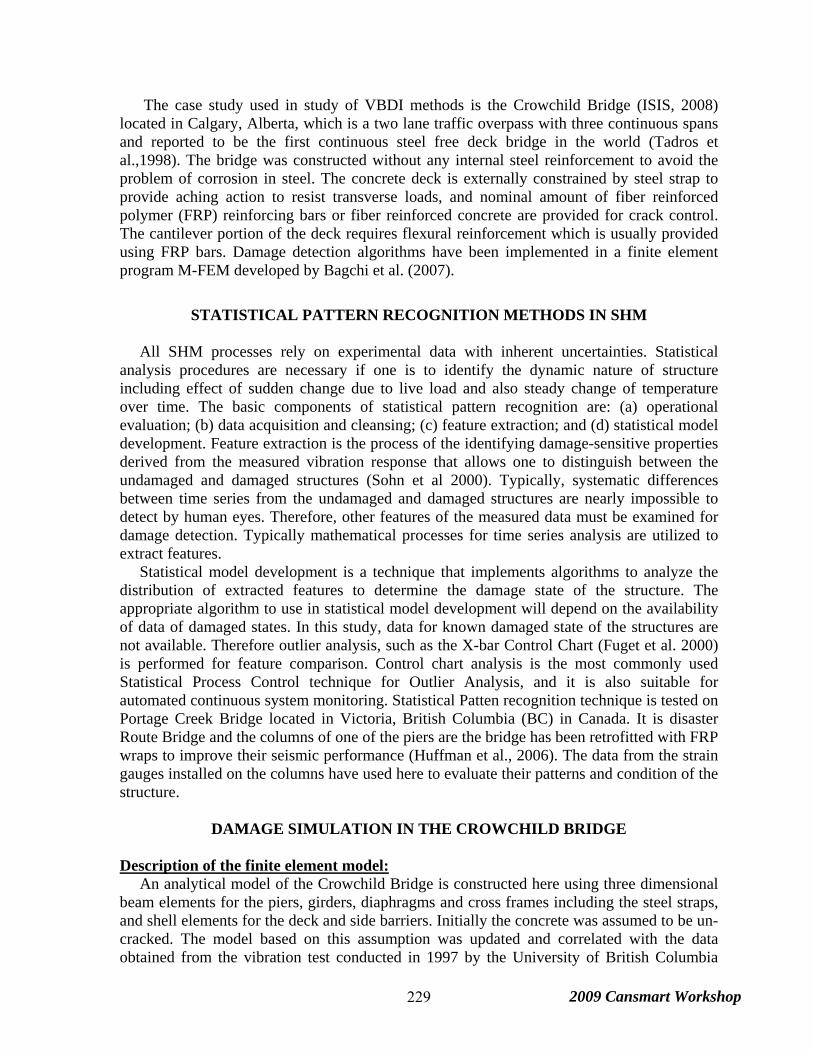
(Ventura et al., 2000). During the process of model updating, the stiffness coefficients of individual elements were modified to fine tune the resulting modal frequencies of the system. The bridge deck has 15 slab segments. The target area for testing is the segment in the middle along with the longitudinal girders at that location (Fig. 1). All elements at that location are simulated for damage scenario by reducing their stiffness in the FEM by certain fractions which are also considered damage severity factors or simply damage factors. The elements in this area are elements 53 through 58, 174,177,180,183 and 186.
2009 Cansmart Workshop
Fig. 1: Finite Element model of the bridge
Damage affected zone
North abutment South abutment
Estimated extent of damage
Damage locations
Actual extent of damage
(b)
(a)
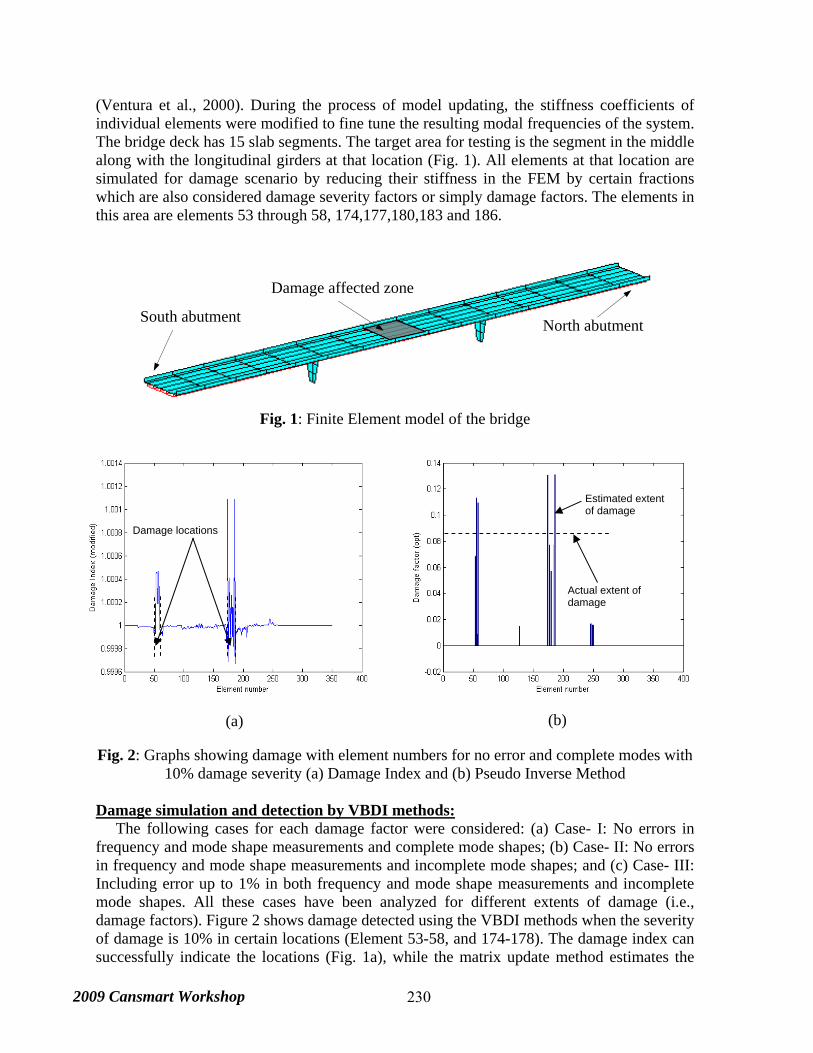
Fig. 2: Graphs showing damage with element numbers for no error and complete modes with 10% damage severity (a) Damage Index and (b) Pseudo Inverse Method
Damage simulation and detection by VBDI methods: The following cases for each damage factor were considered: (a) Case- I: No errors in frequency and mode shape measurements and complete mode shapes; (b) Case- II: No errors in frequency and mode shape measurements and incomplete mode shapes; and (c) Case- III: Including error up to 1% in both frequency and mode shape measurements and incomplete mode shapes. All these cases have been analyzed for different extents of damage (i.e., damage factors). Figure 2 shows damage detected using the VBDI methods when the severity of damage is 10% in certain locations (Element 53-58, and 174-178). The damage index can successfully indicate the locations (Fig. 1a), while the matrix update method estimates the
230
severity well, considering the mean value (Fig. 1b) when no error in frequency and mode shape measurements and complete mode shapes (i.e., Case-I). Similar analysis for Case -II and Case-III has also been performed. It is observed that incomplete mode shapes and some percentage of errors in frequencies did bring down the accuracy of the results comparing to first case. In practice, however, mode shapes are incomplete and the data contains measurement noise. Hence the accuracy of VBDI method may not be good. Other methods such as the Statistical Pattern Recognition methods could work well in such cases.
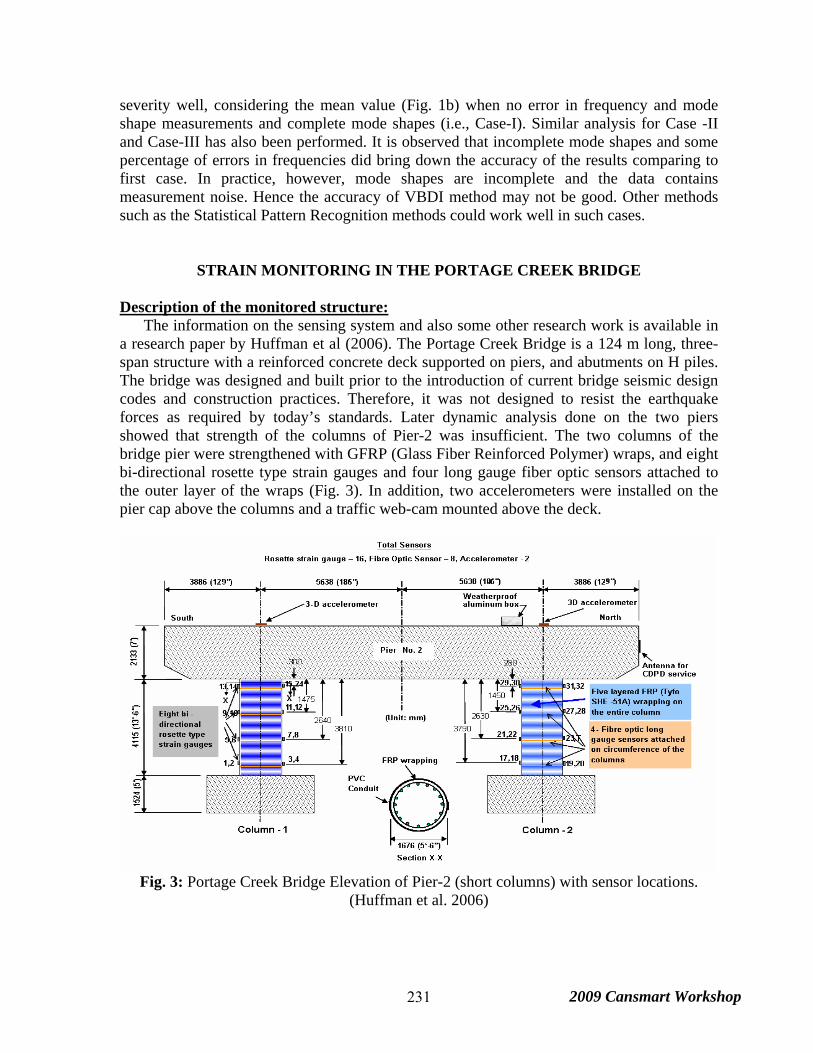
STRAIN MONITORING IN THE PORTAGE CREEK BRIDGE Description of the monitored structure: The information on the sensing system and also some other research work is available in a research paper by Huffman et al (2006). The Portage Creek Bridge is a 124 m long, three-span structure with a reinforced concrete deck supported on piers, and abutments on H piles. The bridge was designed and built prior to the introduction of current bridge seismic design codes and construction practices. Therefore, it was not designed to resist the earthquake forces as required by today’s standards. Later dynamic analysis done on the two piers showed that strength of the columns of Pier-2 was insufficient. The two columns of the bridge pier were strengthened with GFRP (Glass Fiber Reinforced Polymer) wraps, and eight bi-directional rosette type strain gauges and four long gauge fiber optic sensors attached to the outer layer of the wraps (Fig. 3). In addition, two accelerometers were installed on the pier cap above the columns and a traffic web-cam mounted above the deck.
Fig. 3: Portage Creek Bridge Elevation of Pier-2 (short columns) with sensor locations.
(Huffman et al. 2006)
2009 Cansmart Workshop 231
Data Collection And Pre-Processing: The data is acquired locally by the on-site data acquisition system and transmitted to a central server in order to be accessible through internet using an interactive web page at ISIS Canada’s web site. The earliest and the last time of data available for downloading from the database used here are 2003-04-23 13:54:33 and 2006-08-26 17:58:57 respectively. However there are some periods when data are not available. These off-times have occurred at all the range of the monitoring. The duration of off times varies from a few hours to several months. 30 strains of 16 2D-strain gauges, 6 accelerometer readings of two 3D accelerometers and 1 temperature data available for any starting time falling in the range limited by the time mentioned above. Sampling rates available are 1/32s, 1s, 10s and 1min. Number of data points available in a single download varies from 32 to 30,000. Data can be obtained both graphically and numerically.
Time (seconds)
Stra
in g
auge
rea
ding
s
300002500020000150001000050000
-260
-264
-268
-272
-276
Time Series plot of S_1_1_C1 of 30,000 readings at 1s interval
Time (seconds)
Stra
in g
auge
rea
ding
s
250200150100500
-258
-260
-262
-264
-266
-268
Time Series plot of S_1_1_1 of 256 readings at 1s interval
(a) (b)
Time (each unit = 1/32 second)
Stra
in g
auge
rea
ding
s
250200150100500
-256
-258
-260
-262
-264
-266
-268
Time Series plot of S_1_1_C1 of 256 readings at 1/32s interval
Time (each unit =1/32 s)
Rea
ding
s of
S_1
_1_C
1
250200150100500
46.0
45.5
45.0
44.5
44.0
A time series of strain S_1_1_C1 at Steady State
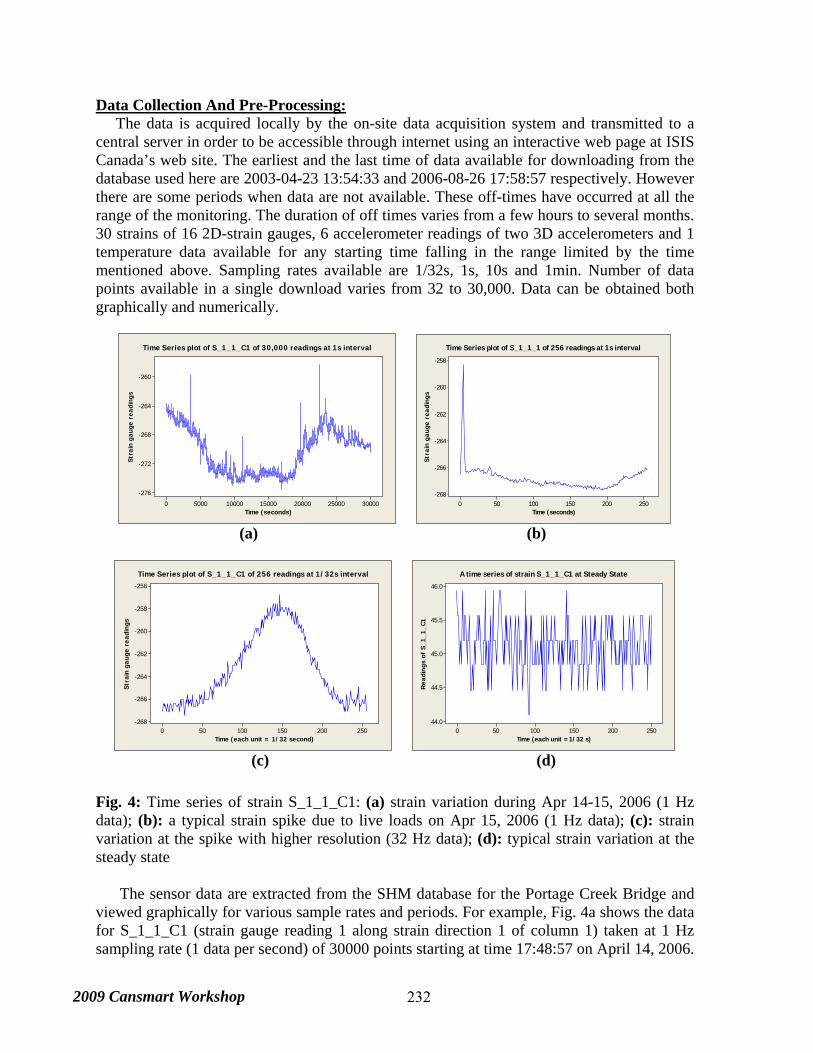
(c) (d) Fig. 4: Time series of strain S_1_1_C1: (a) strain variation during Apr 14-15, 2006 (1 Hz data); (b): a typical strain spike due to live loads on Apr 15, 2006 (1 Hz data); (c): strain variation at the spike with higher resolution (32 Hz data); (d): typical strain variation at the steady state The sensor data are extracted from the SHM database for the Portage Creek Bridge and viewed graphically for various sample rates and periods. For example, Fig. 4a shows the data for S_1_1_C1 (strain gauge reading 1 along strain direction 1 of column 1) taken at 1 Hz sampling rate (1 data per second) of 30000 points starting at time 17:48:57 on April 14, 2006.
2009 Cansmart Workshop 232
2009 Cansmart Workshop
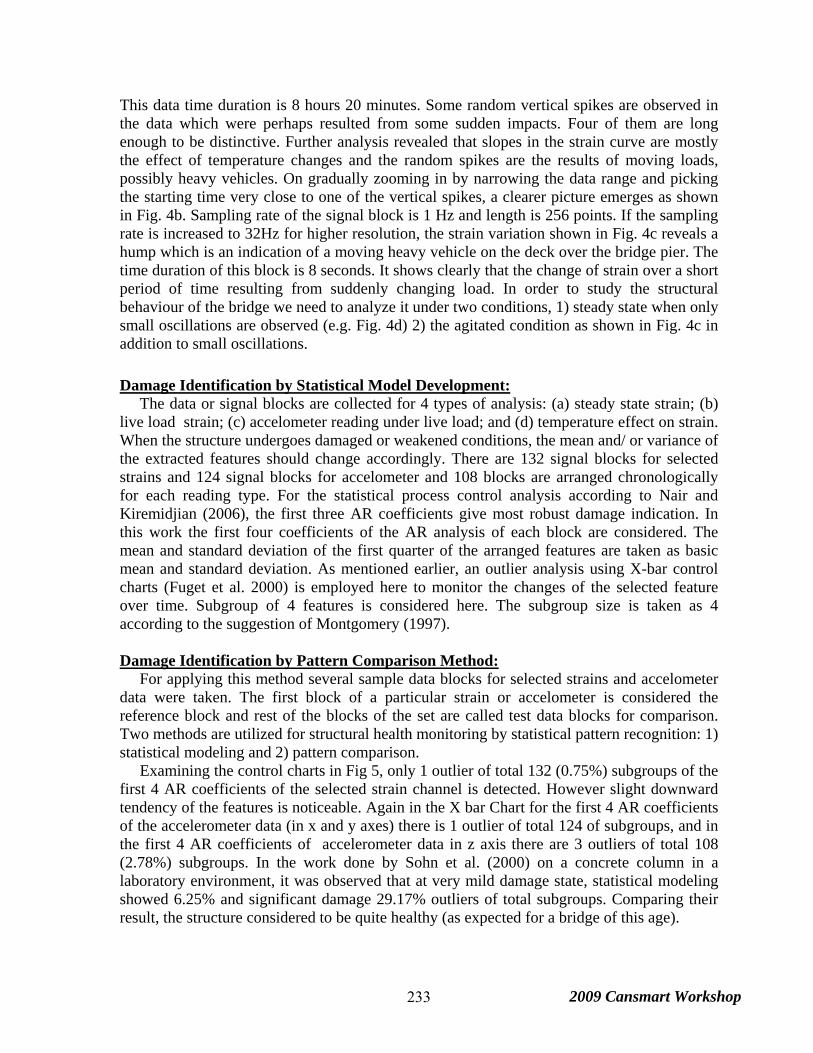
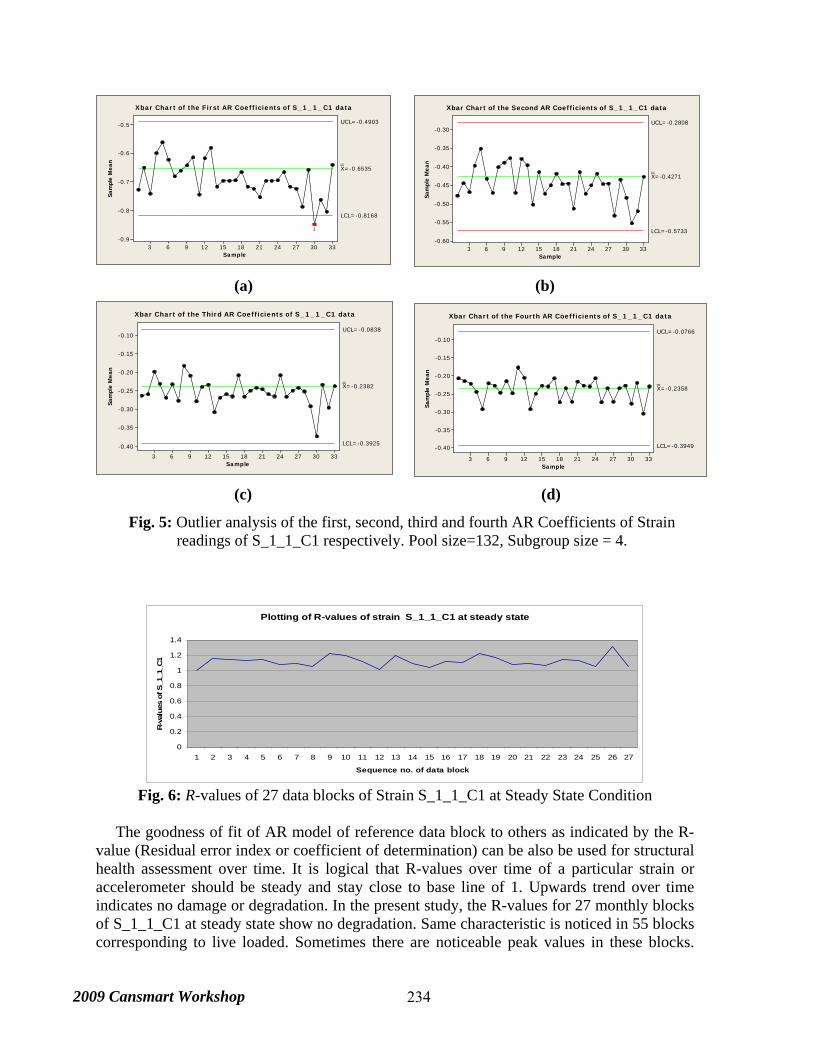
This data time duration is 8 hours 20 minutes. Some random vertical spikes are observed in the data which were perhaps resulted from some sudden impacts. Four of them are long enough to be distinctive. Further analysis revealed that slopes in the strain curve are mostly the effect of temperature changes and the random spikes are the results of moving loads, possibly heavy vehicles. On gradually zooming in by narrowing the data range and picking the starting time very close to one of the vertical spikes, a clearer picture emerges as shown in Fig. 4b. Sampling rate of the signal block is 1 Hz and length is 256 points. If the sampling rate is increased to 32Hz for higher resolution, the strain variation shown in Fig. 4c reveals a hump which is an indication of a moving heavy vehicle on the deck over the bridge pier. The time duration of this block is 8 seconds. It shows clearly that the change of strain over a short period of time resulting from suddenly changing load. In order to study the structural behaviour of the bridge we need to analyze it under two conditions, 1) steady state when only small oscillations are observed (e.g. Fig. 4d) 2) the agitated condition as shown in Fig. 4c in addition to small oscillations. Damage Identification by Statistical Model Development: The data or signal blocks are collected for 4 types of analysis: (a) steady state strain; (b) live load strain; (c) accelometer reading under live load; and (d) temperature effect on strain. When the structure undergoes damaged or weakened conditions, the mean and/ or variance of the extracted features should change accordingly. There are 132 signal blocks for selected strains and 124 signal blocks for accelometer and 108 blocks are arranged chronologically for each reading type. For the statistical process control analysis according to Nair and Kiremidjian (2006), the first three AR coefficients give most robust damage indication. In this work the first four coefficients of the AR analysis of each block are considered. The mean and standard deviation of the first quarter of the arranged features are taken as basic mean and standard deviation. As mentioned earlier, an outlier analysis using X-bar control charts (Fuget et al. 2000) is employed here to monitor the changes of the selected feature over time. Subgroup of 4 features is considered here. The subgroup size is taken as 4 according to the suggestion of Montgomery (1997). Damage Identification by Pattern Comparison Method: For applying this method several sample data blocks for selected strains and accelometer data were taken. The first block of a particular strain or accelometer is considered the reference block and rest of the blocks of the set are called test data blocks for comparison. Two methods are utilized for structural health monitoring by statistical pattern recognition: 1) statistical modeling and 2) pattern comparison. Examining the control charts in Fig 5, only 1 outlier of total 132 (0.75%) subgroups of the first 4 AR coefficients of the selected strain channel is detected. However slight downward tendency of the features is noticeable. Again in the X bar Chart for the first 4 AR coefficients of the accelerometer data (in x and y axes) there is 1 outlier of total 124 of subgroups, and in the first 4 AR coefficients of accelerometer data in z axis there are 3 outliers of total 108 (2.78%) subgroups. In the work done by Sohn et al. (2000) on a concrete column in a laboratory environment, it was observed that at very mild damage state, statistical modeling showed 6.25% and significant damage 29.17% outliers of total subgroups. Comparing their result, the structure considered to be quite healthy (as expected for a bridge of this age).
233
Sample
Sam
ple
Mea
n
3330272421181512963
-0.5
-0.6
-0.7
-0.8
-0.9
__X=-0.6535
UCL=-0.4903
LCL=-0.8168
1
Xbar Chart of the First AR Coefficients of S_1_1_C1 data
2009 Cansmart Workshop
Sample
Sam
ple
Mea
n
3330272421181512963
-0.10
-0.15
-0.20
-0.25
-0.30
-0.35
-0.40
__X=-0.2382
UCL=-0.0838
LCL=-0.3925
Xbar Chart of the Third AR Coefficients of S_1_1_C1 data
Sample
Sam
ple
Mea
n
3330272421181512963
-0.30
-0.35
-0.40
-0.45
-0.50
-0.55
-0.60
__X=-0.4271
UCL=-0.2808
LCL=-0.5733
Xbar Chart of the Second AR Coefficients of S_1_1_C1 data
(a) (b)
Sample
Sam
ple
Mea
n
3330272421181512963
-0.10
-0.15
-0.20
-0.25
-0.30
-0.35
-0.40
__X=-0.2358
UCL=-0.0766
LCL=-0.3949
Xbar Chart of the Fourth AR Coefficients of S_1_1_C1 data
(c)
Fig. 5: Outlier analysis of the first, second, third and fourth AR Coefficients of Strain readings of S_1_1_C1 respectively. Pool size=132, Subgroup size = 4.
(d)
Plotting of R-values of strain S_1_1_C1 at steady state
0
0.2
0.4
0.6
0.8
1
1.2
1.4
1 2 3 4 5 6 7 8 9 10 11 12 13 14 15 16 17 18 19 20 21 22 23 24 25 26 27
Sequence no. of data block
R-va
lues
of S
_1_1
_C1
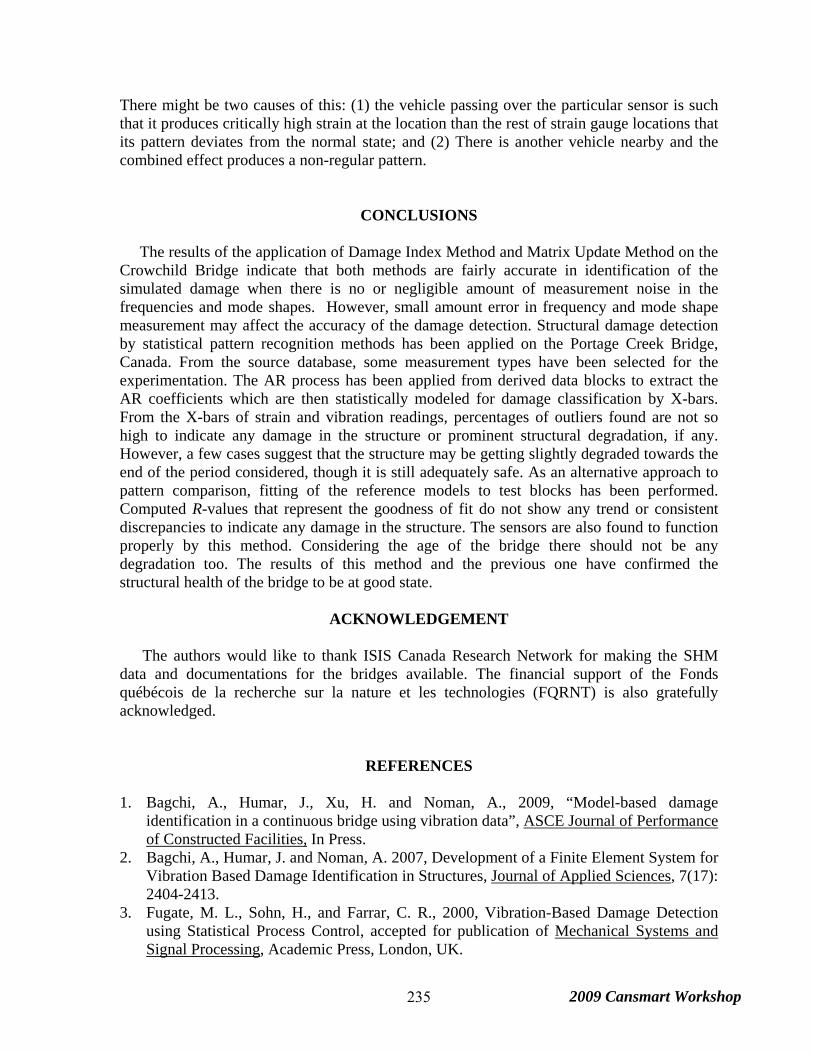
Fig. 6: R-values of 27 data blocks of Strain S_1_1_C1 at Steady State Condition
The goodness of fit of AR model of reference data block to others as indicated by the R-value (Residual error index or coefficient of determination) can be also be used for structural health assessment over time. It is logical that R-values over time of a particular strain or accelerometer should be steady and stay close to base line of 1. Upwards trend over time indicates no damage or degradation. In the present study, the R-values for 27 monthly blocks of S_1_1_C1 at steady state show no degradation. Same characteristic is noticed in 55 blocks corresponding to live loaded. Sometimes there are noticeable peak values in these blocks.
234
2009 Cansmart Workshop
There might be two causes of this: (1) the vehicle passing over the particular sensor is such that it produces critically high strain at the location than the rest of strain gauge locations that its pattern deviates from the normal state; and (2) There is another vehicle nearby and the combined effect produces a non-regular pattern.
CONCLUSIONS
The results of the application of Damage Index Method and Matrix Update Method on the Crowchild Bridge indicate that both methods are fairly accurate in identification of the simulated damage when there is no or negligible amount of measurement noise in the frequencies and mode shapes. However, small amount error in frequency and mode shape measurement may affect the accuracy of the damage detection. Structural damage detection by statistical pattern recognition methods has been applied on the Portage Creek Bridge, Canada. From the source database, some measurement types have been selected for the experimentation. The AR process has been applied from derived data blocks to extract the AR coefficients which are then statistically modeled for damage classification by X-bars. From the X-bars of strain and vibration readings, percentages of outliers found are not so high to indicate any damage in the structure or prominent structural degradation, if any. However, a few cases suggest that the structure may be getting slightly degraded towards the end of the period considered, though it is still adequately safe. As an alternative approach to pattern comparison, fitting of the reference models to test blocks has been performed. Computed R-values that represent the goodness of fit do not show any trend or consistent discrepancies to indicate any damage in the structure. The sensors are also found to function properly by this method. Considering the age of the bridge there should not be any degradation too. The results of this method and the previous one have confirmed the structural health of the bridge to be at good state.
ACKNOWLEDGEMENT
The authors would like to thank ISIS Canada Research Network for making the SHM data and documentations for the bridges available. The financial support of the Fonds québécois de la recherche sur la nature et les technologies (FQRNT) is also gratefully acknowledged.
REFERENCES
1. Bagchi, A., Humar, J., Xu, H. and Noman, A., 2009, “Model-based damage
identification in a continuous bridge using vibration data”, ASCE Journal of Performance of Constructed Facilities, In Press.
2. Bagchi, A., Humar, J. and Noman, A. 2007, Development of a Finite Element System for Vibration Based Damage Identification in Structures, Journal of Applied Sciences, 7(17): 2404-2413.
3. Fugate, M. L., Sohn, H., and Farrar, C. R., 2000, Vibration-Based Damage Detection using Statistical Process Control, accepted for publication of Mechanical Systems and Signal Processing, Academic Press, London, UK.
235

2009 Cansmart Workshop
4. Huffman S., Bagchi, A., Mufti, A., Neale, K., Sargent, D., and Rivera, E., 2006, GFRP Seismic strengthening and structural health monitoring of Portage Creek Bridge Concrete Columsn, The Arabian Journal for Science and Engineering, Volume 31, Number 1C.
5. Humar. J., Bagchi, A., and Xu, H., 2006, Performance of vibration based techniques for the Identification of Structural Damage, Structural Health Monitoring – An International Journal, 5(3): 215-227.
6. Montgomery, D. C., 1997, Introduction to Statistical Quality Control, John Wiley & Sons Inc, New York, NY.
7. Nair, K., K., and Kiremidjian A., S., 2006, A comparison of local damage detection algorithms based on statistical processing of vibration based measurements, Structural Health Monitoring and Intelligent Infrastructure-Qu, Li &Duan, Taylor &Francis Group, London.
8. Sohn, H., Czarneck, J. J., and Farrar, C. R., 2000; Structural Health Monitoring using Statistical Process Control, Journal of Structural Engineering, ASCE, 126(11):1356-1363.
9. Tadros, G., Tromposch, E. and Mufti, A.A. 1998. Superstructure replacement of the Crowchild Trail Bridge, 5th Int. Conference on Short and Medium Span Bridges, Calgary, Alberta.
10. Ventura, C.E., Brincker, R., Andersen, P., and Cantieni, R. 2002. Identification and damage detection studies of the Z24 highway bridge in Switzerland. Proceedings of the 6th International Conference on Short and Medium-span Bridges, Vancouver, Canada, pp 851-858.
236