Embed Size (px)
Citation preview

1
Smart Shopping Carts:
How Real-Time Feedback Influences Spending
Koert van Ittersum
Professor of Marketing and Consumer Well-Being
Department of Marketing
University of Groningen
Nettelbosje 2
9747 AE, Groningen, Netherlands
Phone: +31 50 363 6639
Brian Wansink
John S. Dyson Professor of Marketing
Cornell University
Ithaca, NY 14853-7801, USA
Phone: 607 254 6302
Joost M.E. Pennings
Professor of Marketing
Alex Investment Bank Professor of Finance
Maastricht University
Tongersestraat 53
6211 LM, Maastricht, Netherlands
Phone: +31 43 388 3934
Professor of Marketing
Wageningen University
Hollandseweg 1
6706 KN, Wageningen, Netherlands
Phone: +31 317-483385
Daniel Sheehan*
Ph.D. student
Georgia Institute of Technology
800 West Peachtree Street, NW
Atlanta, GA 30332-0520, USA
Phone: 404 385 4173
Forthcoming in Journal of Marketing
* The authors gratefully acknowledge the financial support of the Marketing Science Institute and the Association for Consumer
Research. The authors thank Carry Cissna, Kelly Martinett, Paola Pulido, Ryan Ricks, and Evan Woolard for their support during
the data collection process and Carter Posey and Kushal Sukthankar for their help with setting up the online grocery store. The
valuable input received during presentations at the Annual Georgia Marketing Symposium (2012), Marketing Science
Conference (2012), ACR conference (2012), University of Groningen (2012), and the Free University of Amsterdam (2013) is
gratefully acknowledged. Finally, the authors thank the Editor and the three anonymous reviewers for their constructive feedback
during the review process.

2
Smart Shopping Carts:
How Real-Time Feedback Influences Spending
While the interest in smart shopping carts is growing, both retailers and consumer groups have
concerns about how real-time spending feedback will influence shopping behavior. Building on
budgeting and spending theories, the authors conduct three lab and grocery store experiments,
which robustly show that real-time spending feedback has a diverging impact on spending
depending on whether a person is budget constrained (“budget” shoppers) or not (“nonbudget”
shoppers). Real-time spending feedback stimulates budget shoppers to spend more (by buying
more national brands). In contrast, this feedback leads nonbudget shoppers to spend less (by
replacing national brands with store brands). Furthermore, smart shopping carts increase
repatronage intentions for budget shoppers while keeping them stable for nonbudget shoppers.
These findings underscore fundamental unexplored differences between budget and nonbudget
shoppers. Moreover, they have key implications for both brick-and-mortar and online retailers,
as well as app developers.
Keywords: real-time spending feedback, grocery shopping behavior, smart shopping carts,
budget shoppers, nonbudget shoppers

3
“Smart carts” are shopping carts equipped with scanners that track the total price of a consumer’s
shopping basket as they shop. Consumer surveys indicate 72% of shoppers would welcome
radio-frequency identification tags on products to help them better track their in-store spending
(www.infosys.com), and 85% of leading retailers rate self-service customer-facing technologies–
–such as smart shopping carts––as one of the three top opportunities for increasing consumer
satisfaction and revenue (Rosenblum 2007). In addition to enabling shoppers to track their in-
store spending (Nelson 2008), smart shopping carts may help improve customer satisfaction by
offering customized and timely promotions, recommending complementary products, sharing
nutritional information and recipes, and even allowing customers to skip the check-out lane (e.g.,
Berberich 2007; Hui et al. 2013; Osborne 2012; Senne 2005). Their potential is further
corroborated by the fact that smart carts have drawn the attention and involvement of high-tech
companies such as IBM, Microsoft, and Fujitsu (e.g., Osborne 2012, Senne 2005).
Yet despite the widespread consumer, retailer, and manufacturer interest, smart carts
curiously lag far behind early industry expectations (Vibert-Kennedy 2003) because of
unresolved concerns. In addition to concerns about shoppers leaving the store with unscanned
groceries, union action to protect the employment of cashiers, and high implementation costs
(e.g., Berberich 2007; Senne 2005), retailers are fundamentally uncertain about how smart
shopping carts will influence shopping, spending, and satisfaction (RetailWire 2012). Even
though smart shopping carts offer a variety of opportunities to improve customer satisfaction,
interested retailers remain reluctant to adopt smart shopping carts without fully understanding
how real-time spending feedback—showing the total price of the items in the shopping basket
while shopping—will influence grocery shopping behavior and profitability.

4
Building on the in-store tracking behavior literature that bridges budgeting (Du and Kamakura
2008), spending (Mehta, Rajiv, and Srinivasan 2003), and in-store decision-making theories (Bell
and Lattin 1998), this research aims to increase the understanding of how real-time spending
feedback influences shopping behavior. Although there is limited research on real-time spending
feedback, one set of studies suggests that smart shopping carts may be especially beneficial for
budget-constrained shoppers (Van Ittersum, Pennings, and Wansink 2010). Therefore, this
research examines whether and how real-time spending feedback influences the shopping and
spending behavior of shoppers who have a budget and those who do not (hereinafter, referred to as
“budget shoppers” and “nonbudget shoppers,” respectively). Specifically, we examine three key
issues: (1) “How does real-time spending feedback influence spending?”, (2) “How do shoppers
adjust their shopping behavior to change their spending?, and (3) “Does real-time spending
feedback differentially influence budget and nonbudget shoppers?”.
This research contributes to a growing body of research on in-store decision making (Dhar,
Huber, and Khan 2007; Khan and Dhar 2006; Stilley, Inman, and Wakefield 2010a; 2010b) by
introducing novel and managerially relevant insights into the spending and shopping behavior of
consumers in response to real-time spending feedback. Real-time spending feedback uniquely
influences spending behavior differently for budget versus nonbudget shoppers. Specifically, we
find that budget shoppers increase the total amount of money they spend by purchasing a greater
number of national brands. In contrast, nonbudget shoppers reduce their spending by replacing
national brands with lower-priced store brands. So while budget shoppers purchase national
brands additively, nonbudget shoppers purchase store brands substitutively.
This research further contributes to budgeting literature that has implicitly assumed that
budget shoppers spend their entire budget to maximize their utility (Du and Kamakura 2008;

5
Thaler 1985). We show that budget shoppers actually underspend on their budget, building a
safety margin into their shopping trip to minimize the risk of overspending on their budget.
Finally, although theory suggests that real-time spending feedback allows budget shoppers to
maximize their utility, budget shoppers seem to interpret the spending room as a “windfall.” That
is, budget shoppers who receive real-time spending feedback spend it readily and more
frivolously by purchasing more hedonic products (Bodkin 1959; Levav and McGraw 2009).
We structure the remainder of this article as follows: To lay the foundation of this research, Study
1 demonstrates that budget shoppers underspend on their budget. Next, building on budgeting and
spending theories, we formulate integrative hypotheses about the effect of real-time spending feedback
on spending behavior for budget and nonbudget shoppers. To examine these hypotheses, we conduct
two field studies. Study 2, conducted in an experimental online grocery store, shows an asymmetric
response to real-time spending feedback for budget and nonbudget shoppers, and it provides empirical
evidence for the proposed underlying mechanism driving the asymmetric response. Study 3 shows the
robustness of these effects in a grocery store in Atlanta. Finally, we provide managerial implications
and discuss the theoretical contributions to the consumer budgeting and spending literature.
Budget Shopping
An estimated one in three U.S. households shops on a budget (Arends 2008; Van Ittersum,
Pennings, and Wansink 2010). A budget earmarks portions of income for specific uses (Bénabou
and Tirole 2004). For budgeting to be an effective self-control strategy, budgets have to
accurately project future spending and be consequential (Thaler 1999). Therefore, this work
focuses on explicit budgets, which are based on a shopper’s resources and projects spending,
rather than implicit budgets, which are based on previous expenditures in the category (Stilley,
Inman, Wakefield 2010a). Budgeting insufficient funds in an account causes people to

6
underconsume goods they desire. However, when too many funds are allocated, people tend to
overconsume the goods they desire less (Heath and Soll 1996). Neither over- nor underspending
is considered optimal (Thaler 1985). Instead, budget shoppers should seek to spend their entire
budget to maximize their utility (Hymans and Shapiro 1976). Therefore, we define budget
shoppers as consumers who shop with an explicit and consequential budget in mind (Bliss 1988).
In general, retailing research suggests that the negative consequences associated with over-
and underspending are asymmetric (Thaler 1980). That is, out-of-pocket costs (i.e.,
overspending) are viewed as losses, while opportunity costs (i.e., foregone products) are viewed
as foregone gains (Thaler 1980). Because losses are weighted more heavily than foregone gains
(Kahneman, Knetsch, and Thaler 1991), budget shoppers likely are more concerned about
overspending than underspending.
While it may be considered optimal to accurately spend a budget, budget shoppers may have a
difficult time accurately spending their entire budget as a result of (1) estimation biases and (2)
spending uncertainty. Van Ittersum, Pennings, and Wansink (2010) demonstrate that budget
shoppers exhibit significant estimation biases when attempting to track their in-store spending
using mental computation strategies. This bias is further magnified by in-store retailing efforts
aimed at increasing purchase quantities (Wansink, Kent, and Hoch 1998) or expanding the range
of categories purchased (Chandon and Wansink 2012). These estimation biases result in
opposing spending biases: those who underestimate their spending are likely to overspend on their
budget, while those who overestimate are likely to underspend.
In addition, when mentally tracking their in-store spending, budget shoppers experience
significant uncertainty about the total price of their shopping basket as they shop (Van Ittersum,
Pennings, and Wansink 2010). This spending uncertainty negatively influences spending. That is,

7
budget shoppers perceive their budget as a reference point (Stilley, Inman, and Wakefield 2010a),
they perceive a loss when they spend more than their budget (Tversky and Kahneman 1991), and
these losses are weighted more heavily than the opportunity costs associated with underspending
(Kahneman, Knetsch, and Thaler 1991; Thaler 1980). To minimize the risk of overspending and
experiencing these losses, budget shoppers who are uncertain about how much of their budget
they have already spent are inclined to spend significantly less than their budget (Pennings, Van
Ittersum, and Wansink 2005). In essence, budget shoppers build a safety margin into their
shopping trip to minimize the likelihood of spending more than their budget. This margin can be
viewed as a monetary measure of the implicit “cost” of bearing the risk to exceed their budget
(Arrow 1971; Pennings and Wansink 2004; Pratt 1964). It represents the amount of money that
budget shoppers are willing to not spend in order to be reasonably confident they will not exceed
their budget. Note that this safety margin is conceptually different from in-store slack (Stilley,
Inman, and Wakefield 2010a), which is defined as a portion of shoppers’ (implicit) mental budget
that they intend to spend but allocate while shopping (vs. planned purchases). To provide
empirical evidence for the foundational assumption about budget shoppers underspending on their
budget as a result of spending uncertainty, we conducted a lab experiment.
Study 1: Budget Shoppers’ Spending Behavior
Study 1 involved 66 university students who received partial course credit for participating. The
average age of the participants was 21 (18–28), and 44.0% were women.
Design and Procedure
Study 1 employed a computer-simulated shopping task. To control for the number and type of
products, participants were given a pretested shopping list with 16 product categories and asked
to make their shopping selections. For each decision (one product category at a time, in

8
shopping-list order), participants were presented with a choice set consisting of two options: one
store brand and one national brand. For each option in each choice set, a picture of the product,
the unit size, and the price were presented. After participants made a choice, the next choice set
appeared on the screen.
Study 1 was a between-subjects design with budget constraint (no budget constraint vs.
budget constraint) as an experimental factor. Participants in the budget-constraint condition were
asked to shop with a budget constraint of $60 (“Imagine that your budget for this shopping trip is
$60”). This budget amount was established based on the prices of the 16 product categories on
the shopping list. The total price of all store brands was $49.50, and the total price of all national
brands $70.50. The average of these two totals is $60, which we used as the budget.
To make the budget consequential and thus effective (Thaler 1999), budget shoppers were
informed that they would have to resolve several complex math problems if they breached their
$60 budget. Participants in the nonbudget condition were merely asked to shop for the items on
their list. Participants were randomly assigned to one of the two conditions.
Measures
The total price of each participant’s basket was recorded. After participants selected the final
product, they were asked to write down the total price of their shopping basket. To measure
spending uncertainty, participants’ confidence in the accuracy of the total price provided was
recorded (1 = “not confident,” and 9 = “very confident”).
Results and Discussion
Consistent with expectations, analysis of variance, with the total price of the shopping basket as the
dependent variable and budget constraint (no budget constraint vs. budget constraint) as an
independent variable, revealed a significant main effect. Budget shoppers spent less than their

9
nonbudget counterparts ($55.45 vs. $60.53; F(1, 64) = 29.16, p < .01). Moreover, budget shoppers
spent 7.6% less than their budget ($55.45 vs. $60; t(32) = 6.39, p < .01).
Controlling for estimation biases (actual spending – estimate spending) (Van Ittersum,
Pennings, and Wansink 2010), an ordinary least squares (OLS) regression confirms that budget
shoppers’ spending decreased with spending uncertainty (b = –.56, p < .01). In contrast, the
spending behavior of nonbudget shoppers was not influenced by spending uncertainty (b = .09, p
> .20). Bootstrapping analyses (Preacher and Hayes 2004) suggest that the effect of budget-
constrained shopping on spending is mediated by spending uncertainty. The indirect effect of
budget constraint on spending was significant (mean bootstrap estimate = –.71, SE = .40; 95%
confidence interval = –1.82/–.16).
These results suggest that neither underspending nor overspending were desirable. If
overspending were desirable, budget shoppers would have spent more. If underspending were
desirable—indicating that participants did not need the entire budget to meet their shopping needs—
nonbudget shoppers would not have spent more than budget shoppers. Moreover, budget shoppers’
underspending is significantly driven by their spending uncertainty.
The Effect of Real-Time Spending Feedback
One of the main premises of this research is that real-time spending feedback may help improve
consumer welfare of budget shoppers by reducing their spending uncertainty, thus enabling them
to spend more of their budget without the risk of exceeding their budget (Hymans and Shapiro
1976; Lynch and Ariely 2000). The resulting improvement in shopping experience as well as the
increase in spending will benefit the retailer. Thus, smart shopping carts may be a win-win
opportunity for budget shoppers and retailers. However, retailers are concerned that spending
feedback could reduce the spending of nonbudget shoppers. That is, while real-time spending

10
feedback may reduce spending uncertainty of budget shoppers, it also may increase the basket
price salience (i.e., the level of attention shoppers place on the total basket price during their
shopping trip) of nonbudget shoppers (see Wathieu, Muthukrishnan, and Bronnenberg 2004).
With an increased salience of the total basket price, the perceived importance and impact of the
basket price on subsequent spending decisions also increase s (Taylor and Thompson 1982;
Wakefield and Inman 2003; Wathieu, Muthukrishnan, and Bronnenberg 2004). We propose that
the reduction in uncertainty about the total basket price stimulates budget shoppers to spend
more, while the increased salience in basket price among nonbudget shoppers stimulates them to
spend relatively less than those without real-time spending feedback.
Spending
Because budget shoppers are inclined to track their in-store spending (Van Ittersum, Pennings,
and Wansink 2010), the salience of their total basket price will be high (Wathieu,
Muthukrishnan, and Bronnenberg 2004). Thus, the impact of real-time spending feedback on
basket price salience will remain limited. However, real-time spending feedback will reduce the
spending uncertainty that budget shoppers experience, allowing them to spend more without the
risk of breaching their budget. Presuming that underspending is not optimal (Heath and Soll
1996; Thaler 1985), we expect that providing budget shoppers with real-time spending feedback
will stimulate them to spend more of their budget on groceries and thus increase their spending.
Nonbudget shoppers, on the contrary, are less inclined to track their in-store spending.
Consequently, the salience of the total basket price will remain relatively low compared with
budget shoppers (Dickson and Sawyer 1990). We expect real-time spending feedback to increase
basket price salience. Increasing the salience of the price of an individual item makes the price more
important in the decision-making process (Van Ittersum et al. 2007; Wathieu, Muthukrishnan, and

11
Bronnenberg 2004), which in turn influences the purchase likelihood of the target item (Lalwani and
Monroe 2005). Similarly, increasing the salience of the total price of the shopping basket with
real-time spending feedback should increase the impact of the total basket price on subsequent
spending decisions (Bell and Lattin 1998). As a result, we hypothesize that real-time spending
feedback reduces spending among nonbudget shoppers.
H1: The effect of real-time spending feedback on spending differs between budget and
nonbudget shoppers. Real-time spending feedback (a) increases spending among budget
shoppers but (b) decreases spending among nonbudget shoppers.
Number of Products Purchased
While shopping behavior determines how much shoppers spend on a given shopping trip,
real-time spending feedback increases shoppers’ awareness of how much they are spending while
shopping. We expect this to influence their subsequent (in-store) shopping behavior. More
specifically, budget shoppers may increase their spending by using their “safety margin” to
purchase more products than budget shoppers who do not receive real-time spending feedback.
In contrast, nonbudget shoppers, hypothesized to reduce their spending in response to real-time
spending feedback, may forfeit products they would normally purchase.
H2: The effect of real-time spending feedback on the number of items purchased differs
between budget and nonbudget shoppers. In response to real-time spending feedback, (a)
budget shoppers purchase more items, and (b) nonbudget shoppers purchase fewer items.
Share of Store Versus National Brands
A different, well-documented strategy to change in-store spending is to replace national
brands—nationally marketed brands owned by a manufacturer—with lower-priced store brands—
brands owned by the retailer—and vice versa (Ailawadi et al. 2001; Bodkin 1959; Keller 2008).
We expect that differentiating between store and national brands will yield novel and relevant
insights (e.g., the retailer profit margin of store brands is higher [Ailawadi and Harlam 2004]).
12
Shoppers focus on quality and price when trading off between store and national brands
(Erdem, Zhao, and Valenzuela 2004). Because budget shoppers tend to be more price sensitive,
they are more inclined to purchase lower-priced store brands (Ailawadi, Gedenk, and Neslin 2003;
Burger and Schott 1972; Lichtenstein, Ridgway, and Netemeyer 1993; Quelch and Harding 1996).
Conversely, real-time spending feedback effectively increases budget shoppers’ spending room,
allowing them to spend more money on what are perceived as higher-quality products (Steenkamp,
Van Heerde, and Geyskens 2010). In turn, the additional spending room that budget shoppers
experience during their shopping trip could stimulate them to replace (some of the) store brands they
would normally purchase with national brands (Krishna et al. 2002).
Nonbudget shoppers, who are hypothesized to reduce their spending in response to receiving
real-time spending feedback, can also accomplish this by purchasing more lower-priced store
brands (Krishna et al. 2002). That is, we expect that nonbudget shoppers will replace (some of the)
national brands they would normally purchase with store brands.
H3: The effect of real-time spending feedback on the type of brands purchased differs between
budget and nonbudget shoppers. In response to real-time spending feedback, (a) budget
shoppers purchase relatively more national brands, and (b) nonbudget shoppers purchase
relatively more store brands.
We approach the question of whether shoppers will adjust their spending in response to real-
time feedback by changing the number of items (H2) or the type of brands they purchase (H3), or
some combination, as an empirical question.
Shopping Experience
Mentally tracking in-store spending can produce mental stress (Van Ittersum, Pennings, and
Wansink 2010). Stress is defined as “a state of imbalance within a person, elicited by an actual or
perceived disparity between environmental demands and the person’s capacity to cope with these

13
demands” (Maes, Vingerhoets and Heck 1987, p. 546). Real-time spending feedback eradicates
the need to mentally track. Therefore, we expect real-time spending feedback to improve the
shopping experience of budget shoppers by eliminating the stress associated with mentally
tracking in-store spending (Linden 1991). The shopping experience of budget shoppers who do
not receive real-time spending feedback will be relatively low (Swinyard 1993).
We hypothesize that real-time spending feedback stimulates nonbudget shoppers to reduce
their spending, particularly on national brands. We expect that feeling pressured to give up some
degree of quality to limit their spending will be experienced as a loss, triggering negative
emotions (Lynch and Ariely 2000). Therefore, real-time spending feedback should negatively
influence the shopping experience for these shoppers (Menon and Kahn 2002).
H4: The effect of real-time spending feedback on the shopping experience differs between
budget and nonbudget shoppers. Real-time spending feedback (a) improves the shopping
experience of budget shoppers but (b) reduces the quality of the shopping experience of
nonbudget shoppers.
Table 1 summarizes our hypotheses on how real-time spending feedback influences the
shopping and spending behavior of budget versus nonbudget shoppers. We examine these
hypotheses in a field experiment in an online grocery store (Study 2) and a field study in an
Atlanta grocery store (Study 3).
Study 2: Real-Time Spending Feedback in an Online Grocery Store
Study 2 involved 194 participants from a professional panel of adult American consumers who
are responsible for most of their household grocery purchases. The average age was 41.4 (18–
77), and 55.2% were women. The average household size was 2.7 (1–6).
Insert Table 1 about here

14
Design
The study design was a 2 2 between-subject design with budget constraint (no budget
constraint vs. a $35 budget constraint) and real-time spending feedback (unavailable vs.
available) as experimental factors. Participants were randomly assigned to one of the four
conditions and asked to shop using a pretested shopping list with 15 common product categories.
The budget of $35 was determined based on the prices of the product categories on the shopping
list. That is, if participants selected the least expensive option for each product category on their
shopping list, they would spend $24.65. If they selected the most expensive item for each
product category on their list, they would spend $51.85. Participants were allowed to not
purchase items that were on their list.
Participants were asked to shop for the products on the shopping list in an experimental
online grocery store, named Grocery Square. The store offers more than 3,000 stockkeeping
units (SKUs) (pictures, prices) in 18 categories, ranging from baby to pet food, and has the same
functionality as a regular online grocery store (except for the actual financial transaction at
checkout). For each product category (e.g., bagels) on the shopping list, participants could
choose from between five and fifteen product options (e.g., blueberry bagels, plain bagels) from
between two and eight different store and national brands (with between two and seven different
price levels). For each option, a picture of the product, the unit size, and the price was presented.
The store brand was a fictitious brand named “GS Value.” All participants were asked to
presume that the store brand resembled the store brand in the store where they conduct most of
their grocery shopping. The basket share of the store brand averaged 48.7%, which suggests that
participants considered it seriously.
We created two versions of the store. For participants who received real-time spending
feedback, the names of the products in their basket and their total price were continuously

15
present. Each time an item was added to the basket, the information was updated. For shoppers
who did not receive the real-time spending feedback, only the names of products in their
shopping basket were shown.
To incentive-align participants (Ding 2007; Ding, Rajdeep, and Liechty 2005), they were
informed that one in ten shoppers was eligible for a prize package worth $75. Nonbudget shoppers
were told that their prize package would consist of the items in their shopping basket and cash. If
the total price of the items in their basket was $40, they would receive those groceries and $75 –
$40 = $35 in cash. Budget shoppers received the same information; however, they were also
informed that if they spent more than their budget of $35, they would only receive the remaining
cash but not the groceries. For instance, budget shoppers who spent $40 on groceries, and thus
breach the budget, only receive $75 – $40 = $35 and no groceries. Accounting for budget
shoppers—with a covariate variable—who spent more than the $35 budget, and thus faced a
different incentive than those who stayed within budget, did not influence our results. We
measured how realistically participants took the decision-making process (“The choices I made
accurately reflect what I would do in my regular grocery store,” “The comparisons I made
between products and prices closely reflected how I make decisions in my regular store”; 1 =
“totally disagree,” and 5 = “totally agree”, α = .81). We found no differences among the four
conditions. On average, participants scored high (M = 4.2), suggesting that the incentive
alignment worked and that the participants took the shopping task realistically.
Procedure
At the beginning of the study, participants were informed that they would be asked to shop for
groceries in an online store and answer questions about their experience in order to help
researchers understand how consumers shop for groceries. Participants were informed that they

16
would shop in a mock online grocery store that offered both store and national brands of a wide
variety of products. Participants were asked to treat the store brand as they would in the store
where they usually shop for groceries. Next, participants were shown a one-minute video clip
detailing (1) how to create a personal account and enter the store, (2) how to shop for groceries
in the online store associated with the experimental condition they were in, and (3) how to
checkout and return to the online survey. Subsequently, participants received their shopping list
and were asked to enter the store and shop for the items on their list. Their shopping list gave the
product category (e.g., bagels) and the SKU (e.g., six-count). After they finished shopping, they
returned to the online survey and answered the remaining questions.
Measures
Each choice and the total price of their basket were recorded for all participants. After
participants selected the final product and checked out of the store, they were asked to write
down the total price of their shopping basket. To measure spending uncertainty, their confidence
in the accuracy of the total price provided was recorded (1 = “not confident,” and 9 = “very
confident”). In addition, measures were taken to assess basket price salience (“I tried very hard
to keep track of the total price of my shopping basket”; 1 = “totally disagree,” and 5 = “totally
agree”) and shopping experience (“I am satisfied with my shopping experience in the online
store”; “I enjoyed shopping in the online store”; “Overall, I am satisfied with the online grocery
store experience”; 1 = “totally disagree,” and 5 = “totally agree”). Next, participants responded
to several statements about relevant personality characteristics such as their general attitude
toward store brands, store price image, and for instance their quality consciousness (see Table 2
for measurement details).
Insert Table 2 about here
17
The results in Table 2 suggest that participants viewed the store brand favorably and believed
that the prices were reasonable. In addition, we find a positive correlation between shoppers’
general attitude toward store brands and the number of store brands in their final shopping basket
(r = .30, p < .001). Furthermore, quality consciousness is negatively correlated with the number
of store brands (r = –.33, p < .001), while price consciousness is positively correlated with the
number of store brands in their basket (r = .23, p < .001). This suggests that the results have face
validity. Finally, sociodemographic information (e.g., age, gender, income) was collected.
Results
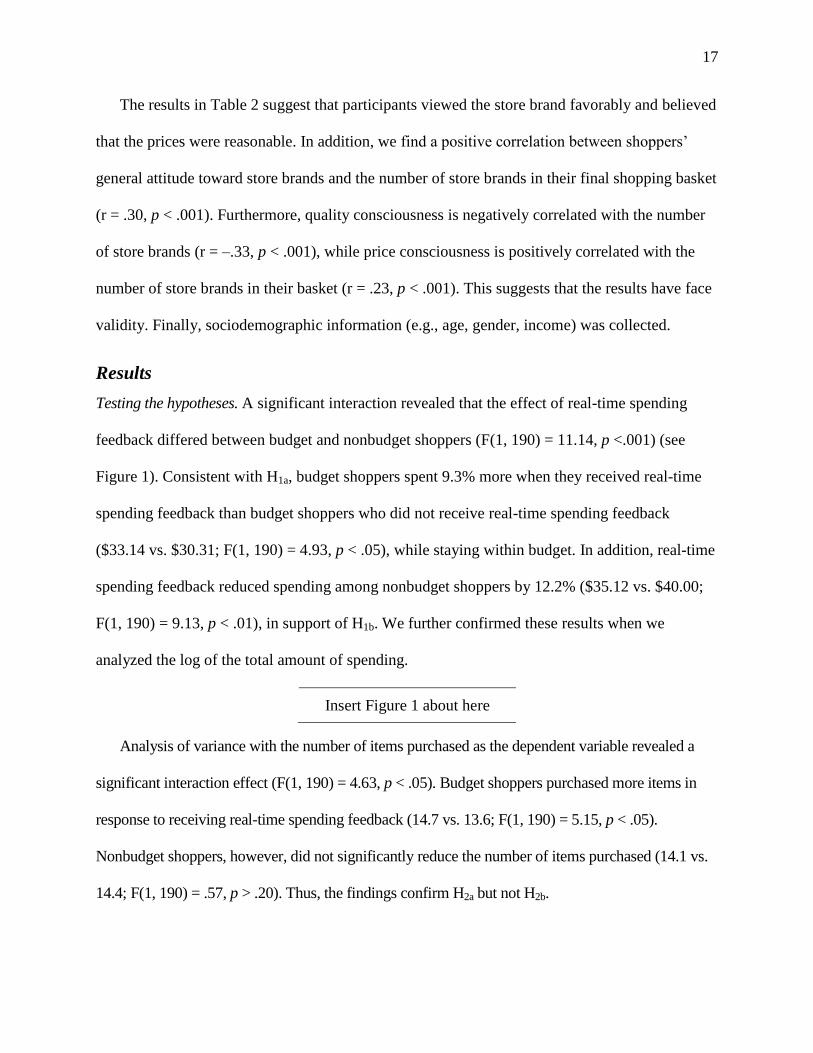
Testing the hypotheses. A significant interaction revealed that the effect of real-time spending
feedback differed between budget and nonbudget shoppers (F(1, 190) = 11.14, p <.001) (see
Figure 1). Consistent with H1a, budget shoppers spent 9.3% more when they received real-time
spending feedback than budget shoppers who did not receive real-time spending feedback
($33.14 vs. $30.31; F(1, 190) = 4.93, p < .05), while staying within budget. In addition, real-time
spending feedback reduced spending among nonbudget shoppers by 12.2% ($35.12 vs. $40.00;
F(1, 190) = 9.13, p < .01), in support of H1b. We further confirmed these results when we
analyzed the log of the total amount of spending.
Analysis of variance with the number of items purchased as the dependent variable revealed a
significant interaction effect (F(1, 190) = 4.63, p < .05). Budget shoppers purchased more items in
response to receiving real-time spending feedback (14.7 vs. 13.6; F(1, 190) = 5.15, p < .05).
Nonbudget shoppers, however, did not significantly reduce the number of items purchased (14.1 vs.
14.4; F(1, 190) = .57, p > .20). Thus, the findings confirm H2a but not H2b.
Insert Figure 1 about here

18
A significant interaction effect suggests that the share of store brands varied across
conditions (F(1, 190) = 13.59, p < .001) (see Figure 1). While the share of store brands reduced
from 62.6% to 49.6% (F(1, 190) = 4.84, p < .05) in response to the real-time spending feedback
among budget shoppers, the share of store brands increased from 33.0% to 50.5% (F(1, 190) =
9.15, p < .01) among nonbudget shoppers. Real-time spending feedback stimulated nonbudget
shoppers to increase the number of store brands in their baskets (4.7 vs. 7.3; F(1, 190) = 9.27, p <
.01) and reduce the number of national brands (9.7 vs. 6.7; F(1, 190) = 13.57, p < .001). The
change in store-brand share among budget shoppers is due to purchasing more (nationally
branded) products and not by replacement purchases. While real-time spending feedback did not
change the number of store brands in the baskets of budget shoppers (8.8 vs. 7.4; F(1, 190) =
2.50, p > .10), it increased the number of national brands (4.8 vs. 7.3; F(1, 190) = 9.23, p < .01).
These findings confirm H3a and H3b.
Finally, real-time spending feedback uniquely influenced the shopping experience of budget
versus nonbudget shoppers (F(1, 190) = 14.63, p < .001). While real-time spending feedback
improved the shopping experience of budget shoppers (3.6 vs. 4.3; F(1, 190) = 13.96, p < .001),
it had a marginally significant, negative effect on the quality of the shopping experience of
nonbudget shoppers (4.3 vs. 4.0; F(1, 190) = 2.73, p = .10). Thus, the findings confirm H4a and
H4b. Furthermore, real-time spending feedback influenced shoppers’ intention to return to the
store (F(1, 190) = 5.08, p < .05). Specifically, real-time spending feedback increased budget
shoppers’ repatronage intentions (3.4 vs. 3.9; F(1, 190) = 6.00, p < .05). For nonbudget
shoppers, there was no significant effect (3.3 vs. 3.2; F(1, 190) = .52, p > .20).
Exploring the mechanism behind the results. Consistent with expectations, real-time spending
feedback reduced spending uncertainty, but more so among budget shoppers (F(1, 190) = 10.6, p

19
< .001). Furthermore, a significant interaction effect (F(1, 190) = 8.09, p < .01) shows that real-
time spending feedback increased the basket price salience among nonbudget shoppers (F(1,
190) = 21.4, p < .001) but had little impact on the basket price salience of budget shoppers (F(1,
190) = .30, p > .20) (see Figure 2).
The results of OLS regressions in Table 3 suggest that real-time spending feedback
eliminates the negative effect of spending uncertainty on spending among budget shoppers.
Bootstrapping analyses (Preacher and Hayes 2004) confirm that the effect of real-time spending
feedback on budget shoppers’ spending is mediated by spending uncertainty. The indirect effect
of real-time spending feedback was significant (mean bootstrap estimate = 3.91, SE = 1.03; 95%
confidence interval = 2.22/6.36). For nonbudget shoppers, the indirect effect of real-time
spending feedback was insignificant (mean bootstrap estimate = –.20, SE = .87; 95% confidence
interval = –2.28/1.37). Instead, as we expected, the effect of real-time spending feedback on
nonbudget shoppers’ spending is mediated by basket price salience. The indirect effect of real-
time spending feedback was significant (mean bootstrap estimate = –2.74, SE = 1.11; 95%
confidence interval = –5.30/–.85). Basket price salience does not mediate the impact of real-time
spending feedback on budget shoppers’ spending (mean bootstrap estimate = –.28, SE = .53;
95% confidence interval = –1.50/.64).
Discussion
The results of Study 2 show that real-time spending feedback influences shoppers differently
depending on whether they are constrained with a budget. Real-time spending feedback reduces
spending uncertainty, which stimulates budget shoppers to spend more money without breaching
Insert Figure 2 about here
Insert Table 3 about here

20
their budget. In contrast, real-time spending feedback reduces spending among nonbudget
shoppers, an effect that is attributed to real-time spending feedback increasing the basket price
salience (Bell and Lattin 1998; Wathieu, Muthukrishnan, and Bronnenberg 2004).
The results further show an asymmetric response in how budget and nonbudget shoppers
change their spending in response to receiving real-time spending feedback. Nonbudget shoppers
lower their spending by replacing national brands with lower-priced store brands. Budget
shoppers, in contrast, increase their spending by purchasing more national brands. This
asymmetric response is consistent with a straightforward utility maximization explanation for both
shoppers. Budget shoppers try to maximize their utility given their “extra” spending room by
purchasing more national brands. Purchasing more national brands yields more utility than
spending the extra money on replacing store brands with national brands. Nonbudget shoppers
minimize the loss of utility associated with the reduction in spending by replacing national brands
with store brands. Replacing national brands with store brands represents a smaller loss in utility
associated with the reduction in spending than reducing their spending by forfeiting certain
grocery items (Steenkamp, Van Heerde, and Geyskens 2010). From a utility maximization point
of view, these results seem consistent and provide a rationale for the lack of support for H2b.
Finally, real-time spending feedback improves the shopping experience of budget shoppers
and increases their intention to return to the store. Although the quality of the shopping
experience of nonbudget shoppers declined, their intention to revisit the store was unaffected.
To test the robustness of the findings, we conducted a field study in a brick-and-mortar
grocery store involving real shoppers during an actual shopping trip for ten or more items. In
addition taking our research to a real grocery store, with real shoppers making real decisions, we
decided not to use a shopping list in this research. As long as shoppers intended to shop for ten or

21
more items, they could participate. A second differentiator was that we did not manipulate the
budget constraint. Instead, we asked participants if they were shopping on a budget.
Furthermore, we wanted to explore whether and how real-time spending feedback influences the
purchase of hedonic items. The purchase of many grocery items is predominantly motivated by
functional aspects (Hirschman and Holbrook 1982). Products such as milk and meat are
utilitarian goods (Batra and Ahtola 1990; Dhar and Wertenbroch 2000; Voss, Spangenberg, and
Grohmann 2003). However, supermarkets also sell a wide array of hedonic goods—such as ice
cream and chocolate—that provide experiential pleasure and excitement (Gill 2008). Given the
basic nature of utilitarian versus hedonic goods, shoppers generally first try to satisfy their
utilitarian needs before indulging in hedonic products (Hirschman and Holbrook 1982). Hedonic
products also generally require more justification than utilitarian products (Khan and Dhar
2010). This raises an unanswered question of whether budget shoppers will use the extra
spending room to purchase more hedonic products. Moreover, will nonbudget shoppers feel
more inclined to give up hedonic products to save some money?
Study 3: Field Study in an Atlanta Grocery Store
Study 3 involved 198 adult shoppers who were intercepted at the beginning of their shopping trip
in a grocery store located in Atlanta. The average age was 52.0 (20–91), and 62.4% were
women. The average household size was 2.3 (1–7).
Design and Procedure
Study 3 involved a 2 × 2 between-subjects design with budget constraint (no budget constraint vs.
budget constraint) and real-time spending feedback (unavailable vs. available) as experimental
factors. Upon entering the store, shoppers were approached by a trained interviewer and asked

22
how many items they intended to purchase during this shopping trip. Shoppers who were shopping
for ten items or more (Van Ittersum et al. 2010) were invited to be a part of the study.
Before the interviewer provided them with additional study details, they first asked
participants whether there was a maximum amount of money they intended to spend on that
shopping trip (i.e., budget) and, if so, how much they intended to spend (Stilley, Inman, and
Wakefield 2010a). After they received additional instructions (discussed next), all participants
were asked to continue on their regular shopping trip, go through the checkout, and then return to
the interviewer to answer some questions.
To observe the solitary influence of real-time spending feedback, half of the participants
were randomly asked to shop using an iPad with a shopping tracker that allowed them to
accurately track their in-store spending. The iPad was attached to the shopping cart using a
specially designed mounting arm. The tracker allowed participants to enter the price of each item
purchased and calculate the total price with an “enter” button, like a cash register. The other half
of the participants shopped without the iPad.
Participants received $10 for participating and were offered a 10% chance of winning a prize
package worth $150 (incentive-aligned study). Nonbudget shoppers who purchased $100 of
groceries had a 10% chance of receiving those groceries for free along with an additional $50 in
cash. Shoppers who spent more than $150 would receive $150 in groceries and no cash. For
budget shoppers—consumers shopping with an explicit and consequential budget in mind (Bliss
1988)—we added the constraint that they needed to spend within their self-reported budget (to
make the budget constraint consequential). If they stayed within their budget, they had a 10%
chance of receiving $150 in groceries and cash (just like the nonbudget shoppers). However, if
they spent more than their budget, they would only be able to receive ($150 – total price of

23
basket) in cash. Making the participants’ subject to consequences if they exceeded their budget is
consistent with theory that states that for budgeting to be an effective self-control strategy,
budgets must be consequential (Thaler 1999). Because the degree to which a budget is
consequential is difficult to self-assess, we decided to make it relatively consequential for all
budget shoppers, which may have affected the reported effect sizes for real-time spending
feedback among shoppers who came to the store with relatively inconsequential budgets.
Measures
After participants finished their shopping trip and paid for their groceries, their final receipt was
copied to determine the actual total price of their basket as well as the number and type (utilitarian
vs. hedonic) of products and brands (store vs. national brands) purchased. Two independent coders
who were unaware of the research objectives classified the products, resolving any discrepancies
through discussion. The agreement between the coders was high (Cohen’s κ > .85, p < .01).
We eliminated eight of the self-proclaimed budget shoppers from the sample because they
spent over five times more than their self-reported budget while still claiming to be motivated to
stay within budget. For those in the real-time spending feedback condition, the total dollar
amount reflected on the iPad was collected to determine whether participants actually and
accurately used it to track their spending. With the exception of nine participants, everyone
correctly and accurately used the iPad. On average, the difference in total spending according to
the tracker and their final receipt was $.19 (t(86) = .37, p > .20).
Following this, demographic information related to gender, age, household size, and income
was collected. Except for income, none of these variables differed among the four conditions.
Budget shoppers reported earning significantly less per month than their nonbudget counterparts
($2,231 vs. $4,141; F(1, 142) = 18.69, p < .001). Furthermore, we measured the motivation of

24
budget shoppers’ to stay within budget (1 = “not motivated,” and 5 = “very motivated”) as well
as how confident they were that they spent less than their budget (1 = “not confident,” and 5 =
“very confident”). Budget shoppers’ motivation to stay within budget was high (M = 4.4).
Receiving real-time spending feedback did not influence their motivation (4.3 vs. 4.5; F(1, 84) =
.32, p > .20). Budget shoppers who received real-time spending feedback reported significantly
higher confidence in not having breached their budget than those who did not receive real-time
spending feedback (4.2 vs. 2.9; F(1, 84) = 18.53, p < .001). Finally, measures were taken to
assess shopping trip experience (“I am satisfied with the shopping trip”; 1 = “totally disagree,”
and 5 = “totally agree”) and repatronage intention (“If the store would offer it, I would return and
use technology to track my spending”; 1 = “totally disagree,” and 5 = “totally agree”).
Results
Consistent with the previous study, a significant interaction revealed that the effect of real-time
spending feedback differed between budget and nonbudget shoppers (F(1, 177) = 7.96, p < .01)
(see Figure 3). Consistent with H1a, budget shoppers spent 34.7% more when they received real-
time spending feedback than budget shoppers who did not receive real-time spending feedback
($42.04 vs. $31.21; F(1, 177) = 4.52, p < .05), while staying within their budget of $44.23.
Testing H1a based on the share of budget spent revealed a similar finding. Budget shoppers who
received real-time spending feedback spent a significantly higher share of their budget than those
who did not receive real-time spending feedback (94.6% vs. 79.2%; F(1, 84) = 17.01, p < .001).
Real-time spending feedback reduced spending among nonbudget shoppers by 24.9% ($54.75 vs.
$41.09; F(1, 177) = 5.21, p < .05), confirming H1b. We further confirmed these results when we
analyzed the log of the total amount of spending.
Insert Figure 3 about here

25
Analysis of variance with the number of items purchased as the dependent variable revealed a
significant interaction effect (F(1, 177) = 4.54, p < .05). Consistent with Study 2, budget shoppers
purchased more items when they received real-time spending feedback (21.2 vs. 17.6; F(1, 177) =
4.40, p < .05). Nonbudget shoppers, on the contrary, did not significantly reduce the number of items
purchased (22.8 vs. 20.2; F(1, 177) = 1.67, p > .20). These findings confirm H2a but not H2b.
Furthermore, the effect of real-time spending feedback on the share of hedonic products purchased is
also dependent on a shopper’s budget situation (F(1, 177) = 4.88, p < .05). Budget shoppers increased
the share of hedonic products in response to real-time spending feedback (26.8% vs. 20.6%; F(1, 177)
= 4.49, p < .05 ). Nonbudget shoppers did not significantly reduce the share of hedonic products when
they received real-time spending feedback (19.0% vs. 21.7%; F(1, 177) = .96, p > .20).
The share of the store brands in this study is almost 14%. A significant interaction effect
suggests that the share of store brands varied across conditions (F(1, 177) = 22.12, p < .001) (see
Figure 3). While budget shoppers reduced the share of store brands from 20.1% to 11.1% ( F(1,
177) = 8.62, p < .01) when they received real-time spending feedback, nonbudget shoppers
actually increased the share of store brands from 7.1% to 17.9% (F(1, 177) = 13.96, p < .001).
Real-time spending feedback did not change the number of store brands in the baskets of budget
shoppers (2.7 vs. 3.2; F(1, 177) = .52, p > .20); instead, it increased the number of national
brands (18.5 vs. 14.4; F(1, 177) = 5.34, p < .05). This suggests that the change in store-brand
share among budget shoppers is due to purchasing additional nationally branded products and
not replacing store-branded products. Real-time spending feedback stimulated nonbudget
shoppers to increase the number of store brands (1.9 vs. 3.5; F(1, 177) = 5.31, p < .05) and
reduce the number of national brands (20.9 vs. 16.7; F(1, 177) = 6.14, p < .05). Thus, the
findings confirm H3a and H3b.

26
Finally, real-time spending feedback uniquely influenced the shopping experience of budget
versus nonbudget shoppers (F(1, 177) = 4.04, p < .05). Real-time spending feedback improved the
shopping experience of budget shoppers (3.7 vs. 4.3; F(1, 177) = 4.89, p < .05), confirming H4a.
However, it had no significant effect on the quality of the shopping experience of nonbudget
shoppers (3.9 vs. 3.7; F(1, 177) = .35, p > .20). Thus, we cannot confirm H4b. Furthermore, real-
time spending feedback influenced shoppers’ repatronage intention (F(1, 164) = 3.43, p < .10).
Real-time spending feedback increased budget shoppers’ repatronage intentions (3.5 vs. 4.5; F(1,
164) = 10.33, p < .001) but had no influence on nonbudget shoppers’ repatronage intention (3.2
vs. 3.3; F(1, 164) = .23, p > .20).
Mediation analysis (Preacher and Hayes 2004) confirmed that real-time spending feedback
improved the shopping experience of budget shoppers through a reduction in stress induced by
mental tracking, operationalized using a proxy (“I had a difficult time keeping track of the total
price of my basket”; 1 = “totally disagree,” and 5 = “totally agree”) (mean bootstrap estimate =
.69, SE = .20; 95% confidence interval = .37/1.13). Moreover, shopping experience mediates the
effect of the change in stress on budget shoppers’ repatronage intention (mean bootstrap estimate
= –.22, SE = .06; 95% confidence interval = –.36/–.11). The shopping experience of budget
shoppers improved as a result of the real-time spending feedback by reducing the stress
associated with mentally keeping track of their spending. In turn, the improved shopping
experience increased their repatronage intention.
The effect of real-time spending feedback on the shopping experience of nonbudget shoppers
is not significantly mediated by a reduction in stress. Instead, it is significantly mediated by the
increase in the share of store brands (mean bootstrap estimate = –.22, SE = .15; 90% confidence
interval = –.50/–.02). The quality of the shopping experience of nonbudget shoppers declined

27
with real-time spending feedback because of the need to reduce spending by giving up high-
quality national brands they normally purchase and replacing them with store brands. Note,
however, that the shift in the shopping experience is directional, albeit insignificant.
Furthermore, while the shopping experience correlates positively with nonbudget shoppers’
repatronage intention, it does not significantly mediate the relationship between the increase in
the share of store brands and repatronage intention.
Discussion
Study 3 examined the robustness of our hypotheses in a brick-and-mortar grocery store involving
real shoppers making real decisions during an actual shopping trip for ten or more items. The
results are largely consistent with our hypotheses and the findings from Study 2. One exception
is the effect of real-time spending feedback on the shopping experience of nonbudget shoppers.
The marginally significant, negative effect found in Study 2 became insignificant in Study 3.
While Study 2 was conducted in a new online grocery store with “new” customers, Study 3 was
conducted in an existing store with existing customers. Shoppers’ past experiences in the brick-
and-mortar store of Study 3 may have mitigated the negative effect of the real-time shopping on
the shopping experience. Modality variations such as this have appeared elsewhere, generally
being slightly weakened in field studies compared with lab studies. These results are consistent
with that tendency.
Note that the participants who tracked their in-store spending did so by entering the prices of the
items into a shopping calculator (as opposed to receiving the real-time spending feedback
automatically through scanning). The market penetration of smart shopping carts and handheld
scanners is still small and geographically concentrated. Grocery stores in the southeastern United
States generally do not offer them, so we used iPads instead. This may have increased the salience

28
of the prices and consequently some of the effect sizes. Nonetheless, the directionalities of all the
effects reported in Study 3 are nearly identical to those found in Study 2––during which participants
received real-time spending feedback automatically. In this way, the results of Study 3 add external
validity to the effects of real-time spending feedback for both budget and nonbudget shoppers.
Study 3 also yielded some novel insights into the effect of real-time spending feedback on the
purchase of hedonic products. We elaborate on these findings in the “General Discussion” section.
General Discussion
The results of one lab experiment, a field study in an experimental online grocery store, and a field
study in a brick-and-mortar grocery store converge on how real-time spending feedback influences
the spending behavior of budget and nonbudget shoppers (see Table 4). Budget shoppers who
receive real-time spending feedback increase their spending, without breaching their budget. They
increase their spending by purchasing more (hedonic) products, as well as increasing the number
of nationally branded products. This suggests that budget shoppers may believe that purchasing
more nationally branded (hedonic) products yields more utility than spending the extra money on
replacing store brands with national brands. Furthermore, real-time spending feedback improves
the shopping experience of budget shoppers by reducing the mental stress associated with keeping
track of total spending while shopping. It also increases their intention to return to the store to use
the technology and receive real-time spending feedback while shopping.
Nonbudget shoppers reduce their spending in response to real-time spending feedback. They
accomplish this in part by replacing more expensive national brands with lower-priced store
brands. The results suggest that nonbudget shoppers prefer to purchase store brands rather than
forfeit the products they normally purchase. Replacing national brands with store brands may
Insert Table 4 about here

29
represent a smaller loss in utility associated with the reduction in spending than reducing their
spending by forfeiting certain grocery items (Steenkamp, Van Heerde, and Geyskens 2010).
From a utility maximization point of view, these results seem consistent and provide a rationale
for the lack of support for H2b. Notably, although the reported quality of the shopping experience
declined in response to the real-time spending feedback, it did not have a significant effect on
nonbudget shoppers’ intentions to return to the store.
Contributions to Marketing Theory
This research contributes to a growing body of research on in-store decision making (Dhar,
Huber, and Khan 2007; Khan and Dhar 2006; Stilley, Inman, and Wakefield 2010a; 2010b) by
introducing novel and managerially relevant insights into the spending and shopping behavior of
consumers in response to real-time spending feedback. This research fills a knowledge gap at the
interface of consumer budgeting, spending, and in-store decision-making theories. It bridges
these theories by contributing to theory development on in-store tracking behavior. Furthermore,
it contributes to existing budgeting, spending, and in-store decision-making theories.
In-store tracking behavior. This research expands existing theory on in-store tracking
behavior, a critical research domain in the context of budgeting, spending, and in-store decision-
making theories that has received little attention to date. Van Ittersum et al. (2010) demonstrate
that many shoppers keep track of their spending while shopping for groceries and that the
majority track because of budget constraints. While some shoppers use calculators and shopping
lists, the most dominant tracking strategy involves mental computation. Shoppers who are
motivated to be accurate—often those with the most stringent budgets—end up being less
accurate than less motivated shoppers (because they tend to calculate instead of estimate the total
basket price). Furthermore, shoppers who underestimate the total price of their basket are more

30
likely to overspend. Building on Pennings et al. (2005), the current research shows that budget
shoppers cope with the spending uncertainty in part by building a safety margin into their
shopping trip—that is, they spend less than their budget to prevent breaching their budget.
Across the studies we reported here, budget shoppers who did not receive real-time spending
feedback spent only 86% of their budget. Real-time spending feedback alleviates spending
uncertainty, stimulating budget shoppers to spend almost 95% of their budget, which is 10% more
than budget shoppers shopping without receiving real-time spending feedback. In contrast, real-time
spending feedback reduces nonbudget shoppers’ spending, an effect attributed to the increased
salience of their total basket price. Finally, this research demonstrates the consequences of real-time
spending feedback on in-store decision making. Real-time spending feedback stimulates budget
shoppers to increase their spending by purchasing more nationally branded products. For nonbudget
shoppers, instead of reducing the number of products purchased, they replace national brands with
store brands. This theoretical understanding on in-store tracking behavior has important
ramifications for existing budgeting, spending, and in-store decision-making theories.
Budgeting and spending. The budgeting (Du and Kamakura 2008; Larson and Hamilton
2012) and spending (e.g., Mehta, Rajiv, and Srinivasan2003; Stilley, Inman, and Wakefield
2010a, 2010b) literature examines how and why people budget, as well as how these budgets
influence their spending behavior. The budgeting literature implicitly assumes that shoppers with
budgets are knowledgeable about the total price of their shopping baskets as they shop (Bénabou
and Tirole 2004; Ulkümen, Thomas, and Morwitz 2008). Van Ittersum, Pennings, and Wansink
(2010) demonstrate that this assumption is problematic. That is, while budgets stimulate budget
shoppers to track their in-store spending, the task complexity and spending uncertainty causes
estimation biases that directly influence their spending.

31
The budgeting literature also assumes that for budget shoppers to maximize their utility, they
need to spend their entire budget (Thaler 1985). However, we demonstrate that budget shoppers,
faced with spending uncertainty, actually spend systematically less than their budget. Providing
budget shoppers real-time spending feedback reduces this spending uncertainty, stimulating them
to spend more of their budget, which is consistent with maximizing consumer utility (Hymans
and Shapiro 1976; Lynch and Ariely 2000). These results warrant caution for the use of observed
spending behavior to infer people’s budgeting behavior (e.g., Du and Kamakura 2008). Modeling
variations in the share of people’s budget being spent may improve our understanding of how
consumers allocate and spend their discretionary income.
In-store decision making. Real-time spending feedback stimulates budget shoppers to spend
more of their budget. Existing theories suggest that real-time spending feedback allows budget
shoppers to increase their utility, given their budget constraints (Lynch and Ariely 2000) and
given knowledge of existing inventory levels in their home (Chandon and Wansink 2006).
Notably, the results on the effect of real-time spending feedback on the purchase of hedonic
items in Study 3 suggest that the reduction in spending uncertainty creates spending room that
budget shoppers seem to interpret as a “windfall,” or an unexpected monetary gain. Note that
because the money was designated to be spent on groceries, we do not claim that this money
represents an actual financial gain. We merely suggest that budget shoppers experience the
“extra” spending room as an unexpected gain (Levav and McGraw 2009). As a result, budget
shoppers who receive real-time spending feedback spend it readily and more frivolously by
purchasing more hedonic products (Bodkin 1959; Levav and McGraw 2009). The windfall effect
seems to help them justify the purchase of these hedonic products, which generally require more
justification than utilitarian products (Khan and Dhar 2010; Okada 2005).

32
This raises the potentially important question whether real-time spending feedback actually
helps consumers or simply stimulates them to spend money that they typically would not. For
example, one might argue that the purchase of hedonic products represents an important part of
maximizing ones utility; budget shoppers take the opportunity to purchase these products when
they realize they can afford it. The finding that nonbudget shoppers seem reluctant to give up
hedonic products when they realize how much they are spending attests to the potential utility
associated with hedonic products. Alternatively, the purchase of hedonic products may be driven
simply by the novelty of the real-time spending feedback experience in our studies. That is, budget
shoppers with more extensive real-time spending feedback experience may not experience the
“extra” spending room as an unexpected gain (Levav and McGraw 2009) and, consequently, may
spend the money on additional utilitarian products to maximize their utility. Examining the long-
term effects of real-time spending feedback could provide further understanding.
We find that real-time spending feedback stimulates budget shoppers to buy national brands
additively (not at the expense of store brands), whereas nonbudget shoppers buy store brands
substitutively. Existing research suggests that consumer response to price promotions of branded
products is brand-specific (Blattberg and Wisniewski 1989). More specifically, when higher-
priced national brands are on sale, they will draw sales from lower-priced brands, but not vice
versa (Sethuraman 1996). Consistent with this, we find that budget shoppers, who tend to favor
store brands, are interested in purchasing more higher-priced national brands when they receive
real-time spending feedback. However, when nonbudget shoppers, who tend to favor national
brands, feel inclined to reduce their spending, they are more inclined to switch to store brands
than to forfeit certain grocery items.

33
Contributions to Marketing Practice
Despite the growing interest in and availability of smart shopping carts, their adoption by
retailers is lagging behind early industry expectations. This may be driven partly by concerns
about whether and how real-time spending feedback influences retail performance. The current
research improves our understanding of this question by examining the influence of real-time
spending feedback on grocery shopping behavior and, ultimately, retail performance. Our
findings should be useful to retailers that are deciding whether to invest in smart shopping carts.
Consider the following examples:
1. Real-time spending feedback increases budget shoppers’ spending: retailers with store locations
in lower-income areas may benefit from offering smart shopping carts at these locations.
2. Real-time spending feedback increases budget shoppers’ spending but reduces that of
nonbudget shoppers: retailers could assess the share of budget versus nonbudget shoppers
at a particular store location and decide whether to offer in-store tracking technology.
3. Real-time spending feedback may offer a competitive advantage for retailers: smart
shopping carts increase repatronage intentions for budget shoppers, but does not decrease
it for nonbudget shoppers. Thus, smart shopping carts may offer an attractive opportunity
to draw new customers—budget shoppers—to a store without running the risk of losing
nonbudget shoppers.
4. Real-time spending feedback reduces nonbudget shoppers’ spending but stimulates them
to replace lower-margin national brands with higher-margin store brands: retailers with a
successful store brand may still find it profitable to offer smart shopping carts.
5. Real-time spending feedback is only one component in smart shopping carts: promotions,
advertisements, loyalty program integration, and other tools offer a multitude of advantages to
retailers. Furthermore, some of these tools may help retailers mitigate potential financial losses
among nonbudget shoppers in response to receiving real-time spending feedback.

34
It will be important for retailers to be able to differentiate between budget and nonbudget
shoppers. One proposed strategy is to use geographic income data to decide whether to offer
smart shopping carts in a particular store. Alternatively, stores with loyalty cards can look for
shoppers who have highly consistent periodic spending, which would suggest that they are
generally conforming to a given spending amount. While targeting only specific customers with
smart carts may be a bit more challenging, the smaller size of handheld scanners may offer more
flexibility. For example, Stop & Shop allows customers to decide whether to use handheld
scanners. Customers who opt to use these simply scan their store card and retrieve one. Using
historic customer data from the store card, the retailer can then target customers who are most
likely to shop with a budget. Alternatively, retailers may allow shoppers to decide for themselves
whether they want to see their total spending while shopping.
The implications of these findings are relevant not only for smart-cart grocers but for any
retailing context in which spending totals can be updated in real time. There are a variety of ways
the total amount of money being spent on a basket of goods (e.g., Amazon.com) can be
displayed. First, cumulative spending totals can either be consistently visible to the shoppers
throughout the shopping trip or only visible when they check out. For budget shoppers, real-time
spending feedback might encourage them to spend more than they would otherwise, which may
increase their satisfaction with the site and ultimately with the retailer (Gómez, McLaughlin, and
Wittink 2004). For nonbudget shoppers, real-time spending feedback likely reduces their
satisfaction and decreases how much they spend. A key question for a retailer to consider is what
type of consumers most regularly visits their site. A retailer catering more to budget shoppers
may elect to present real-time spending feedback consistently throughout the shopping trip,
although this would benefit from confirmatory research.

35
Another question of interest would be exactly what price should be displayed. It is common
for e-retailers to show only the total amount of the items purchased until checkout time, at which
point sales tax and shipping costs are added to the total. With registered users (for whom shipping
costs and sales taxes are known), one option could be to offer an estimated running total cost that
includes shipping, handling, and taxes. This may increase the amount that budget shoppers spend.
Similar issues should be considered by developers of mobile applications on smart phones or
tablets that focus on providing users with updated information about their spending. Features
such as running total versus end-of-shopping total or basket cost versus total cost could be useful
differentiating features.
Limitations and Further Research
The converging results across different contexts lend important credibility to the findings. They support
the theoretical foundation that explains the disparate results for budget versus nonbudget shoppers. To
some degree, this lessens any concerns one might have had with any one study alone. What is yet to be
investigated is whether the initial attention given to real-time shopping feedback would diminish with
time (Van Houwelingen and Van Raaij 1989). That is, the first few times people are faced with such
feedback, they might be more responsive to it than they would be after multiple trips.
The results suggest that the reduction in mental stress associated with mentally tracking total
spending improves the shopping experience of budget shoppers. We also find a negative relationship
between the share of store brands and the shopping experience of nonbudget shoppers, an effect we
attribute to feeling forced to forfeit the national brands to which they have become accustomed.
Notably, the relationship among real-time spending feedback, shopping experience, and shoppers’
intention to return to store yields a somewhat surprising finding: Consistent with what might be
expected, for budget shoppers, an improvement in shopping experience leads to an increased

36
repatronage intention. However, a decline in the quality of nonbudget shoppers’ shopping experience
does not significantly decrease their intention to return to the store and use the tracking technology.
This suggests that the factors that influence nonbudget shoppers to return to the store are driven less
by the shopping experience. Alternatively, nonbudget shoppers may acknowledge the benefits of
real-time spending feedback (i.e., to help control their spending), even if this is not something they
strongly prefer. These findings warrant additional attention in further research.
Real-time spending feedback generates novel dynamics for modelers. The brand-switching
inversion that occurs for budget versus nonbudget shoppers offers an intriguing complexity to
existing models of shopping behavior. The practical implication of this would be to determine how
these elasticities vary across categories. The coarse distinction between hedonic and nonhedonic
products provides a good foundation for this.
From a practical standpoint, it must be acknowledged that the total impact of real-time spending
feedback on retail performance is the outcome of a complex interplay between how much money budget
and nonbudget shoppers spend on higher-margin store brands versus lower-margin national brands.
Therefore, analytical models can be developed to help retailers optimize their decision about whether to
invest in smart shopping cart technology and how long it would take to recoup the investment.
Real-time spending feedback is only one aspect of how smart shopping carts may evolve to
influence consumers during a shopping trip. For example, smart shopping carts may offer customized
advertisements and promotions throughout the shopping trip or based on the time of day (Tal and
Wansink 2013). The content and timing of these could be made dependent on the shopper-specific
characteristics, loyalty card data, and even items already placed in the shopping basket (Hui et al.
2013). Product recommendations and customized shopping lists could become an integral part of the
shopping experience. The dynamic nature of offering customized information during the shopping

37
trip offers opportunities that may yield important new theoretical insights and be of practical
relevance for both consumers and retailers. Given these opportunities, gaining additional insights into
which shoppers are most likely to use smart carts and hand held scanners will be invaluable.
Conclusion
The results of these studies offer robust insights that may help retailers create win-win strategies
using smart shopping carts, handheld scanners, or mobile phones. These insights further contribute to
the in-store tracking and spending behavior literature and benefit existing budgeting, spending, and
in-store decision-making theories. We identify a variety of directions for further research related to
the implications of the growing use of customer-facing technologies––such as handheld scanner and
smart shopping carts—for consumers, retailers, manufacturers, and marketing researchers.
Looking forward, it would be promising to examine whether and how real-time feedback
influences other types of behaviors. For example, how does a runner respond to real-time
distance feedback while running, or how does a dieter respond to real-time calorie-intake
feedback? With the growing market of apps that allow people to track many different aspects of
their life, gaining a better understanding about the implications of real-time feedback is relevant
and worthwhile.

38
REFERENCES
Ailawadi, Kusum, Karen Gedenk, and Scott A. Neslin (2003), “Understanding Competition
Between Retailers and Manufacturers: An Integrated Analysis of Store Brand and National
Brand Deal Usage,” working paper, Tuck School of Business, Dartmouth College.
——— and Bari Harlam (2004), “An Empirical Analysis of the Determinants of Retail Margins:
The Role of Store Brand Share,” Journal of Marketing, 68 (January), 147–66.
———, Scott A. Neslin, and Karen Gedenk (2001), “Pursuing the Value-Conscious Consumers:
Store Brands Versus National Brand Promotions,” Journal of Marketing, 65 (January), 71–89.
Arends, Brett (2008), “Load Up the Pantry,” (April 21), (accessed June 19, 2008), [available at
http://online.wsj.com/public/article/SB120881517227532621.html].
Arrow, Kenneth J. (1971), Essays in the Theory of Risk Bearing. Chicago: Markham Publishing Co.
Batra, Rajeev and Olli T. Ahtola (1990), “Measuring Hedonic and Utilitarian Sources of
Consumer Attitudes,” Marketing Letters, 2 (2), 159–70.
Bell, David R. and James M. Lattin (1998), “Shopping Behavior and Consumer Preference for
Store Price Format: Why ‘Large Basket’ Shoppers Prefer EDLP,” Marketing Science, 17
(1), 66–88.
Bénabou, Roland and Jean Tirole (2004), “Willpower and Personal Rules,” Journal of Political
Economy, 112 (4), 848–86.
Berberich, Steve (2007), “Grocery Stores Turn to Hand-held Personal Scanners for Shoppers,”
[http://ww2.gazette.net/stories/082207/busimlo183159_32376.shtml].
Blattberg, Robert C. and Kenneth J. Wisniewski (1989), “Price Induced Patterns of Competition,”
Marketing Science, 8 (Fall), 291–309.

39
Bliss, Christopher (1988), “A Theory of Retail Pricing,” Journal of Industrial Economics, 36 (4),
375–91.
Bodkin, Ronald G. (1959), “Windfall Income and Consumption,” American Economic Review,
49(4), 602–614.
Burger, Philip C. and Barbara Schott (1972), “Can Private Brand Buyers Be Identified?” Journal
of Marketing Research, 9 (May), 219–22.
Chandon, Pierre and Brian Wansink (2006), “How Biased Household Inventory Estimates Distort
Shopping and Storage Decisions,” Journal of Marketing, 70 (4), 118-35.
Chandon, Pierre and Brian Wansink (2012), “Does Food Marketing Need to Make Us Fat? A
Review and Solutions,” Nutrition Reviews, 70:10 (October), 571-593.
Dhar, Ravi, Joel Huber, and Uzma Khan (2007), “The Shopping Momentum Effect,” Journal of
Marketing Research, 44 (August), 370–78.
——— and Klaus Wertenbroch (2000), “Consumer Choice Between Hedonic and Utilitarian
Goods,” Journal of Marketing Research, 37 (February), 60–71.
Dickson, Peter R. and Alan G. Sawyer (1990), “The Price Knowledge and Search of Supermarket
Shoppers,” Journal of Marketing, 54 (July), 42–53.
Ding, Min (2007), “An Incentive-Aligned Mechanism for Conjoint Analysis,” Journal of
Marketing Research, 44 (May), 214–23
———, Grewal Rajdeep, and John Liechty (2005), “Incentive-Aligned Conjoint Analysis,”
Journal of Marketing Research, 42 (February), 67–82.
Du, Rex Y. and Wagner A. Kamakura (2008), “Where Did All That Money Go? Understanding
How Consumers Allocate Their Consumption Budget,” Journal of Marketing, 72
(November), 109–131.

40
Erdem, Tülin, Ying Zhao, and Anna Valenzuela (2004), “Performance of Store Brands: A Cross-
Country Analysis of Consumer Store-brand Preferences, Perceptions, and Risk,” Journal of
Marketing Research, 41 (February), 86–100.
Gill, Tripat (2008), “Convergent Products: What Functionalities Add More Value to the Base?”
Journal of Marketing, 72 (March), 46–62.
Gómez, Miguel I., Edward W. McLaughlin, and Dick R. Wittink (2004), “Customer Satisfaction
and Retail Sales Performance: An Empirical Investigation,” Journal of Retailing, 80 (4),
265–78.
Heath, Chip and Jack B. Soll (1996), “Mental Budgeting and Consumer Decisions,” Journal of
Consumer Research, 23 (June), 40–52.
Hirschman, Elizabeth C. and Morris B. Holbrook (1982), “Hedonic Consumption: Emerging
Concepts, Methods and Propositions.” Journal of Marketing, 46 (July), 92–101.
Hui, Sam K., J. Jeffrey Inman, Yanliu Huang, and Jacob Suher (2013), “The Effect of In-Store
Travel Distance on Unplanned Spending: Applications to Mobile Promotion Strategies,”
Journal of Marketing, 77 (March), 1–16.
Hymans, Saul H. and Harold T. Shapiro (1976), “The Allocation of Household Income to Food
Consumption,” Journal of Econometrics, 4 (2), 167–88.
Kahneman, Daniel, Jack L. Knetsch, and Richard H. Thaler (1991), “The Endowment Effect,
Loss Aversion, and Status Quo Bias,” Journal of Economic Perspectives, 5 (1), 193–206.
Keller, Kevin L. (2008), Strategic Brand Management, 3d ed. Upper Saddle River, NJ:
Pearson/Prentice Hall.
Khan, Uzma and Ravi Dhar (2006), “Licensing Effect in Consumer Choice,” Journal of
Marketing Research, 43 (May), 259–66.

41
——— and ——— (2010), “Price-Framing Effect on the Purchase of Hedonic and Utilitarian
Bundles,” Journal of Marketing Research, 47 (December), 1090–99.
Krishna, Aradhna, Richard Briesch, Donald Lehmann, and Hong Yuan (2002), “A Meta-Analysis
of the Impact of Price Presentation on Perceived Savings,” Journal of Retailing, 78 (2),
101–118.
Lalwani, Ashok K. and Kent B. Monroe (2005), “A Reexamination of Frequency-Depth Effects in
Consumer Price Judgments,” Journal of Consumer Research, 32 (December), 480–85.
Larson, Jeffrey S. and Ryan Hamilton (2012), “When Budgeting Backfires: How Self-Imposed
Price Restraints Can Increase Spending,” Journal of Marketing Research, 49 (April), 218–30.
Levav, Jonathan and A. Peter McGraw (2009), “Emotional Accounting: How Feelings About
Money Influence Consumer Choice,” Journal of Marketing Research, 46 (February), 66–80.
Lichtenstein, Donald R., Nancy M. Ridgway, and Richard G. Netemeyer (1993), “Price
Perceptions and Consumer Shopping Behavior: A Field Study,” Journal of Marketing
Research, 30 (May), 234–45.
Linden, Wolfgang (1991), “What Do Arithmetic Stress Tests Measure? Protocol Variations and
Cardiovascular Responses,” Psychophysiology, 28 (1), 91–102.
Lynch, John G. and Dan Ariely (2000), “Wine Online: Search Costs Affect. Competition on
Price, Quality, and Distribution,” Marketing Science, 19 (1), 83–103
Maes, S., Ad Vingerhoets, and Guus Van Heck (1987), “The Study of Stress and Disease: Some
Developments and Requirements,” Social Science Medicine, 25, 567-578.
Mehta, Nitin, Surendra Rajiv, and Kannan Srinivasan (2003), “Price Uncertainty and Consumer
Search: A Structural Model of Consideration Set Formation,” Marketing Science, 22 (1),
58–84.

42
Menon, Satya and Barbara Kahn (2002), “Cross-Category Effect of Induced Arousal and Pleasure
on the Internet Shopping Experience,” Journal of Retailing, 78 (1), 31–40.
Nelson, Stephanie (2008), “Attention Shoppers: Smart Carts … Aisle 6,” Daily Herald, (April
30), (accessed April 24, 2013), [available at https://prev.dailyherald.com/story/?id=180936].
Okada, Erica M. (2005), “Justification Effects on Consumer Choice of Hedonic and Utilitarian
Goods,” Journal of Marketing Research, 42 (February), 43–53.
Osborne, Charlie (2012), “Smart Carts Follows You When Grocery Shopping,” SmartPlanet,
(March 1), (accessed April 24, 2013), [available at http://www.smartplanet.com/blog/smart-
takes/smart-cart-follows-you-when-grocery-shopping/23536].
Pennings, Joost M.E., Koert van Ittersum, and Brian Wansink (2005), “To Spend or Not to
Spend? The Effect of Budget Constraints on Estimation Processes and Spending Behavior,”
in Advances in Consumer Research, Vol. 32, Geeta Menon and Akshay R. Rao, eds. Duluth,
MN: Association for Consumer Research, 328–29.
——— and Brian Wansink (2004), “Channel Contract Behavior: The Role of Risk Attitudes,
Risk Perceptions, and Channel Members’ Market Structures,” Journal of Business, 77
(October), 697–723
Pratt, John W. (1964), “Risk Aversion in the Small and in the Large,” Econometrica, 32
(January–April), 122–36.
Preacher, Kristopher J. and Andrew F. Hayes (2004), “SPSS and SAS Procedures for Estimating
Indirect Effects in Simple Mediation Models,” Behavior Research Methods, Instruments,
and Computers, 36 (4), 717–31.
Quelch, John A. and David Harding (1996), “Brand Versus Private Labels: Fighting to Win,”
Harvard Business Review, (January–February), 99–109.

43
RetailWire (2012), “Pricing Transparency: Can Retailers Regain Control?” results of a RetailWire
Study, (accessed April 24, 2013), [available at
http://ww1.prweb.com/prfiles/2012/10/03/9974639/price-trans-exec-summary.pdf].
Rosenblum, Paula (2007), “Technology Enabled Customer-Centricity in the Store,” benchmark
report, Retail Systems Research, (March), (accessed April 24, 2013), [available at
http://www.anselmiconsulting.com/Documents/Technology%20Enabled%20Customer%20
Centricity%20RSAG%20in%20the%20Store.pdf].
Senne, Steven (2005), “New Computers Make Grocery Carts Smarter,” (May 3), (accessed April
24, 2013), [available at http://usatoday30.usatoday.com/tech/news/2005-05-03-smart-
carts_x.htm].
Sethuraman, Raj (1996), “A Model of How Discounting High-Priced Brands Affects the Sales of
Low-Priced Brands,” Journal of Marketing Research, 33 (November), 399–409.
Steenkamp, Jan-Benedict E.M., Harald J. van Heerde, and Inge Geyskens (2010), “What Makes
Consumers Willing to Pay a Price Premium for National Brands over Private Labels?”
Journal of Marketing Research, 47 (December), 1011–24.
Stilley, Karen M., J. Jeffrey Inman, and Kirk L. Wakefield (2010a), “Planning to Make
Unplanned Purchases? The Role of In-Store Slack in Budget Deviation,” Journal of
Consumer Research, 37 (2), 264–78.
Stilley, Karen M., J. Jeffrey Inman, and Kirk L. Wakefield (2010b), “Spending on the Fly: Mental
Budgets, Promotions, and Spending Behavior,” Journal of Marketing, 74 (May), 34-47.
Swinyard, William R. (1993), “The Effects of Mood, Involvement, and Quality of Store Experience
on Shopping Intentions,” Journal of Consumer Research, 20 (September), 271–80.

44
Tal, Aner and Brian Wansink (2013), “Fattening Fasting: Hungry Grocery Shoppers Buy More
Calories Not More Food,” JAMA Internal Medicine, 173:12, 1146-1148.
Taylor, Shelley E. and Susan C. Thompson (1982), “Stalking the Elusive Vividness Effect,”
Psychological Review, 89 (2), 155–81.
Thaler, Richard H. (1980), “Toward a Positive Theory of Consumer Choice,” Journal of
Economic Behavior and Organization, 1 (1), 36–60.
——— (1985), “Mental Accounting and Consumer Choice,” Marketing Science, 4 (3), 199–214.
——— (1999), “Mental Accounting Matters,” Journal of Behavioral Decision Making, 12 (3),
183–206.
Tversky, Amos and Daniel Kahneman (1991), “Loss Aversion in Riskless Choice: A Reference-
Dependent Model,” Quarterly Journal of Economics, 106 (November), 1039–61.
Ulkümen, Gülden, Manoj Thomas, and Vicki Morwitz (2008), “Will I Spend More in Twelve
Months or a Year? The Effect of Ease of Estimation and Confidence on Budget Estimates,”
Journal of Consumer Research, 35 (August), 245–56.
Van Houwelingen, Jeannet H. and W. Fred van Raaij (1989), “The Effect of Goal-Setting and
Daily Electronic Feedback on In-Home Energy Use,” Journal of Consumer Research, 16
(June), 98–105.
Van Ittersum, Koert, Joost M.E. Pennings, and Brian Wansink (2010), “Trying Harder and Doing
Worse: How Grocery Shoppers Track In-Store Spending,” Journal of Marketing, 74 (2),
90–104.
———, ———, ———, and Hans C.M. Van Trijp (2007), “The Validity of Attribute-
importance Measurement: A Review,” Journal of Business Research, 60 (11), 1177–90.

45
Vibert-Kennedy, Karen (2003), “Smart Shopping Carts to Roam Grocery Stores of Future,”
(October 26), (accessed April 24, 2013), [http://www.usatoday.com/news/science/2003-10-
26-shop-smart_x.htm].
Voss, Kevin E., Eric R. Spangenberg, and Bianca Grohmann (2003), “Measuring the Hedonic and
Utilitarian Dimensions of Consumer Attitude,” Journal of Marketing Research, 40
(August), 310–20.
Wakefield, Kirk L. and J. Jeffrey Inman (2003), “Situational Price Sensitivity: The Role of
Consumption Occasion, Social Context, and Income, Journal of Retailing, 79 (4), 199–212.
Wansink, Brian, Robert J. Kent, and Stephen J. Hoch (1998), “An Anchoring and Adjustment
Model of Purchase Quantity Decisions,” Journal of Marketing Research, 35:1 (February),
71-81.
Wathieu, Luc, A.V. Muthukrishnan, and Bart J. Bronnenberg (2004), “The Asymmetric Effect of
Discount Retraction on Subsequent Choice,” Journal of Consumer Research, 31 (3) 652–57.

46
TABLE 1
How Real-Time Spending Feedback Influences Grocery Shopping Behavior
Budget Shoppers Nonbudget Shoppers
Total spending ($) H1a Increases
H1b Decreases
Number of products purchased H2a Increases H2b Decreases
Store vs. national brands (%) H3a Decreases H3b Increases
Shopping experience H4a Increases H4b Decreases
TABLE 2
Psychographics of the Participants of Study 2
Characteristics Items Average
(SD)
Cronbach’s
Alpha
Shopping experience I am satisfied with my shopping experience in the online
store.
4.1 (.92) .87
I enjoyed shopping in the online store.
Overall, I am satisfied with the online grocery store
experience.
Intention to return to
store
I could consider myself to be loyal to a real online grocery
store that is similar to Grocery Square.
3.5 (1.09) .89
I would definitely buy products from a real online grocery
store that is similar to Grocery Square.
I would expect to purchase through a real online grocery
store that is similar to Grocery Square.
Store brand attitude I like the store brand. 3.4 (.80)
.78
(GS Value) I believe the quality of the store brand is high.
I feel confident about the quality of the store brand.
Store price image I believe the online grocery store is expensive. 2.9 (1.03)a
.85
The prices of the products sold at the online store are high.
General attitude
toward store brands
I buy store brands. 3.9 (.96)s
.73
My shopping cart contains store brands for several
products.
I hardly ever buy store brands. (R)
Quality
consciousness
For me, quality is decisive when purchasing products. 3.6 (.78)a
.68
I am willing to pay for higher quality products.
Price consciousness I am a price conscious grocery shopper. 4.1 (.89)a
.75
I find myself checking the prices even for small items. aScores did not differ between four conditions.
Notes: (R) = reverse-scored item.

47
TABLE 3
Study 2: How Spending Uncertainty and Price Salience Affect the Spending ($) of Budget
and Nonbudget Shoppers (Controlling for Estimation Biases)
Spending ($)
Budget Shoppers Nonbudget Shoppers
No Real-Time
Spending Feedback
Real-Time
Spending Feedback
No Real-Time
Spending Feedback
Real-Time
Spending Feedback
Spending uncertainty –.36**
–.00n.s.
–.02n.s.
–.02n.s.
Price salience –.24*
–.40***
–.13n.s.
–.49***
Estimation biasa
–.24**
–.02n.s.
–.09n.s.
–.01n.s.
R-square .37 .16 .02 .24
F-value 8.29***
2.80**
.29n.s.
4.87*
*p < .10.
**p < .05.
***p < .01. aEstimation bias = estimated spending – actual spending.
Notes: n.s. = not significant.
TABLE 4
How Real-Time Spending Feedback Influences Grocery Shopping Behavior in Field
Studies
Budget Shoppers Nonbudget Shoppers
S2 S3 S2 S3
Total spending ($) H1a Increases
H1b Decreases
Number of products purchased H2a Increases H2b Decreases X X
Store vs. national brands (%) H3a Decreases H3b Increases
Shopping experience H4a Increases H4b Decreases X

48
FIGURE 1
Study 2: How Real-Time Spending Feedback Affects Spending ($) and the Percentage of Store
Brands
FIGURE 2
Study 2: How Real-Time Spending Influences Uncertainty and Price Salience
FIGURE 3
Study 3: How Real-Time Spending Feedback Affects Spending ($) and the Percentage of Store
Brands
20.0%
25.0%
30.0%
35.0%
40.0%
45.0%
50.0%
55.0%
60.0%
65.0%
70.0%
Budget shopper Non-budget shopper
No real-time spending feedback Real-time spending feedback
$20.00
$25.00
$30.00
$35.00
$40.00
$45.00
Budget shopper Non-budget shopper
No real-time spending feedback Real-time spending feedback
Spending ($) % of store brands
0.0
1.0
2.0
3.0
4.0
5.0
6.0
7.0
8.0
9.0
Budget shopper Non-budget shopper
No real-time spending feedback Real-time spending feedback
0.0
1.0
2.0
3.0
4.0
5.0
Budget shopper Non-budget shopper
No real-time spending feedback Real-time spending feedback
Spending uncertainty Price Salience
$20.00
$25.00
$30.00
$35.00
$40.00
$45.00
$50.00
$55.00
$60.00
$65.00
Budget shopper Non-budget shopper
No real-time spending feedback Real-time spending feedback
0.0%
5.0%
10.0%
15.0%
20.0%
25.0%
Budget shopper Non-budget shopper
No real-time spending feedback Real-time spending feedback
Spending ($) % of store brands


![[Pubcon 2009] 7 Habits of Highly Effective Shopping Carts](https://img.pdfslide.net/doc/110x75/55d54cd0bb61ebc7228b4694/pubcon-2009-7-habits-of-highly-effective-shopping-carts.jpg)