Embed Size (px)
Citation preview
Smart Tupperware 1
Abstract
Eventually in the future each household will feature a smart kitchen where appliances will be able
to communicate with one another and make common kitchen decisions like ordering groceries and
downloading recipes. One step towards this is the Smart Tupperware; plastic containers that will
automatically recognized the type and quantity of food stored inside.
The containers will incorporate a variety of sensors, a microcontroller, and a wireless transmitter
into a small module. The sensors will collect statistical data of the food based on such properties as light
transmission/reflection, density and color. These three properties will be sufficient to differentiate the
type of benchmark dry goods that are planned for storage in the containers. The sensor data will then be
transmitted by wireless communication from the Tupperware to a central computer.
The data gathering, data transmission, and the duration of these two processes will be managed
by the microcontroller. After receiving the data from the Smart Tupperware, a PC will perform statistical
analysis, cross-referencing a benchmark previously defined by pre-production research. From the
benchmark and information provided by other smart Tupperware via the Internet, the PC will be able to
differentiate the type of food stored in the container. After calculating the type of food and amount left, a
shopping list database will be created. At the consumer’s discretion, the shopping list would be
downloaded from the PC to the PDA. The list would indicate the amount of food left over in each
container, making grocery shopping easier. The uncertainty of when to buy a particular item will be
eliminated with this technology.

Smart Tupperware 2
Table of Contents:
• Abstract 1
• Table of Contents 2
• List of Figure & Tables 3
• Introduction 4
• Overview 5
• Project Design 7
o Software 7
o Sensors 8
o Microcontroller 10
o Wireless Communication 12
o Power 13
• Conclusion 16
Smart Tupperware 3
List of Figures & Tables:
• Figure 1: System Overview 5
• Figure 2: Gantt Chart 6
• Figure 3: PDA Application 7
• Figure 4: Plastic Membrane Deflection 10
• Figure 5: One Poll/day Energy Distribution 13
• Figure 6: Two Polls/Day Energy Distribution 13
• Figure 7: Three Polls/Day Energy Distribution 14
Appendix:
• A. RGB Histogram of Cereals
• B. RGB Benchmark of Cereal
• C. Base Station Source Code
• D. Microcontroller Source Code

Smart Tupperware 4
Introduction
In order to grocery shop productively, a person must write a list before hand to get all the needed
items. The problem with this is the time and effort it requires to look through the cupboard in order to
assess what food needs to be bought. Having a grocery list automatically downloaded to the PDA would
save a lot of time and make the shopping experience easier. But how can a grocery list be automatically
created without examining every shelf in the pantry and refrigerator? The logical solution would be to
have containers that can examine its content autonomously and send this information to a PC where a
grocery list can be created. Then before a shopping trip, the list can be downloaded onto a PDA. This
technology would revolutionize how people shop; in particular saving money by not purchasing
unnecessary goods.
The two main issues in designing the Tupperware is cost and power consumption. Since
Tupperware ranges from $10 to $40, the goal of the project is to create an attachment for the container
that would cost less than the Tupperware itself. If the parts were expensive, it would be pointless to
market this technology. Who would want to purchase an improvement for an existing product if it is
twice the cost of the original merchandise? Power is another aspect that has to be analyzed carefully.
Considering that the Tupperware would be stored in shelves and accessed frequently, a lengthy battery
life is vital. A short life span would cause hassle due to changing batteries every time the container was
refilled. Careful management of power will extend battery life, making the Tupperware worry free.
Once these issues are resolved, more attention can be addressed towards the types of sensors
needed and the wireless communication system. What properties of the food should the sensors analyze
and how can this data be used to discriminate them? The size and price constraints will gear the module
towards cheap sensors and low power devices. The decisions involved in making the Smart Tupperware
will require a very robust system of sensors, a microprocessor, and transmitter that is capable of sending
data to a central PC without interference from other household devices. The following paper will discuss
the problems and solutions in creating such an item for tomorrow’s smart kitchen.

Smart Tupperware 5
Overview
Smart Tupperware began as a research project and slowly moved into a design project. The
amount of research for sensors alone required a large portion of the semester. Research into different
forms of wireless communication required a significant amount of time before a final communication
device was selected. The power specification needed to be investigated in order to determine how
useable the product would be. Once all research was complete an initial system design was created.
The system design, shown in Figure 1, separated the different sections of the project into levels of
hierarchy. The levels of hierarchy were developed to minimize user interaction. The highest level of
abstraction, which included the PDA, was the only level in which the user would interact with the Smart
Tupperware. The PDA interacted with the base station to maintain an up to date shopping list. The base
station was the gateway between the user and the Smart Tupperware. In order to keep accurate
information, the base station communicated with the Smart Tupperware over a wireless connection. This
wireless connection was fed information by the microcontroller. The microcontroller’s information came
from the sensor readings of the Smart Tupperware. Finally, at the lowest level of hierarchy was the
power. The power interacted with every component on the Smart Tupperware and thus caused the most
design compromises.
Figure 1: System Overview

Smart Tupperware 6
With system level design complete, detailed design and actual implementation began. In order to
delegate tasks, two group leaders were appointed: Ryan Goss and George Kaniamos. At this point the
team was split into 5 different areas to address the different modules of the system. Software for the
system was completed by Ryan Goss, Matthew Genelin was assigned the task of wireless
communication, Hendry Gouwanda completed the job of microcontroller interfacing, sensors were
handed to and completed by Sitha Chhum, and George Kaniamos oversaw board design and power
research. The organization of work is laid out in the Gantt chart shown below:
Figure 2: Gantt Chart

Smart Tupperware 7
Project Design
Software
In the software design the main goal was to make a product that met the specification and was
easy for the customer to use. The choices for software were made to allow simple user interaction while
minimizing the amount of programming required. The shopping list application needed to provide a way
to select purchased and not purchased foods on a list, both manually and by an automatic update. The
shopping list was developed using embedded Visual Tools for the Pocket PC 2002. The application
offered a simple five-button interface that allowed for easy customer operation.
Figure 3: PDA Application
The other software developed was the base station software suite, which analyzed and interpreted
sensor data. This suite of applications included a way for the PDA’s shopping list to be created and
updated using the software suite. A user’s interface allowed for the input of new Tupperware data to be
entered into the database and updated the shopping lists for the PDA without any interaction from the
user. Also, an online database was created and updated by the base station software. This database
allowed for simple searchable tags for a researchers interface as well as future intelligent retrieval. The
base station must also allow for a stocker’s interface, which allows the stocker to inform the Tupperware
what is contained within the individual pieces of Tupperware. The base station used Visual Basic for the
majority of the system including the stocker interface. Perl was implemented for screen scraping the web

Smart Tupperware 8
database and allowing for the researcher interface. The software suite was tested using simulated Smart
Tupperware sensor data. This testing included the full interaction of retrieving new Tupperware readings,
to the updating of the online database, as well as updating the PDA shopping list. With the Smart
Tupperware now able to interact with the customer, how will the information the customer know what
and when food should be bought?
Sensors
The role of the sensors was to examine the food stored in the Tupperware. By using a variety of
sensors the two main goals, identifying the amount and type of food, were accomplished. Numerous
types of sensors were researched in order to determine what combination was best for obtaining the two
goals. The sensors were selected by the food property they were testing for: mass, color reflection, and
volume. To show that these sensors could differentiate food the benchmark for the project was narrowed
down to cereals. Cereals are among the most common food to be stored in Tupperware and given the
numerous brands of cereal available, it was the perfect food for which to show the potential of the
sensors. Five kinds of cereals were picked as the benchmark: Fruit Loops, Corn Pops, Frosted Flakes,
Coca Puffs, and Raisin Bran.
The first sensor examined was a digital color camera since this was the easiest method of
determining the type of cereal in the container. To see how the camera would analyze the cereals,
pictures of each cereal was taken and examined in MATLAB using the Imaging Processing Toolbox.
MATLAB showed that each cereal had a different RGB histogram as seen in Appendix A. Therefore by
using the camera it was possible to distinguish cereal simply by analyzing the photo. Miniature color
cameras used in the toy industry were readily available for an affordable price so it seemed the solution of
discriminating food was found, except that two key issues came up. The problems were focusing and an
external light source. A strong light source was needed for the camera to perceive anything besides
darkness. This meant power had to be allotted for this device in the already stringent power budget. The
placement of the light was also a concern because it had an effect on focusing.
If the camera was placed on the lid over the food, focusing was an issue because the focal point of
the lens would remain unchanged as the amount of cereal decreased, leading to an unfocused image.
Depending on where the light source was located, the image would either be darker or lighter than
normal. If the light was placed near the bottom, images taken at full volume would be blurred to black.
Similarly, if the light was situated near the top, images taken at half volume would be blurred to white.
Either way, these two circumstances would cause the RGB histogram of the cereal to be different enough
where it might be mistaken for another cereal. Perfect placement of the light or an auto-focusing camera
could solve this problem, but neither was possible due to difficulty and cost, respectively. So in order to

Smart Tupperware 9
eliminate the two problems but still take advantage of the camera’s ability to discriminate by color
another light beam sensor was used: red, green, and blue LEDs and a photocell.
The LEDs would essentially perform the same function as the camera, transmitting a different
wavelength of light and detecting the amount of light reflected back from the food, at a fraction of the
cost and power. The LEDs required less than 6mA to work properly and in the run of millions costs only
pennies each.
CdS photocells were used to detect the magnitude of the light reflection in terms of voltage. The
greater the intensity of reflected light, the higher the voltage at the CdS cell. The location to place the
LEDs and cell proved to be more difficult than imagined. The LEDs and cells were initially positioned at
an angle facing each other so that the light from the LED would reflect off the food and be directed to the
photocell. The locations of these pairs were tried on the on the Tupperware sides and at corners. Despite
angling these components at the same angle the voltage readings were dependent on how much food was
between the LED and cell instead of how much light reflected off the cereal. The eventual solution was
creating a clear window on the bottom of the Tupperware, with the LEDs and cells directly below it. This
also allowed the CdS cells to only be affected by the amount of light reflected off the food.
For the property of density, strain gages and IR LEDs were used. The IR LEDS were positioned
in a matrix on a large side, with a corresponding photodiode matrix on the other side in order to measure
volume. Since cereal has a tendency to shift to the sides after being poured, the majority of the
components were oriented near the middle and sides.
By firing each LED and reading the corresponding photodiode, it was possible to see if the LED
was blocked by food or not. A blocked LED would result in a photodiode voltage of zero. An unblocked
LED would result in a voltage of 3.0V. By examining the entire matrix individually, determining the
shape of the cereal in the Tupperware was possible, allowing for the volume of the cereal to be calculated.
The accuracy of this level sensor could be increased with more LEDs, but given power and I/O port
constraints, only 8 pairs were used.
The sensing of mass was done by strain gages, which were placed on the bottom of the
Tupperware. The strain gages, in conjunction with an instrumentation amplifier, could detect minute
changes in force. The larger the force applied to the strain gage, the larger the output voltage from the
amplifier. To determine where the gages would be placed, IEEE papers on the deflection of square
plastic membranes were consulted. The papers showed that the greatest deflection occurred at the
maximum curvature point, which as shown in Figure 4 below, occurred at a distance of two-tenths of the
radius from the center of the membrane. Placement of the gages elsewhere would show minimal or no
displacement of the Tupperware bottom.

Smart Tupperware 10
Figure 4: Plastic Membrane
Deflection
With all the sensors in place, it was now possible to create a benchmark. The RGB reflectance of
the cereal was tested by pouring the cereal into the Tupperware and reading its red, green, and blue value
individually, with the lights off to simulate a cupboard location. The Tupperware was then emptied so the
above process could be repeated for 20 readings. The red and green LEDs were ran at 5mA, while the
blue used 4mA. The result was each cereal having different RGB values as predicted by MATLAB. This
is shown in Appendix B. The benchmark for density wasn’ t as easy.
The hope of the gage was to associate a voltage reading with a mass. However during testing, the
gages did not show the increase of voltage with increasing cereal amount. The reason seemed to be that
the wires connecting the strain gages to the instrumentation amplifier was very sensitive to touch. With
no reliable data, a benchmark for density wasn’ t possible. Luckily, the IR and color LEDs were enough
to discriminate food and determine food volume. With the RGB benchmark now it place, the current
question posed is how will the Tupperware interpret this data so it will be useful to the customer?
Microcontroller
The data analysis will be handled by the microcontroller. The requirements of the
microcontroller were to gather sensor data and store it until it was ready for communication to the base
station. Possible microcontrollers were narrowed down based on a few factors: power consumption,
price, size, abundant I/O ports, multiple A/D conversion and availability. Another vital feature was the
ability to place the microcontroller in sleep mode in order to save power.

Smart Tupperware 11
The search for a microcontroller that fit those criteria led to three primary choices: PIC, Motorola
MC68HC12, and the Atmel ATMega. The main issue confronting the microcontroller was that it needed
to be flexible for the research phase of the project. Based on all the restraints the Atmel ATMega128L
was chosen. The Atmel ATMega128L was a fairly low power microcontroller that afford large amounts
of flexibility for I/O and A/D. The Atmel ATMega was available with an evaluation board, but this
required an additional cost and off circuit programming. Instead the on-board programming feature was
used. This meant that the programming circuit had to be developed, but it also meant that the
microcontroller could remain soldered onto the circuit board throughout the programming and testing
phase of the project.
A primary task of the microcontroller was routing digital data to an analog signal in order to
power the sensors. Another duty of it was to convert analog signal acquired from the sensors to digital
signal so that the data could be transmitted to the main computer using the wireless communication
interface. The microcontroller will activate the sensor and communication system several times per day
during its active mode. The time spent in this mode was dependent on the power consumption of the
system and the delay in transmitting data. Power and timing calculation showed that having the micro
controller on for up to two minutes a day would last six months. If each power on cycle is less then 30
seconds, three wake cycles per day can be achieved.
The microcontroller itself consumes around 1.3mWh with a current draw of 10µA in sleep mode.
During active mode the peak current jump to 17mA, however power-on time was limited so a minimal
power of 36.9µWh was consumed. The reason sleep mode consumed a lot of energy was due to active
mode being on for less than a minute per-day. The rest of the day would be spent in sleep mode.
After the micro controller samples data, it is stored in volatile memory for later conveying to the
PC base station. The micro controller was also actively involved with communicating with the PC base
station and controlling data transmission. The micro controller controls wake time, or power on, for the
communications system. It also handles transmitting a complete transaction with the base station PC
using a protocol developed by our group.
Problems were experienced during testing of the microcontroller, including incorrect hardware
connections, storing data into the ATMega memory, configuring the A/D conversion and wireless
transmission. The difficulty in saving data was solved by using an array that held the data according to
the following configuration. The first byte was the Tupperware ID number. The second byte was the
ASCII character identifying the data (R for Red, G for green and so on). The third byte was the value of
the data. This sequence was repeated for all sensor data: Red, Green, Blue, and the IR matrix.

Smart Tupperware 12
The A/D conversion worked after extensive debugging. The microcontroller was able to light up
the LEDs individually and was able to read analog data at its ADC ports. Now that the sensor data was
collectable, how will this information make it to the base station?
Wireless Communications
The information from the Smart Tupperware will be transmitted using wireless communication.
In choosing a wireless communication device that would work there were several possibilities explored:
AM, FM, Bluetooth, and 802.11b. When deciding which wireless option to use, there were several
criteria to meet. Power, cost and size were major constraints, but another key requirement was that the
communication be robust enough to transmit over a kitchen distance without interference. This ruled out
AM transmission because it was too noisy. Of the remaining choices all of the devices fit the key
constraint of interference and distance so which option was best suited for this project?
While exploring the Bluetooth option it was discovered that the modules were shipped without a
protocol stack. To have a fully operating Bluetooth communication system required a full protocol stack.
The protocol stack was unique to the communication standard being used. Since there was no protocol
for Smart Tupperware it meant that the protocol stack had to be developed. Most of the consumer
Bluetooth devices shipped are closed source so the only option for implementing the stack was to use an
open source development project available. This option was explored by attempting to rewrite a Linux
driver and recompile for the microcontroller, but was soon determined to be outside the scope of this
project.
This left an FM transceiver and 802.11b. After some research 802.11b was rejected because of it
high power consumption and difficulty in implementation. FM was chosen because it had the lowest
power draw and was the easiest to implement of all the options. To handle the FM transmission an RF
Monolithics module was used. This module offered plug and use compatibility. It had a simple footprint
for schematic layout and handled all transmission requirements. This module was also readily available,
eliminating the need for outside vendors. The RF Monolithics module offered a ready to use system that
was cost effective and would allow for minimal interference over the specified range.
Part of the design of the FM transmission system was to develop a protocol to communicate
between the Smart Tupperware and the base station. The protocol had to address multiple Tupperware
units, so naming was a must. A unique Tupperware ID was implemented on the flash programmable
memory. This allowed for multiple pieces of Tupperware to communicate with a signle base station and
have the base station uniquely identify them. In order to differentiate between data from separate Smart
Tupperware, the first byte from the microcontroller will be the identification number of the Tupperware.
The assigned unique identifier number was transmitted first to the base station. Next, the various sensor

Smart Tupperware 13
readings are transmitted along with checking bytes for error correction. The order of the transmission was
Tupperware ID, Red, Green and Blue LED voltage value, weight and finally volume.
Transmission of data bytes between the microcontroller and the base station PC was made
possible using the RF Monolithics module. The data was sent at a baud rate of 12 at 19.2 kHz. A
problem found with transmitting data was even though the microcontroller sent the correct bytes the base
station was not received properly because the serial port could not distinguish between the different
voltage levels. This problem was resolved by using a buffer at the serial input in order to differentiate the
signals. Even though specifications for the module showed minimal interference for short distances, a
blocked path was enough to cause errors during transmission. Sending the same data three times and
checking to see if the base station received the same data three times minimized the probability of errors.
If the same data didn’ t appear three times, an error had occurred. Now that the Smart Tupperware has a
way to determine its contents and transmit that information to a base station, how will the entire system
be powered?
Power
Managing the power of this system proved to be a delicate balance. It was a choice between
meeting customer specification and developing a useful product. As mentioned above, compromises
were made to make this system work. In order to see how the compromises compared with each other, a
few different scenarios were evaluated. Since the benchmark deals solely with cereal it doesn’ t make
much sense to poll for information several times per day. An assumption was made that at most cereal is
eaten three times a day. This led to three scenarios for polling: once a day, twice a day and three times a
day for a duration of 3-6 months, as required by the customer. Figure 5 shows the energy requirements
for one reading. From above the, one reading per day would yield a loss of 1.58 mWh. Assuming 30
days in one month, the power consumed after 3 months will roughly be 116.81 mWh and after 6 months
we would have consumed 232.49 mWh.

Smart Tupperware 14
Figure 5: One Poll/day Energy Distribution
Our second scenario, polling two times per day yields the following energy distribution as shown in
Figure 6.
Figure 6: Two Polls/day Energy Distribution
For two readings a day, the consumption of energy is 1.87 mWh. Again, assuming 30 days in a month,
the total power used after 3 months will be 168.23 mWh and 336.47 mWh after 6 months. If we were to
poll three times per day we would yield the distribution shown in Figure 7.
Figure 7: Three Poll/day Energy Distribution

Smart Tupperware 15
After one day we would have consumed 2.15 mWh of energy. After 3 months, 193.85 mWh would have
been used and after 6 months, 387.00 mWh of energy.
Aside from the time period constraint put on us by the customer, another requirement was to
power this system with a button cell battery. The main goal of the battery specification was to deliver a
useful product without altering the appearance of the Tupperware. Consequently the Panasonic CR2477
Button cell battery was examined. It had a nominal voltage of 3.0 volts and a capacity of 1000mAh. It
was also quite small with a diameter of 24mm and a thickness of 7mm. Going back to the scenarios, the
worst case scenario was taking three readings per day. This would consume roughly 387 mWh of energy
over a 6 month period. Looking at that calculation and the specs on this battery, it seemed the battery was
more than adequate for providing energy to our system. However, these nominal calculations were based
on the assumption the current draw was about 0.200mA of current at any point in time. Testing showed
that it was possible to pull about 47mA at 2 volts for a few seconds, but a concrete time time-span was
not possible due to power curves not extending past a 3 mA discharge. This battery by itself can run the
entire system, but there is an uncertainty of its lifetime because of limits in the power charts. Since it is
possible to draw more than the recommended current, cycling the sensors on and off independently could
prevent a surge of 115mA needed to run all the sensors. Another choice was adding two or three more
batteries to reduce the shock to each individual battery or adding a capacitor to cushion the current.
To make a useable product other power options were explored. The other power options that
were explored were a Lithium Ion Rechargeable, AAA household batteries, and an inductive charging
method. The inductive charger was ruled out due to its complexity and the fact the regular customers do
not have outlets in their cabinets. However, the household and rechargeable batteries had the potential to
work with this system, so they were examined further.
Next, the AAA batteries were explored. Each AAA battery provided 1.5 volts and had the
capacity to handle 300 mAh of current and 300mWh of energy. Referring back to the scenarios the worst
case was using 387 mWh of energy. Since the Smart Tupperware required a minimum of 3.2 volts, a total
of 3 AAA batteries were needed. With that, the specification of the AAA listed above would triple,
making them useable for this system. Calculations, for the worst case, showed that the 3 AAA would
provide a total of 7 hours of operation, which for 6 months yielded 2.33 minutes per day. 2.33 minutes
per day was more than adequate since most operations required only seconds.
Another option was the rechargeable UltraLife battery. This battery provided 3.7 volts, a
capacity of 920 mAh of current and 3400mWh of energy. This battery was comparable to the 3 AAA
batteries; calculations showed their energy supply to be equal, 7 total hours of use and 2.33 min per day.
Despite its slim size and power capacity, it was ruled out due to a couple of reasons. First, circuitry to
recharge this battery was needed. Doing so would make the board larger and more complicated. Also, if

Smart Tupperware 16
the intention is for each household to have multiple Tupperware containers more than one charger needs
to be bought or a cycle for charging needed to be developed. Because of too much user interaction, which
would defeat the purpose of this project, this battery was ruled out.
Even though a button cell battery was never implemented, it was shown to be a valid solution to
the power requirement. Other alternatives, such as AAA and Lithium Ion rechargeable were also shown
that would make the product more useable, but no internal battery was selected for the prototype. To
allow for maximum testing and flexibility an external power supply was used.

Smart Tupperware 17
Conclusion
Smart Tupperware began more as a research project than a design project. This project laid the
infrastructure for future development of Smart Tupperware. The prototype developed, used components
that would allow for a large amount of flexibility while still meeting the specifications given by the
customer. All of the specifications for each individual component were met. There was a statistical
analysis, which concluded that cereals were distinguishable based on the sensors used. The sensor data
was gathered and sent to a wireless communication system that transmitted the information to the base
station. All of these components can be powered by a button cell battery and operate for 3-6 months.
This project did go over the $200 ECE department budget. The reasons for exceeding the $200, were
different research components. Certain components, such as wireless communication, required a lot of
money even though they were not used in the final design.
This project could have been improved if lower power components were used in the design. Such
devices included an even lower power microcontroller, amplifiers, and communication systems. The
operating current of the sensors could also have been lower to a minimal to decrease its high power
consumption. But since this project was only a developmental project and all customer specifications
were met, this will all be considered in future prototypes.
Full integration of the system was almost completed. The sensors were able to calculate RGB
voltages and the level of food. The microcontroller was able to gather in the sensor readings and send the
information to the RF Monolithics module. The RF Monolithics module was able the transmit the
information from the microcontroller to the base station. The base station was able to read the
information, but the information was never usable because of the failure to complete the full wireless
system. The base station software was able to simulate new information from the Smart Tupperware and
properly analyze the information using the benchmark. The base station updated the Smart Tupperware
web page as well as the shopping list for the PDA. The PDA software was able to update and modify the
grocery list as needed. The only item absent was a fully working wireless communication subsystem.
Smart Tupperware was a successful project and would have been completely implemented if wireless
communication would have come through.

Smart Tupperware 18
Appendix A: RGB Histogram of Cereals
X axis = shade of the color where 250 is the ideal red, green or blue. As the number gets smaller, the
color gets darker until its black at 0.
Y axis = # of times the shade of the color occurs.
The M-file:
RGB = imread('swheat2.jpg'); R = RGB(:,:,1); G = RGB(:,:,2); B = RGB(:,:,3); subplot(3,1,1),imhist(R),title('red'), axis([0 250 0 4000]) subplot(3,1,2),imhist(G),title('green'),axis([0 250 0 4000]) subplot(3,1,3),imhist(B),title('blue'),axis([0 250 0 4000])

Smart Tupperware 19
Figure 1: Frosted Flakes

Smart Tupperware 20
Figure 2: Corn Pops

Smart Tupperware 21
Figure 3: Cocoa Puffs

Smart Tupperware 22
Figure 4: Fruit Loops

Smart Tupperware 23
Figure 5: Raisin Bran
Appendix B: RGB Benchmark of Cereal
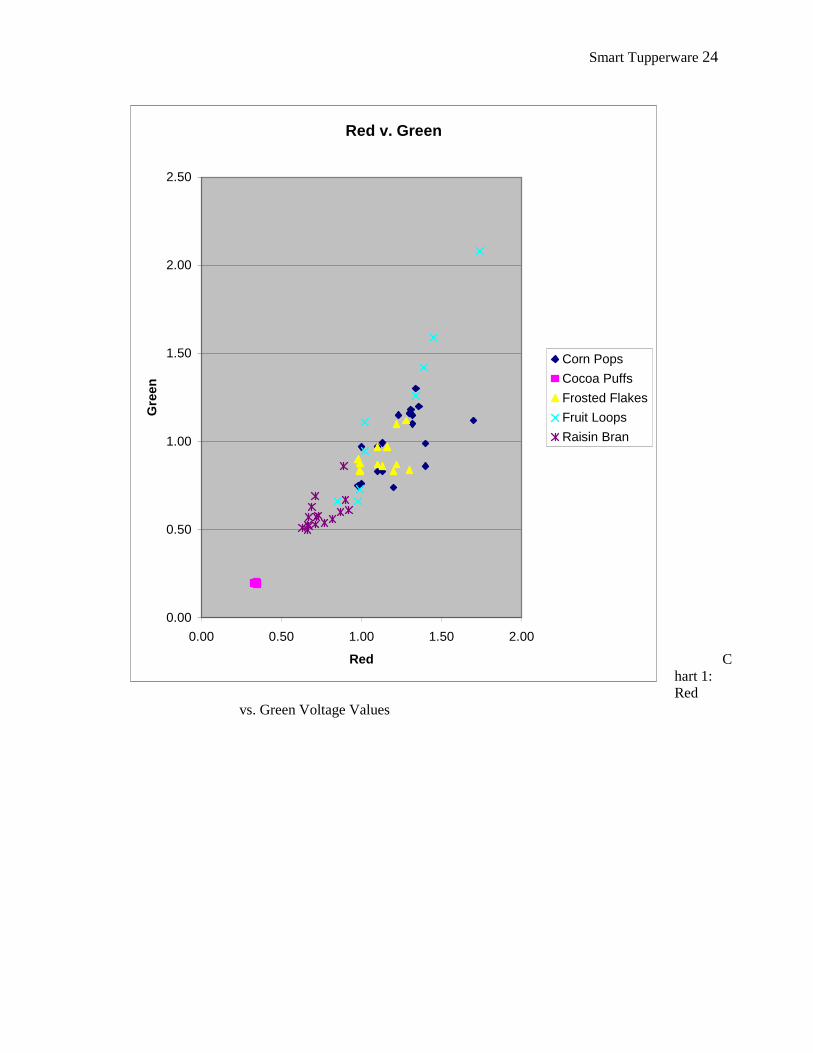
Smart Tupperware 24
Chart 1: Red
vs. Green Voltage Values
Red v. Green
0.00
0.50
1.00
1.50
2.00
2.50
0.00 0.50 1.00 1.50 2.00
Red
Gre
en
Corn Pops
Cocoa Puffs
Frosted Flakes
Fruit Loops
Raisin Bran

Smart Tupperware 25
Chart 2: Green vs. Blue Voltage Values
Green v. Blue
0.00
0.20
0.40
0.60
0.80
1.00
1.20
1.40
1.60
1.80
0.00 0.50 1.00 1.50 2.00 2.50
Green
Blu
e
Corn Pops
Cocoa Puffs
Frosted FlakesFruit Loops
Raisin Bran

Smart Tupperware 26
Table 1: Table of Maximum, Minimum, Average, and Standard Deviation of RGB Values for each Cereal