Embed Size (px)
Citation preview
© 2014 IBM Corporation
Smarter Transportation Management
An Opportunity for Government to Think and Act in
New Ways: Smarter Transportation and Traffic Safety
Smarter Transportation Management
Cate Richards
NA Smarter Cities Leader
IBM
December 10, 2014
© 2014 IBM Corporation 2
Smarter Cities Management Smarter Transportation Management
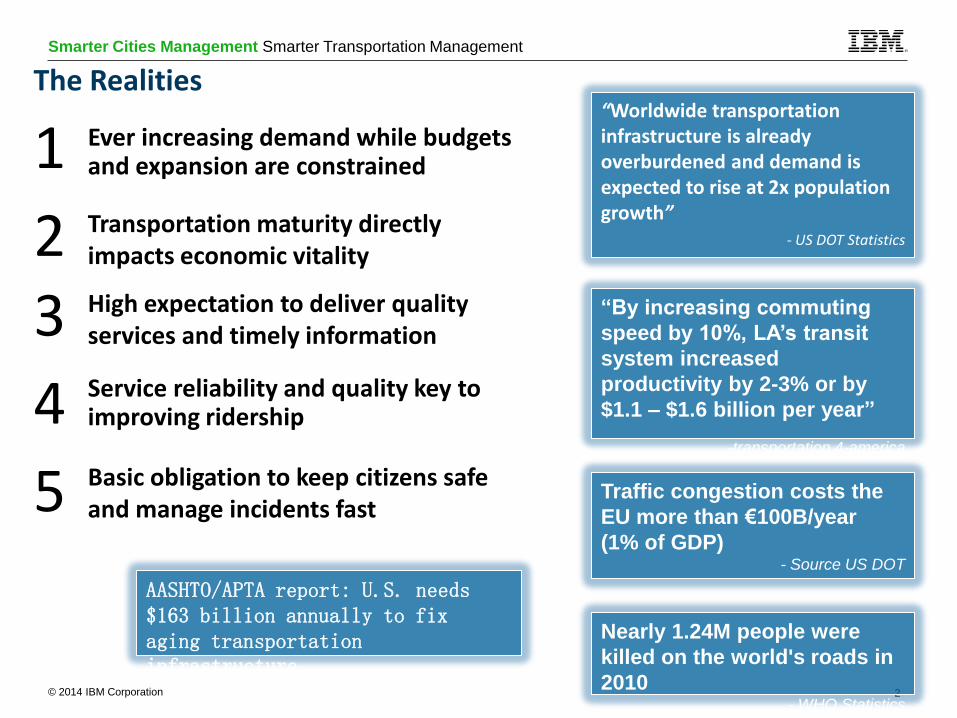
The Realities
1 Ever increasing demand while budgets and expansion are constrained
Transportation maturity directly impacts economic vitality
Service reliability and quality key to improving ridership
Basic obligation to keep citizens safe and manage incidents fast
“Worldwide transportation infrastructure is already overburdened and demand is expected to rise at 2x population growth”
- US DOT Statistics
“By increasing commuting
speed by 10%, LA’s transit
system increased
productivity by 2-3% or by
$1.1 – $1.6 billion per year”
-transportation 4-america
Traffic congestion costs the
EU more than €100B/year
(1% of GDP) - Source US DOT
Nearly 1.24M people were
killed on the world's roads in
2010 - WHO Statistics
High expectation to deliver quality services and timely information
2 3
4
5
AASHTO/APTA report: U.S. needs $163 billion annually to fix aging transportation infrastructure
- WHO Statistics
© 2014 IBM Corporation 3
Smarter Cities Management Smarter Transportation Management
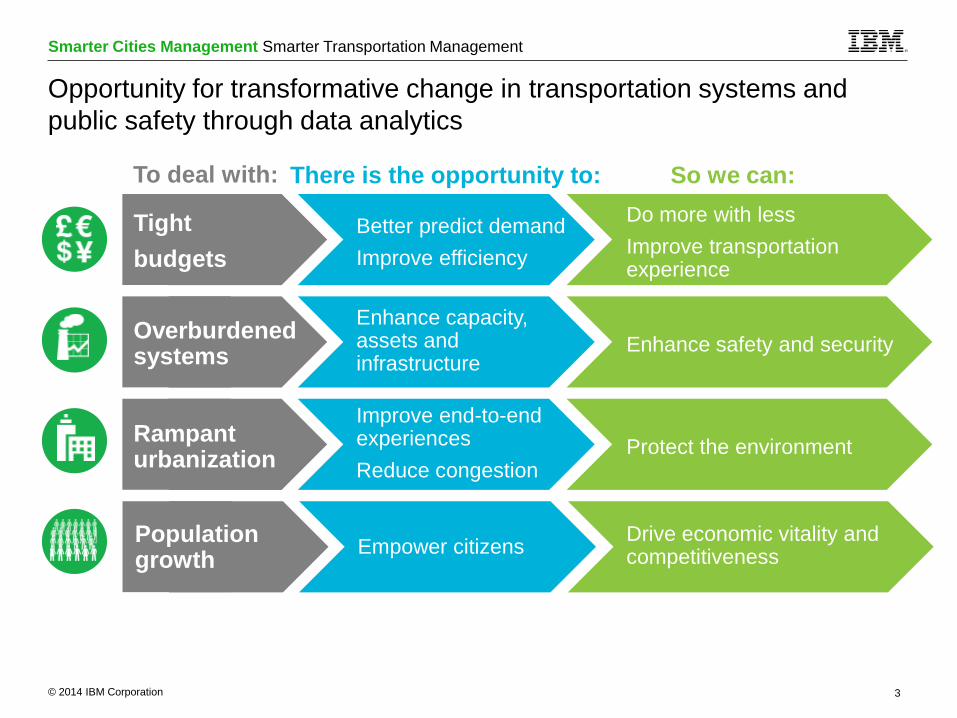
Opportunity for transformative change in transportation systems and
public safety through data analytics
Tight
budgets
Better predict demand
Improve efficiency
Do more with less
Improve transportation experience
Overburdened systems
Enhance capacity, assets and infrastructure
Enhance safety and security
Rampant urbanization
Improve end-to-end experiences
Reduce congestion Protect the environment
Population growth
Empower citizens Drive economic vitality and competitiveness
To deal with: There is the opportunity to: So we can:

© 2014 IBM Corporation 4
Smarter Cities Management Smarter Transportation Management
Energy Healthcare Public
Works
Transportation Govt Services & Education Public Safety
…the connections drive budget, revenue, safety and citizen satisfaction
Public Safety increases use of
public transit
Fewer Road Construction
Road Closures Mean Less Congestion
Safer Transit Means Fewer
Hospitalizations
Easing traffic congestion improves
emergency response
© 2014 IBM Corporation 5
Smarter Cities Management Smarter Transportation Management
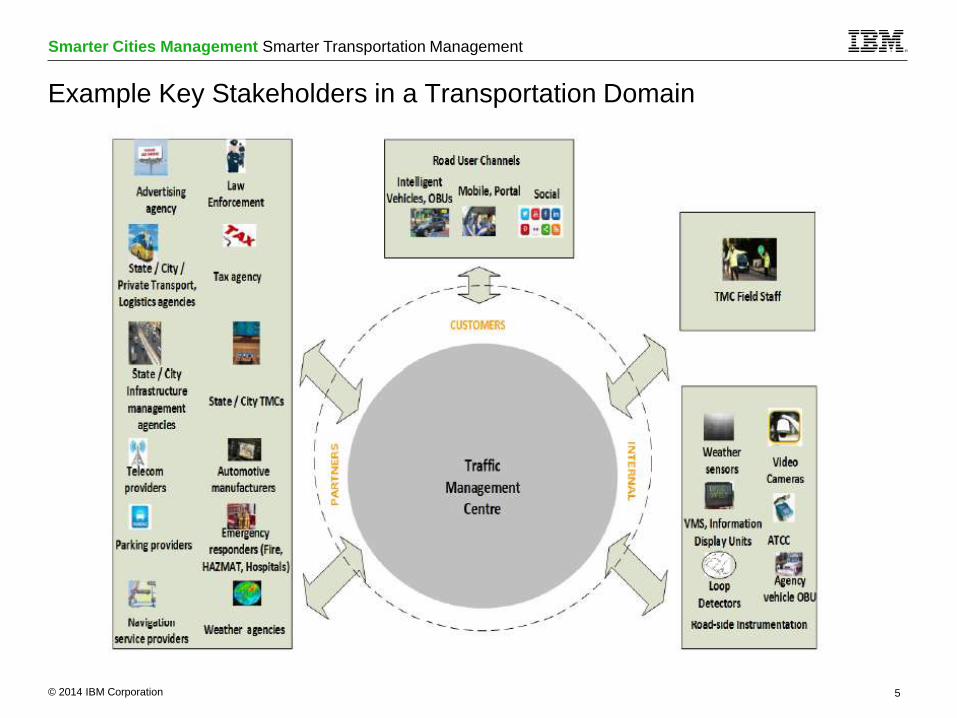
Example Key Stakeholders in a Transportation Domain
© 2014 IBM Corporation 6
Smarter Cities Management Smarter Transportation Management
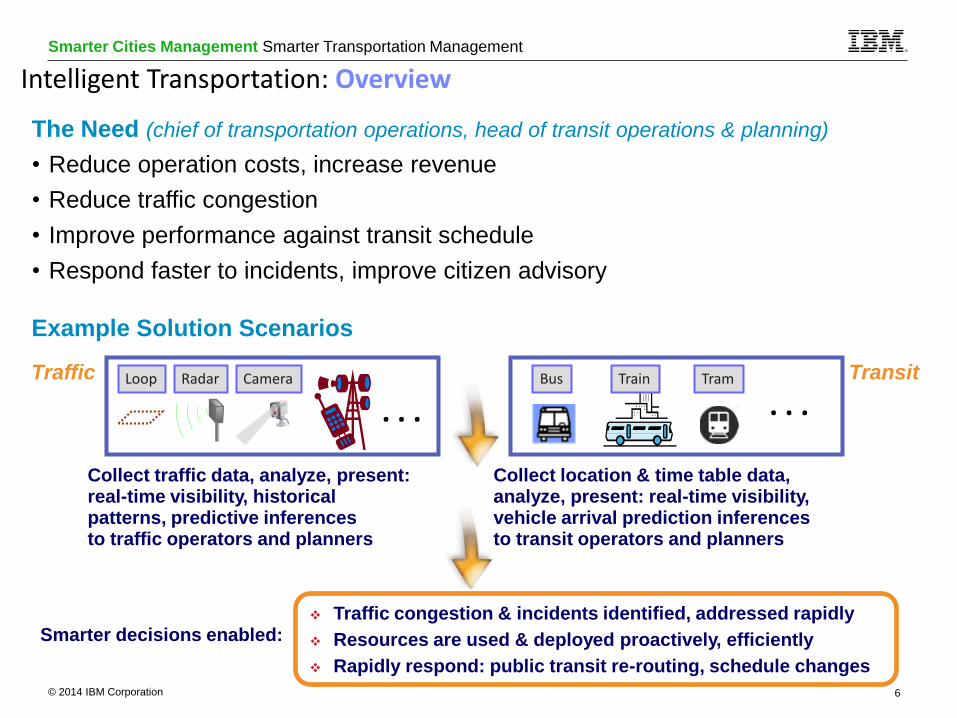
The Need (chief of transportation operations, head of transit operations & planning)
• Reduce operation costs, increase revenue
• Reduce traffic congestion
• Improve performance against transit schedule
• Respond faster to incidents, improve citizen advisory
Radar Camera Loop
. . . Train Tram Bus
. . . Traffic Transit
Example Solution Scenarios
Traffic congestion & incidents identified, addressed rapidly
Resources are used & deployed proactively, efficiently
Rapidly respond: public transit re-routing, schedule changes
Smarter decisions enabled:
Collect traffic data, analyze, present: real-time visibility, historical patterns, predictive inferences to traffic operators and planners
Collect location & time table data, analyze, present: real-time visibility, vehicle arrival prediction inferences to transit operators and planners
Intelligent Transportation: Overview
© 2014 IBM Corporation 7
Smarter Cities Management Smarter Transportation Management
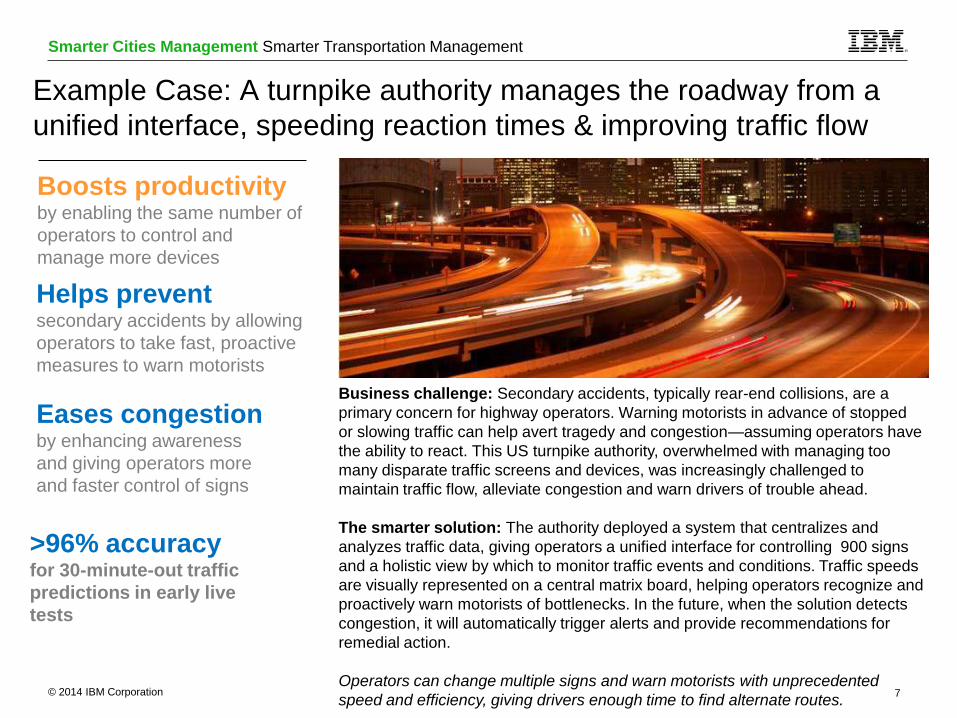
Example Case: A turnpike authority manages the roadway from a
unified interface, speeding reaction times & improving traffic flow
>96% accuracy for 30-minute-out traffic
predictions in early live
tests
Business challenge: Secondary accidents, typically rear-end collisions, are a
primary concern for highway operators. Warning motorists in advance of stopped
or slowing traffic can help avert tragedy and congestion—assuming operators have
the ability to react. This US turnpike authority, overwhelmed with managing too
many disparate traffic screens and devices, was increasingly challenged to
maintain traffic flow, alleviate congestion and warn drivers of trouble ahead.
The smarter solution: The authority deployed a system that centralizes and
analyzes traffic data, giving operators a unified interface for controlling 900 signs
and a holistic view by which to monitor traffic events and conditions. Traffic speeds
are visually represented on a central matrix board, helping operators recognize and
proactively warn motorists of bottlenecks. In the future, when the solution detects
congestion, it will automatically trigger alerts and provide recommendations for
remedial action.
Operators can change multiple signs and warn motorists with unprecedented
speed and efficiency, giving drivers enough time to find alternate routes.
Helps prevent secondary accidents by allowing
operators to take fast, proactive
measures to warn motorists
Eases congestion by enhancing awareness
and giving operators more
and faster control of signs
Boosts productivity by enabling the same number of
operators to control and
manage more devices
© 2014 IBM Corporation 8
Smarter Cities Management Smarter Transportation Management
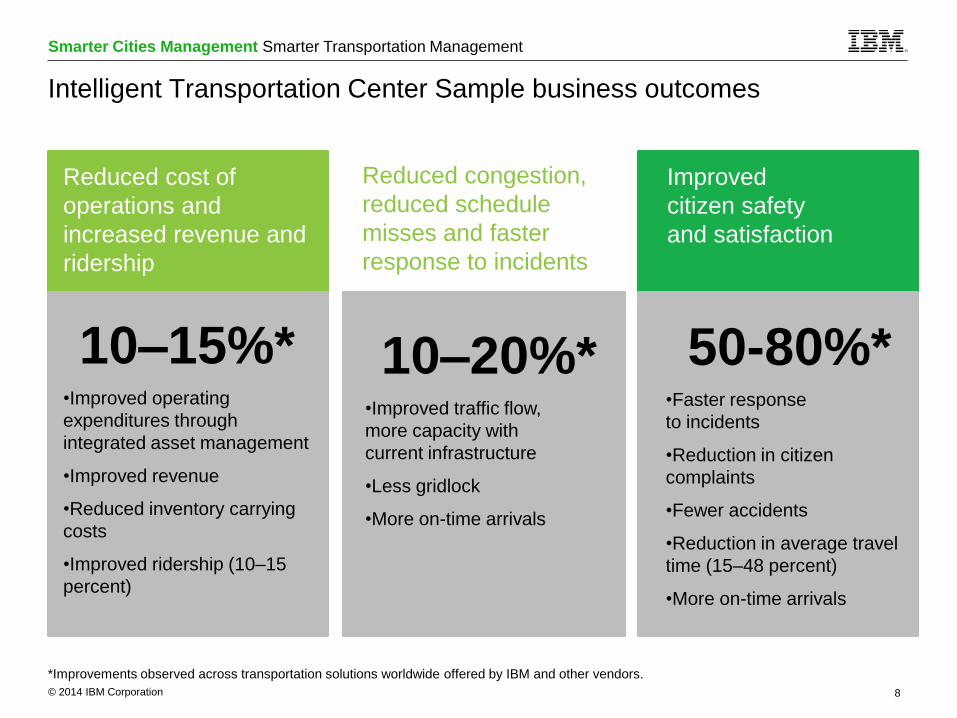
Intelligent Transportation Center Sample business outcomes
Reduced congestion,
reduced schedule
misses and faster
response to incidents
10–20%* •Improved traffic flow,
more capacity with
current infrastructure
•Less gridlock
•More on-time arrivals
50-80%* •Faster response
to incidents
•Reduction in citizen
complaints
•Fewer accidents
•Reduction in average travel
time (15–48 percent)
•More on-time arrivals
Improved
citizen safety
and satisfaction
10–15%* •Improved operating
expenditures through
integrated asset management
•Improved revenue
•Reduced inventory carrying
costs
•Improved ridership (10–15
percent)
Reduced cost of
operations and
increased revenue and
ridership
*Improvements observed across transportation solutions worldwide offered by IBM and other vendors.
© 2014 IBM Corporation 9
Smarter Cities Management Smarter Transportation Management
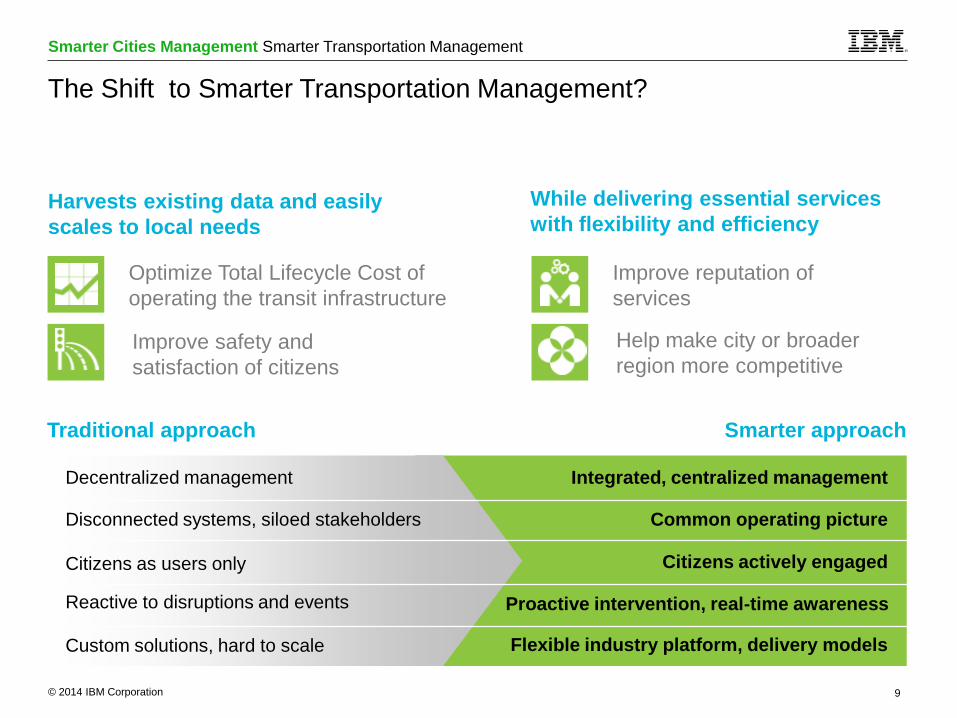
The Shift to Smarter Transportation Management?
Smarter approach
Decentralized management
Disconnected systems, siloed stakeholders
Citizens as users only
Reactive to disruptions and events
Custom solutions, hard to scale
Integrated, centralized management
Common operating picture
Citizens actively engaged
Proactive intervention, real-time awareness
Flexible industry platform, delivery models
Harvests existing data and easily
scales to local needs
Optimize Total Lifecycle Cost of
operating the transit infrastructure
Help make city or broader
region more competitive
While delivering essential services
with flexibility and efficiency
Improve reputation of
services
Improve safety and
satisfaction of citizens
Traditional approach
© 2014 IBM Corporation 10
Smarter Cities Management Smarter Transportation Management
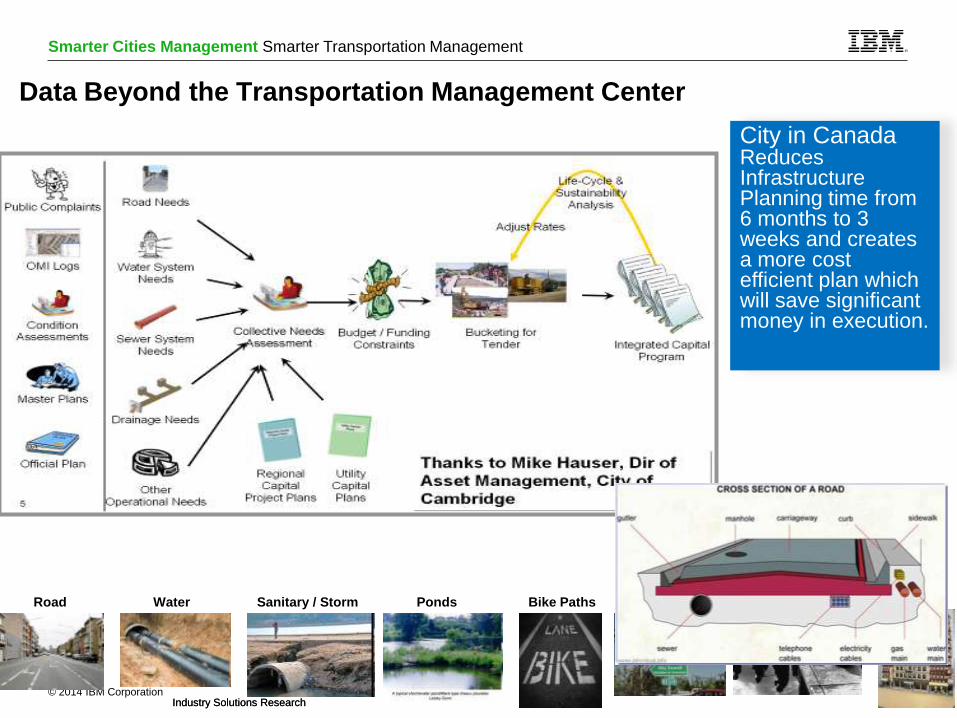
Data Beyond the Transportation Management Center
Industry Solutions Research
Industry Solutions Research
Road Water Sanitary / Storm Ponds Bike Paths Signs Pavement Buildings
City in Canada Reduces Infrastructure Planning time from 6 months to 3 weeks and creates a more cost efficient plan which will save significant money in execution.

© 2014 IBM Corporation 11
Smarter Cities Management Smarter Transportation Management
How does this work?
Correlation Optimization Allocation
OPERATIONS
ACTION
Deployment Optimization
Emergency Deployment
Budget Planning
Policy Support
Asset Utilization
Traffic Patterns
Asset Deployment
Emergency Planning
Weather/season
Demand
Environment
Road Assets
Construction actions
Enforcement Actions
Measurements
Control actions
Traffic Data
Maintenance resources
Equipment
Category
Economic factors
Equipment rating
BUSINESS
OUTCOMES
Training actions
EXOGENOUS
CONDITIONS
OPERATIONS
Equipment
deployment
Equipment Location
ANALYTICS
ENGINE
Applying Analytics to gain a deeper view into operations can provide a number
views and insights that can be applied to better support business activities
© 2014 IBM Corporation 12
Smarter Cities Management Smarter Transportation Management
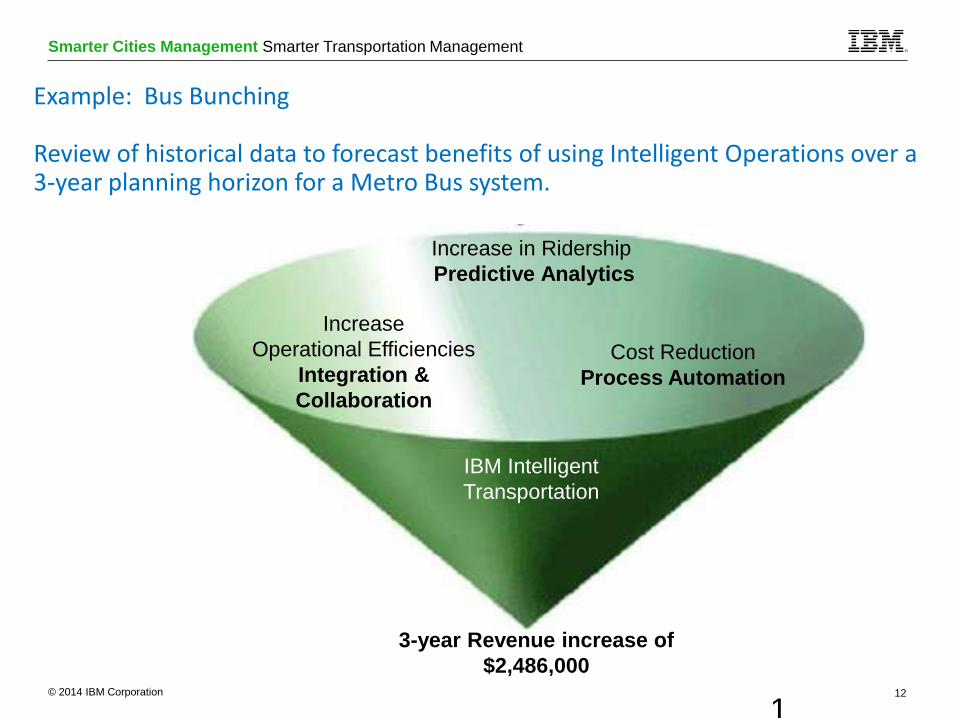
Example: Bus Bunching Review of historical data to forecast benefits of using Intelligent Operations over a 3-year planning horizon for a Metro Bus system.
IBM Intelligent
Transportation
Increase in Ridership
Predictive Analytics
3-year Revenue increase of
$2,486,000
Cost Reduction
Process Automation
Increase
Operational Efficiencies
Integration &
Collaboration
1
© 2014 IBM Corporation 13
Smarter Cities Management Smarter Transportation Management
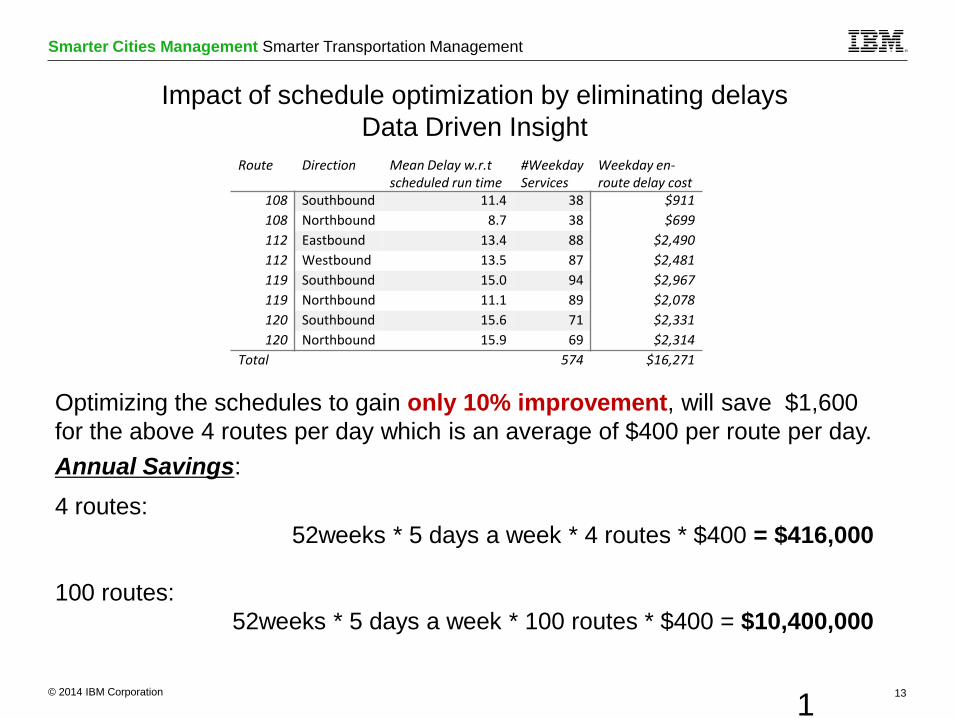
Impact of schedule optimization by eliminating delays
Data Driven Insight
Route Direction Mean Delay w.r.t scheduled run time
#Weekday Services
Weekday en-route delay cost
108 Southbound 11.4 38 $911
108 Northbound 8.7 38 $699
112 Eastbound 13.4 88 $2,490
112 Westbound 13.5 87 $2,481
119 Southbound 15.0 94 $2,967
119 Northbound 11.1 89 $2,078
120 Southbound 15.6 71 $2,331
120 Northbound 15.9 69 $2,314
Total 574 $16,271
Optimizing the schedules to gain only 10% improvement, will save $1,600
for the above 4 routes per day which is an average of $400 per route per day.
4 routes:
52weeks * 5 days a week * 4 routes * $400 = $416,000
100 routes:
52weeks * 5 days a week * 100 routes * $400 = $10,400,000
Annual Savings:
1
3
© 2014 IBM Corporation 14
Smarter Cities Management Smarter Transportation Management
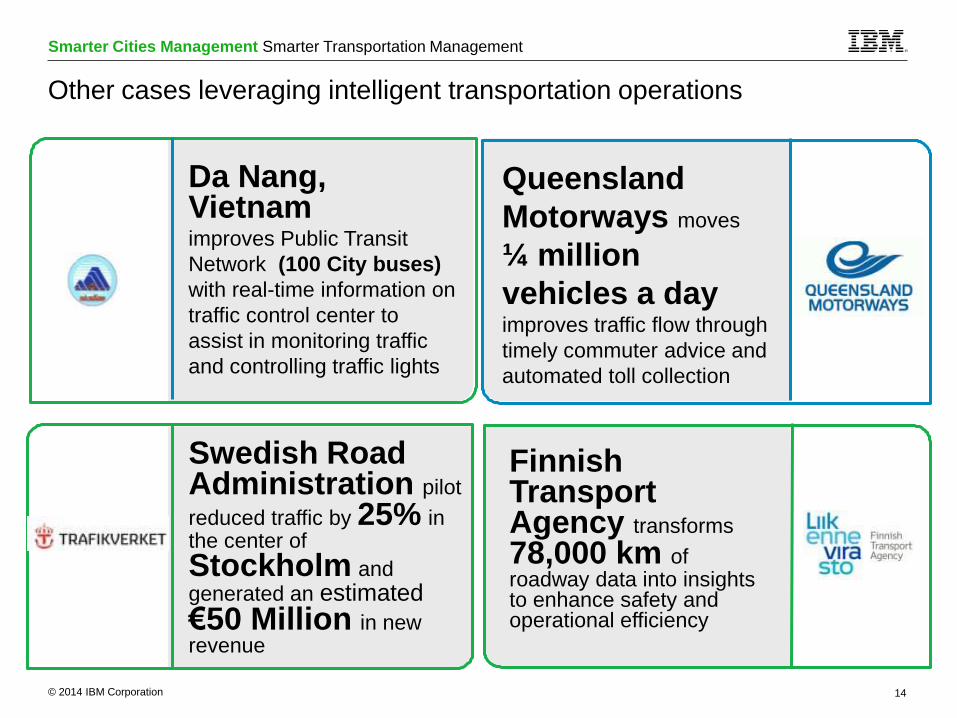
Finnish Transport Agency transforms
78,000 km of roadway data into insights to enhance safety and operational efficiency
Swedish Road Administration pilot
reduced traffic by 25% in the center of
Stockholm and generated an estimated
€50 Million in new revenue
Queensland
Motorways moves
¼ million
vehicles a day
improves traffic flow through
timely commuter advice and
automated toll collection
Da Nang, Vietnam improves Public Transit
Network (100 City buses)
with real-time information on
traffic control center to
assist in monitoring traffic
and controlling traffic lights
Other cases leveraging intelligent transportation operations
© 2014 IBM Corporation 15
Smarter Cities Management Smarter Transportation Management
Closing Thoughts For Gains In Data Driven Success
• It is critical to get the right information to the right set of
users at the right time, through visibility across networks.
• This can only be made possible by interactions between
various government agencies at multiple levels (city, state,
& country), non-governmental organizations, and other data
sources
• Using data and analytics to drive change leverages your
infrastructures and organizations rather than replacing
them.
• New cloud technology can make these solutions more
affordable. It open opportunities for shared resources
across a city, county or state.

© 2014 IBM Corporation 16
Smarter Cities Management Smarter Transportation Management
Thank you.
© 2014 IBM Corporation 17
Smarter Cities Management Smarter Transportation Management
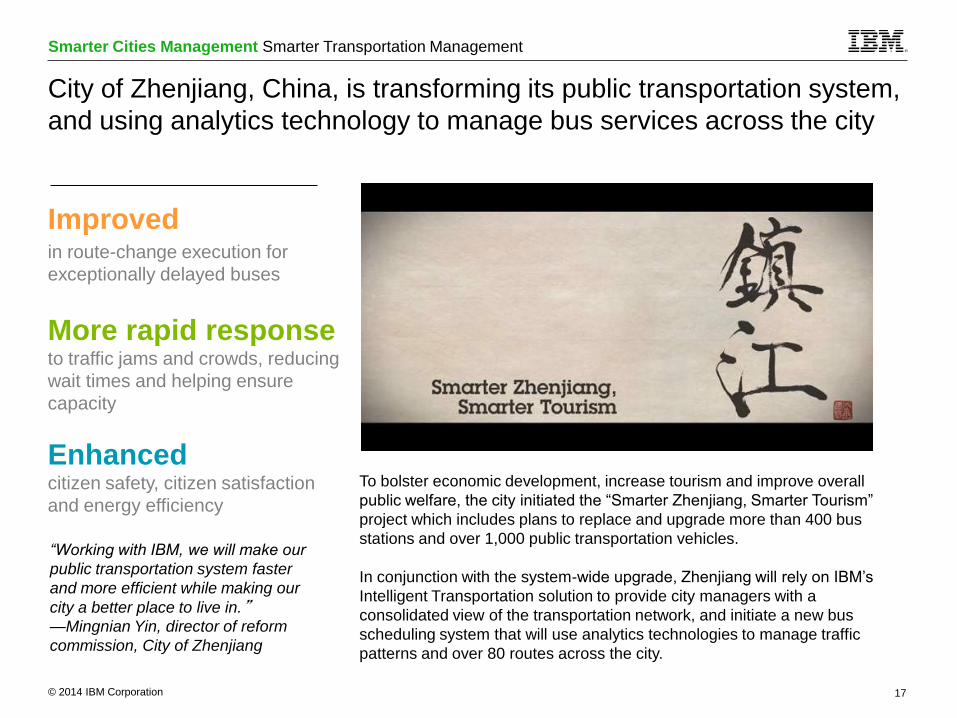
City of Zhenjiang, China, is transforming its public transportation system,
and using analytics technology to manage bus services across the city
Improved in route-change execution for
exceptionally delayed buses
More rapid response to traffic jams and crowds, reducing
wait times and helping ensure
capacity
Enhanced citizen safety, citizen satisfaction
and energy efficiency
To bolster economic development, increase tourism and improve overall
public welfare, the city initiated the “Smarter Zhenjiang, Smarter Tourism”
project which includes plans to replace and upgrade more than 400 bus
stations and over 1,000 public transportation vehicles.
In conjunction with the system-wide upgrade, Zhenjiang will rely on IBM’s
Intelligent Transportation solution to provide city managers with a
consolidated view of the transportation network, and initiate a new bus
scheduling system that will use analytics technologies to manage traffic
patterns and over 80 routes across the city.
“Working with IBM, we will make our
public transportation system faster
and more efficient while making our
city a better place to live in.”
—Mingnian Yin, director of reform
commission, City of Zhenjiang

© 2014 IBM Corporation 18
Smarter Cities Management Smarter Transportation Management
Why IBM for smarter transportation management?
Get ahead of problems with the power of predictive
analytics, analyze issues and improve continuously
Eliminate silo-based problem solving by leveraging a
system-wide view
Employ a single view of truth and collaborative process
driven problem solving for incident management
Industry’s leading transportation semantic model in-built in
the product
Leverage current investments, incrementally add value
and get the best total cost of ownership
Leverage cross-domain synergies with other
transportation modes, public safety, city planning, etc.
Work with open industry standards, ecosystem of partners
Scalable transportation platform designed to help:
© 2014 IBM Corporation 19
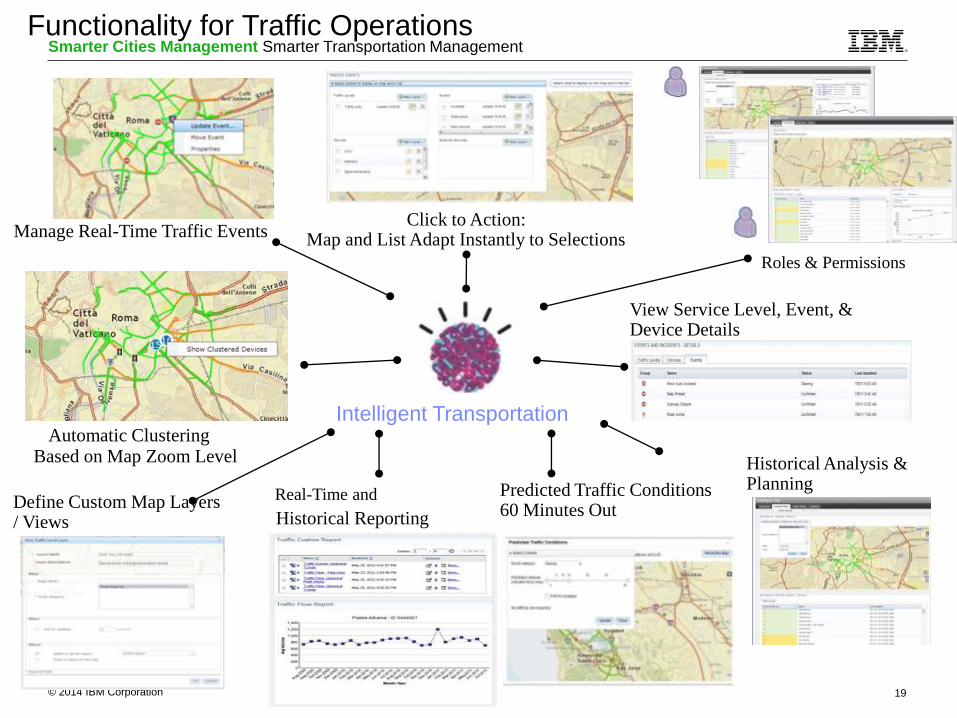
Smarter Cities Management Smarter Transportation Management Functionality for Traffic Operations
Intelligent Transportation
Click to Action: Map and List Adapt Instantly to Selections
Roles & Permissions
View Service Level, Event, & Device Details
Manage Real-Time Traffic Events
Automatic Clustering Based on Map Zoom Level
Define Custom Map Layers / Views
Real-Time and
Historical Reporting
Historical Analysis & Planning Predicted Traffic Conditions
60 Minutes Out
© 2014 IBM Corporation 20
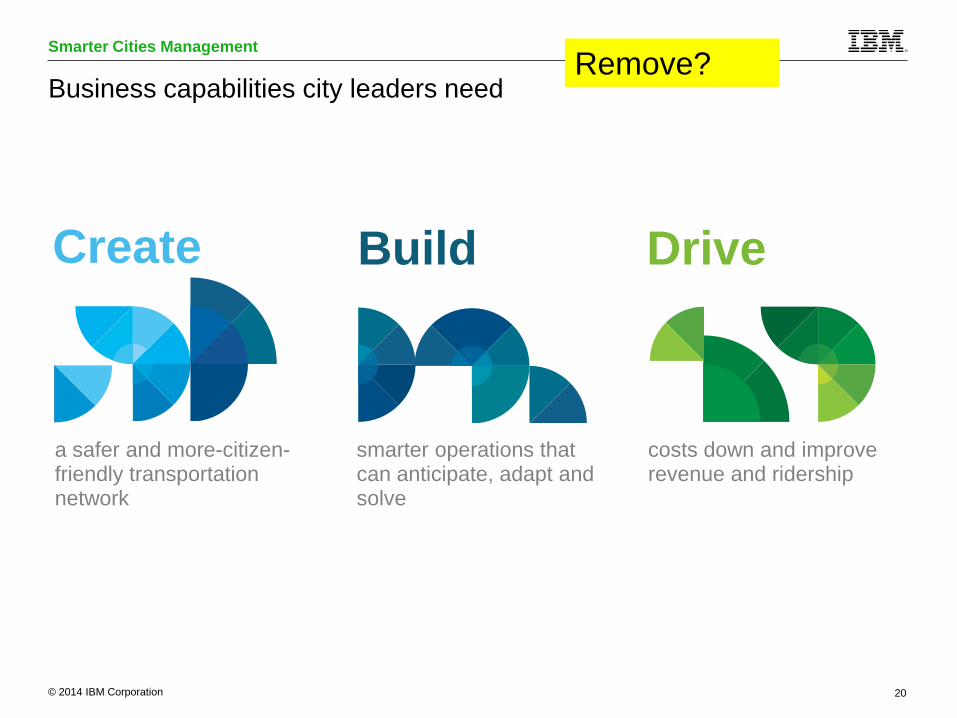
Smarter Cities Management
Business capabilities city leaders need
a safer and more-citizen-friendly transportation network
smarter operations that can anticipate, adapt and solve
costs down and improve revenue and ridership
Build Create Drive
Remove?
© 2014 IBM Corporation 21
Smarter Cities Management Smarter Transportation Management
Intelligent Transportation – Smarter Traffic Operations
Transformative, centralized management of traffic operations built
on advanced analytics and collaborative incident management
• Improve decision making: Gain real-time situational awareness about current traffic performance and issues
• Improve service to citizens: Minimize negative human and commercial impact of congestions and incidents through proactive decisions
• Lower cost of upgrade: Lower solution cost leveraging prior investments and expanding the technology/vendor options
• Improve coordination & control: Dashboards that integrates operational tools and optimizes workforce
• Implement auditable best practices: Implement auditable collaborative processes for flow optimization and incident management