Embed Size (px)
Citation preview


Contents
Equity 4-7
Derivatives 8-9
Commodity 10-13
Currency 14
IPO 15
FD Monitor 16
Insurance 17
Mutual Fund 18
SMC RESEARCH TEAMREGISTERED OFFICES:
11 / 6B, Shanti Chamber, Pusa Road, New Delhi 110005.
Tel: 91-11-30111000, Fax: 91-11-25754365
MUMBAI OFFICE:
Dheeraj Sagar, 1st Floor, Opp. Goregaon sports Club, Link Road
Malad (West), Mumbai 400064
Tel: 91-22-67341600, Fax: 91-22-28805606
KOLKATA OFFICE:
18,Rabindra Sarani, Poddar Court, Gate No-4,5th Floor, Kolkata-700001
Tel : 91-33-39847000 Fax No : 91-33-39847004
AHMEDABAD OFFICE :
10/A, 4th Floor, Kalapurnam Building, Near Municipal Market,
C G Road, Ahmedabad-380009, Gujarat
Tel : 91-79-26424801 - 05, 40049801 - 03
CHENNAI OFFICE:
Salzburg Square, Flat No.1, III rd Floor, Door No.107, Harrington Road,
Chetpet, Chennai - 600031.
Tel: 044-39109100, Fax -044- 39109111
SECUNDERABAD OFFICE:
206, 3rd Floor, above CMR Exclusive, Bhuvana Towers, S.D.Road,
Secunderabad - 500003
Tel: 91-40-30780298/99, 39109536
DUBAI OFFICE:
312, Belshalat Building, Al Karama, Dubai, P.O. Box 117210, U.A.E.
Tel: 97143963120, Mobile : 971502612483
Fax : 9714 3963122
Email ID : [email protected]
Printed and Published on behalf of
Mr. Saurabh Jain @ Publication Address
11/6B, Shanti Chamber, Pusa Road, New Delhi-110005
Website: www.smcindiaonline.com
Investor Grievance : [email protected]
Printed at: S&S MARKETING
102, Mahavirji Complex LSC-3, Rishabh Vihar, New Delhi - 110092 (India)
Ph.: +91-11- 43035012, 43035014, Email: [email protected]
lobal markets remained in a fix over the outcome of the monetary policy of
two major central banks, i.e. U.S. Federal Reserve and Bank of Japan. GFederal Reserve took no action at the meeting just concluded citing
concerns over the possibility of exit of Britain from Euro –area. Also Bank of Japan
maintained the status-quo. Janet Yellen said that rates may be depressed by “factors
that are not going to be rapidly disappearing, but will be part of the new normal.”
Federal officials also slowed the pace of expected moves in both 2017 and 2018: They
now only foresee three increases in each of those years, down from the four they
expected in March. Concerns over the likely exit of Britain from Euro-area which could
roil the financial markets led to buying in safest assets i.e. bonds, sending bond yields to
record low of countries like Japan and simultaneously, resulting in selling in equities.
Back at home, hopes of further cut in the interest rate in the next policy meeting by
the Reserve Bank of India got dimmed in view of the rise in consumer inflation.
Consumer Price Index (CPI) inflation for the month of May rose to 5.76% versus 5.47%
(revised) in April largely driven by food inflation that rose to 7.55% versus 6.40% in
April. On the macro front, India's current account deficit (CAD) narrowed sharply to
$0.3 billion (0.1% of GDP) in Q4 of 2015-16, significantly lower than $7.1 billion (1.3%
of GDP) in Q3 of 2015-16 primarily on account of a lower trade deficit ($24.8 billion)
than in Q4 of last year ($31.6 billion) and $34 billion in the preceding quarter.
On the commodity market front, bullion counter is expected to witness the volatile
movement as the crucial referendum on Britain exit from Euro zone will take place
this week (on 23 June). Gold is expected to trade in the range of 30000-31500 levels
while silver can move in the range of 40800-43500 levels in the near term. Crude oil
market is looking more and more rebalanced as falling US production and supply
disruptions in Canada and Nigeria eased the global glut. Recently strong demand and
hot weather concerns in US have lifted natural gas prices higher. Base metal counter
may remain on a volatile path, Brexit fears and China slowdown concerns to give
further direction to the prices. In a new development, SEBI on last Thursday
temporarily suspended Chana futures. With immediate impact all chana future
contracts are put under square off mode and Sebi said that no new positions would be
launched until further order. EUR German ZEW Survey, Durable Goods Orders etc are
the events scheduled this week, which can give significant impact on the prices.
From The Desk Of Editor
(Saurabh Jain)
SMC Global Securities Limited is proposing, subject to receipt of requisite approvals, market conditions and other considerations, a further public offering of its equity shares and has filed the Draft Red Herring Prospectus with the Securities and Exchange Board of India (“SEBI”) and the Stock Exchanges. The Draft Red Herring Prospectus is available on the website of SEBI at www.sebi.gov.in and on the websites of the Book Running Lead Manager i.e., ICICI Securities Limited at www.icicisecurities.com and the Co- Book Running Lead Manager i.e., Elara Capital (India) Private Limited at www.elaracapital.com . Investors should note that investment in equity shares involves a high degree of risk and for details relating to the same, please see the section titled “Risk Factors” of the aforementioned offer document.
SMC Global Securities Ltd. (hereinafter referred to as “SMC”) is a registered Member of National Stock Exchange of India Limited, Bombay Stock Exchange Limited and its associate is member of MCX stock Exchange Limited. It is also registered as a Depository Participant with CDSL and NSDL. Its associates merchant banker and Portfolio Manager are registered with SEBI and NBFC registered with RBI. It also has registration with AMFI as a Mutual Fund Distributor.
SMC has applied with SEBI for registering as a Research Entity in terms of SEBI (Research Analyst) Regulations, 2014. SMC or its associates has not been debarred/ suspended by SEBI or any other regulatory authority for accessing /dealing in securities Market.
SMC or its associates including its relatives/analyst do not hold any financial interest/beneficial ownership of more than 1% in the company covered by Analyst. SMC or its associates and relatives does not have any material conflict of interest. SMC or its associates/analyst has not received any compensation from the company covered by Analyst during the past twelve months. The subject company has not been a client of SMC during the past twelve months. SMC or its associates has not received any compensation or other benefits from the company covered by analyst or third party in connection with the research report. The Analyst has not served as an officer, director or employee of company covered by Analyst and SMC has not been engaged in market making activity of the company covered by Analyst.
The views expressed are based solely on information available publicly available/internal data/ other reliable sources believed to be true.
SMC does not represent/ provide any warranty express or implied to the accuracy, contents or views expressed herein and investors are advised to independently evaluate the market conditions/risks involved before making any investment decision.
NEWS
DOMESTIC NEWSEconomy• India's Consumer Price Index (CPI) inflation for the month of May rose
shockingly to 5.76% versus 5.47% (revised) in April. Food inflation rose to 7.55% versus 6.40% in April.
• India's wholesale price inflation rose slightly in May. Wholesale prices increased 0.79 percent year-on-year in May, faster than the 0.34 percent growth seen in April and 0.5 percent rise forecast by economists. This was the second consecutive rise in prices.
Capital Goods• Ujaas Energy has received an order for “Designing, Engineering,
Procurement & Supply, Construction & Erection, Testing & Commissioning and Comprehensive Operation & Maintenance for 10 years of 3MW (AC) Solar PV Power Plant on Turnkey Basis” at Aligarh Muslim University, Firdaus Nagar, Aligarh, Uttar Pradesh, at a price of ̀ 20.66 crore.
• Alstom T&D India has been awarded two contracts worth over `202 crore from Power Grid Corporation of India for execution of projects in Madhya Pradesh. Both the projects will facilitate evacuation of power and add to availability of electricity in the central region.
• BHEL has commissioned another 195 MW unit at Muzafferpur thermal power station in Bihar. This is the second 195 MW unit to be commissioned by BHEL at the 2x195 MW Muzaffarpur Thermal Power Station Stage-II of Kanti Bijlee Utpadan Nigam Limited (KBUNL), a joint venture of NTPC and BSPGCL.
• A2Z Infra Engineering won a $13.56 million (around ̀ 90 crore) contract from Nepal government for expansion of electricity distribution network.
Entertainment• Inox Leisure has entered into ticketing agreement with One97 Communications
which is the owner of the website www.paytm.com, Paytm mobile applications, Paytm IVR, Paytm WAP site, etc. (Collectively referred to as 'Paytm') for promotions, marketing and listing of its movie/ event tickets inventory and related products and services on the Paytm Marketplace.
Power• NTPC Ltd and Coal India Limited have formed a joint venture company,
Hindustan Urvarak & Rasayn Limited, with 50:50 shareholding for the revival of Gorakhpur (Uttar Pradesh) and Sindri (Jharkhand) plants of Fertilizer Corporation of India Ltd. The JV will set up ammonia urea plants at both the sites. Last month, NTPC and Coal India (CIL) had signed an agreement for setting up a joint venture firm to revive Sindhri and Gorakhpur fertilizer plants, which will together produce 1.27 million tonnes of urea per annum.
Healthcare• Zydus Cadila and Eczacibasi, a Turkish Healthcare Company have signed a
strategic collaboration agreement to market biotech products in the Turkish market. The agreement involves the import of biosimilars which are currently unavailable in the country especially for the treatment of cancer and also paves the way for a long term strategic collaboration to produce and launch new products in the market.
Retail• V-Mart Retail has opened a new store located at Dakhinakali Road,
Dhenkanal, Odisha. This is the 7th store in the State of Odisha across 7 cities. With this, total number of stores has increased to 127 stores in 110 cities with total area of approx. 10.52 lakh sq. ft.
INTERNATIONAL NEWS• US consumer price index edged up by 0.2 percent in May after climbing by 0.4
percent in April. Economists had expected prices to rise by 0.3 percent. The uptick in consumer prices was partly due to a continued increase in energy prices, which jumped by 1.2 percent in May after spiking by 3.4 percent in April.
• US initial jobless claims rose to 277,000, an increase of 13,000 from the previous week's unrevised level of 264,000. Economists had expected jobless claims to edge up to 270,000. With the bigger than expected increase, jobless claims rebounded after falling to their lowest level in over a month in the previous week.
• US industrial production fell by 0.4 percent in May after climbing by a downwardly revised 0.6 percent in April. Production had been expected to edge down by 0.1 percent compared to the 0.7 percent increase originally reported for the previous month.
• US producer price index climbed by 0.4 percent in May after edging up by 0.2 percent in April. Economists had expected prices to rise by 0.3 percent. The bigger than expected increase in producer prices was partly due to the jump in energy prices, which surged up by 2.8 percent in May. Gasoline prices spiked by 6.6 percent.
• US import prices jumped by 1.4 percent in May after climbing by an upwardly revised 0.7 percent in April. Economists had expected import prices to rise by 0.8 percent compared to the 0.3 percent increase originally reported for the previous month.
• U.K. retail sales increased more than expected in May on clothing and footwear sales. The retail sales volume advanced 0.9 percent in May from the prior month, faster than the expected increase of 0.2 percent. Nonetheless, the pace of growth slowed from 1.9 percent registered in April.
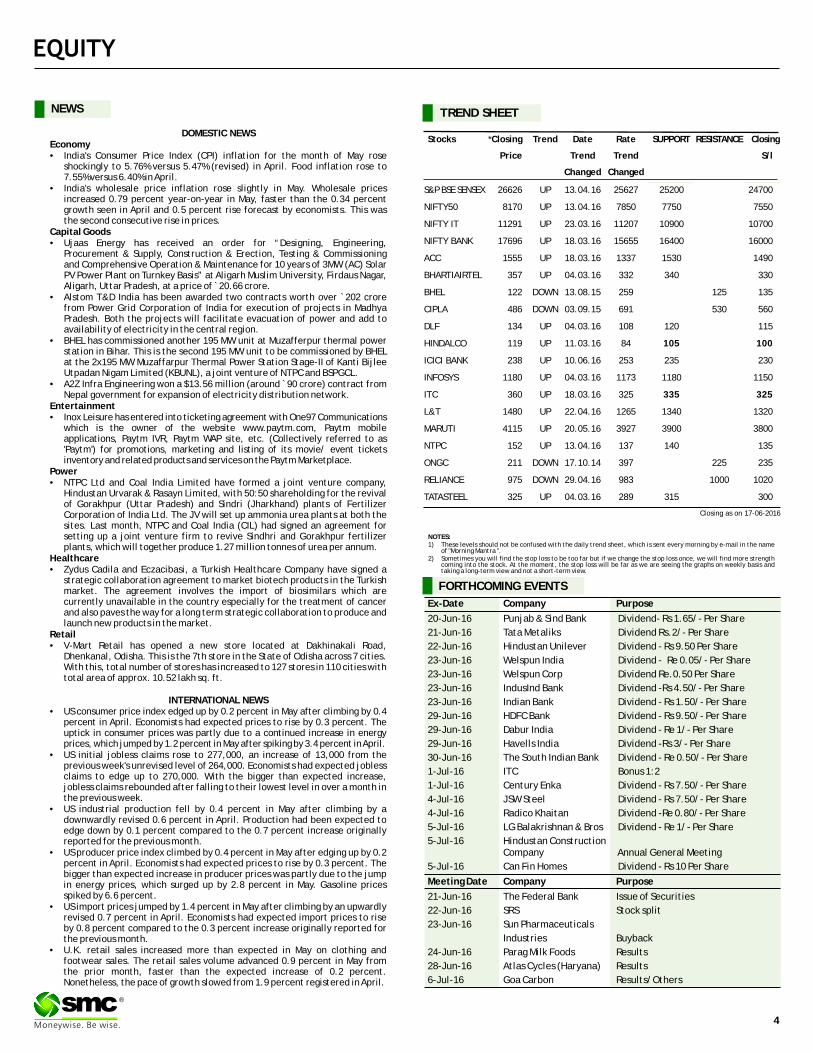
Ex-Date Company Purpose
20-Jun-16 Punjab & Sind Bank Dividend- Rs 1.65/- Per Share
21-Jun-16 Tata Metaliks Dividend Rs.2/- Per Share
22-Jun-16 Hindustan Unilever Dividend - Rs 9.50 Per Share
23-Jun-16 Welspun India Dividend - Re 0.05/- Per Share
23-Jun-16 Welspun Corp Dividend Re.0.50 Per Share
23-Jun-16 IndusInd Bank Dividend -Rs 4.50/- Per Share
23-Jun-16 Indian Bank Dividend - Rs 1.50/- Per Share
29-Jun-16 HDFC Bank Dividend - Rs 9.50/- Per Share
29-Jun-16 Dabur India Dividend - Re 1/- Per Share
29-Jun-16 Havells India Dividend -Rs 3/- Per Share
30-Jun-16 The South Indian Bank Dividend - Re 0.50/- Per Share
1-Jul-16 ITC Bonus 1:2
1-Jul-16 Century Enka Dividend - Rs 7.50/- Per Share
4-Jul-16 JSW Steel Dividend - Rs 7.50/- Per Share
4-Jul-16 Radico Khaitan Dividend -Re 0.80/- Per Share
5-Jul-16 LG Balakrishnan & Bros Dividend - Re 1/- Per Share
5-Jul-16 Hindustan ConstructionCompany Annual General Meeting
5-Jul-16 Can Fin Homes Dividend - Rs 10 Per Share
Meeting Date Company Purpose
21-Jun-16 The Federal Bank Issue of Securities
22-Jun-16 SRS Stock split
23-Jun-16 Sun Pharmaceuticals
Industries Buyback
24-Jun-16 Parag Milk Foods Results
28-Jun-16 Atlas Cycles (Haryana) Results
6-Jul-16 Goa Carbon Results/Others
FORTHCOMING EVENTS
NOTES:1) These levels should not be confused with the daily trend sheet, which is sent every morning by e-mail in the name
of "Morning Mantra ".2) Sometimes you will find the stop loss to be too far but if we change the stop loss once, we will find more strength
coming into the stock. At the moment, the stop loss will be far as we are seeing the graphs on weekly basis and taking a long-term view and not a short-term view.
TREND SHEET
Stocks *Closing Trend Date Rate SUPPORT RESISTANCE Closing
Price Trend Trend
Changed Changed
S&P BSE SENSEX 26626 UP 13.04.16 25627 25200 24700
NIFTY50 8170 UP 13.04.16 7850 7750 7550
NIFTY IT 11291 UP 23.03.16 11207 10900 10700
NIFTY BANK 17696 UP 18.03.16 15655 16400 16000
ACC 1555 UP 18.03.16 1337 1530 1490
BHARTIAIRTEL 357 UP 04.03.16 332 340 330
BHEL 122 DOWN 13.08.15 259 125 135
CIPLA 486 DOWN 03.09.15 691 530 560
DLF 134 UP 04.03.16 108 120 115
HINDALCO 119 UP 11.03.16 84 105 100
ICICI BANK 238 UP 10.06.16 253 235 230
INFOSYS 1180 UP 04.03.16 1173 1180 1150
ITC 360 UP 18.03.16 325 335 325
L&T 1480 UP 22.04.16 1265 1340 1320
MARUTI 4115 UP 20.05.16 3927 3900 3800
NTPC 152 UP 13.04.16 137 140 135
ONGC 211 DOWN 17.10.14 397 225 235
RELIANCE 975 DOWN 29.04.16 983 1000 1020
TATASTEEL 325 UP 04.03.16 289 315 300
S/l
4
®
Closing as on 17-06-2016
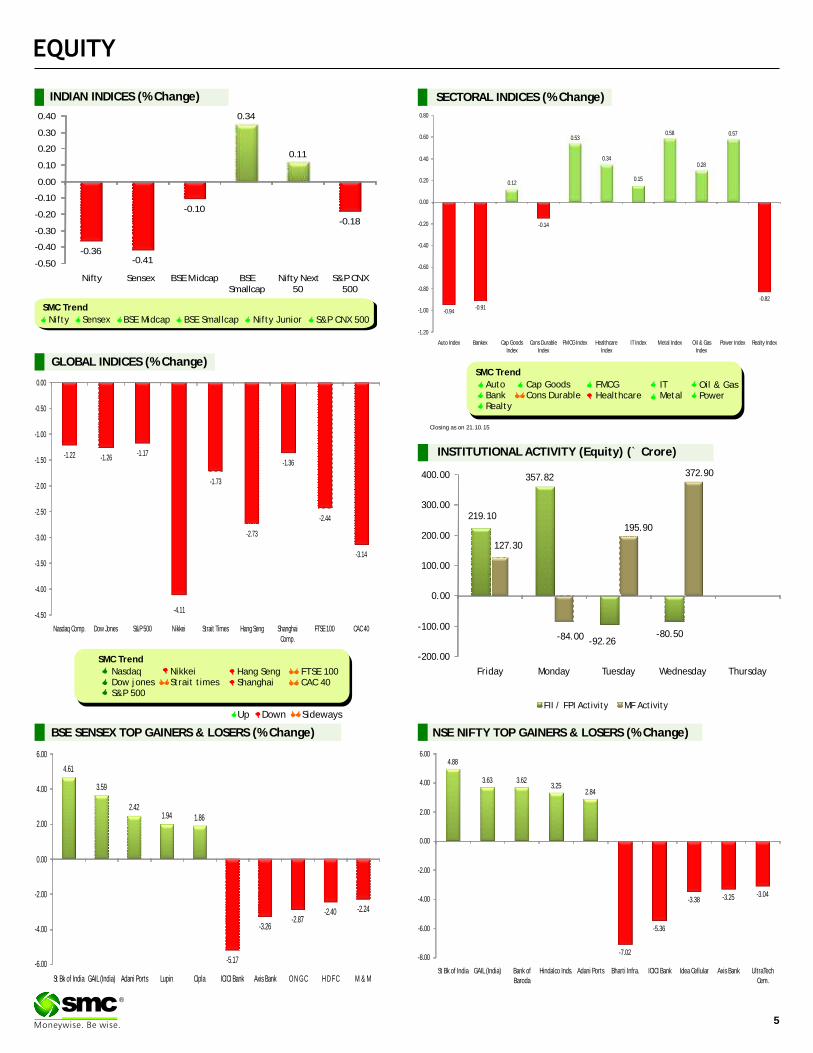
BSE SENSEX GAINERS & LOSERS TOP (% Change) NSE NIFTY GAINERS TOP & LOSERS (% Change)
SECTORAL INDICES (% Change)
SMC Trend
FMCGHealthcare
Auto BankRealty
Cap GoodsCons Durable
Oil & GasPower
ITMetal
Down SidewaysUp
GLOBAL INDICES (% Change)
INDIAN INDICES (% Change)
5
®
SMC Trend
Nifty Sensex BSE Midcap BSE Smallcap Nifty Junior S&P CNX 500
SMC Trend
FTSE 100CAC 40
NasdaqDow jonesS&P 500
NikkeiStrait times
Hang SengShanghai
219.10
357.82
-92.26-80.50
127.30
-84.00
195.90
372.90
-200.00
-100.00
0.00
100.00
200.00
300.00
400.00
Friday Monday Tuesday Wednesday Thursday
FII / FPI Activity MF Activity
4.88
3.63 3.623.25
2.84
-7.02
-5.36
-3.38 -3.25 -3.04
-8.00
-6.00
-4.00
-2.00
0.00
2.00
4.00
6.00
St Bk of India GAIL (India) Bank of Baroda
Hindalco Inds. Adani Ports Bharti Infra. ICICI Bank Idea Cellular Axis Bank UltraTech Cem.
4.61
3.59
2.421.94 1.86
-5.17
-3.26-2.87
-2.40 -2.24
-6.00
-4.00
-2.00
0.00
2.00
4.00
6.00
St Bk of India GAIL (India) Adani Ports Lupin Cipla ICICI Bank Axis Bank O N G C H D F C M & M
0.34
0.11
-0.36-0.41
-0.10
-0.18
-0.50
-0.40
-0.30
-0.20
-0.10
0.00
0.10
0.20
0.30
0.40
Nifty Sensex BSE Midcap BSE Smallcap
Nifty Next 50
S&P CNX 500
0.12
0.53
0.34
0.15
0.58
0.28
0.57
-0.94-0.91
-0.14
-0.82
-1.20
-1.00
-0.80
-0.60
-0.40
-0.20
0.00
0.20
0.40
0.60
0.80
Auto Index Bankex Cap Goods Index
Cons Durable Index
FMCG Index Healthcare Index
IT Index Metal Index Oil & Gas Index
Power Index Realty Index
-1.22 -1.26-1.17
-4.11
-1.73
-2.73
-1.36
-2.44
-3.14
-4.50
-4.00
-3.50
-3.00
-2.50
-2.00
-1.50
-1.00
-0.50
0.00
Nasdaq Comp. Dow Jones S&P 500 Nikkei Strait Times Hang Seng Shanghai Comp.
FTSE 100 CAC 40
INSTITUTIONAL ACTIVITY (Equity) (` Crore)
Closing as on 21.10.15
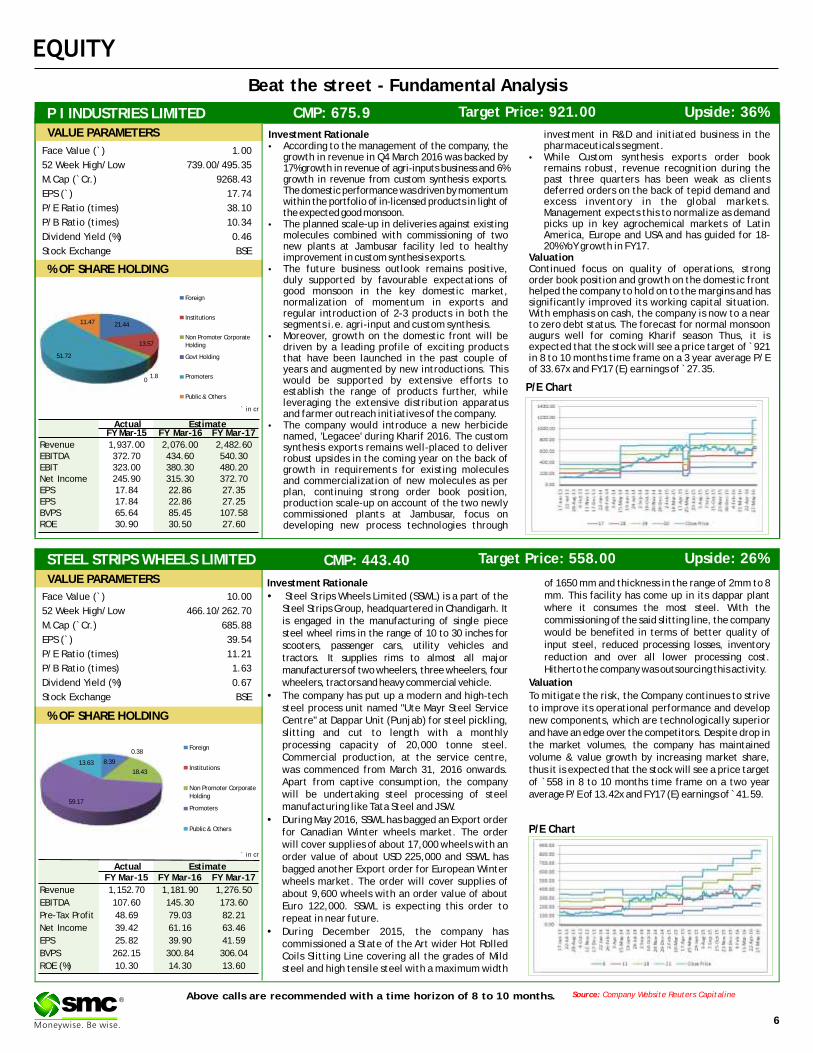
Beat the street - Fundamental Analysis
Above calls are recommended with a time horizon of 8 to 10 months. Source: Company Website Reuters Capitaline
6
®
STEEL STRIPS WHEELS LIMITED CMP: 443.40 Upside: 26%Target Price: 558.00
Investment Rationale of 1650 mm and thickness in the range of 2mm to 8 mm. This facility has come up in its dappar plant �Steel Strips Wheels Limited (SSWL) is a part of the where it consumes the most steel. With the Steel Strips Group, headquartered in Chandigarh. It commissioning of the said slitting line, the company is engaged in the manufacturing of single piece would be benefited in terms of better quality of steel wheel rims in the range of 10 to 30 inches for input steel, reduced processing losses, inventory scooters, passenger cars, utility vehicles and reduction and over all lower processing cost. tractors. It supplies rims to almost all major Hitherto the company was outsourcing this activity.manufacturers of two wheelers, three wheelers, four
wheelers, tractors and heavy commercial vehicle. Valuation
�The company has put up a modern and high-tech To mitigate the risk, the Company continues to strive steel process unit named "Ute Mayr Steel Service to improve its operational performance and develop Centre" at Dappar Unit (Punjab) for steel pickling, new components, which are technologically superior slitting and cut to length with a monthly and have an edge over the competitors. Despite drop in processing capacity of 20,000 tonne steel. the market volumes, the company has maintained Commercial production, at the service centre, volume & value growth by increasing market share, was commenced from March 31, 2016 onwards. thus it is expected that the stock will see a price target Apart from captive consumption, the company of `558 in 8 to 10 months time frame on a two year will be undertaking steel processing of steel average P/E of 13.42x and FY17 (E) earnings of ̀ 41.59.manufacturing like Tata Steel and JSW.
�During May 2016, SSWL has bagged an Export order for Canadian Winter wheels market. The order will cover supplies of about 17,000 wheels with an order value of about USD 225,000 and SSWL has bagged another Export order for European Winter wheels market. The order will cover supplies of about 9,600 wheels with an order value of about Euro 122,000. SSWL is expecting this order to repeat in near future.
�During December 2015, the company has commissioned a State of the Art wider Hot Rolled Coils Slitting Line covering all the grades of Mild steel and high tensile steel with a maximum width
Face Value (`) 10.00
52 Week High/Low 466.10/262.70
M.Cap (`Cr.) 685.88
EPS (`) 39.54
P/E Ratio (times) 11.21
P/B Ratio (times) 1.63
Dividend Yield (%) 0.67
Stock Exchange BSE
% OF SHARE HOLDING
P/E Chart
` in cr
Actual EstimateFY Mar-15 FY Mar-16 FY Mar-17
Revenue 1,152.70 1,181.90 1,276.50
EBITDA 107.60 145.30 173.60
Pre-Tax Profit 48.69 79.03 82.21
Net Income 39.42 61.16 63.46
EPS 25.82 39.90 41.59
BVPS 262.15 300.84 306.04
ROE (%) 10.30 14.30 13.60
VALUE PARAMETERS
Investment Rationale investment in R&D and initiated business in the •According to the management of the company, the pharmaceuticals segment.
growth in revenue in Q4 March 2016 was backed by •While Custom synthesis exports order book 17% growth in revenue of agri-inputs business and 6% remains robust, revenue recognition during the growth in revenue from custom synthesis exports. past three quarters has been weak as clients The domestic performance was driven by momentum deferred orders on the back of tepid demand and within the portfolio of in-licensed products in light of excess inventory in the global markets. the expected good monsoon. Management expects this to normalize as demand
•The planned scale-up in deliveries against existing picks up in key agrochemical markets of Latin molecules combined with commissioning of two America, Europe and USA and has guided for 18-new plants at Jambusar facility led to healthy 20% YoY growth in FY17.improvement in custom synthesis exports. Valuation
•The future business outlook remains positive, Continued focus on quality of operations, strong duly supported by favourable expectations of order book position and growth on the domestic front good monsoon in the key domestic market, helped the company to hold on to the margins and has normalization of momentum in exports and significantly improved its working capital situation. regular introduction of 2-3 products in both the With emphasis on cash, the company is now to a near segments i.e. agri-input and custom synthesis. to zero debt status. The forecast for normal monsoon
•Moreover, growth on the domestic front will be augurs well for coming Kharif season Thus, it is driven by a leading profile of exciting products expected that the stock will see a price target of ̀ 921 that have been launched in the past couple of in 8 to 10 months time frame on a 3 year average P/E years and augmented by new introductions. This of 33.67x and FY17 (E) earnings of ̀ 27.35.would be supported by extensive efforts to establish the range of products further, while leveraging the extensive distribution apparatus and farmer outreach initiatives of the company.
•The company would introduce a new herbicide named, 'Legacee' during Kharif 2016. The custom synthesis exports remains well-placed to deliver robust upsides in the coming year on the back of growth in requirements for existing molecules and commercialization of new molecules as per plan, continuing strong order book position, production scale-up on account of the two newly commissioned plants at Jambusar, focus on developing new process technologies through
P/E Chart
P I INDUSTRIES LIMITED CMP: 675.9 Upside: 36%Target Price: 921.00
Face Value (`) 1.00
52 Week High/Low 739.00/495.35
M.Cap (`Cr.) 9268.43
EPS (`) 17.74
P/E Ratio (times) 38.10
P/B Ratio (times) 10.34
Dividend Yield (%) 0.46
Stock Exchange BSE
` in cr
% OF SHARE HOLDING
VALUE PARAMETERS
Actual EstimateFY Mar-15 FY Mar-16 FY Mar-17
Revenue 1,937.00 2,076.00 2,482.60EBITDA 372.70 434.60 540.30EBIT 323.00 380.30 480.20Net Income 245.90 315.30 372.70EPS 17.84 22.86 27.35EPS 17.84 22.86 27.25BVPS 65.64 85.45 107.58ROE 30.90 30.50 27.60
8.39
0.38
18.43
59.17
13.63
Foreign
Institutions
Non Promoter Corporate Holding
Promoters
Public & Others
21.44
13.57
1.80
51.72
11.47
Foreign
Institutions
Non Promoter Corporate Holding
Govt Holding
Promoters
Public & Others
Charts by Spider Software India Ltd
7
EQUITY
Above calls are recommended with a time horizon of 1-2 months
Disclaimer : The analyst and its affiliates companies make no representation or warranty in relation to the accuracy, completeness or reliability of the information contained in its research. The analysis contained in the analyst research is based on numerous assumptions. Different assumptions could result in materially different results.The analyst, not any of its affiliated companies, not any of their members, directors, employees or agents accepts any liability for any loss or damage arising out of the use of all or any part of the analysis research.
SOURCE: CAPITAL LINE
®
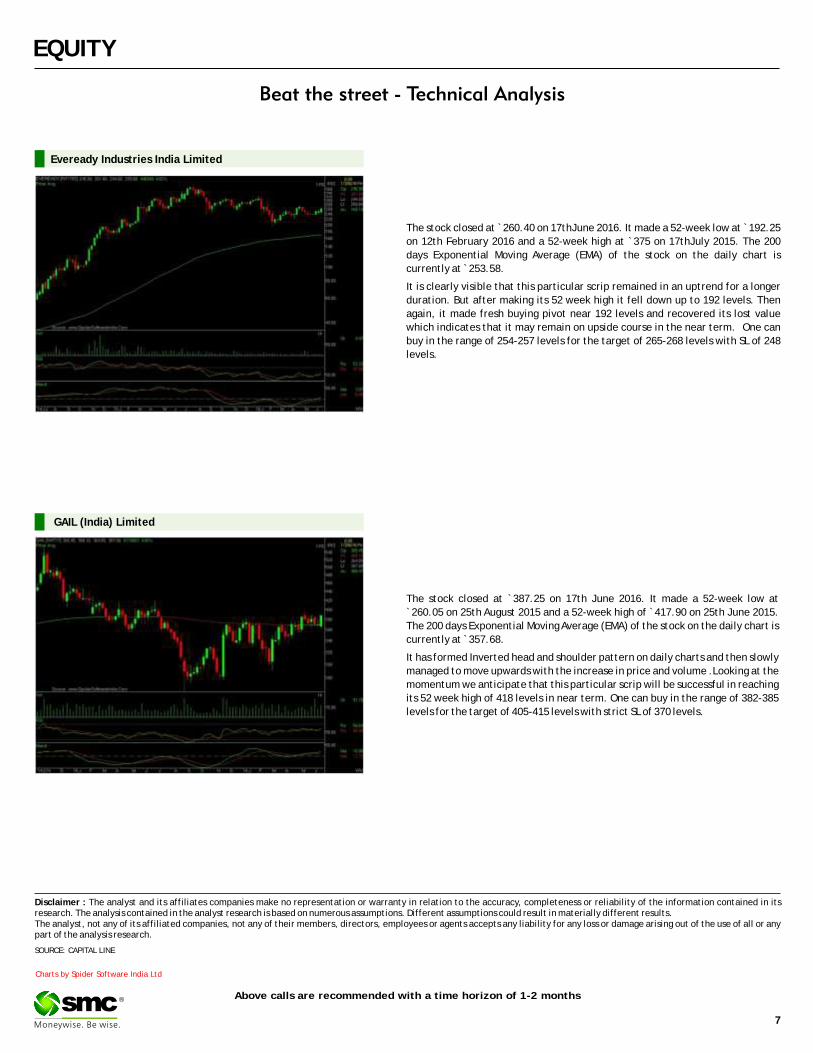
The stock closed at ̀ 260.40 on 17thJune 2016. It made a 52-week low at ̀ 192.25
on 12th February 2016 and a 52-week high at `375 on 17thJuly 2015. The 200
days Exponential Moving Average (EMA) of the stock on the daily chart is
currently at ̀ 253.58.
It is clearly visible that this particular scrip remained in an uptrend for a longer
duration. But after making its 52 week high it fell down up to 192 levels. Then
again, it made fresh buying pivot near 192 levels and recovered its lost value
which indicates that it may remain on upside course in the near term. One can
buy in the range of 254-257 levels for the target of 265-268 levels with SL of 248
levels.
Eveready Industries India Limited
The stock closed at `387.25 on 17th June 2016. It made a 52-week low at
`260.05 on 25th August 2015 and a 52-week high of `417.90 on 25th June 2015.
The 200 days Exponential Moving Average (EMA) of the stock on the daily chart is
currently at ̀ 357.68.
It has formed Inverted head and shoulder pattern on daily charts and then slowly
managed to move upwards with the increase in price and volume .Looking at the
momentum we anticipate that this particular scrip will be successful in reaching
its 52 week high of 418 levels in near term. One can buy in the range of 382-385
levels for the target of 405-415 levels with strict SL of 370 levels.
GAIL (India) Limited
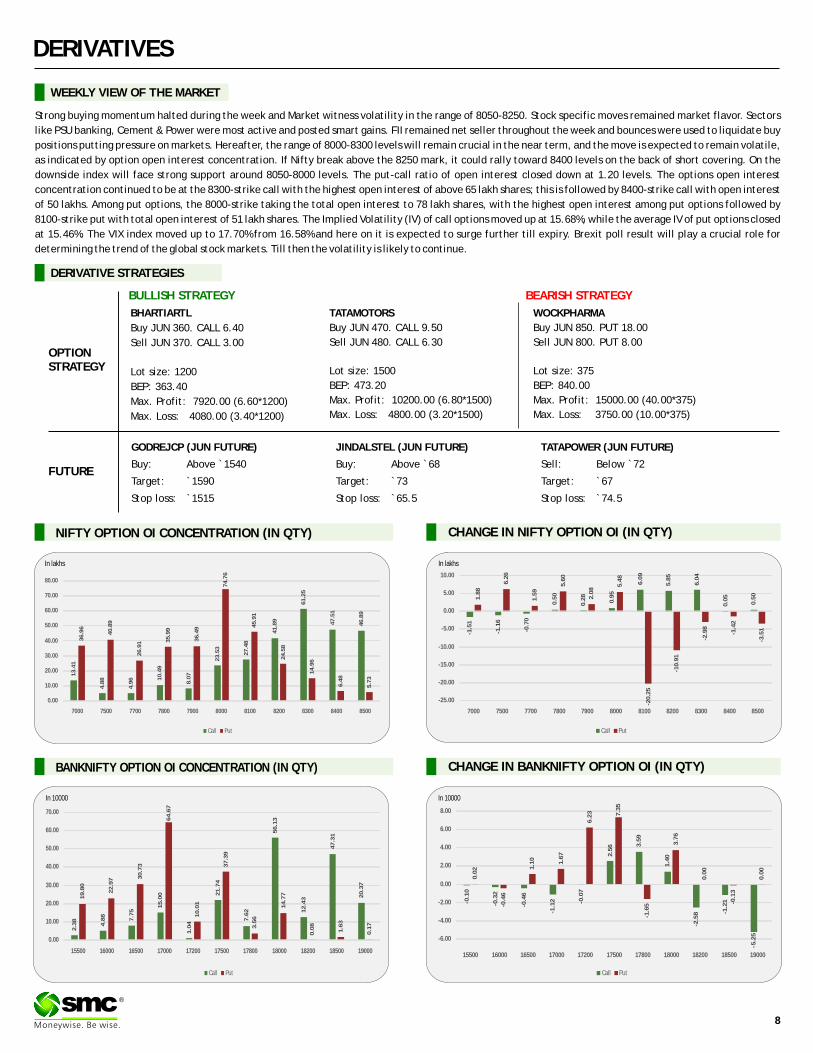
DERIVATIVES
CHANGE IN NIFTY OPTION OI (IN QTY)
WEEKLY VIEW OF THE MARKET
NIFTY OPTION OI CONCENTRATION (IN QTY)
CHANGE IN BANKNIFTY OPTION OI (IN QTY)BANKNIFTY OPTION OI CONCENTRATION (IN QTY)
®
Strong buying momentum halted during the week and Market witness volatility in the range of 8050-8250. Stock specific moves remained market flavor. Sectors
like PSU banking, Cement & Power were most active and posted smart gains. FII remained net seller throughout the week and bounces were used to liquidate buy
positions putting pressure on markets. Hereafter, the range of 8000-8300 levels will remain crucial in the near term, and the move is expected to remain volatile,
as indicated by option open interest concentration. If Nifty break above the 8250 mark, it could rally toward 8400 levels on the back of short covering. On the
downside index will face strong support around 8050-8000 levels. The put-call ratio of open interest closed down at 1.20 levels. The options open interest
concentration continued to be at the 8300-strike call with the highest open interest of above 65 lakh shares; this is followed by 8400-strike call with open interest
of 50 lakhs. Among put options, the 8000-strike taking the total open interest to 78 lakh shares, with the highest open interest among put options followed by
8100-strike put with total open interest of 51 lakh shares. The Implied Volatility (IV) of call options moved up at 15.68%, while the average IV of put options closed
at 15.46%. The VIX index moved up to 17.70% from 16.58% and here on it is expected to surge further till expiry. Brexit poll result will play a crucial role for
determining the trend of the global stock markets. Till then the volatility is likely to continue.
In lakhs
In 10000 In 10000
GODREJCP (JUN FUTURE)
Buy: Above `1540
Target: `1590
Stop loss: `1515
WOCKPHARMA
Buy JUN 850. PUT 18.00
Sell JUN 800. PUT 8.00
Lot size: 375
BEP: 840.00
Max. Profit: 15000.00 (40.00*375)
Max. Loss: 3750.00 (10.00*375)
OPTIONSTRATEGY
FUTURE
BHARTIARTL
Buy JUN 360. CALL 6.40
Sell JUN 370. CALL 3.00
Lot size: 1200
BEP: 363.40
Max. Profit: 7920.00 (6.60*1200)
Max. Loss: 4080.00 (3.40*1200)
TATAMOTORS
Buy JUN 470. CALL 9.50
Sell JUN 480. CALL 6.30
Lot size: 1500
BEP: 473.20
Max. Profit: 10200.00 (6.80*1500)
Max. Loss: 4800.00 (3.20*1500)
DERIVATIVE STRATEGIES
JINDALSTEL (JUN FUTURE)
Buy: Above `68
Target: `73
Stop loss: `65.5
TATAPOWER (JUN FUTURE)
Sell: Below `72
Target: `67
Stop loss: `74.5
BULLISH STRATEGY BEARISH STRATEGY
Call Put
13
.41
4.8
8
4.9
6 10
.49
8.0
7
23
.53
27
.48
41
.89
61
.25
47
.51
46
.89
36
.96
40
.89
26
.91 3
5.9
9
36
.49
74
.76
45
.91
24
.58
14
.96
6.4
8
5.7
3
0.00
10.00
20.00
30.00
40.00
50.00
60.00
70.00
80.00
7000 7500 7700 7800 7900 8000 8100 8200 8300 8400 8500
Call Put
-1.5
1
-1.1
6
-0.7
0
0.5
0
0.2
8
0.9
5
6.0
9
5.8
5
6.0
4
0.0
5
0.5
0
1.8
8
6.2
6
1.5
9
5.6
0
2.0
8
5.4
8
-20
.25
-10
.91
-2.9
8
-1.4
2
-3.5
1
-25.00
-20.00
-15.00
-10.00
-5.00
0.00
5.00
10.00
7000 7500 7700 7800 7900 8000 8100 8200 8300 8400 8500
Call Put
2.3
8
4.8
8
7.7
5
15
.00
1.0
4
21
.74
7.6
2
56
.13
12
.43
47
.31
20
.37
19
.80
22
.97 3
0.7
3
64
.67
10
.01
37
.39
3.5
6
14
.77
0.0
8
1.6
3
0.1
7
0.00
10.00
20.00
30.00
40.00
50.00
60.00
70.00
15500 16000 16500 17000 17200 17500 17800 18000 18200 18500 19000
Call Put
-0.1
0
-0.3
2
-0.4
6
-1.1
2 -0.0
7
2.5
6 3.5
9
1.4
0
-2.5
8 -1.2
1
-5.2
5
0.0
2
-0.4
6
1.1
0
1.6
7
6.2
3 7.3
5
-1.6
5
3.7
6
0.0
0
-0.1
3
0.0
0
-6.00
-4.00
-2.00
0.00
2.00
4.00
6.00
8.00
15500 16000 16500 17000 17200 17500 17800 18000 18200 18500 19000
8
In lakhs
9
DERIVATIVES
®
FII’s ACTIVITY IN DERIVATIVE SEGMENT
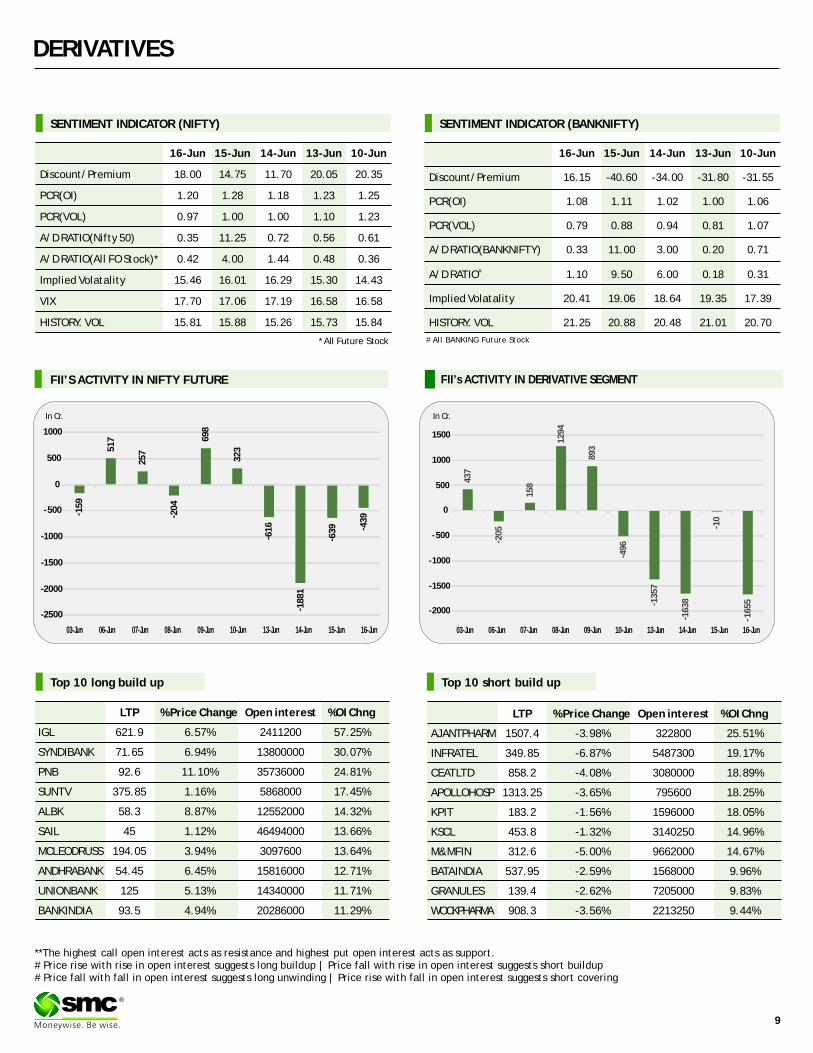
SENTIMENT INDICATOR (NIFTY)
16-Jun 15-Jun 14-Jun 13-Jun 10-Jun
Discount/Premium 18.00 14.75 11.70 20.05 20.35
PCR(OI) 1.20 1.28 1.18 1.23 1.25
PCR(VOL) 0.97 1.00 1.00 1.10 1.23
A/D RATIO(Nifty 50) 0.35 11.25 0.72 0.56 0.61
A/D RATIO(All FO Stock)* 0.42 4.00 1.44 0.48 0.36
Implied Volatality 15.46 16.01 16.29 15.30 14.43
VIX 17.70 17.06 17.19 16.58 16.58
HISTORY. VOL 15.81 15.88 15.26 15.73 15.84
*All Future Stock
SENTIMENT INDICATOR (BANKNIFTY)
16-Jun 15-Jun 14-Jun 13-Jun 10-Jun
Discount/Premium 16.15 -40.60 -34.00 -31.80 -31.55
PCR(OI) 1.08 1.11 1.02 1.00 1.06
PCR(VOL) 0.79 0.88 0.94 0.81 1.07
A/D RATIO(BANKNIFTY) 0.33 11.00 3.00 0.20 0.71
#A/D RATIO 1.10 9.50 6.00 0.18 0.31
Implied Volatality 20.41 19.06 18.64 19.35 17.39
HISTORY. VOL 21.25 20.88 20.48 21.01 20.70
FII’S ACTIVITY IN NIFTY FUTURE
**The highest call open interest acts as resistance and highest put open interest acts as support.# Price rise with rise in open interest suggests long buildup | Price fall with rise in open interest suggests short buildup # Price fall with fall in open interest suggests long unwinding | Price rise with fall in open interest suggests short covering
# All BANKING Future Stock
Top 10 short build up
In Cr. In Cr.
Top 10 long build up
LTP % Price Change Open interest %OI Chng
IGL 621.9 6.57% 2411200 57.25%
SYNDIBANK 71.65 6.94% 13800000 30.07%
PNB 92.6 11.10% 35736000 24.81%
SUNTV 375.85 1.16% 5868000 17.45%
ALBK 58.3 8.87% 12552000 14.32%
SAIL 45 1.12% 46494000 13.66%
MCLEODRUSS 194.05 3.94% 3097600 13.64%
ANDHRABANK 54.45 6.45% 15816000 12.71%
UNIONBANK 125 5.13% 14340000 11.71%
BANKINDIA 93.5 4.94% 20286000 11.29%
LTP % Price Change Open interest %OI Chng
AJANTPHARM 1507.4 -3.98% 322800 25.51%
INFRATEL 349.85 -6.87% 5487300 19.17%
CEATLTD 858.2 -4.08% 3080000 18.89%
APOLLOHOSP 1313.25 -3.65% 795600 18.25%
KPIT 183.2 -1.56% 1596000 18.05%
KSCL 453.8 -1.32% 3140250 14.96%
M&MFIN 312.6 -5.00% 9662000 14.67%
BATAINDIA 537.95 -2.59% 1568000 9.96%
GRANULES 139.4 -2.62% 7205000 9.83%
WOCKPHARMA 908.3 -3.56% 2213250 9.44%
- 15
9
51
7
25
7
- 20
4
69
8
32
3
- 61
6
- 18
81
- 63
9 - 43
9
-2500
-2000
-1500
-1000
-500
0
500
1000
03-Jun 06-Jun 07-Jun 08-Jun 09-Jun 10-Jun 13-Jun 14-Jun 15-Jun 16-Jun
43
7
- 20
5
15
8
12
94
89
3
- 49
6
- 13
57
- 16
38
- 10
- 16
55
-2000
-1500
-1000
- 500
0
500
1000
1500
03-Jun 06-Jun 07-Jun 08-Jun 09-Jun 10-Jun 13-Jun 14-Jun 15-Jun 16-Jun
10
®
Turmeric futures (July) may continue to remain trapped in the range of 7900-8250 levels. Spot turmeric prices are decreasing at Erode markets due to lack of demand. Till date, no fresh demand was received by the traders, and in days to come, the demand scenario is likely to diminish as the stocks are sufficient to cater any incremental demand. The buyers are refrained from any major buying as they anticipate turmeric prices to rule around these levels in the near term and they can source the yellow spice any time at these rates. Cardamom futures (July) is expected to trade in the range of 850-900 levels with an upside bias. Currently, the demand is high for the aromatic capsules in the upcountry markets as the stockists are covering for their future requirements. It is estimated that by mid-July the inventories would be exhausted and that in turn would create a shortage, before the arrivals of the new crop. The market participants are expecting that the next crop would arrive only by August end and it is likely to be comparatively lower than that of the current season. Jeera futures (July) can rise for the third consecutive week & test 18000 levels as demand is outpacing supplies. Arrival of Cumin in market is declining in the spot market gradually mainly due to lower crop this season and farmer's engagement with kharif crop cultivation. Coriander futures (July) is likely to trade with a negative bias & face resistance near 7020 levels. In the current scenario, no fresh stocking activities are being noticed in the spot markets as demand from major consumption regions are sluggish is as per need basis.
SPICES
The consolidation phase with a downside bias is likely to persist in soybean futures (July) and in days to come, it may trade in the range of 3800-3950 levels. At the spot markets, soybean prices are trading down in Madhya Pradesh and Maharashtra due to inconsistent demand for soybean meal, which has declined nearly `5,000 per tonne in last 2 months. However, the one factor of farmers reducing their sowing area under soybean by 10-20% is due to shortage of certified seeds and this may give some support to the counter. Mustard futures (July) is likely to witness some correction due to profit booking & can move down towards 4600 levels owing to disparity in crushing. The prices of by products such as mustard oil/mustard oilcake have not risen as compared to mustard seed prices & the crushing disparity has risen to `3,944 per tonne against `2,650-2,750 averaged last 15 days. An extended downtrend can be seen in refined soy oil futures (July) as it will possibly slip towards 625-620 levels. The sentiments of the international market are bearish as soy oil prices are trading lower on CBOT & at home there is the highest stock of vegetable Oils at port and pipeline and demand is reduced due to summer. The bearishness in CPO futures (July) may continue & can test 490-480 levels in near term. Malaysian palm oil futures at 2,426 ringgit have hit a five-month low as the export demand is now a question mark. Recently, Malaysia has raised the export tax on crude palm oil to 6%for the month of July, which may dent the purchase of importing countries.
OIL AND OILSEEDS
OTHER COMMODITIES
Mentha oil futures (June) is closing lower for the seventh consecutive week due to lack of demand and increasing supply of new crop. The downside may extend further & can test 800 levels in the near term. Mentha oil supply has just begun in the spot markets and arrivals pace is likely to remain strong, which may cap any rise in the near term. Kapas futures (April) is expected to trade with a positive bias in the range of 900-940 levels, supported by information of reduced area of cultivation in the ongoing sowing season. The facts are showing a considerable fall in cotton acreage in the ongoing kharif season in all of the major growing states such as Punjab, Haryana and Rajasthan as compared to the previous year. It is cited by the Cotton Association of India that the cotton planting in the country is likely to fall to the lowest in seven years in the 2016-17 marketing season. This season the farmers are opting to plant pulses and peanuts, also known as ground nuts. In days to come, an upside momentum is not likely to be seen Sugar futures (July) despite of international sugar prices quoting nearing the highest level in more than 2-1/2 years. The counter will possibly trade sideways to down & test 3520 levels. The reason being is that the government imposed 20% duty on export of raw, white and refined sugar to rein in local sugar prices that shot up to a three-and-a-half-year high earlier this month. According to trade estimates, around 20,000 tonnes of sugar contracted for export is likely to be in dilemma after this decision.
Bullion counter is expected to a witness volatile movement as the crucial referendum on Britain exit from Euro zone will take place this week on 23 June. Gold will rally, if Britons choose to exit the EU and may drop sharply lower if they continue to stay in euro zone. Meanwhile SPDR gold trust holdings and physical demand will also give further direction to the prices. Recently increase in investment demand has supported its prices. Meanwhile, local currency rupee can also affect the prices, which can move in the range of 66-68 levels in MCX. Gold can trade in the range of 30000-31500 levels while silver can move in the range of 40800-43500 levels in near term. A British member of parliament was shot dead in the street last week, causing deep shock across the country and the suspension of campaigning for referendum on the country's EU membership. Asian physical gold demand remained subdued last week as the metal rallied to its highest in nearly two years, with discounts in India widening the most in 3-1/2 months as consumers shied away from making new purchases. Holdings in SPDR Gold Trust, the world's largest gold-backed exchange-traded fund, rose to 902.53 tonnes which is the highest since October 2013. Meanwhile, Fed kept its rates unchanged in last week meeting and the number of Fed officials who see just a single rate hike this year rose to six, from one in March. The odds of a rate increase by December have dropped to 35 percent from 76 percent at the start of this month. Low borrowing costs boost the appeal of owning precious metals, which don't pay interest.
BULLIONS
Crude oil prices can trade on a volatile path as some profit booking can be seen after the recent stunning rise in past few months on supply disruptions and improved demand outlook have lifted the prices higher. Overall it can move in the range of 3000-3400 in MCX. Crude oil market is looking more and more rebalanced as falling US production and supply disruptions in Canada and Nigeria ease the global glut. As for US oil production, it fell by a sizable 29,000 bpd to 8.72 million bpd. Over the past 4 weeks, production has averaged 8.74 million bpd, down 8.8% from the 2015 average of 9.59 million bpd and down 10% from the 2015 weekly production high of over 9.7 million bpd set in April 2015. Despite elevated imports, crude oil inventories are declining as US production falls. Indeed, it also appears that the decline in the rate of US production is accelerating. Natural gas may trade on volatile path as it can move in the range of 168-183 in MCX .Recently strong demand and hot weather concerns in US have lifted the prices higher. Natural-gas inventories rose by 69 billion cubic feet penultimate week to 3.041 trillion cubic feet, the highest level on record for the same week. Natural-gas prices have surged in recent weeks on expectations that the glut of fuel is set to shrink as production declines and hot weather spurs more demand for gas-powered electricity to run air-conditioning units. Meanwhile, updated weather forecasting models continued to show above-normal temperatures across most parts of the U.S. over the next two weeks.
ENERGY COMPLEX
Base metals counter may remain on a volatile path as Brexit fears and China slowdown concerns to give further direction to the prices. The International Monetary Fund called last week for the creation of a fund to help finance structural reforms in the euro zone, echoing ideas floated by the European Commission in 2012 but subsequently dropped in the face of German opposition. China will strictly control new production capacity in the non-ferrous metals sector and boost the stockpiling of state reserves as part of an effort to push forward structural supply-side reform. Copper may move in the range of 290-320. Lead can hover in the range of 110-118. Zinc can move in the range of 130-141. According to data from the International Lead and Zinc Study Group (ILZSG)” The global zinc market saw a deficit of 2,500 tonnes in April after a 20,400 shortfall in March and the market saw a surplus of 24,000 tonnes in the first four months of the year down from a surplus of 185,000 tonnes in the same period last year”. China's mine output of zinc content rose five percent to 456,000 tonnes in April. Meanwhile higher zinc prices are behind rising output in China. Aluminum can move in the range of 102-111. Japanese aluminium buyers are locked in talks with producers over the level of physical premiums to be paid for shipments in the third quarter. Nickel may remain in the range of 570-620. Union workers at Colombia's Cerro Matoso nickel mine cancelled plans to strike after reaching a deal on pay increases and benefits.
BASE METALS
11
TECHNICAL RECOMMENDATIONS
COMMODITY
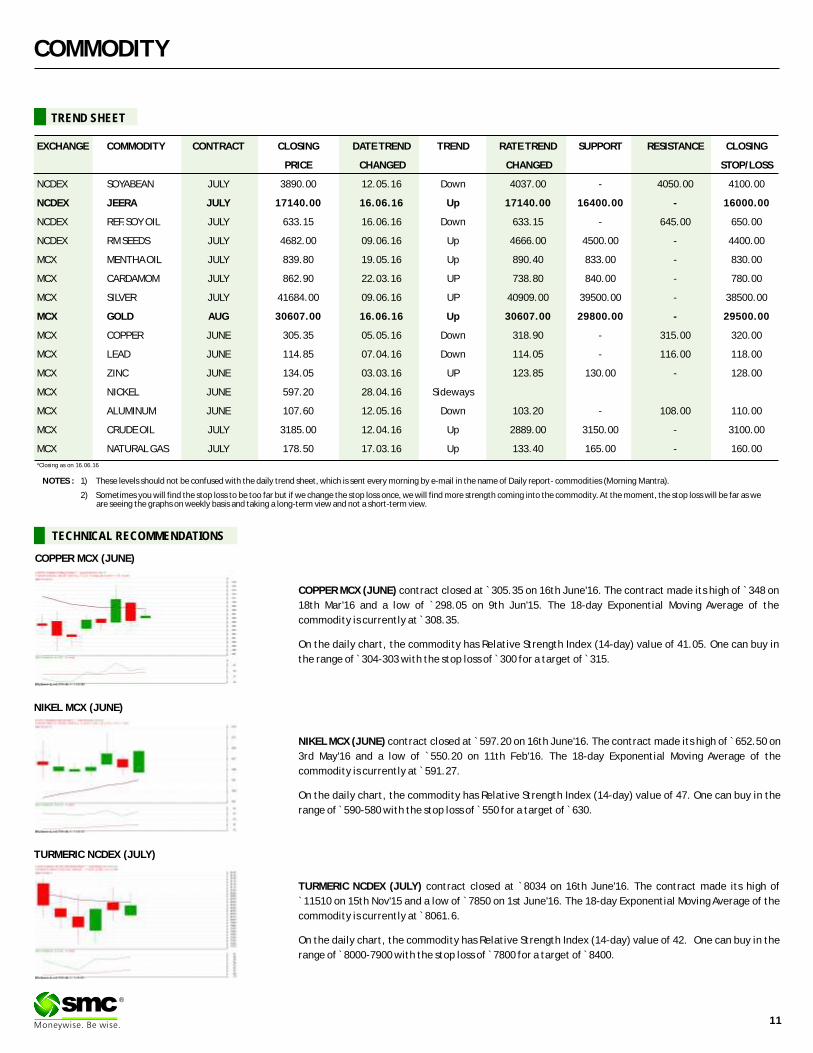
COPPER MCX (JUNE) contract closed at ̀ 305.35 on 16th June'16. The contract made its high of 348 on
18th Mar'16 and a low of `298.05 on 9th Jun'15. The 18-day Exponential Moving Average of the
commodity is currently at ̀ 308.35.
On the daily chart, the commodity has Relative Strength Index (14-day) value of 41.05. One can buy in
the range of ̀ 304-303 with the stop loss of ̀ 300 for a target of ̀ 315.
`
NIKEL MCX (JUNE) contract closed at 597.20 on 16th June'16. The contract made its high of 652.50 on
3rd May'16 and a low of `550.20 on 11th Feb'16. The 18-day Exponential Moving Average of the
commodity is currently at ̀ 591.27.
On the daily chart, the commodity has Relative Strength Index (14-day) value of 47. One can buy in the
range of ̀ 590-580 with the stop loss of ̀ 550 for a target of ̀ 630.
` `
TURMERIC NCDEX (JULY) contract closed at 8034 on 16th June'16. The contract made its high of
`11510 on 15th Nov'15 and a low of ̀ 7850 on 1st June'16. The 18-day Exponential Moving Average of the
commodity is currently at ̀ 8061.6.
On the daily chart, the commodity has Relative Strength Index (14-day) value of 42. One can buy in the
range of ̀ 8000-7900 with the stop loss of ̀ 7800 for a target of ̀ 8400.
`
®
COPPER MCX (JUNE)
NIKEL MCX (JUNE)
TURMERIC NCDEX (JULY)
NOTES : 1) These levels should not be confused with the daily trend sheet, which is sent every morning by e-mail in the name of Daily report- commodities (Morning Mantra).
2) Sometimes you will find the stop loss to be too far but if we change the stop loss once, we will find more strength coming into the commodity. At the moment, the stop loss will be far as we are seeing the graphs on weekly basis and taking a long-term view and not a short-term view.
EXCHANGE COMMODITY CONTRACT CLOSING DATE TREND TREND RATE TREND SUPPORT RESISTANCE CLOSING
PRICE CHANGED CHANGED STOP/LOSS
NCDEX SOYABEAN JULY 3890.00 12.05.16 Down 4037.00 - 4050.00 4100.00
NCDEX JEERA JULY 17140.00 16.06.16 Up 17140.00 16400.00 - 16000.00
NCDEX REF.SOY OIL JULY 633.15 16.06.16 Down 633.15 - 645.00 650.00
NCDEX RM SEEDS JULY 4682.00 09.06.16 Up 4666.00 4500.00 - 4400.00
MCX MENTHA OIL JULY 839.80 19.05.16 Up 890.40 833.00 - 830.00
MCX CARDAMOM JULY 862.90 22.03.16 UP 738.80 840.00 - 780.00
MCX SILVER JULY 41684.00 09.06.16 UP 40909.00 39500.00 - 38500.00
MCX GOLD AUG 30607.00 16.06.16 Up 30607.00 29800.00 - 29500.00
MCX COPPER JUNE 305.35 05.05.16 Down 318.90 - 315.00 320.00
MCX LEAD JUNE 114.85 07.04.16 Down 114.05 - 116.00 118.00
MCX ZINC JUNE 134.05 03.03.16 UP 123.85 130.00 - 128.00
MCX NICKEL JUNE 597.20 28.04.16 Sideways
MCX ALUMINUM JUNE 107.60 12.05.16 Down 103.20 - 108.00 110.00
MCX CRUDE OIL JULY 3185.00 12.04.16 Up 2889.00 3150.00 - 3100.00
MCX NATURAL GAS JULY 178.50 17.03.16 Up 133.40 165.00 - 160.00
TREND SHEET
*Closing as on 16.06.16
COMMODITY
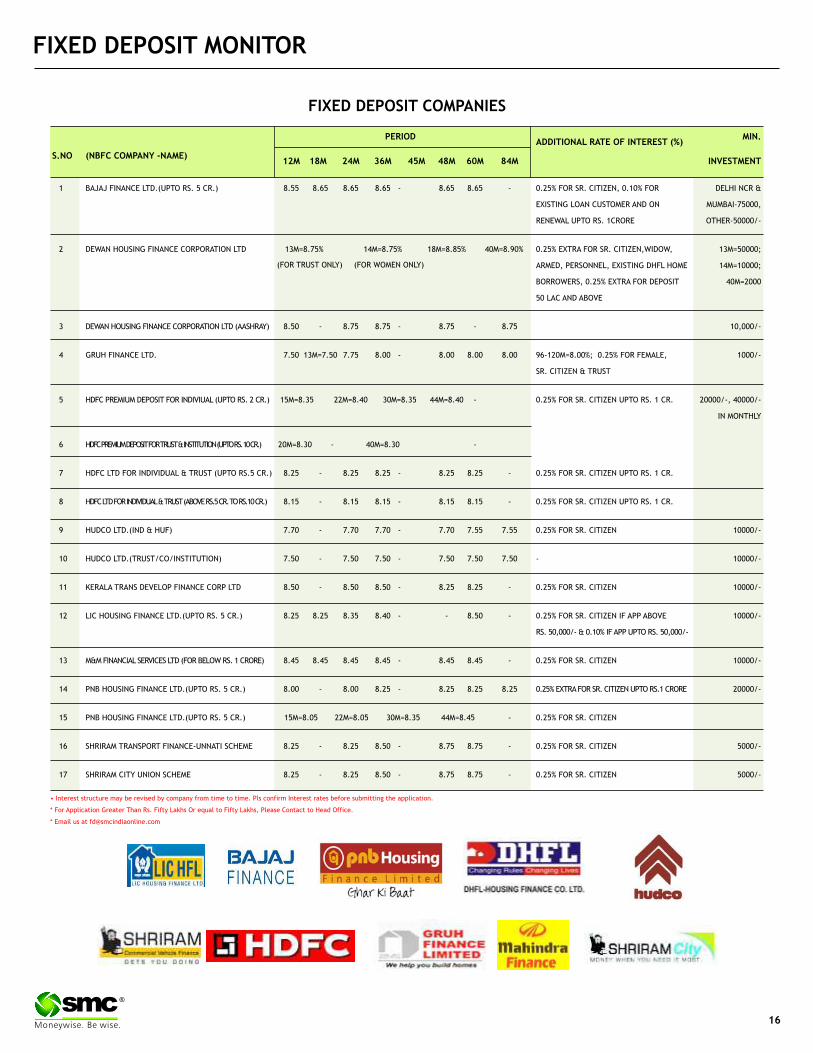
NEWS DIGEST
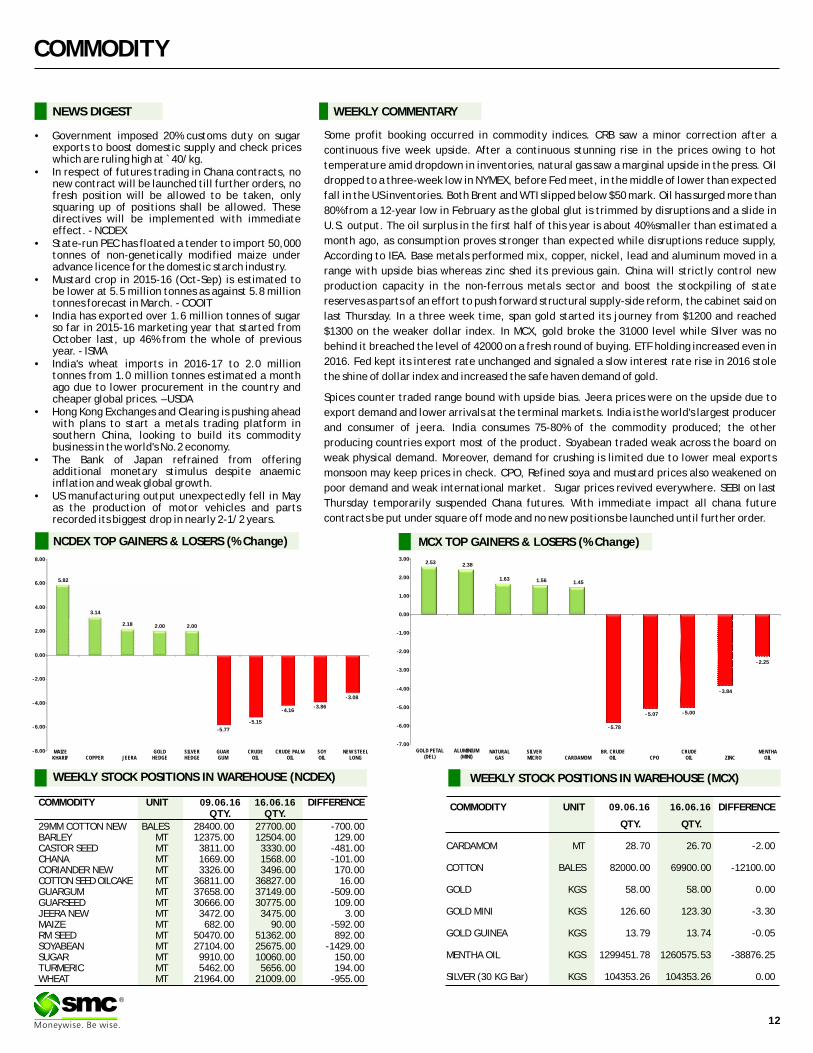
Some profit booking occurred in commodity indices. CRB saw a minor correction after a
continuous five week upside. After a continuous stunning rise in the prices owing to hot
temperature amid dropdown in inventories, natural gas saw a marginal upside in the press. Oil
dropped to a three-week low in NYMEX, before Fed meet, in the middle of lower than expected
fall in the US inventories. Both Brent and WTI slipped below $50 mark. Oil has surged more than
80% from a 12-year low in February as the global glut is trimmed by disruptions and a slide in
U.S. output. The oil surplus in the first half of this year is about 40% smaller than estimated a
month ago, as consumption proves stronger than expected while disruptions reduce supply,
According to IEA. Base metals performed mix, copper, nickel, lead and aluminum moved in a
range with upside bias whereas zinc shed its previous gain. China will strictly control new
production capacity in the non-ferrous metals sector and boost the stockpiling of state
reserves as parts of an effort to push forward structural supply-side reform, the cabinet said on
last Thursday. In a three week time, span gold started its journey from $1200 and reached
$1300 on the weaker dollar index. In MCX, gold broke the 31000 level while Silver was no
behind it breached the level of 42000 on a fresh round of buying. ETF holding increased even in
2016. Fed kept its interest rate unchanged and signaled a slow interest rate rise in 2016 stole
the shine of dollar index and increased the safe haven demand of gold.
Spices counter traded range bound with upside bias. Jeera prices were on the upside due to
export demand and lower arrivals at the terminal markets. India is the world's largest producer
and consumer of jeera. India consumes 75-80% of the commodity produced; the other
producing countries export most of the product. Soyabean traded weak across the board on
weak physical demand. Moreover, demand for crushing is limited due to lower meal exports
monsoon may keep prices in check. CPO, Refined soya and mustard prices also weakened on
poor demand and weak international market. Sugar prices revived everywhere. SEBI on last
Thursday temporarily suspended Chana futures. With immediate impact all chana future
contracts be put under square off mode and no new positions be launched until further order.
WEEKLY COMMENTARY
COMMODITY UNIT 16.06.16 DIFFERENCEQTY. QTY.
29MM COTTON NEW BALES 28400.00 27700.00 -700.00BARLEY MT 12375.00 12504.00 129.00CASTOR SEED MT 3811.00 3330.00 -481.00CHANA MT 1669.00 1568.00 -101.00CORIANDER NEW MT 3326.00 3496.00 170.00COTTON SEED OILCAKE MT 36811.00 36827.00 16.00GUARGUM MT 37658.00 37149.00 -509.00GUARSEED MT 30666.00 30775.00 109.00JEERA NEW MT 3472.00 3475.00 3.00MAIZE MT 682.00 90.00 -592.00RM SEED MT 50470.00 51362.00 892.00SOYABEAN MT 27104.00 25675.00 -1429.00SUGAR MT 9910.00 10060.00 150.00TURMERIC MT 5462.00 5656.00 194.00WHEAT MT 21964.00 21009.00 -955.00
09.06.16 COMMODITY UNIT 16.06.16 DIFFERENCE
QTY. QTY.
CARDAMOM MT 28.70 26.70 -2.00
COTTON BALES 82000.00 69900.00 -12100.00
GOLD KGS 58.00 58.00 0.00
GOLD MINI KGS 126.60 123.30 -3.30
GOLD GUINEA KGS 13.79 13.74 -0.05
MENTHA OIL KGS 1299451.78 1260575.53 -38876.25
SILVER (30 KG Bar) KGS 104353.26 104353.26 0.00
09.06.16
•Government imposed 20% customs duty on sugar exports to boost domestic supply and check prices which are ruling high at ̀ 40/kg.
•In respect of futures trading in Chana contracts, no new contract will be launched till further orders, no fresh position will be allowed to be taken, only squaring up of positions shall be allowed. These directives will be implemented with immediate effect. - NCDEX
•State-run PEC has floated a tender to import 50,000 tonnes of non-genetically modified maize under advance licence for the domestic starch industry.
•Mustard crop in 2015-16 (Oct-Sep) is estimated to be lower at 5.5 million tonnes as against 5.8 million tonnes forecast in March. - COOIT
•India has exported over 1.6 million tonnes of sugar so far in 2015-16 marketing year that started from October last, up 46% from the whole of previous year. - ISMA
•India's wheat imports in 2016-17 to 2.0 million tonnes from 1.0 million tonnes estimated a month ago due to lower procurement in the country and cheaper global prices. – USDA
•Hong Kong Exchanges and Clearing is pushing ahead with plans to start a metals trading platform in southern China, looking to build its commodity business in the world's No.2 economy.
•The Bank of Japan refrained from offering additional monetary stimulus despite anaemic inflation and weak global growth.
•US manufacturing output unexpectedly fell in May as the production of motor vehicles and parts recorded its biggest drop in nearly 2-1/2 years.
WEEKLY STOCK POSITIONS IN WAREHOUSE (MCX)
12
®
WEEKLY STOCK POSITIONS IN WAREHOUSE (NCDEX)
NCDEX TOP GAINERS & LOSERS (% Change) MCX TOP GAINERS & LOSERS (% Change)
5.82
3.14
2.18 2.00 2.00
-5.77
-5.15
-4.16-3.86
-3.08
-8.00
-6.00
-4.00
-2.00
0.00
2.00
4.00
6.00
8.00
MAIZE KHARIF COPPER JEERA
GOLD HEDGE
SILVER HEDGE
GUAR GUM
CRUDE OIL
CRUDE PALM OIL
SOY OIL
NEW STEEL LONG
2.53 2.38
1.63 1.56 1.45
- 5.78
- 5.07 - 5.00
- 3.84
- 2.25
-7.00
-6.00
-5.00
-4.00
-3.00
-2.00
-1.00
0.00
1.00
2.00
3.00
GOLD PETAL (DEL)
ALUMINIUM (MINI)
NATURAL GAS
SILVER MICRO CARDAMOM
BR. CRUDE OIL CPO
CRUDE OIL ZINC
MENTHA OIL
COMMODITY
COMMODITY EXCHANGE CONTRACT 10 16.06.16 CHANGE%
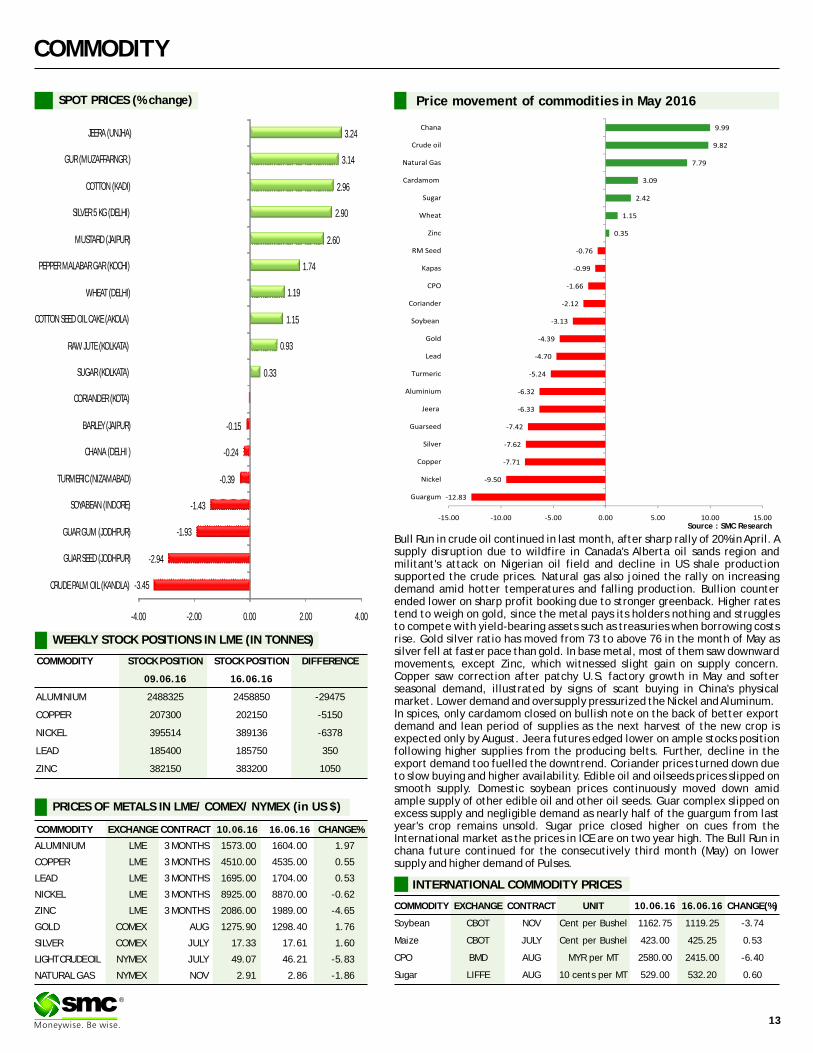
ALUMINIUM LME 3 MONTHS 1573.00 1604.00 1.97
COPPER LME 3 MONTHS 4510.00 4535.00 0.55
LEAD LME 3 MONTHS 1695.00 1704.00 0.53
NICKEL LME 3 MONTHS 8925.00 8870.00 -0.62
ZINC LME 3 MONTHS 2086.00 1989.00 -4.65
GOLD COMEX AUG 1275.90 1298.40 1.76
SILVER COMEX JULY 17.33 17.61 1.60
LIGHT CRUDE OIL NYMEX JULY 49.07 46.21 -5.83
NATURAL GAS NYMEX NOV 2.91 2.86 -1.86
.06.16
PRICES OF METALS IN LME/ COMEX/ NYMEX (in US $)
WEEKLY STOCK POSITIONS IN LME (IN TONNES)
COMMODITY STOCK POSITION STOCK POSITION DIFFERENCE
09.06.16 16.06.16
ALUMINIUM 2488325 2458850 -29475
COPPER 207300 202150 -5150
NICKEL 395514 389136 -6378
LEAD 185400 185750 350
ZINC 382150 383200 1050
INTERNATIONAL COMMODITY PRICES
COMMODITY EXCHANGE CONTRACT UNIT 10.06.16 16.06.16 CHANGE(%)
Soybean CBOT NOV Cent per Bushel 1162.75 1119.25 -3.74
Maize CBOT JULY Cent per Bushel 423.00 425.25 0.53
CPO BMD AUG MYR per MT 2580.00 2415.00 -6.40
Sugar LIFFE AUG 10 cents per MT 529.00 532.20 0.60
13
®
SPOT PRICES (% change) Price movement of commodities in May 2016
Bull Run in crude oil continued in last month, after sharp rally of 20% in April. A supply disruption due to wildfire in Canada's Alberta oil sands region and militant's attack on Nigerian oil field and decline in US shale production supported the crude prices. Natural gas also joined the rally on increasing demand amid hotter temperatures and falling production. Bullion counter ended lower on sharp profit booking due to stronger greenback. Higher rates tend to weigh on gold, since the metal pays its holders nothing and struggles to compete with yield-bearing assets such as treasuries when borrowing costs rise. Gold silver ratio has moved from 73 to above 76 in the month of May as silver fell at faster pace than gold. In base metal, most of them saw downward movements, except Zinc, which witnessed slight gain on supply concern. Copper saw correction after patchy U.S. factory growth in May and softer seasonal demand, illustrated by signs of scant buying in China's physical market. Lower demand and oversupply pressurized the Nickel and Aluminum.In spices, only cardamom closed on bullish note on the back of better export demand and lean period of supplies as the next harvest of the new crop is expected only by August. Jeera futures edged lower on ample stocks position following higher supplies from the producing belts. Further, decline in the export demand too fuelled the downtrend. Coriander prices turned down due to slow buying and higher availability. Edible oil and oilseeds prices slipped on smooth supply. Domestic soybean prices continuously moved down amid ample supply of other edible oil and other oil seeds. Guar complex slipped on excess supply and negligible demand as nearly half of the guargum from last year's crop remains unsold. Sugar price closed higher on cues from the International market as the prices in ICE are on two year high. The Bull Run in chana future continued for the consecutively third month (May) on lower supply and higher demand of Pulses.
-3.45
-2.94
-1.93
-1.43
-0.39
-0.24
-0.15
0.33
0.93
1.15
1.19
1.74
2.60
2.90
2.96
3.14
3.24
-4.00 -2.00 0.00 2.00 4.00
CRUDE PALM OIL (KANDLA)
GUAR SEED (JODHPUR)
GUAR GUM (JODHPUR)
SOYABEAN (INDORE)
TURMERIC (NIZAMABAD)
CHANA (DELHI )
BARLEY (JAIPUR)
CORIANDER (KOTA)
SUGAR (KOLKATA)
RAW JUTE (KOLKATA)
COTTON SEED OIL CAKE (AKOLA)
WHEAT (DELHI)
PEPPER MALABAR GAR (KOCHI)
MUSTARD (JAIPUR)
SILVER 5 KG (DELHI)
COTTON (KADI)
GUR (MUZAFFARNGR.)
JEERA (UNJHA)
Source : SMC Research
CURRENCY
Currency Table
Currency Pair Open High Low Close
USD/INR 67.09 67.46 67.09 67.41
EUR/INR 75.55 76.10 75.39 75.47
GBP/INR 96.25 96.25 95.10 95.17
JPY/INR 63.19 64.94 63.11 64.61
(Source: Reliable Software, Open: Monday 9.00 AM IST, Close: Thursday (5.00 PM IST)
News Flows of last week
15th June U.S. industrial output fell 0.4 percent in May, manufacturing slips
15th June Fed keeps interest rates unchanged, signals fewer future hikes
15th June Yen hits 20-month high vs dollar after BOJ stands pat.
16th June U.S. current account deficit rose to seven-year high in first
quarter
16th June U.S. mortgage rates hit lowest in over three years
16th June Japan keeps economy assessment unchanged, warns of slower
consumer price rises
EUR/INR (JUNE) contract closed at 75.47 on 16th June'16. The contract made its high of 76.10 on 16th June'16 and a low of 75.39 on 16thJune '16 (Weekly Basis). The 14-day Exponential Moving Average of the EUR/INR is currently at ̀ 75.72
On the daily chart, EUR/INR has Relative Strength Index (14-day) value of 45.32. One can buy above 76.00 for a target of 76.80 with the stop loss of 75.60
JPY/NR (JUNE) contract closed at 64.61 on 16thJune'16. The contract made its high of 64.94 on 16th June '16 and a low of 63.11 on 13thJune'16 (Weekly Basis). The 14-day Exponential Moving Average of the JPY/INR is currently at 62.81.
On the daily chart, JPY/INR has Relative Strength Index (14-day) value of 71.60. One can buy around 63.75 for a target of 64.75 with the stop loss of 63.25.
Market Stance
Tailing its previous week losses, Indian rupee once again tumbled down as
against the dollar and tested one week low against the greenback on the back
of persistent demand for the American currency from banks and importers in
view of sharp fall in equities worldwide. Mainly, concerns over Fed policy meet
and referendum on Brexit next week hurt the sentiments for local unit. On the
domestic front, India's foreign-exchange reserves have surged to a record this
month, which somewhat improve a little bit sentiment for rupee to pare its
losses. In coming week, a lot of global and domestic headwinds are coming
together and that could make the rupee market very volatile. Uncertainty
about the U.K.'s June 23 referendum has cast a pall over the global outlook,
spurring risk aversion across emerging markets.
EUR/INR
USD/INR (JUNE) contract closed at 67.41 on 16thJune'16. The contract made its high of 67.46 on 14thJune'16 and a low of 67.09 on 13thJune'16 (Weekly Basis). The 14-day Exponential Moving Average of the USD/INR is currently at 67.25.
On the daily chart, the USD/INR has Relative Strength Index (14-day) value of 54.87. One can sell below 67.00 for the target of 66.30 with the stop loss of 67.40.
GBP/INR (JUNE) contract closed at 95.17 on 16thJune'16. The contract made its high of 96.25 on 13th June'16 and a low of 95.10 on 16thJune '16 (Weekly Basis). The 14-day Exponential Moving Average of the GBP/INR is currently at 96.57.
On the daily chart, GBP/INR has Relative Strength Index (14-day) value of 44.69. One can buy above 96.10 for a target of 97.20 with the stop loss of 95.50.
USD/INRTechnical Recommendation
Economic gauge for the next week
Date Currency Event Previous
21st June USD Markit Services PMI 51.322nd June EUR Non-monetary policy's ECB meeting22nd June USD Housing Price Index (MoM) 0.722nd June GBP Gfk Consumer Confidence -123rd June GBP EU referendum23rd June EUR Markit Services PMI 53.323rd June EUR Markit Manufacturing PMI 51.523rd June USD Initial Jobless Claims 27723rd June USD Markit Manufacturing PMI 50.723rd June USD New Home Sales (MoM) 0.61923rd June USD New Home Sales Change (MoM) 16.624th June USD Durable Goods Orders ex Transportation 0.424th June USD Durable Goods Orders 3.4
GBP/INR JPY/INR
14
®
IPO
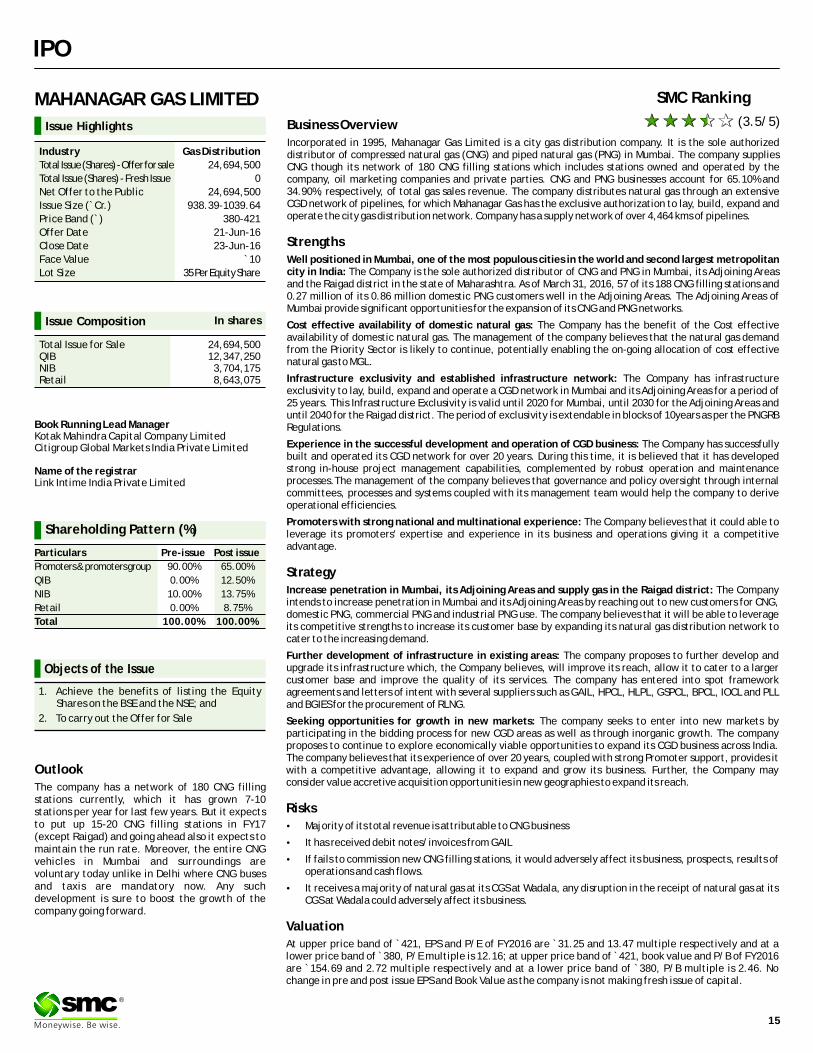
Issue Composition
Total Issue for Sale 24,694,500QIB 12,347,250 NIB 3,704,175 Retail 8,643,075
In shares
Book Running Lead ManagerKotak Mahindra Capital Company LimitedCitigroup Global Markets India Private Limited
Name of the registrarLink Intime India Private Limited
Issue Highlights
Industry Gas Distribution
Total Issue (Shares) - Offer for sale 24,694,500
Total Issue (Shares) - Fresh Issue 0
Net Offer to the Public 24,694,500
Issue Size (`Cr.) 938.39-1039.64
Price Band (`) 380-421
Offer Date 21-Jun-16
Close Date 23-Jun-16
Face Value `10
Lot Size 35 Per Equity Share
MAHANAGAR GAS LIMITED
Shareholding Pattern (%)
Particulars Pre-issue Post issue
Promoters & promoters group 90.00% 65.00%
QIB 0.00% 12.50%
NIB 10.00% 13.75%
Retail 0.00% 8.75%
Total 100.00% 100.00%
Objects of the Issue
1. Achieve the benefits of listing the Equity Shares on the BSE and the NSE; and
2. To carry out the Offer for Sale
Business Overview
Incorporated in 1995, Mahanagar Gas Limited is a city gas distribution company. It is the sole authorized distributor of compressed natural gas (CNG) and piped natural gas (PNG) in Mumbai. The company supplies CNG though its network of 180 CNG filling stations which includes stations owned and operated by the company, oil marketing companies and private parties. CNG and PNG businesses account for 65.10% and 34.90%, respectively, of total gas sales revenue. The company distributes natural gas through an extensive CGD network of pipelines, for which Mahanagar Gas has the exclusive authorization to lay, build, expand and operate the city gas distribution network. Company has a supply network of over 4,464 kms of pipelines.
Strengths
Well positioned in Mumbai, one of the most populous cities in the world and second largest metropolitan city in India: The Company is the sole authorized distributor of CNG and PNG in Mumbai, its Adjoining Areas and the Raigad district in the state of Maharashtra. As of March 31, 2016, 57 of its 188 CNG filling stations and 0.27 million of its 0.86 million domestic PNG customers well in the Adjoining Areas. The Adjoining Areas of Mumbai provide significant opportunities for the expansion of its CNG and PNG networks.
Cost effective availability of domestic natural gas: The Company has the benefit of the Cost effective availability of domestic natural gas. The management of the company believes that the natural gas demand from the Priority Sector is likely to continue, potentially enabling the on-going allocation of cost effective natural gas to MGL.
Infrastructure exclusivity and established infrastructure network: The Company has infrastructure exclusivity to lay, build, expand and operate a CGD network in Mumbai and its Adjoining Areas for a period of 25 years. This Infrastructure Exclusivity is valid until 2020 for Mumbai, until 2030 for the Adjoining Areas and until 2040 for the Raigad district. The period of exclusivity is extendable in blocks of 10years as per the PNGRB Regulations.
Experience in the successful development and operation of CGD business: The Company has successfully built and operated its CGD network for over 20 years. During this time, it is believed that it has developed strong in-house project management capabilities, complemented by robust operation and maintenance processes.The management of the company believes that governance and policy oversight through internal committees, processes and systems coupled with its management team would help the company to derive operational efficiencies.
Promoters with strong national and multinational experience: The Company believes that it could able to leverage its promoters' expertise and experience in its business and operations giving it a competitive advantage.
Strategy
Increase penetration in Mumbai, its Adjoining Areas and supply gas in the Raigad district: The Company intends to increase penetration in Mumbai and its Adjoining Areas by reaching out to new customers for CNG, domestic PNG, commercial PNG and industrial PNG use. The company believes that it will be able to leverage its competitive strengths to increase its customer base by expanding its natural gas distribution network to cater to the increasing demand.
Further development of infrastructure in existing areas: The company proposes to further develop and upgrade its infrastructure which, the Company believes, will improve its reach, allow it to cater to a larger customer base and improve the quality of its services. The company has entered into spot framework agreements and letters of intent with several suppliers such as GAIL, HPCL, HLPL, GSPCL, BPCL, IOCL and PLL and BGIES for the procurement of RLNG.
Seeking opportunities for growth in new markets: The company seeks to enter into new markets by participating in the bidding process for new CGD areas as well as through inorganic growth. The company proposes to continue to explore economically viable opportunities to expand its CGD business across India. The company believes that its experience of over 20 years, coupled with strong Promoter support, provides it with a competitive advantage, allowing it to expand and grow its business. Further, the Company may consider value accretive acquisition opportunities in new geographies to expand its reach.
Risks
�Majority of its total revenue is attributable to CNG business
�It has received debit notes/invoices from GAIL
�If fails to commission new CNG filling stations, it would adversely affect its business, prospects, results of operations and cash flows.
�It receives a majority of natural gas at its CGS at Wadala, any disruption in the receipt of natural gas at its CGS at Wadala could adversely affect its business.
Valuation
At upper price band of `421, EPS and P/E of FY2016 are `31.25 and 13.47 multiple respectively and at a lower price band of ̀ 380, P/E multiple is 12.16; at upper price band of ̀ 421, book value and P/B of FY2016 are `154.69 and 2.72 multiple respectively and at a lower price band of `380, P/B multiple is 2.46. No change in pre and post issue EPS and Book Value as the company is not making fresh issue of capital.
SMC Ranking
Outlook
The company has a network of 180 CNG filling stations currently, which it has grown 7-10 stations per year for last few years. But it expects to put up 15-20 CNG filling stations in FY17 (except Raigad) and going ahead also it expects to maintain the run rate. Moreover, the entire CNG vehicles in Mumbai and surroundings are voluntary today unlike in Delhi where CNG buses and taxis are mandatory now. Any such development is sure to boost the growth of the company going forward.
(3.5/5)
15
®

IRDAI REGISTERED INSURANCE BROKER
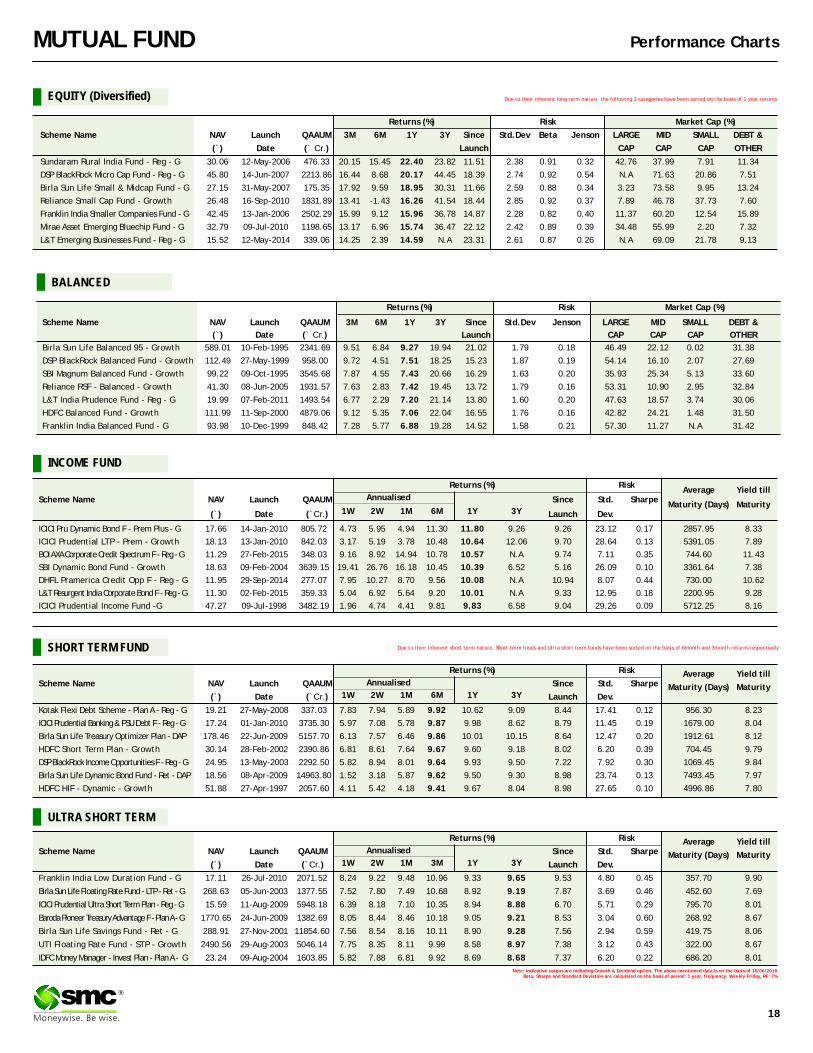
Returns (%) Risk Market Cap (%)
Scheme Name NAV Launch QAAUM 3M 6M 1Y 3Y Since Std.Dev Jenson LARGE MID SMALL DEBT &
(`) Date (` Cr.) Launch CAP CAP CAP OTHER
Birla Sun Life Balanced 95 - Growth 589.01 10-Feb-1995 2341.69 9.51 6.84 9.27 19.94 21.02 1.79 0.18 46.49 22.12 0.02 31.38
DSP BlackRock Balanced Fund - Growth 112.49 27-May-1999 958.00 9.72 4.51 7.51 18.25 15.23 1.87 0.19 54.14 16.10 2.07 27.69
SBI Magnum Balanced Fund - Growth 99.22 09-Oct-1995 3545.68 7.87 4.55 7.43 20.66 16.29 1.63 0.20 35.93 25.34 5.13 33.60
Reliance RSF - Balanced - Growth 41.30 08-Jun-2005 1931.57 7.63 2.83 7.42 19.45 13.72 1.79 0.16 53.31 10.90 2.95 32.84
L&T India Prudence Fund - Reg - G 19.99 07-Feb-2011 1493.54 6.77 2.29 7.20 21.14 13.80 1.60 0.20 47.63 18.57 3.74 30.06
HDFC Balanced Fund - Growth 111.99 11-Sep-2000 4879.06 9.12 5.35 7.06 22.04 16.55 1.76 0.16 42.82 24.21 1.48 31.50
Franklin India Balanced Fund - G 93.98 10-Dec-1999 848.42 7.28 5.77 6.88 19.28 14.52 1.58 0.21 57.30 11.27 N.A 31.42
Annualised
Returns (%) RiskAverage Yield till
Scheme Name NAV Launch QAAUM Since Std. SharpeMaturity (Days) Maturity
1W 2W 1M 6M 1Y 3Y(`) Date (`Cr.) Launch Dev.
ICICI Pru Dynamic Bond F - Prem Plus - G 17.66 14-Jan-2010 805.72 4.73 5.95 4.94 11.30 11.80 9.26 9.26 23.12 0.17 2857.95 8.33
ICICI Prudential LTP - Prem - Growth 18.13 13-Jan-2010 842.03 3.17 5.19 3.78 10.48 10.64 12.06 9.70 28.64 0.13 5391.05 7.89
BOI AXA Corporate Credit Spectrum F - Reg - G 11.29 27-Feb-2015 348.03 9.16 8.92 14.94 10.78 10.57 N.A 9.74 7.11 0.35 744.60 11.43
SBI Dynamic Bond Fund - Growth 18.63 09-Feb-2004 3639.15 19.41 26.76 16.18 10.45 10.39 6.52 5.16 26.09 0.10 3361.64 7.38
DHFL Pramerica Credit Opp F - Reg - G 11.95 29-Sep-2014 277.07 7.95 10.27 8.70 9.56 10.08 N.A 10.94 8.07 0.44 730.00 10.62
L&T Resurgent India Corporate Bond F - Reg - G 11.30 02-Feb-2015 359.33 5.04 6.92 5.64 9.20 10.01 N.A 9.33 12.95 0.18 2200.95 9.28
ICICI Prudential Income Fund -G 47.27 09-Jul-1998 3482.19 1.96 4.74 4.41 9.81 9.83 6.58 9.04 29.26 0.09 5712.25 8.16
Returns (%) Risk Average Yield tillScheme Name NAV Launch QAAUM Since Std. Sharpe Maturity (Days) Maturity
1W 2W 1M 6M 1Y 3Y(`) Date (`Cr.) Launch Dev.
Kotak Flexi Debt Scheme - Plan A - Reg - G 19.21 27-May-2008 337.03 7.83 7.94 5.89 9.92 10.62 9.09 8.44 17.41 0.12 956.30 8.23
ICICI Prudential Banking & PSU Debt F - Reg - G 17.24 01-Jan-2010 3735.30 5.97 7.08 5.78 9.87 9.98 8.62 8.79 11.45 0.19 1679.00 8.04
Birla Sun Life Treasury Optimizer Plan - DAP 178.46 22-Jun-2009 5157.70 6.13 7.57 6.46 9.86 10.01 10.15 8.64 12.47 0.20 1912.61 8.12
HDFC Short Term Plan - Growth 30.14 28-Feb-2002 2390.86 6.81 8.61 7.64 9.67 9.60 9.18 8.02 6.20 0.39 704.45 9.79
DSP BlackRock Income Opportunities F - Reg - G 24.95 13-May-2003 2292.50 5.82 8.94 8.01 9.64 9.93 9.50 7.22 7.92 0.30 1069.45 9.84
Birla Sun Life Dynamic Bond Fund - Ret - DAP 18.56 08-Apr-2009 14963.80 1.52 3.18 5.87 9.62 9.50 9.30 8.98 23.74 0.13 7493.45 7.97
HDFC HIF - Dynamic - Growth 51.88 27-Apr-1997 2057.60 4.11 5.42 4.18 9.41 9.67 8.04 8.98 27.65 0.10 4996.86 7.80
Returns (%) Risk Average Yield tillScheme Name NAV Launch QAAUM Since Std. Sharpe Maturity (Days) Maturity
1W 2W 1M 3M 1Y 3Y(`) Date (`Cr.) Launch Dev.
Franklin India Low Duration Fund - G 17.11 26-Jul-2010 2071.52 8.24 9.22 9.48 10.96 9.33 9.65 9.53 4.80 0.45 357.70 9.90
Birla Sun Life Floating Rate Fund - LTP - Ret - G 268.63 05-Jun-2003 1377.55 7.52 7.80 7.49 10.68 8.92 9.19 7.87 3.69 0.46 452.60 7.69
ICICI Prudential Ultra Short Term Plan - Reg - G 15.59 11-Aug-2009 5948.18 6.39 8.18 7.10 10.35 8.94 8.88 6.70 5.71 0.29 795.70 8.01
Baroda Pioneer Treasury Advantage F - Plan A - G 1770.65 24-Jun-2009 1382.69 8.05 8.44 8.46 10.18 9.05 9.21 8.53 3.04 0.60 268.92 8.67
Birla Sun Life Savings Fund - Ret - G 288.91 27-Nov-2001 11854.60 7.56 8.54 8.16 10.11 8.90 9.28 7.56 2.94 0.59 419.75 8.06
UTI Floating Rate Fund - STP - Growth 2490.56 29-Aug-2003 5046.14 7.75 8.35 8.11 9.99 8.58 8.97 7.38 3.12 0.43 322.00 8.67
IDFC Money Manager - Invest Plan - Plan A - G 23.24 09-Aug-2004 1603.85 5.82 7.88 6.81 9.92 8.69 8.68 7.37 6.20 0.22 686.20 8.01
Returns (%) Risk Market Cap (%)
Scheme Name NAV Launch QAAUM 3M 6M 1Y 3Y Since Std.Dev Beta Jenson LARGE MID SMALL DEBT &
(`) Date (` Cr.) Launch CAP CAP CAP OTHER
Sundaram Rural India Fund - Reg - G 30.06 12-May-2006 476.33 20.15 15.45 22.40 23.82 11.51 2.38 0.91 0.32 42.76 37.99 7.91 11.34
DSP BlackRock Micro Cap Fund - Reg - G 45.80 14-Jun-2007 2213.86 16.44 8.68 20.17 44.45 18.39 2.74 0.92 0.54 N.A 71.63 20.86 7.51
Birla Sun Life Small & Midcap Fund - G 27.15 31-May-2007 175.35 17.92 9.59 18.95 30.31 11.66 2.59 0.88 0.34 3.23 73.58 9.95 13.24
Reliance Small Cap Fund - Growth 26.48 16-Sep-2010 1831.89 13.41 -1.43 16.26 41.54 18.44 2.85 0.92 0.37 7.89 46.78 37.73 7.60
Franklin India Smaller Companies Fund - G 42.45 13-Jan-2006 2502.29 15.99 9.12 15.96 36.78 14.87 2.28 0.82 0.40 11.37 60.20 12.54 15.89
Mirae Asset Emerging Bluechip Fund - G 32.79 09-Jul-2010 1198.65 13.17 6.96 15.74 36.47 22.12 2.42 0.89 0.39 34.48 55.99 2.20 7.32
L&T Emerging Businesses Fund - Reg - G 15.52 12-May-2014 339.06 14.25 2.39 14.59 N.A 23.31 2.61 0.87 0.26 N.A 69.09 21.78 9.13
Note: Indicative corpus are including Growth & Dividend option. The above mentioned data is on the basis of 16/06/2016Beta, Sharpe and Standard Deviation are calculated on the basis of period: 1 year, frequency: Weekly Friday, RF: 7%
Annualised
18
MUTUAL FUND Performance Charts
EQUITY (Diversified)
INCOME FUND
ULTRA SHORT TERM
SHORT TERM FUND
Due to their inherent long term nature, the following 3 categories have been sorted on the basis of 1 year returns
Due to their inherent short term nature, Short term funds and Ultra short term funds have been sorted on the basis of 6month and 3month returns respectively
Annualised
®
BALANCED

SMC's team members enjoying their trip to Singapore