Embed Size (px)
Citation preview

SME FINANCE MONITORQ4 2018
An independent report by BVA BDRC, March 2019
www.bva-bdrc.com
2
CONTENTS Page No.
FOREWORD ................................................................................................................................................................. 3 1 INTRODUCTION ................................................................................................................................................. 6 2 MANAGEMENT SUMMARY ................................................................................................................................. 9 3 USING THIS REPORT ....................................................................................................................................... 17 4 THE GENERAL CONTEXT ................................................................................................................................. 24 5 FINANCIAL CONTEXT – HOW ARE SMES FUNDING THEMSELVES? (PART 1) ............................................ 85 6 FINANCIAL CONTEXT – HOW ARE SMES FUNDING THEMSELVES? (PART 2) .......................................... 112 7 NEED FOR FUNDING ..................................................................................................................................... 150 8 AN OVERVIEW OF BORROWING EVENTS ................................................................................................... 163 9 BORROWING EVENTS IN MORE DETAIL ..................................................................................................... 171 10 OUTCOME OF TYPE 1 APPLICATIONS ......................................................................................................... 182 11 NOT LOOKING TO BORROW ........................................................................................................................ 209 12 THE FUTURE .................................................................................................................................................. 229 13 AWARENESS OF TASKFORCE AND OTHER INITIATIVES ........................................................................... 293 14 GRAPHS AND CHARTS ................................................................................................................................... 315 15 TECHNICAL APPENDIX ................................................................................................................................. 326

www.bva-bdrc.com
FOREWORD
FOREWORD
www.bva-bdrc.com
4
Welcome to the full report of the SME Finance Monitor for Q4 2018. This is the second report since changes were made to the questionnaire in Q1 2018, aiming to better reflect current trends in access to finance for SMEs. The report now includes 12 months of data on a wider range of financial products and providers available to meet SME access to finance needs.
The SME Finance Monitor continues to survey 4,500 businesses every quarter about past borrowing events and future borrowing intentions. It is the largest such survey in the UK and since the first report was published covering Q1-2 2011 has built into a robust and reliable independent data source for all parties interested in the issue of SME finance. In total, 31 waves of interviewing have been completed, with a full report now published every half year, following completion of the Q2 and Q4 fieldwork. For 2019 the full report will continue to be published every half year as before.
The survey was set up through the Business Finance Taskforce, which was itself established in July 2010 to review the key issue of bank finance and how the banks could help the UK to return to sustainable growth. It made a commitment to fund and publish an
independent survey to identify (and track) demand for finance and how SMEs feel about borrowing – the SME Finance Monitor.
This extensive dataset is recognized by both public and private sector stakeholders as the de facto authority on access to finance conditions for SMEs, because it is seen as reliable, trustworthy, and, crucially, as independent. The Monitor is cited regularly in Parliament, in government led reviews, and in evidence to the European Commission and OECD, as well as forming the basis for policy discussions between the banks and BEIS.
The data provides both a clear view of how SMEs are feeling now, and, increasingly, how this has changed over time. It also provides analysis by size of SME and sector, as SMEs should not be seen as one homogenous group: in particular, the smallest SMEs with no employees can often report different views and experiences to their larger peers.
This is an independent report, and I am pleased to confirm that this latest version has once again been written and published by BVA BDRC, with no influence sought or applied by any member of the Steering Group.
Shiona Davies Editor, The SME Finance Monitor March 2019
FOREWORD
www.bva-bdrc.com
5
The Survey Steering Group comprises representatives of the following:
Association of Chartered Certified Accountants
Barclays Bank
UK Finance
Dept. for Business, Energy and Industrial Strategy
EEF the manufacturers’ organisation
Federation of Small Businesses
Forum of Private Business
HM Treasury
HSBC
Lloyds Banking Group
Royal Bank of Scotland
Santander

www.bva-bdrc.com
1 INTRODUCTION
1. INTRODUCTION
www.bva-bdrc.com
7
The issue of SMEs and external finance continues to provoke debate. Over time, the emphasis has moved from issues around access to finance to those around demand for finance amongst SMEs and the extent to which the right forms of funding are available to those businesses looking to grow and invest. For some time, the prevailing economic conditions have affected both business confidence and appetite for borrowing, while the Brexit negotiations that have followed the EU referendum result in June 2016 have added an additional level of uncertainty.
The Business Finance Taskforce was set up in July 2010 to review this key issue of bank finance and how the banks could help the UK to return to sustainable growth. It made a commitment to fund and publish an independent survey to identify (and track) demand for finance and how SMEs feel about borrowing. BVA BDRC was appointed to conduct this survey in order to provide a robust and respected independent source of information. BVA BDRC continues to maintain full editorial control over the findings presented in this report.
At present it appears that it is demand rather than supply issues that are contributing to the continued lower levels of lending to SMEs and so the SME Finance Monitor questionnaire has evolved over time to capture more data in this area. In 2017, it was decided to re-design the core of the questionnaire for 2018, expanding the range of financial products and providers that SMEs could comment on. This is the second report based on this re-designed questionnaire, providing a full 12 months of data. Where questions were retained from previous waves they have been re-numbered and both the old and new numbers are shown in this report.
The majority of this report is based on a total of 18,002 interviews with SMEs, conducted across the four quarters of 2018 (using the new questionnaire). Previous interviews conducted in 2011 (three waves), and the 4 waves in each of the years 2012 to 2017 are not in these year-ending results but they are still shown in this report where data is reported quarterly or annually over time, or by application date.
The YEQ4 2018 data therefore includes the following four waves:
• January-March 2018 – 4,500 interviews conducted, referred to as Q1 2018
• April-June 2018 – 4,500 interviews conducted, referred to as Q2 2018
• July-September 2018 – 4,502 interviews conducted, referred to as Q3 2018
• October-December 2018 – 4,500 interviews conducted, referred to as Q4 2018.
The results from these most recent four waves have been combined as usual to cover a full 12 months of interviewing, and weighted to the overall profile of SMEs in the UK in such a way that it is possible to analyse results wave on wave where relevant – and the data reported for an individual quarter will be as originally reported. This combined dataset of 18,002 interviews is referred to as YEQ4 2018.
1. INTRODUCTION
www.bva-bdrc.com
8
Since Q1 2016 the overall sample size has been 4,500 interviews per quarter (previously 5,000) which still provides a robust base size for analysis. Also, in 2016 the size, sector and region quotas and weighting were reviewed and, for the first time since the Monitor was established, minor changes were made to better reflect the current profile of SMEs. These new weights have been applied to all data from Q1 2016 onwards.
The majority of reporting is based on interviews conducted in the year to Q4 2018. The exceptions to this rule are:
• Data on applications has previously been based on when the application was made, rather than the date of interview. Many of the application questions have been revised from Q1 2018 and so limited data is currently available. Analysis in this report is based on all applications reported during interviews in 2018, which could have been made between Q1 2017 and Q4 2018.
• Where SMEs are asked about their planned future behaviour, and typically their expectations for the next 3 months, comparisons are made between individual quarters.
• For key questions summary tables are provided with annual figures over the longer term to set the current results in context. The charts in the final chapter of this report provide more detailed quarter on quarter data from the start of the Monitor.
• Where a new question has still captured similar data to previous versions then data over time has been provided as a comparison.
The structure of the SME market is such that each ‘All SME’ figure quoted will be heavily influenced by the views of those with 0 employees, who make up three quarters of the SME population. As the views of these smallest SMEs can differ markedly from their larger peers, an ‘All employers’ figure is now also reported for some key questions, that is those SMEs with 1-249 employees.
A further quarter of 4,500 interviews, to the same sample structure, is being conducted January to March 2019.
A seventh edition of the annual report, published in August 2018, provided separate analysis at a regional level for an in-depth assessment of local conditions during 2017. A further regional report is planned for Spring 2019 to report on local conditions during 2018.
www.bva-bdrc.com
2 MANAGEMENT SUMMARY THIS REPORT COVERS the borrowing process from the SME’s perspective, with detailed information about those who have had a need for funding and those who have been, or would have liked to have been, through the process of borrowing for their business. It also provides broader context information about SMEs including growth, profitability and perceived barriers to running the business. This is the second report since the re-design of the questionnaire in Q1 2018.
2. MANAGEMENT SUMMARY
www.bva-bdrc.com
10
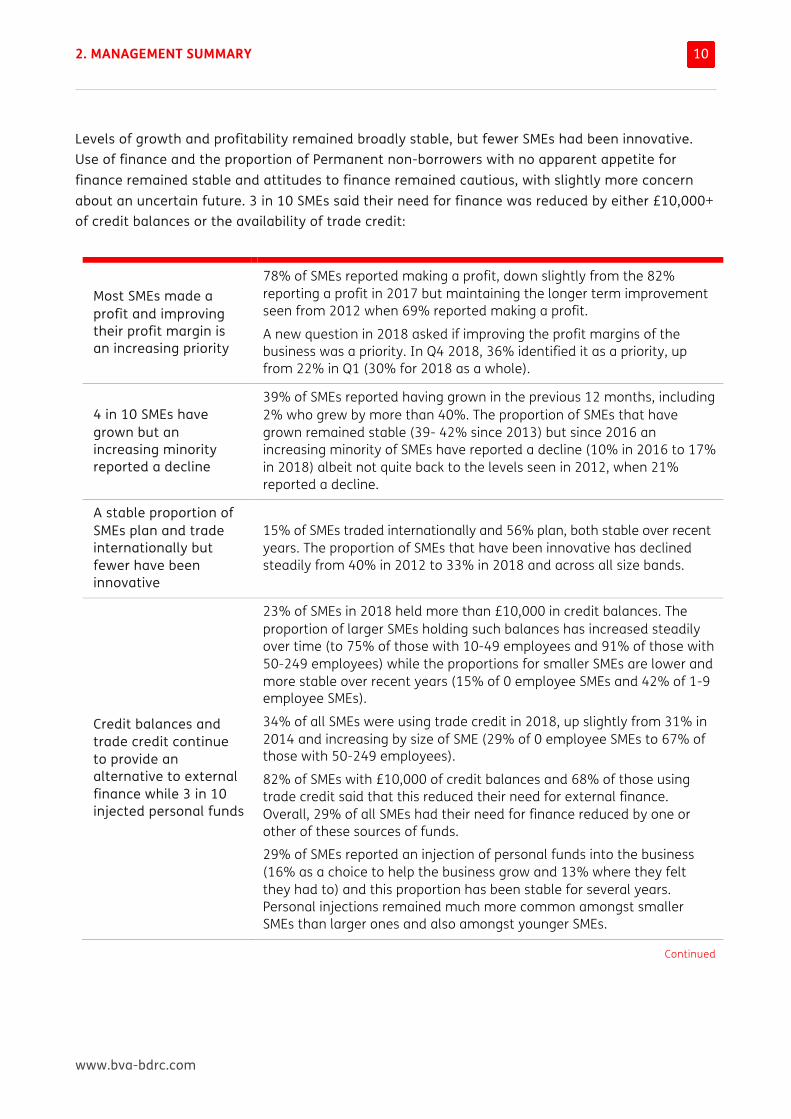
Levels of growth and profitability remained broadly stable, but fewer SMEs had been innovative. Use of finance and the proportion of Permanent non-borrowers with no apparent appetite for finance remained stable and attitudes to finance remained cautious, with slightly more concern about an uncertain future. 3 in 10 SMEs said their need for finance was reduced by either £10,000+ of credit balances or the availability of trade credit:
Most SMEs made a profit and improving their profit margin is an increasing priority
78% of SMEs reported making a profit, down slightly from the 82% reporting a profit in 2017 but maintaining the longer term improvement seen from 2012 when 69% reported making a profit.
A new question in 2018 asked if improving the profit margins of the business was a priority. In Q4 2018, 36% identified it as a priority, up from 22% in Q1 (30% for 2018 as a whole).
4 in 10 SMEs have grown but an increasing minority reported a decline
39% of SMEs reported having grown in the previous 12 months, including 2% who grew by more than 40%. The proportion of SMEs that have grown remained stable (39- 42% since 2013) but since 2016 an increasing minority of SMEs have reported a decline (10% in 2016 to 17% in 2018) albeit not quite back to the levels seen in 2012, when 21% reported a decline.
A stable proportion of SMEs plan and trade internationally but fewer have been innovative
15% of SMEs traded internationally and 56% plan, both stable over recent years. The proportion of SMEs that have been innovative has declined steadily from 40% in 2012 to 33% in 2018 and across all size bands.
Credit balances and trade credit continue to provide an alternative to external finance while 3 in 10 injected personal funds
23% of SMEs in 2018 held more than £10,000 in credit balances. The proportion of larger SMEs holding such balances has increased steadily over time (to 75% of those with 10-49 employees and 91% of those with 50-249 employees) while the proportions for smaller SMEs are lower and more stable over recent years (15% of 0 employee SMEs and 42% of 1-9 employee SMEs).
34% of all SMEs were using trade credit in 2018, up slightly from 31% in 2014 and increasing by size of SME (29% of 0 employee SMEs to 67% of those with 50-249 employees).
82% of SMEs with £10,000 of credit balances and 68% of those using trade credit said that this reduced their need for external finance. Overall, 29% of all SMEs had their need for finance reduced by one or other of these sources of funds.
29% of SMEs reported an injection of personal funds into the business (16% as a choice to help the business grow and 13% where they felt they had to) and this proportion has been stable for several years. Personal injections remained much more common amongst smaller SMEs than larger ones and also amongst younger SMEs.
Continued
2. MANAGEMENT SUMMARY
www.bva-bdrc.com
11
Continued
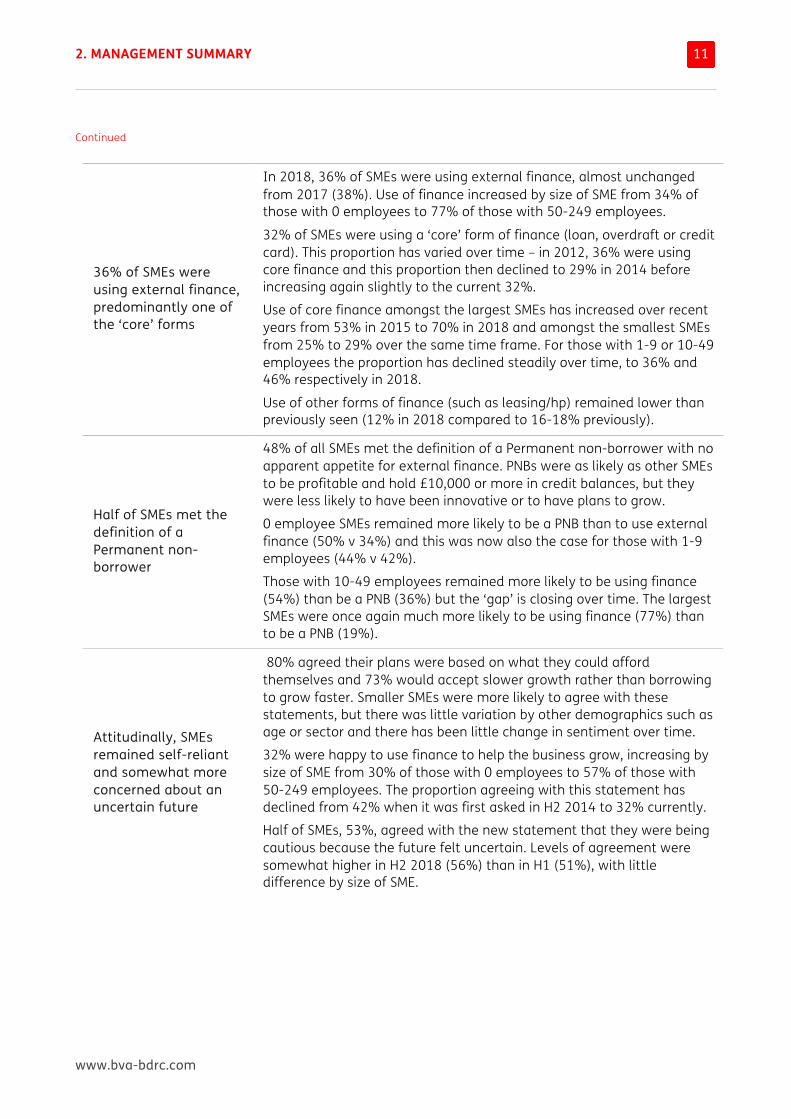
36% of SMEs were using external finance, predominantly one of the ‘core’ forms
In 2018, 36% of SMEs were using external finance, almost unchanged from 2017 (38%). Use of finance increased by size of SME from 34% of those with 0 employees to 77% of those with 50-249 employees.
32% of SMEs were using a ‘core’ form of finance (loan, overdraft or credit card). This proportion has varied over time – in 2012, 36% were using core finance and this proportion then declined to 29% in 2014 before increasing again slightly to the current 32%.
Use of core finance amongst the largest SMEs has increased over recent years from 53% in 2015 to 70% in 2018 and amongst the smallest SMEs from 25% to 29% over the same time frame. For those with 1-9 or 10-49 employees the proportion has declined steadily over time, to 36% and 46% respectively in 2018.
Use of other forms of finance (such as leasing/hp) remained lower than previously seen (12% in 2018 compared to 16-18% previously).
Half of SMEs met the definition of a Permanent non-borrower
48% of all SMEs met the definition of a Permanent non-borrower with no apparent appetite for external finance. PNBs were as likely as other SMEs to be profitable and hold £10,000 or more in credit balances, but they were less likely to have been innovative or to have plans to grow.
0 employee SMEs remained more likely to be a PNB than to use external finance (50% v 34%) and this was now also the case for those with 1-9 employees (44% v 42%).
Those with 10-49 employees remained more likely to be using finance (54%) than be a PNB (36%) but the ‘gap’ is closing over time. The largest SMEs were once again much more likely to be using finance (77%) than to be a PNB (19%).
Attitudinally, SMEs remained self-reliant and somewhat more concerned about an uncertain future
80% agreed their plans were based on what they could afford themselves and 73% would accept slower growth rather than borrowing to grow faster. Smaller SMEs were more likely to agree with these statements, but there was little variation by other demographics such as age or sector and there has been little change in sentiment over time.
32% were happy to use finance to help the business grow, increasing by size of SME from 30% of those with 0 employees to 57% of those with 50-249 employees. The proportion agreeing with this statement has declined from 42% when it was first asked in H2 2014 to 32% currently.
Half of SMEs, 53%, agreed with the new statement that they were being cautious because the future felt uncertain. Levels of agreement were somewhat higher in H2 2018 (56%) than in H1 (51%), with little difference by size of SME.
2. MANAGEMENT SUMMARY
www.bva-bdrc.com
12
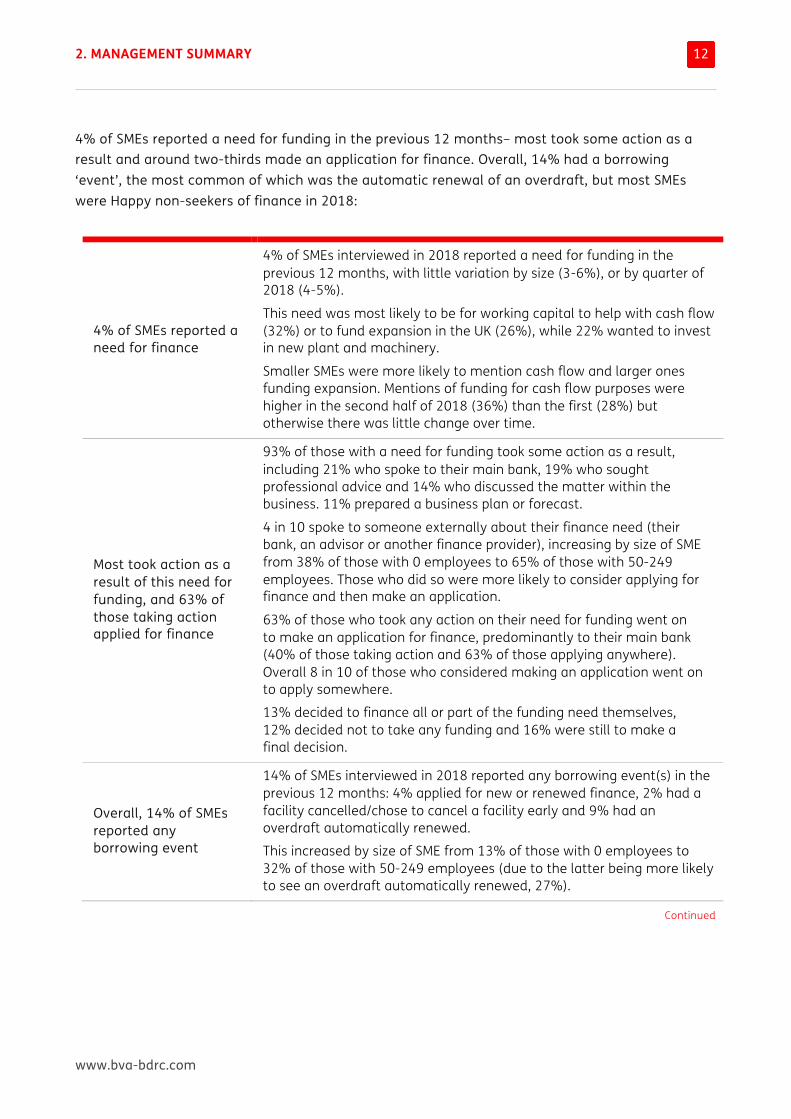
4% of SMEs reported a need for funding in the previous 12 months– most took some action as a result and around two-thirds made an application for finance. Overall, 14% had a borrowing ‘event’, the most common of which was the automatic renewal of an overdraft, but most SMEs were Happy non-seekers of finance in 2018:
4% of SMEs reported a need for finance
4% of SMEs interviewed in 2018 reported a need for funding in the previous 12 months, with little variation by size (3-6%), or by quarter of 2018 (4-5%).
This need was most likely to be for working capital to help with cash flow (32%) or to fund expansion in the UK (26%), while 22% wanted to invest in new plant and machinery.
Smaller SMEs were more likely to mention cash flow and larger ones funding expansion. Mentions of funding for cash flow purposes were higher in the second half of 2018 (36%) than the first (28%) but otherwise there was little change over time.
Most took action as a result of this need for funding, and 63% of those taking action applied for finance
93% of those with a need for funding took some action as a result, including 21% who spoke to their main bank, 19% who sought professional advice and 14% who discussed the matter within the business. 11% prepared a business plan or forecast.
4 in 10 spoke to someone externally about their finance need (their bank, an advisor or another finance provider), increasing by size of SME from 38% of those with 0 employees to 65% of those with 50-249 employees. Those who did so were more likely to consider applying for finance and then make an application.
63% of those who took any action on their need for funding went on to make an application for finance, predominantly to their main bank (40% of those taking action and 63% of those applying anywhere). Overall 8 in 10 of those who considered making an application went on to apply somewhere.
13% decided to finance all or part of the funding need themselves, 12% decided not to take any funding and 16% were still to make a final decision.
Overall, 14% of SMEs reported any borrowing event
14% of SMEs interviewed in 2018 reported any borrowing event(s) in the previous 12 months: 4% applied for new or renewed finance, 2% had a facility cancelled/chose to cancel a facility early and 9% had an overdraft automatically renewed.
This increased by size of SME from 13% of those with 0 employees to 32% of those with 50-249 employees (due to the latter being more likely to see an overdraft automatically renewed, 27%).
Continued
2. MANAGEMENT SUMMARY
www.bva-bdrc.com
13
Continued
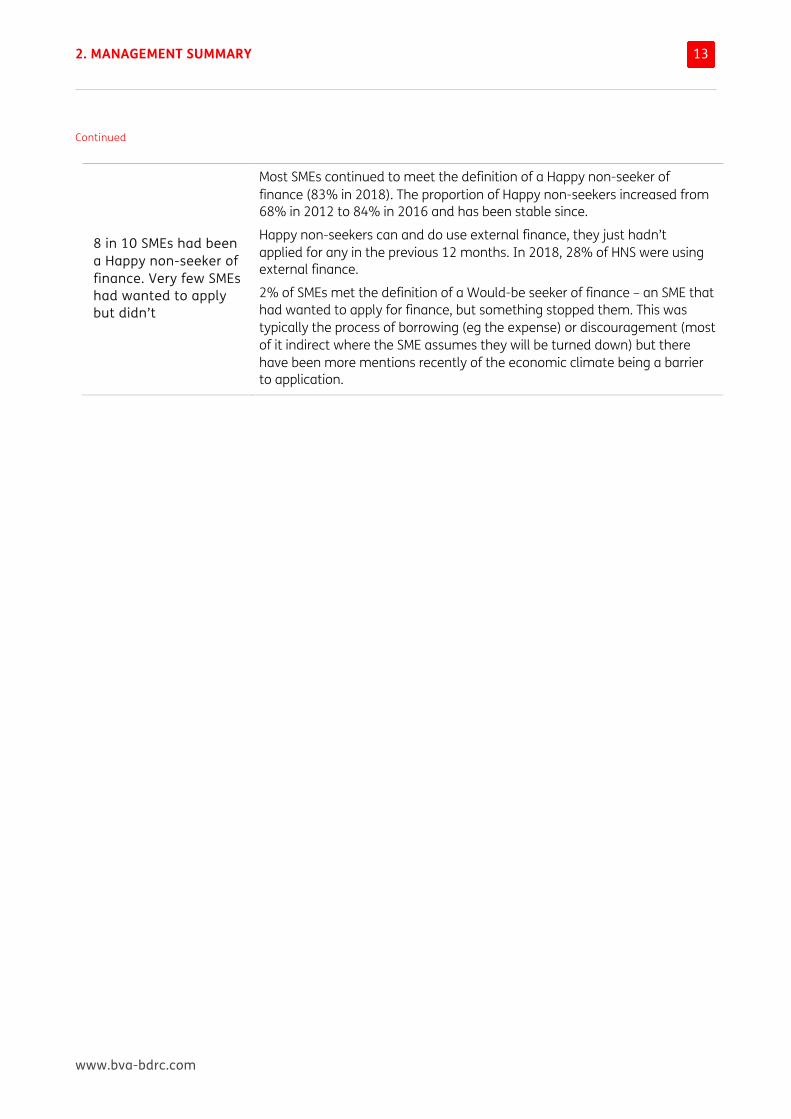
8 in 10 SMEs had been a Happy non-seeker of finance. Very few SMEs had wanted to apply but didn’t
Most SMEs continued to meet the definition of a Happy non-seeker of finance (83% in 2018). The proportion of Happy non-seekers increased from 68% in 2012 to 84% in 2016 and has been stable since.
Happy non-seekers can and do use external finance, they just hadn’t applied for any in the previous 12 months. In 2018, 28% of HNS were using external finance.
2% of SMEs met the definition of a Would-be seeker of finance – an SME that had wanted to apply for finance, but something stopped them. This was typically the process of borrowing (eg the expense) or discouragement (most of it indirect where the SME assumes they will be turned down) but there have been more mentions recently of the economic climate being a barrier to application.
2. MANAGEMENT SUMMARY
www.bva-bdrc.com
14
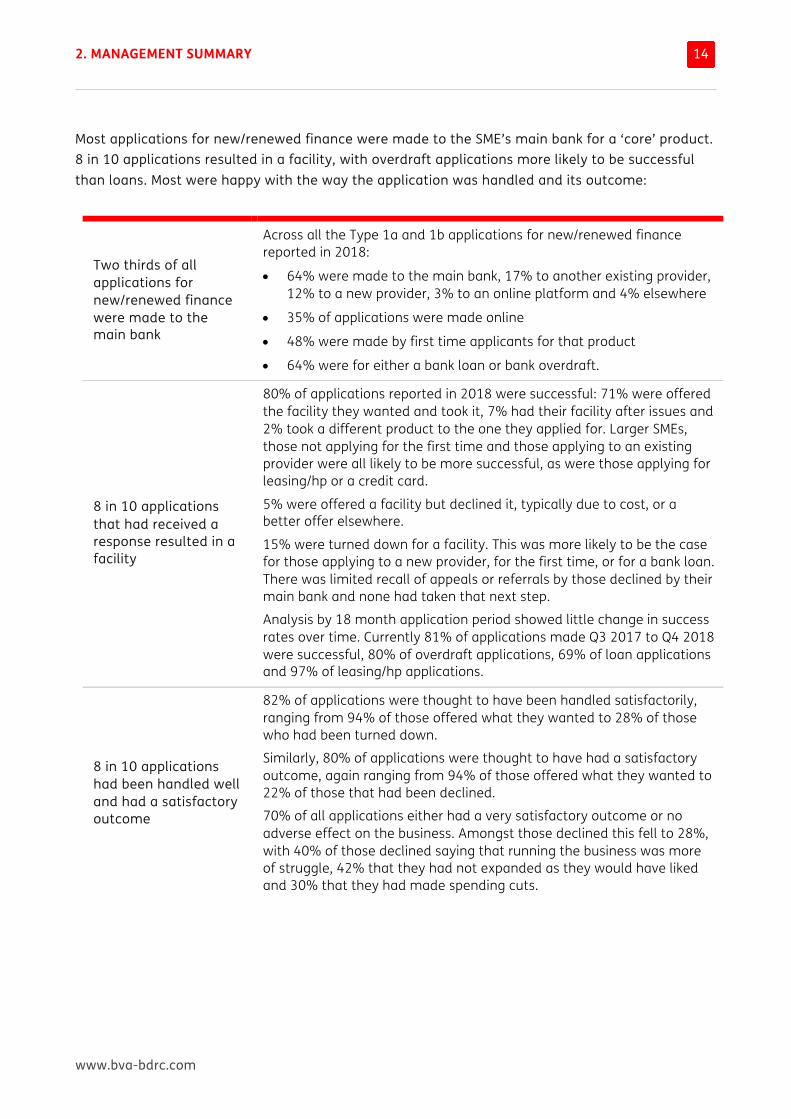
Most applications for new/renewed finance were made to the SME’s main bank for a ‘core’ product. 8 in 10 applications resulted in a facility, with overdraft applications more likely to be successful than loans. Most were happy with the way the application was handled and its outcome:
Two thirds of all applications for new/renewed finance were made to the main bank
Across all the Type 1a and 1b applications for new/renewed finance reported in 2018:
• 64% were made to the main bank, 17% to another existing provider, 12% to a new provider, 3% to an online platform and 4% elsewhere
• 35% of applications were made online
• 48% were made by first time applicants for that product
• 64% were for either a bank loan or bank overdraft.
8 in 10 applications that had received a response resulted in a facility
80% of applications reported in 2018 were successful: 71% were offered the facility they wanted and took it, 7% had their facility after issues and 2% took a different product to the one they applied for. Larger SMEs, those not applying for the first time and those applying to an existing provider were all likely to be more successful, as were those applying for leasing/hp or a credit card.
5% were offered a facility but declined it, typically due to cost, or a better offer elsewhere.
15% were turned down for a facility. This was more likely to be the case for those applying to a new provider, for the first time, or for a bank loan. There was limited recall of appeals or referrals by those declined by their main bank and none had taken that next step.
Analysis by 18 month application period showed little change in success rates over time. Currently 81% of applications made Q3 2017 to Q4 2018 were successful, 80% of overdraft applications, 69% of loan applications and 97% of leasing/hp applications.
8 in 10 applications had been handled well and had a satisfactory outcome
82% of applications were thought to have been handled satisfactorily, ranging from 94% of those offered what they wanted to 28% of those who had been turned down.
Similarly, 80% of applications were thought to have had a satisfactory outcome, again ranging from 94% of those offered what they wanted to 22% of those that had been declined.
70% of all applications either had a very satisfactory outcome or no adverse effect on the business. Amongst those declined this fell to 28%, with 40% of those declined saying that running the business was more of struggle, 42% that they had not expanded as they would have liked and 30% that they had made spending cuts.
2. MANAGEMENT SUMMARY
www.bva-bdrc.com
15
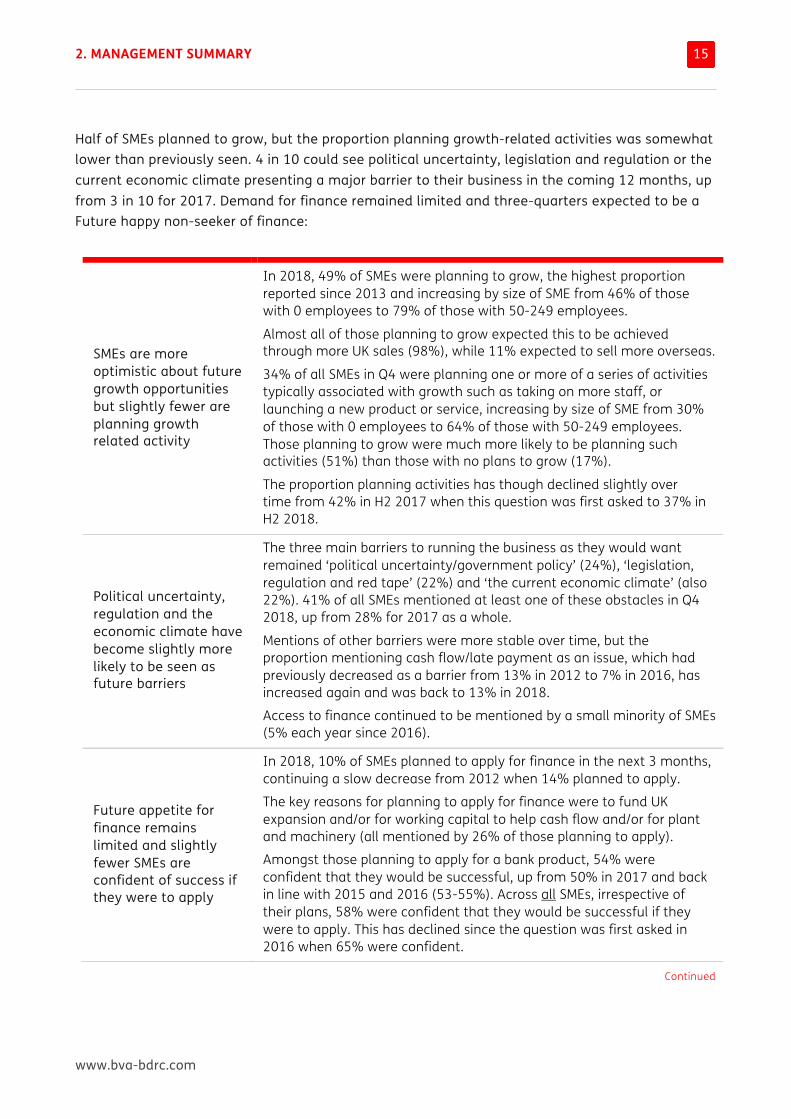
Half of SMEs planned to grow, but the proportion planning growth-related activities was somewhat lower than previously seen. 4 in 10 could see political uncertainty, legislation and regulation or the current economic climate presenting a major barrier to their business in the coming 12 months, up from 3 in 10 for 2017. Demand for finance remained limited and three-quarters expected to be a Future happy non-seeker of finance:
SMEs are more optimistic about future growth opportunities but slightly fewer are planning growth related activity
In 2018, 49% of SMEs were planning to grow, the highest proportion reported since 2013 and increasing by size of SME from 46% of those with 0 employees to 79% of those with 50-249 employees.
Almost all of those planning to grow expected this to be achieved through more UK sales (98%), while 11% expected to sell more overseas.
34% of all SMEs in Q4 were planning one or more of a series of activities typically associated with growth such as taking on more staff, or launching a new product or service, increasing by size of SME from 30% of those with 0 employees to 64% of those with 50-249 employees. Those planning to grow were much more likely to be planning such activities (51%) than those with no plans to grow (17%).
The proportion planning activities has though declined slightly over time from 42% in H2 2017 when this question was first asked to 37% in H2 2018.
Political uncertainty, regulation and the economic climate have become slightly more likely to be seen as future barriers
The three main barriers to running the business as they would want remained ‘political uncertainty/government policy’ (24%), ‘legislation, regulation and red tape’ (22%) and ‘the current economic climate’ (also 22%). 41% of all SMEs mentioned at least one of these obstacles in Q4 2018, up from 28% for 2017 as a whole.
Mentions of other barriers were more stable over time, but the proportion mentioning cash flow/late payment as an issue, which had previously decreased as a barrier from 13% in 2012 to 7% in 2016, has increased again and was back to 13% in 2018.
Access to finance continued to be mentioned by a small minority of SMEs (5% each year since 2016).
Future appetite for finance remains limited and slightly fewer SMEs are confident of success if they were to apply
In 2018, 10% of SMEs planned to apply for finance in the next 3 months, continuing a slow decrease from 2012 when 14% planned to apply.
The key reasons for planning to apply for finance were to fund UK expansion and/or for working capital to help cash flow and/or for plant and machinery (all mentioned by 26% of those planning to apply).
Amongst those planning to apply for a bank product, 54% were confident that they would be successful, up from 50% in 2017 and back in line with 2015 and 2016 (53-55%). Across all SMEs, irrespective of their plans, 58% were confident that they would be successful if they were to apply. This has declined since the question was first asked in 2016 when 65% were confident.
Continued
2. MANAGEMENT SUMMARY
www.bva-bdrc.com
16
Continued
Future would-be seekers are put off applying by the current economic climate
While 10% of SMEs planned to apply, 13% of SMEs met the definition of a Future would-be seeker of finance (who wanted to apply but thought something would stop them). The biggest group continued to be the Future happy non-seekers (77% of all SMEs).
Amongst Future would-be seekers the key reason for not applying was the current economic climate, mentioned by 57% as their main reason for not applying. 20% cited issues with the process of borrowing while 13% felt discouraged from applying.
Those trading internationally or employing overseas staff have some concerns
SMEs that trade internationally remained more likely to be planning to grow and to apply for finance than domestic only SMEs but also more likely to cite political uncertainty as a barrier, as well as the value of sterling and, to a lesser extent, the current economic climate. Over time, such international SMEs have remained more likely to be planning to grow than their domestic only peers but their appetite for finance has declined (although still ahead of their peers).
16% of all SME employers employed staff from overseas, predominantly from the EU (14%) rather than further afield (5%). The proportion employing overseas staff was somewhat lower in 2018 than it was in H2 2017 when this question was first asked (23%).
51% of SMEs with overseas employees were concerned about possible changes to migration rules (the equivalent of 8% of all employers) and this was higher than in H2 2017, when 42% were concerned.

www.bva-bdrc.com
3 USING THIS REPORT
3. USING THIS REPORT
www.bva-bdrc.com
18
As well as the overall SME market, key elements have been analysed by a number of other factors where sample sizes permit. Typically, nothing will be reported on a base size of less than 100 – where this has been done an asterisk * highlights the care to be taken with a small base size. If appropriate, a qualitative or indicative assessment has been provided where base sizes are too small to report.
Much of the analysis is by size of business, based on the number of employees (excluding the respondent). This is because research has repeatedly shown that SMEs are not a homogenous group in their need for external finance, or their ability to obtain it, and that size of business can be a significant factor. The employee size bands used are the standard bands of 0 (typically a sole trader), 1-9, 10-49 and 50-249 employees.
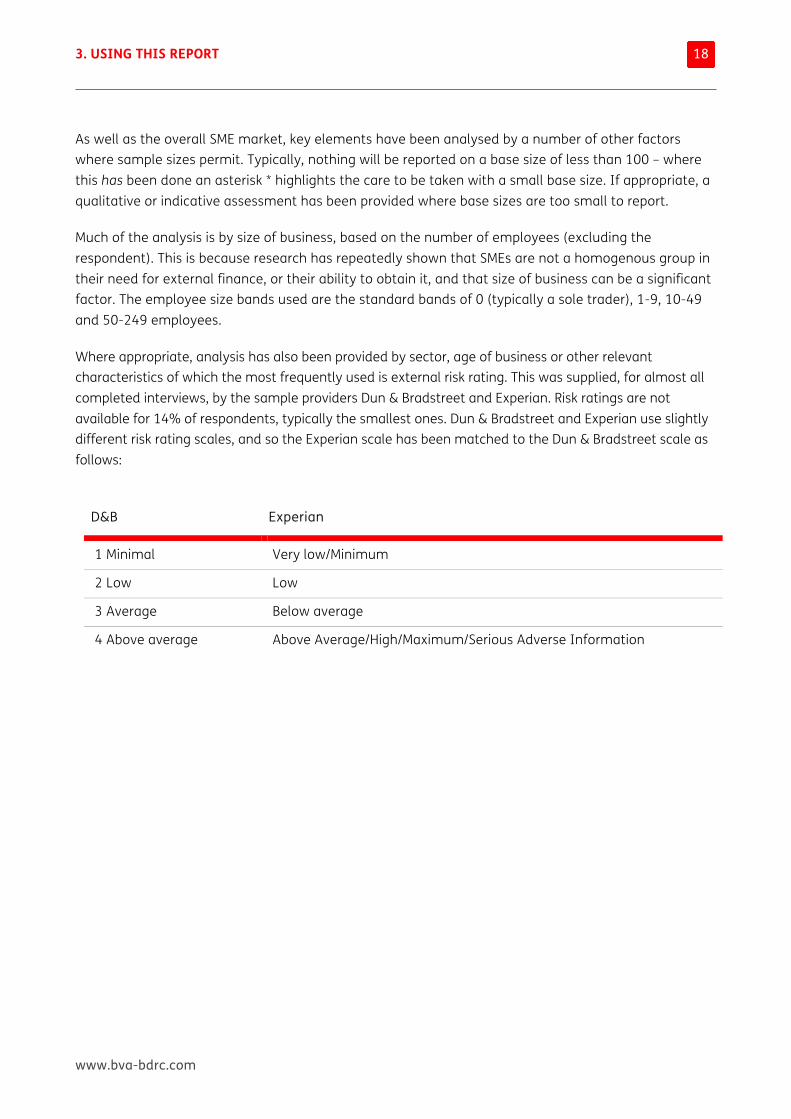
Where appropriate, analysis has also been provided by sector, age of business or other relevant characteristics of which the most frequently used is external risk rating. This was supplied, for almost all completed interviews, by the sample providers Dun & Bradstreet and Experian. Risk ratings are not available for 14% of respondents, typically the smallest ones. Dun & Bradstreet and Experian use slightly different risk rating scales, and so the Experian scale has been matched to the Dun & Bradstreet scale as follows:
D&B Experian
1 Minimal Very low/Minimum
2 Low Low
3 Average Below average
4 Above average Above Average/High/Maximum/Serious Adverse Information
3. USING THIS REPORT
www.bva-bdrc.com
19
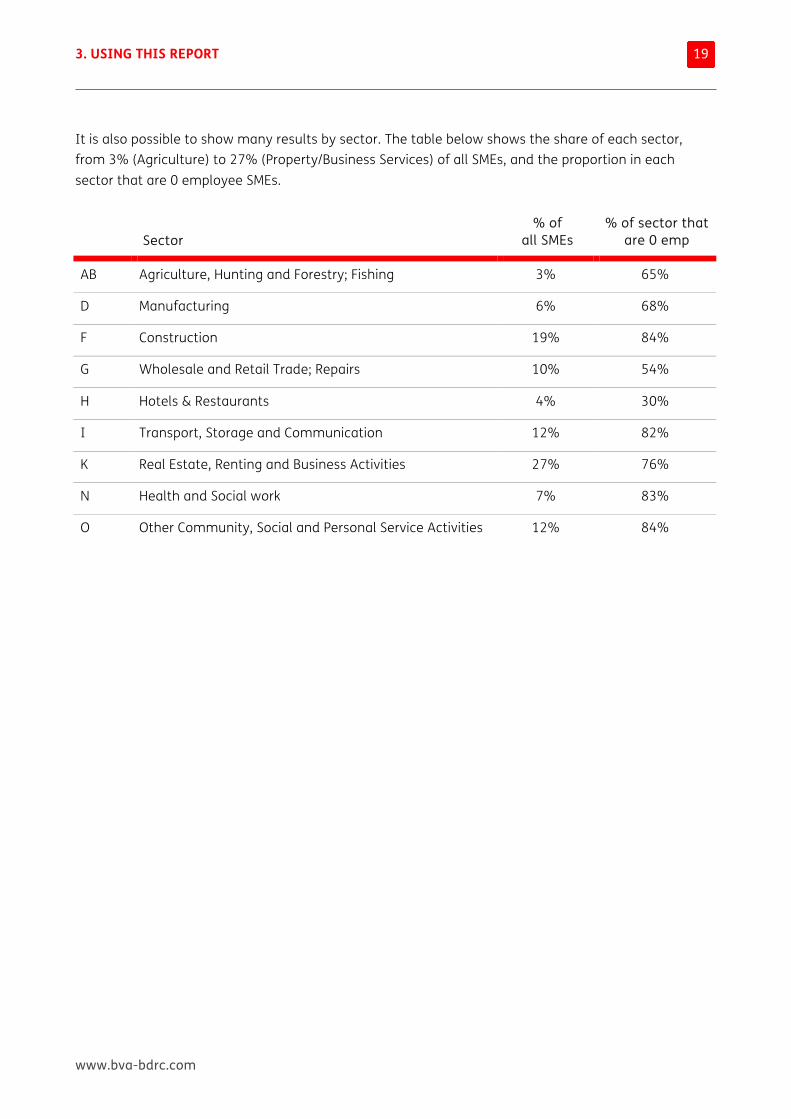
It is also possible to show many results by sector. The table below shows the share of each sector, from 3% (Agriculture) to 27% (Property/Business Services) of all SMEs, and the proportion in each sector that are 0 employee SMEs.
Sector
% of all SMEs
% of sector that are 0 emp
AB Agriculture, Hunting and Forestry; Fishing 3% 65%
D Manufacturing 6% 68%
F Construction 19% 84%
G Wholesale and Retail Trade; Repairs 10% 54%
H Hotels & Restaurants 4% 30%
I Transport, Storage and Communication 12% 82%
K Real Estate, Renting and Business Activities 27% 76%
N Health and Social work 7% 83%
O Other Community, Social and Personal Service Activities 12% 84%
3. USING THIS REPORT
www.bva-bdrc.com
20
ANALYSIS OVER TIME This report is based predominantly on four waves of data gathered across the 4 quarters of 2018. In all four waves, SMEs were asked about their past behaviour during the previous 12 months, so there is an overlap in the time period each wave has reported on. These year-ending figures are defined by the date of interview, i.e. all interviews conducted in the year concerned.
Where results can be shown by individual quarter over time, they have been. However, small sample sizes for some lines of questioning mean that in those instances data is reported based on four quarters combined (YEQ4 2018 in this report). This provides a robust sample size and allows for analysis by key sub-groups such as size, sector or external risk rating.
Each report also comments on changes in demand for credit and the outcome of applications over time. Here, it is more appropriate to analyse results based on when the application was made, rather than when the interview was conducted. The extensive changes made to the questionnaire for Q1 2018 mean that base sizes for applications made are currently limited to those reported in 2018. As the data builds over future waves, analysis by date of application will once again become possible (typically in 18 month periods).
The exception to the approach outlined above, apart from when a new question has been introduced, is in the latter stages of the report where SMEs were asked about their planned future behaviour. In these instances, where we are typically reporting expectations for the next three months, comparisons are made between individual quarters as each provides an assessment of SME sentiment for the coming months and the comparison is an appropriate one.
Not all of the previous quarters are shown in the standard quarterly tables in this report. Quarterly data from 2011-2016 is no longer routinely shown and subsequent reports will continue this policy of deleting the oldest wave before adding the latest.
However, a series of annual summary tables have been developed and were included for the first time in the Q2 2016 report. These complement the series of key charts in the final chapter of this report which show all results over time for key metrics.
3. USING THIS REPORT
www.bva-bdrc.com
21
DEFINITIONS USED IN THIS REPORT Over time, a number of definitions have been developed for different SMEs and some standard terms are commonly used in this report. The most frequently used are summarised below:
SME size – this is based on the number of employees (excluding the respondent). Those with more than 249 employees were excluded from the research
External risk profile – this is provided by the sample providers (Dun & Bradstreet and Experian). Risk ratings are not available for 15% of respondents, typically the smallest ones. D&B and Experian use slightly different risk rating scales, and so the Experian scale has been matched to the D&B scale as shown at the start of this chapter
Fast growth – SMEs that report having grown by 20% or more each year, for each of the past 3 years (definition updated Q4 2012)
Use of external finance – SMEs were asked whether they were currently using any of the following forms of finance: Bank overdraft, Credit cards, Bank loan, Commercial mortgage, Leasing or hire purchase, Loans/equity from directors, Loans/equity from family and friends, Invoice finance, Grants, Loans from other 3rd parties, Export/import finance, crowd funding, asset based lending, or any other loan or overdraft facility
Permanent non-borrower – SMEs that seem firmly disinclined to borrow because they meet all of the following conditions: are not currently using external finance, have not used external finance in the past 5 years, have had no borrowing events in the past 12 months, have not applied for any other forms of finance in the last 12 months, said that they had had no desire to borrow in the past 12 months and reported no inclination to borrow in the next 3 months
Borrowing event – there are now 5 types of borrowing event recorded on the SME Finance Monitor:
• Type 1a: Where a need for funding resulted in a borrowing event (involving any product and any provider)
• Type 1b: Where the SME had (also) applied for any other new or renewed facility, from a list of major products
• Type 1c: Any other application made and not already mentioned
• Where the SME’s overdraft had been automatically renewed
• Type 2/3 events: Where the SME or the finance provider had sought to cancel or re-negotiate a facility before it was due to be repaid.
3. USING THIS REPORT
www.bva-bdrc.com
22
Would-be seeker – those SMEs that had not had a borrowing event and said that something had stopped them applying for funding in the previous 12 months (definition revised in Q1 2018 – the question is now asked for all borrowing not just loans and overdrafts, but the question wording has not changed)
Happy non-seeker – those SMEs that had not had a borrowing event, and also said that nothing had stopped them applying for any (further) funding in the previous 12 months (definition revised in Q1 2018)
Issues – something that needed further discussion before a loan or overdraft facility was agreed, typically the terms and conditions (security, fee or interest rate) or the amount initially offered by the bank
Principle of borrowing – where an SME did not (or, looking ahead, will not) apply to borrow because they feared they might lose control of their business, or preferred to seek alternative sources of funding
Process of borrowing – where an SME did not (or, looking ahead, will not) apply to borrow because they thought it would be too expensive, too much hassle etc.
Discouragement – where an SME did not (or, looking ahead, will not) apply to borrow because it had been put off, either directly (they made informal enquiries of the bank and felt put off) or indirectly (they thought they would be turned down by the bank so did not enquire)
Major obstacle – SMEs were asked to rate the extent to which each of a number of factors were perceived as obstacles to their running the business as they would wish in the next 12 months, using a 1 to 10 scale. Ratings of 8-10 are classed as a major obstacle
Future happy non-seekers – those that said they would not be applying to borrow (more) in the next three months because they said that they did not need to borrow (more) or already had the facilities they needed
Future would-be seekers – those that felt that there were barriers that would stop them applying to borrow (more) in the next three months (such as discouragement, the economy or the principle or process of borrowing)
Average – the arithmetic mean of values, calculated by adding the values together and dividing by the number of cases
Median – a different type of average, found by arranging the values in order and then selecting the one in the middle. The median is a useful number in cases where there are very large extreme values which would otherwise skew the data, such as a few very large loans or overdraft facilities

3. USING THIS REPORT
www.bva-bdrc.com
23
Please note that the majority of data tables show column percentages, which means that the percentage quoted is the percentage of the group described at the top of the column in which the figure appears. On some occasions, particularly for data shown over time, summary tables have been prepared which include row percentages, which means that the percentage quoted is the percentage of the group described at the left hand side of the row in which the figure appears. Where row percentages are shown, this is highlighted in the table.
From the Q2 2016 report onwards, additional summary tables have been prepared for key questions to show the changes year on year since 2012. This provides a longer term context for the changes being seen in the most recent quarters, upon which most reporting is based.
www.bva-bdrc.com
4 THE GENERAL CONTEXT THIS CHAPTER PRESENTS an overview of the characteristics of SMEs in the UK. Unless otherwise stated, figures are based on all interviews conducted in the year ending Q4 2018 (YEQ4 18).
4. THE GENERAL CONTEXT
www.bva-bdrc.com
25
KEY FINDINGS Growth: 4 in 10 SMEs (39%) reported having grown in the 12 months prior to interview, with 2% having grown by 40% or more.
• The proportion that have grown has varied very little over time (39-42% since 2013), but since 2016 an increasing minority of SMEs have reported a decline (10% in 2016 to 17% in 2018), albeit not quite back to levels seen in 2012 (21%)
• A consistent quarter of SMEs (26%) said their business had developed ‘quite a bit’ over the last three years, while 10% had retrenched. Most, 63%, said the business was ‘recognisably the same’ as before
Profitability: Between 2012 and 2017 the proportion of SMEs reporting a profit increased from 69% to 82%. The figure for 2018 was slightly lower (78%), due to slightly fewer 0 employee SMEs reporting a profit, although most did (77% from 81%).
• An increasing proportion of SMEs said that improving their profit margin was a priority – from 22% in Q1 2018 to 36% in Q4 and 30% for 2018 as a whole
Credit balances: 23% of SMEs held more than £10,000 in credit balances and this has been stable since 2015. 8 in 10 who held such balances said that it reduced their need for external finance, the equivalent of 1 in 10 of all SMEs.
• The proportion of SMEs with 10-49 or 50-249 employees that hold £10,000 or more of credit balances has increased steadily (to 75% and 91% respectively in 2018) while the proportion of smaller SMEs with such balances has stabilised
• Where available, having £10,000 of credit balances was more likely to reduce the need for external finance (82%) than having access to trade credit (68% of a different group of SMEs)
• Overall, 29% of SMEs said their need for finance was reduced by either £10,000 of credit balances or having access to trade credit
4. THE GENERAL CONTEXT
www.bva-bdrc.com
26
International: 15% of SMEs traded internationally and this was little changed over recent years
• 18% of exporters made half or more of their total sales overseas, with little variation by size. A quarter (28%) made all or most of their sales to the EU, declining by size of SME. There was no clear pattern over time
• 16% of all SMEs with employees said that they employ staff from overseas, typically from the EU (14%) rather than further afield (5%), increasing to half of all SMEs with 50-249 employees (56%). The proportion employing overseas staff was somewhat lower in 2018 (16%) than it was in H2 2017 when this question was first asked (23%)
• 51% of SMEs with overseas employees were concerned about possible changes to migration rules (the equivalent of 8% of all employers) and this was higher than in H2 2017 (42%)
Managing the business: The proportions of SMEs that plan (56%) or have a qualified person in charge of the finances (25%) have been stable over time, but there has been a continued decline in the proportion that have innovated (33% in 2018 from 40% in 2012)
• 83% of SMEs sell to consumers and 55% to other businesses (37% sell to both). Larger SMEs and exporters were somewhat more likely to sell to businesses and less likely to sell to consumers. A third of those selling to businesses had more than 50 customers
The banking relationship: Most SMEs described their relationship with the bank as ‘fine but transactional’ (63%) and levels of switching remained low (2%)
• 15% of SMEs didn’t have an active relationship with their bank and wished that they did, and this has increased slightly since 2016 (12%)
• 55% had a high level of trust in their main bank compared to 25% in the banking industry generally. 23% had a high level of trust in both
4. THE GENERAL CONTEXT
www.bva-bdrc.com
27
This chapter presents an overview of the characteristics of SMEs in the UK and has been largely unaffected by the changes made to the questionnaire in Q1 2018. Unless otherwise stated, figures are based on the 18,002 interviews conducted in the year ending Q4 2018 (that is Q1, Q2, Q3 and Q4 of 2018). SMEs have faced a range of trading challenges since the SME Finance Monitor started, with the UK economy seeing differing levels of growth, a number of General Elections and the 2016 EU referendum. Analysis of this data over time provides an indication of how SMEs have managed as conditions have changed.
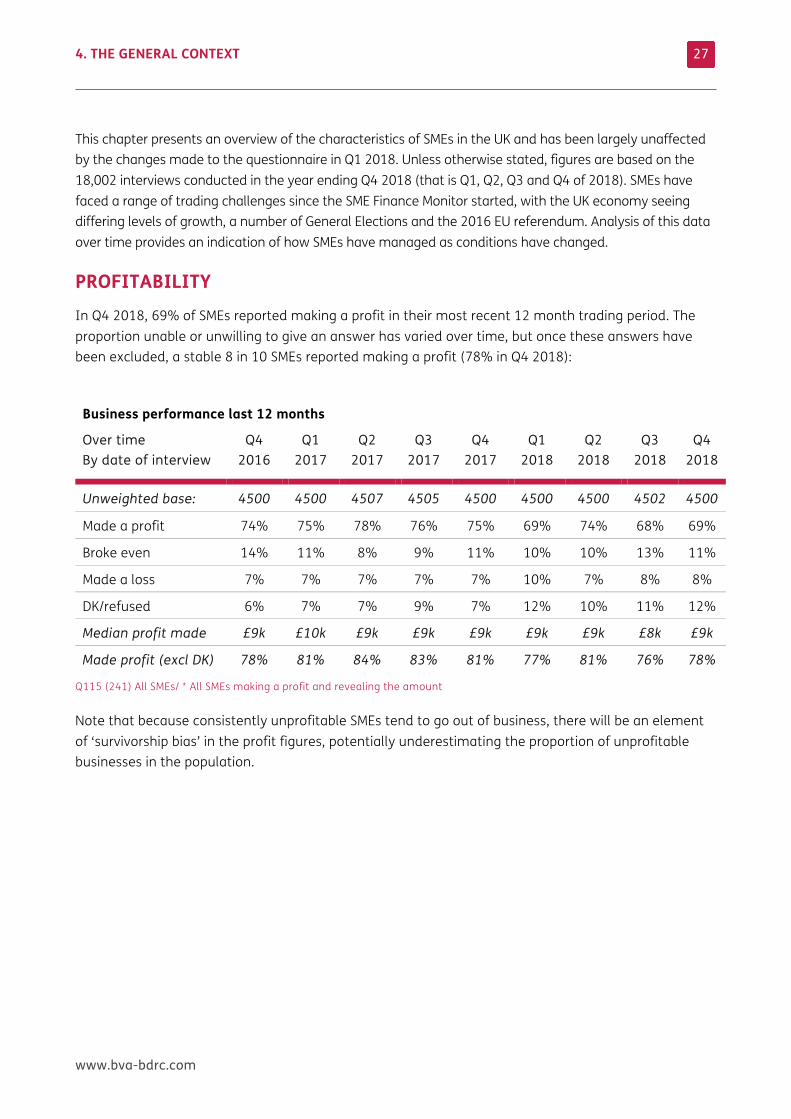
PROFITABILITY In Q4 2018, 69% of SMEs reported making a profit in their most recent 12 month trading period. The proportion unable or unwilling to give an answer has varied over time, but once these answers have been excluded, a stable 8 in 10 SMEs reported making a profit (78% in Q4 2018):
Business performance last 12 months
Over time By date of interview
Q4 2016
Q1 2017
Q2 2017
Q3 2017
Q4 2017
Q1 2018
Q2 2018
Q3 2018
Q4 2018
Unweighted base: 4500 4500 4507 4505 4500 4500 4500 4502 4500
Made a profit 74% 75% 78% 76% 75% 69% 74% 68% 69%
Broke even 14% 11% 8% 9% 11% 10% 10% 13% 11%
Made a loss 7% 7% 7% 7% 7% 10% 7% 8% 8%
DK/refused 6% 7% 7% 9% 7% 12% 10% 11% 12%
Median profit made £9k £10k £9k £9k £9k £9k £9k £8k £9k
Made profit (excl DK) 78% 81% 84% 83% 81% 77% 81% 76% 78%
Q115 (241) All SMEs/ * All SMEs making a profit and revealing the amount
Note that because consistently unprofitable SMEs tend to go out of business, there will be an element of ‘survivorship bias’ in the profit figures, potentially underestimating the proportion of unprofitable businesses in the population.
4. THE GENERAL CONTEXT
www.bva-bdrc.com
28
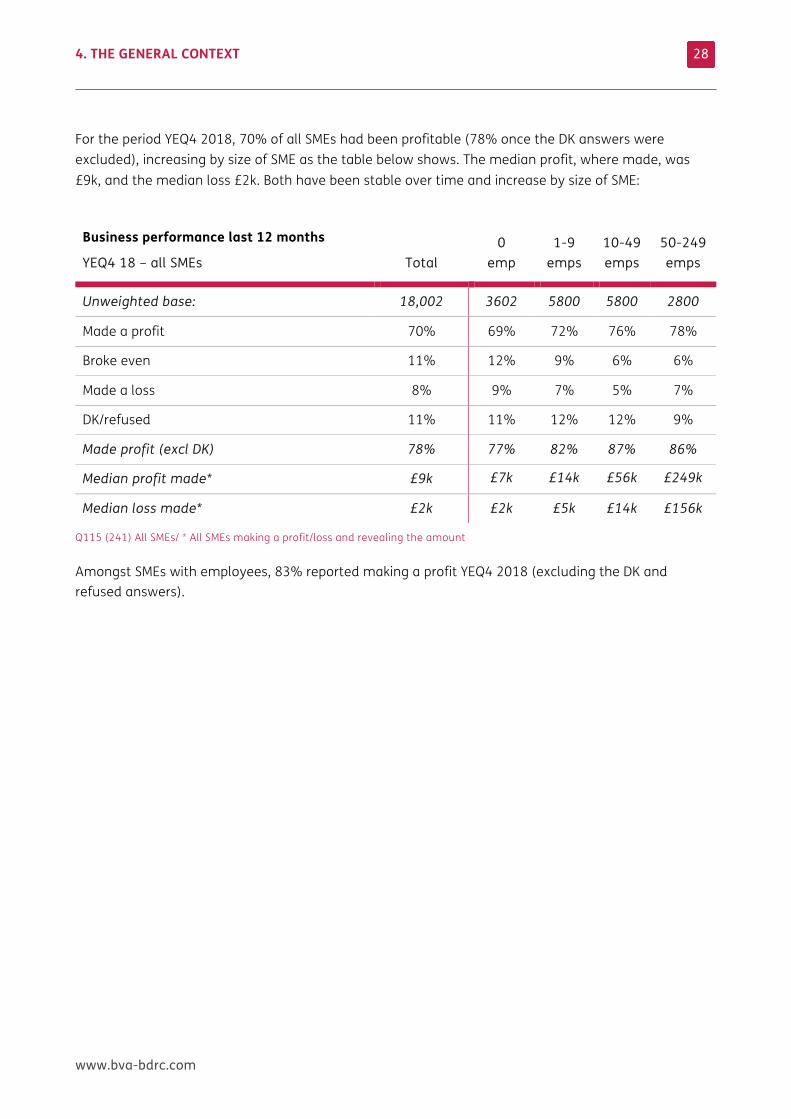
For the period YEQ4 2018, 70% of all SMEs had been profitable (78% once the DK answers were excluded), increasing by size of SME as the table below shows. The median profit, where made, was £9k, and the median loss £2k. Both have been stable over time and increase by size of SME:
Business performance last 12 months
YEQ4 18 – all SMEs
Total 0
emp 1-9
emps 10-49 emps
50-249 emps
Unweighted base: 18,002 3602 5800 5800 2800
Made a profit 70% 69% 72% 76% 78%
Broke even 11% 12% 9% 6% 6%
Made a loss 8% 9% 7% 5% 7%
DK/refused 11% 11% 12% 12% 9%
Made profit (excl DK) 78% 77% 82% 87% 86%
Median profit made* £9k £7k £14k £56k £249k
Median loss made* £2k £2k £5k £14k £156k
Q115 (241) All SMEs/ * All SMEs making a profit/loss and revealing the amount
Amongst SMEs with employees, 83% reported making a profit YEQ4 2018 (excluding the DK and refused answers).
4. THE GENERAL CONTEXT
www.bva-bdrc.com
29
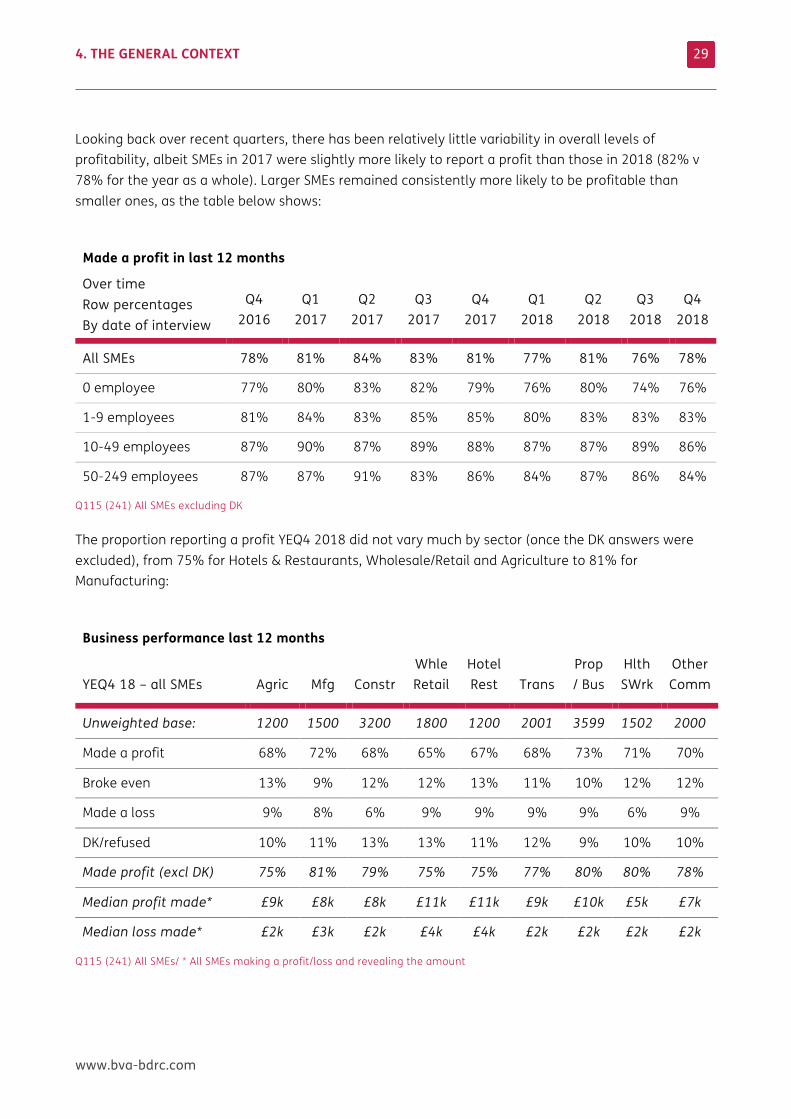
Looking back over recent quarters, there has been relatively little variability in overall levels of profitability, albeit SMEs in 2017 were slightly more likely to report a profit than those in 2018 (82% v 78% for the year as a whole). Larger SMEs remained consistently more likely to be profitable than smaller ones, as the table below shows:
Q115 (241) All SMEs excluding DK
The proportion reporting a profit YEQ4 2018 did not vary much by sector (once the DK answers were excluded), from 75% for Hotels & Restaurants, Wholesale/Retail and Agriculture to 81% for Manufacturing:
Business performance last 12 months
YEQ4 18 – all SMEs Agric Mfg Constr Whle Retail
Hotel Rest Trans
Prop/ Bus
Hlth SWrk
Other Comm
Unweighted base: 1200 1500 3200 1800 1200 2001 3599 1502 2000
Made a profit 68% 72% 68% 65% 67% 68% 73% 71% 70%
Broke even 13% 9% 12% 12% 13% 11% 10% 12% 12%
Made a loss 9% 8% 6% 9% 9% 9% 9% 6% 9%
DK/refused 10% 11% 13% 13% 11% 12% 9% 10% 10%
Made profit (excl DK) 75% 81% 79% 75% 75% 77% 80% 80% 78%
Median profit made* £9k £8k £8k £11k £11k £9k £10k £5k £7k
Median loss made* £2k £3k £2k £4k £4k £2k £2k £2k £2k
Q115 (241) All SMEs/ * All SMEs making a profit/loss and revealing the amount
Made a profit in last 12 months
Over time Row percentages By date of interview
Q4 2016
Q1 2017
Q2 2017
Q3 2017
Q4 2017
Q1 2018
Q2 2018
Q3 2018
Q4 2018
All SMEs 78% 81% 84% 83% 81% 77% 81% 76% 78%
0 employee 77% 80% 83% 82% 79% 76% 80% 74% 76%
1-9 employees 81% 84% 83% 85% 85% 80% 83% 83% 83%
10-49 employees 87% 90% 87% 89% 88% 87% 87% 89% 86%
50-249 employees 87% 87% 91% 83% 86% 84% 87% 86% 84%
4. THE GENERAL CONTEXT
www.bva-bdrc.com
30
Median profits reported for YEQ4 2018 varied somewhat by sector (£5-11k) with little change over time. Reported median losses for YEQ4 2018 were £2k overall and for almost all sectors.
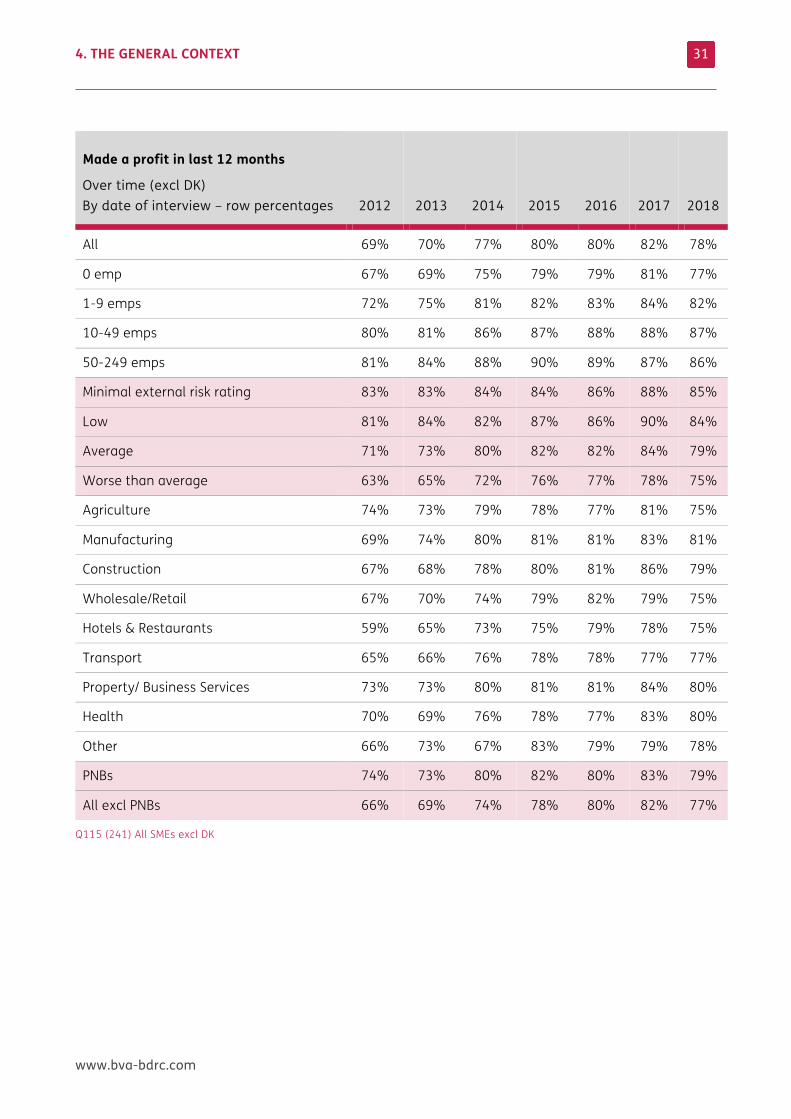
The table below takes a longer term view of profitability (back to 2012 and also excluding DK/refused answers) by key demographics. This shows that an increasing proportion of SMEs reported making a profit between 2012 (69%) and 2017 (82%), while the figure for 2018 was somewhat lower (78%).
The proportion making a profit has increased over time across all size bands, but notably for those with 0 employees (67% to 81% 2012-17) albeit the 2018 figure of 77% was somewhat lower. Between 2012 and 2015, Permanent non-Borrowers with no apparent appetite for finance were more likely to be profitable than their peers, but since then there has been little to choose between the two groups:
4. THE GENERAL CONTEXT
www.bva-bdrc.com
31
Made a profit in last 12 months
Over time (excl DK) By date of interview – row percentages 2012 2013 2014 2015
2016 2017 2018
All 69% 70% 77% 80% 80% 82% 78%
0 emp 67% 69% 75% 79% 79% 81% 77%
1-9 emps 72% 75% 81% 82% 83% 84% 82%
10-49 emps 80% 81% 86% 87% 88% 88% 87%
50-249 emps 81% 84% 88% 90% 89% 87% 86%
Minimal external risk rating 83% 83% 84% 84% 86% 88% 85%
Low 81% 84% 82% 87% 86% 90% 84%
Average 71% 73% 80% 82% 82% 84% 79%
Worse than average 63% 65% 72% 76% 77% 78% 75%
Agriculture 74% 73% 79% 78% 77% 81% 75%
Manufacturing 69% 74% 80% 81% 81% 83% 81%
Construction 67% 68% 78% 80% 81% 86% 79%
Wholesale/Retail 67% 70% 74% 79% 82% 79% 75%
Hotels & Restaurants 59% 65% 73% 75% 79% 78% 75%
Transport 65% 66% 76% 78% 78% 77% 77%
Property/ Business Services 73% 73% 80% 81% 81% 84% 80%
Health 70% 69% 76% 78% 77% 83% 80%
Other 66% 73% 67% 83% 79% 79% 78%
PNBs 74% 73% 80% 82% 80% 83% 79%
All excl PNBs 66% 69% 74% 78% 80% 82% 77%
Q115 (241) All SMEs excl DK
4. THE GENERAL CONTEXT
www.bva-bdrc.com
32
From Q1 2018 SMEs were asked whether increasing their profit margin was a key priority for the business. YEQ4 2018, 30% of all SMEs said that it was, increasing by size of SME:
• 28% of SMEs with 0 employees said it was a priority • 34% of SMEs with 1-9 employees • 40% of SMEs with 10-49 employees • 51% of SMEs with 50-249 employees said it was a priority.
35% of SMEs with employees said that improving profit margins was a key priority.
Further analysis showed that for 2018 as a whole
• There was little variation by risk rating in the proportion saying it was a priority (28-31%).
• Excluding the Permanent non-borrowers increased the proportion saying it was a priority to 34% (compared to 25% of PNBs).
• 36% of those using finance, and 39% of those planning to grow in the next 12 months, said it was a priority (compared to 26% of those not using finance and 21% not planning to grow).
• Those trading for 2-5 years were the most likely to say it was a priority (35%) compared to 27% of those trading for more than 15 years and 29-30% of other SMEs.
• Those in Wholesale/Retail or Property/Businesses Services were somewhat more likely to say it was a priority (both 33%), while those in Health were the least likely (21%).
• Those who had made a profit in the last year were as likely to say that improving profit margins was a priority (30%) as those who had made a loss (31%), with those who broke even somewhat less likely to agree (24%):
• Analysis by size of SME showed improving profit margins was an equal prority for 0 employee and 1-9 employee SMEs whether they had previously made a profit or a loss.
• It was slighty more of a priority for SMEs with 10-49 employees if they had made a loss (44%) than a profit (40%) and this was even more likley to be the case for those with 50-249 employees (62% if they made a loss compared to 53% if they had made a profit).
Over the four quarters of 2018 when this question has been asked, the proportion citing the improvement of profit margins as a priority has increased, especially in the second half of the year (from 22% in Q1 to 26% in Q2, 33% in Q3 and 36% in Q4). This was driven by the smallest SMEs (20% to 36% between Q1 and Q4 2018 for those with 0 employees).
4. THE GENERAL CONTEXT
www.bva-bdrc.com
33
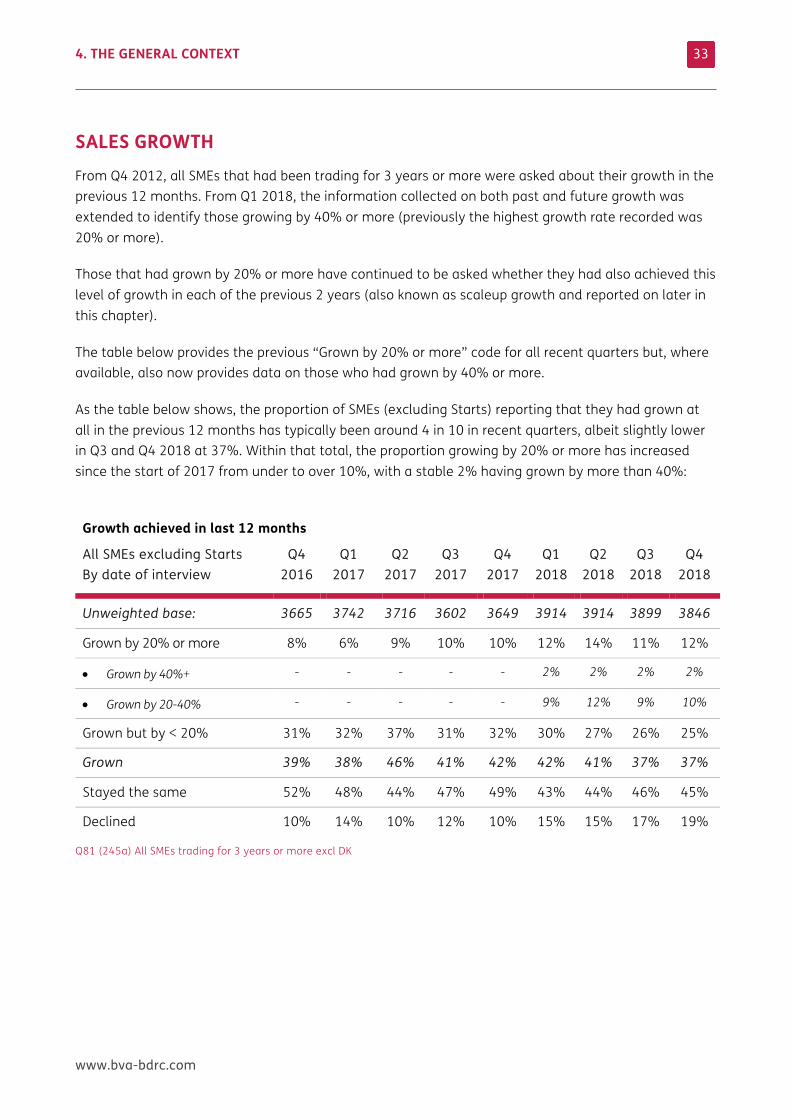
SALES GROWTH From Q4 2012, all SMEs that had been trading for 3 years or more were asked about their growth in the previous 12 months. From Q1 2018, the information collected on both past and future growth was extended to identify those growing by 40% or more (previously the highest growth rate recorded was 20% or more).
Those that had grown by 20% or more have continued to be asked whether they had also achieved this level of growth in each of the previous 2 years (also known as scaleup growth and reported on later in this chapter).
The table below provides the previous “Grown by 20% or more” code for all recent quarters but, where available, also now provides data on those who had grown by 40% or more.
As the table below shows, the proportion of SMEs (excluding Starts) reporting that they had grown at all in the previous 12 months has typically been around 4 in 10 in recent quarters, albeit slightly lower in Q3 and Q4 2018 at 37%. Within that total, the proportion growing by 20% or more has increased since the start of 2017 from under to over 10%, with a stable 2% having grown by more than 40%:
Growth achieved in last 12 months
All SMEs excluding Starts By date of interview
Q4 2016
Q1 2017
Q2 2017
Q3 2017
Q4 2017
Q1 2018
Q2 2018
Q3 2018
Q4 2018
Unweighted base: 3665 3742 3716 3602 3649 3914 3914 3899 3846
Grown by 20% or more 8% 6% 9% 10% 10% 12% 14% 11% 12%
• Grown by 40%+ - - - - - 2% 2% 2% 2%
• Grown by 20-40% - - - - - 9% 12% 9% 10%
Grown but by < 20% 31% 32% 37% 31% 32% 30% 27% 26% 25%
Grown 39% 38% 46% 41% 42% 42% 41% 37% 37%
Stayed the same 52% 48% 44% 47% 49% 43% 44% 46% 45%
Declined 10% 14% 10% 12% 10% 15% 15% 17% 19%
Q81 (245a) All SMEs trading for 3 years or more excl DK
4. THE GENERAL CONTEXT
www.bva-bdrc.com
34
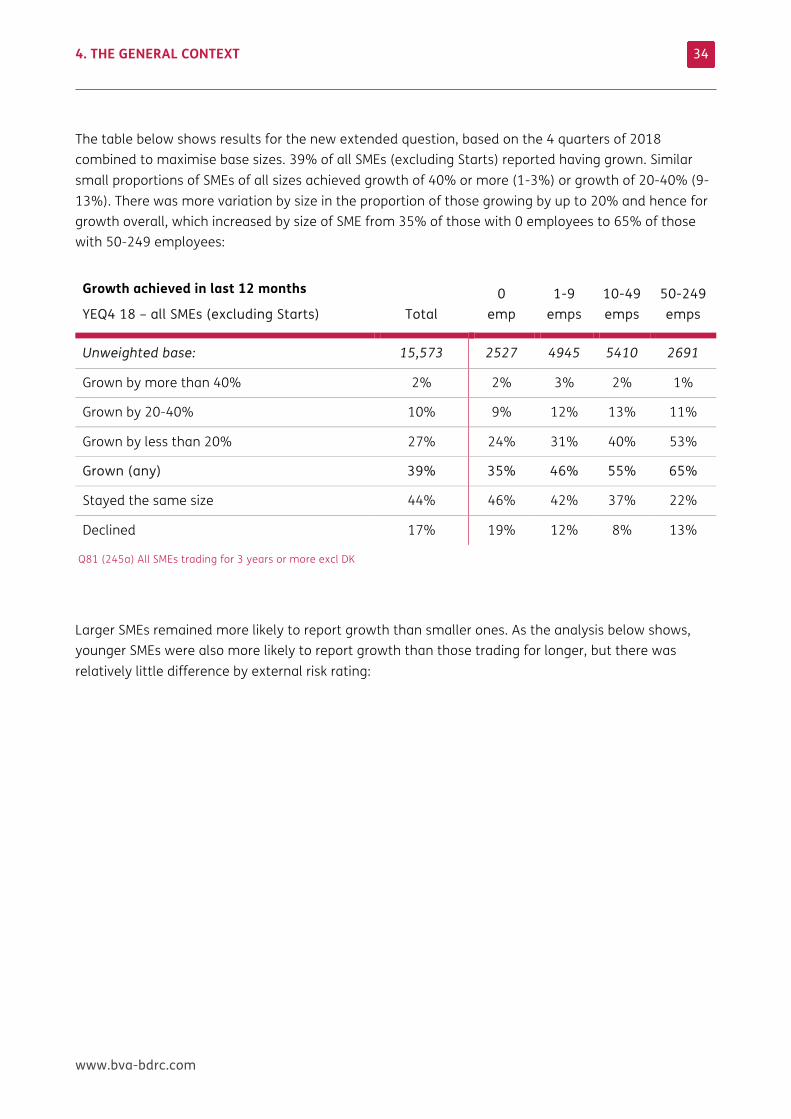
The table below shows results for the new extended question, based on the 4 quarters of 2018 combined to maximise base sizes. 39% of all SMEs (excluding Starts) reported having grown. Similar small proportions of SMEs of all sizes achieved growth of 40% or more (1-3%) or growth of 20-40% (9-13%). There was more variation by size in the proportion of those growing by up to 20% and hence for growth overall, which increased by size of SME from 35% of those with 0 employees to 65% of those with 50-249 employees:
Growth achieved in last 12 months
YEQ4 18 – all SMEs (excluding Starts)
Total 0
emp 1-9
emps 10-49 emps
50-249 emps
Unweighted base: 15,573 2527 4945 5410 2691
Grown by more than 40% 2% 2% 3% 2% 1%
Grown by 20-40% 10% 9% 12% 13% 11%
Grown by less than 20% 27% 24% 31% 40% 53%
Grown (any) 39% 35% 46% 55% 65%
Stayed the same size 44% 46% 42% 37% 22%
Declined 17% 19% 12% 8% 13%
Q81 (245a) All SMEs trading for 3 years or more excl DK
Larger SMEs remained more likely to report growth than smaller ones. As the analysis below shows, younger SMEs were also more likely to report growth than those trading for longer, but there was relatively little difference by external risk rating:
4. THE GENERAL CONTEXT
www.bva-bdrc.com
35
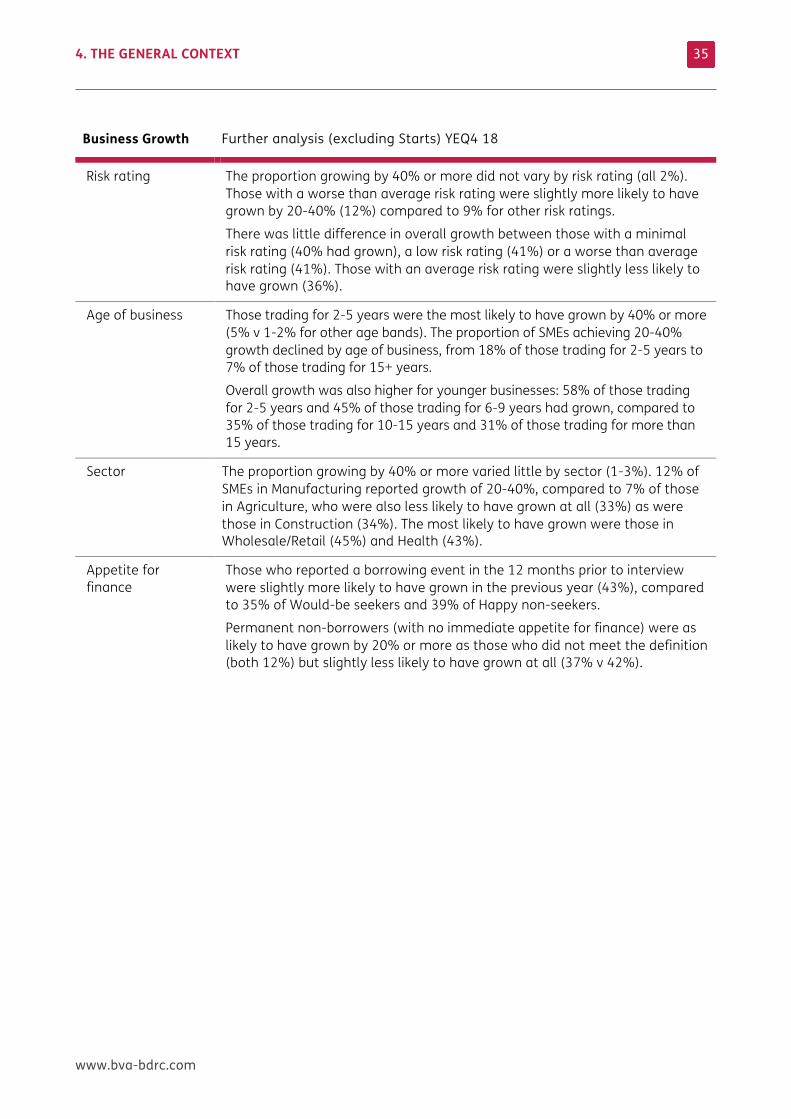
Business Growth Further analysis (excluding Starts) YEQ4 18
Risk rating The proportion growing by 40% or more did not vary by risk rating (all 2%). Those with a worse than average risk rating were slightly more likely to have grown by 20-40% (12%) compared to 9% for other risk ratings.
There was little difference in overall growth between those with a minimal risk rating (40% had grown), a low risk rating (41%) or a worse than average risk rating (41%). Those with an average risk rating were slightly less likely to have grown (36%).
Age of business Those trading for 2-5 years were the most likely to have grown by 40% or more (5% v 1-2% for other age bands). The proportion of SMEs achieving 20-40% growth declined by age of business, from 18% of those trading for 2-5 years to 7% of those trading for 15+ years.
Overall growth was also higher for younger businesses: 58% of those trading for 2-5 years and 45% of those trading for 6-9 years had grown, compared to 35% of those trading for 10-15 years and 31% of those trading for more than 15 years.
Sector The proportion growing by 40% or more varied little by sector (1-3%). 12% of SMEs in Manufacturing reported growth of 20-40%, compared to 7% of those in Agriculture, who were also less likely to have grown at all (33%) as were those in Construction (34%). The most likely to have grown were those in Wholesale/Retail (45%) and Health (43%).
Appetite for finance
Those who reported a borrowing event in the 12 months prior to interview were slightly more likely to have grown in the previous year (43%), compared to 35% of Would-be seekers and 39% of Happy non-seekers.
Permanent non-borrowers (with no immediate appetite for finance) were as likely to have grown by 20% or more as those who did not meet the definition (both 12%) but slightly less likely to have grown at all (37% v 42%).
4. THE GENERAL CONTEXT
www.bva-bdrc.com
36
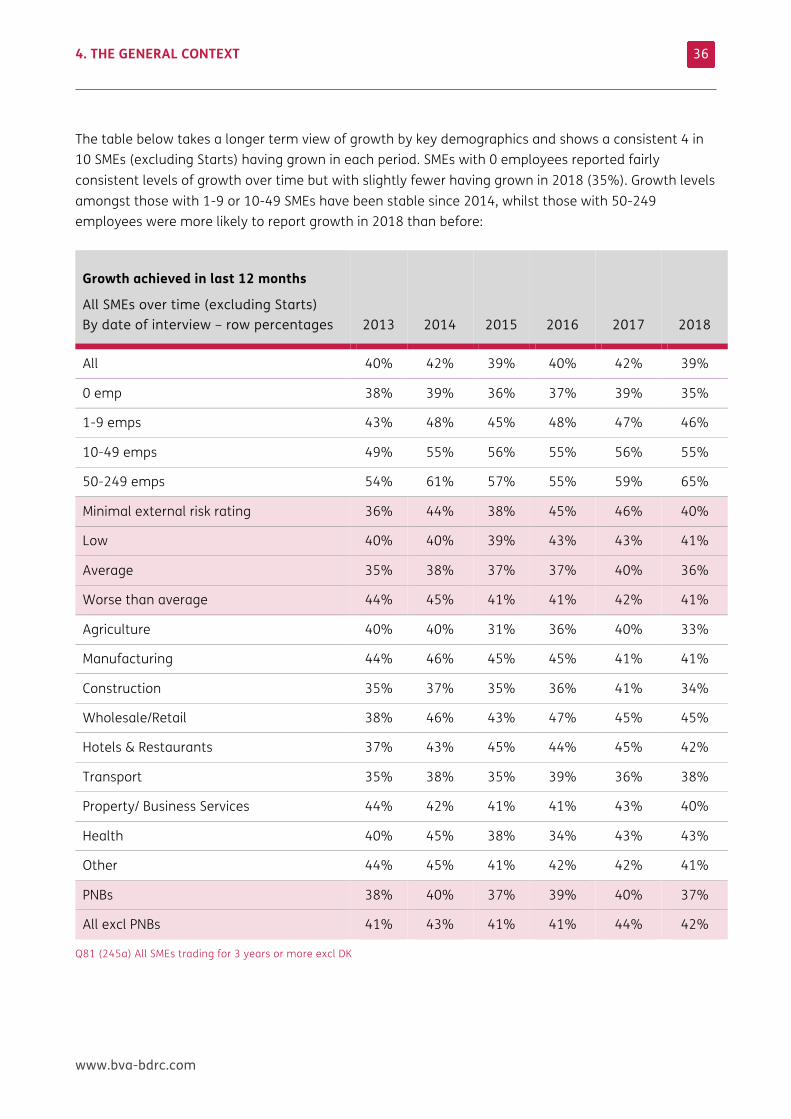
The table below takes a longer term view of growth by key demographics and shows a consistent 4 in 10 SMEs (excluding Starts) having grown in each period. SMEs with 0 employees reported fairly consistent levels of growth over time but with slightly fewer having grown in 2018 (35%). Growth levels amongst those with 1-9 or 10-49 SMEs have been stable since 2014, whilst those with 50-249 employees were more likely to report growth in 2018 than before:
Growth achieved in last 12 months
All SMEs over time (excluding Starts) By date of interview – row percentages 2013 2014 2015 2016 2017 2018
All 40% 42% 39% 40% 42% 39%
0 emp 38% 39% 36% 37% 39% 35%
1-9 emps 43% 48% 45% 48% 47% 46%
10-49 emps 49% 55% 56% 55% 56% 55%
50-249 emps 54% 61% 57% 55% 59% 65%
Minimal external risk rating 36% 44% 38% 45% 46% 40%
Low 40% 40% 39% 43% 43% 41%
Average 35% 38% 37% 37% 40% 36%
Worse than average 44% 45% 41% 41% 42% 41%
Agriculture 40% 40% 31% 36% 40% 33%
Manufacturing 44% 46% 45% 45% 41% 41%
Construction 35% 37% 35% 36% 41% 34%
Wholesale/Retail 38% 46% 43% 47% 45% 45%
Hotels & Restaurants 37% 43% 45% 44% 45% 42%
Transport 35% 38% 35% 39% 36% 38%
Property/ Business Services 44% 42% 41% 41% 43% 40%
Health 40% 45% 38% 34% 43% 43%
Other 44% 45% 41% 42% 42% 41%
PNBs 38% 40% 37% 39% 40% 37%
All excl PNBs 41% 43% 41% 41% 44% 42%
Q81 (245a) All SMEs trading for 3 years or more excl DK
4. THE GENERAL CONTEXT
www.bva-bdrc.com
37
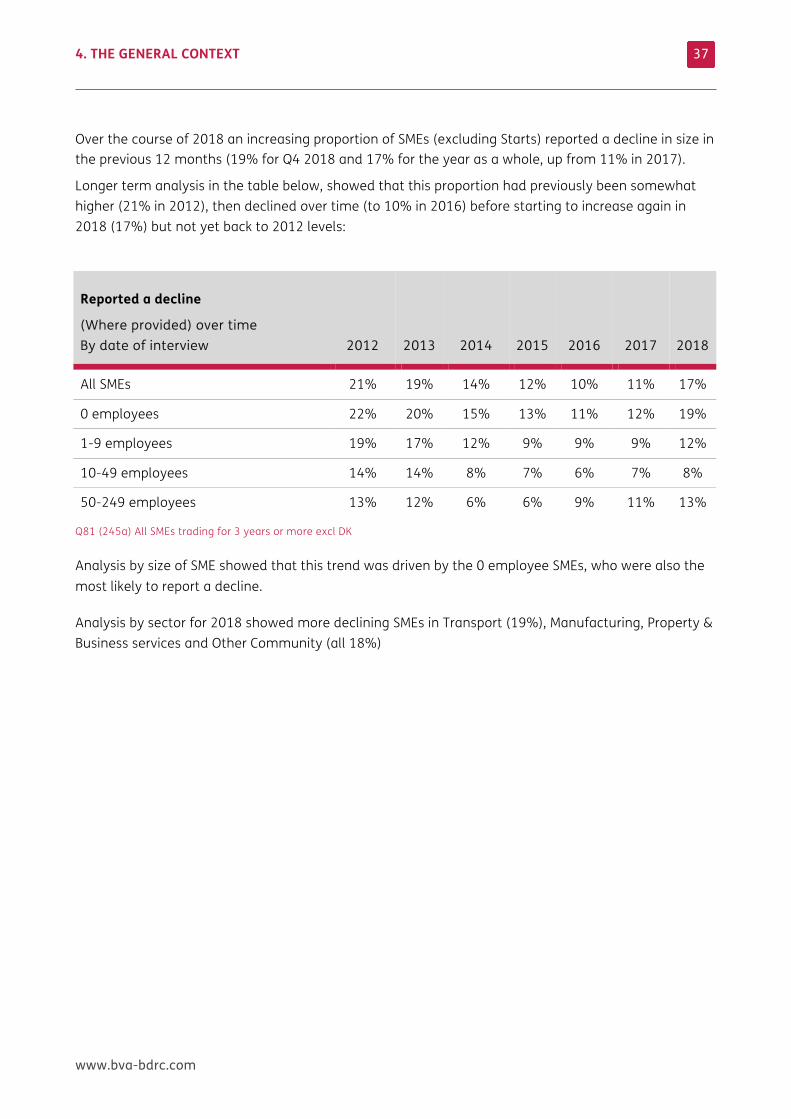
Over the course of 2018 an increasing proportion of SMEs (excluding Starts) reported a decline in size in the previous 12 months (19% for Q4 2018 and 17% for the year as a whole, up from 11% in 2017).
Longer term analysis in the table below, showed that this proportion had previously been somewhat higher (21% in 2012), then declined over time (to 10% in 2016) before starting to increase again in 2018 (17%) but not yet back to 2012 levels:
Reported a decline
(Where provided) over time By date of interview 2012 2013 2014 2015
2016 2017 2018
All SMEs 21% 19% 14% 12% 10% 11% 17%
0 employees 22% 20% 15% 13% 11% 12% 19%
1-9 employees 19% 17% 12% 9% 9% 9% 12%
10-49 employees 14% 14% 8% 7% 6% 7% 8%
50-249 employees 13% 12% 6% 6% 9% 11% 13%
Q81 (245a) All SMEs trading for 3 years or more excl DK
Analysis by size of SME showed that this trend was driven by the 0 employee SMEs, who were also the most likely to report a decline.
Analysis by sector for 2018 showed more declining SMEs in Transport (19%), Manufacturing, Property & Business services and Other Community (all 18%)
4. THE GENERAL CONTEXT
www.bva-bdrc.com
38
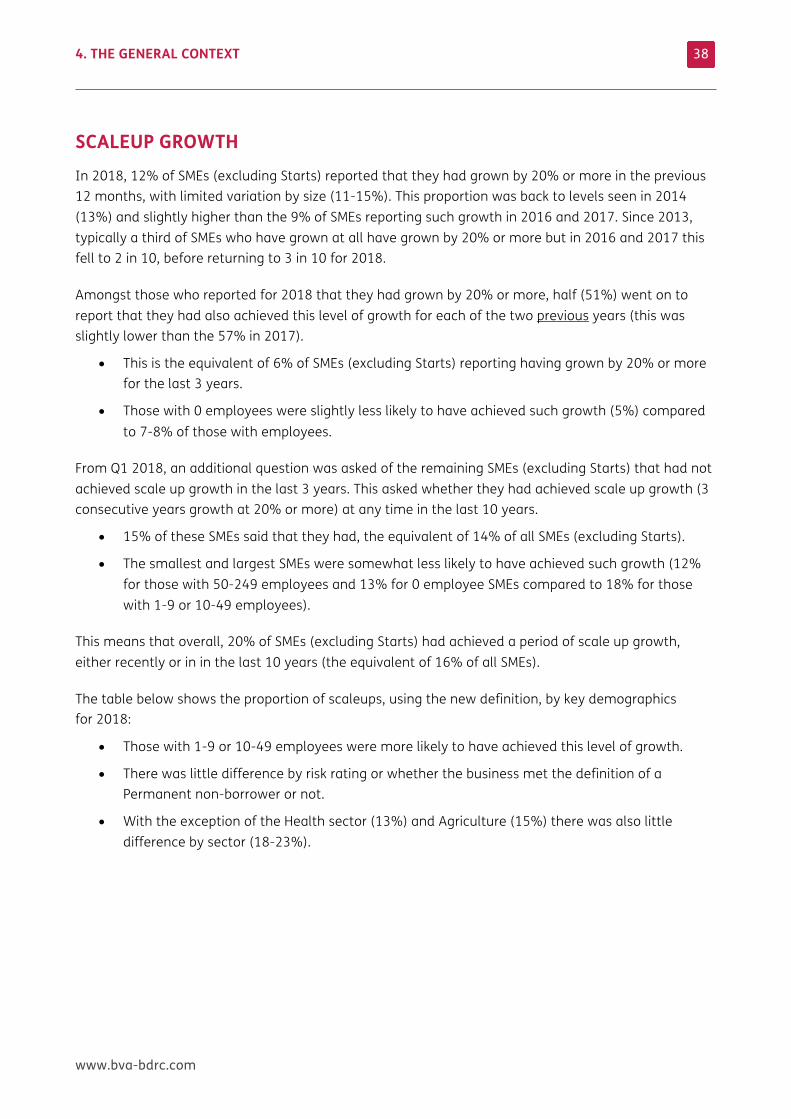
SCALEUP GROWTH In 2018, 12% of SMEs (excluding Starts) reported that they had grown by 20% or more in the previous 12 months, with limited variation by size (11-15%). This proportion was back to levels seen in 2014 (13%) and slightly higher than the 9% of SMEs reporting such growth in 2016 and 2017. Since 2013, typically a third of SMEs who have grown at all have grown by 20% or more but in 2016 and 2017 this fell to 2 in 10, before returning to 3 in 10 for 2018.
Amongst those who reported for 2018 that they had grown by 20% or more, half (51%) went on to report that they had also achieved this level of growth for each of the two previous years (this was slightly lower than the 57% in 2017).
• This is the equivalent of 6% of SMEs (excluding Starts) reporting having grown by 20% or more for the last 3 years.
• Those with 0 employees were slightly less likely to have achieved such growth (5%) compared to 7-8% of those with employees.
From Q1 2018, an additional question was asked of the remaining SMEs (excluding Starts) that had not achieved scale up growth in the last 3 years. This asked whether they had achieved scale up growth (3 consecutive years growth at 20% or more) at any time in the last 10 years.
• 15% of these SMEs said that they had, the equivalent of 14% of all SMEs (excluding Starts).
• The smallest and largest SMEs were somewhat less likely to have achieved such growth (12% for those with 50-249 employees and 13% for 0 employee SMEs compared to 18% for those with 1-9 or 10-49 employees).
This means that overall, 20% of SMEs (excluding Starts) had achieved a period of scale up growth, either recently or in in the last 10 years (the equivalent of 16% of all SMEs).
The table below shows the proportion of scaleups, using the new definition, by key demographics for 2018:
• Those with 1-9 or 10-49 employees were more likely to have achieved this level of growth.
• There was little difference by risk rating or whether the business met the definition of a Permanent non-borrower or not.
• With the exception of the Health sector (13%) and Agriculture (15%) there was also little difference by sector (18-23%).
4. THE GENERAL CONTEXT
www.bva-bdrc.com
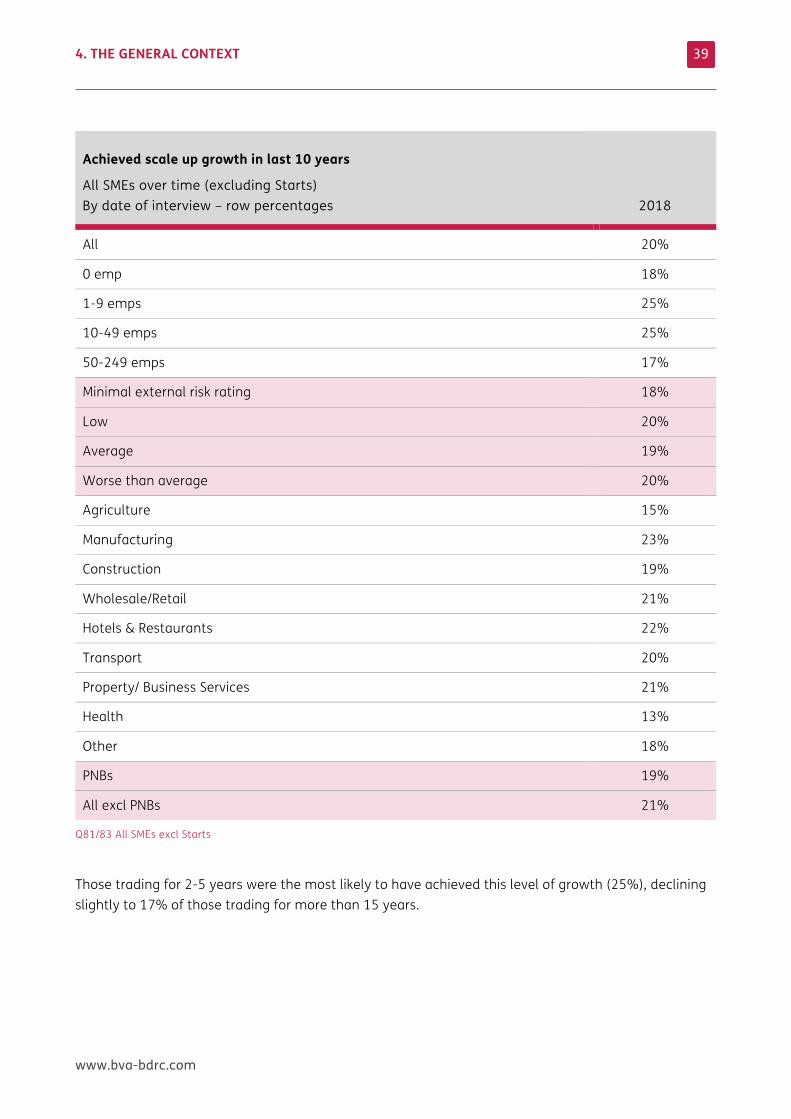
39
Achieved scale up growth in last 10 years
All SMEs over time (excluding Starts) By date of interview – row percentages 2018
All 20%
0 emp 18%
1-9 emps 25%
10-49 emps 25%
50-249 emps 17%
Minimal external risk rating 18%
Low 20%
Average 19%
Worse than average 20%
Agriculture 15%
Manufacturing 23%
Construction 19%
Wholesale/Retail 21%
Hotels & Restaurants 22%
Transport 20%
Property/ Business Services 21%
Health 13%
Other 18%
PNBs 19%
All excl PNBs 21%
Q81/83 All SMEs excl Starts
Those trading for 2-5 years were the most likely to have achieved this level of growth (25%), declining slightly to 17% of those trading for more than 15 years.
4. THE GENERAL CONTEXT
www.bva-bdrc.com
40
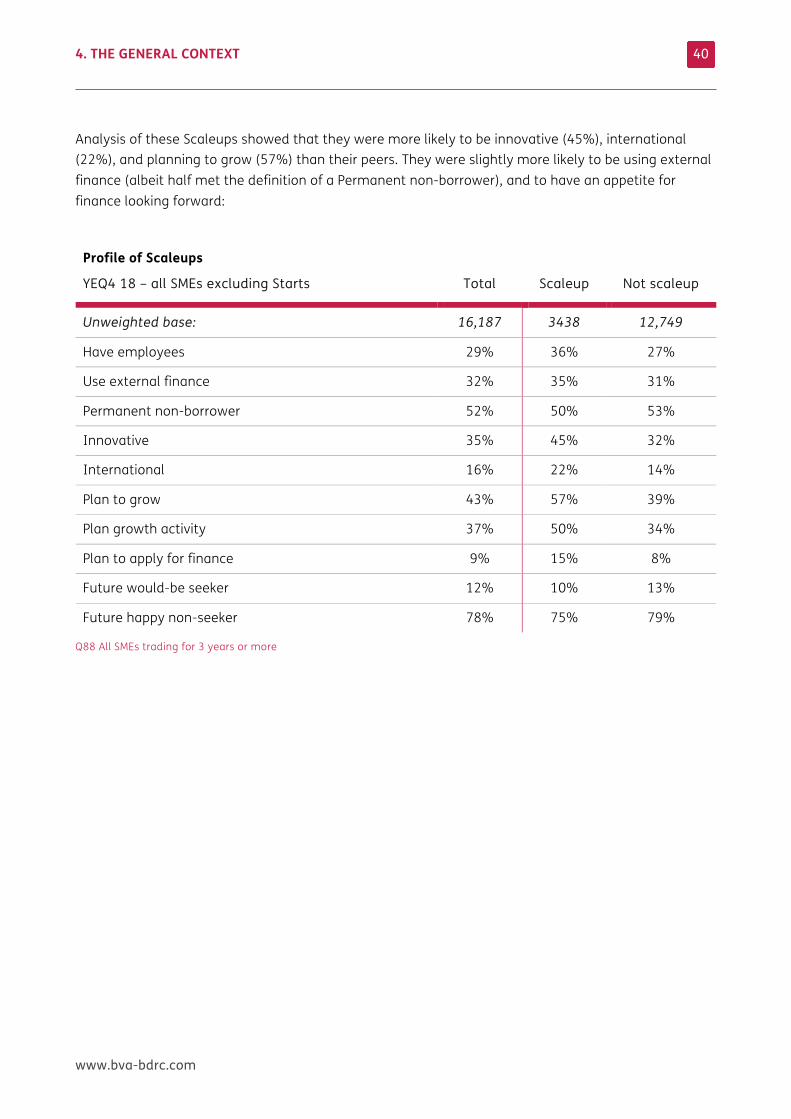
Analysis of these Scaleups showed that they were more likely to be innovative (45%), international (22%), and planning to grow (57%) than their peers. They were slightly more likely to be using external finance (albeit half met the definition of a Permanent non-borrower), and to have an appetite for finance looking forward:
Profile of Scaleups
YEQ4 18 – all SMEs excluding Starts Total Scaleup Not scaleup
Unweighted base: 16,187 3438 12,749
Have employees 29% 36% 27%
Use external finance 32% 35% 31%
Permanent non-borrower 52% 50% 53%
Innovative 35% 45% 32%
International 16% 22% 14%
Plan to grow 43% 57% 39%
Plan growth activity 37% 50% 34%
Plan to apply for finance 9% 15% 8%
Future would-be seeker 12% 10% 13%
Future happy non-seeker 78% 75% 79%
Q88 All SMEs trading for 3 years or more
4. THE GENERAL CONTEXT
www.bva-bdrc.com
41
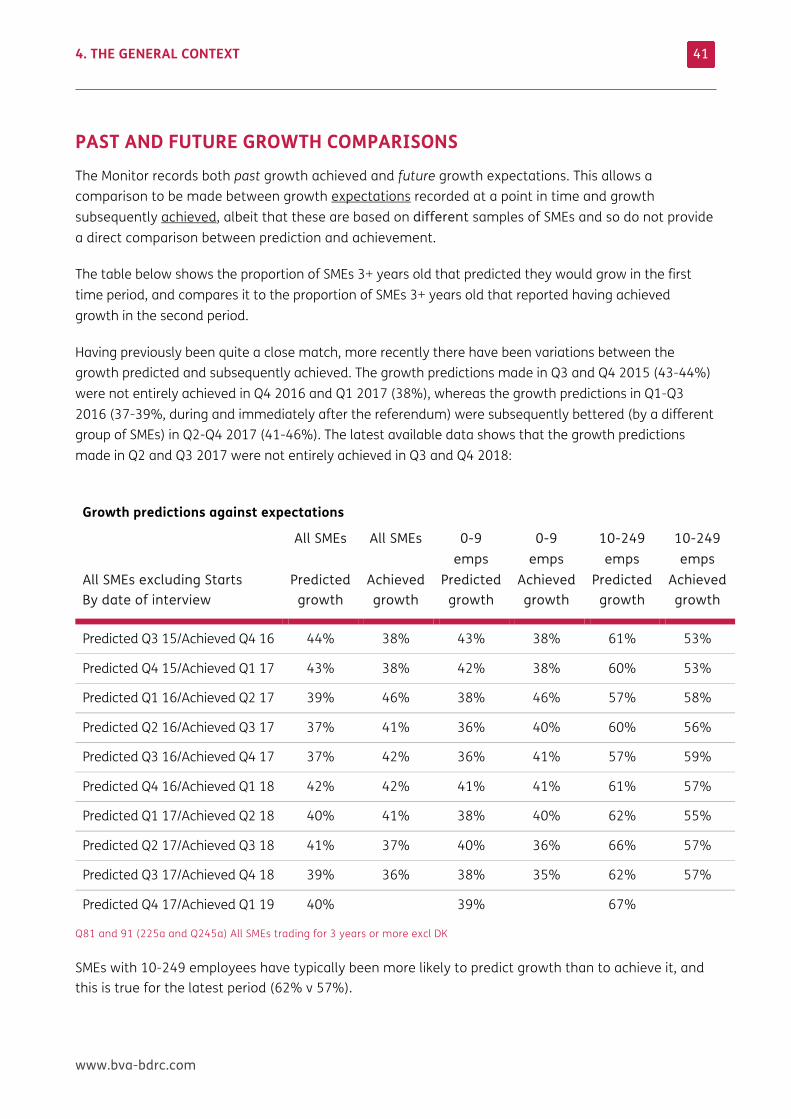
PAST AND FUTURE GROWTH COMPARISONS The Monitor records both past growth achieved and future growth expectations. This allows a comparison to be made between growth expectations recorded at a point in time and growth subsequently achieved, albeit that these are based on different samples of SMEs and so do not provide a direct comparison between prediction and achievement.
The table below shows the proportion of SMEs 3+ years old that predicted they would grow in the first time period, and compares it to the proportion of SMEs 3+ years old that reported having achieved growth in the second period.
Having previously been quite a close match, more recently there have been variations between the growth predicted and subsequently achieved. The growth predictions made in Q3 and Q4 2015 (43-44%) were not entirely achieved in Q4 2016 and Q1 2017 (38%), whereas the growth predictions in Q1-Q3 2016 (37-39%, during and immediately after the referendum) were subsequently bettered (by a different group of SMEs) in Q2-Q4 2017 (41-46%). The latest available data shows that the growth predictions made in Q2 and Q3 2017 were not entirely achieved in Q3 and Q4 2018:
Growth predictions against expectations
All SMEs excluding Starts By date of interview
All SMEs
Predicted growth
All SMEs
Achieved growth
0-9 emps
Predicted growth
0-9 emps
Achieved growth
10-249 emps
Predicted growth
10-249 emps
Achieved growth
Predicted Q3 15/Achieved Q4 16 44% 38% 43% 38% 61% 53%
Predicted Q4 15/Achieved Q1 17 43% 38% 42% 38% 60% 53%
Predicted Q1 16/Achieved Q2 17 39% 46% 38% 46% 57% 58%
Predicted Q2 16/Achieved Q3 17 37% 41% 36% 40% 60% 56%
Predicted Q3 16/Achieved Q4 17 37% 42% 36% 41% 57% 59%
Predicted Q4 16/Achieved Q1 18 42% 42% 41% 41% 61% 57%
Predicted Q1 17/Achieved Q2 18 40% 41% 38% 40% 62% 55%
Predicted Q2 17/Achieved Q3 18 41% 37% 40% 36% 66% 57%
Predicted Q3 17/Achieved Q4 18 39% 36% 38% 35% 62% 57%
Predicted Q4 17/Achieved Q1 19 40% 39% 67%
Q81 and 91 (225a and Q245a) All SMEs trading for 3 years or more excl DK
SMEs with 10-249 employees have typically been more likely to predict growth than to achieve it, and this is true for the latest period (62% v 57%).
4. THE GENERAL CONTEXT
www.bva-bdrc.com
42
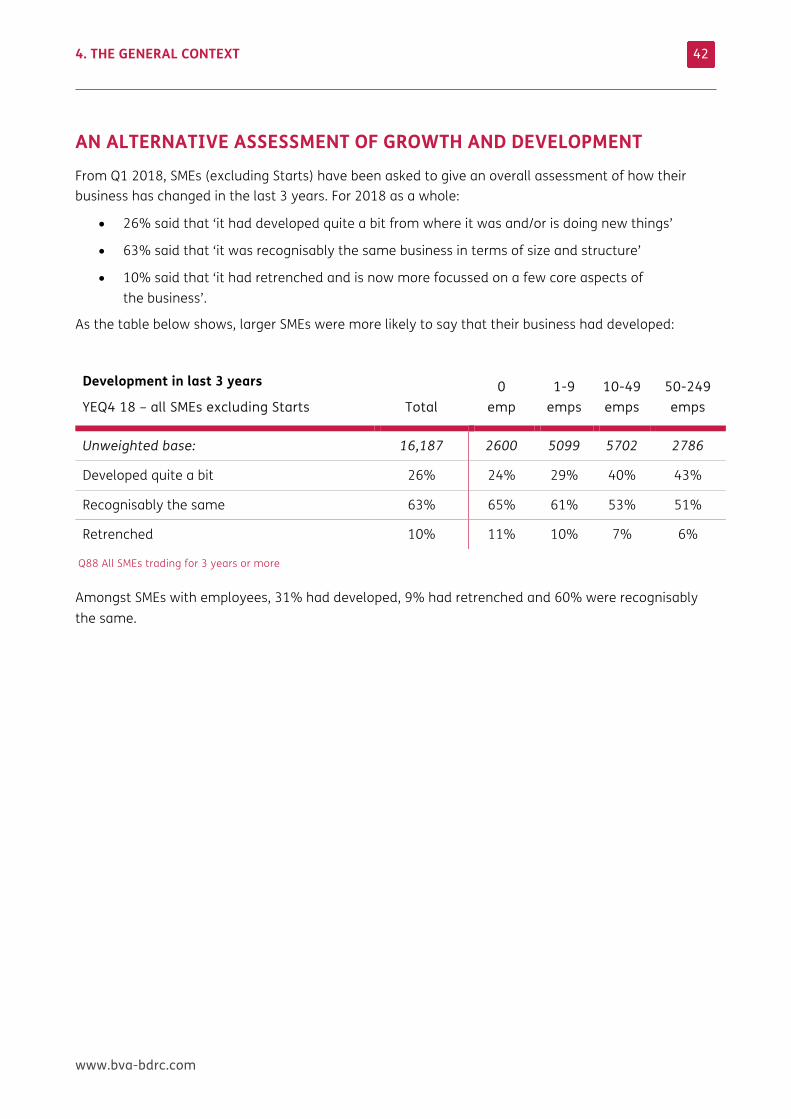
AN ALTERNATIVE ASSESSMENT OF GROWTH AND DEVELOPMENT From Q1 2018, SMEs (excluding Starts) have been asked to give an overall assessment of how their business has changed in the last 3 years. For 2018 as a whole:
• 26% said that ‘it had developed quite a bit from where it was and/or is doing new things’
• 63% said that ‘it was recognisably the same business in terms of size and structure’
• 10% said that ‘it had retrenched and is now more focussed on a few core aspects of the business’.
As the table below shows, larger SMEs were more likely to say that their business had developed:
Development in last 3 years
YEQ4 18 – all SMEs excluding Starts
Total 0
emp 1-9
emps 10-49 emps
50-249 emps
Unweighted base: 16,187 2600 5099 5702 2786
Developed quite a bit 26% 24% 29% 40% 43%
Recognisably the same 63% 65% 61% 53% 51%
Retrenched 10% 11% 10% 7% 6%
Q88 All SMEs trading for 3 years or more
Amongst SMEs with employees, 31% had developed, 9% had retrenched and 60% were recognisably the same.
4. THE GENERAL CONTEXT
www.bva-bdrc.com
43
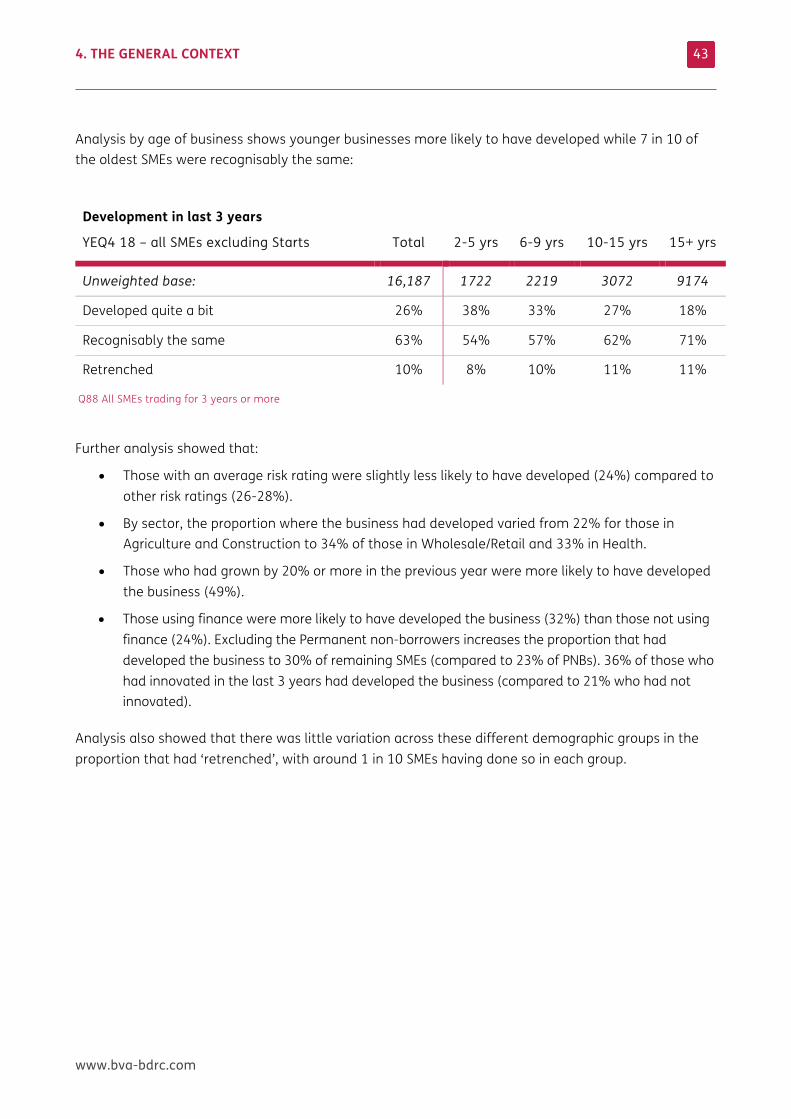
Analysis by age of business shows younger businesses more likely to have developed while 7 in 10 of the oldest SMEs were recognisably the same:
Development in last 3 years
YEQ4 18 – all SMEs excluding Starts
Total 2-5 yrs 6-9 yrs 10-15 yrs 15+ yrs
Unweighted base: 16,187 1722 2219 3072 9174
Developed quite a bit 26% 38% 33% 27% 18%
Recognisably the same 63% 54% 57% 62% 71%
Retrenched 10% 8% 10% 11% 11%
Q88 All SMEs trading for 3 years or more
Further analysis showed that:
• Those with an average risk rating were slightly less likely to have developed (24%) compared to other risk ratings (26-28%).
• By sector, the proportion where the business had developed varied from 22% for those in Agriculture and Construction to 34% of those in Wholesale/Retail and 33% in Health.
• Those who had grown by 20% or more in the previous year were more likely to have developed the business (49%).
• Those using finance were more likely to have developed the business (32%) than those not using finance (24%). Excluding the Permanent non-borrowers increases the proportion that had developed the business to 30% of remaining SMEs (compared to 23% of PNBs). 36% of those who had innovated in the last 3 years had developed the business (compared to 21% who had not innovated).
Analysis also showed that there was little variation across these different demographic groups in the proportion that had ‘retrenched’, with around 1 in 10 SMEs having done so in each group.
4. THE GENERAL CONTEXT
www.bva-bdrc.com
44
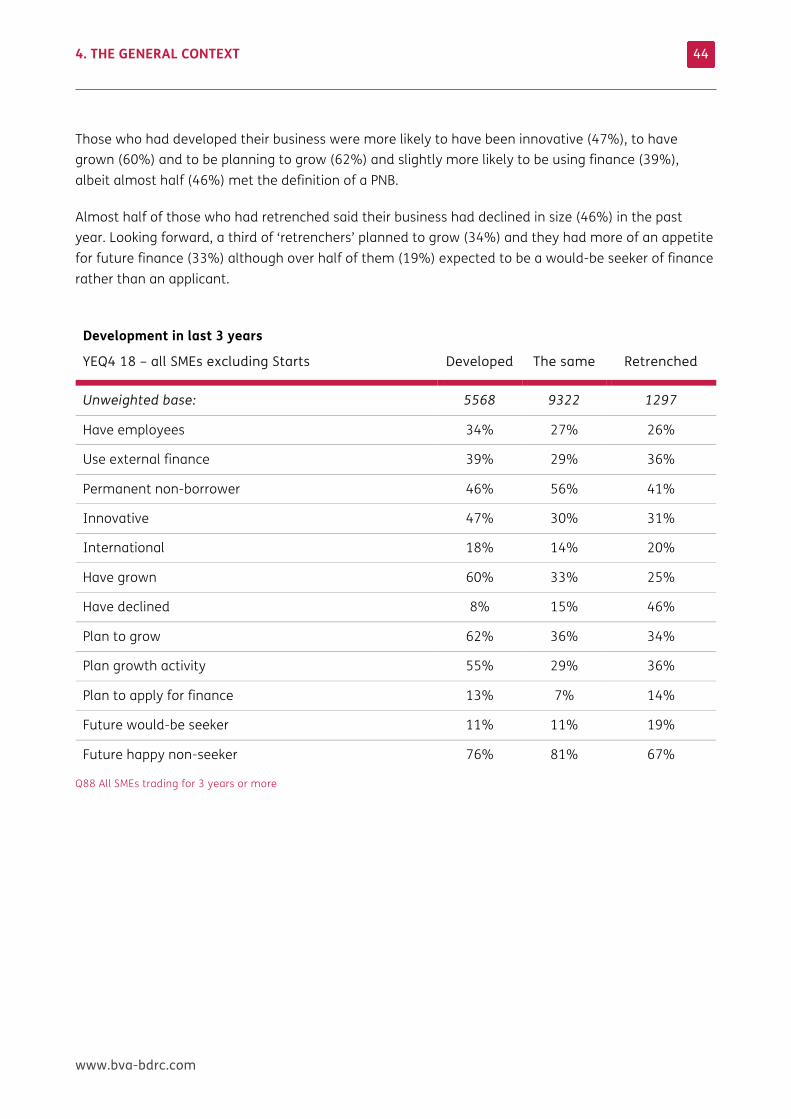
Those who had developed their business were more likely to have been innovative (47%), to have grown (60%) and to be planning to grow (62%) and slightly more likely to be using finance (39%), albeit almost half (46%) met the definition of a PNB.
Almost half of those who had retrenched said their business had declined in size (46%) in the past year. Looking forward, a third of ‘retrenchers’ planned to grow (34%) and they had more of an appetite for future finance (33%) although over half of them (19%) expected to be a would-be seeker of finance rather than an applicant.
Development in last 3 years
YEQ4 18 – all SMEs excluding Starts Developed The same Retrenched
Unweighted base: 5568 9322 1297
Have employees 34% 27% 26%
Use external finance 39% 29% 36%
Permanent non-borrower 46% 56% 41%
Innovative 47% 30% 31%
International 18% 14% 20%
Have grown 60% 33% 25%
Have declined 8% 15% 46%
Plan to grow 62% 36% 34%
Plan growth activity 55% 29% 36%
Plan to apply for finance 13% 7% 14%
Future would-be seeker 11% 11% 19%
Future happy non-seeker 76% 81% 67%
Q88 All SMEs trading for 3 years or more
4. THE GENERAL CONTEXT
www.bva-bdrc.com
45
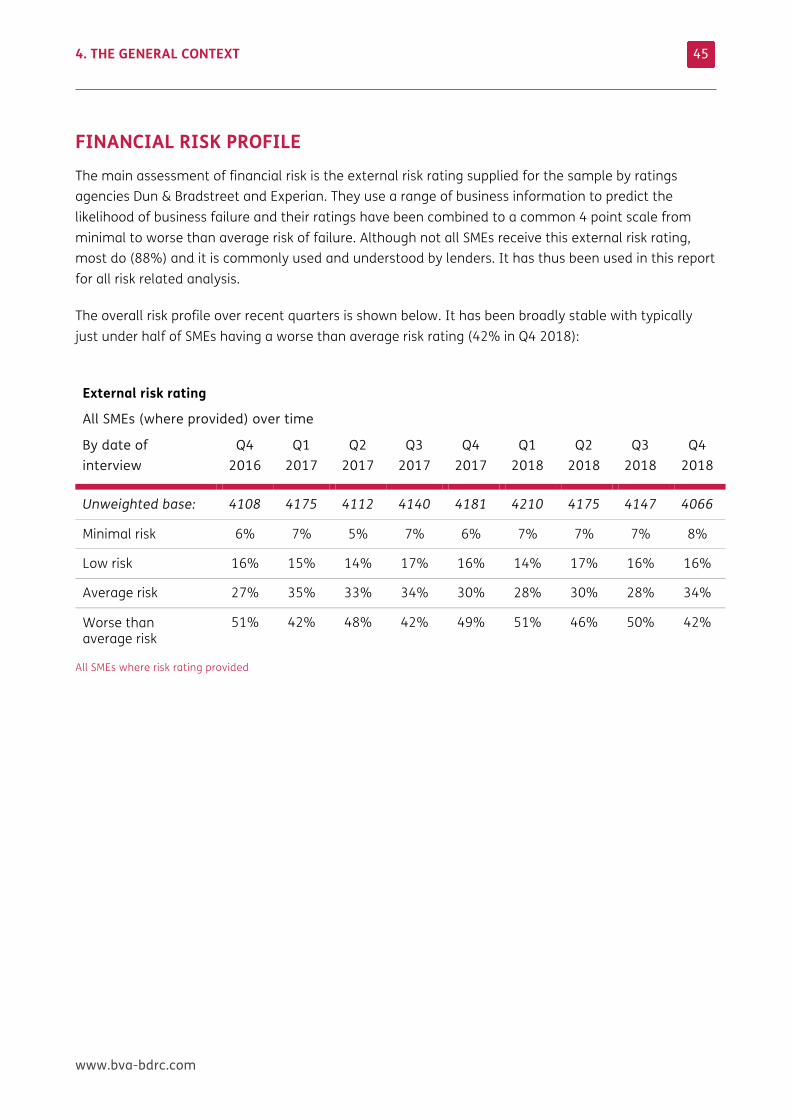
FINANCIAL RISK PROFILE The main assessment of financial risk is the external risk rating supplied for the sample by ratings agencies Dun & Bradstreet and Experian. They use a range of business information to predict the likelihood of business failure and their ratings have been combined to a common 4 point scale from minimal to worse than average risk of failure. Although not all SMEs receive this external risk rating, most do (88%) and it is commonly used and understood by lenders. It has thus been used in this report for all risk related analysis.
The overall risk profile over recent quarters is shown below. It has been broadly stable with typically just under half of SMEs having a worse than average risk rating (42% in Q4 2018):
External risk rating
All SMEs (where provided) over time
By date of interview
Q4 2016
Q1 2017
Q2 2017
Q3 2017
Q4 2017
Q1 2018
Q2 2018
Q3 2018
Q4 2018
Unweighted base: 4108 4175 4112 4140 4181 4210 4175 4147 4066
Minimal risk 6% 7% 5% 7% 6% 7% 7% 7% 8%
Low risk 16% 15% 14% 17% 16% 14% 17% 16% 16%
Average risk 27% 35% 33% 34% 30% 28% 30% 28% 34%
Worse than average risk
51% 42% 48% 42% 49% 51% 46% 50% 42%
All SMEs where risk rating provided
4. THE GENERAL CONTEXT
www.bva-bdrc.com
46
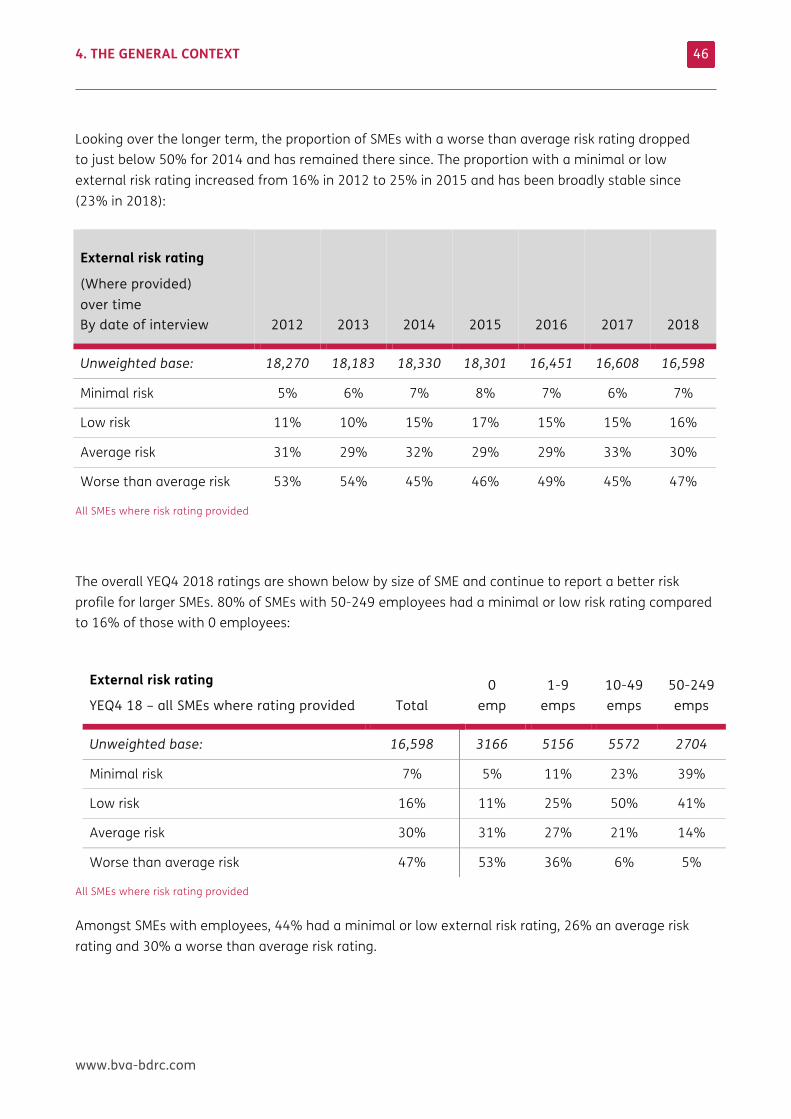
Looking over the longer term, the proportion of SMEs with a worse than average risk rating dropped to just below 50% for 2014 and has remained there since. The proportion with a minimal or low external risk rating increased from 16% in 2012 to 25% in 2015 and has been broadly stable since (23% in 2018):
External risk rating
(Where provided) over time By date of interview 2012 2013 2014 2015
2016 2017 2018
Unweighted base: 18,270 18,183 18,330 18,301 16,451 16,608 16,598
Minimal risk 5% 6% 7% 8% 7% 6% 7%
Low risk 11% 10% 15% 17% 15% 15% 16%
Average risk 31% 29% 32% 29% 29% 33% 30%
Worse than average risk 53% 54% 45% 46% 49% 45% 47%
All SMEs where risk rating provided
The overall YEQ4 2018 ratings are shown below by size of SME and continue to report a better risk profile for larger SMEs. 80% of SMEs with 50-249 employees had a minimal or low risk rating compared to 16% of those with 0 employees:
External risk rating
YEQ4 18 – all SMEs where rating provided Total 0
emp 1-9
emps 10-49 emps
50-249 emps
Unweighted base: 16,598 3166 5156 5572 2704
Minimal risk 7% 5% 11% 23% 39%
Low risk 16% 11% 25% 50% 41%
Average risk 30% 31% 27% 21% 14%
Worse than average risk 47% 53% 36% 6% 5%
All SMEs where risk rating provided
Amongst SMEs with employees, 44% had a minimal or low external risk rating, 26% an average risk rating and 30% a worse than average risk rating.
4. THE GENERAL CONTEXT
www.bva-bdrc.com
47
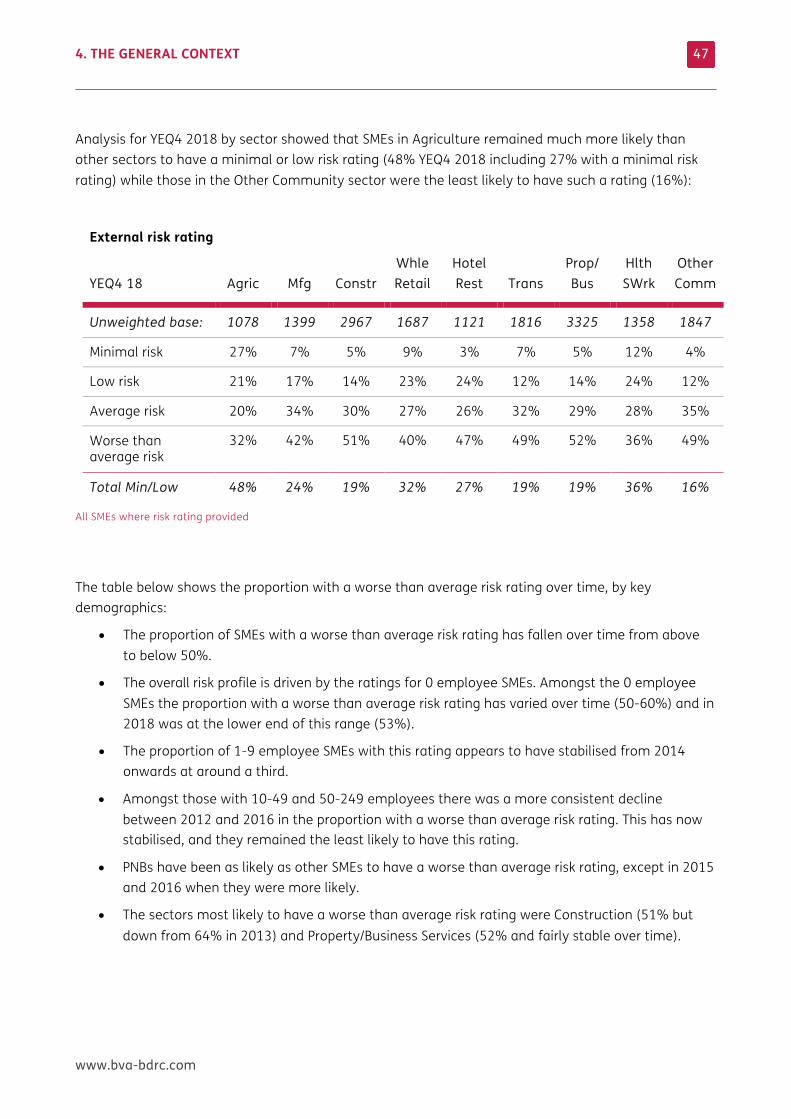
Analysis for YEQ4 2018 by sector showed that SMEs in Agriculture remained much more likely than other sectors to have a minimal or low risk rating (48% YEQ4 2018 including 27% with a minimal risk rating) while those in the Other Community sector were the least likely to have such a rating (16%):
External risk rating
YEQ4 18 Agric Mfg Constr Whle Retail
Hotel Rest Trans
Prop/ Bus
Hlth SWrk
Other Comm
Unweighted base: 1078 1399 2967 1687 1121 1816 3325 1358 1847
Minimal risk 27% 7% 5% 9% 3% 7% 5% 12% 4%
Low risk 21% 17% 14% 23% 24% 12% 14% 24% 12%
Average risk 20% 34% 30% 27% 26% 32% 29% 28% 35%
Worse than average risk
32% 42% 51% 40% 47% 49% 52% 36% 49%
Total Min/Low 48% 24% 19% 32% 27% 19% 19% 36% 16%
All SMEs where risk rating provided
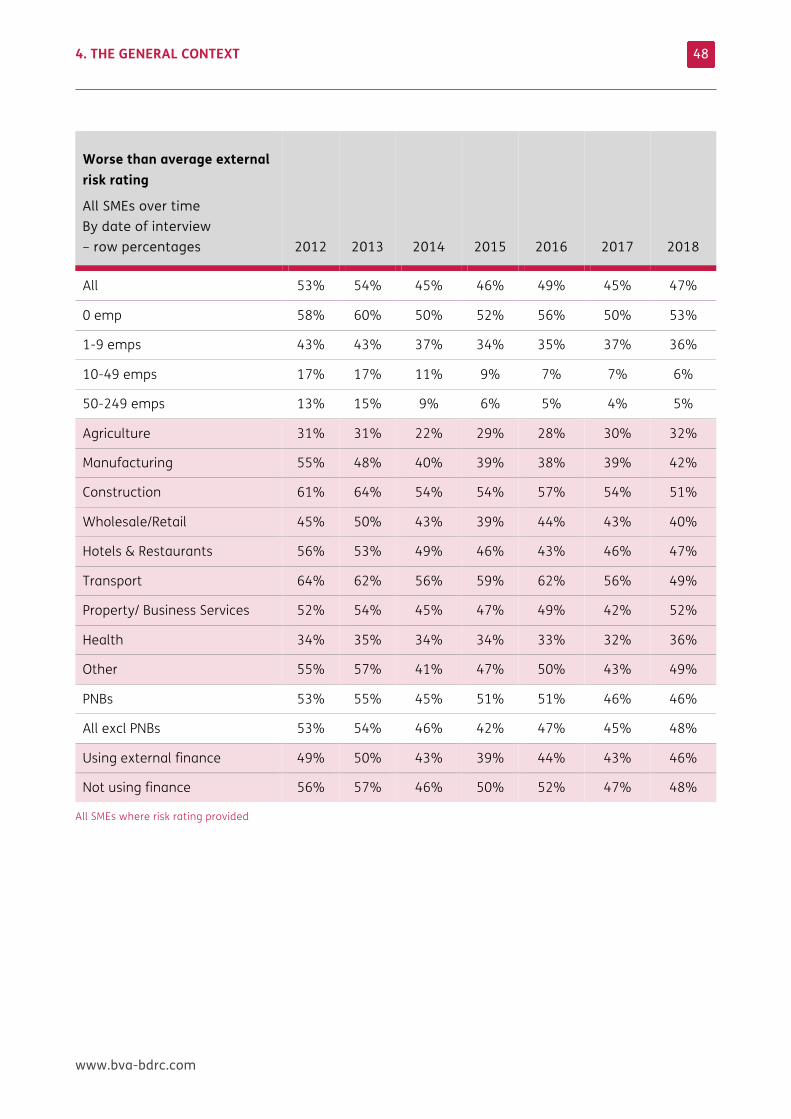
The table below shows the proportion with a worse than average risk rating over time, by key demographics:
• The proportion of SMEs with a worse than average risk rating has fallen over time from above to below 50%.
• The overall risk profile is driven by the ratings for 0 employee SMEs. Amongst the 0 employee SMEs the proportion with a worse than average risk rating has varied over time (50-60%) and in 2018 was at the lower end of this range (53%).
• The proportion of 1-9 employee SMEs with this rating appears to have stabilised from 2014 onwards at around a third.
• Amongst those with 10-49 and 50-249 employees there was a more consistent decline between 2012 and 2016 in the proportion with a worse than average risk rating. This has now stabilised, and they remained the least likely to have this rating.
• PNBs have been as likely as other SMEs to have a worse than average risk rating, except in 2015 and 2016 when they were more likely.
• The sectors most likely to have a worse than average risk rating were Construction (51% but down from 64% in 2013) and Property/Business Services (52% and fairly stable over time).
4. THE GENERAL CONTEXT
www.bva-bdrc.com
48
Worse than average external risk rating
All SMEs over time By date of interview – row percentages 2012 2013 2014 2015 2016 2017 2018
All 53% 54% 45% 46% 49% 45% 47%
0 emp 58% 60% 50% 52% 56% 50% 53%
1-9 emps 43% 43% 37% 34% 35% 37% 36%
10-49 emps 17% 17% 11% 9% 7% 7% 6%
50-249 emps 13% 15% 9% 6% 5% 4% 5%
Agriculture 31% 31% 22% 29% 28% 30% 32%
Manufacturing 55% 48% 40% 39% 38% 39% 42%
Construction 61% 64% 54% 54% 57% 54% 51%
Wholesale/Retail 45% 50% 43% 39% 44% 43% 40%
Hotels & Restaurants 56% 53% 49% 46% 43% 46% 47%
Transport 64% 62% 56% 59% 62% 56% 49%
Property/ Business Services 52% 54% 45% 47% 49% 42% 52%
Health 34% 35% 34% 34% 33% 32% 36%
Other 55% 57% 41% 47% 50% 43% 49%
PNBs 53% 55% 45% 51% 51% 46% 46%
All excl PNBs 53% 54% 46% 42% 47% 45% 48%
Using external finance 49% 50% 43% 39% 44% 43% 46%
Not using finance 56% 57% 46% 50% 52% 47% 48%
All SMEs where risk rating provided
4. THE GENERAL CONTEXT
www.bva-bdrc.com
49
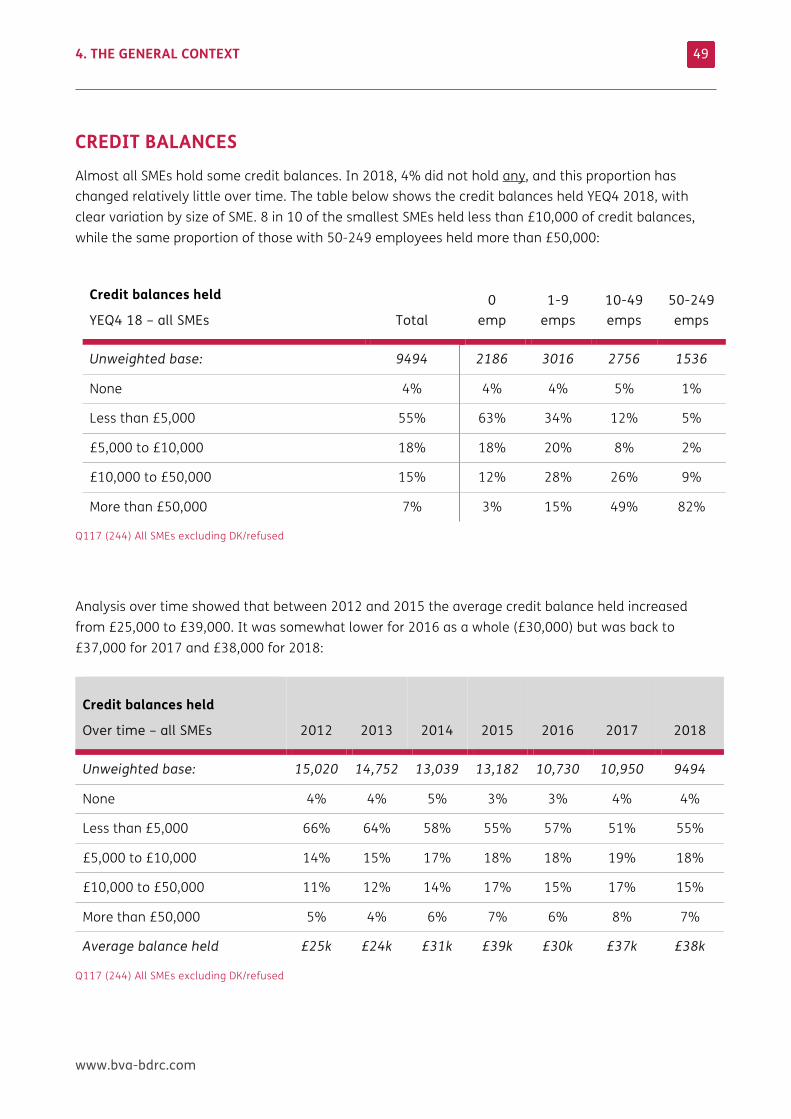
CREDIT BALANCES Almost all SMEs hold some credit balances. In 2018, 4% did not hold any, and this proportion has changed relatively little over time. The table below shows the credit balances held YEQ4 2018, with clear variation by size of SME. 8 in 10 of the smallest SMEs held less than £10,000 of credit balances, while the same proportion of those with 50-249 employees held more than £50,000:
Credit balances held
YEQ4 18 – all SMEs Total 0
emp 1-9
emps 10-49 emps
50-249 emps
Unweighted base: 9494 2186 3016 2756 1536
None 4% 4% 4% 5% 1%
Less than £5,000 55% 63% 34% 12% 5%
£5,000 to £10,000 18% 18% 20% 8% 2%
£10,000 to £50,000 15% 12% 28% 26% 9%
More than £50,000 7% 3% 15% 49% 82%
Q117 (244) All SMEs excluding DK/refused
Analysis over time showed that between 2012 and 2015 the average credit balance held increased from £25,000 to £39,000. It was somewhat lower for 2016 as a whole (£30,000) but was back to £37,000 for 2017 and £38,000 for 2018:
Credit balances held
Over time – all SMEs 2012 2013 2014 2015
2016 2017 2018
Unweighted base: 15,020 14,752 13,039 13,182 10,730 10,950 9494
None 4% 4% 5% 3% 3% 4% 4%
Less than £5,000 66% 64% 58% 55% 57% 51% 55%
£5,000 to £10,000 14% 15% 17% 18% 18% 19% 18%
£10,000 to £50,000 11% 12% 14% 17% 15% 17% 15%
More than £50,000 5% 4% 6% 7% 6% 8% 7%
Average balance held £25k £24k £31k £39k £30k £37k £38k
Q117 (244) All SMEs excluding DK/refused
4. THE GENERAL CONTEXT
www.bva-bdrc.com
50
The median value of credit balances held remained at £2,000 for YEQ4 2018. This amount continued to vary by size of SME, and for YEQ2 2018 was:
• £2,000 for 0 employee SMEs
• £6,000 for 1-9 employee SMEs
• £36,000 for 10-49 employee SMEs
• £223,000 for 50-249 employee SMEs.
The median value of credit balances did not vary by sector (£2-3k).
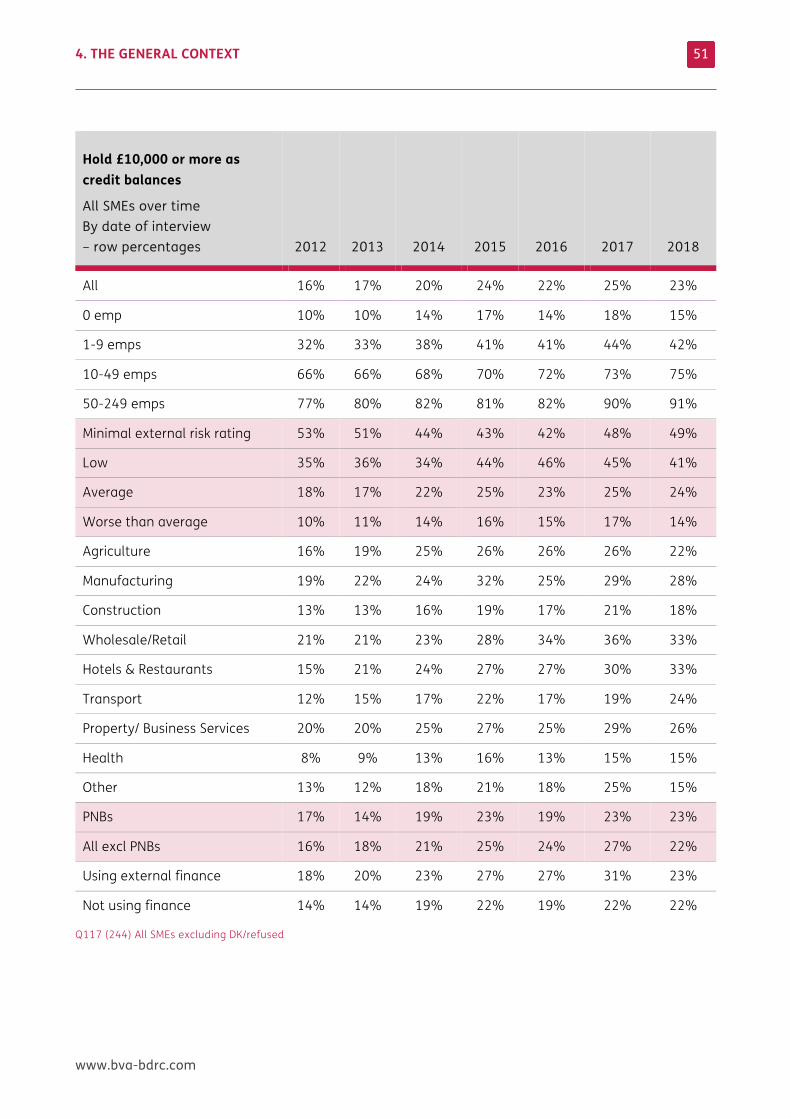
The table below shows the proportion of SMEs holding more than £10,000 in credit balances, and how this has changed over time.
• The proportion increased from 16% in 2012 to 24% in 2015 and has been stable since.
• All size bands are now more likely to hold £10,000 or more than they were in 2012, but those with a minimal risk rating were no more likely to be holding such balances.
• By sector, those in Wholesale/Retail or Hotels & Restaurants have always been more likely to hold £10,000 or more than other sectors and the proportion has increased over time to 33% in 2018
• The proportion using external finance who also held £10,000 or more in credit balances increased from 18% in 2012 to 31% in 2017 but was lower in 2018 (23%). 22% of SMEs that were not using external finance held £10,000 or more in credit balances in 2018 and this proportion has been stable since 2014.
4. THE GENERAL CONTEXT
www.bva-bdrc.com
51
Hold £10,000 or more as credit balances
All SMEs over time By date of interview – row percentages 2012 2013 2014 2015 2016 2017 2018
All 16% 17% 20% 24% 22% 25% 23%
0 emp 10% 10% 14% 17% 14% 18% 15%
1-9 emps 32% 33% 38% 41% 41% 44% 42%
10-49 emps 66% 66% 68% 70% 72% 73% 75%
50-249 emps 77% 80% 82% 81% 82% 90% 91%
Minimal external risk rating 53% 51% 44% 43% 42% 48% 49%
Low 35% 36% 34% 44% 46% 45% 41%
Average 18% 17% 22% 25% 23% 25% 24%
Worse than average 10% 11% 14% 16% 15% 17% 14%
Agriculture 16% 19% 25% 26% 26% 26% 22%
Manufacturing 19% 22% 24% 32% 25% 29% 28%
Construction 13% 13% 16% 19% 17% 21% 18%
Wholesale/Retail 21% 21% 23% 28% 34% 36% 33%
Hotels & Restaurants 15% 21% 24% 27% 27% 30% 33%
Transport 12% 15% 17% 22% 17% 19% 24%
Property/ Business Services 20% 20% 25% 27% 25% 29% 26%
Health 8% 9% 13% 16% 13% 15% 15%
Other 13% 12% 18% 21% 18% 25% 15%
PNBs 17% 14% 19% 23% 19% 23% 23%
All excl PNBs 16% 18% 21% 25% 24% 27% 22%
Using external finance 18% 20% 23% 27% 27% 31% 23%
Not using finance 14% 14% 19% 22% 19% 22% 22%
Q117 (244) All SMEs excluding DK/refused
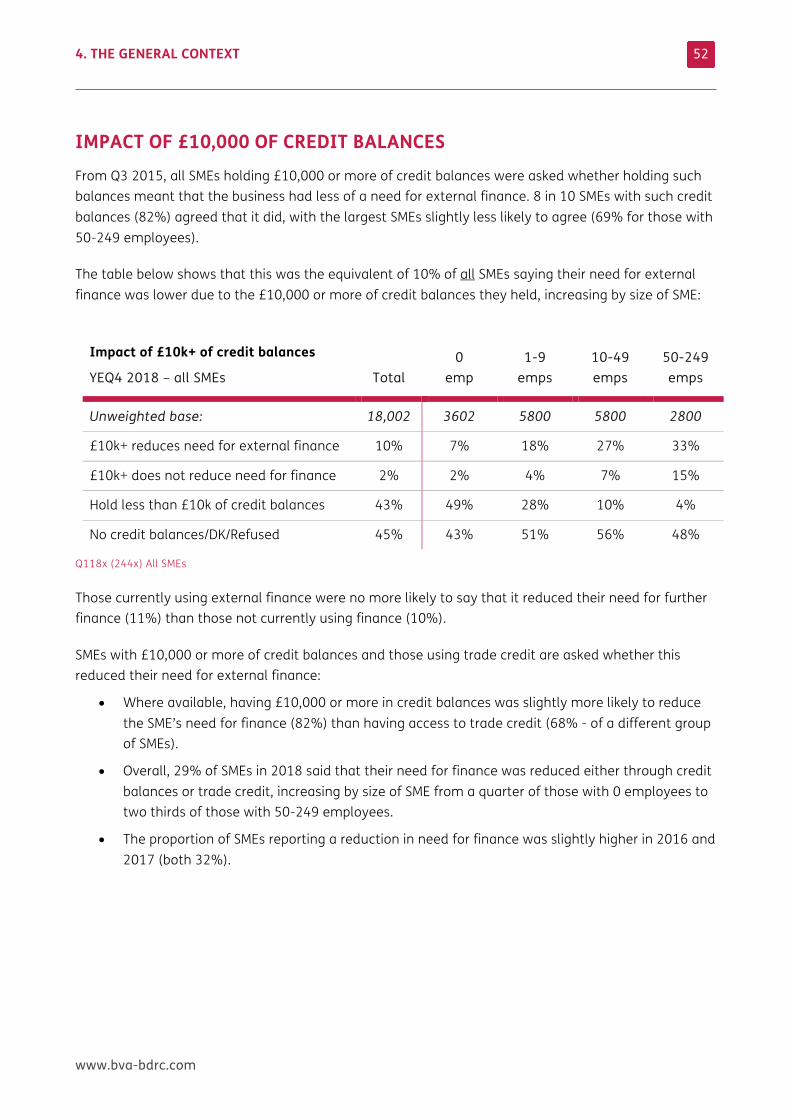
4. THE GENERAL CONTEXT
www.bva-bdrc.com
52
IMPACT OF £10,000 OF CREDIT BALANCES From Q3 2015, all SMEs holding £10,000 or more of credit balances were asked whether holding such balances meant that the business had less of a need for external finance. 8 in 10 SMEs with such credit balances (82%) agreed that it did, with the largest SMEs slightly less likely to agree (69% for those with 50-249 employees).
The table below shows that this was the equivalent of 10% of all SMEs saying their need for external finance was lower due to the £10,000 or more of credit balances they held, increasing by size of SME:
Impact of £10k+ of credit balances
YEQ4 2018 – all SMEs Total 0
emp 1-9
emps 10-49 emps
50-249 emps
Unweighted base: 18,002 3602 5800 5800 2800
£10k+ reduces need for external finance 10% 7% 18% 27% 33%
£10k+ does not reduce need for finance 2% 2% 4% 7% 15%
Hold less than £10k of credit balances 43% 49% 28% 10% 4%
No credit balances/DK/Refused 45% 43% 51% 56% 48%
Q118x (244x) All SMEs
Those currently using external finance were no more likely to say that it reduced their need for further finance (11%) than those not currently using finance (10%).
SMEs with £10,000 or more of credit balances and those using trade credit are asked whether this reduced their need for external finance:
• Where available, having £10,000 or more in credit balances was slightly more likely to reduce the SME’s need for finance (82%) than having access to trade credit (68% - of a different group of SMEs).
• Overall, 29% of SMEs in 2018 said that their need for finance was reduced either through credit balances or trade credit, increasing by size of SME from a quarter of those with 0 employees to two thirds of those with 50-249 employees.
• The proportion of SMEs reporting a reduction in need for finance was slightly higher in 2016 and 2017 (both 32%).
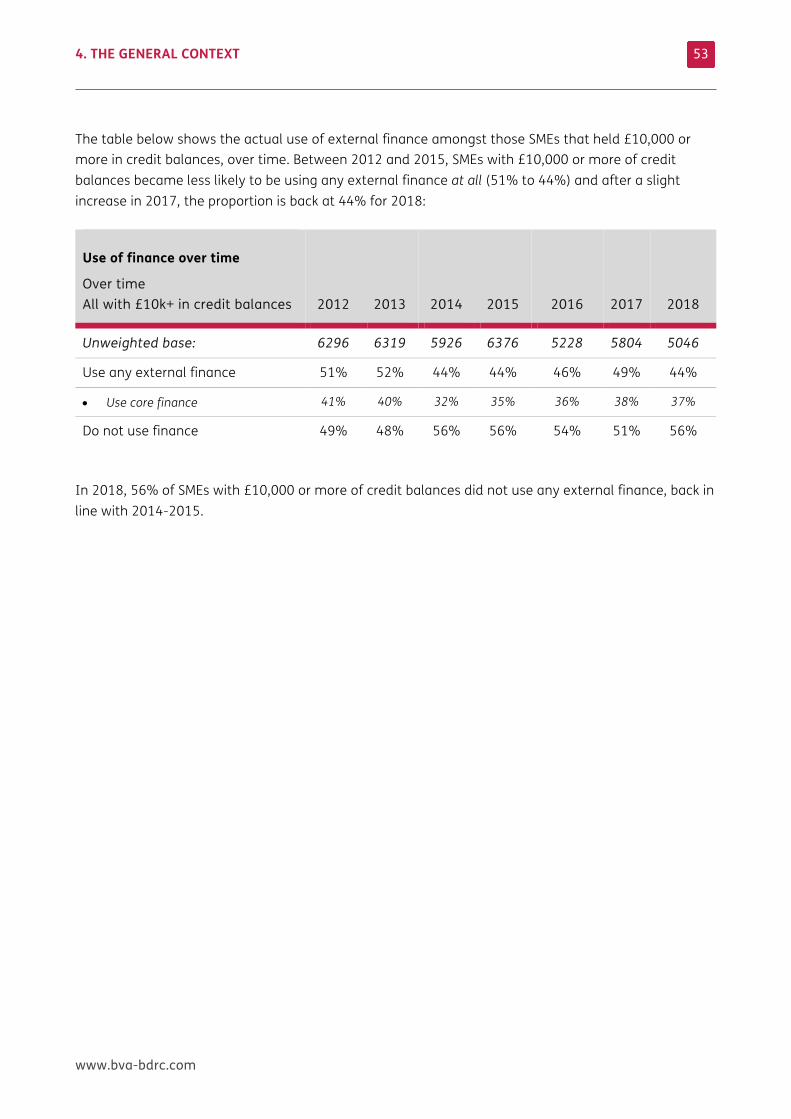
4. THE GENERAL CONTEXT
www.bva-bdrc.com
53
The table below shows the actual use of external finance amongst those SMEs that held £10,000 or more in credit balances, over time. Between 2012 and 2015, SMEs with £10,000 or more of credit balances became less likely to be using any external finance at all (51% to 44%) and after a slight increase in 2017, the proportion is back at 44% for 2018:
Use of finance over time
Over time All with £10k+ in credit balances 2012 2013 2014 2015
2016 2017 2018
Unweighted base: 6296 6319 5926 6376 5228 5804 5046
Use any external finance 51% 52% 44% 44% 46% 49% 44%
• Use core finance 41% 40% 32% 35% 36% 38% 37%
Do not use finance 49% 48% 56% 56% 54% 51% 56%
In 2018, 56% of SMEs with £10,000 or more of credit balances did not use any external finance, back in line with 2014-2015.
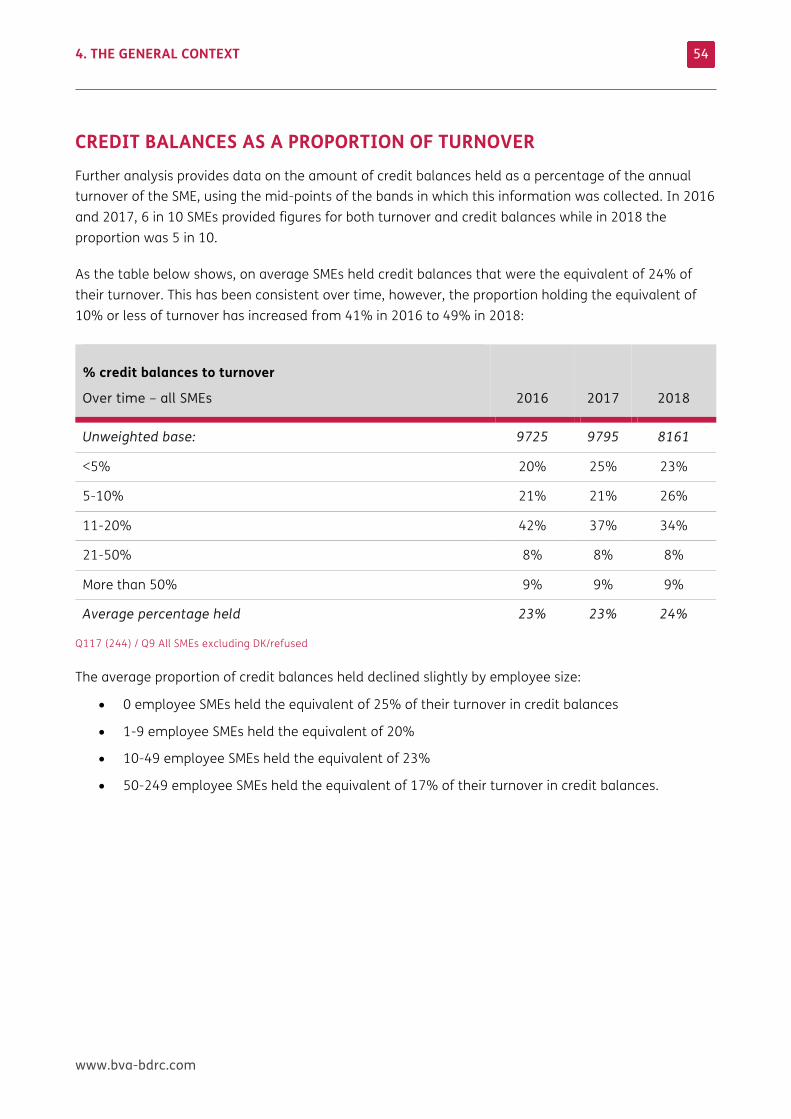
4. THE GENERAL CONTEXT
www.bva-bdrc.com
54
CREDIT BALANCES AS A PROPORTION OF TURNOVER Further analysis provides data on the amount of credit balances held as a percentage of the annual turnover of the SME, using the mid-points of the bands in which this information was collected. In 2016 and 2017, 6 in 10 SMEs provided figures for both turnover and credit balances while in 2018 the proportion was 5 in 10.
As the table below shows, on average SMEs held credit balances that were the equivalent of 24% of their turnover. This has been consistent over time, however, the proportion holding the equivalent of 10% or less of turnover has increased from 41% in 2016 to 49% in 2018:
% credit balances to turnover
Over time – all SMEs
2016 2017 2018
Unweighted base: 9725 9795 8161
<5% 20% 25% 23%
5-10% 21% 21% 26%
11-20% 42% 37% 34%
21-50% 8% 8% 8%
More than 50% 9% 9% 9%
Average percentage held 23% 23% 24%
Q117 (244) / Q9 All SMEs excluding DK/refused
The average proportion of credit balances held declined slightly by employee size:
• 0 employee SMEs held the equivalent of 25% of their turnover in credit balances
• 1-9 employee SMEs held the equivalent of 20%
• 10-49 employee SMEs held the equivalent of 23%
• 50-249 employee SMEs held the equivalent of 17% of their turnover in credit balances.
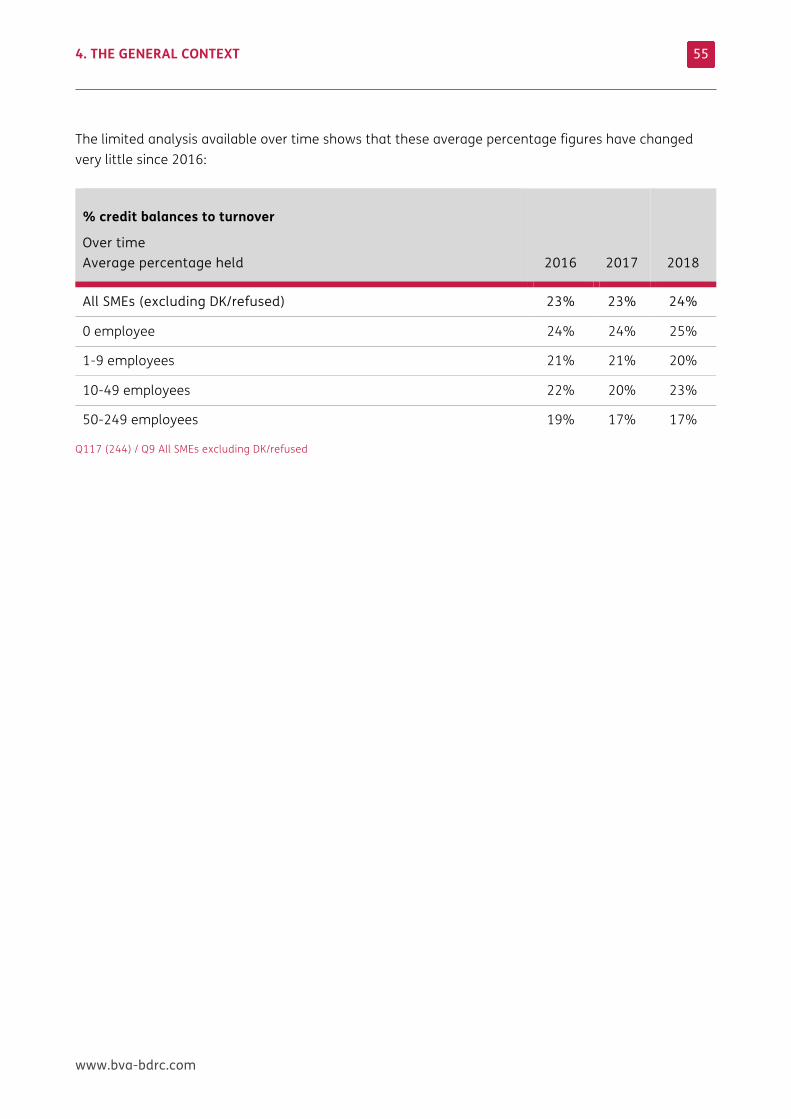
4. THE GENERAL CONTEXT
www.bva-bdrc.com
55
The limited analysis available over time shows that these average percentage figures have changed very little since 2016:
% credit balances to turnover
Over time Average percentage held
2016 2017 2018
All SMEs (excluding DK/refused) 23% 23% 24%
0 employee 24% 24% 25%
1-9 employees 21% 21% 20%
10-49 employees 22% 20% 23%
50-249 employees 19% 17% 17%
Q117 (244) / Q9 All SMEs excluding DK/refused
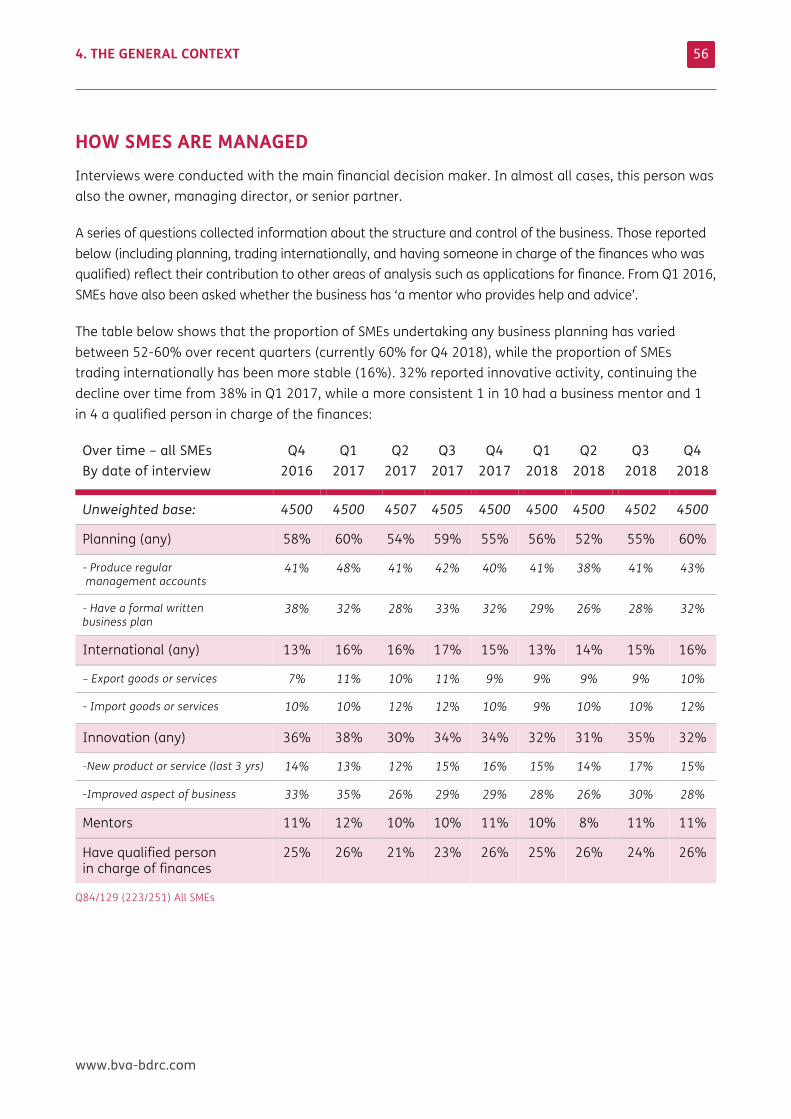
4. THE GENERAL CONTEXT
www.bva-bdrc.com
56
HOW SMES ARE MANAGED Interviews were conducted with the main financial decision maker. In almost all cases, this person was also the owner, managing director, or senior partner.
A series of questions collected information about the structure and control of the business. Those reported below (including planning, trading internationally, and having someone in charge of the finances who was qualified) reflect their contribution to other areas of analysis such as applications for finance. From Q1 2016, SMEs have also been asked whether the business has ‘a mentor who provides help and advice’.
The table below shows that the proportion of SMEs undertaking any business planning has varied between 52-60% over recent quarters (currently 60% for Q4 2018), while the proportion of SMEs trading internationally has been more stable (16%). 32% reported innovative activity, continuing the decline over time from 38% in Q1 2017, while a more consistent 1 in 10 had a business mentor and 1 in 4 a qualified person in charge of the finances:
Over time – all SMEs By date of interview
Q4 2016
Q1 2017
Q2 2017
Q3 2017
Q4 2017
Q1 2018
Q2 2018
Q3 2018
Q4 2018
Unweighted base: 4500 4500 4507 4505 4500 4500 4500 4502 4500
Planning (any) 58% 60% 54% 59% 55% 56% 52% 55% 60%
- Produce regular management accounts
41% 48% 41% 42% 40% 41% 38% 41% 43%
- Have a formal written business plan
38% 32% 28% 33% 32% 29% 26% 28% 32%
International (any) 13% 16% 16% 17% 15% 13% 14% 15% 16%
– Export goods or services 7% 11% 10% 11% 9% 9% 9% 9% 10%
- Import goods or services 10% 10% 12% 12% 10% 9% 10% 10% 12%
Innovation (any) 36% 38% 30% 34% 34% 32% 31% 35% 32%
-New product or service (last 3 yrs) 14% 13% 12% 15% 16% 15% 14% 17% 15%
-Improved aspect of business 33% 35% 26% 29% 29% 28% 26% 30% 28%
Mentors 11% 12% 10% 10% 11% 10% 8% 11% 11%
Have qualified person in charge of finances
25% 26% 21% 23% 26% 25% 26% 24% 26%
Q84/129 (223/251) All SMEs
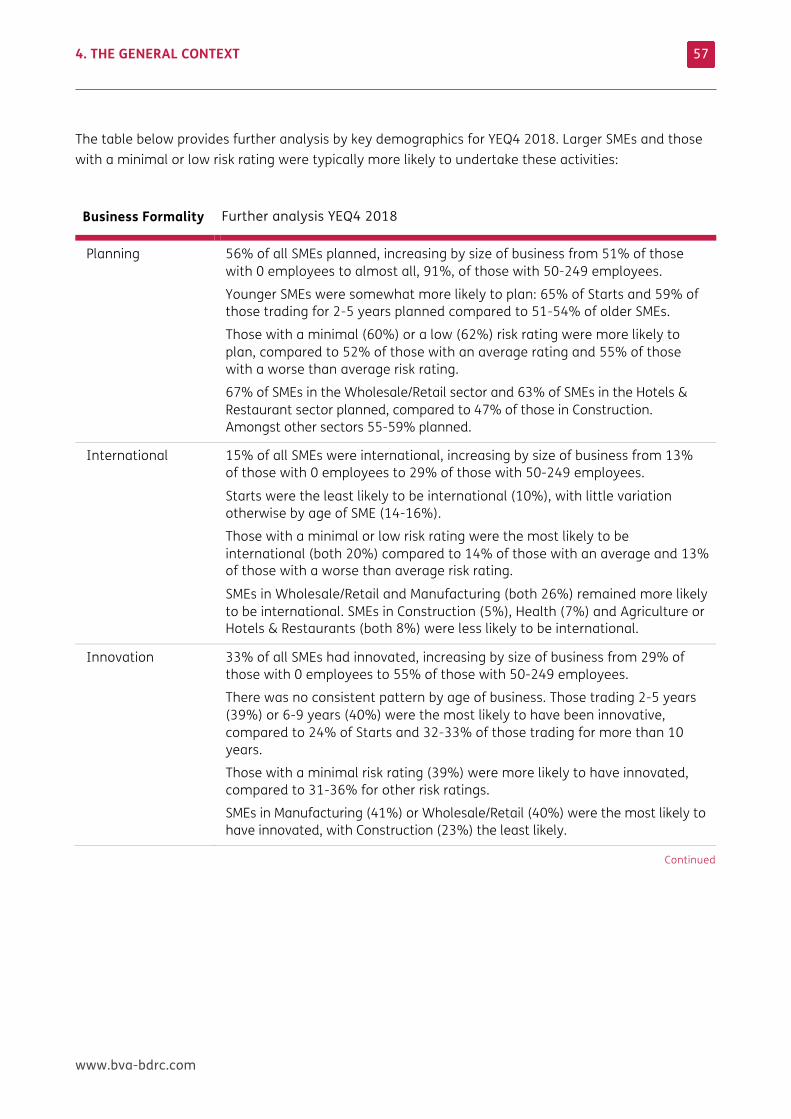
4. THE GENERAL CONTEXT
www.bva-bdrc.com
57
The table below provides further analysis by key demographics for YEQ4 2018. Larger SMEs and those with a minimal or low risk rating were typically more likely to undertake these activities:
Business Formality Further analysis YEQ4 2018
Planning 56% of all SMEs planned, increasing by size of business from 51% of those with 0 employees to almost all, 91%, of those with 50-249 employees.
Younger SMEs were somewhat more likely to plan: 65% of Starts and 59% of those trading for 2-5 years planned compared to 51-54% of older SMEs.
Those with a minimal (60%) or a low (62%) risk rating were more likely to plan, compared to 52% of those with an average rating and 55% of those with a worse than average risk rating.
67% of SMEs in the Wholesale/Retail sector and 63% of SMEs in the Hotels & Restaurant sector planned, compared to 47% of those in Construction. Amongst other sectors 55-59% planned.
International 15% of all SMEs were international, increasing by size of business from 13% of those with 0 employees to 29% of those with 50-249 employees.
Starts were the least likely to be international (10%), with little variation otherwise by age of SME (14-16%).
Those with a minimal or low risk rating were the most likely to be international (both 20%) compared to 14% of those with an average and 13% of those with a worse than average risk rating.
SMEs in Wholesale/Retail and Manufacturing (both 26%) remained more likely to be international. SMEs in Construction (5%), Health (7%) and Agriculture or Hotels & Restaurants (both 8%) were less likely to be international.
Innovation 33% of all SMEs had innovated, increasing by size of business from 29% of those with 0 employees to 55% of those with 50-249 employees.
There was no consistent pattern by age of business. Those trading 2-5 years (39%) or 6-9 years (40%) were the most likely to have been innovative, compared to 24% of Starts and 32-33% of those trading for more than 10 years.
Those with a minimal risk rating (39%) were more likely to have innovated, compared to 31-36% for other risk ratings.
SMEs in Manufacturing (41%) or Wholesale/Retail (40%) were the most likely to have innovated, with Construction (23%) the least likely.
Continued
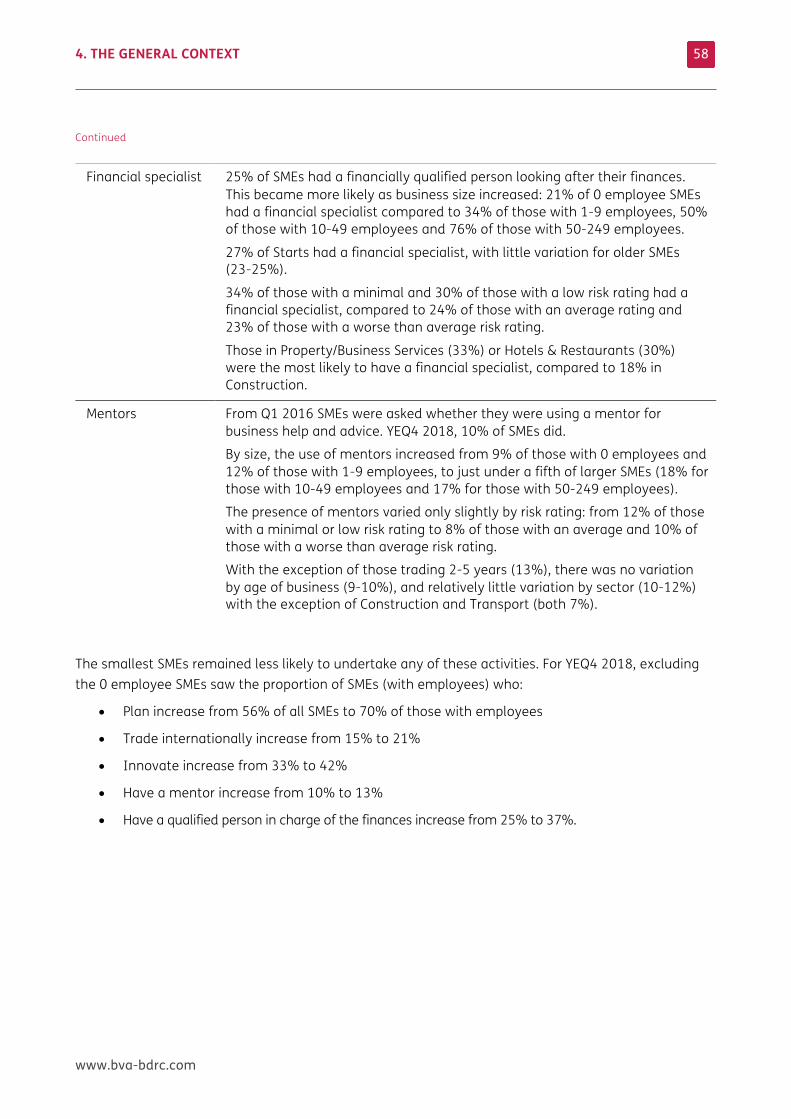
4. THE GENERAL CONTEXT
www.bva-bdrc.com
58
Continued
Financial specialist 25% of SMEs had a financially qualified person looking after their finances. This became more likely as business size increased: 21% of 0 employee SMEs had a financial specialist compared to 34% of those with 1-9 employees, 50% of those with 10-49 employees and 76% of those with 50-249 employees.
27% of Starts had a financial specialist, with little variation for older SMEs (23-25%).
34% of those with a minimal and 30% of those with a low risk rating had a financial specialist, compared to 24% of those with an average rating and 23% of those with a worse than average risk rating.
Those in Property/Business Services (33%) or Hotels & Restaurants (30%) were the most likely to have a financial specialist, compared to 18% in Construction.
Mentors From Q1 2016 SMEs were asked whether they were using a mentor for business help and advice. YEQ4 2018, 10% of SMEs did.
By size, the use of mentors increased from 9% of those with 0 employees and 12% of those with 1-9 employees, to just under a fifth of larger SMEs (18% for those with 10-49 employees and 17% for those with 50-249 employees).
The presence of mentors varied only slightly by risk rating: from 12% of those with a minimal or low risk rating to 8% of those with an average and 10% of those with a worse than average risk rating.
With the exception of those trading 2-5 years (13%), there was no variation by age of business (9-10%), and relatively little variation by sector (10-12%) with the exception of Construction and Transport (both 7%).
The smallest SMEs remained less likely to undertake any of these activities. For YEQ4 2018, excluding the 0 employee SMEs saw the proportion of SMEs (with employees) who:
• Plan increase from 56% of all SMEs to 70% of those with employees
• Trade internationally increase from 15% to 21%
• Innovate increase from 33% to 42%
• Have a mentor increase from 10% to 13%
• Have a qualified person in charge of the finances increase from 25% to 37%.
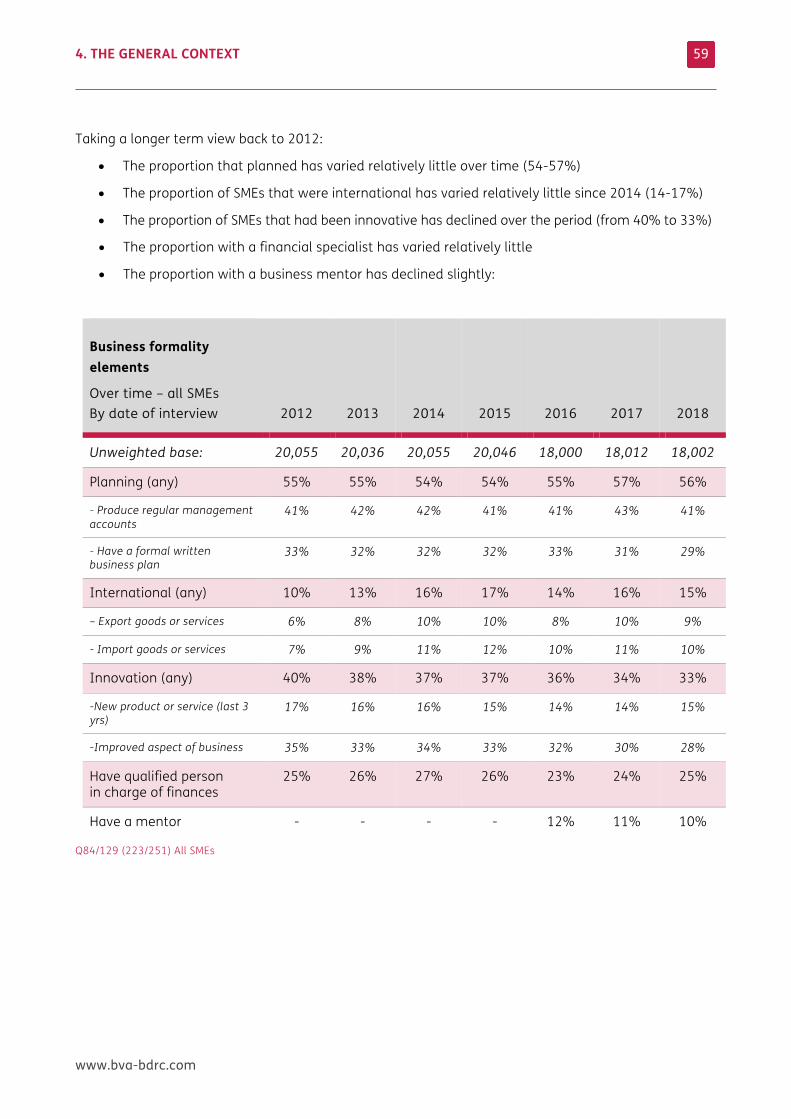
4. THE GENERAL CONTEXT
www.bva-bdrc.com
59
Taking a longer term view back to 2012:
• The proportion that planned has varied relatively little over time (54-57%)
• The proportion of SMEs that were international has varied relatively little since 2014 (14-17%)
• The proportion of SMEs that had been innovative has declined over the period (from 40% to 33%)
• The proportion with a financial specialist has varied relatively little
• The proportion with a business mentor has declined slightly:
Business formality elements
Over time – all SMEs By date of interview 2012 2013 2014 2015
2016 2017 2018
Unweighted base: 20,055 20,036 20,055 20,046 18,000 18,012 18,002
Planning (any) 55% 55% 54% 54% 55% 57% 56%
- Produce regular management accounts
41% 42% 42% 41% 41% 43% 41%
- Have a formal written business plan
33% 32% 32% 32% 33% 31% 29%
International (any) 10% 13% 16% 17% 14% 16% 15%
– Export goods or services 6% 8% 10% 10% 8% 10% 9%
- Import goods or services 7% 9% 11% 12% 10% 11% 10%
Innovation (any) 40% 38% 37% 37% 36% 34% 33%
-New product or service (last 3 yrs)
17% 16% 16% 15% 14% 14% 15%
-Improved aspect of business 35% 33% 34% 33% 32% 30% 28%
Have qualified person in charge of finances
25% 26% 27% 26% 23% 24% 25%
Have a mentor - - - - 12% 11% 10%
Q84/129 (223/251) All SMEs
4. THE GENERAL CONTEXT
www.bva-bdrc.com
60
The proportion of SMEs that innovate has declined steadily since 2012. Further investigation showed that this decline between 2012 and 2018 occurred across all size bands, but more markedly for those with 50-249 employees and slightly more for improving an aspect of the business than for new product development:
• Amongst all SMEs the proportion developing a new product dropped from 17% in 2012 to 15% in 2018 and the proportion improving the business from 35% to 28%.
• Amongst those with 0 employees the proportion developing a new product was stable (15% to 14%) but the proportion improving the business declined from 32% to 25%.
• Amongst those with 1-9 employees the proportion developing a new product dropped from 22% to 18% and the proportion improving the business from 44% to 35%.
• Amongst those with 10-49 employees the proportion developing a new product dropped from 29% to 24% and the proportion improving the business from 55% to 46%.
• Amongst those with 50-249 employees the proportion developing a new product dropped more markedly from 42% to 29% and the proportion improving the business from 64% to 45%.
Occasional questions have been asked (starting in Q1 2014) about whether the business holds intellectual property or other knowledge assets on its balance sheet such as patents, copyrights, trademarks or goodwill (in H1 2014, 6% did).
The latest figures for YEQ4 2018 were marginally higher, with 8% of all SMEs holding intellectual property or other knowledge assets on their balance sheet, increasing by size from 7% of 0 employee SMEs and 9% of those with 1-9 employees, to 15% of those with 10-49 employees and 30% of those with 50-249 employees.
Those in the Property/Business Services sector (11%) or in Manufacturing or the Other Community sectors (10%) were more likely to hold such assets, compared to 2% of those in Construction and 4-8% in other sectors.
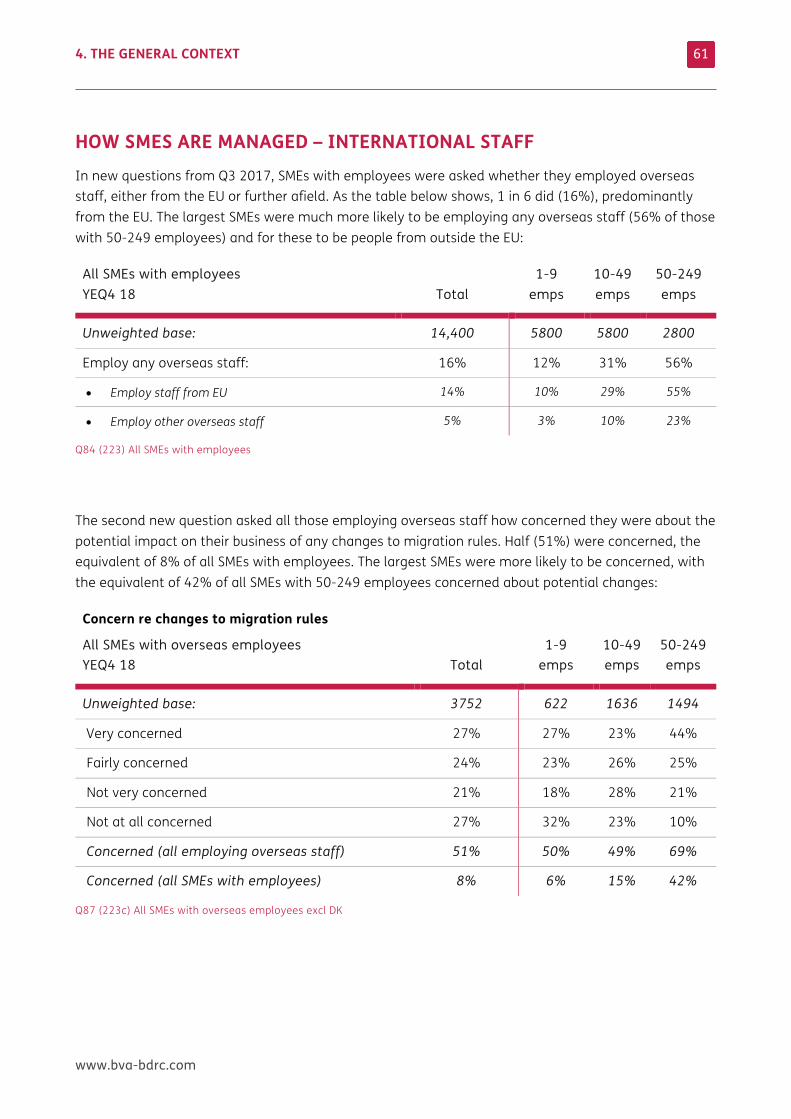
4. THE GENERAL CONTEXT
www.bva-bdrc.com
61
HOW SMES ARE MANAGED – INTERNATIONAL STAFF In new questions from Q3 2017, SMEs with employees were asked whether they employed overseas staff, either from the EU or further afield. As the table below shows, 1 in 6 did (16%), predominantly from the EU. The largest SMEs were much more likely to be employing any overseas staff (56% of those with 50-249 employees) and for these to be people from outside the EU:
All SMEs with employees YEQ4 18 Total
1-9 emps
10-49 emps
50-249 emps
Unweighted base: 14,400 5800 5800 2800
Employ any overseas staff: 16% 12% 31% 56%
• Employ staff from EU 14% 10% 29% 55%
• Employ other overseas staff 5% 3% 10% 23%
Q84 (223) All SMEs with employees
The second new question asked all those employing overseas staff how concerned they were about the potential impact on their business of any changes to migration rules. Half (51%) were concerned, the equivalent of 8% of all SMEs with employees. The largest SMEs were more likely to be concerned, with the equivalent of 42% of all SMEs with 50-249 employees concerned about potential changes:
Concern re changes to migration rules
All SMEs with overseas employees YEQ4 18 Total
1-9 emps
10-49 emps
50-249 emps
Unweighted base: 3752 622 1636 1494
Very concerned 27% 27% 23% 44%
Fairly concerned 24% 23% 26% 25%
Not very concerned 21% 18% 28% 21%
Not at all concerned 27% 32% 23% 10%
Concerned (all employing overseas staff) 51% 50% 49% 69%
Concerned (all SMEs with employees) 8% 6% 15% 42%
Q87 (223c) All SMEs with overseas employees excl DK
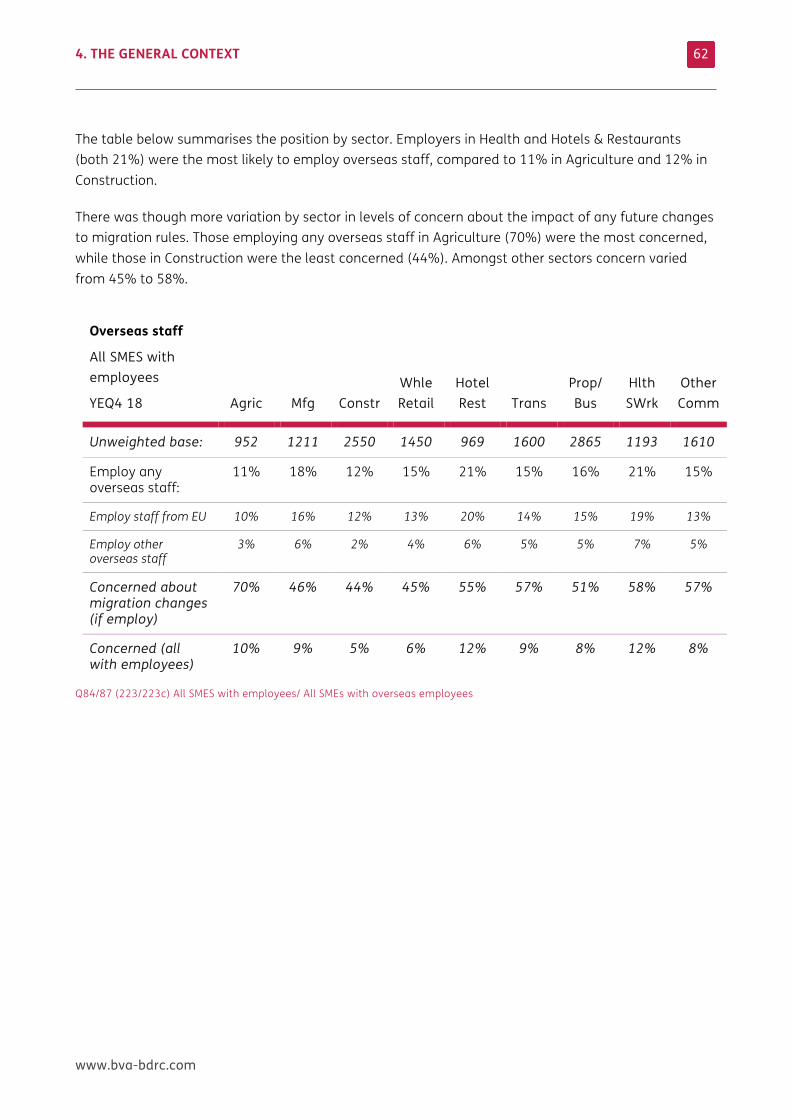
4. THE GENERAL CONTEXT
www.bva-bdrc.com
62
The table below summarises the position by sector. Employers in Health and Hotels & Restaurants (both 21%) were the most likely to employ overseas staff, compared to 11% in Agriculture and 12% in Construction.
There was though more variation by sector in levels of concern about the impact of any future changes to migration rules. Those employing any overseas staff in Agriculture (70%) were the most concerned, while those in Construction were the least concerned (44%). Amongst other sectors concern varied from 45% to 58%.
Overseas staff
All SMES with employees
YEQ4 18 Agric Mfg Constr Whle Retail
Hotel Rest Trans
Prop/ Bus
Hlth SWrk
Other Comm
Unweighted base: 952 1211 2550 1450 969 1600 2865 1193 1610
Employ any overseas staff:
11% 18% 12% 15% 21% 15% 16% 21% 15%
Employ staff from EU 10% 16% 12% 13% 20% 14% 15% 19% 13%
Employ other overseas staff
3% 6% 2% 4% 6% 5% 5% 7% 5%
Concerned about migration changes (if employ)
70% 46% 44% 45% 55% 57% 51% 58% 57%
Concerned (all with employees)
10% 9% 5% 6% 12% 9% 8% 12% 8%
Q84/87 (223/223c) All SMES with employees/ All SMEs with overseas employees
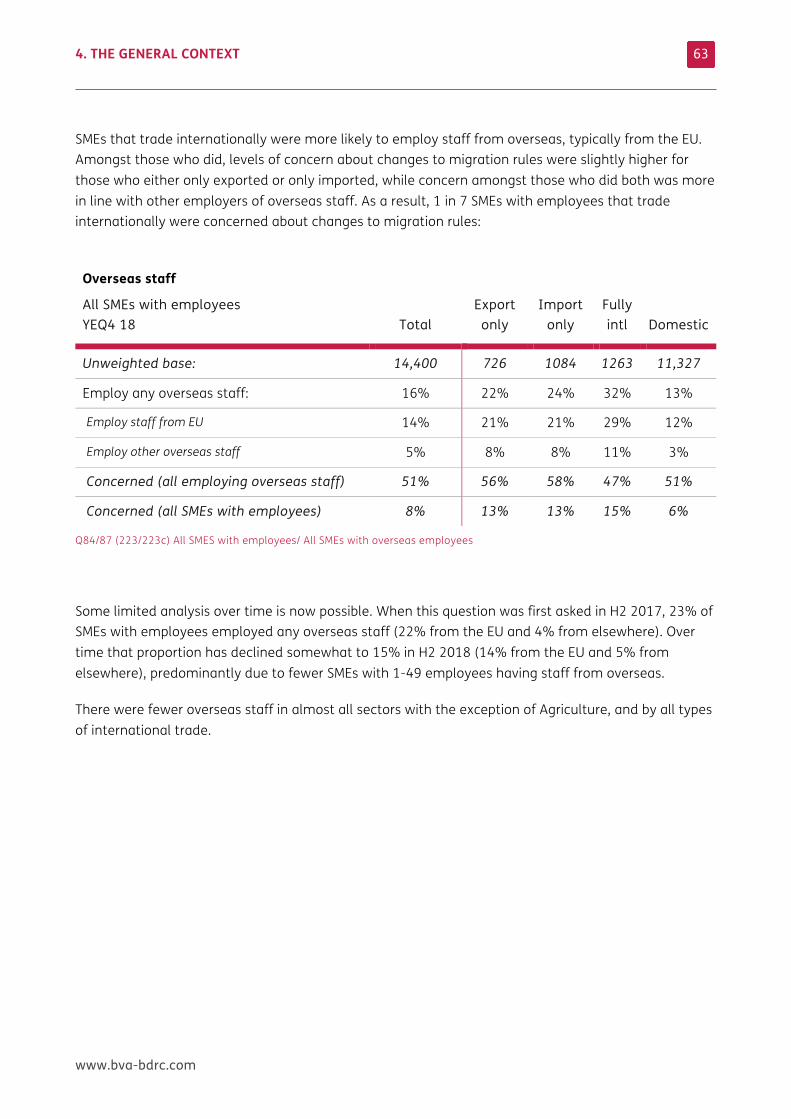
4. THE GENERAL CONTEXT
www.bva-bdrc.com
63
SMEs that trade internationally were more likely to employ staff from overseas, typically from the EU. Amongst those who did, levels of concern about changes to migration rules were slightly higher for those who either only exported or only imported, while concern amongst those who did both was more in line with other employers of overseas staff. As a result, 1 in 7 SMEs with employees that trade internationally were concerned about changes to migration rules:
Overseas staff
All SMEs with employees YEQ4 18 Total
Export only
Import only
Fully intl Domestic
Unweighted base: 14,400 726 1084 1263 11,327
Employ any overseas staff: 16% 22% 24% 32% 13%
Employ staff from EU 14% 21% 21% 29% 12%
Employ other overseas staff 5% 8% 8% 11% 3%
Concerned (all employing overseas staff) 51% 56% 58% 47% 51%
Concerned (all SMEs with employees) 8% 13% 13% 15% 6%
Q84/87 (223/223c) All SMES with employees/ All SMEs with overseas employees
Some limited analysis over time is now possible. When this question was first asked in H2 2017, 23% of SMEs with employees employed any overseas staff (22% from the EU and 4% from elsewhere). Over time that proportion has declined somewhat to 15% in H2 2018 (14% from the EU and 5% from elsewhere), predominantly due to fewer SMEs with 1-49 employees having staff from overseas.
There were fewer overseas staff in almost all sectors with the exception of Agriculture, and by all types of international trade.
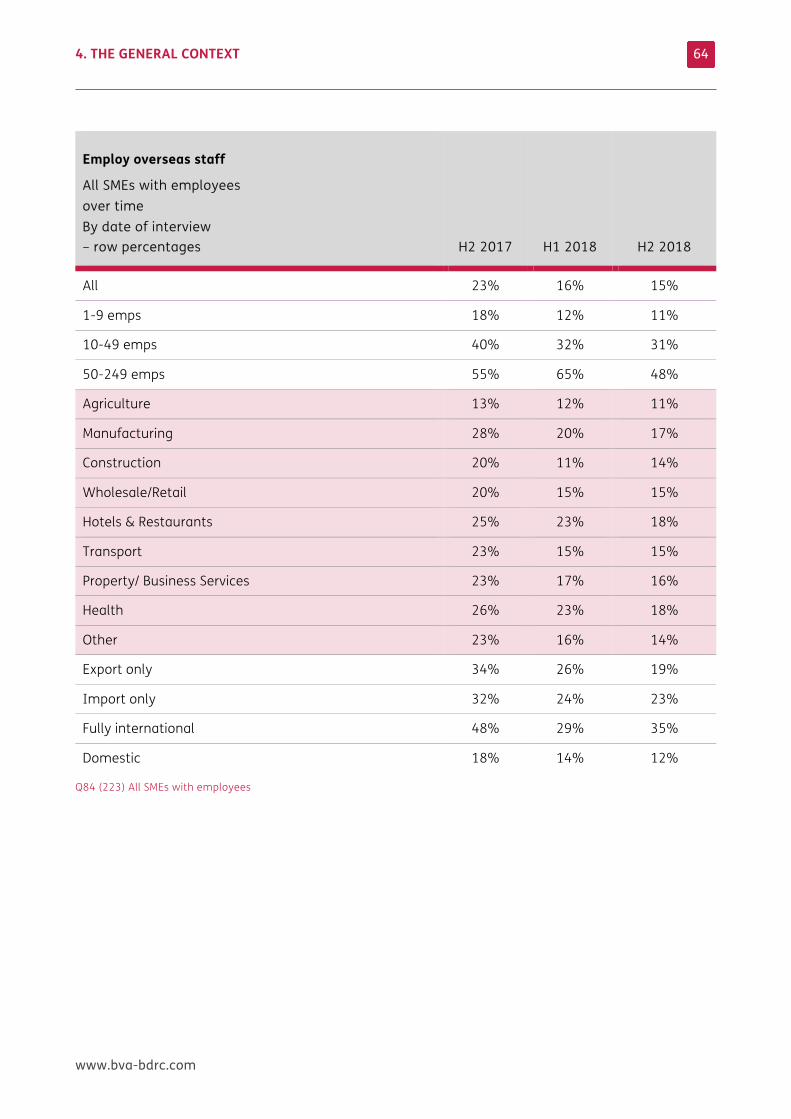
4. THE GENERAL CONTEXT
www.bva-bdrc.com
64
Employ overseas staff
All SMEs with employees over time By date of interview – row percentages H2 2017 H1 2018 H2 2018
All 23% 16% 15%
1-9 emps 18% 12% 11%
10-49 emps 40% 32% 31%
50-249 emps 55% 65% 48%
Agriculture 13% 12% 11%
Manufacturing 28% 20% 17%
Construction 20% 11% 14%
Wholesale/Retail 20% 15% 15%
Hotels & Restaurants 25% 23% 18%
Transport 23% 15% 15%
Property/ Business Services 23% 17% 16%
Health 26% 23% 18%
Other 23% 16% 14%
Export only 34% 26% 19%
Import only 32% 24% 23%
Fully international 48% 29% 35%
Domestic 18% 14% 12%
Q84 (223) All SMEs with employees
4. THE GENERAL CONTEXT
www.bva-bdrc.com
65
Amongst those employing staff from overseas, concern about changes to migration rules increased from 4 in 10 to 5 in 10 of relevant SMEs and for all but the largest SMEs.
• Concern amongst Manufacturers with overseas staff increased from 27% in H2 2017 to 43% in H2 2018 and amongst those in the Other Community sector from 32% to 53%.Those in Agriculture (59% to 69%) and Wholesale/Retail (40% to 50%) and Construction (32% to 43%) were also more concerned in H2 2018 while employers of overseas staff in other sectors saw no or minimal increases in levels of concern.
• Amongst those who only export, levels of concern about migration changes increased from 49% in H2 2017 to 64% in H1 2018 but then reverted to 44% for H2 2018. For those who only import, levels of concern about migration changes increased from 47% in H2 2017 to 56% in H1 2018 and then again to 59% for H2 2018, while for those who both import and export, levels of concern about migration changes increased from 42% in H2 2017 to 48% in H1 2018 but were then stable at 47% for H2 2018.
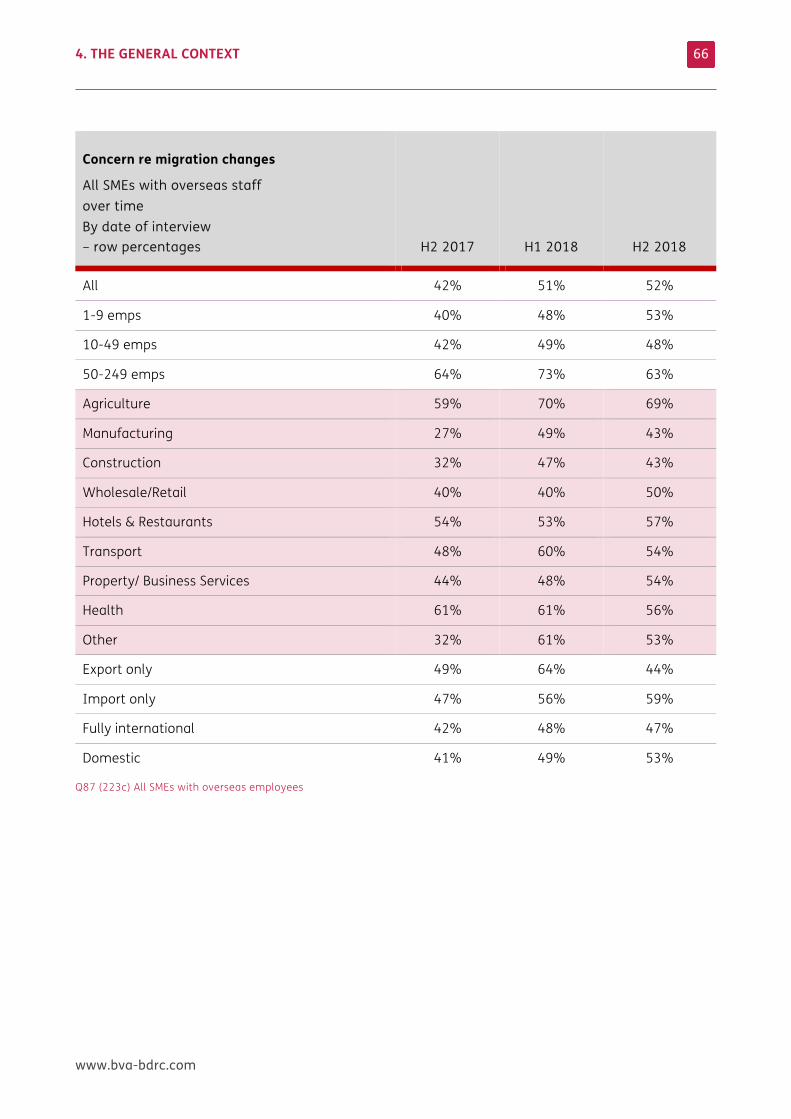
4. THE GENERAL CONTEXT
www.bva-bdrc.com
66
Concern re migration changes
All SMEs with overseas staff over time By date of interview – row percentages H2 2017 H1 2018 H2 2018
All 42% 51% 52%
1-9 emps 40% 48% 53%
10-49 emps 42% 49% 48%
50-249 emps 64% 73% 63%
Agriculture 59% 70% 69%
Manufacturing 27% 49% 43%
Construction 32% 47% 43%
Wholesale/Retail 40% 40% 50%
Hotels & Restaurants 54% 53% 57%
Transport 48% 60% 54%
Property/ Business Services 44% 48% 54%
Health 61% 61% 56%
Other 32% 61% 53%
Export only 49% 64% 44%
Import only 47% 56% 59%
Fully international 42% 48% 47%
Domestic 41% 49% 53%
Q87 (223c) All SMEs with overseas employees
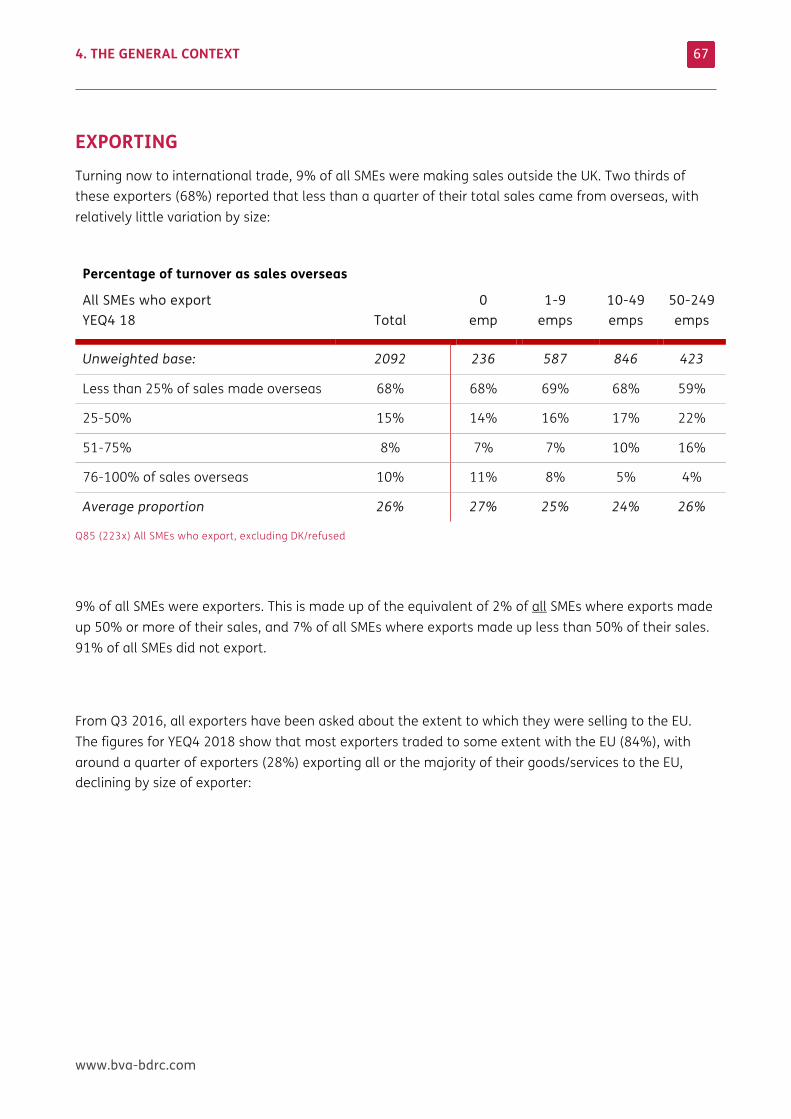
4. THE GENERAL CONTEXT
www.bva-bdrc.com
67
EXPORTING Turning now to international trade, 9% of all SMEs were making sales outside the UK. Two thirds of these exporters (68%) reported that less than a quarter of their total sales came from overseas, with relatively little variation by size:
Percentage of turnover as sales overseas
All SMEs who export YEQ4 18 Total
0 emp
1-9 emps
10-49 emps
50-249 emps
Unweighted base: 2092 236 587 846 423
Less than 25% of sales made overseas 68% 68% 69% 68% 59%
25-50% 15% 14% 16% 17% 22%
51-75% 8% 7% 7% 10% 16%
76-100% of sales overseas 10% 11% 8% 5% 4%
Average proportion 26% 27% 25% 24% 26%
Q85 (223x) All SMEs who export, excluding DK/refused
9% of all SMEs were exporters. This is made up of the equivalent of 2% of all SMEs where exports made up 50% or more of their sales, and 7% of all SMEs where exports made up less than 50% of their sales. 91% of all SMEs did not export.
From Q3 2016, all exporters have been asked about the extent to which they were selling to the EU. The figures for YEQ4 2018 show that most exporters traded to some extent with the EU (84%), with around a quarter of exporters (28%) exporting all or the majority of their goods/services to the EU, declining by size of exporter:
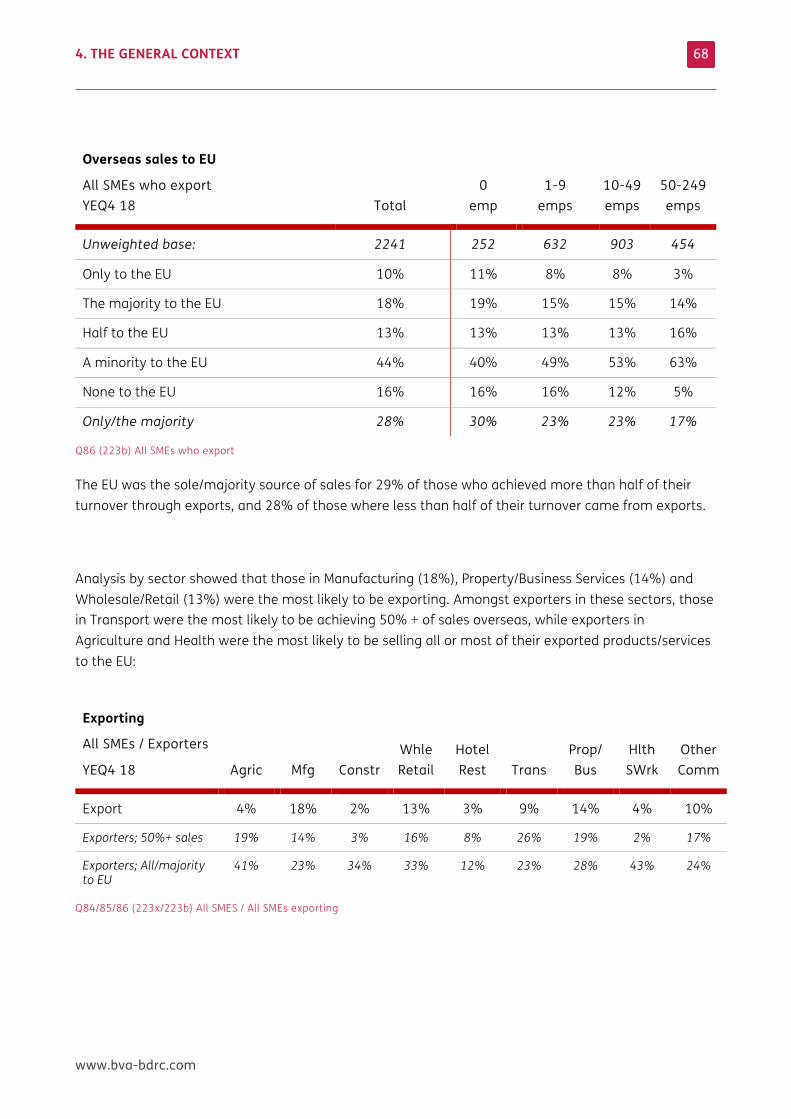
4. THE GENERAL CONTEXT
www.bva-bdrc.com
68
Overseas sales to EU
All SMEs who export YEQ4 18 Total
0 emp
1-9 emps
10-49 emps
50-249 emps
Unweighted base: 2241 252 632 903 454
Only to the EU 10% 11% 8% 8% 3%
The majority to the EU 18% 19% 15% 15% 14%
Half to the EU 13% 13% 13% 13% 16%
A minority to the EU 44% 40% 49% 53% 63%
None to the EU 16% 16% 16% 12% 5%
Only/the majority 28% 30% 23% 23% 17%
Q86 (223b) All SMEs who export
The EU was the sole/majority source of sales for 29% of those who achieved more than half of their turnover through exports, and 28% of those where less than half of their turnover came from exports.
Analysis by sector showed that those in Manufacturing (18%), Property/Business Services (14%) and Wholesale/Retail (13%) were the most likely to be exporting. Amongst exporters in these sectors, those in Transport were the most likely to be achieving 50% + of sales overseas, while exporters in Agriculture and Health were the most likely to be selling all or most of their exported products/services to the EU:
Exporting
All SMEs / Exporters
YEQ4 18 Agric Mfg Constr Whle Retail
Hotel Rest Trans
Prop/ Bus
Hlth SWrk
Other Comm
Export 4% 18% 2% 13% 3% 9% 14% 4% 10%
Exporters; 50%+ sales 19% 14% 3% 16% 8% 26% 19% 2% 17%
Exporters; All/majority to EU
41% 23% 34% 33% 12% 23% 28% 43% 24%
Q84/85/86 (223x/223b) All SMES / All SMEs exporting
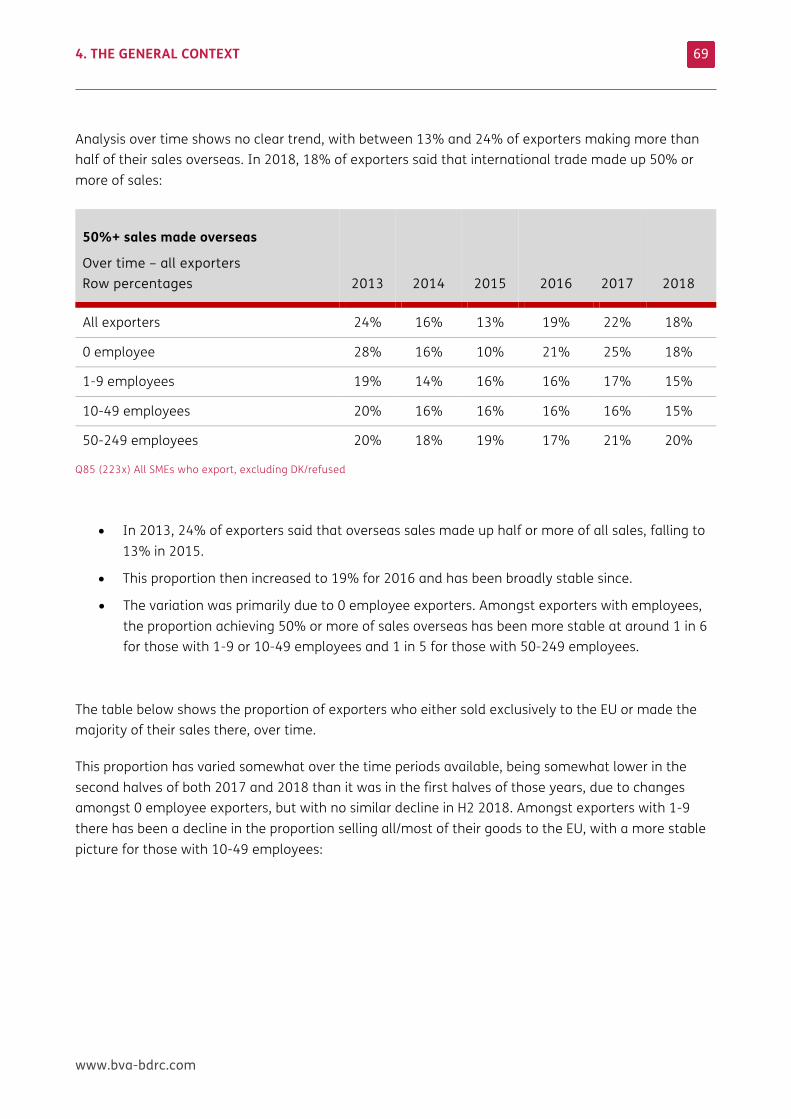
4. THE GENERAL CONTEXT
www.bva-bdrc.com
69
Analysis over time shows no clear trend, with between 13% and 24% of exporters making more than half of their sales overseas. In 2018, 18% of exporters said that international trade made up 50% or more of sales:
50%+ sales made overseas
Over time – all exporters Row percentages 2013 2014 2015 2016 2017 2018
All exporters 24% 16% 13% 19% 22% 18%
0 employee 28% 16% 10% 21% 25% 18%
1-9 employees 19% 14% 16% 16% 17% 15%
10-49 employees 20% 16% 16% 16% 16% 15%
50-249 employees 20% 18% 19% 17% 21% 20%
Q85 (223x) All SMEs who export, excluding DK/refused
• In 2013, 24% of exporters said that overseas sales made up half or more of all sales, falling to 13% in 2015.
• This proportion then increased to 19% for 2016 and has been broadly stable since.
• The variation was primarily due to 0 employee exporters. Amongst exporters with employees, the proportion achieving 50% or more of sales overseas has been more stable at around 1 in 6 for those with 1-9 or 10-49 employees and 1 in 5 for those with 50-249 employees.
The table below shows the proportion of exporters who either sold exclusively to the EU or made the majority of their sales there, over time.
This proportion has varied somewhat over the time periods available, being somewhat lower in the second halves of both 2017 and 2018 than it was in the first halves of those years, due to changes amongst 0 employee exporters, but with no similar decline in H2 2018. Amongst exporters with 1-9 there has been a decline in the proportion selling all/most of their goods to the EU, with a more stable picture for those with 10-49 employees:
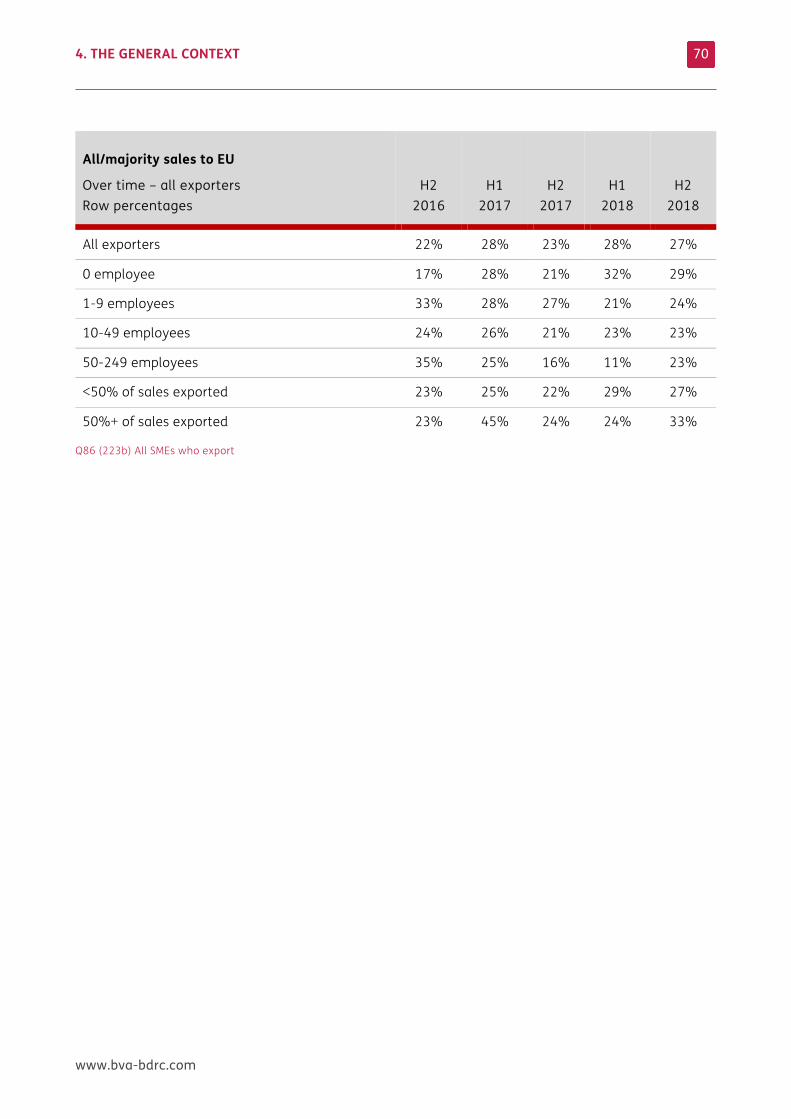
4. THE GENERAL CONTEXT
www.bva-bdrc.com
70
All/majority sales to EU
Over time – all exporters Row percentages
H2 2016
H1 2017
H2 2017
H1 2018
H2 2018
All exporters 22% 28% 23% 28% 27%
0 employee 17% 28% 21% 32% 29%
1-9 employees 33% 28% 27% 21% 24%
10-49 employees 24% 26% 21% 23% 23%
50-249 employees 35% 25% 16% 11% 23%
<50% of sales exported 23% 25% 22% 29% 27%
50%+ of sales exported 23% 45% 24% 24% 33%
Q86 (223b) All SMEs who export
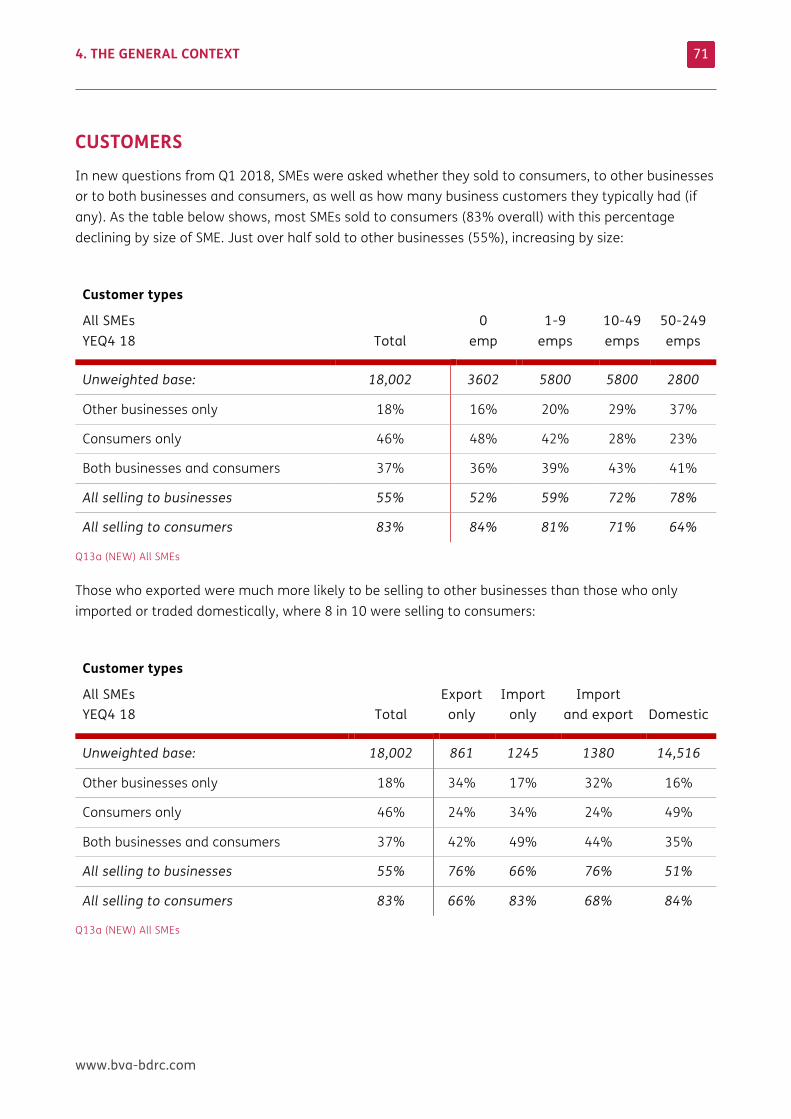
4. THE GENERAL CONTEXT
www.bva-bdrc.com
71
CUSTOMERS In new questions from Q1 2018, SMEs were asked whether they sold to consumers, to other businesses or to both businesses and consumers, as well as how many business customers they typically had (if any). As the table below shows, most SMEs sold to consumers (83% overall) with this percentage declining by size of SME. Just over half sold to other businesses (55%), increasing by size:
Customer types
All SMEs YEQ4 18 Total
0 emp
1-9 emps
10-49 emps
50-249 emps
Unweighted base: 18,002 3602 5800 5800 2800
Other businesses only 18% 16% 20% 29% 37%
Consumers only 46% 48% 42% 28% 23%
Both businesses and consumers 37% 36% 39% 43% 41%
All selling to businesses 55% 52% 59% 72% 78%
All selling to consumers 83% 84% 81% 71% 64%
Q13a (NEW) All SMEs
Those who exported were much more likely to be selling to other businesses than those who only imported or traded domestically, where 8 in 10 were selling to consumers:
Customer types
All SMEs YEQ4 18 Total
Export only
Import only
Import and export Domestic
Unweighted base: 18,002 861 1245 1380 14,516
Other businesses only 18% 34% 17% 32% 16%
Consumers only 46% 24% 34% 24% 49%
Both businesses and consumers 37% 42% 49% 44% 35%
All selling to businesses 55% 76% 66% 76% 51%
All selling to consumers 83% 66% 83% 68% 84%
Q13a (NEW) All SMEs
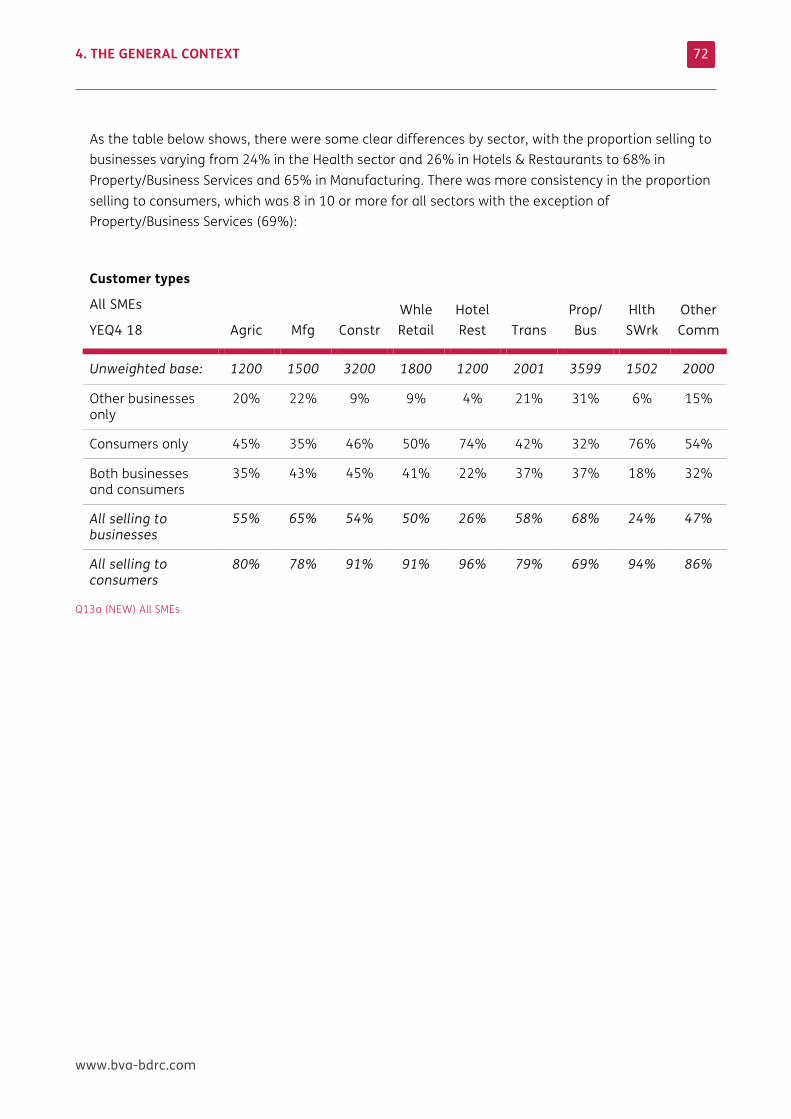
4. THE GENERAL CONTEXT
www.bva-bdrc.com
72
As the table below shows, there were some clear differences by sector, with the proportion selling to businesses varying from 24% in the Health sector and 26% in Hotels & Restaurants to 68% in Property/Business Services and 65% in Manufacturing. There was more consistency in the proportion selling to consumers, which was 8 in 10 or more for all sectors with the exception of Property/Business Services (69%):
Customer types
All SMEs
YEQ4 18 Agric Mfg Constr Whle Retail
Hotel Rest Trans
Prop/ Bus
Hlth SWrk
Other Comm
Unweighted base: 1200 1500 3200 1800 1200 2001 3599 1502 2000
Other businesses only
20% 22% 9% 9% 4% 21% 31% 6% 15%
Consumers only 45% 35% 46% 50% 74% 42% 32% 76% 54%
Both businesses and consumers
35% 43% 45% 41% 22% 37% 37% 18% 32%
All selling to businesses
55% 65% 54% 50% 26% 58% 68% 24% 47%
All selling to consumers
80% 78% 91% 91% 96% 79% 69% 94% 86%
Q13a (NEW) All SMEs
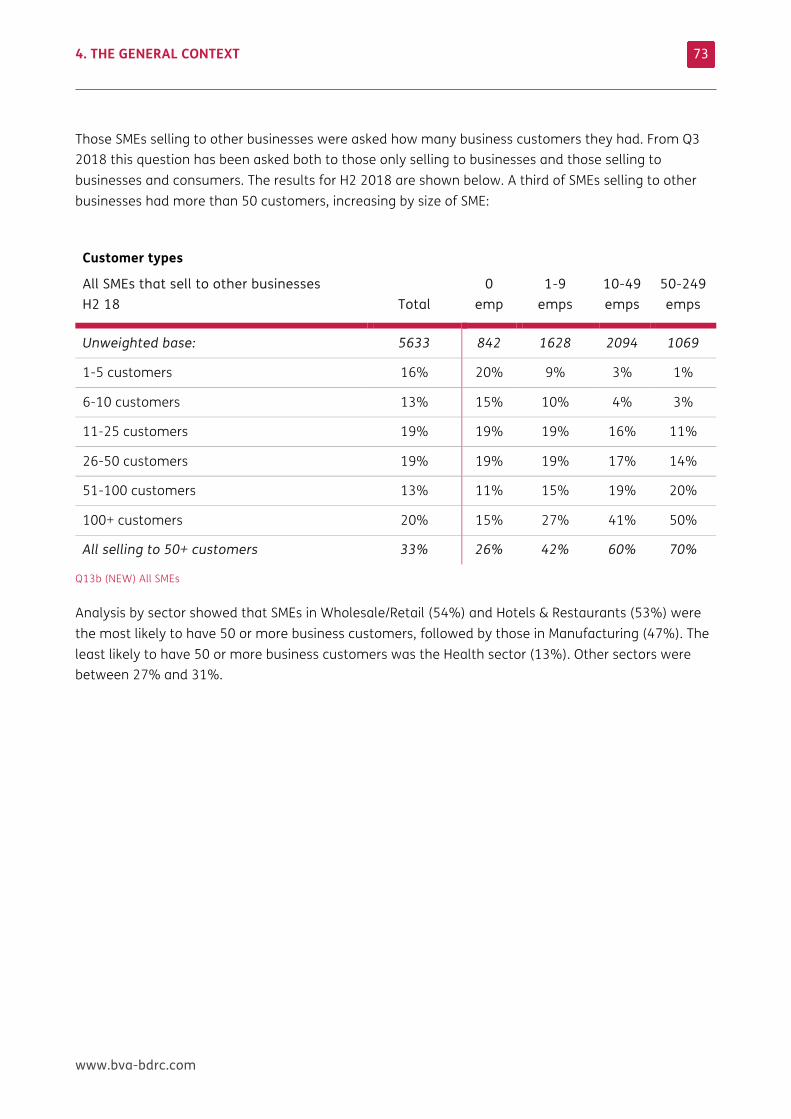
4. THE GENERAL CONTEXT
www.bva-bdrc.com
73
Those SMEs selling to other businesses were asked how many business customers they had. From Q3 2018 this question has been asked both to those only selling to businesses and those selling to businesses and consumers. The results for H2 2018 are shown below. A third of SMEs selling to other businesses had more than 50 customers, increasing by size of SME:
Customer types
All SMEs that sell to other businesses H2 18 Total
0 emp
1-9 emps
10-49 emps
50-249 emps
Unweighted base: 5633 842 1628 2094 1069
1-5 customers 16% 20% 9% 3% 1%
6-10 customers 13% 15% 10% 4% 3%
11-25 customers 19% 19% 19% 16% 11%
26-50 customers 19% 19% 19% 17% 14%
51-100 customers 13% 11% 15% 19% 20%
100+ customers 20% 15% 27% 41% 50%
All selling to 50+ customers 33% 26% 42% 60% 70%
Q13b (NEW) All SMEs
Analysis by sector showed that SMEs in Wholesale/Retail (54%) and Hotels & Restaurants (53%) were the most likely to have 50 or more business customers, followed by those in Manufacturing (47%). The least likely to have 50 or more business customers was the Health sector (13%). Other sectors were between 27% and 31%.
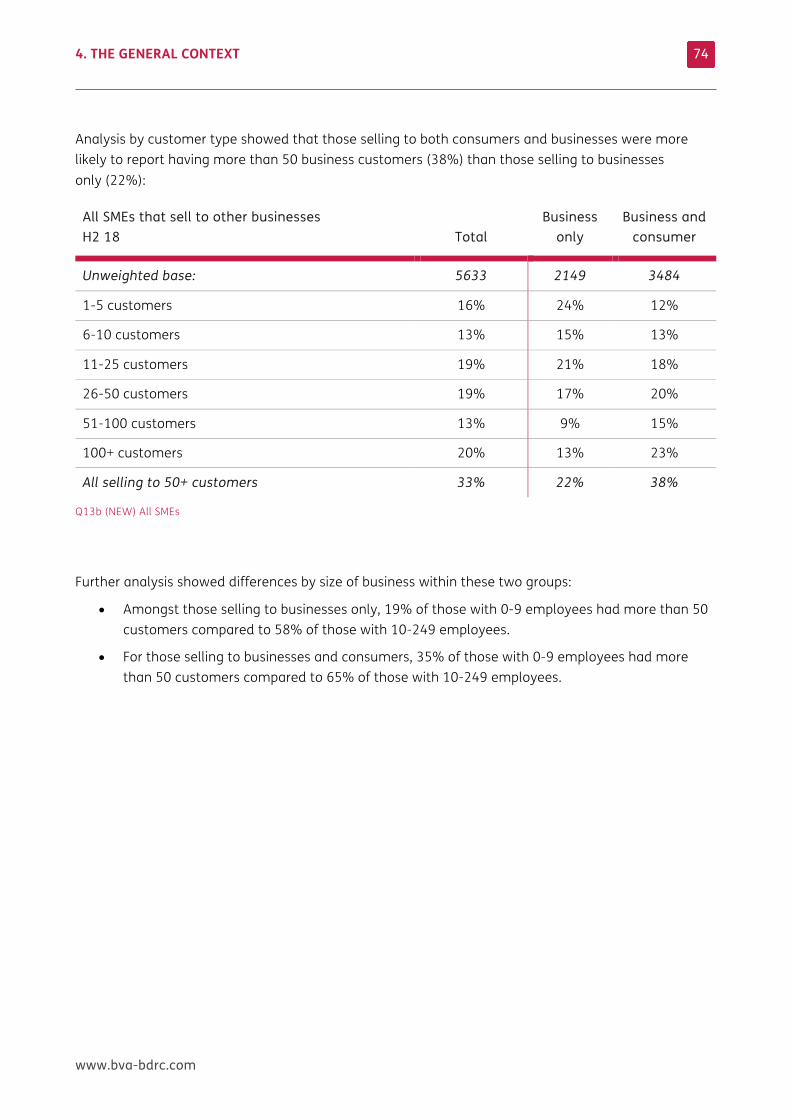
4. THE GENERAL CONTEXT
www.bva-bdrc.com
74
Analysis by customer type showed that those selling to both consumers and businesses were more likely to report having more than 50 business customers (38%) than those selling to businesses only (22%):
All SMEs that sell to other businesses H2 18 Total
Business only
Business and consumer
Unweighted base: 5633 2149 3484
1-5 customers 16% 24% 12%
6-10 customers 13% 15% 13%
11-25 customers 19% 21% 18%
26-50 customers 19% 17% 20%
51-100 customers 13% 9% 15%
100+ customers 20% 13% 23%
All selling to 50+ customers 33% 22% 38%
Q13b (NEW) All SMEs
Further analysis showed differences by size of business within these two groups:
• Amongst those selling to businesses only, 19% of those with 0-9 employees had more than 50 customers compared to 58% of those with 10-249 employees.
• For those selling to businesses and consumers, 35% of those with 0-9 employees had more than 50 customers compared to 65% of those with 10-249 employees.
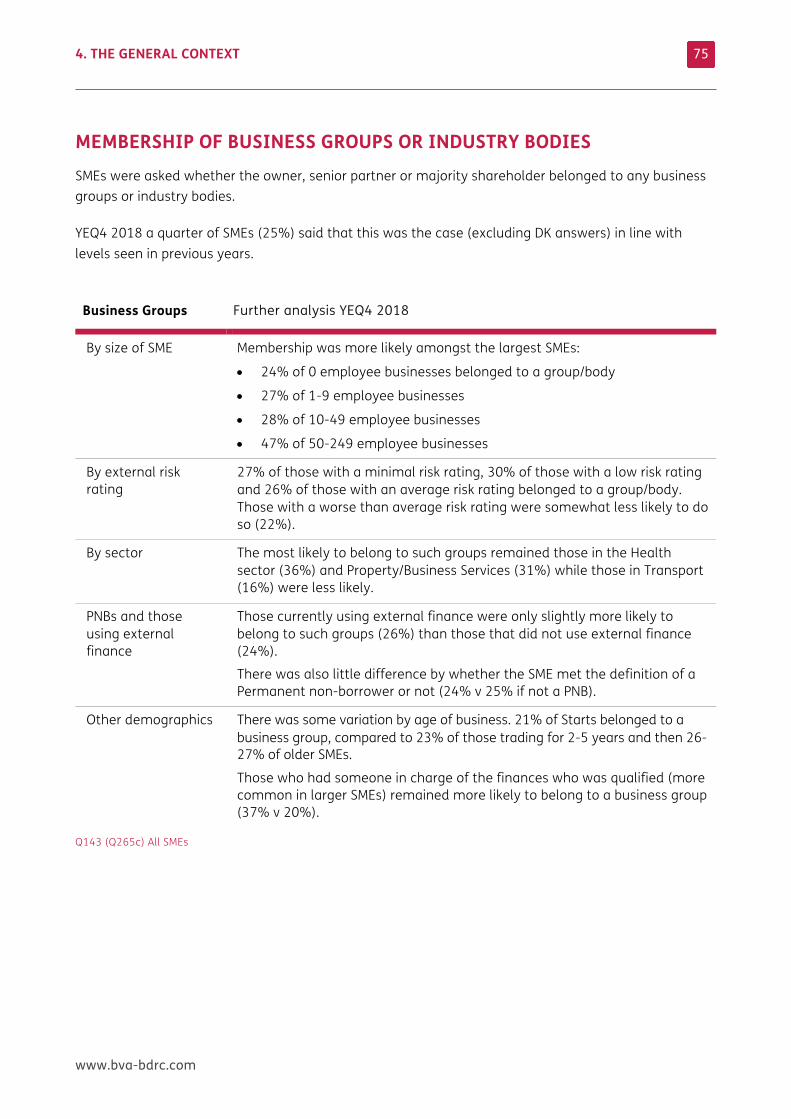
4. THE GENERAL CONTEXT
www.bva-bdrc.com
75
MEMBERSHIP OF BUSINESS GROUPS OR INDUSTRY BODIES SMEs were asked whether the owner, senior partner or majority shareholder belonged to any business groups or industry bodies.
YEQ4 2018 a quarter of SMEs (25%) said that this was the case (excluding DK answers) in line with levels seen in previous years.
Business Groups Further analysis YEQ4 2018
By size of SME Membership was more likely amongst the largest SMEs:
• 24% of 0 employee businesses belonged to a group/body
• 27% of 1-9 employee businesses
• 28% of 10-49 employee businesses
• 47% of 50-249 employee businesses
By external risk rating
27% of those with a minimal risk rating, 30% of those with a low risk rating and 26% of those with an average risk rating belonged to a group/body. Those with a worse than average risk rating were somewhat less likely to do so (22%).
By sector The most likely to belong to such groups remained those in the Health sector (36%) and Property/Business Services (31%) while those in Transport (16%) were less likely.
PNBs and those using external finance
Those currently using external finance were only slightly more likely to belong to such groups (26%) than those that did not use external finance (24%).
There was also little difference by whether the SME met the definition of a Permanent non-borrower or not (24% v 25% if not a PNB).
Other demographics There was some variation by age of business. 21% of Starts belonged to a business group, compared to 23% of those trading for 2-5 years and then 26-27% of older SMEs.
Those who had someone in charge of the finances who was qualified (more common in larger SMEs) remained more likely to belong to a business group (37% v 20%).
Q143 (Q265c) All SMEs
4. THE GENERAL CONTEXT
www.bva-bdrc.com
76
BUSINESS OWNERSHIP 69% of companies had one owner, declining by size from 88% of 0 employee companies to 42% of those with 50-249 employees. This means that of all SMEs, 90% were either sole proprietorships or companies with one owner.
A broader question explored the extent to which the owner of the SME was also involved in other businesses. For YEQ4 2018 (and excluding DK answers):
• 89% reported that this was the only business the owner was involved in, managerially or strategically, decreasing with size from 91% of 0 employee SMEs, to 71% of those with 50-249 employees.
• 9% reported that the owner currently ran another business as well (8% amongst 0 employee SMEs increasing to 28% amongst those with 50-249 employees).
• 2% reported that the owner had set up and run a business before (with little variation by size, except for the 6% of those with 50-249 employees).
• Less than 1% said the owner had provided funds for another business in the past few years, again with little variation by size of SME.
SMEs with employees were also asked whether theirs was a family business. For YEQ4 2018, 64% of those with employees said that it was. This means that for SMEs as a whole:
• 16% had employees and were family owned
• 9% had employees and a different ownership structure
• 75% of all SMEs had no employees (so were not asked the question).
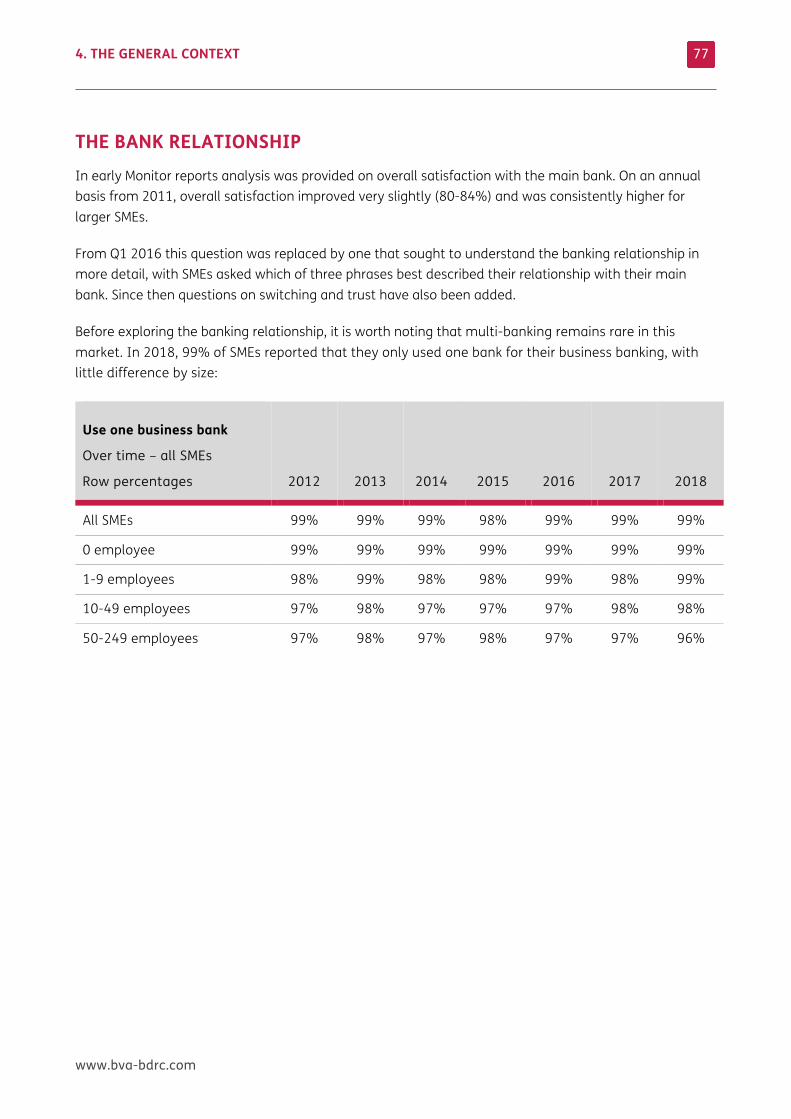
4. THE GENERAL CONTEXT
www.bva-bdrc.com
77
THE BANK RELATIONSHIP In early Monitor reports analysis was provided on overall satisfaction with the main bank. On an annual basis from 2011, overall satisfaction improved very slightly (80-84%) and was consistently higher for larger SMEs.
From Q1 2016 this question was replaced by one that sought to understand the banking relationship in more detail, with SMEs asked which of three phrases best described their relationship with their main bank. Since then questions on switching and trust have also been added.
Before exploring the banking relationship, it is worth noting that multi-banking remains rare in this market. In 2018, 99% of SMEs reported that they only used one bank for their business banking, with little difference by size:
Use one business bank
Over time – all SMEs
Row percentages 2012 2013 2014 2015 2016 2017 2018
All SMEs 99% 99% 99% 98% 99% 99% 99%
0 employee 99% 99% 99% 99% 99% 99% 99%
1-9 employees 98% 99% 98% 98% 99% 98% 99%
10-49 employees 97% 98% 97% 97% 97% 98% 98%
50-249 employees 97% 98% 97% 98% 97% 97% 96%
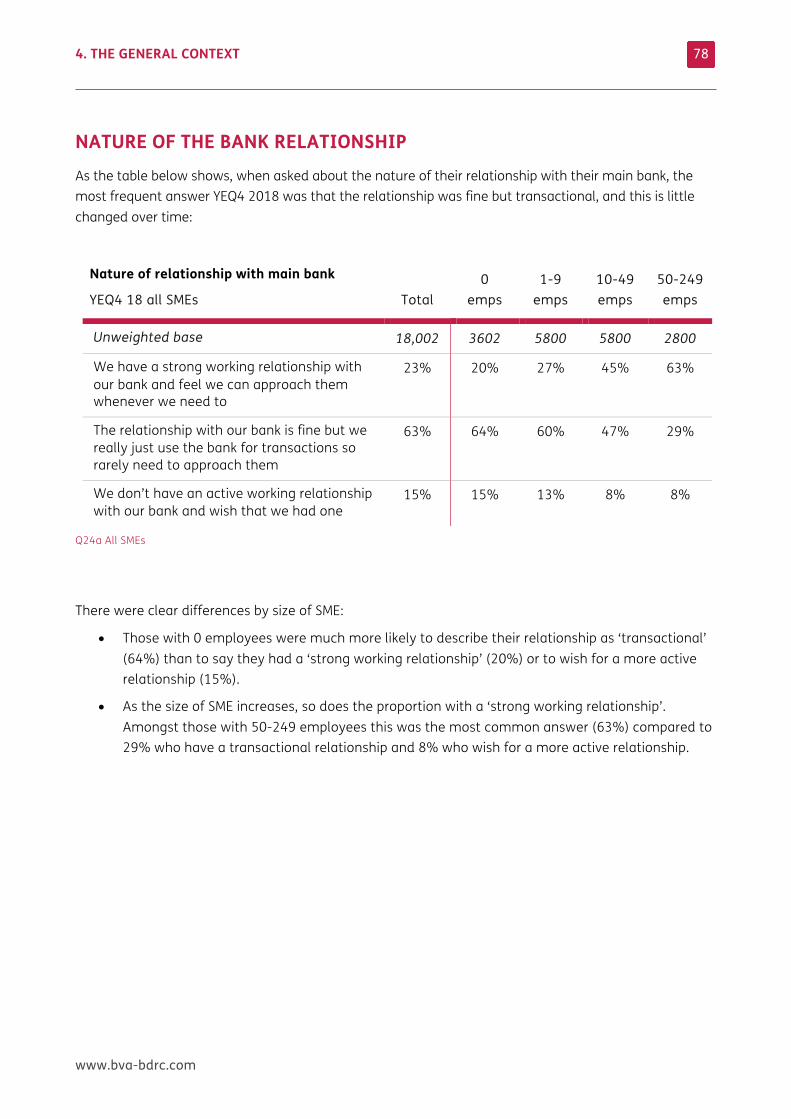
4. THE GENERAL CONTEXT
www.bva-bdrc.com
78
NATURE OF THE BANK RELATIONSHIP As the table below shows, when asked about the nature of their relationship with their main bank, the most frequent answer YEQ4 2018 was that the relationship was fine but transactional, and this is little changed over time:
Nature of relationship with main bank
YEQ4 18 all SMEs Total 0
emps 1-9
emps 10-49 emps
50-249 emps
Unweighted base 18,002 3602 5800 5800 2800
We have a strong working relationship with our bank and feel we can approach them whenever we need to
23% 20% 27% 45% 63%
The relationship with our bank is fine but we really just use the bank for transactions so rarely need to approach them
63% 64% 60% 47% 29%
We don’t have an active working relationship with our bank and wish that we had one
15% 15% 13% 8% 8%
Q24a All SMEs
There were clear differences by size of SME:
• Those with 0 employees were much more likely to describe their relationship as ‘transactional’ (64%) than to say they had a ‘strong working relationship’ (20%) or to wish for a more active relationship (15%).
• As the size of SME increases, so does the proportion with a ‘strong working relationship’. Amongst those with 50-249 employees this was the most common answer (63%) compared to 29% who have a transactional relationship and 8% who wish for a more active relationship.
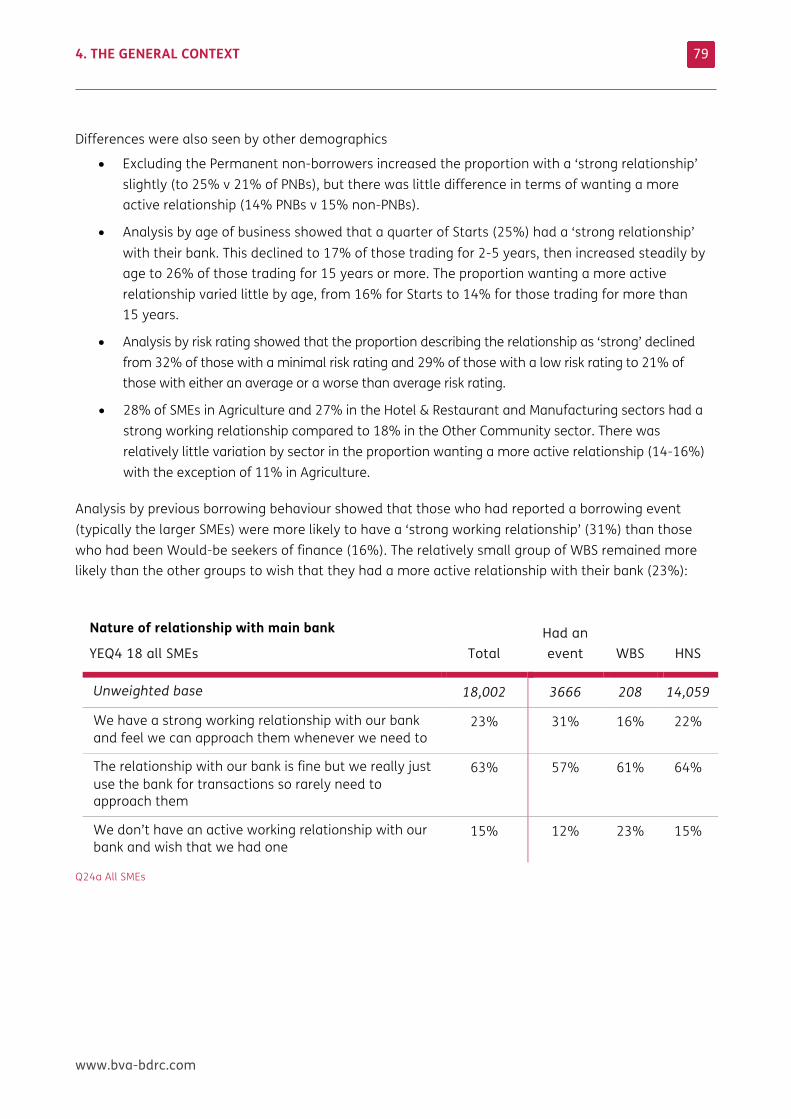
4. THE GENERAL CONTEXT
www.bva-bdrc.com
79
Differences were also seen by other demographics
• Excluding the Permanent non-borrowers increased the proportion with a ‘strong relationship’ slightly (to 25% v 21% of PNBs), but there was little difference in terms of wanting a more active relationship (14% PNBs v 15% non-PNBs).
• Analysis by age of business showed that a quarter of Starts (25%) had a ‘strong relationship’ with their bank. This declined to 17% of those trading for 2-5 years, then increased steadily by age to 26% of those trading for 15 years or more. The proportion wanting a more active relationship varied little by age, from 16% for Starts to 14% for those trading for more than 15 years.
• Analysis by risk rating showed that the proportion describing the relationship as ‘strong’ declined from 32% of those with a minimal risk rating and 29% of those with a low risk rating to 21% of those with either an average or a worse than average risk rating.
• 28% of SMEs in Agriculture and 27% in the Hotel & Restaurant and Manufacturing sectors had a strong working relationship compared to 18% in the Other Community sector. There was relatively little variation by sector in the proportion wanting a more active relationship (14-16%) with the exception of 11% in Agriculture.
Analysis by previous borrowing behaviour showed that those who had reported a borrowing event (typically the larger SMEs) were more likely to have a ‘strong working relationship’ (31%) than those who had been Would-be seekers of finance (16%). The relatively small group of WBS remained more likely than the other groups to wish that they had a more active relationship with their bank (23%):
Nature of relationship with main bank
YEQ4 18 all SMEs Total Had an event WBS HNS
Unweighted base 18,002 3666 208 14,059
We have a strong working relationship with our bank and feel we can approach them whenever we need to
23% 31% 16% 22%
The relationship with our bank is fine but we really just use the bank for transactions so rarely need to approach them
63% 57% 61% 64%
We don’t have an active working relationship with our bank and wish that we had one
15% 12% 23% 15%
Q24a All SMEs
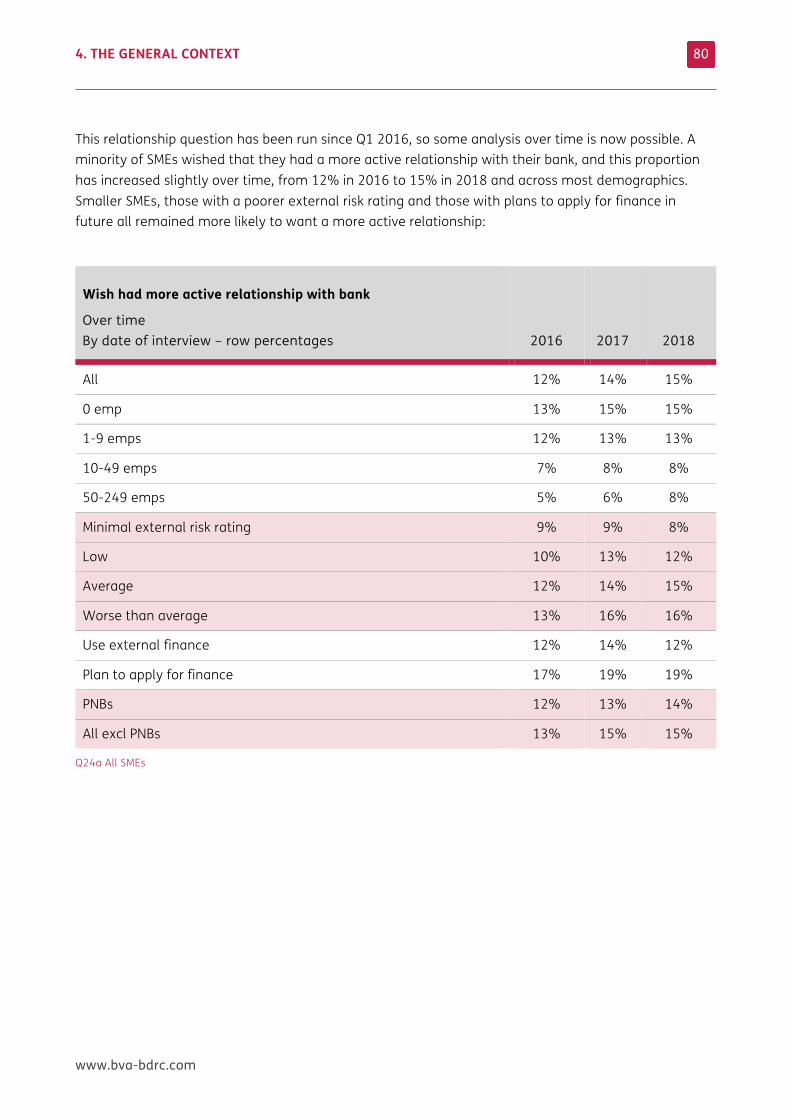
4. THE GENERAL CONTEXT
www.bva-bdrc.com
80
This relationship question has been run since Q1 2016, so some analysis over time is now possible. A minority of SMEs wished that they had a more active relationship with their bank, and this proportion has increased slightly over time, from 12% in 2016 to 15% in 2018 and across most demographics. Smaller SMEs, those with a poorer external risk rating and those with plans to apply for finance in future all remained more likely to want a more active relationship:
Wish had more active relationship with bank
Over time By date of interview – row percentages
2016 2017 2018
All 12% 14% 15%
0 emp 13% 15% 15%
1-9 emps 12% 13% 13%
10-49 emps 7% 8% 8%
50-249 emps 5% 6% 8%
Minimal external risk rating 9% 9% 8%
Low 10% 13% 12%
Average 12% 14% 15%
Worse than average 13% 16% 16%
Use external finance 12% 14% 12%
Plan to apply for finance 17% 19% 19%
PNBs 12% 13% 14%
All excl PNBs 13% 15% 15%
Q24a All SMEs
4. THE GENERAL CONTEXT
www.bva-bdrc.com
81
SWITCHING MAIN BANK From Q1 2018, further relationship questions were added.
The first asked whether the business had changed main bank in the past 3 years. In 2018:
• 2% said that they had made a change, with little variation by size (2% of those with 0 and 1-9 employees had changed bank, 3% for those with 10-49 employees and 4% for those with 50-249 employees).
• There was also little variation by risk rating (2-3%), or once the Permanent non-borrowers were excluded (3%), or by whether the SME was using finance (3%) or not (2%).
• Those trading for less than 10 years were the most likely to have changed bank in the last 3 years (3%), those trading for more than 15 years the least likely (1%). 4% of those in Wholesale/Retail, Health and the Other Community sectors had switched (1-2% for other sectors).
• Those who had changed bank had a similar relationship with their bank (25% a strong relationship) to those who had not made a change (23%), although they remained slightly more likely to wish they had a more active relationship (18% v 15% of those who hadn’t changed).
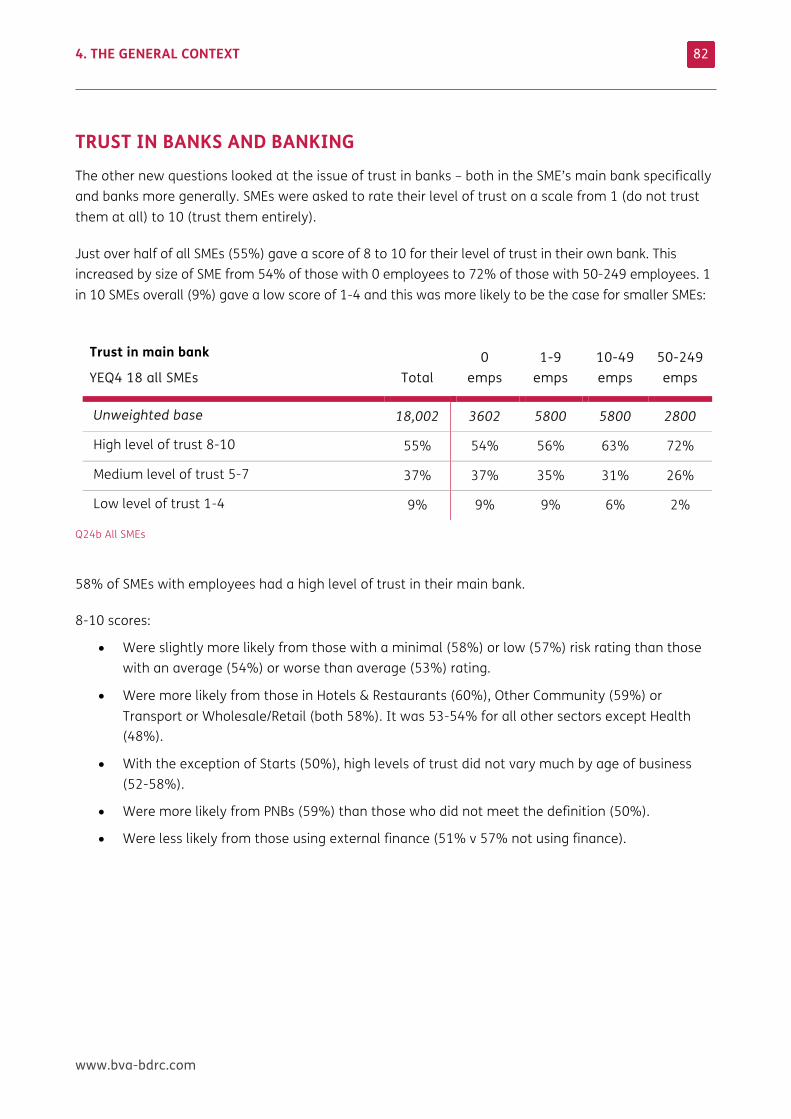
4. THE GENERAL CONTEXT
www.bva-bdrc.com
82
TRUST IN BANKS AND BANKING The other new questions looked at the issue of trust in banks – both in the SME’s main bank specifically and banks more generally. SMEs were asked to rate their level of trust on a scale from 1 (do not trust them at all) to 10 (trust them entirely).
Just over half of all SMEs (55%) gave a score of 8 to 10 for their level of trust in their own bank. This increased by size of SME from 54% of those with 0 employees to 72% of those with 50-249 employees. 1 in 10 SMEs overall (9%) gave a low score of 1-4 and this was more likely to be the case for smaller SMEs:
Trust in main bank
YEQ4 18 all SMEs Total 0
emps 1-9
emps 10-49 emps
50-249 emps
Unweighted base 18,002 3602 5800 5800 2800
High level of trust 8-10 55% 54% 56% 63% 72%
Medium level of trust 5-7 37% 37% 35% 31% 26%
Low level of trust 1-4 9% 9% 9% 6% 2%
Q24b All SMEs
58% of SMEs with employees had a high level of trust in their main bank.
8-10 scores:
• Were slightly more likely from those with a minimal (58%) or low (57%) risk rating than those with an average (54%) or worse than average (53%) rating.
• Were more likely from those in Hotels & Restaurants (60%), Other Community (59%) or Transport or Wholesale/Retail (both 58%). It was 53-54% for all other sectors except Health (48%).
• With the exception of Starts (50%), high levels of trust did not vary much by age of business (52-58%).
• Were more likely from PNBs (59%) than those who did not meet the definition (50%).
• Were less likely from those using external finance (51% v 57% not using finance).
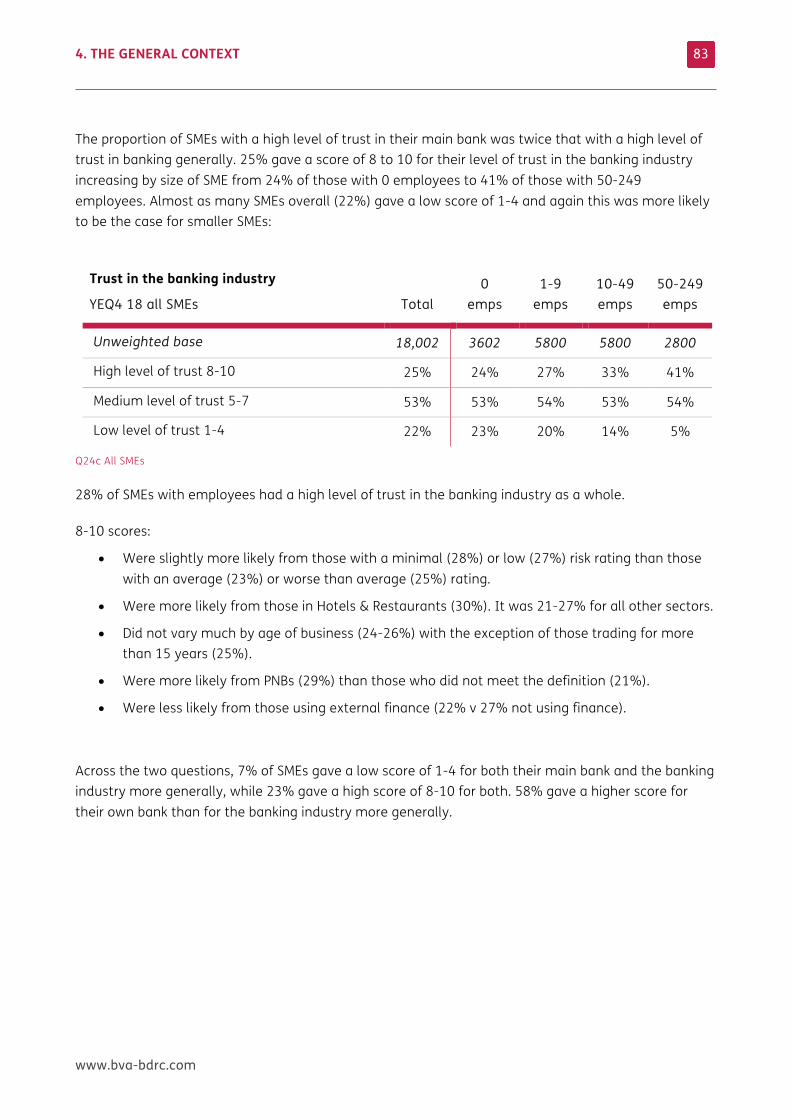
4. THE GENERAL CONTEXT
www.bva-bdrc.com
83
The proportion of SMEs with a high level of trust in their main bank was twice that with a high level of trust in banking generally. 25% gave a score of 8 to 10 for their level of trust in the banking industry increasing by size of SME from 24% of those with 0 employees to 41% of those with 50-249 employees. Almost as many SMEs overall (22%) gave a low score of 1-4 and again this was more likely to be the case for smaller SMEs:
Trust in the banking industry
YEQ4 18 all SMEs Total 0
emps 1-9
emps 10-49 emps
50-249 emps
Unweighted base 18,002 3602 5800 5800 2800
High level of trust 8-10 25% 24% 27% 33% 41%
Medium level of trust 5-7 53% 53% 54% 53% 54%
Low level of trust 1-4 22% 23% 20% 14% 5%
Q24c All SMEs
28% of SMEs with employees had a high level of trust in the banking industry as a whole.
8-10 scores:
• Were slightly more likely from those with a minimal (28%) or low (27%) risk rating than those with an average (23%) or worse than average (25%) rating.
• Were more likely from those in Hotels & Restaurants (30%). It was 21-27% for all other sectors.
• Did not vary much by age of business (24-26%) with the exception of those trading for more than 15 years (25%).
• Were more likely from PNBs (29%) than those who did not meet the definition (21%).
• Were less likely from those using external finance (22% v 27% not using finance).
Across the two questions, 7% of SMEs gave a low score of 1-4 for both their main bank and the banking industry more generally, while 23% gave a high score of 8-10 for both. 58% gave a higher score for their own bank than for the banking industry more generally.
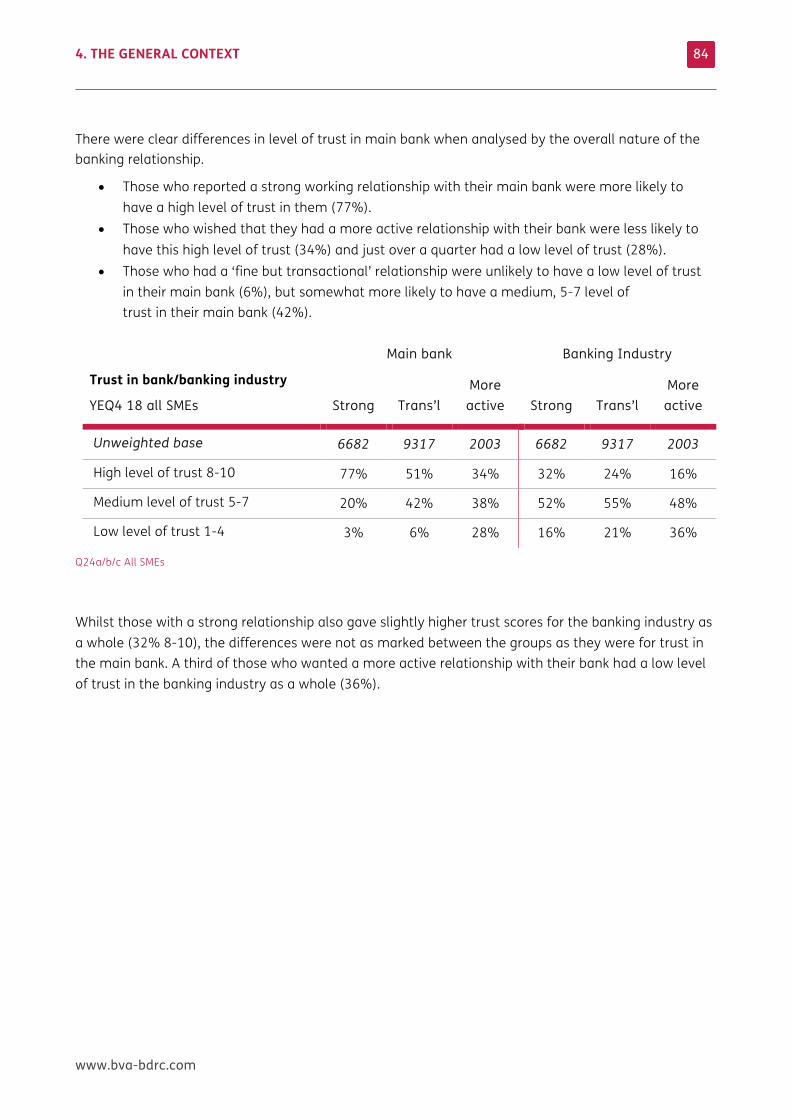
4. THE GENERAL CONTEXT
www.bva-bdrc.com
84
There were clear differences in level of trust in main bank when analysed by the overall nature of the banking relationship.
• Those who reported a strong working relationship with their main bank were more likely to have a high level of trust in them (77%).
• Those who wished that they had a more active relationship with their bank were less likely to have this high level of trust (34%) and just over a quarter had a low level of trust (28%).
• Those who had a ‘fine but transactional’ relationship were unlikely to have a low level of trust in their main bank (6%), but somewhat more likely to have a medium, 5-7 level of trust in their main bank (42%).
Main bank Banking Industry
Trust in bank/banking industry
YEQ4 18 all SMEs Strong Trans’l More
active Strong Trans’l More
active
Unweighted base 6682 9317 2003 6682 9317 2003
High level of trust 8-10 77% 51% 34% 32% 24% 16%
Medium level of trust 5-7 20% 42% 38% 52% 55% 48%
Low level of trust 1-4 3% 6% 28% 16% 21% 36%
Q24a/b/c All SMEs
Whilst those with a strong relationship also gave slightly higher trust scores for the banking industry as a whole (32% 8-10), the differences were not as marked between the groups as they were for trust in the main bank. A third of those who wanted a more active relationship with their bank had a low level of trust in the banking industry as a whole (36%).
www.bva-bdrc.com
5 FINANCIAL CONTEXT – HOW ARE SMES FUNDING THEMSELVES? (PART 1) THIS CHAPTER PROVIDES an overview of the types of external finance being used by SMEs, including the use of core and other forms of finance, crowd funding and the use of personal funds.
5. FINANCIAL CONTEXT – HOW ARE SMES FUNDING THEMSELVES? (PART1)
www.bva-bdrc.com
86
KEY FINDINGS External finance: 36% of SMEs were using external finance in 2018, almost unchanged from 2017 (38%) and increasing by size of SME from 34% of those with 0 employees to 77% of those with 50-249 employees
• During 2018, use of finance Q1 to Q3 was lower than previously seen (34-36%) but then higher in Q4 2018 (41%) due to increased use amongst smaller SMEs, and more use of core products (overdrafts and credit cards)
Forms of finance: 32% of all SMEs were using one or more forms of core finance (loans, overdrafts or credit cards). Back in 2012, 36% of SMEs were using core finance, declining to 29% in 2014 before increasing again slightly to the current 32%
• Use of core finance amongst the largest SMEs has increased over recent years from 53% in 2015 to 70% in 2018 and amongst the smallest SMEs from 25% to 29% over the same time frame. For those with 1-9 or 10-49 employees the proportion has declined steadily over time, to 36% and 46% respectively in 2018
• 19% of SMEs were using a bank overdraft (up from 16% 2014-2016), 9% a bank loan/commercial mortgage (up slightly from 7% 2014-2016) and 14% a credit card (down slightly from 16-17% in recent years)
• 25% of all SMEs were only using core finance and amongst SMEs using only one form of external finance, 81% were using a core product
• Use of other forms of finance remained lower than previously seen (12% in 2018 compared to 16-18% previously)
5. FINANCIAL CONTEXT – HOW ARE SMES FUNDING THEMSELVES? (PART1)
www.bva-bdrc.com
87
Injections of personal funds: 29% of SMEs reported an injection of personal funds into the business (16% as a choice to help the business grow and 13% where they felt they had to do it) and this has been stable over recent years
• Personal injections remained much more common amongst smaller SMEs (29% with 0 employees and 27% with 1-9 employees) than larger ones (13% with 10-49 employees and 6% with 50-249 employees) and also amongst younger SMEs
Personal finances: 14% of SMEs used a personal bank account for their business banking, slightly lower than previously seen. 94% of those with a personal bank account were 0 employee SMEs
• 19% of those using any form of finance said some /all of it was in a personal name (the equivalent of 7% of all SMEs). This was much more likely to be the case for smaller SMEs (23% of 0 employee SMEs using finance) than those with employees (1% of those with 50-249 employees)
• Around 1 in 10 loans and overdrafts were in a personal name, with the vast majority being for 0 employee SMEs
5. FINANCIAL CONTEXT – HOW ARE SMES FUNDING THEMSELVES? (PART1)
www.bva-bdrc.com
88
FINANCIAL CONTEXT This is the first of what are now two chapters on external finance, in its many forms. This chapter reflects the changes made to the questionnaire from Q1 2018 with an extended list of the types of finance that SMEs could say they were using.
This first chapter covers current use of external finance as well as the role of personal finance (whether as a borrowing facility or an injection of personal funds), The second financial context chapter covers some of the wider context, including the Permanent non-Borrowers, use of trade credit and attitudes to finance.
USE OF EXTERNAL FINANCE – AN OVERVIEW SMEs were asked some initial questions about their use of external finance:
• Which of a specified list of sources they were currently using.
• If they were not using finance currently whether they had used any form of external finance in the past 5 years.
From Q1 2018, in addition to the forms of finance that have been recorded since the start of the SME Finance Monitor, SMEs were also asked whether they were using any of the following forms of finance:
• Finance through crowd funding or peer to peer lending
• Asset based lending
• Selective or single invoice finance
• Any other loan
• Any other overdraft facility.
Use of these other forms of finance is reported below but was limited. Overall 2% of SMEs reported using any of these new forms of finance, with little variation by size with the exception of the largest SMEs, where 15% of those with 50-249 employees were using one or more (with 10% making use of ‘other loans’ and 4% ‘Asset based lending’).
The new definition of use of external finance, including these additional codes, has been used in all analysis from Q1 2018 onwards, unless otherwise stated.
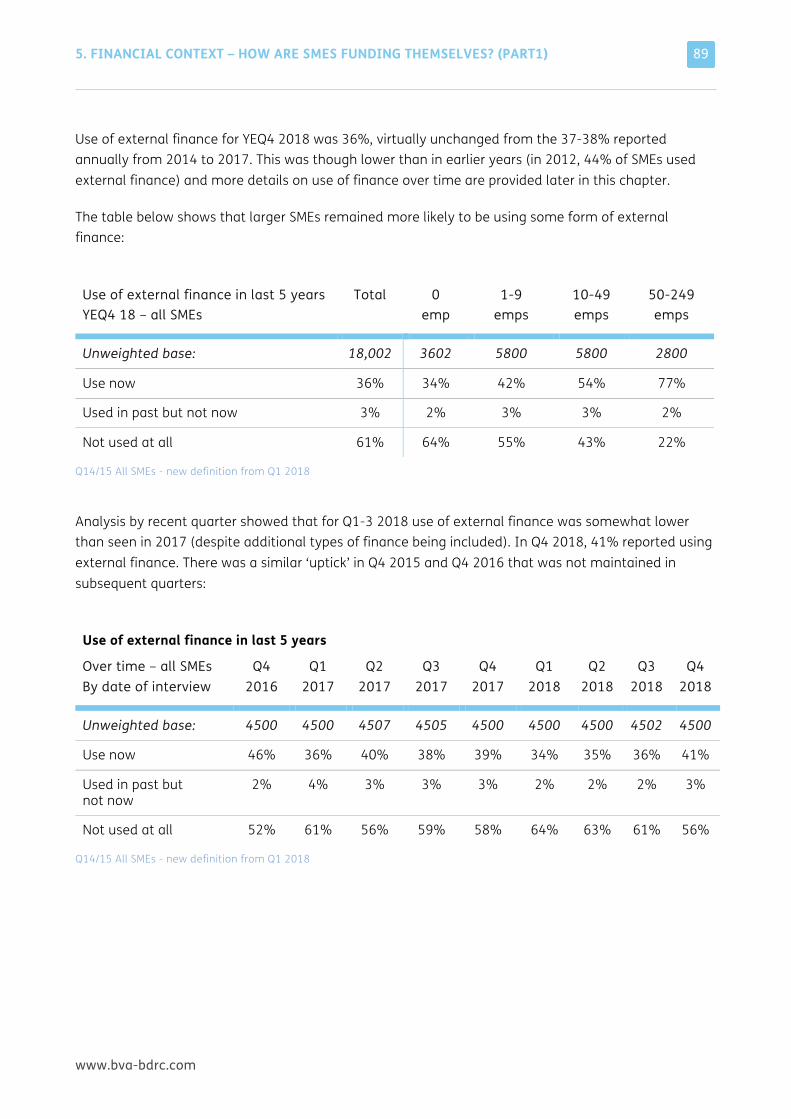
5. FINANCIAL CONTEXT – HOW ARE SMES FUNDING THEMSELVES? (PART1)
www.bva-bdrc.com
89
Use of external finance for YEQ4 2018 was 36%, virtually unchanged from the 37-38% reported annually from 2014 to 2017. This was though lower than in earlier years (in 2012, 44% of SMEs used external finance) and more details on use of finance over time are provided later in this chapter.
The table below shows that larger SMEs remained more likely to be using some form of external finance:
Use of external finance in last 5 years YEQ4 18 – all SMEs
Total
0 emp
1-9 emps
10-49 emps
50-249 emps
Unweighted base: 18,002 3602 5800 5800 2800
Use now 36% 34% 42% 54% 77%
Used in past but not now 3% 2% 3% 3% 2%
Not used at all 61% 64% 55% 43% 22%
Q14/15 All SMEs - new definition from Q1 2018
Analysis by recent quarter showed that for Q1-3 2018 use of external finance was somewhat lower than seen in 2017 (despite additional types of finance being included). In Q4 2018, 41% reported using external finance. There was a similar ‘uptick’ in Q4 2015 and Q4 2016 that was not maintained in subsequent quarters:
Use of external finance in last 5 years
Over time – all SMEs By date of interview
Q4 2016
Q1 2017
Q2 2017
Q3 2017
Q4 2017
Q1 2018
Q2 2018
Q3 2018
Q4 2018
Unweighted base: 4500 4500 4507 4505 4500 4500 4500 4502 4500
Use now 46% 36% 40% 38% 39% 34% 35% 36% 41%
Used in past but not now
2% 4% 3% 3% 3% 2% 2% 2% 3%
Not used at all 52% 61% 56% 59% 58% 64% 63% 61% 56%
Q14/15 All SMEs - new definition from Q1 2018
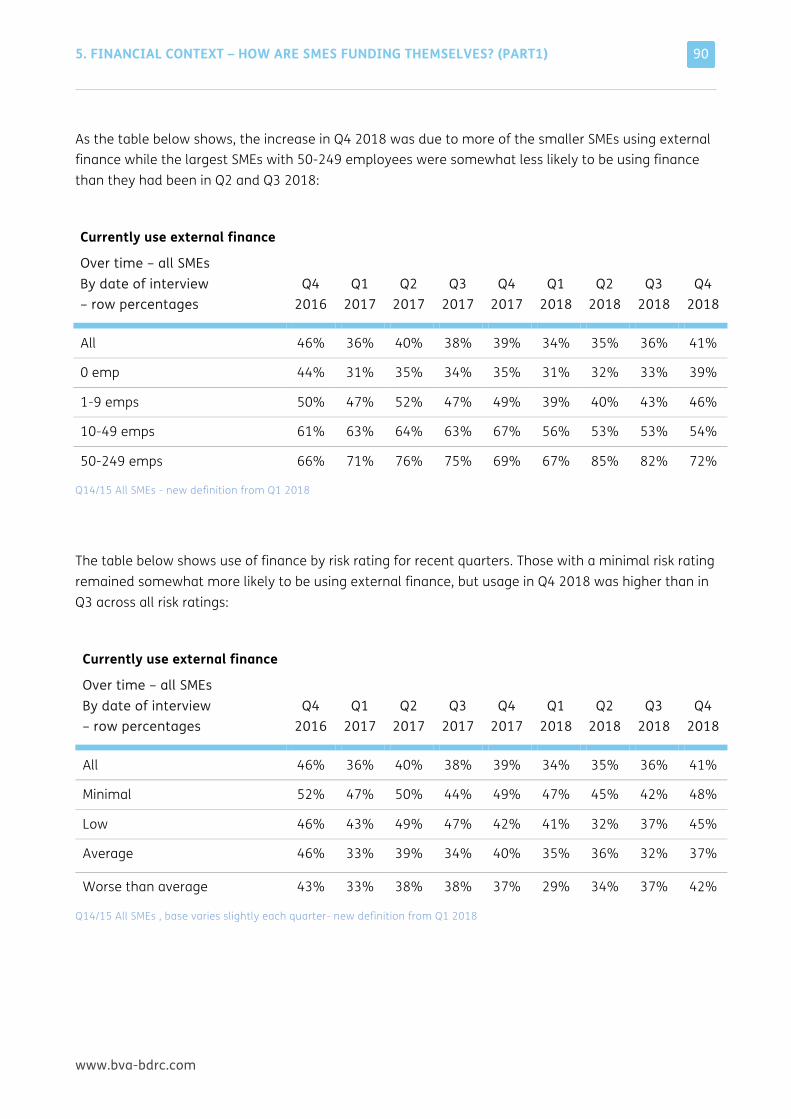
5. FINANCIAL CONTEXT – HOW ARE SMES FUNDING THEMSELVES? (PART1)
www.bva-bdrc.com
90
As the table below shows, the increase in Q4 2018 was due to more of the smaller SMEs using external finance while the largest SMEs with 50-249 employees were somewhat less likely to be using finance than they had been in Q2 and Q3 2018:
Currently use external finance
Over time – all SMEs By date of interview – row percentages
Q4 2016
Q1 2017
Q2 2017
Q3 2017
Q4 2017
Q1 2018
Q2 2018
Q3 2018
Q4 2018
All 46% 36% 40% 38% 39% 34% 35% 36% 41%
0 emp 44% 31% 35% 34% 35% 31% 32% 33% 39%
1-9 emps 50% 47% 52% 47% 49% 39% 40% 43% 46%
10-49 emps 61% 63% 64% 63% 67% 56% 53% 53% 54%
50-249 emps 66% 71% 76% 75% 69% 67% 85% 82% 72%
Q14/15 All SMEs - new definition from Q1 2018
The table below shows use of finance by risk rating for recent quarters. Those with a minimal risk rating remained somewhat more likely to be using external finance, but usage in Q4 2018 was higher than in Q3 across all risk ratings:
Currently use external finance
Over time – all SMEs By date of interview – row percentages
Q4 2016
Q1 2017
Q2 2017
Q3 2017
Q4 2017
Q1 2018
Q2 2018
Q3 2018
Q4 2018
All 46% 36% 40% 38% 39% 34% 35% 36% 41%
Minimal 52% 47% 50% 44% 49% 47% 45% 42% 48%
Low 46% 43% 49% 47% 42% 41% 32% 37% 45%
Average 46% 33% 39% 34% 40% 35% 36% 32% 37%
Worse than average 43% 33% 38% 38% 37% 29% 34% 37% 42%
Q14/15 All SMEs , base varies slightly each quarter- new definition from Q1 2018
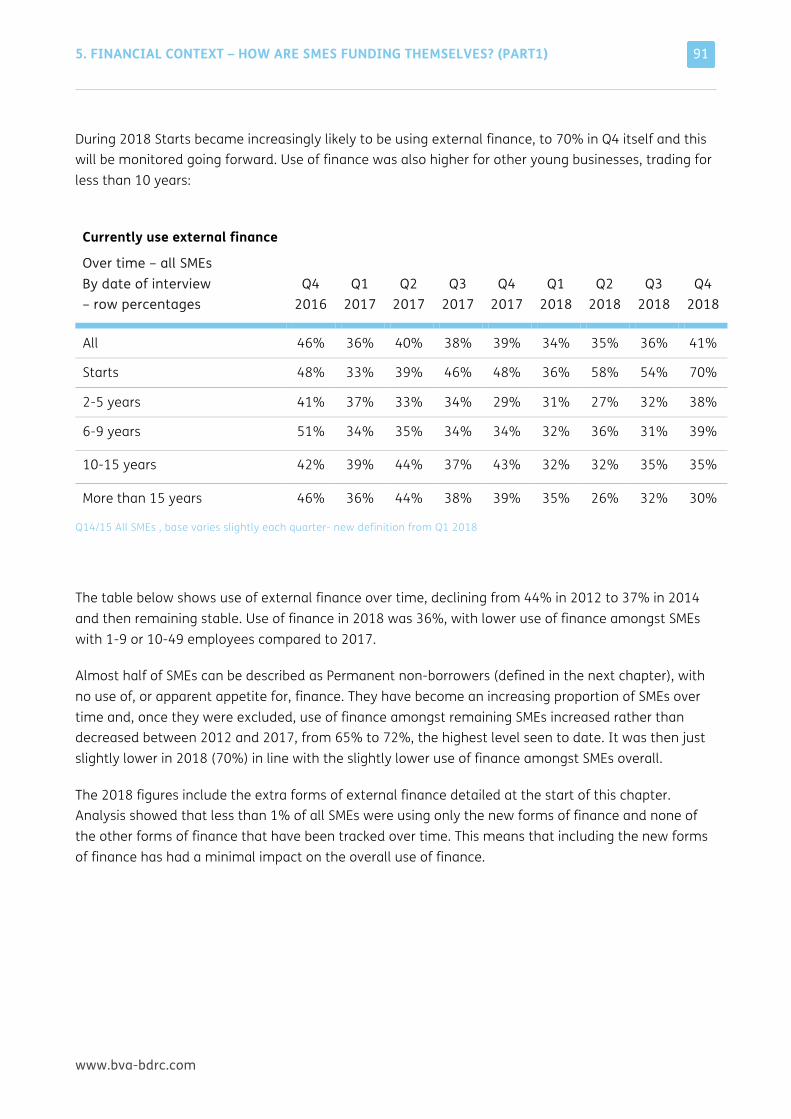
5. FINANCIAL CONTEXT – HOW ARE SMES FUNDING THEMSELVES? (PART1)
www.bva-bdrc.com
91
During 2018 Starts became increasingly likely to be using external finance, to 70% in Q4 itself and this will be monitored going forward. Use of finance was also higher for other young businesses, trading for less than 10 years:
Currently use external finance
Over time – all SMEs By date of interview – row percentages
Q4 2016
Q1 2017
Q2 2017
Q3 2017
Q4 2017
Q1 2018
Q2 2018
Q3 2018
Q4 2018
All 46% 36% 40% 38% 39% 34% 35% 36% 41%
Starts 48% 33% 39% 46% 48% 36% 58% 54% 70%
2-5 years 41% 37% 33% 34% 29% 31% 27% 32% 38%
6-9 years 51% 34% 35% 34% 34% 32% 36% 31% 39%
10-15 years 42% 39% 44% 37% 43% 32% 32% 35% 35%
More than 15 years 46% 36% 44% 38% 39% 35% 26% 32% 30%
Q14/15 All SMEs , base varies slightly each quarter- new definition from Q1 2018
The table below shows use of external finance over time, declining from 44% in 2012 to 37% in 2014 and then remaining stable. Use of finance in 2018 was 36%, with lower use of finance amongst SMEs with 1-9 or 10-49 employees compared to 2017.
Almost half of SMEs can be described as Permanent non-borrowers (defined in the next chapter), with no use of, or apparent appetite for, finance. They have become an increasing proportion of SMEs over time and, once they were excluded, use of finance amongst remaining SMEs increased rather than decreased between 2012 and 2017, from 65% to 72%, the highest level seen to date. It was then just slightly lower in 2018 (70%) in line with the slightly lower use of finance amongst SMEs overall.
The 2018 figures include the extra forms of external finance detailed at the start of this chapter. Analysis showed that less than 1% of all SMEs were using only the new forms of finance and none of the other forms of finance that have been tracked over time. This means that including the new forms of finance has had a minimal impact on the overall use of finance.
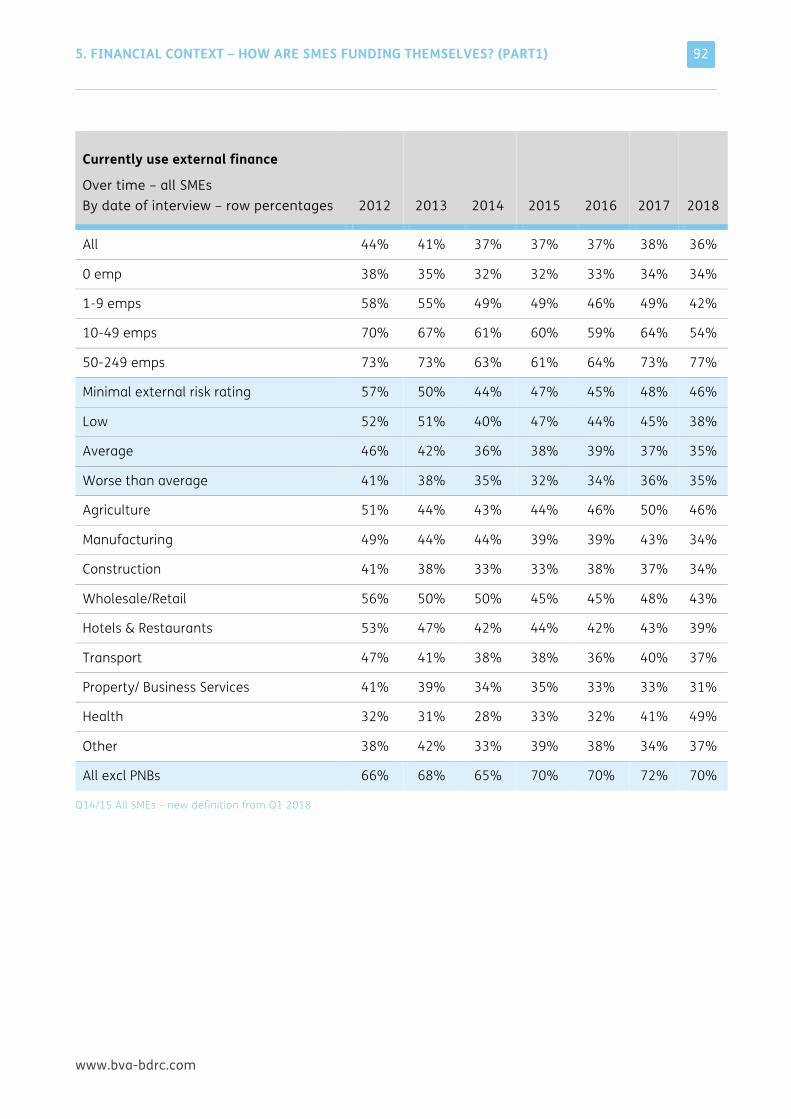
5. FINANCIAL CONTEXT – HOW ARE SMES FUNDING THEMSELVES? (PART1)
www.bva-bdrc.com
92
Currently use external finance
Over time – all SMEs By date of interview – row percentages 2012 2013 2014 2015
2016 2017 2018
All 44% 41% 37% 37% 37% 38% 36%
0 emp 38% 35% 32% 32% 33% 34% 34%
1-9 emps 58% 55% 49% 49% 46% 49% 42%
10-49 emps 70% 67% 61% 60% 59% 64% 54%
50-249 emps 73% 73% 63% 61% 64% 73% 77%
Minimal external risk rating 57% 50% 44% 47% 45% 48% 46%
Low 52% 51% 40% 47% 44% 45% 38%
Average 46% 42% 36% 38% 39% 37% 35%
Worse than average 41% 38% 35% 32% 34% 36% 35%
Agriculture 51% 44% 43% 44% 46% 50% 46%
Manufacturing 49% 44% 44% 39% 39% 43% 34%
Construction 41% 38% 33% 33% 38% 37% 34%
Wholesale/Retail 56% 50% 50% 45% 45% 48% 43%
Hotels & Restaurants 53% 47% 42% 44% 42% 43% 39%
Transport 47% 41% 38% 38% 36% 40% 37%
Property/ Business Services 41% 39% 34% 35% 33% 33% 31%
Health 32% 31% 28% 33% 32% 41% 49%
Other 38% 42% 33% 39% 38% 34% 37%
All excl PNBs 66% 68% 65% 70% 70% 72% 70%
Q14/15 All SMEs – new definition from Q1 2018
5. FINANCIAL CONTEXT – HOW ARE SMES FUNDING THEMSELVES? (PART1)
www.bva-bdrc.com
93
SUMMARY USE OF CORE AND OTHER FORMS OF FINANCE The overall use of finance figures already reported include use of the ‘core’ forms of finance often provided by banks (overdrafts, loans and/or credit cards) and a range of ‘other’ forms of finance available to SMEs.
Detailed breakdowns by type of product are provided later in this chapter.
The changes to the forms of finance recorded from Q1 2018 still allow the previous ‘core’ net figures to be calculated and the new codes for use of ‘other’ loans and overdrafts can then be added to make the ‘new core definition’ shown below. The changes have had little impact on the net use of core finance products (from 35% to 36% in Q4 2018).
The longer term view provided in the table below shows how use of any of these forms of core finance declined from 36% in 2012 to 29% in 2014 and has since increased very slightly (32% for 2018).
Within the relatively stable position overall however, use of core finance amongst those with 50-249 employees has increased to 70% in 2018, while use of core finance amongst those with 0 employees declined from 31% in 2012 to 25% in 2014 and 2015 but has since increased again to 29% in 2018. Those with 1-9 or 10-49 employees have seen a steadier decline in the use of core finance over time (48% in 2012 to 36% in 2018 for those with 1-9 employees and 62% to 46% for those with 10-49 employees).
As with use of finance overall, these trends have been affected by the increase in Permanent non-borrowers. Once they were excluded, use of core finance increased from 51% in 2014 to 61% in 2018:
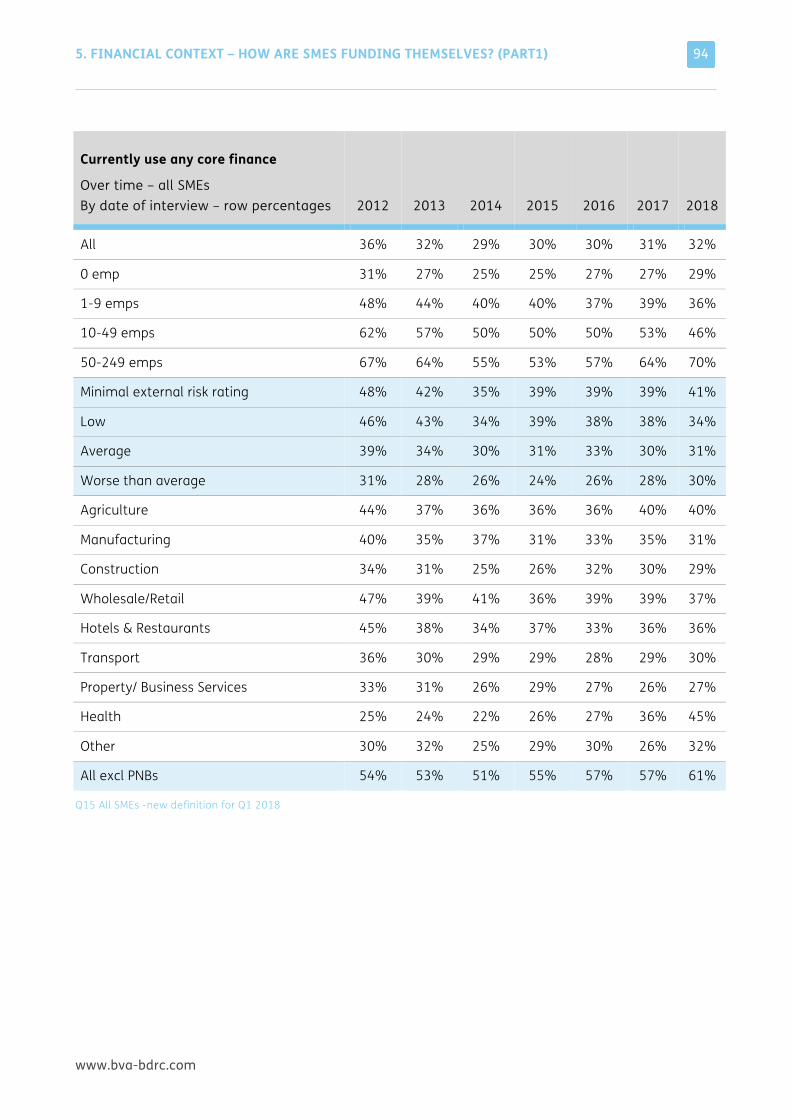
5. FINANCIAL CONTEXT – HOW ARE SMES FUNDING THEMSELVES? (PART1)
www.bva-bdrc.com
94
Currently use any core finance
Over time – all SMEs By date of interview – row percentages 2012 2013 2014 2015 2016 2017 2018
All 36% 32% 29% 30% 30% 31% 32%
0 emp 31% 27% 25% 25% 27% 27% 29%
1-9 emps 48% 44% 40% 40% 37% 39% 36%
10-49 emps 62% 57% 50% 50% 50% 53% 46%
50-249 emps 67% 64% 55% 53% 57% 64% 70%
Minimal external risk rating 48% 42% 35% 39% 39% 39% 41%
Low 46% 43% 34% 39% 38% 38% 34%
Average 39% 34% 30% 31% 33% 30% 31%
Worse than average 31% 28% 26% 24% 26% 28% 30%
Agriculture 44% 37% 36% 36% 36% 40% 40%
Manufacturing 40% 35% 37% 31% 33% 35% 31%
Construction 34% 31% 25% 26% 32% 30% 29%
Wholesale/Retail 47% 39% 41% 36% 39% 39% 37%
Hotels & Restaurants 45% 38% 34% 37% 33% 36% 36%
Transport 36% 30% 29% 29% 28% 29% 30%
Property/ Business Services 33% 31% 26% 29% 27% 26% 27%
Health 25% 24% 22% 26% 27% 36% 45%
Other 30% 32% 25% 29% 30% 26% 32%
All excl PNBs 54% 53% 51% 55% 57% 57% 61%
Q15 All SMEs -new definition for Q1 2018
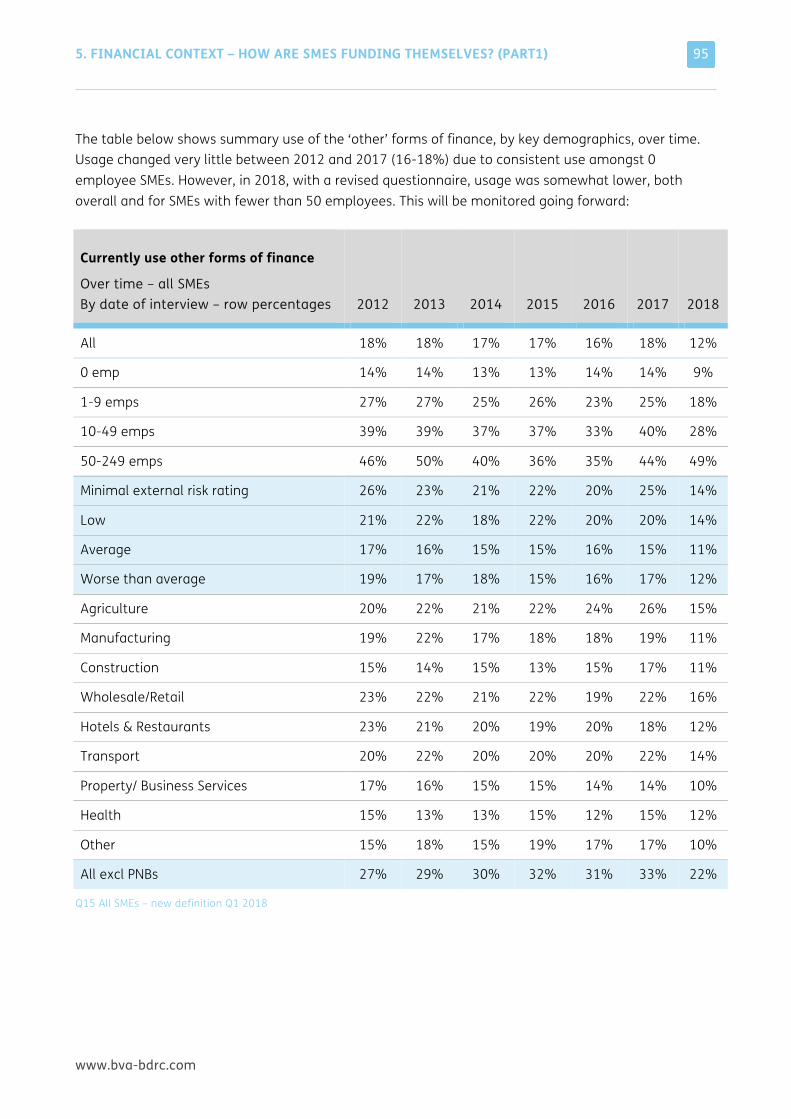
5. FINANCIAL CONTEXT – HOW ARE SMES FUNDING THEMSELVES? (PART1)
www.bva-bdrc.com
95
The table below shows summary use of the ‘other’ forms of finance, by key demographics, over time. Usage changed very little between 2012 and 2017 (16-18%) due to consistent use amongst 0 employee SMEs. However, in 2018, with a revised questionnaire, usage was somewhat lower, both overall and for SMEs with fewer than 50 employees. This will be monitored going forward:
Currently use other forms of finance
Over time – all SMEs By date of interview – row percentages 2012 2013 2014 2015 2016 2017 2018
All 18% 18% 17% 17% 16% 18% 12%
0 emp 14% 14% 13% 13% 14% 14% 9%
1-9 emps 27% 27% 25% 26% 23% 25% 18%
10-49 emps 39% 39% 37% 37% 33% 40% 28%
50-249 emps 46% 50% 40% 36% 35% 44% 49%
Minimal external risk rating 26% 23% 21% 22% 20% 25% 14%
Low 21% 22% 18% 22% 20% 20% 14%
Average 17% 16% 15% 15% 16% 15% 11%
Worse than average 19% 17% 18% 15% 16% 17% 12%
Agriculture 20% 22% 21% 22% 24% 26% 15%
Manufacturing 19% 22% 17% 18% 18% 19% 11%
Construction 15% 14% 15% 13% 15% 17% 11%
Wholesale/Retail 23% 22% 21% 22% 19% 22% 16%
Hotels & Restaurants 23% 21% 20% 19% 20% 18% 12%
Transport 20% 22% 20% 20% 20% 22% 14%
Property/ Business Services 17% 16% 15% 15% 14% 14% 10%
Health 15% 13% 13% 15% 12% 15% 12%
Other 15% 18% 15% 19% 17% 17% 10%
All excl PNBs 27% 29% 30% 32% 31% 33% 22%
Q15 All SMEs – new definition Q1 2018
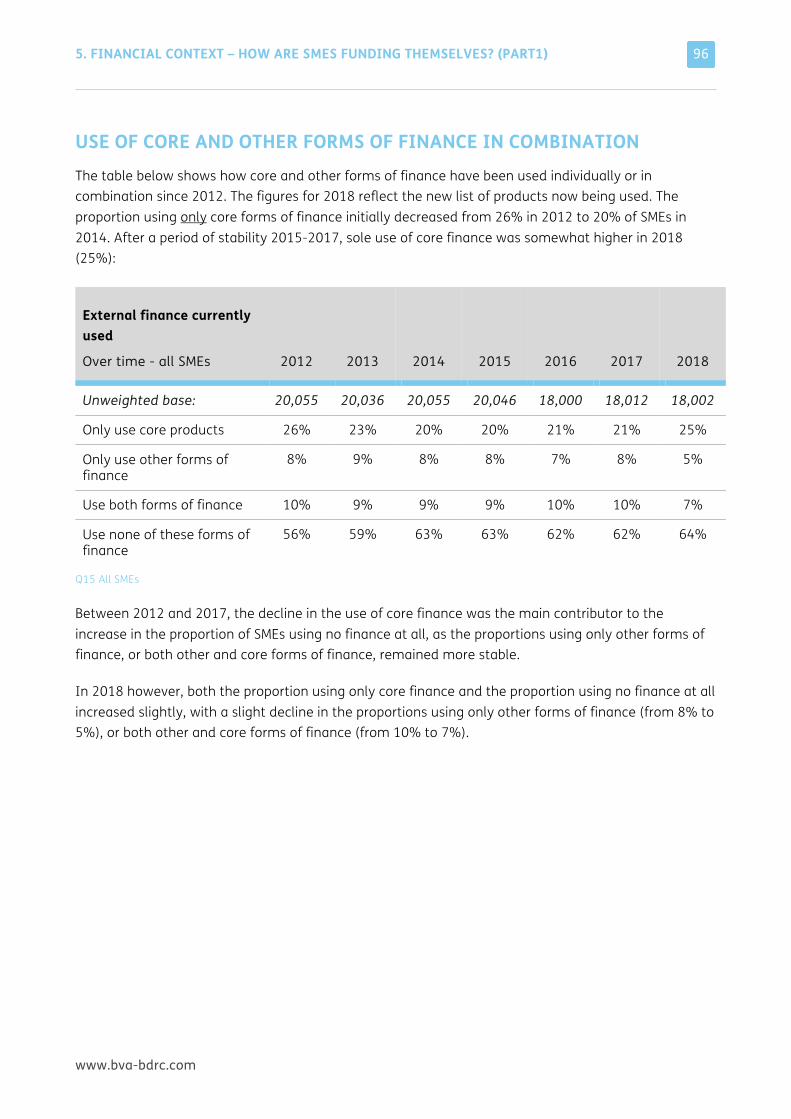
5. FINANCIAL CONTEXT – HOW ARE SMES FUNDING THEMSELVES? (PART1)
www.bva-bdrc.com
96
USE OF CORE AND OTHER FORMS OF FINANCE IN COMBINATION The table below shows how core and other forms of finance have been used individually or in combination since 2012. The figures for 2018 reflect the new list of products now being used. The proportion using only core forms of finance initially decreased from 26% in 2012 to 20% of SMEs in 2014. After a period of stability 2015-2017, sole use of core finance was somewhat higher in 2018 (25%):
External finance currently used
Over time - all SMEs 2012 2013 2014 2015 2016 2017 2018
Unweighted base: 20,055 20,036 20,055 20,046 18,000 18,012 18,002
Only use core products 26% 23% 20% 20% 21% 21% 25%
Only use other forms of finance
8% 9% 8% 8% 7% 8% 5%
Use both forms of finance 10% 9% 9% 9% 10% 10% 7%
Use none of these forms of finance
56% 59% 63% 63% 62% 62% 64%
Q15 All SMEs
Between 2012 and 2017, the decline in the use of core finance was the main contributor to the increase in the proportion of SMEs using no finance at all, as the proportions using only other forms of finance, or both other and core forms of finance, remained more stable.
In 2018 however, both the proportion using only core finance and the proportion using no finance at all increased slightly, with a slight decline in the proportions using only other forms of finance (from 8% to 5%), or both other and core forms of finance (from 10% to 7%).
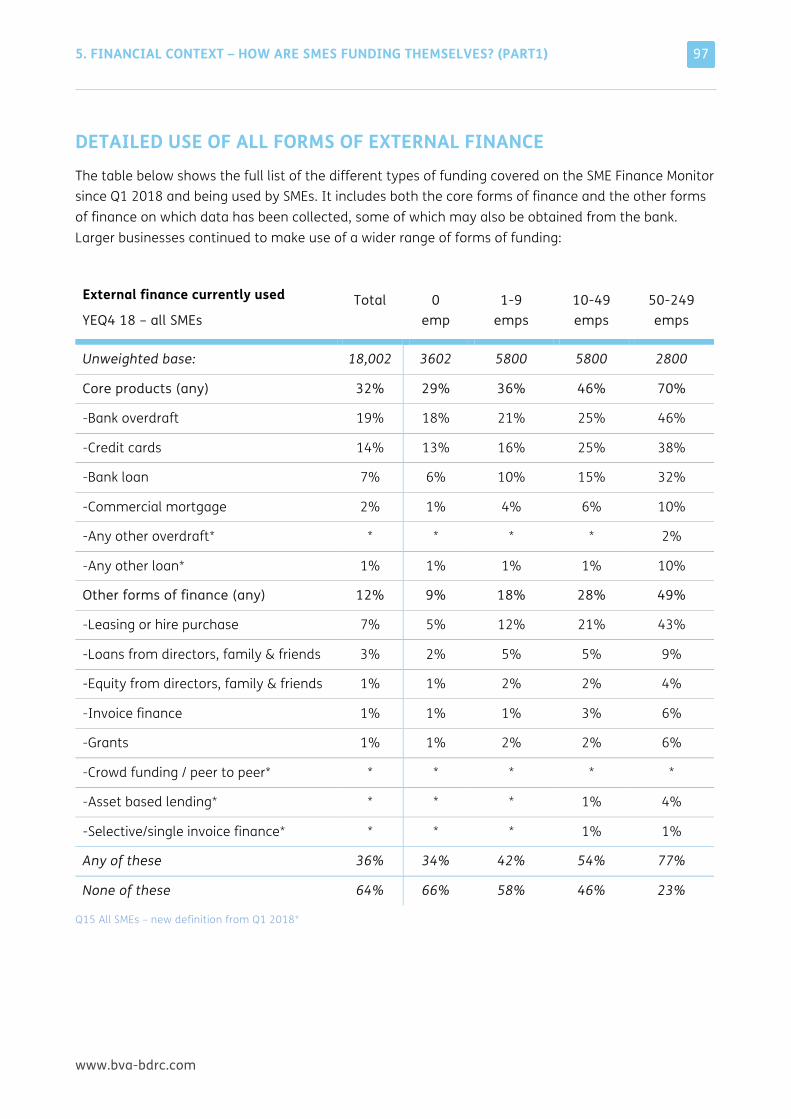
5. FINANCIAL CONTEXT – HOW ARE SMES FUNDING THEMSELVES? (PART1)
www.bva-bdrc.com
97
DETAILED USE OF ALL FORMS OF EXTERNAL FINANCE The table below shows the full list of the different types of funding covered on the SME Finance Monitor since Q1 2018 and being used by SMEs. It includes both the core forms of finance and the other forms of finance on which data has been collected, some of which may also be obtained from the bank. Larger businesses continued to make use of a wider range of forms of funding:
External finance currently used
YEQ4 18 – all SMEs Total
0
emp 1-9
emps 10-49 emps
50-249 emps
Unweighted base: 18,002 3602 5800 5800 2800
Core products (any) 32% 29% 36% 46% 70%
-Bank overdraft 19% 18% 21% 25% 46%
-Credit cards 14% 13% 16% 25% 38%
-Bank loan 7% 6% 10% 15% 32%
-Commercial mortgage 2% 1% 4% 6% 10%
-Any other overdraft* * * * * 2%
-Any other loan* 1% 1% 1% 1% 10%
Other forms of finance (any) 12% 9% 18% 28% 49%
-Leasing or hire purchase 7% 5% 12% 21% 43%
-Loans from directors, family & friends 3% 2% 5% 5% 9%
-Equity from directors, family & friends 1% 1% 2% 2% 4%
-Invoice finance 1% 1% 1% 3% 6%
-Grants 1% 1% 2% 2% 6%
-Crowd funding / peer to peer* * * * * *
-Asset based lending* * * * 1% 4%
-Selective/single invoice finance* * * * 1% 1%
Any of these 36% 34% 42% 54% 77%
None of these 64% 66% 58% 46% 23%
Q15 All SMEs – new definition from Q1 2018*
5. FINANCIAL CONTEXT – HOW ARE SMES FUNDING THEMSELVES? (PART1)
www.bva-bdrc.com
98
Amongst SMEs with employees, 45% were using external finance – 39% were using any form of core finance and 21% any of the other forms of finance listed.
SMEs that import and/or export were asked about use of Export/Import finance. YEQ4 2018, 1% of such SMEs used these products, with limited variation by size of business (1-3%).
SMEs that are companies were also asked about use of equity from other third parties such as Business Angels. 1% were using such finance, with little variation by size, age or risk rating, or over time.
The table below details the use of all of these forms of funding over recent quarters. Since the new definitions were introduced in Q1 2018, use of ‘other’ forms of finance has been fairly stable but at somewhat lower levels than previously seen. Use of ‘core forms of finance was stable until Q4 when 36% reported using such finance, with higher use of overdrafts and credit cards.
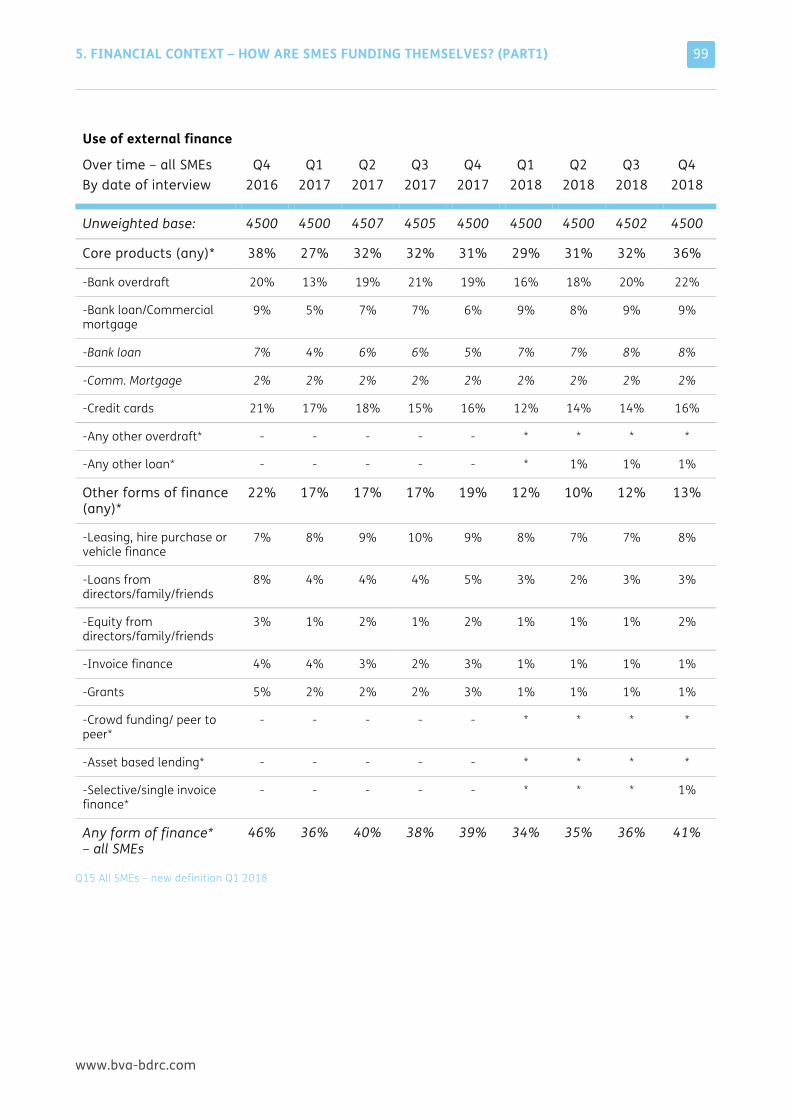
5. FINANCIAL CONTEXT – HOW ARE SMES FUNDING THEMSELVES? (PART1)
www.bva-bdrc.com
99
Use of external finance
Over time – all SMEs By date of interview
Q4 2016
Q1 2017
Q2 2017
Q3 2017
Q4 2017
Q1 2018
Q2 2018
Q3 2018
Q4 2018
Unweighted base: 4500 4500 4507 4505 4500 4500 4500 4502 4500
Core products (any)* 38% 27% 32% 32% 31% 29% 31% 32% 36%
-Bank overdraft 20% 13% 19% 21% 19% 16% 18% 20% 22%
-Bank loan/Commercial mortgage
9% 5% 7% 7% 6% 9% 8% 9% 9%
-Bank loan 7% 4% 6% 6% 5% 7% 7% 8% 8%
-Comm. Mortgage 2% 2% 2% 2% 2% 2% 2% 2% 2%
-Credit cards 21% 17% 18% 15% 16% 12% 14% 14% 16%
-Any other overdraft* - - - - - * * * *
-Any other loan* - - - - - * 1% 1% 1%
Other forms of finance (any)*
22% 17% 17% 17% 19% 12% 10% 12% 13%
-Leasing, hire purchase or vehicle finance
7% 8% 9% 10% 9% 8% 7% 7% 8%
-Loans from directors/family/friends
8% 4% 4% 4% 5% 3% 2% 3% 3%
-Equity from directors/family/friends
3% 1% 2% 1% 2% 1% 1% 1% 2%
-Invoice finance 4% 4% 3% 2% 3% 1% 1% 1% 1%
-Grants 5% 2% 2% 2% 3% 1% 1% 1% 1%
-Crowd funding/ peer to peer*
- - - - - * * * *
-Asset based lending* - - - - - * * * *
-Selective/single invoice finance*
- - - - - * * * 1%
Any form of finance* – all SMEs
46% 36% 40% 38% 39% 34% 35% 36% 41%
Q15 All SMEs – new definition Q1 2018
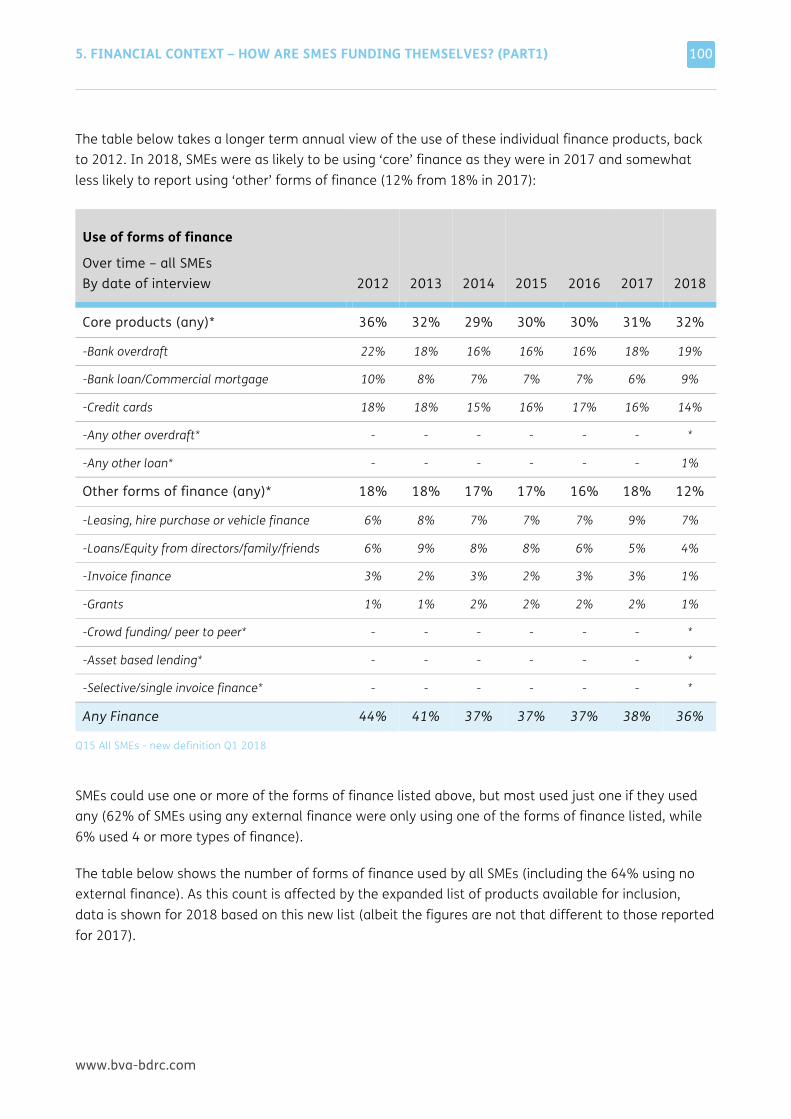
5. FINANCIAL CONTEXT – HOW ARE SMES FUNDING THEMSELVES? (PART1)
www.bva-bdrc.com
100
The table below takes a longer term annual view of the use of these individual finance products, back to 2012. In 2018, SMEs were as likely to be using ‘core’ finance as they were in 2017 and somewhat less likely to report using ‘other’ forms of finance (12% from 18% in 2017):
Use of forms of finance
Over time – all SMEs By date of interview 2012 2013 2014 2015
2016 2017 2018
Core products (any)* 36% 32% 29% 30% 30% 31% 32%
-Bank overdraft 22% 18% 16% 16% 16% 18% 19%
-Bank loan/Commercial mortgage 10% 8% 7% 7% 7% 6% 9%
-Credit cards 18% 18% 15% 16% 17% 16% 14%
-Any other overdraft* - - - - - - *
-Any other loan* - - - - - - 1%
Other forms of finance (any)* 18% 18% 17% 17% 16% 18% 12%
-Leasing, hire purchase or vehicle finance 6% 8% 7% 7% 7% 9% 7%
-Loans/Equity from directors/family/friends 6% 9% 8% 8% 6% 5% 4%
-Invoice finance 3% 2% 3% 2% 3% 3% 1%
-Grants 1% 1% 2% 2% 2% 2% 1%
-Crowd funding/ peer to peer* - - - - - - *
-Asset based lending* - - - - - - *
-Selective/single invoice finance* - - - - - - *
Any Finance 44% 41% 37% 37% 37% 38% 36%
Q15 All SMEs - new definition Q1 2018
SMEs could use one or more of the forms of finance listed above, but most used just one if they used any (62% of SMEs using any external finance were only using one of the forms of finance listed, while 6% used 4 or more types of finance).
The table below shows the number of forms of finance used by all SMEs (including the 64% using no external finance). As this count is affected by the expanded list of products available for inclusion, data is shown for 2018 based on this new list (albeit the figures are not that different to those reported for 2017).
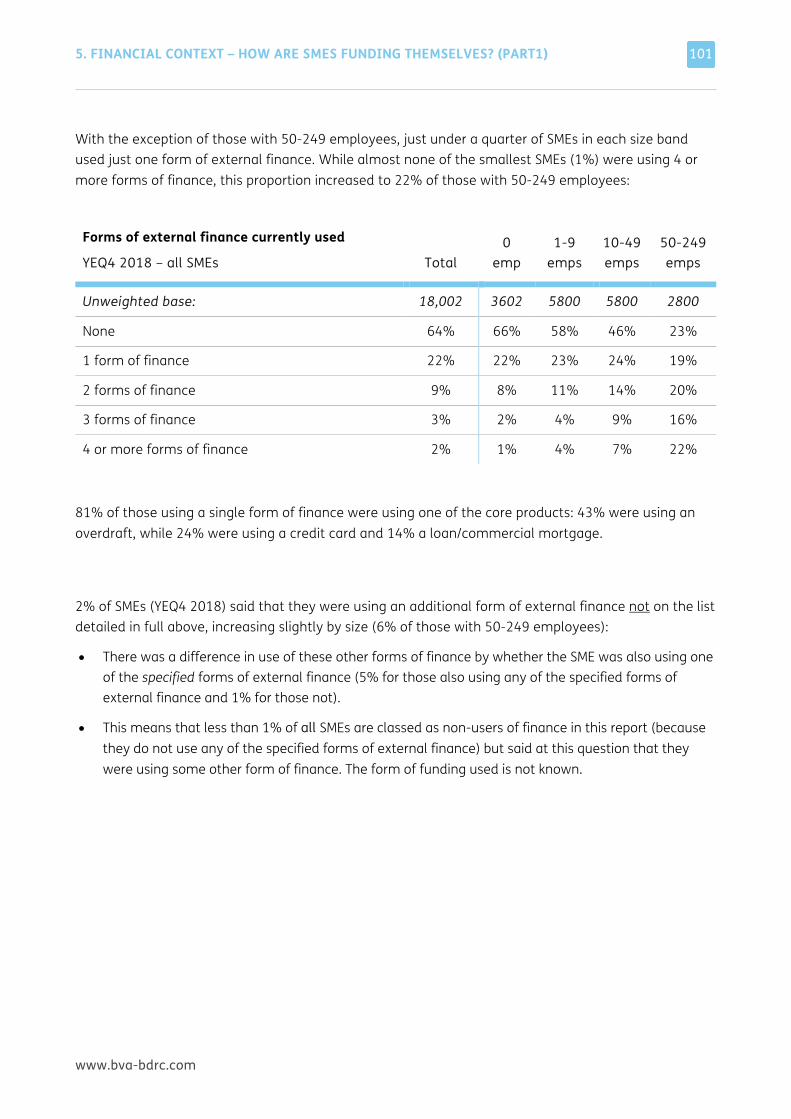
5. FINANCIAL CONTEXT – HOW ARE SMES FUNDING THEMSELVES? (PART1)
www.bva-bdrc.com
101
With the exception of those with 50-249 employees, just under a quarter of SMEs in each size band used just one form of external finance. While almost none of the smallest SMEs (1%) were using 4 or more forms of finance, this proportion increased to 22% of those with 50-249 employees:
Forms of external finance currently used
YEQ4 2018 – all SMEs Total 0
emp 1-9
emps 10-49 emps
50-249 emps
Unweighted base: 18,002 3602 5800 5800 2800
None 64% 66% 58% 46% 23%
1 form of finance 22% 22% 23% 24% 19%
2 forms of finance 9% 8% 11% 14% 20%
3 forms of finance 3% 2% 4% 9% 16%
4 or more forms of finance 2% 1% 4% 7% 22%
81% of those using a single form of finance were using one of the core products: 43% were using an overdraft, while 24% were using a credit card and 14% a loan/commercial mortgage.
2% of SMEs (YEQ4 2018) said that they were using an additional form of external finance not on the list detailed in full above, increasing slightly by size (6% of those with 50-249 employees):
• There was a difference in use of these other forms of finance by whether the SME was also using one of the specified forms of external finance (5% for those also using any of the specified forms of external finance and 1% for those not).
• This means that less than 1% of all SMEs are classed as non-users of finance in this report (because they do not use any of the specified forms of external finance) but said at this question that they were using some other form of finance. The form of funding used is not known.
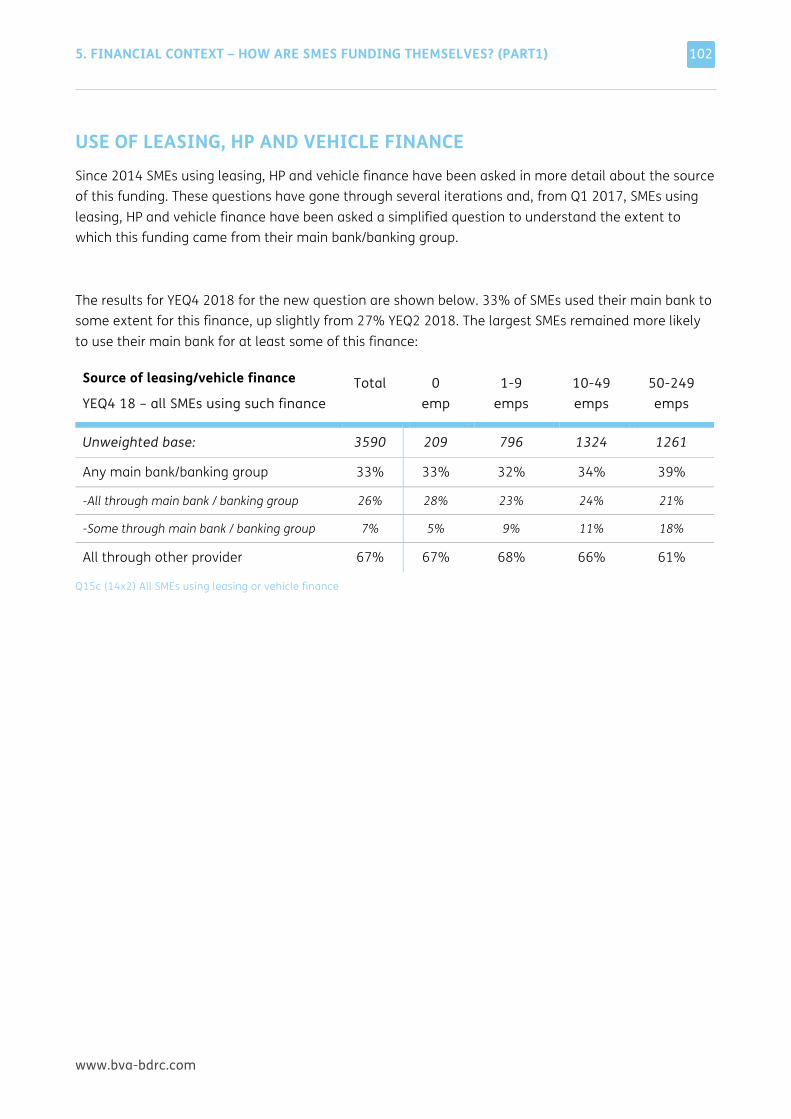
5. FINANCIAL CONTEXT – HOW ARE SMES FUNDING THEMSELVES? (PART1)
www.bva-bdrc.com
102
USE OF LEASING, HP AND VEHICLE FINANCE Since 2014 SMEs using leasing, HP and vehicle finance have been asked in more detail about the source of this funding. These questions have gone through several iterations and, from Q1 2017, SMEs using leasing, HP and vehicle finance have been asked a simplified question to understand the extent to which this funding came from their main bank/banking group.
The results for YEQ4 2018 for the new question are shown below. 33% of SMEs used their main bank to some extent for this finance, up slightly from 27% YEQ2 2018. The largest SMEs remained more likely to use their main bank for at least some of this finance:
Source of leasing/vehicle finance
YEQ4 18 – all SMEs using such finance Total
0
emp 1-9
emps 10-49 emps
50-249 emps
Unweighted base: 3590 209 796 1324 1261
Any main bank/banking group 33% 33% 32% 34% 39%
-All through main bank / banking group 26% 28% 23% 24% 21%
-Some through main bank / banking group 7% 5% 9% 11% 18%
All through other provider 67% 67% 68% 66% 61%
Q15c (14x2) All SMEs using leasing or vehicle finance
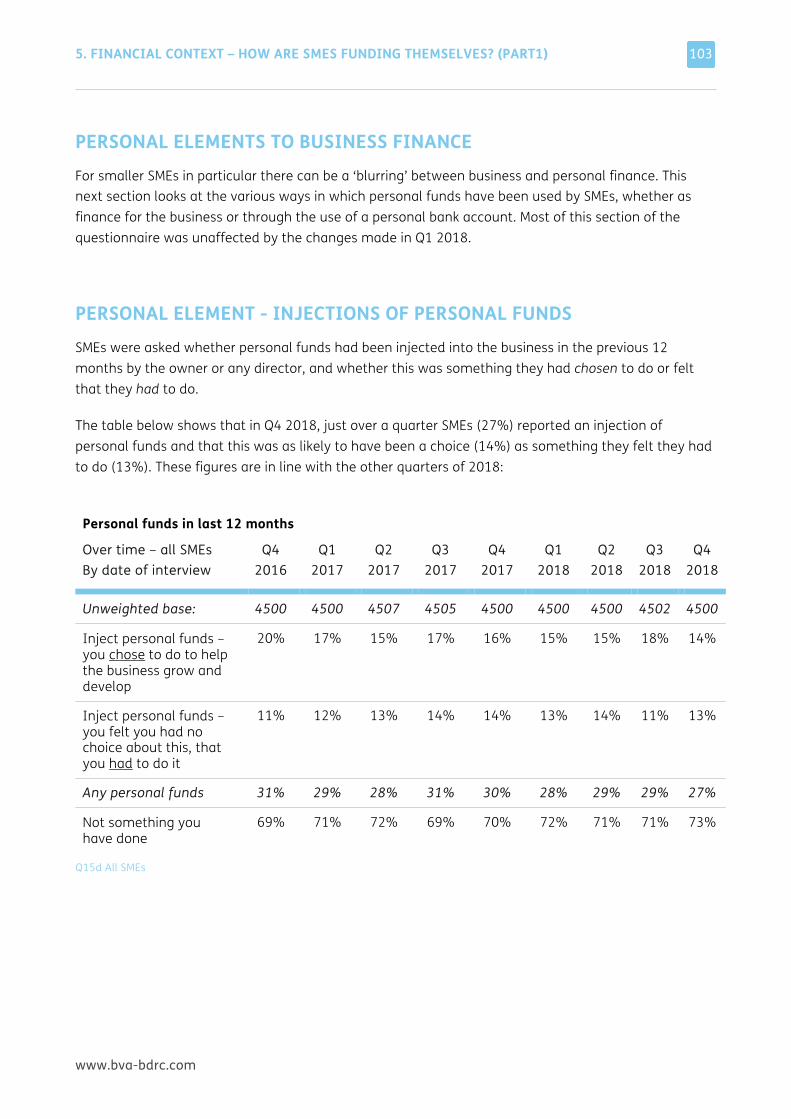
5. FINANCIAL CONTEXT – HOW ARE SMES FUNDING THEMSELVES? (PART1)
www.bva-bdrc.com
103
PERSONAL ELEMENTS TO BUSINESS FINANCE For smaller SMEs in particular there can be a ‘blurring’ between business and personal finance. This next section looks at the various ways in which personal funds have been used by SMEs, whether as finance for the business or through the use of a personal bank account. Most of this section of the questionnaire was unaffected by the changes made in Q1 2018.
PERSONAL ELEMENT - INJECTIONS OF PERSONAL FUNDS SMEs were asked whether personal funds had been injected into the business in the previous 12 months by the owner or any director, and whether this was something they had chosen to do or felt that they had to do.
The table below shows that in Q4 2018, just over a quarter SMEs (27%) reported an injection of personal funds and that this was as likely to have been a choice (14%) as something they felt they had to do (13%). These figures are in line with the other quarters of 2018:
Personal funds in last 12 months
Over time – all SMEs By date of interview
Q4 2016
Q1 2017
Q2 2017
Q3 2017
Q4 2017
Q1 2018
Q2 2018
Q3 2018
Q4 2018
Unweighted base: 4500 4500 4507 4505 4500 4500 4500 4502 4500
Inject personal funds – you chose to do to help the business grow and develop
20% 17% 15% 17% 16% 15% 15% 18% 14%
Inject personal funds – you felt you had no choice about this, that you had to do it
11% 12% 13% 14% 14% 13% 14% 11% 13%
Any personal funds 31% 29% 28% 31% 30% 28% 29% 29% 27%
Not something you have done
69% 71% 72% 69% 70% 72% 71% 71% 73%
Q15d All SMEs
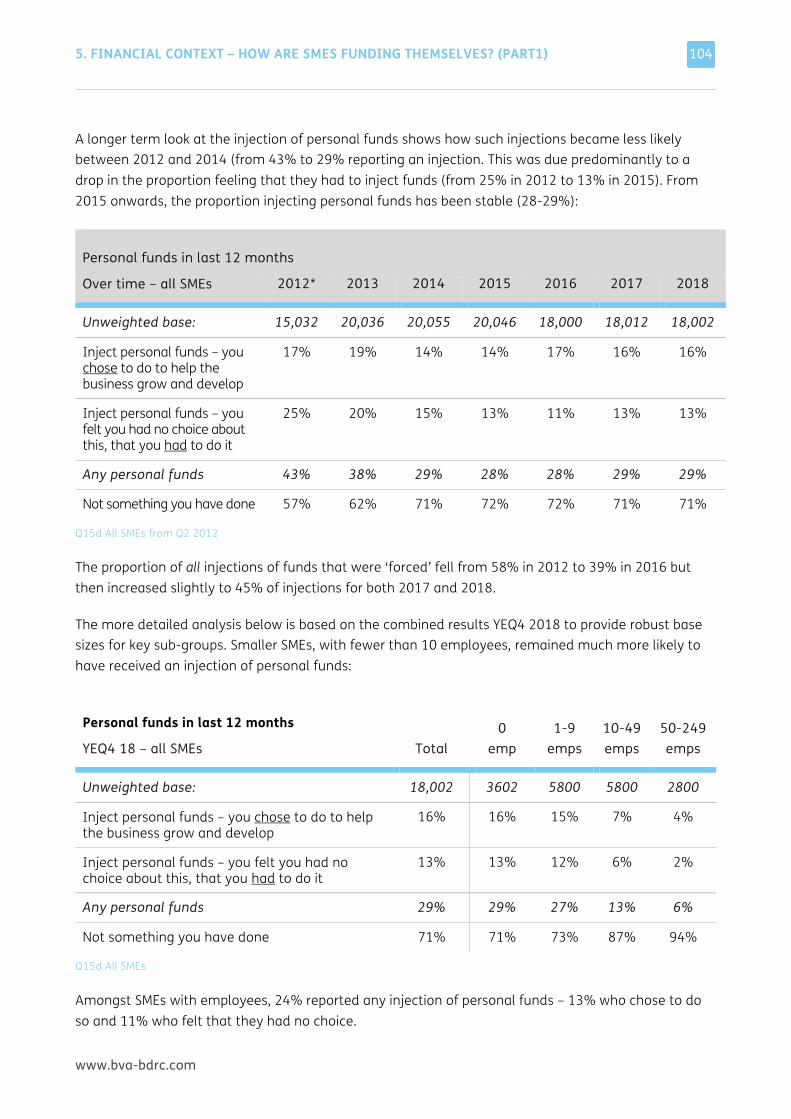
5. FINANCIAL CONTEXT – HOW ARE SMES FUNDING THEMSELVES? (PART1)
www.bva-bdrc.com
104
A longer term look at the injection of personal funds shows how such injections became less likely between 2012 and 2014 (from 43% to 29% reporting an injection. This was due predominantly to a drop in the proportion feeling that they had to inject funds (from 25% in 2012 to 13% in 2015). From 2015 onwards, the proportion injecting personal funds has been stable (28-29%):
Personal funds in last 12 months
Over time – all SMEs 2012* 2013 2014 2015 2016 2017 2018
Unweighted base: 15,032 20,036 20,055 20,046 18,000 18,012 18,002
Inject personal funds – you chose to do to help the business grow and develop
17% 19% 14% 14% 17% 16% 16%
Inject personal funds – you felt you had no choice about this, that you had to do it
25% 20% 15% 13% 11% 13% 13%
Any personal funds 43% 38% 29% 28% 28% 29% 29%
Not something you have done 57% 62% 71% 72% 72% 71% 71%
Q15d All SMEs from Q2 2012
The proportion of all injections of funds that were ‘forced’ fell from 58% in 2012 to 39% in 2016 but then increased slightly to 45% of injections for both 2017 and 2018.
The more detailed analysis below is based on the combined results YEQ4 2018 to provide robust base sizes for key sub-groups. Smaller SMEs, with fewer than 10 employees, remained much more likely to have received an injection of personal funds:
Personal funds in last 12 months
YEQ4 18 – all SMEs Total 0
emp 1-9
emps 10-49 emps
50-249 emps
Unweighted base: 18,002 3602 5800 5800 2800
Inject personal funds – you chose to do to help the business grow and develop
16% 16% 15% 7% 4%
Inject personal funds – you felt you had no choice about this, that you had to do it
13% 13% 12% 6% 2%
Any personal funds 29% 29% 27% 13% 6%
Not something you have done 71% 71% 73% 87% 94%
Q15d All SMEs
Amongst SMEs with employees, 24% reported any injection of personal funds – 13% who chose to do so and 11% who felt that they had no choice.
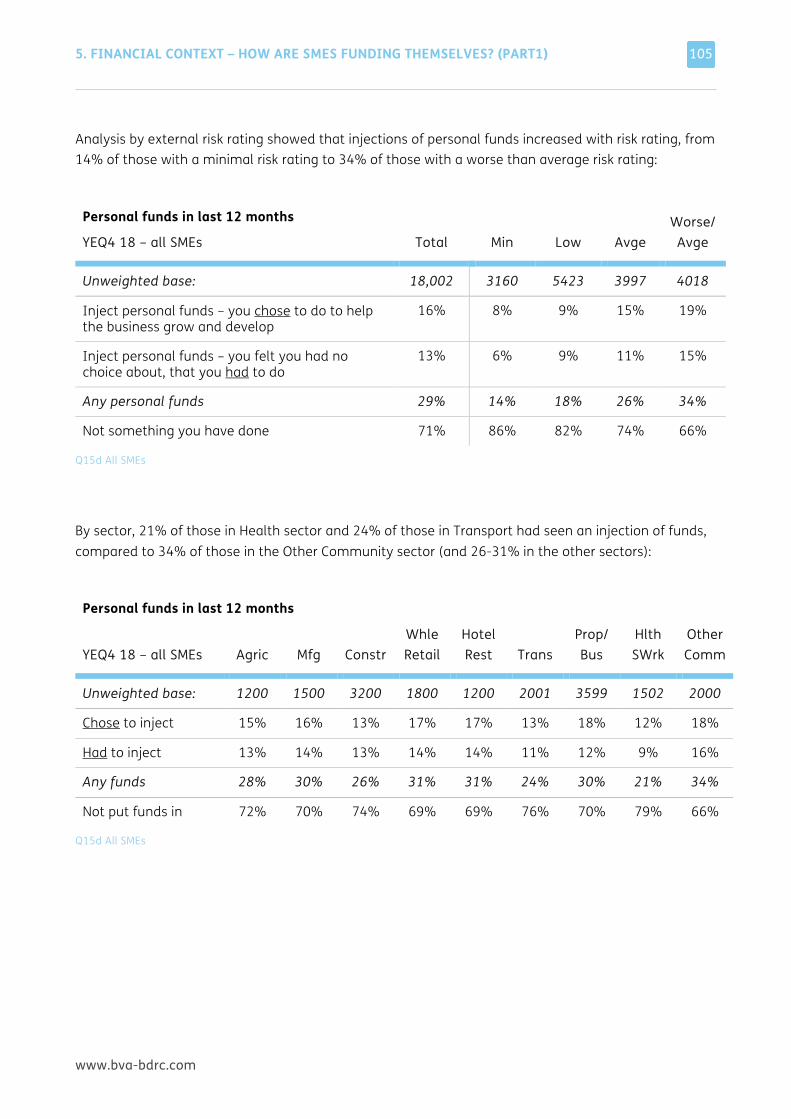
5. FINANCIAL CONTEXT – HOW ARE SMES FUNDING THEMSELVES? (PART1)
www.bva-bdrc.com
105
Analysis by external risk rating showed that injections of personal funds increased with risk rating, from 14% of those with a minimal risk rating to 34% of those with a worse than average risk rating:
Personal funds in last 12 months
YEQ4 18 – all SMEs Total Min Low Avge Worse/
Avge
Unweighted base: 18,002 3160 5423 3997 4018
Inject personal funds – you chose to do to help the business grow and develop
16% 8% 9% 15% 19%
Inject personal funds – you felt you had no choice about, that you had to do
13% 6% 9% 11% 15%
Any personal funds 29% 14% 18% 26% 34%
Not something you have done 71% 86% 82% 74% 66%
Q15d All SMEs
By sector, 21% of those in Health sector and 24% of those in Transport had seen an injection of funds, compared to 34% of those in the Other Community sector (and 26-31% in the other sectors):
Personal funds in last 12 months
YEQ4 18 – all SMEs Agric Mfg Constr Whle Retail
Hotel Rest Trans
Prop/ Bus
Hlth SWrk
Other Comm
Unweighted base: 1200 1500 3200 1800 1200 2001 3599 1502 2000
Chose to inject 15% 16% 13% 17% 17% 13% 18% 12% 18%
Had to inject 13% 14% 13% 14% 14% 11% 12% 9% 16%
Any funds 28% 30% 26% 31% 31% 24% 30% 21% 34%
Not put funds in 72% 70% 74% 69% 69% 76% 70% 79% 66%
Q15d All SMEs
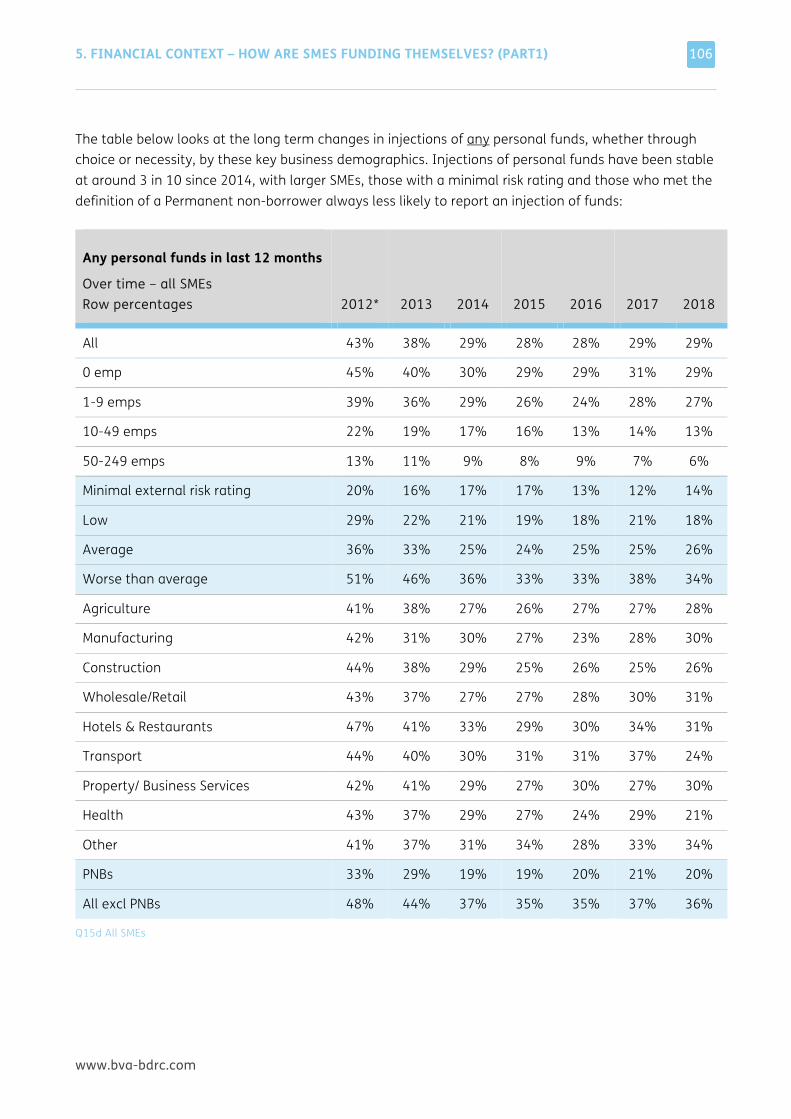
5. FINANCIAL CONTEXT – HOW ARE SMES FUNDING THEMSELVES? (PART1)
www.bva-bdrc.com
106
The table below looks at the long term changes in injections of any personal funds, whether through choice or necessity, by these key business demographics. Injections of personal funds have been stable at around 3 in 10 since 2014, with larger SMEs, those with a minimal risk rating and those who met the definition of a Permanent non-borrower always less likely to report an injection of funds:
Any personal funds in last 12 months
Over time – all SMEs Row percentages 2012* 2013 2014 2015
2016 2017 2018
All 43% 38% 29% 28% 28% 29% 29%
0 emp 45% 40% 30% 29% 29% 31% 29%
1-9 emps 39% 36% 29% 26% 24% 28% 27%
10-49 emps 22% 19% 17% 16% 13% 14% 13%
50-249 emps 13% 11% 9% 8% 9% 7% 6%
Minimal external risk rating 20% 16% 17% 17% 13% 12% 14%
Low 29% 22% 21% 19% 18% 21% 18%
Average 36% 33% 25% 24% 25% 25% 26%
Worse than average 51% 46% 36% 33% 33% 38% 34%
Agriculture 41% 38% 27% 26% 27% 27% 28%
Manufacturing 42% 31% 30% 27% 23% 28% 30%
Construction 44% 38% 29% 25% 26% 25% 26%
Wholesale/Retail 43% 37% 27% 27% 28% 30% 31%
Hotels & Restaurants 47% 41% 33% 29% 30% 34% 31%
Transport 44% 40% 30% 31% 31% 37% 24%
Property/ Business Services 42% 41% 29% 27% 30% 27% 30%
Health 43% 37% 29% 27% 24% 29% 21%
Other 41% 37% 31% 34% 28% 33% 34%
PNBs 33% 29% 19% 19% 20% 21% 20%
All excl PNBs 48% 44% 37% 35% 35% 37% 36%
Q15d All SMEs
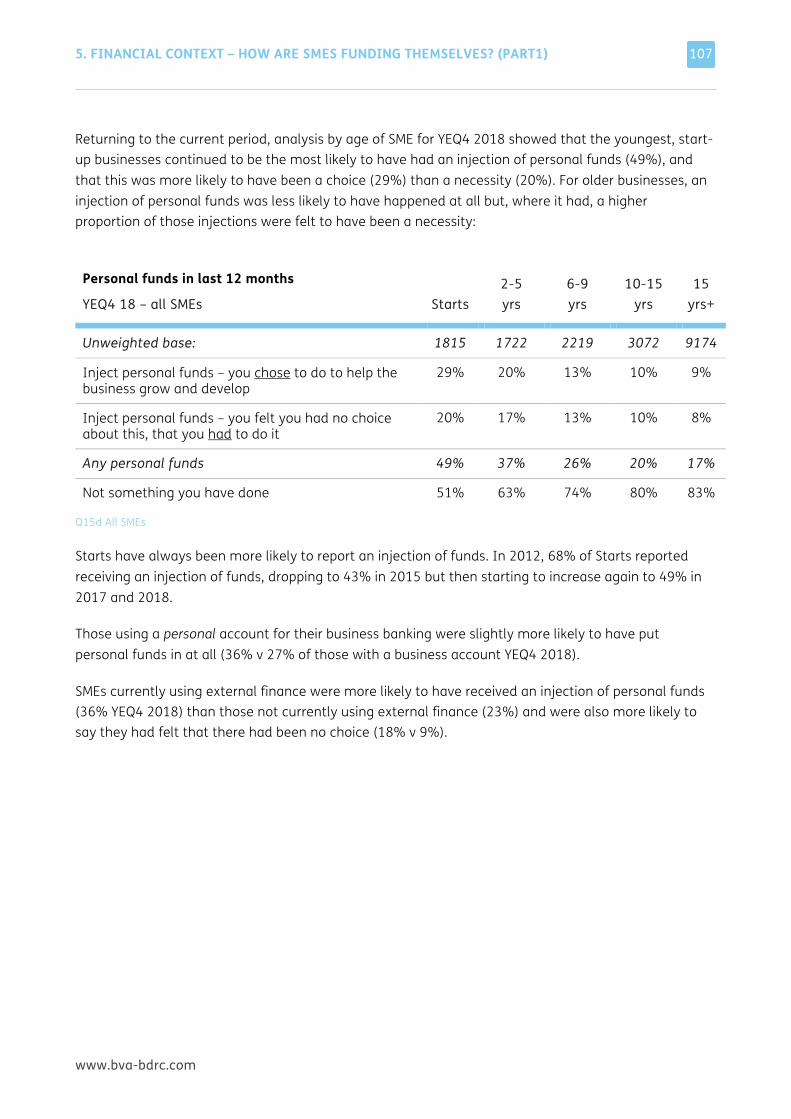
5. FINANCIAL CONTEXT – HOW ARE SMES FUNDING THEMSELVES? (PART1)
www.bva-bdrc.com
107
Returning to the current period, analysis by age of SME for YEQ4 2018 showed that the youngest, start-up businesses continued to be the most likely to have had an injection of personal funds (49%), and that this was more likely to have been a choice (29%) than a necessity (20%). For older businesses, an injection of personal funds was less likely to have happened at all but, where it had, a higher proportion of those injections were felt to have been a necessity:
Personal funds in last 12 months
YEQ4 18 – all SMEs Starts 2-5 yrs
6-9 yrs
10-15 yrs
15 yrs+
Unweighted base: 1815 1722 2219 3072 9174
Inject personal funds – you chose to do to help the business grow and develop
29% 20% 13% 10% 9%
Inject personal funds – you felt you had no choice about this, that you had to do it
20% 17% 13% 10% 8%
Any personal funds 49% 37% 26% 20% 17%
Not something you have done 51% 63% 74% 80% 83%
Q15d All SMEs
Starts have always been more likely to report an injection of funds. In 2012, 68% of Starts reported receiving an injection of funds, dropping to 43% in 2015 but then starting to increase again to 49% in 2017 and 2018.
Those using a personal account for their business banking were slightly more likely to have put personal funds in at all (36% v 27% of those with a business account YEQ4 2018).
SMEs currently using external finance were more likely to have received an injection of personal funds (36% YEQ4 2018) than those not currently using external finance (23%) and were also more likely to say they had felt that there had been no choice (18% v 9%).
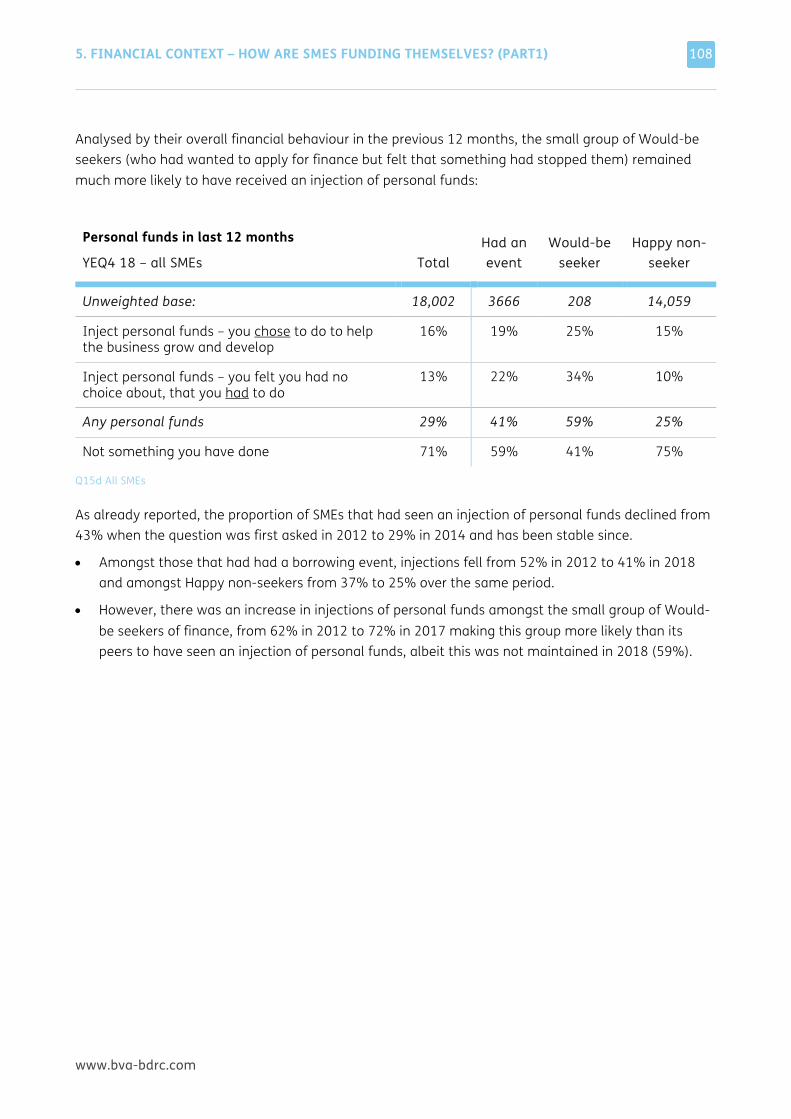
5. FINANCIAL CONTEXT – HOW ARE SMES FUNDING THEMSELVES? (PART1)
www.bva-bdrc.com
108
Analysed by their overall financial behaviour in the previous 12 months, the small group of Would-be seekers (who had wanted to apply for finance but felt that something had stopped them) remained much more likely to have received an injection of personal funds:
Personal funds in last 12 months
YEQ4 18 – all SMEs Total Had an event
Would-be seeker
Happy non-seeker
Unweighted base: 18,002 3666 208 14,059
Inject personal funds – you chose to do to help the business grow and develop
16% 19% 25% 15%
Inject personal funds – you felt you had no choice about, that you had to do
13% 22% 34% 10%
Any personal funds 29% 41% 59% 25%
Not something you have done 71% 59% 41% 75%
Q15d All SMEs
As already reported, the proportion of SMEs that had seen an injection of personal funds declined from 43% when the question was first asked in 2012 to 29% in 2014 and has been stable since.
• Amongst those that had had a borrowing event, injections fell from 52% in 2012 to 41% in 2018 and amongst Happy non-seekers from 37% to 25% over the same period.
• However, there was an increase in injections of personal funds amongst the small group of Would-be seekers of finance, from 62% in 2012 to 72% in 2017 making this group more likely than its peers to have seen an injection of personal funds, albeit this was not maintained in 2018 (59%).
5. FINANCIAL CONTEXT – HOW ARE SMES FUNDING THEMSELVES? (PART1)
www.bva-bdrc.com
109
PERSONAL ELEMENT - USE OF PERSONAL BANK ACCOUNTS Most SMEs used a business bank account (86% excluding DK answers).
Of the 14% that used a personal account, almost all (94%) were 0 employee businesses. So, whilst 17% of 0 employee SMEs used a personal account for their business banking, amongst those with employees the figure was 3%.
SMEs more likely to be using a personal account included those in the Health sector (20%), Starts (17%) and those trading for 2-5 years (18%). Those with a minimal or low external risk rating were less likely to be using a personal account (both 6%) as were those in Wholesale/Retail (4%).
In most years around 1 in 5 SMEs used a personal account, the slight exception being 2014 when 1 in 7 SMEs used them. The figures for 2017 (16%) and 2018 (14%) were at the lower end of the range seen.
YEQ4 2018, SMEs using a personal account were:
• Less likely to be using external finance (29% used external finance, compared to 38% of those using a business account) and somewhat less likely to have had a borrowing event (10% v 15%).
• Somewhat more likely to have put personal funds into the business (36% v 27% of those with a business account) or to be a Permanent non-borrower (51% v 47%).
PERSONAL ELEMENT - FINANCE FACILITIES IN A PERSONAL NAME Those using core finance have previously been asked whether any of those loan, overdraft or credit card facilities were in their personal name, rather than that of the business. In 2017, a quarter of those using such facilities (26%) said that one or more facilities were in their personal name. This varied relatively little across the quarters in which the question was asked.
From Q1 2018, the question was broadened. SMEs were still asked about the loans and/or overdrafts they used but were then asked about any other forms of finance, not just credit cards specifically. As a result, the figures below are the proportion of all those using finance who have a facility in their personal name, not just those using ‘core’ finance as previously. As core forms of finance are more likely to be in a personal name than other forms of finance, all the percentages are lower.
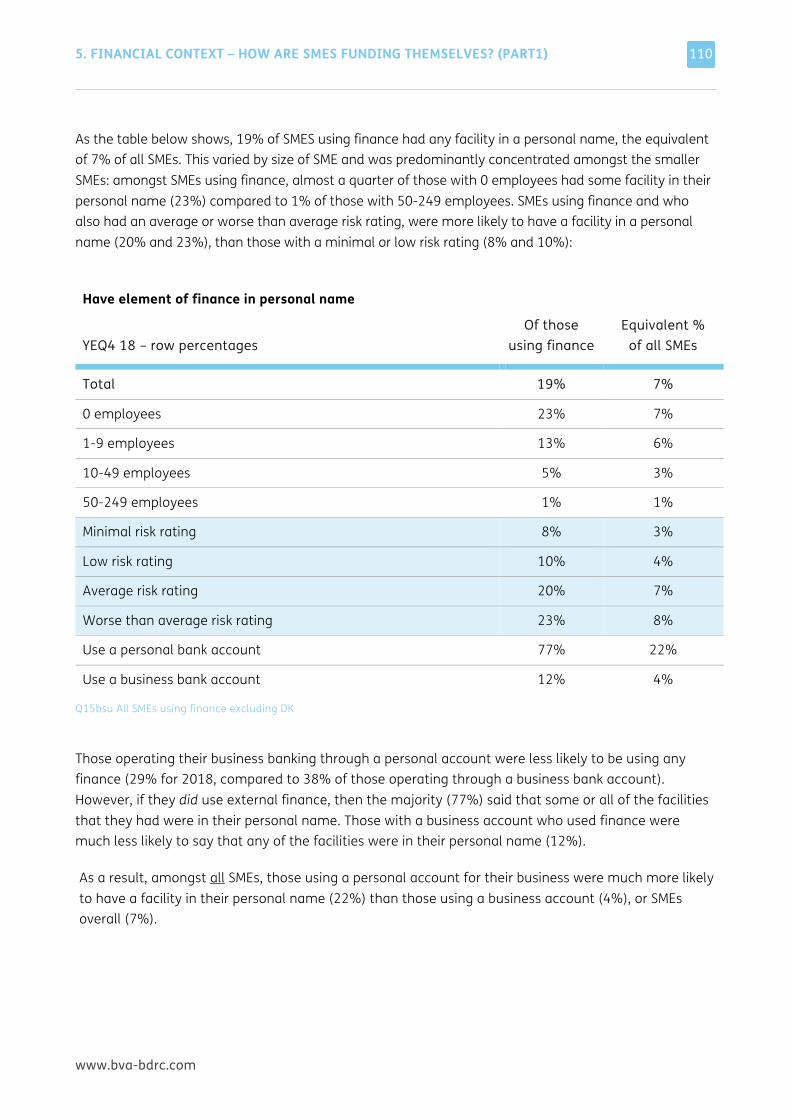
5. FINANCIAL CONTEXT – HOW ARE SMES FUNDING THEMSELVES? (PART1)
www.bva-bdrc.com
110
As the table below shows, 19% of SMES using finance had any facility in a personal name, the equivalent of 7% of all SMEs. This varied by size of SME and was predominantly concentrated amongst the smaller SMEs: amongst SMEs using finance, almost a quarter of those with 0 employees had some facility in their personal name (23%) compared to 1% of those with 50-249 employees. SMEs using finance and who also had an average or worse than average risk rating, were more likely to have a facility in a personal name (20% and 23%), than those with a minimal or low risk rating (8% and 10%):
Have element of finance in personal name
YEQ4 18 – row percentages
Of those using finance
Equivalent % of all SMEs
Total 19% 7%
0 employees 23% 7%
1-9 employees 13% 6%
10-49 employees 5% 3%
50-249 employees 1% 1%
Minimal risk rating 8% 3%
Low risk rating 10% 4%
Average risk rating 20% 7%
Worse than average risk rating 23% 8%
Use a personal bank account 77% 22%
Use a business bank account 12% 4%
Q15bsu All SMEs using finance excluding DK
Those operating their business banking through a personal account were less likely to be using any finance (29% for 2018, compared to 38% of those operating through a business bank account). However, if they did use external finance, then the majority (77%) said that some or all of the facilities that they had were in their personal name. Those with a business account who used finance were much less likely to say that any of the facilities were in their personal name (12%).
As a result, amongst all SMEs, those using a personal account for their business were much more likely to have a facility in their personal name (22%) than those using a business account (4%), or SMEs overall (7%).
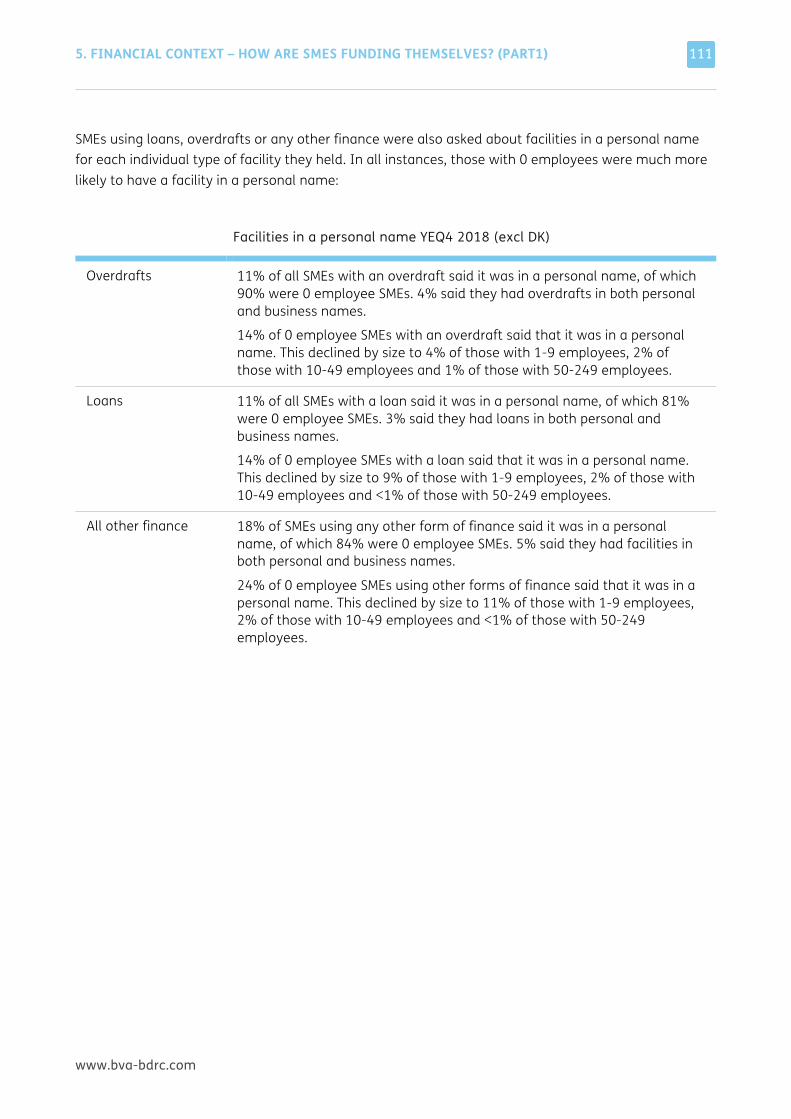
5. FINANCIAL CONTEXT – HOW ARE SMES FUNDING THEMSELVES? (PART1)
www.bva-bdrc.com
111
SMEs using loans, overdrafts or any other finance were also asked about facilities in a personal name for each individual type of facility they held. In all instances, those with 0 employees were much more likely to have a facility in a personal name:
Facilities in a personal name YEQ4 2018 (excl DK)
Overdrafts 11% of all SMEs with an overdraft said it was in a personal name, of which 90% were 0 employee SMEs. 4% said they had overdrafts in both personal and business names.
14% of 0 employee SMEs with an overdraft said that it was in a personal name. This declined by size to 4% of those with 1-9 employees, 2% of those with 10-49 employees and 1% of those with 50-249 employees.
Loans 11% of all SMEs with a loan said it was in a personal name, of which 81% were 0 employee SMEs. 3% said they had loans in both personal and business names.
14% of 0 employee SMEs with a loan said that it was in a personal name. This declined by size to 9% of those with 1-9 employees, 2% of those with 10-49 employees and <1% of those with 50-249 employees.
All other finance 18% of SMEs using any other form of finance said it was in a personal name, of which 84% were 0 employee SMEs. 5% said they had facilities in both personal and business names.
24% of 0 employee SMEs using other forms of finance said that it was in a personal name. This declined by size to 11% of those with 1-9 employees, 2% of those with 10-49 employees and <1% of those with 50-249 employees.
www.bva-bdrc.com
6 FINANCIAL CONTEXT – HOW ARE SMES FUNDING THEMSELVES? (PART 2) THIS CHAPTER PROVIDES an overview of other aspects of external finance – trade credit, Permanent non-Borrowers and attitudes to using finance.
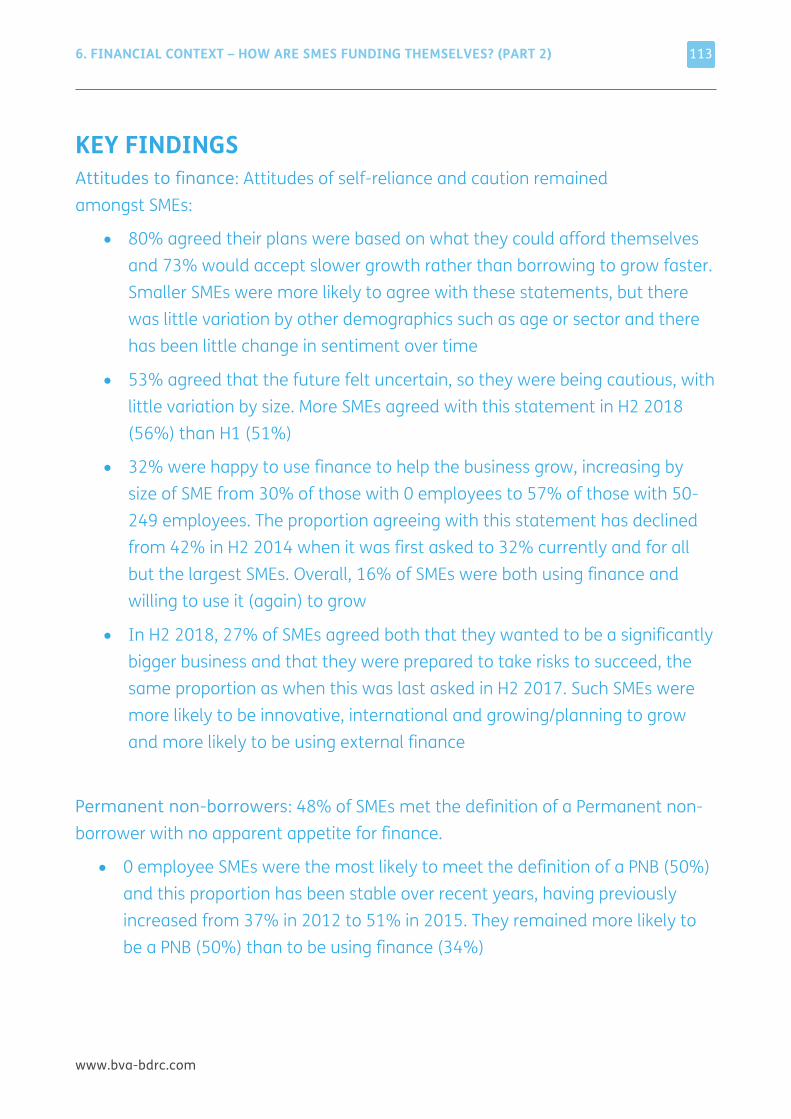
6. FINANCIAL CONTEXT – HOW ARE SMES FUNDING THEMSELVES? (PART 2)
www.bva-bdrc.com
113
KEY FINDINGS Attitudes to finance: Attitudes of self-reliance and caution remained amongst SMEs:
• 80% agreed their plans were based on what they could afford themselves and 73% would accept slower growth rather than borrowing to grow faster. Smaller SMEs were more likely to agree with these statements, but there was little variation by other demographics such as age or sector and there has been little change in sentiment over time
• 53% agreed that the future felt uncertain, so they were being cautious, with little variation by size. More SMEs agreed with this statement in H2 2018 (56%) than H1 (51%)
• 32% were happy to use finance to help the business grow, increasing by size of SME from 30% of those with 0 employees to 57% of those with 50-249 employees. The proportion agreeing with this statement has declined from 42% in H2 2014 when it was first asked to 32% currently and for all but the largest SMEs. Overall, 16% of SMEs were both using finance and willing to use it (again) to grow
• In H2 2018, 27% of SMEs agreed both that they wanted to be a significantly bigger business and that they were prepared to take risks to succeed, the same proportion as when this was last asked in H2 2017. Such SMEs were more likely to be innovative, international and growing/planning to grow and more likely to be using external finance
Permanent non-borrowers: 48% of SMEs met the definition of a Permanent non-borrower with no apparent appetite for finance.
• 0 employee SMEs were the most likely to meet the definition of a PNB (50%) and this proportion has been stable over recent years, having previously increased from 37% in 2012 to 51% in 2015. They remained more likely to be a PNB (50%) than to be using finance (34%)
6. FINANCIAL CONTEXT – HOW ARE SMES FUNDING THEMSELVES? (PART 2)
www.bva-bdrc.com
114
• Amongst those with 1-9 employees the proportion of PNBs has increased over time (from 25% in 2012 to 44% in 2018) and they are now as likely to be a PNB (44%) as to be using external finance (42%)
• Amongst those with 10-49 employees the proportion of PNBs has also increased over time (from 18% in 2012 to 36% in 2018). They remained more likely to be using external finance (54%) than to be a PNB (36%) but the ‘gap’ has closed from 52 to 18 percentage points
• The largest SMEs were the least likely to meet the definition of a PNB (19%). The proportion of PNBs increased from 15% in 2012 to 28% in 2015, then declined again and SMEs with 50-249 employees remained much more likely to be using external finance (77%) than to be a PNB (19%)
• PNBs were as likely as other SMEs to be profitable and hold £10,000 or more in credit balances, but they were less likely to have been innovative or to have plans to grow
Trade credit: A third of SMEs (34%) were using trade credit, up slightly from 31% in 2014, and increasing by size of SME (29% of 0 employee SMEs to 67% of those with 50-249 employees)
• Where available, having access to trade credit was less likely to reduce the need for external finance (68%) than having £10,000 of credit balances (82% of a different group of SMEs)
• Overall, 29% of SMEs said their need for finance was reduced by either £10,000 of credit balances or having access to trade credit
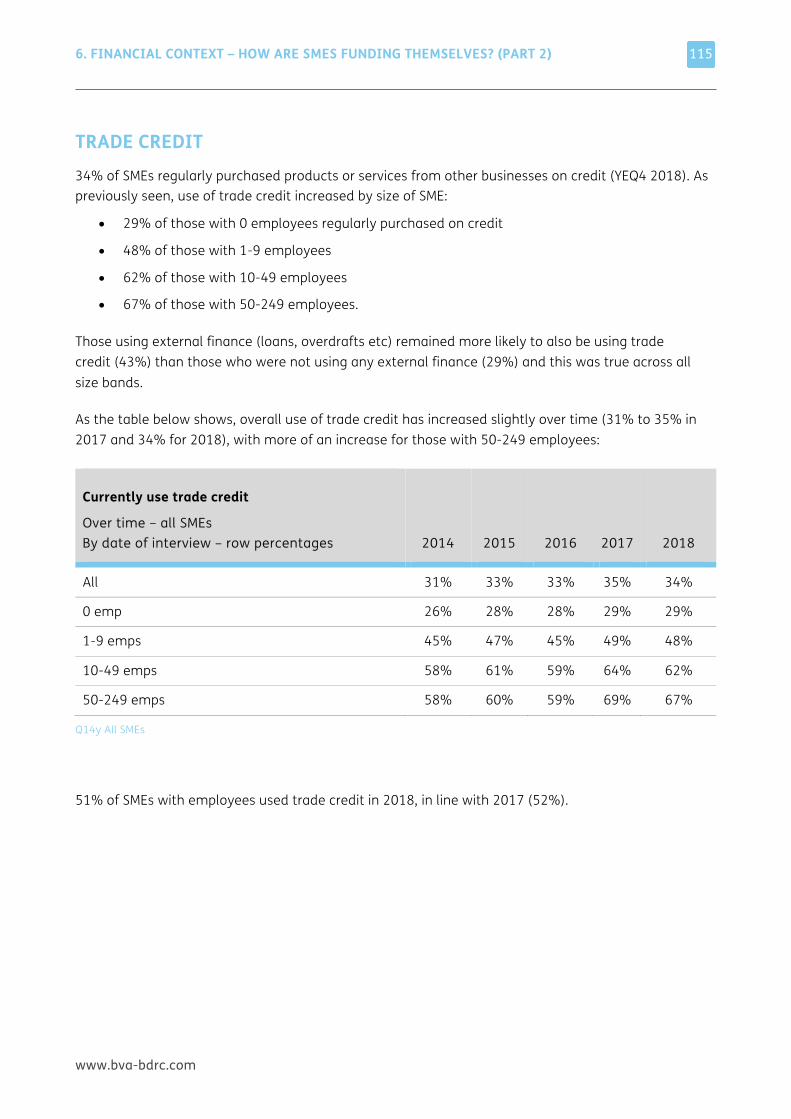
6. FINANCIAL CONTEXT – HOW ARE SMES FUNDING THEMSELVES? (PART 2)
www.bva-bdrc.com
115
TRADE CREDIT 34% of SMEs regularly purchased products or services from other businesses on credit (YEQ4 2018). As previously seen, use of trade credit increased by size of SME:
• 29% of those with 0 employees regularly purchased on credit
• 48% of those with 1-9 employees
• 62% of those with 10-49 employees
• 67% of those with 50-249 employees.
Those using external finance (loans, overdrafts etc) remained more likely to also be using trade credit (43%) than those who were not using any external finance (29%) and this was true across all size bands.
As the table below shows, overall use of trade credit has increased slightly over time (31% to 35% in 2017 and 34% for 2018), with more of an increase for those with 50-249 employees:
Currently use trade credit
Over time – all SMEs By date of interview – row percentages 2014 2015 2016 2017 2018
All 31% 33% 33% 35% 34%
0 emp 26% 28% 28% 29% 29%
1-9 emps 45% 47% 45% 49% 48%
10-49 emps 58% 61% 59% 64% 62%
50-249 emps 58% 60% 59% 69% 67%
Q14y All SMEs
51% of SMEs with employees used trade credit in 2018, in line with 2017 (52%).
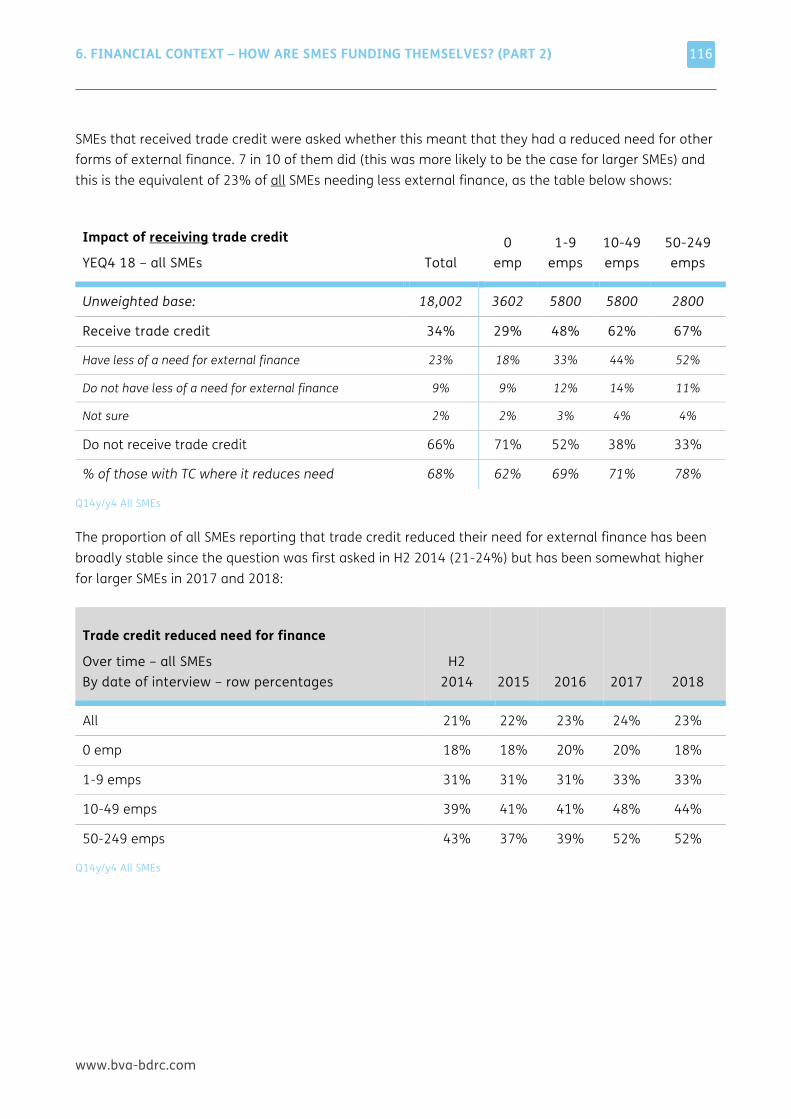
6. FINANCIAL CONTEXT – HOW ARE SMES FUNDING THEMSELVES? (PART 2)
www.bva-bdrc.com
116
SMEs that received trade credit were asked whether this meant that they had a reduced need for other forms of external finance. 7 in 10 of them did (this was more likely to be the case for larger SMEs) and this is the equivalent of 23% of all SMEs needing less external finance, as the table below shows:
Impact of receiving trade credit
YEQ4 18 – all SMEs Total 0
emp 1-9
emps 10-49 emps
50-249 emps
Unweighted base: 18,002 3602 5800 5800 2800
Receive trade credit 34% 29% 48% 62% 67%
Have less of a need for external finance 23% 18% 33% 44% 52%
Do not have less of a need for external finance 9% 9% 12% 14% 11%
Not sure 2% 2% 3% 4% 4%
Do not receive trade credit 66% 71% 52% 38% 33%
% of those with TC where it reduces need 68% 62% 69% 71% 78%
Q14y/y4 All SMEs
The proportion of all SMEs reporting that trade credit reduced their need for external finance has been broadly stable since the question was first asked in H2 2014 (21-24%) but has been somewhat higher for larger SMEs in 2017 and 2018:
Trade credit reduced need for finance
Over time – all SMEs By date of interview – row percentages
H2 2014 2015 2016 2017 2018
All 21% 22% 23% 24% 23%
0 emp 18% 18% 20% 20% 18%
1-9 emps 31% 31% 31% 33% 33%
10-49 emps 39% 41% 41% 48% 44%
50-249 emps 43% 37% 39% 52% 52%
Q14y/y4 All SMEs
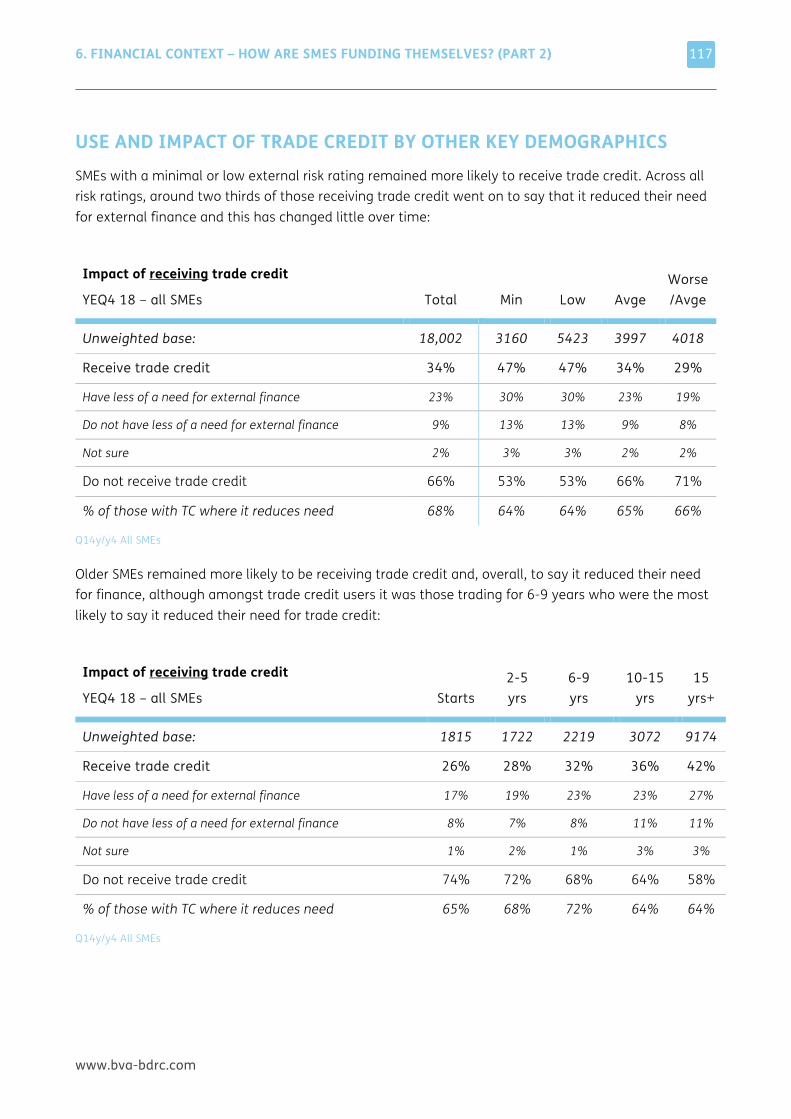
6. FINANCIAL CONTEXT – HOW ARE SMES FUNDING THEMSELVES? (PART 2)
www.bva-bdrc.com
117
USE AND IMPACT OF TRADE CREDIT BY OTHER KEY DEMOGRAPHICS SMEs with a minimal or low external risk rating remained more likely to receive trade credit. Across all risk ratings, around two thirds of those receiving trade credit went on to say that it reduced their need for external finance and this has changed little over time:
Impact of receiving trade credit
YEQ4 18 – all SMEs Total Min Low Avge Worse/Avge
Unweighted base: 18,002 3160 5423 3997 4018
Receive trade credit 34% 47% 47% 34% 29%
Have less of a need for external finance 23% 30% 30% 23% 19%
Do not have less of a need for external finance 9% 13% 13% 9% 8%
Not sure 2% 3% 3% 2% 2%
Do not receive trade credit 66% 53% 53% 66% 71%
% of those with TC where it reduces need 68% 64% 64% 65% 66%
Q14y/y4 All SMEs
Older SMEs remained more likely to be receiving trade credit and, overall, to say it reduced their need for finance, although amongst trade credit users it was those trading for 6-9 years who were the most likely to say it reduced their need for trade credit:
Impact of receiving trade credit
YEQ4 18 – all SMEs Starts 2-5 yrs
6-9 yrs
10-15 yrs
15 yrs+
Unweighted base: 1815 1722 2219 3072 9174
Receive trade credit 26% 28% 32% 36% 42%
Have less of a need for external finance 17% 19% 23% 23% 27%
Do not have less of a need for external finance 8% 7% 8% 11% 11%
Not sure 1% 2% 1% 3% 3%
Do not receive trade credit 74% 72% 68% 64% 58%
% of those with TC where it reduces need 65% 68% 72% 64% 64%
Q14y/y4 All SMEs
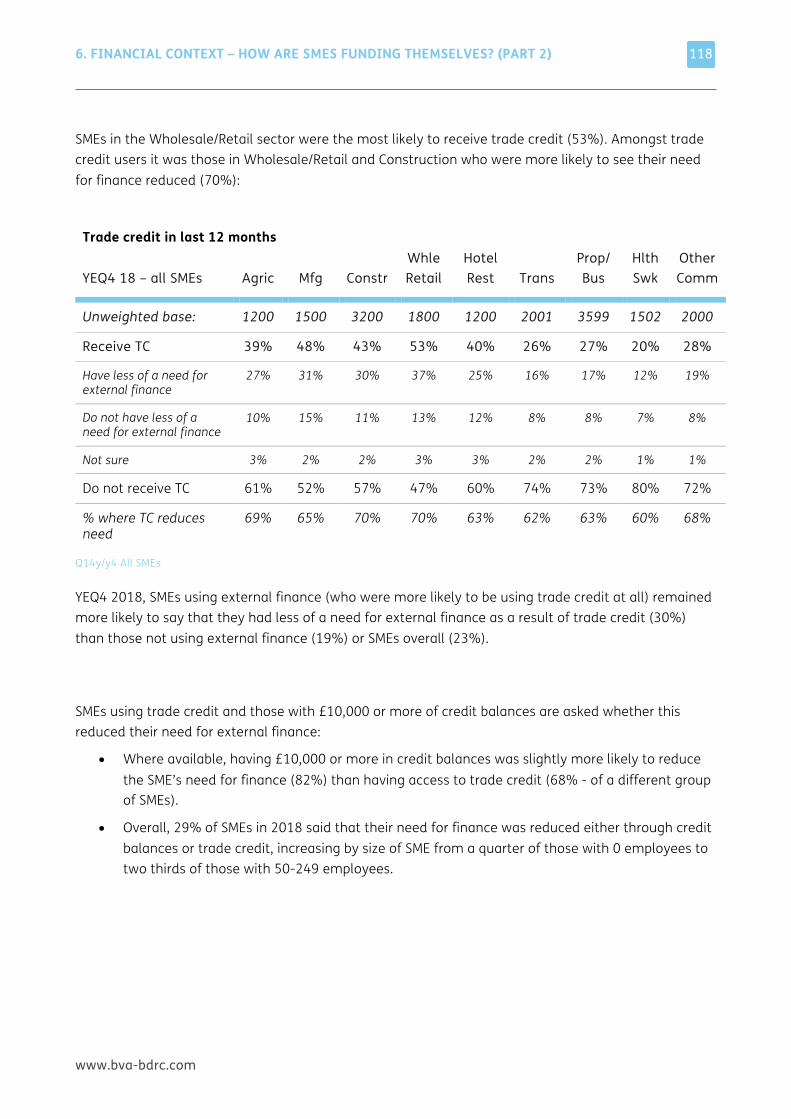
6. FINANCIAL CONTEXT – HOW ARE SMES FUNDING THEMSELVES? (PART 2)
www.bva-bdrc.com
118
SMEs in the Wholesale/Retail sector were the most likely to receive trade credit (53%). Amongst trade credit users it was those in Wholesale/Retail and Construction who were more likely to see their need for finance reduced (70%):
Trade credit in last 12 months
YEQ4 18 – all SMEs Agric Mfg Constr Whle Retail
Hotel Rest Trans
Prop/ Bus
Hlth Swk
Other Comm
Unweighted base: 1200 1500 3200 1800 1200 2001 3599 1502 2000
Receive TC 39% 48% 43% 53% 40% 26% 27% 20% 28%
Have less of a need for external finance
27% 31% 30% 37% 25% 16% 17% 12% 19%
Do not have less of a need for external finance
10% 15% 11% 13% 12% 8% 8% 7% 8%
Not sure 3% 2% 2% 3% 3% 2% 2% 1% 1%
Do not receive TC 61% 52% 57% 47% 60% 74% 73% 80% 72%
% where TC reduces need
69% 65% 70% 70% 63% 62% 63% 60% 68%
Q14y/y4 All SMEs
YEQ4 2018, SMEs using external finance (who were more likely to be using trade credit at all) remained more likely to say that they had less of a need for external finance as a result of trade credit (30%) than those not using external finance (19%) or SMEs overall (23%).
SMEs using trade credit and those with £10,000 or more of credit balances are asked whether this reduced their need for external finance:
• Where available, having £10,000 or more in credit balances was slightly more likely to reduce the SME’s need for finance (82%) than having access to trade credit (68% - of a different group of SMEs).
• Overall, 29% of SMEs in 2018 said that their need for finance was reduced either through credit balances or trade credit, increasing by size of SME from a quarter of those with 0 employees to two thirds of those with 50-249 employees.
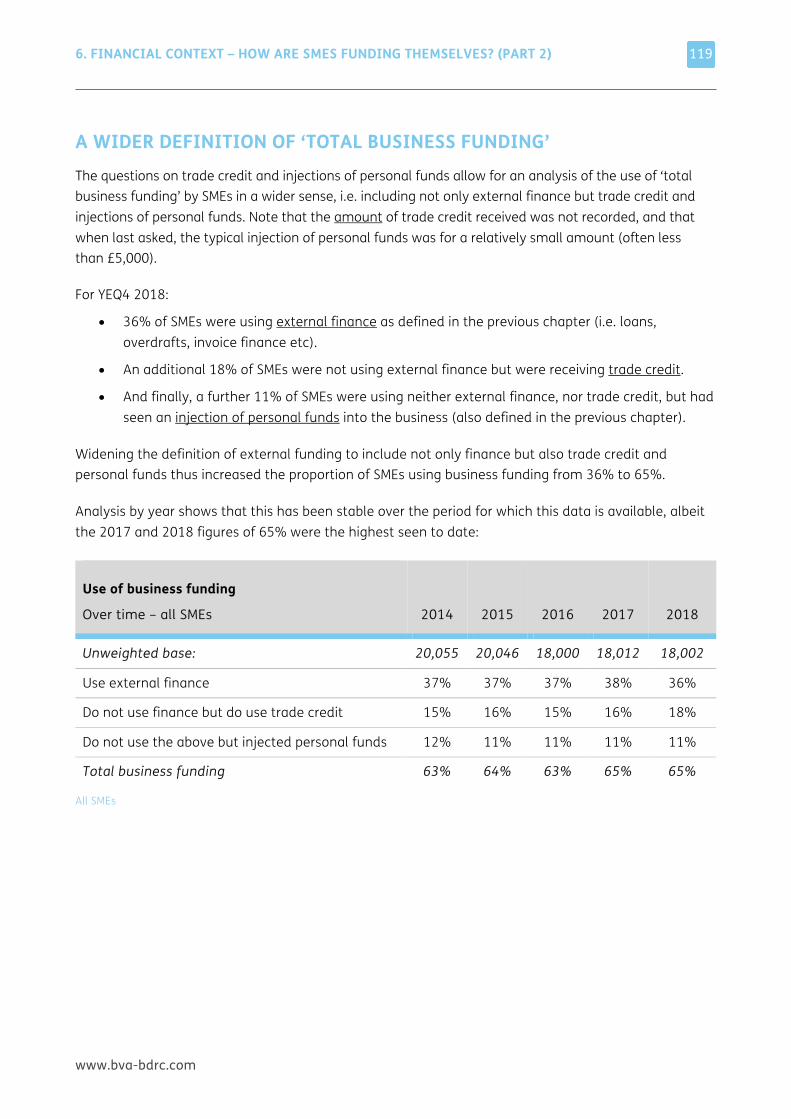
6. FINANCIAL CONTEXT – HOW ARE SMES FUNDING THEMSELVES? (PART 2)
www.bva-bdrc.com
119
A WIDER DEFINITION OF ‘TOTAL BUSINESS FUNDING’ The questions on trade credit and injections of personal funds allow for an analysis of the use of ‘total business funding’ by SMEs in a wider sense, i.e. including not only external finance but trade credit and injections of personal funds. Note that the amount of trade credit received was not recorded, and that when last asked, the typical injection of personal funds was for a relatively small amount (often less than £5,000).
For YEQ4 2018:
• 36% of SMEs were using external finance as defined in the previous chapter (i.e. loans, overdrafts, invoice finance etc).
• An additional 18% of SMEs were not using external finance but were receiving trade credit.
• And finally, a further 11% of SMEs were using neither external finance, nor trade credit, but had seen an injection of personal funds into the business (also defined in the previous chapter).
Widening the definition of external funding to include not only finance but also trade credit and personal funds thus increased the proportion of SMEs using business funding from 36% to 65%.
Analysis by year shows that this has been stable over the period for which this data is available, albeit the 2017 and 2018 figures of 65% were the highest seen to date:
Use of business funding
Over time – all SMEs 2014 2015 2016 2017 2018
Unweighted base: 20,055 20,046 18,000 18,012 18,002
Use external finance 37% 37% 37% 38% 36%
Do not use finance but do use trade credit 15% 16% 15% 16% 18%
Do not use the above but injected personal funds 12% 11% 11% 11% 11%
Total business funding 63% 64% 63% 65% 65%
All SMEs
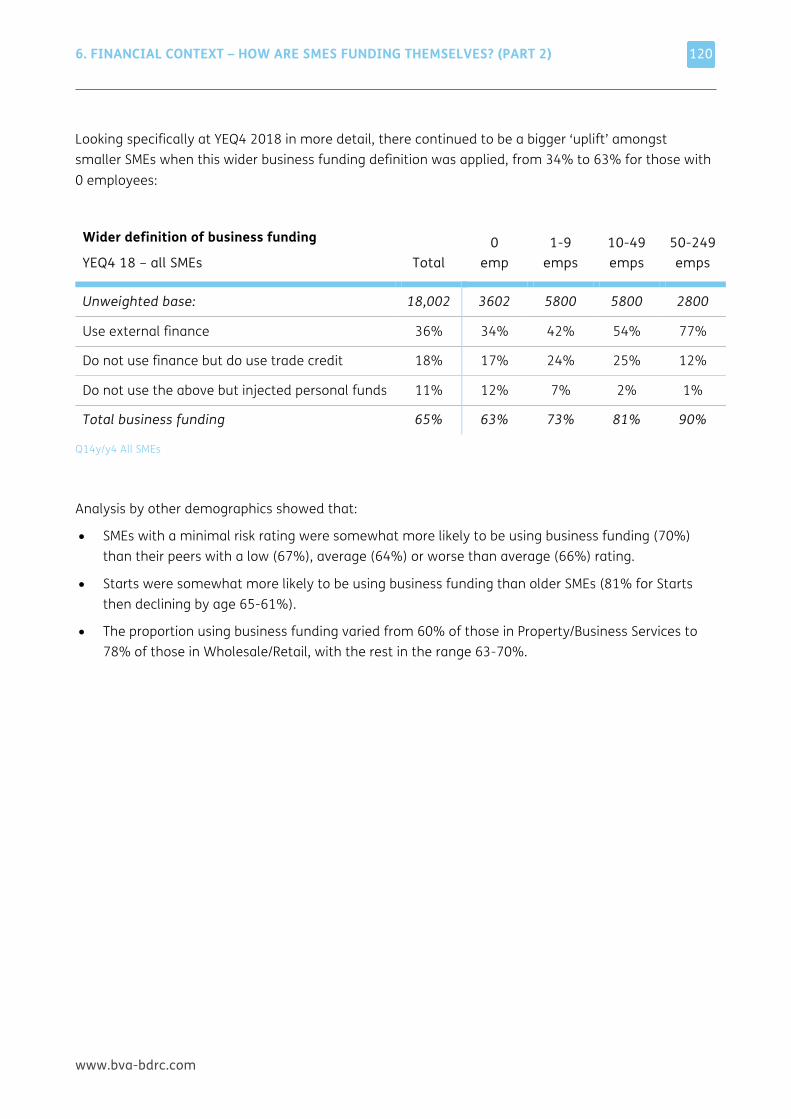
6. FINANCIAL CONTEXT – HOW ARE SMES FUNDING THEMSELVES? (PART 2)
www.bva-bdrc.com
120
Looking specifically at YEQ4 2018 in more detail, there continued to be a bigger ‘uplift’ amongst smaller SMEs when this wider business funding definition was applied, from 34% to 63% for those with 0 employees:
Wider definition of business funding
YEQ4 18 – all SMEs Total 0
emp 1-9
emps 10-49 emps
50-249 emps
Unweighted base: 18,002 3602 5800 5800 2800
Use external finance 36% 34% 42% 54% 77%
Do not use finance but do use trade credit 18% 17% 24% 25% 12%
Do not use the above but injected personal funds 11% 12% 7% 2% 1%
Total business funding 65% 63% 73% 81% 90%
Q14y/y4 All SMEs
Analysis by other demographics showed that:
• SMEs with a minimal risk rating were somewhat more likely to be using business funding (70%) than their peers with a low (67%), average (64%) or worse than average (66%) rating.
• Starts were somewhat more likely to be using business funding than older SMEs (81% for Starts then declining by age 65-61%).
• The proportion using business funding varied from 60% of those in Property/Business Services to 78% of those in Wholesale/Retail, with the rest in the range 63-70%.
6. FINANCIAL CONTEXT – HOW ARE SMES FUNDING THEMSELVES? (PART 2)
www.bva-bdrc.com
121
THE NON-BORROWING SME As the previous chapter reported, a third of SMEs (36% YEQ4 2018) used external finance. Other data from this report allows for identification of those SMEs who seem firmly disinclined to borrow, defined as those that met all of the following conditions:
• Are not currently using external finance
• Have not used external finance in the past 5 years
• Have had no borrowing events in the past 12 months
• Have not applied for any other forms of finance in the last 12 months
• Reported no inclination to borrow in the past 12 months or next 3 months.
From Q1 2018 the questions used to identify these SMEs have changed slightly but the sentiment behind them remains the same as in previous waves.
These Permanent non-borrowers made up 48% of SMEs (YEQ4 2018), and remained more likely to be found amongst the smaller SMEs, although not exclusively so (amongst SMEs with employees, 42% met the definition of a Permanent non-borrower):
• 50% of 0 employee SMEs met this non-borrowing definition
• 44% of 1-9 employee SMEs
• 36% of 10-49 employee SMEs
• 19% of 50-249 employee SMEs.
Half of SMEs in Property/Business Services (52%) or Construction (51%) met the definition of a Permanent non-borrower, compared to 38% of those in Health and 41% of those in Agriculture. Starts were less likely to meet the definition (31%) than older SMEs (49-54%) but there was little difference by external risk rating (45% for those with a minimal risk rating, 47-50% for other ratings).
Those using a personal account for their business banking were also somewhat more likely to meet the definition (51%). This means that the equivalent of 7% of all SMEs were Permanent non-borrowers who used a personal bank account.
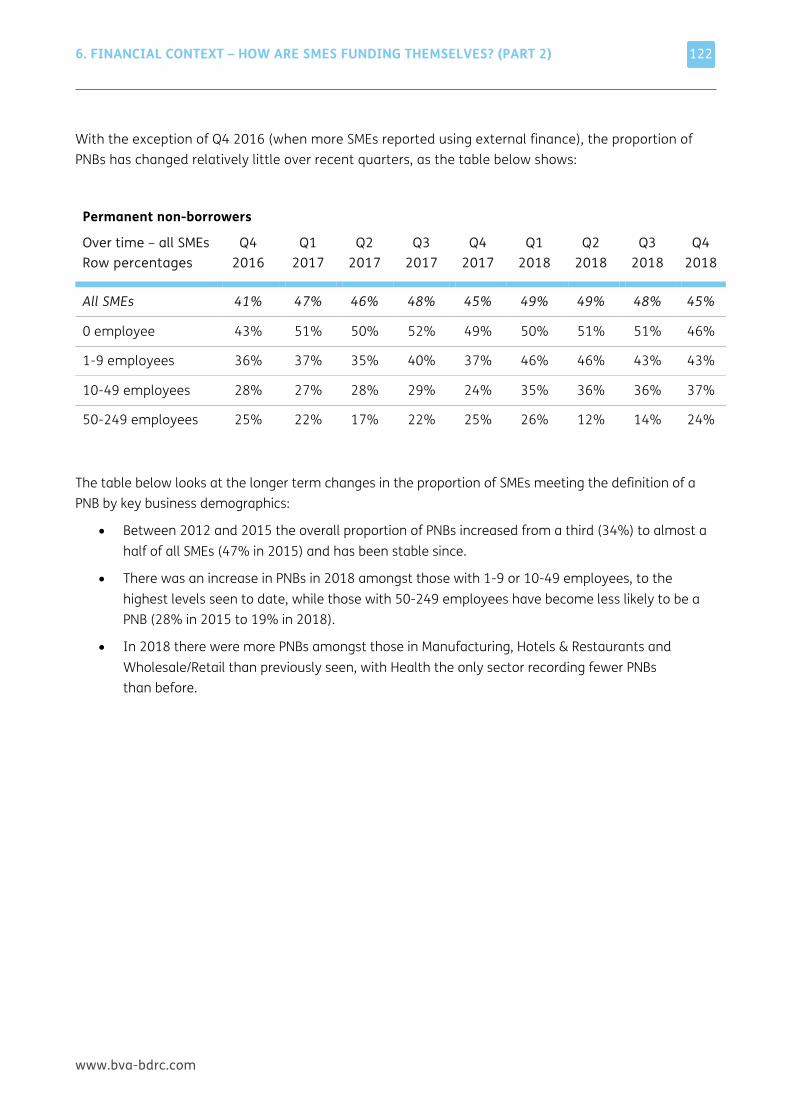
6. FINANCIAL CONTEXT – HOW ARE SMES FUNDING THEMSELVES? (PART 2)
www.bva-bdrc.com
122
With the exception of Q4 2016 (when more SMEs reported using external finance), the proportion of PNBs has changed relatively little over recent quarters, as the table below shows:
Permanent non-borrowers
Over time – all SMEs Row percentages
Q4 2016
Q1 2017
Q2 2017
Q3 2017
Q4 2017
Q1 2018
Q2 2018
Q3 2018
Q4 2018
All SMEs 41% 47% 46% 48% 45% 49% 49% 48% 45%
0 employee 43% 51% 50% 52% 49% 50% 51% 51% 46%
1-9 employees 36% 37% 35% 40% 37% 46% 46% 43% 43%
10-49 employees 28% 27% 28% 29% 24% 35% 36% 36% 37%
50-249 employees 25% 22% 17% 22% 25% 26% 12% 14% 24%
The table below looks at the longer term changes in the proportion of SMEs meeting the definition of a PNB by key business demographics:
• Between 2012 and 2015 the overall proportion of PNBs increased from a third (34%) to almost a half of all SMEs (47% in 2015) and has been stable since.
• There was an increase in PNBs in 2018 amongst those with 1-9 or 10-49 employees, to the highest levels seen to date, while those with 50-249 employees have become less likely to be a PNB (28% in 2015 to 19% in 2018).
• In 2018 there were more PNBs amongst those in Manufacturing, Hotels & Restaurants and Wholesale/Retail than previously seen, with Health the only sector recording fewer PNBs than before.
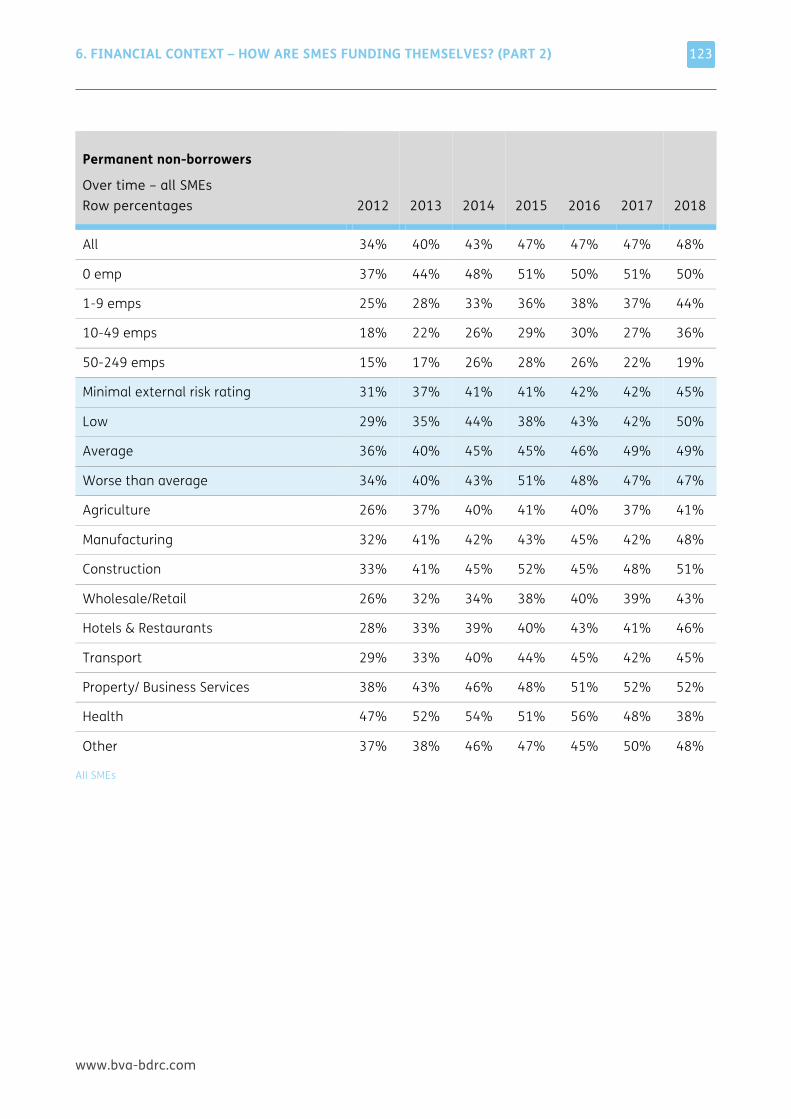
6. FINANCIAL CONTEXT – HOW ARE SMES FUNDING THEMSELVES? (PART 2)
www.bva-bdrc.com
123
Permanent non-borrowers
Over time – all SMEs Row percentages 2012 2013 2014 2015
2016 2017 2018
All 34% 40% 43% 47% 47% 47% 48%
0 emp 37% 44% 48% 51% 50% 51% 50%
1-9 emps 25% 28% 33% 36% 38% 37% 44%
10-49 emps 18% 22% 26% 29% 30% 27% 36%
50-249 emps 15% 17% 26% 28% 26% 22% 19%
Minimal external risk rating 31% 37% 41% 41% 42% 42% 45%
Low 29% 35% 44% 38% 43% 42% 50%
Average 36% 40% 45% 45% 46% 49% 49%
Worse than average 34% 40% 43% 51% 48% 47% 47%
Agriculture 26% 37% 40% 41% 40% 37% 41%
Manufacturing 32% 41% 42% 43% 45% 42% 48%
Construction 33% 41% 45% 52% 45% 48% 51%
Wholesale/Retail 26% 32% 34% 38% 40% 39% 43%
Hotels & Restaurants 28% 33% 39% 40% 43% 41% 46%
Transport 29% 33% 40% 44% 45% 42% 45%
Property/ Business Services 38% 43% 46% 48% 51% 52% 52%
Health 47% 52% 54% 51% 56% 48% 38%
Other 37% 38% 46% 47% 45% 50% 48%
All SMEs
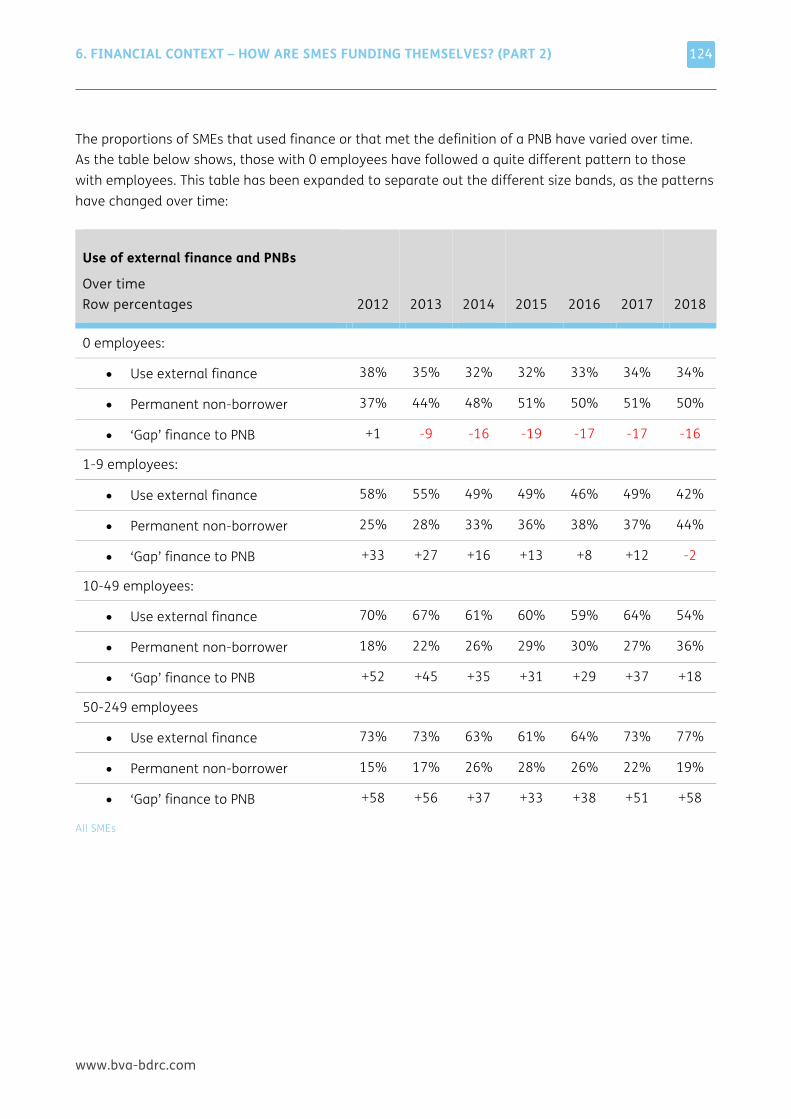
6. FINANCIAL CONTEXT – HOW ARE SMES FUNDING THEMSELVES? (PART 2)
www.bva-bdrc.com
124
The proportions of SMEs that used finance or that met the definition of a PNB have varied over time. As the table below shows, those with 0 employees have followed a quite different pattern to those with employees. This table has been expanded to separate out the different size bands, as the patterns have changed over time:
Use of external finance and PNBs
Over time Row percentages 2012 2013 2014 2015
2016 2017 2018
0 employees:
• Use external finance 38% 35% 32% 32% 33% 34% 34%
• Permanent non-borrower 37% 44% 48% 51% 50% 51% 50%
• ‘Gap’ finance to PNB +1 -9 -16 -19 -17 -17 -16
1-9 employees:
• Use external finance 58% 55% 49% 49% 46% 49% 42%
• Permanent non-borrower 25% 28% 33% 36% 38% 37% 44%
• ‘Gap’ finance to PNB +33 +27 +16 +13 +8 +12 -2
10-49 employees:
• Use external finance 70% 67% 61% 60% 59% 64% 54%
• Permanent non-borrower 18% 22% 26% 29% 30% 27% 36%
• ‘Gap’ finance to PNB +52 +45 +35 +31 +29 +37 +18
50-249 employees
• Use external finance 73% 73% 63% 61% 64% 73% 77%
• Permanent non-borrower 15% 17% 26% 28% 26% 22% 19%
• ‘Gap’ finance to PNB +58 +56 +37 +33 +38 +51 +58
All SMEs
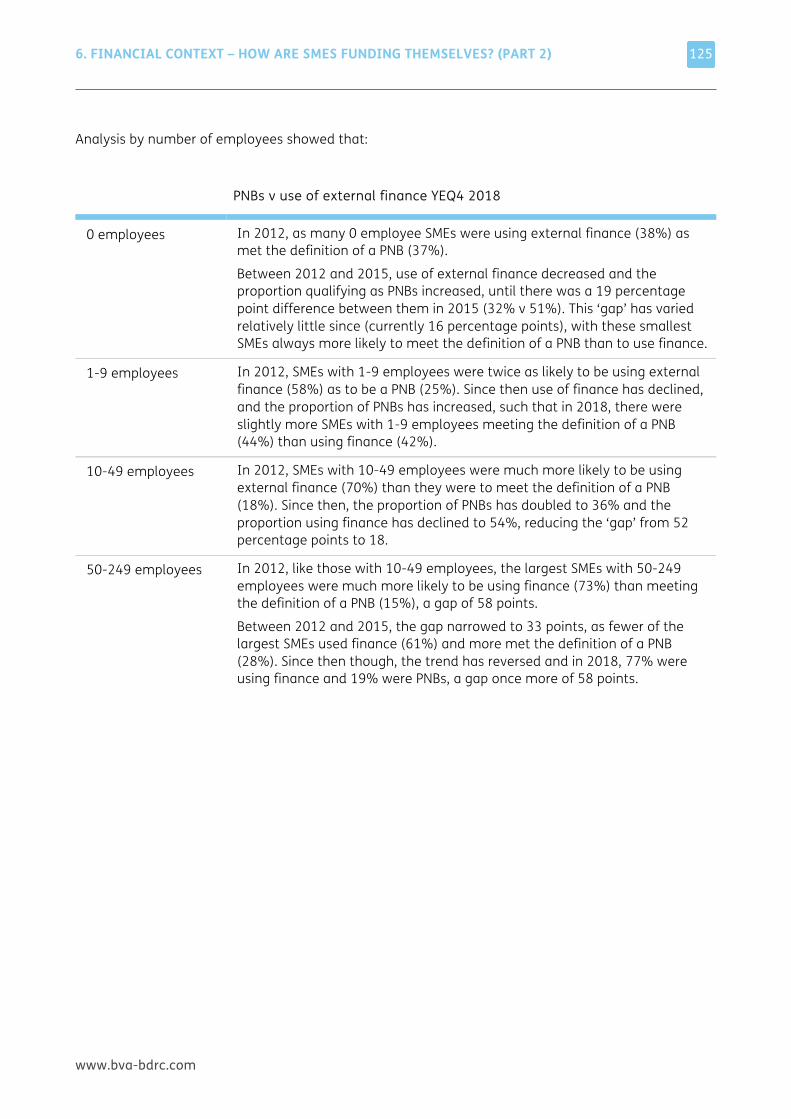
6. FINANCIAL CONTEXT – HOW ARE SMES FUNDING THEMSELVES? (PART 2)
www.bva-bdrc.com
125
Analysis by number of employees showed that:
PNBs v use of external finance YEQ4 2018
0 employees In 2012, as many 0 employee SMEs were using external finance (38%) as met the definition of a PNB (37%).
Between 2012 and 2015, use of external finance decreased and the proportion qualifying as PNBs increased, until there was a 19 percentage point difference between them in 2015 (32% v 51%). This ‘gap’ has varied relatively little since (currently 16 percentage points), with these smallest SMEs always more likely to meet the definition of a PNB than to use finance.
1-9 employees In 2012, SMEs with 1-9 employees were twice as likely to be using external finance (58%) as to be a PNB (25%). Since then use of finance has declined, and the proportion of PNBs has increased, such that in 2018, there were slightly more SMEs with 1-9 employees meeting the definition of a PNB (44%) than using finance (42%).
10-49 employees In 2012, SMEs with 10-49 employees were much more likely to be using external finance (70%) than they were to meet the definition of a PNB (18%). Since then, the proportion of PNBs has doubled to 36% and the proportion using finance has declined to 54%, reducing the ‘gap’ from 52 percentage points to 18.
50-249 employees In 2012, like those with 10-49 employees, the largest SMEs with 50-249 employees were much more likely to be using finance (73%) than meeting the definition of a PNB (15%), a gap of 58 points.
Between 2012 and 2015, the gap narrowed to 33 points, as fewer of the largest SMEs used finance (61%) and more met the definition of a PNB (28%). Since then though, the trend has reversed and in 2018, 77% were using finance and 19% were PNBs, a gap once more of 58 points.
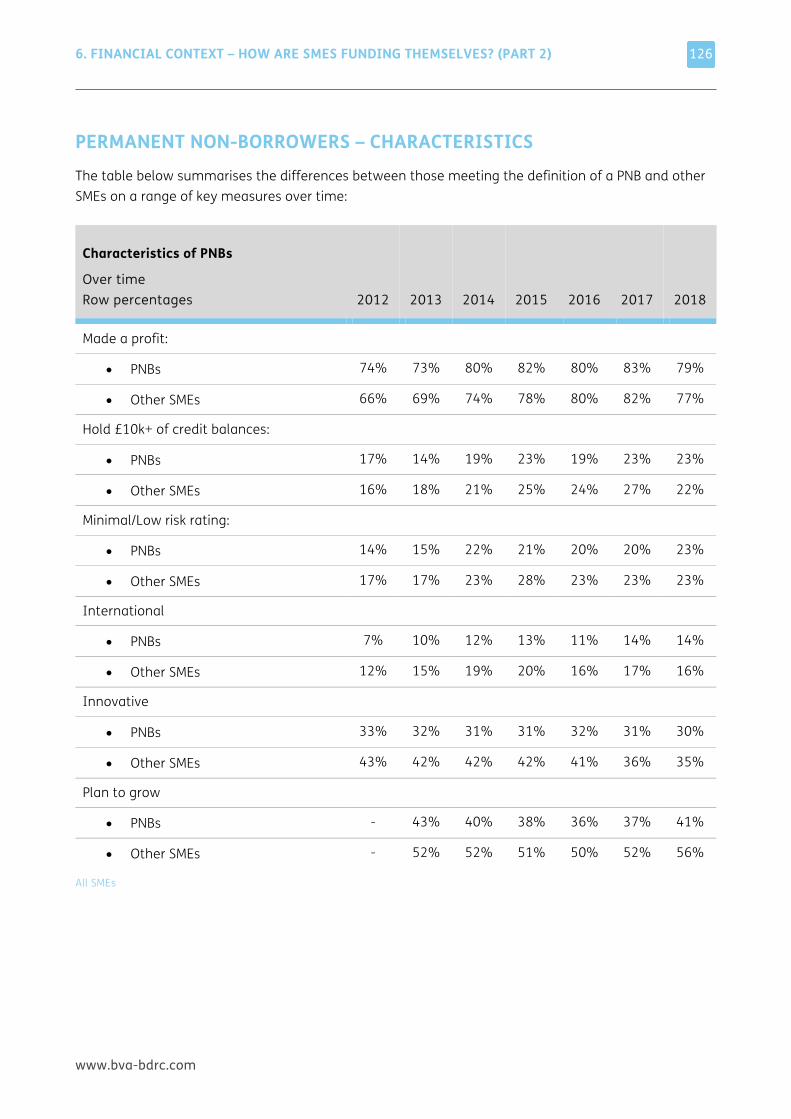
6. FINANCIAL CONTEXT – HOW ARE SMES FUNDING THEMSELVES? (PART 2)
www.bva-bdrc.com
126
PERMANENT NON-BORROWERS – CHARACTERISTICS The table below summarises the differences between those meeting the definition of a PNB and other SMEs on a range of key measures over time:
Characteristics of PNBs
Over time Row percentages 2012 2013 2014 2015
2016 2017 2018
Made a profit:
• PNBs 74% 73% 80% 82% 80% 83% 79%
• Other SMEs 66% 69% 74% 78% 80% 82% 77%
Hold £10k+ of credit balances:
• PNBs 17% 14% 19% 23% 19% 23% 23%
• Other SMEs 16% 18% 21% 25% 24% 27% 22%
Minimal/Low risk rating:
• PNBs 14% 15% 22% 21% 20% 20% 23%
• Other SMEs 17% 17% 23% 28% 23% 23% 23%
International
• PNBs 7% 10% 12% 13% 11% 14% 14%
• Other SMEs 12% 15% 19% 20% 16% 17% 16%
Innovative
• PNBs 33% 32% 31% 31% 32% 31% 30%
• Other SMEs 43% 42% 42% 42% 41% 36% 35%
Plan to grow
• PNBs - 43% 40% 38% 36% 37% 41%
• Other SMEs - 52% 52% 51% 50% 52% 56%
All SMEs
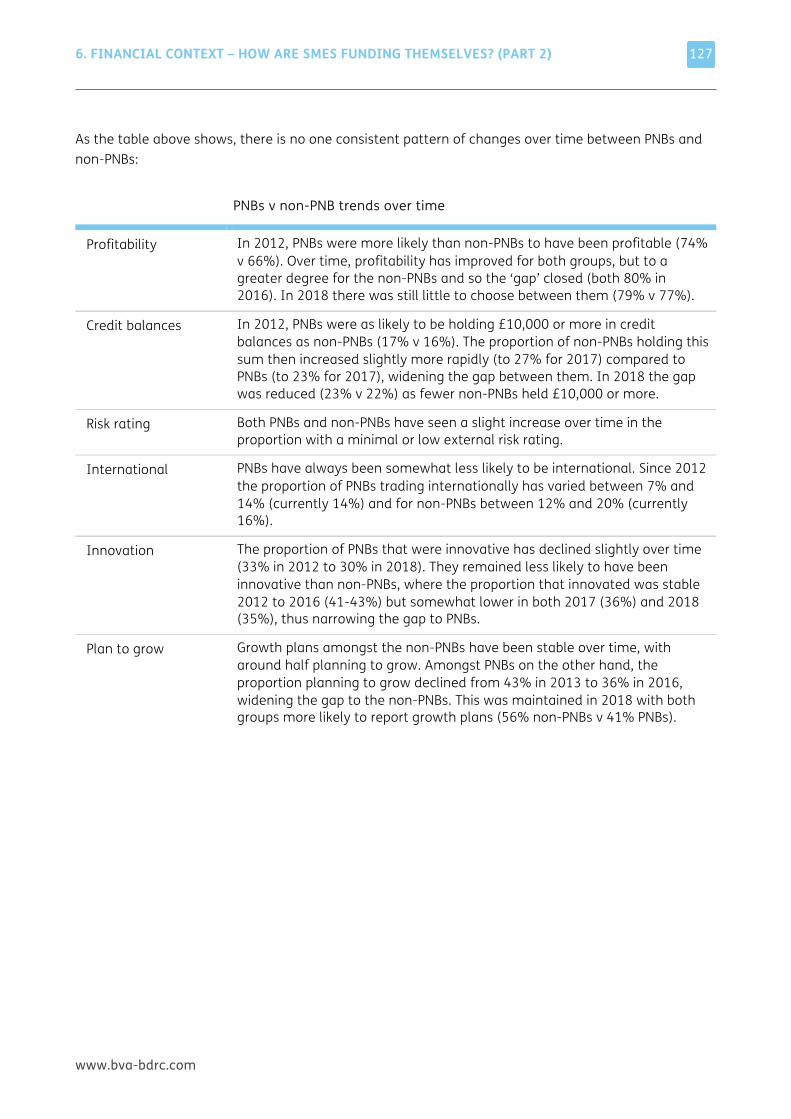
6. FINANCIAL CONTEXT – HOW ARE SMES FUNDING THEMSELVES? (PART 2)
www.bva-bdrc.com
127
As the table above shows, there is no one consistent pattern of changes over time between PNBs and non-PNBs:
PNBs v non-PNB trends over time
Profitability In 2012, PNBs were more likely than non-PNBs to have been profitable (74% v 66%). Over time, profitability has improved for both groups, but to a greater degree for the non-PNBs and so the ‘gap’ closed (both 80% in 2016). In 2018 there was still little to choose between them (79% v 77%).
Credit balances In 2012, PNBs were as likely to be holding £10,000 or more in credit balances as non-PNBs (17% v 16%). The proportion of non-PNBs holding this sum then increased slightly more rapidly (to 27% for 2017) compared to PNBs (to 23% for 2017), widening the gap between them. In 2018 the gap was reduced (23% v 22%) as fewer non-PNBs held £10,000 or more.
Risk rating Both PNBs and non-PNBs have seen a slight increase over time in the proportion with a minimal or low external risk rating.
International PNBs have always been somewhat less likely to be international. Since 2012 the proportion of PNBs trading internationally has varied between 7% and 14% (currently 14%) and for non-PNBs between 12% and 20% (currently 16%).
Innovation The proportion of PNBs that were innovative has declined slightly over time (33% in 2012 to 30% in 2018). They remained less likely to have been innovative than non-PNBs, where the proportion that innovated was stable 2012 to 2016 (41-43%) but somewhat lower in both 2017 (36%) and 2018 (35%), thus narrowing the gap to PNBs.
Plan to grow Growth plans amongst the non-PNBs have been stable over time, with around half planning to grow. Amongst PNBs on the other hand, the proportion planning to grow declined from 43% in 2013 to 36% in 2016, widening the gap to the non-PNBs. This was maintained in 2018 with both groups more likely to report growth plans (56% non-PNBs v 41% PNBs).
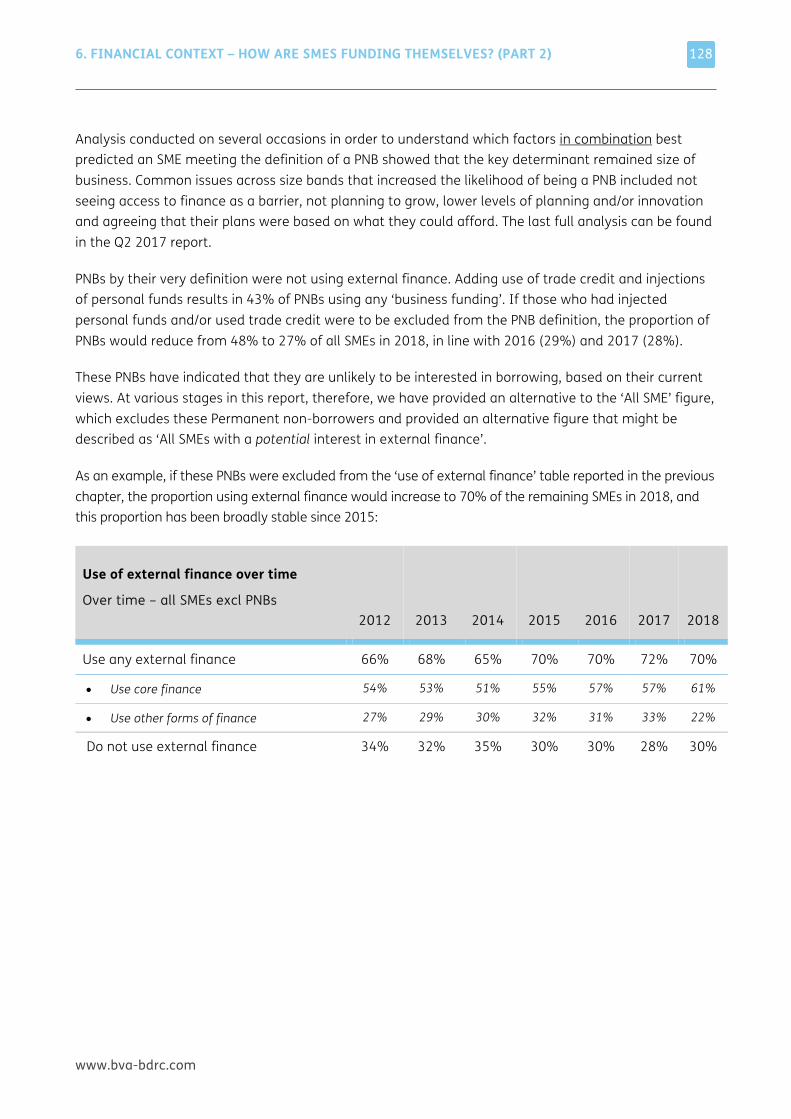
6. FINANCIAL CONTEXT – HOW ARE SMES FUNDING THEMSELVES? (PART 2)
www.bva-bdrc.com
128
Analysis conducted on several occasions in order to understand which factors in combination best predicted an SME meeting the definition of a PNB showed that the key determinant remained size of business. Common issues across size bands that increased the likelihood of being a PNB included not seeing access to finance as a barrier, not planning to grow, lower levels of planning and/or innovation and agreeing that their plans were based on what they could afford. The last full analysis can be found in the Q2 2017 report.
PNBs by their very definition were not using external finance. Adding use of trade credit and injections of personal funds results in 43% of PNBs using any ‘business funding’. If those who had injected personal funds and/or used trade credit were to be excluded from the PNB definition, the proportion of PNBs would reduce from 48% to 27% of all SMEs in 2018, in line with 2016 (29%) and 2017 (28%).
These PNBs have indicated that they are unlikely to be interested in borrowing, based on their current views. At various stages in this report, therefore, we have provided an alternative to the ‘All SME’ figure, which excludes these Permanent non-borrowers and provided an alternative figure that might be described as ‘All SMEs with a potential interest in external finance’.
As an example, if these PNBs were excluded from the ‘use of external finance’ table reported in the previous chapter, the proportion using external finance would increase to 70% of the remaining SMEs in 2018, and this proportion has been broadly stable since 2015:
Use of external finance over time
Over time – all SMEs excl PNBs 2012 2013 2014 2015
2016 2017 2018
Use any external finance 66% 68% 65% 70% 70% 72% 70%
• Use core finance 54% 53% 51% 55% 57% 57% 61%
• Use other forms of finance 27% 29% 30% 32% 31% 33% 22%
Do not use external finance 34% 32% 35% 30% 30% 28% 30%
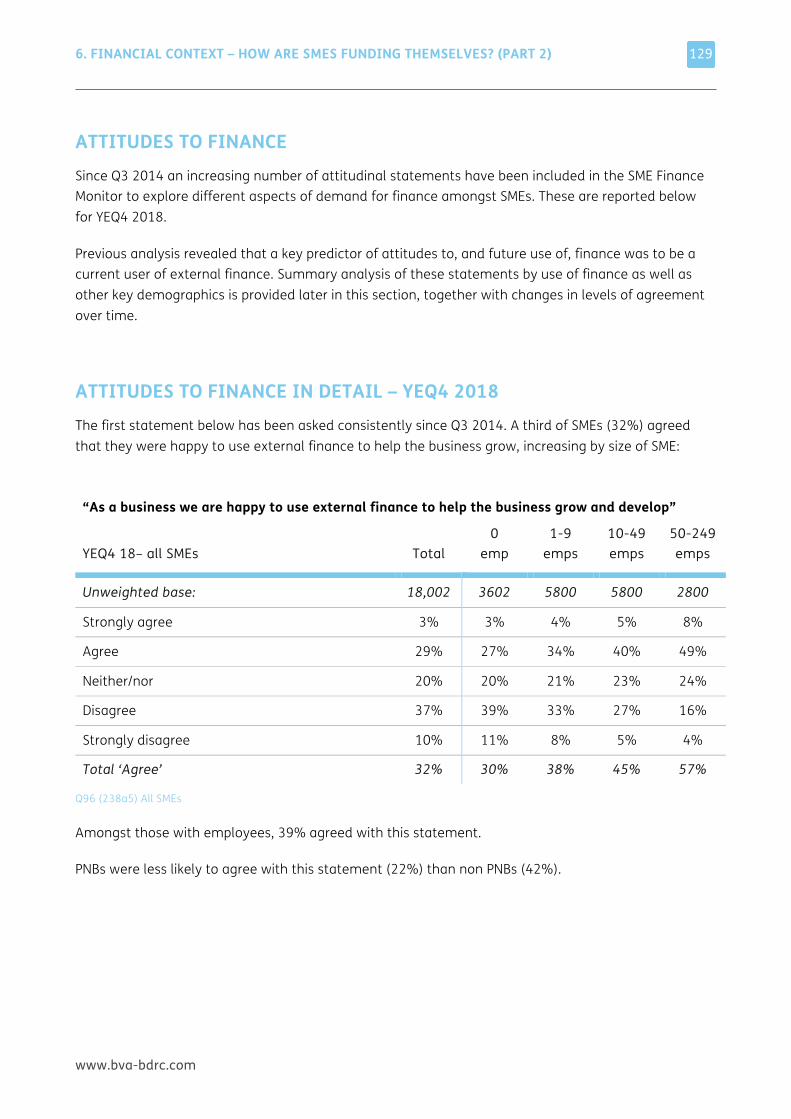
6. FINANCIAL CONTEXT – HOW ARE SMES FUNDING THEMSELVES? (PART 2)
www.bva-bdrc.com
129
ATTITUDES TO FINANCE Since Q3 2014 an increasing number of attitudinal statements have been included in the SME Finance Monitor to explore different aspects of demand for finance amongst SMEs. These are reported below for YEQ4 2018.
Previous analysis revealed that a key predictor of attitudes to, and future use of, finance was to be a current user of external finance. Summary analysis of these statements by use of finance as well as other key demographics is provided later in this section, together with changes in levels of agreement over time.
ATTITUDES TO FINANCE IN DETAIL – YEQ4 2018 The first statement below has been asked consistently since Q3 2014. A third of SMEs (32%) agreed that they were happy to use external finance to help the business grow, increasing by size of SME:
“As a business we are happy to use external finance to help the business grow and develop”
YEQ4 18– all SMEs Total 0
emp 1-9
emps 10-49 emps
50-249 emps
Unweighted base: 18,002 3602 5800 5800 2800
Strongly agree 3% 3% 4% 5% 8%
Agree 29% 27% 34% 40% 49%
Neither/nor 20% 20% 21% 23% 24%
Disagree 37% 39% 33% 27% 16%
Strongly disagree 10% 11% 8% 5% 4%
Total ‘Agree’ 32% 30% 38% 45% 57%
Q96 (238a5) All SMEs
Amongst those with employees, 39% agreed with this statement.
PNBs were less likely to agree with this statement (22%) than non PNBs (42%).
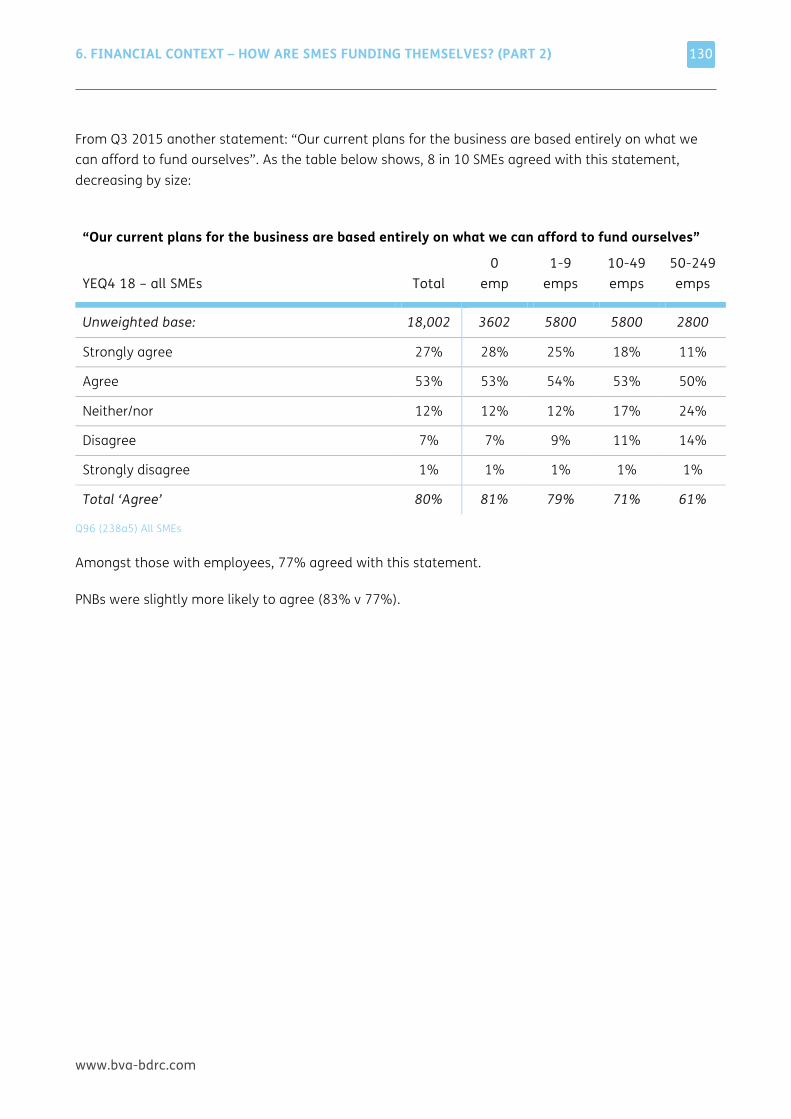
6. FINANCIAL CONTEXT – HOW ARE SMES FUNDING THEMSELVES? (PART 2)
www.bva-bdrc.com
130
From Q3 2015 another statement: “Our current plans for the business are based entirely on what we can afford to fund ourselves”. As the table below shows, 8 in 10 SMEs agreed with this statement, decreasing by size:
“Our current plans for the business are based entirely on what we can afford to fund ourselves”
YEQ4 18 – all SMEs Total 0
emp 1-9
emps 10-49 emps
50-249 emps
Unweighted base: 18,002 3602 5800 5800 2800
Strongly agree 27% 28% 25% 18% 11%
Agree 53% 53% 54% 53% 50%
Neither/nor 12% 12% 12% 17% 24%
Disagree 7% 7% 9% 11% 14%
Strongly disagree 1% 1% 1% 1% 1%
Total ‘Agree’ 80% 81% 79% 71% 61%
Q96 (238a5) All SMEs
Amongst those with employees, 77% agreed with this statement.
PNBs were slightly more likely to agree (83% v 77%).
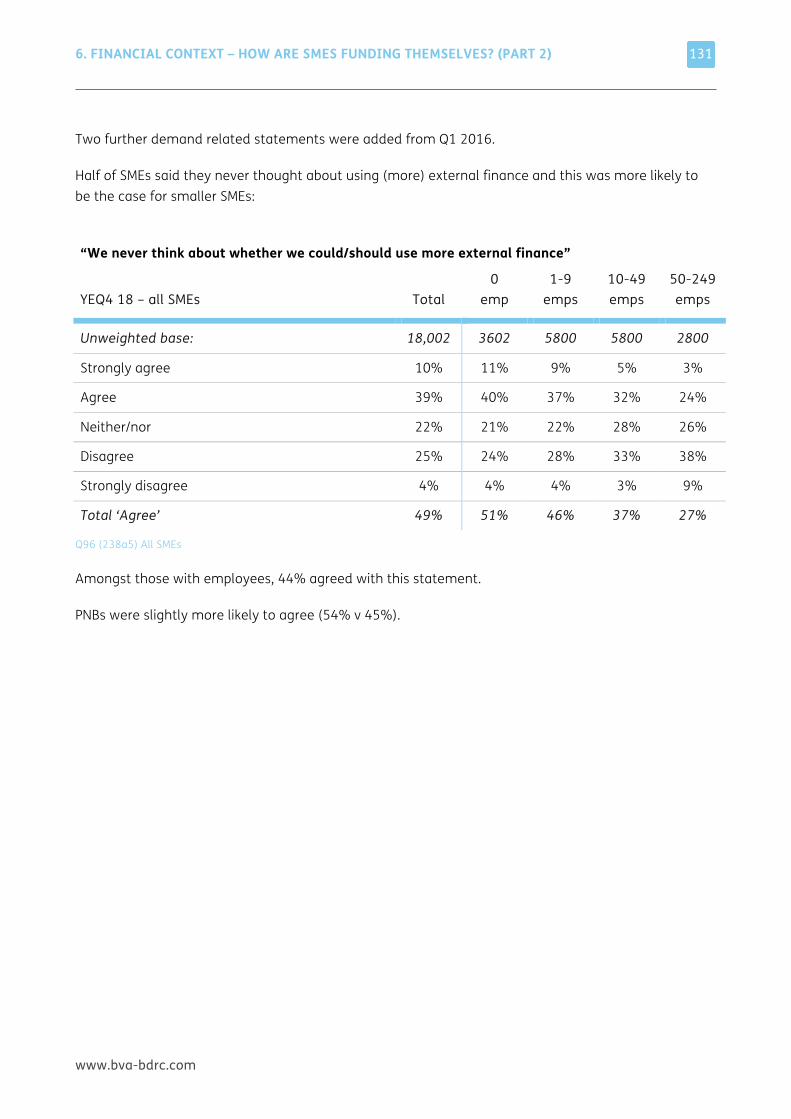
6. FINANCIAL CONTEXT – HOW ARE SMES FUNDING THEMSELVES? (PART 2)
www.bva-bdrc.com
131
Two further demand related statements were added from Q1 2016.
Half of SMEs said they never thought about using (more) external finance and this was more likely to be the case for smaller SMEs:
“We never think about whether we could/should use more external finance”
YEQ4 18 – all SMEs Total 0
emp 1-9
emps 10-49 emps
50-249 emps
Unweighted base: 18,002 3602 5800 5800 2800
Strongly agree 10% 11% 9% 5% 3%
Agree 39% 40% 37% 32% 24%
Neither/nor 22% 21% 22% 28% 26%
Disagree 25% 24% 28% 33% 38%
Strongly disagree 4% 4% 4% 3% 9%
Total ‘Agree’ 49% 51% 46% 37% 27%
Q96 (238a5) All SMEs
Amongst those with employees, 44% agreed with this statement.
PNBs were slightly more likely to agree (54% v 45%).
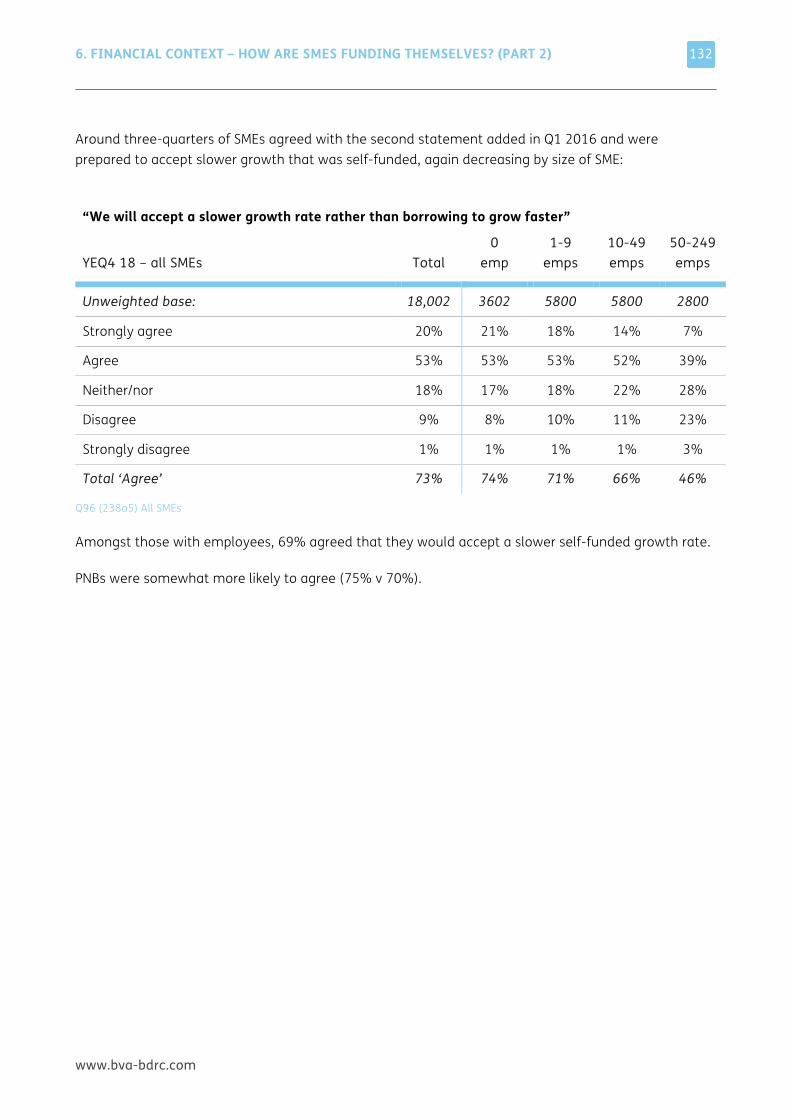
6. FINANCIAL CONTEXT – HOW ARE SMES FUNDING THEMSELVES? (PART 2)
www.bva-bdrc.com
132
Around three-quarters of SMEs agreed with the second statement added in Q1 2016 and were prepared to accept slower growth that was self-funded, again decreasing by size of SME:
“We will accept a slower growth rate rather than borrowing to grow faster”
YEQ4 18 – all SMEs Total 0
emp 1-9
emps 10-49 emps
50-249 emps
Unweighted base: 18,002 3602 5800 5800 2800
Strongly agree 20% 21% 18% 14% 7%
Agree 53% 53% 53% 52% 39%
Neither/nor 18% 17% 18% 22% 28%
Disagree 9% 8% 10% 11% 23%
Strongly disagree 1% 1% 1% 1% 3%
Total ‘Agree’ 73% 74% 71% 66% 46%
Q96 (238a5) All SMEs
Amongst those with employees, 69% agreed that they would accept a slower self-funded growth rate.
PNBs were somewhat more likely to agree (75% v 70%).
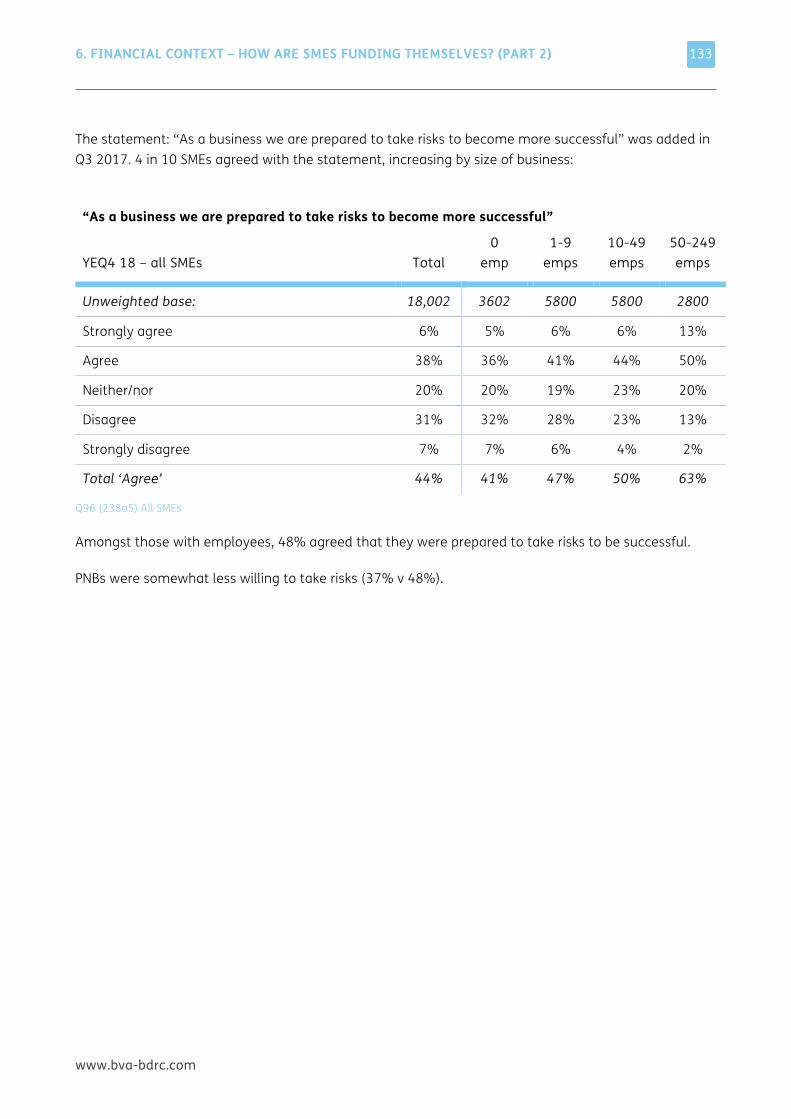
6. FINANCIAL CONTEXT – HOW ARE SMES FUNDING THEMSELVES? (PART 2)
www.bva-bdrc.com
133
The statement: “As a business we are prepared to take risks to become more successful” was added in Q3 2017. 4 in 10 SMEs agreed with the statement, increasing by size of business:
“As a business we are prepared to take risks to become more successful”
YEQ4 18 – all SMEs Total 0
emp 1-9
emps 10-49 emps
50-249 emps
Unweighted base: 18,002 3602 5800 5800 2800
Strongly agree 6% 5% 6% 6% 13%
Agree 38% 36% 41% 44% 50%
Neither/nor 20% 20% 19% 23% 20%
Disagree 31% 32% 28% 23% 13%
Strongly disagree 7% 7% 6% 4% 2%
Total ‘Agree’ 44% 41% 47% 50% 63%
Q96 (238a5) All SMEs
Amongst those with employees, 48% agreed that they were prepared to take risks to be successful.
PNBs were somewhat less willing to take risks (37% v 48%).
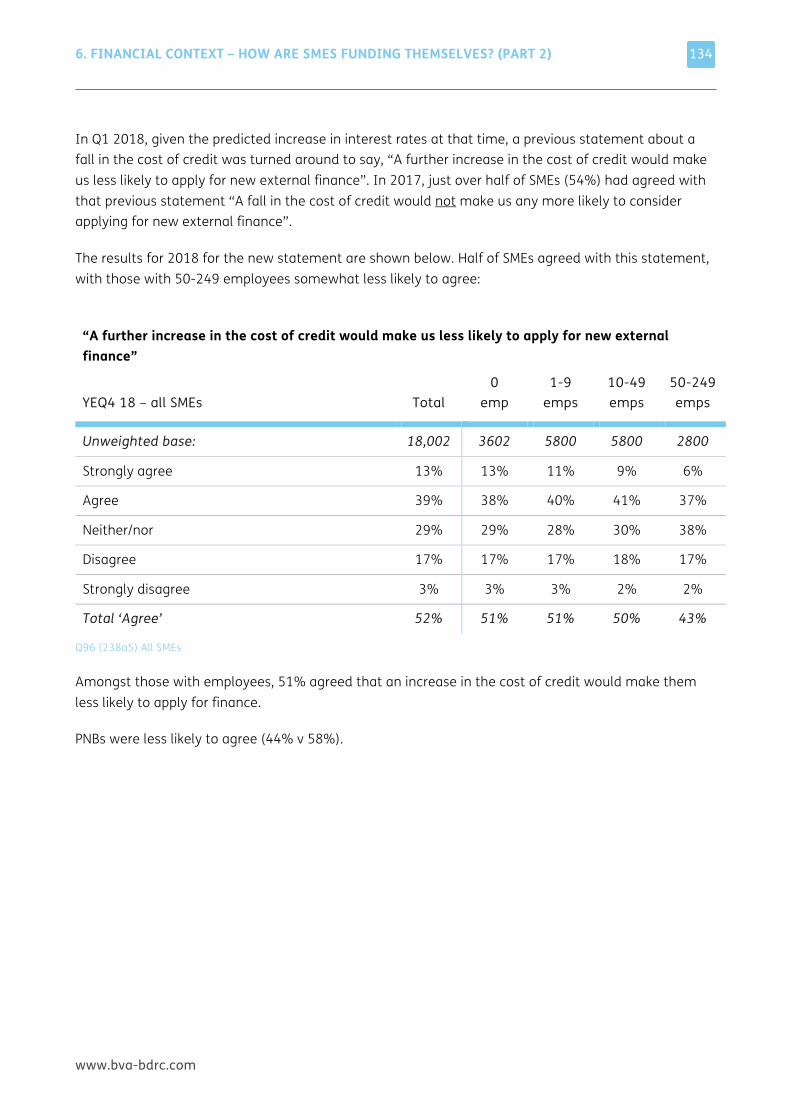
6. FINANCIAL CONTEXT – HOW ARE SMES FUNDING THEMSELVES? (PART 2)
www.bva-bdrc.com
134
In Q1 2018, given the predicted increase in interest rates at that time, a previous statement about a fall in the cost of credit was turned around to say, “A further increase in the cost of credit would make us less likely to apply for new external finance”. In 2017, just over half of SMEs (54%) had agreed with that previous statement “A fall in the cost of credit would not make us any more likely to consider applying for new external finance”.
The results for 2018 for the new statement are shown below. Half of SMEs agreed with this statement, with those with 50-249 employees somewhat less likely to agree:
“A further increase in the cost of credit would make us less likely to apply for new external finance”
YEQ4 18 – all SMEs Total 0
emp 1-9
emps 10-49 emps
50-249 emps
Unweighted base: 18,002 3602 5800 5800 2800
Strongly agree 13% 13% 11% 9% 6%
Agree 39% 38% 40% 41% 37%
Neither/nor 29% 29% 28% 30% 38%
Disagree 17% 17% 17% 18% 17%
Strongly disagree 3% 3% 3% 2% 2%
Total ‘Agree’ 52% 51% 51% 50% 43%
Q96 (238a5) All SMEs
Amongst those with employees, 51% agreed that an increase in the cost of credit would make them less likely to apply for finance.
PNBs were less likely to agree (44% v 58%).

6. FINANCIAL CONTEXT – HOW ARE SMES FUNDING THEMSELVES? (PART 2)
www.bva-bdrc.com
135
Two further statements were added in Q1 2018. The first was “Because the future feels uncertain we are being very cautious with our plans for the business”. Half of SMEs agreed with the statement, with little variation by size of SME:
“Because the future feels uncertain we are being very cautious with our plans for the business”
YEQ4 18 – all SMEs Total 0
emp 1-9
emps 10-49 emps
50-249 emps
Unweighted base: 18,002 3602 5800 5800 2800
Strongly agree 12% 13% 11% 10% 7%
Agree 41% 41% 43% 41% 39%
Neither/nor 22% 22% 22% 24% 35%
Disagree 22% 22% 22% 22% 18%
Strongly disagree 2% 2% 2% 2% 2%
Total ‘Agree’ 53% 54% 54% 51% 46%
Q96 (238a5) All SMEs from Q1 2018
Amongst those with employees, 53% agreed that they were being cautious with their plans.
PNBs were less likely to agree (48% v 59%).
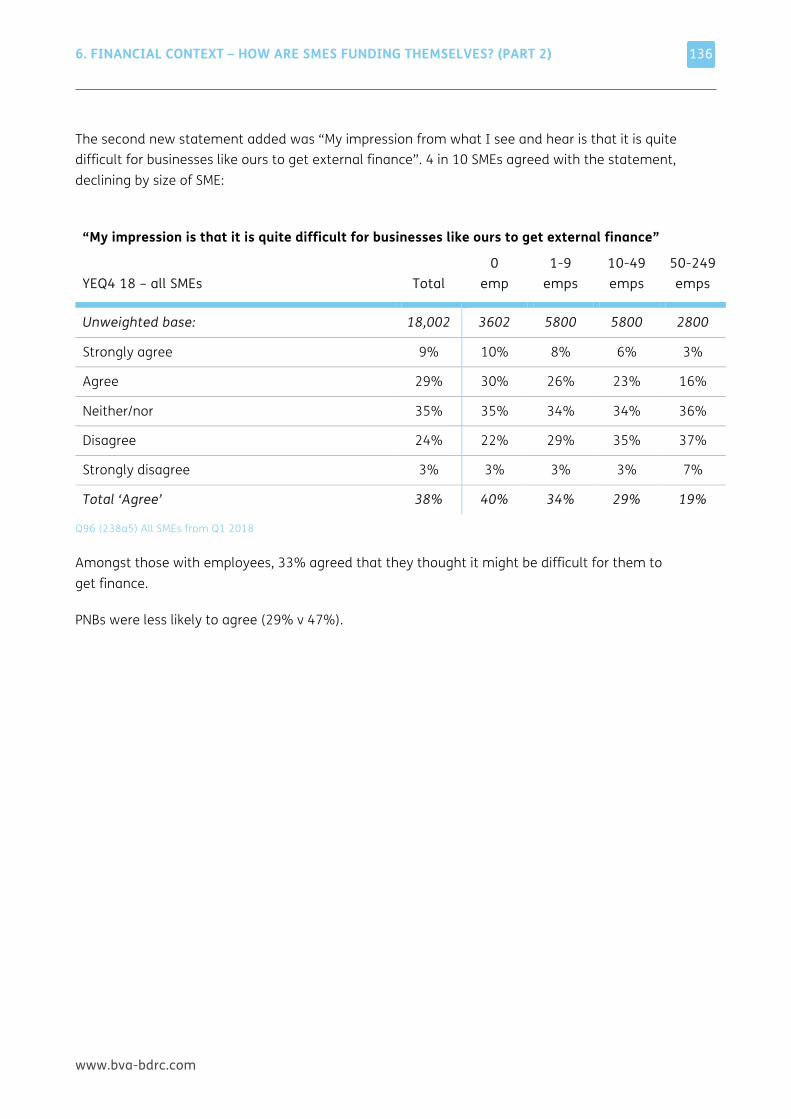
6. FINANCIAL CONTEXT – HOW ARE SMES FUNDING THEMSELVES? (PART 2)
www.bva-bdrc.com
136
The second new statement added was “My impression from what I see and hear is that it is quite difficult for businesses like ours to get external finance”. 4 in 10 SMEs agreed with the statement, declining by size of SME:
“My impression is that it is quite difficult for businesses like ours to get external finance”
YEQ4 18 – all SMEs Total 0
emp 1-9
emps 10-49 emps
50-249 emps
Unweighted base: 18,002 3602 5800 5800 2800
Strongly agree 9% 10% 8% 6% 3%
Agree 29% 30% 26% 23% 16%
Neither/nor 35% 35% 34% 34% 36%
Disagree 24% 22% 29% 35% 37%
Strongly disagree 3% 3% 3% 3% 7%
Total ‘Agree’ 38% 40% 34% 29% 19%
Q96 (238a5) All SMEs from Q1 2018
Amongst those with employees, 33% agreed that they thought it might be difficult for them to get finance.
PNBs were less likely to agree (29% v 47%).
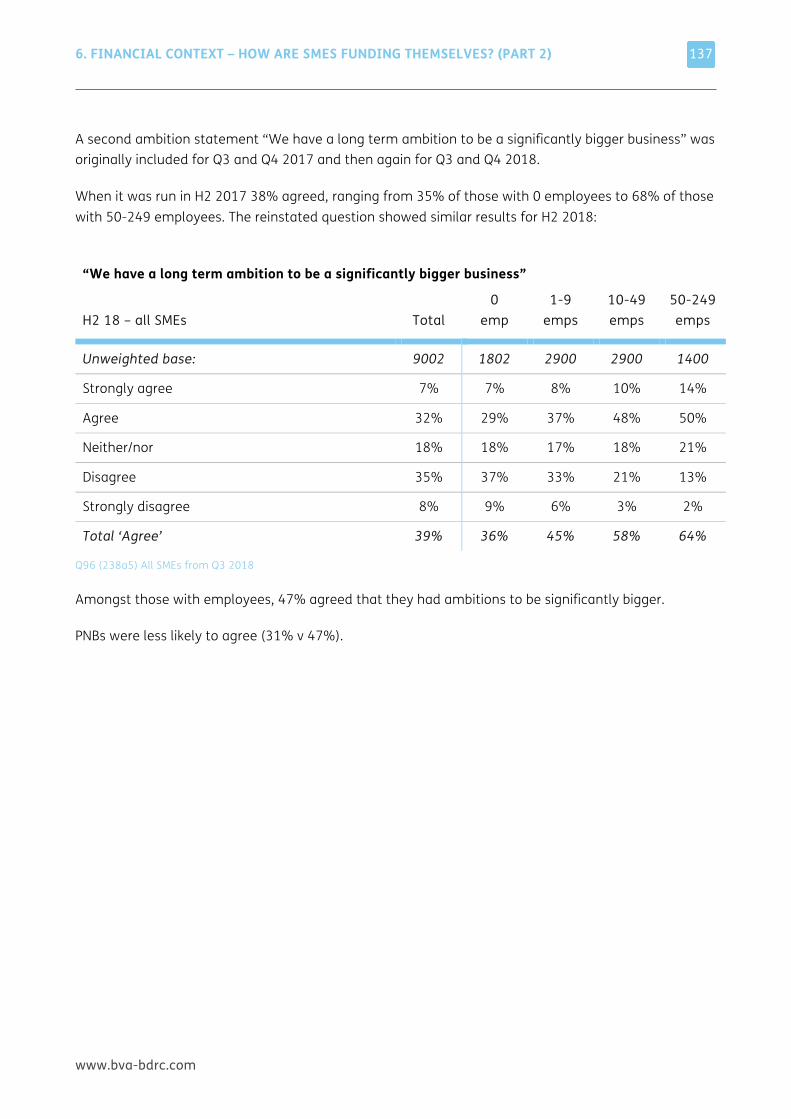
6. FINANCIAL CONTEXT – HOW ARE SMES FUNDING THEMSELVES? (PART 2)
www.bva-bdrc.com
137
A second ambition statement “We have a long term ambition to be a significantly bigger business” was originally included for Q3 and Q4 2017 and then again for Q3 and Q4 2018.
When it was run in H2 2017 38% agreed, ranging from 35% of those with 0 employees to 68% of those with 50-249 employees. The reinstated question showed similar results for H2 2018:
“We have a long term ambition to be a significantly bigger business”
H2 18 – all SMEs Total 0
emp 1-9
emps 10-49 emps
50-249 emps
Unweighted base: 9002 1802 2900 2900 1400
Strongly agree 7% 7% 8% 10% 14%
Agree 32% 29% 37% 48% 50%
Neither/nor 18% 18% 17% 18% 21%
Disagree 35% 37% 33% 21% 13%
Strongly disagree 8% 9% 6% 3% 2%
Total ‘Agree’ 39% 36% 45% 58% 64%
Q96 (238a5) All SMEs from Q3 2018
Amongst those with employees, 47% agreed that they had ambitions to be significantly bigger.
PNBs were less likely to agree (31% v 47%).
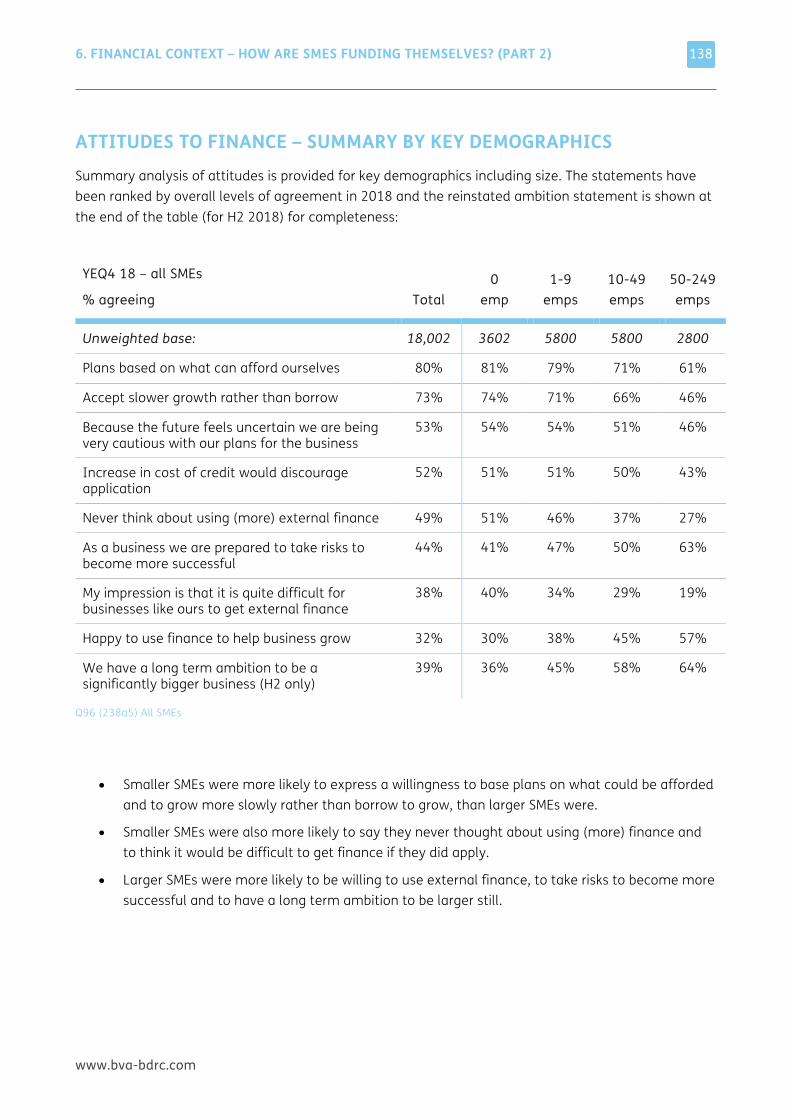
6. FINANCIAL CONTEXT – HOW ARE SMES FUNDING THEMSELVES? (PART 2)
www.bva-bdrc.com
138
ATTITUDES TO FINANCE – SUMMARY BY KEY DEMOGRAPHICS Summary analysis of attitudes is provided for key demographics including size. The statements have been ranked by overall levels of agreement in 2018 and the reinstated ambition statement is shown at the end of the table (for H2 2018) for completeness:
YEQ4 18 – all SMEs
% agreeing Total 0
emp 1-9
emps 10-49 emps
50-249 emps
Unweighted base: 18,002 3602 5800 5800 2800
Plans based on what can afford ourselves 80% 81% 79% 71% 61%
Accept slower growth rather than borrow 73% 74% 71% 66% 46%
Because the future feels uncertain we are being very cautious with our plans for the business
53% 54% 54% 51% 46%
Increase in cost of credit would discourage application
52% 51% 51% 50% 43%
Never think about using (more) external finance 49% 51% 46% 37% 27%
As a business we are prepared to take risks to become more successful
44% 41% 47% 50% 63%
My impression is that it is quite difficult for businesses like ours to get external finance
38% 40% 34% 29% 19%
Happy to use finance to help business grow 32% 30% 38% 45% 57%
We have a long term ambition to be a significantly bigger business (H2 only)
39% 36% 45% 58% 64%
Q96 (238a5) All SMEs
• Smaller SMEs were more likely to express a willingness to base plans on what could be afforded and to grow more slowly rather than borrow to grow, than larger SMEs were.
• Smaller SMEs were also more likely to say they never thought about using (more) finance and to think it would be difficult to get finance if they did apply.
• Larger SMEs were more likely to be willing to use external finance, to take risks to become more successful and to have a long term ambition to be larger still.
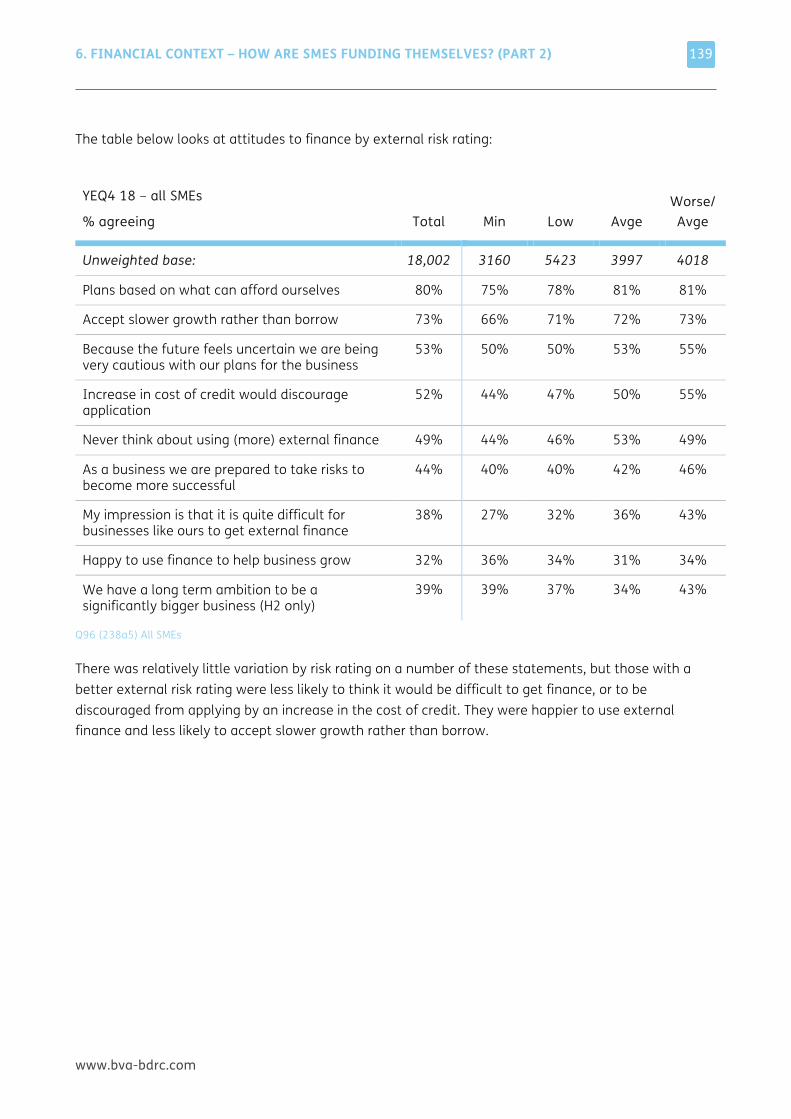
6. FINANCIAL CONTEXT – HOW ARE SMES FUNDING THEMSELVES? (PART 2)
www.bva-bdrc.com
139
The table below looks at attitudes to finance by external risk rating:
YEQ4 18 – all SMEs
% agreeing Total Min Low Avge Worse/
Avge
Unweighted base: 18,002 3160 5423 3997 4018
Plans based on what can afford ourselves 80% 75% 78% 81% 81%
Accept slower growth rather than borrow 73% 66% 71% 72% 73%
Because the future feels uncertain we are being very cautious with our plans for the business
53% 50% 50% 53% 55%
Increase in cost of credit would discourage application
52% 44% 47% 50% 55%
Never think about using (more) external finance 49% 44% 46% 53% 49%
As a business we are prepared to take risks to become more successful
44% 40% 40% 42% 46%
My impression is that it is quite difficult for businesses like ours to get external finance
38% 27% 32% 36% 43%
Happy to use finance to help business grow 32% 36% 34% 31% 34%
We have a long term ambition to be a significantly bigger business (H2 only)
39% 39% 37% 34% 43%
Q96 (238a5) All SMEs
There was relatively little variation by risk rating on a number of these statements, but those with a better external risk rating were less likely to think it would be difficult to get finance, or to be discouraged from applying by an increase in the cost of credit. They were happier to use external finance and less likely to accept slower growth rather than borrow.
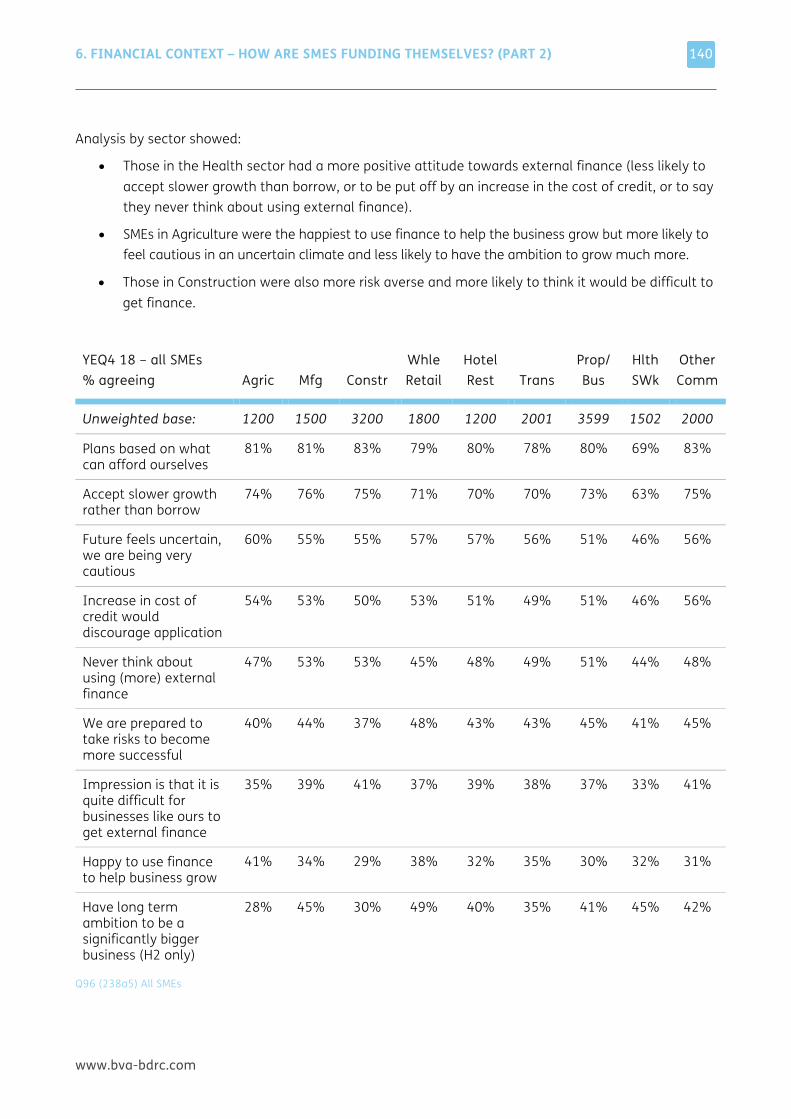
6. FINANCIAL CONTEXT – HOW ARE SMES FUNDING THEMSELVES? (PART 2)
www.bva-bdrc.com
140
Analysis by sector showed:
• Those in the Health sector had a more positive attitude towards external finance (less likely to accept slower growth than borrow, or to be put off by an increase in the cost of credit, or to say they never think about using external finance).
• SMEs in Agriculture were the happiest to use finance to help the business grow but more likely to feel cautious in an uncertain climate and less likely to have the ambition to grow much more.
• Those in Construction were also more risk averse and more likely to think it would be difficult to get finance.
YEQ4 18 – all SMEs % agreeing Agric Mfg Constr
Whle Retail
Hotel Rest Trans
Prop/ Bus
Hlth SWk
Other Comm
Unweighted base: 1200 1500 3200 1800 1200 2001 3599 1502 2000
Plans based on what can afford ourselves
81% 81% 83% 79% 80% 78% 80% 69% 83%
Accept slower growth rather than borrow
74% 76% 75% 71% 70% 70% 73% 63% 75%
Future feels uncertain, we are being very cautious
60% 55% 55% 57% 57% 56% 51% 46% 56%
Increase in cost of credit would discourage application
54% 53% 50% 53% 51% 49% 51% 46% 56%
Never think about using (more) external finance
47% 53% 53% 45% 48% 49% 51% 44% 48%
We are prepared to take risks to become more successful
40% 44% 37% 48% 43% 43% 45% 41% 45%
Impression is that it is quite difficult for businesses like ours to get external finance
35% 39% 41% 37% 39% 38% 37% 33% 41%
Happy to use finance to help business grow
41% 34% 29% 38% 32% 35% 30% 32% 31%
Have long term ambition to be a significantly bigger business (H2 only)
28% 45% 30% 49% 40% 35% 41% 45% 42%
Q96 (238a5) All SMEs
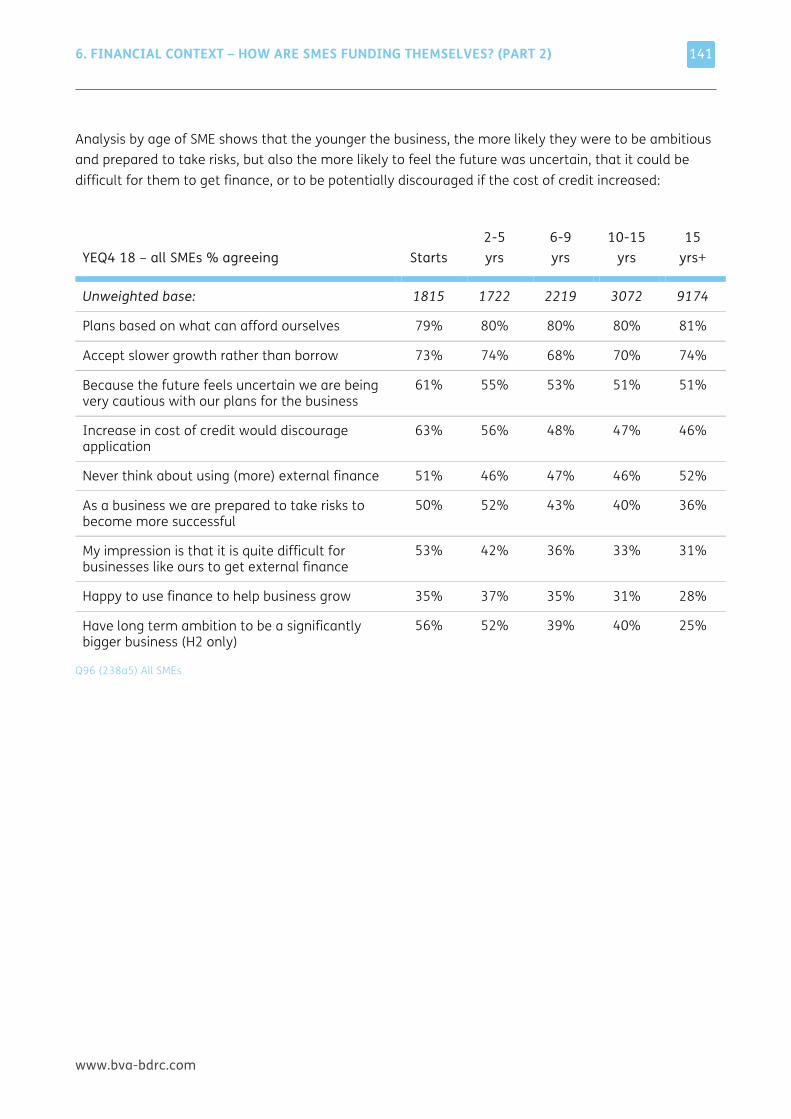
6. FINANCIAL CONTEXT – HOW ARE SMES FUNDING THEMSELVES? (PART 2)
www.bva-bdrc.com
141
Analysis by age of SME shows that the younger the business, the more likely they were to be ambitious and prepared to take risks, but also the more likely to feel the future was uncertain, that it could be difficult for them to get finance, or to be potentially discouraged if the cost of credit increased:
YEQ4 18 – all SMEs % agreeing Starts
2-5 yrs
6-9 yrs
10-15 yrs
15 yrs+
Unweighted base: 1815 1722 2219 3072 9174
Plans based on what can afford ourselves 79% 80% 80% 80% 81%
Accept slower growth rather than borrow 73% 74% 68% 70% 74%
Because the future feels uncertain we are being very cautious with our plans for the business
61% 55% 53% 51% 51%
Increase in cost of credit would discourage application
63% 56% 48% 47% 46%
Never think about using (more) external finance 51% 46% 47% 46% 52%
As a business we are prepared to take risks to become more successful
50% 52% 43% 40% 36%
My impression is that it is quite difficult for businesses like ours to get external finance
53% 42% 36% 33% 31%
Happy to use finance to help business grow 35% 37% 35% 31% 28%
Have long term ambition to be a significantly bigger business (H2 only)
56% 52% 39% 40% 25%
Q96 (238a5) All SMEs
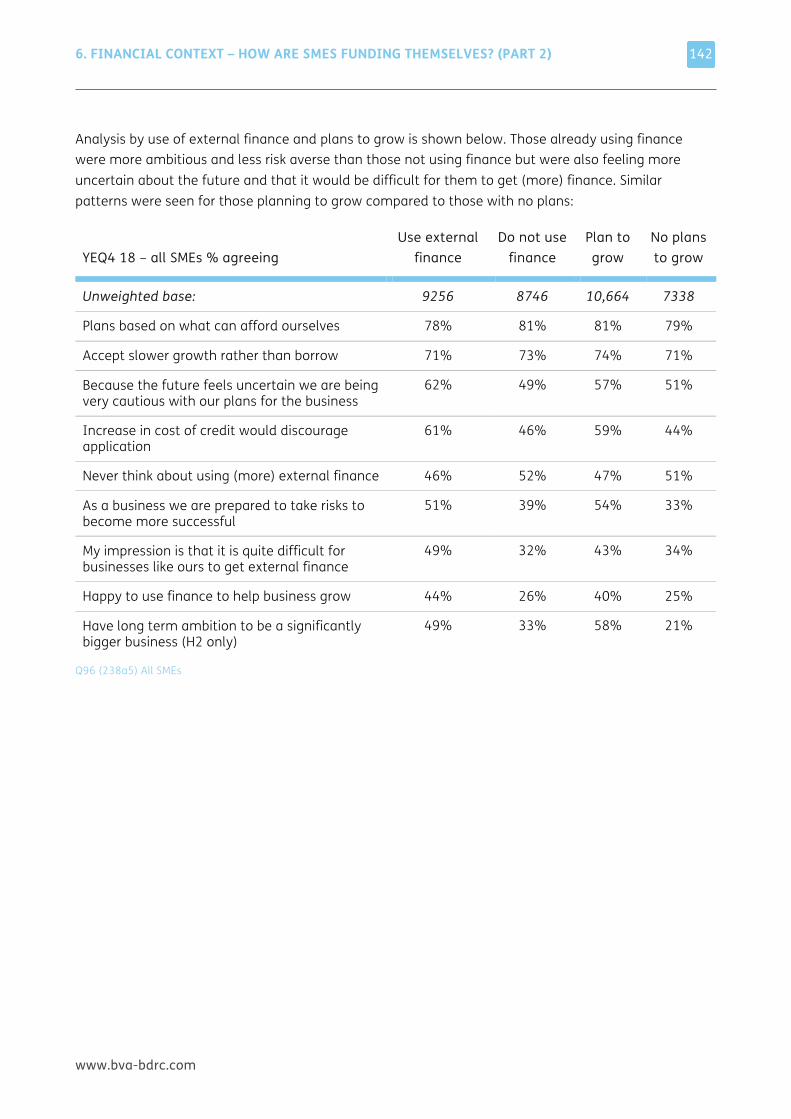
6. FINANCIAL CONTEXT – HOW ARE SMES FUNDING THEMSELVES? (PART 2)
www.bva-bdrc.com
142
Analysis by use of external finance and plans to grow is shown below. Those already using finance were more ambitious and less risk averse than those not using finance but were also feeling more uncertain about the future and that it would be difficult for them to get (more) finance. Similar patterns were seen for those planning to grow compared to those with no plans:
YEQ4 18 – all SMEs % agreeing
Use external finance
Do not use finance
Plan to grow
No plans to grow
Unweighted base: 9256 8746 10,664 7338
Plans based on what can afford ourselves 78% 81% 81% 79%
Accept slower growth rather than borrow 71% 73% 74% 71%
Because the future feels uncertain we are being very cautious with our plans for the business
62% 49% 57% 51%
Increase in cost of credit would discourage application
61% 46% 59% 44%
Never think about using (more) external finance 46% 52% 47% 51%
As a business we are prepared to take risks to become more successful
51% 39% 54% 33%
My impression is that it is quite difficult for businesses like ours to get external finance
49% 32% 43% 34%
Happy to use finance to help business grow 44% 26% 40% 25%
Have long term ambition to be a significantly bigger business (H2 only)
49% 33% 58% 21%
Q96 (238a5) All SMEs
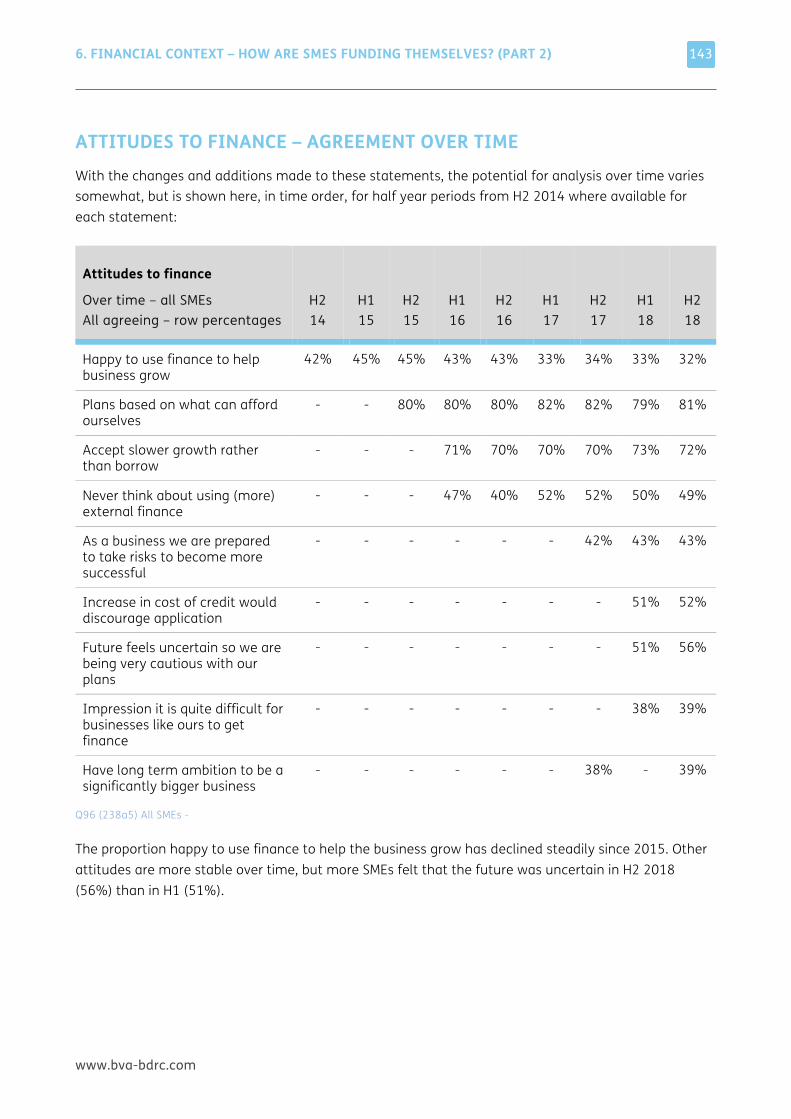
6. FINANCIAL CONTEXT – HOW ARE SMES FUNDING THEMSELVES? (PART 2)
www.bva-bdrc.com
143
ATTITUDES TO FINANCE – AGREEMENT OVER TIME With the changes and additions made to these statements, the potential for analysis over time varies somewhat, but is shown here, in time order, for half year periods from H2 2014 where available for each statement:
Attitudes to finance
Over time – all SMEs All agreeing – row percentages
H2 14
H1 15
H2 15
H1 16
H2 16
H1 17
H2 17
H1 18
H2 18
Happy to use finance to help business grow
42% 45% 45% 43% 43% 33% 34% 33% 32%
Plans based on what can afford ourselves
- - 80% 80% 80% 82% 82% 79% 81%
Accept slower growth rather than borrow
- - - 71% 70% 70% 70% 73% 72%
Never think about using (more) external finance
- - - 47% 40% 52% 52% 50% 49%
As a business we are prepared to take risks to become more successful
- - - - - - 42% 43% 43%
Increase in cost of credit would discourage application
- - - - - - - 51% 52%
Future feels uncertain so we are being very cautious with our plans
- - - - - - - 51% 56%
Impression it is quite difficult for businesses like ours to get finance
- - - - - - - 38% 39%
Have long term ambition to be a significantly bigger business
- - - - - - 38% - 39%
Q96 (238a5) All SMEs -
The proportion happy to use finance to help the business grow has declined steadily since 2015. Other attitudes are more stable over time, but more SMEs felt that the future was uncertain in H2 2018 (56%) than in H1 (51%).
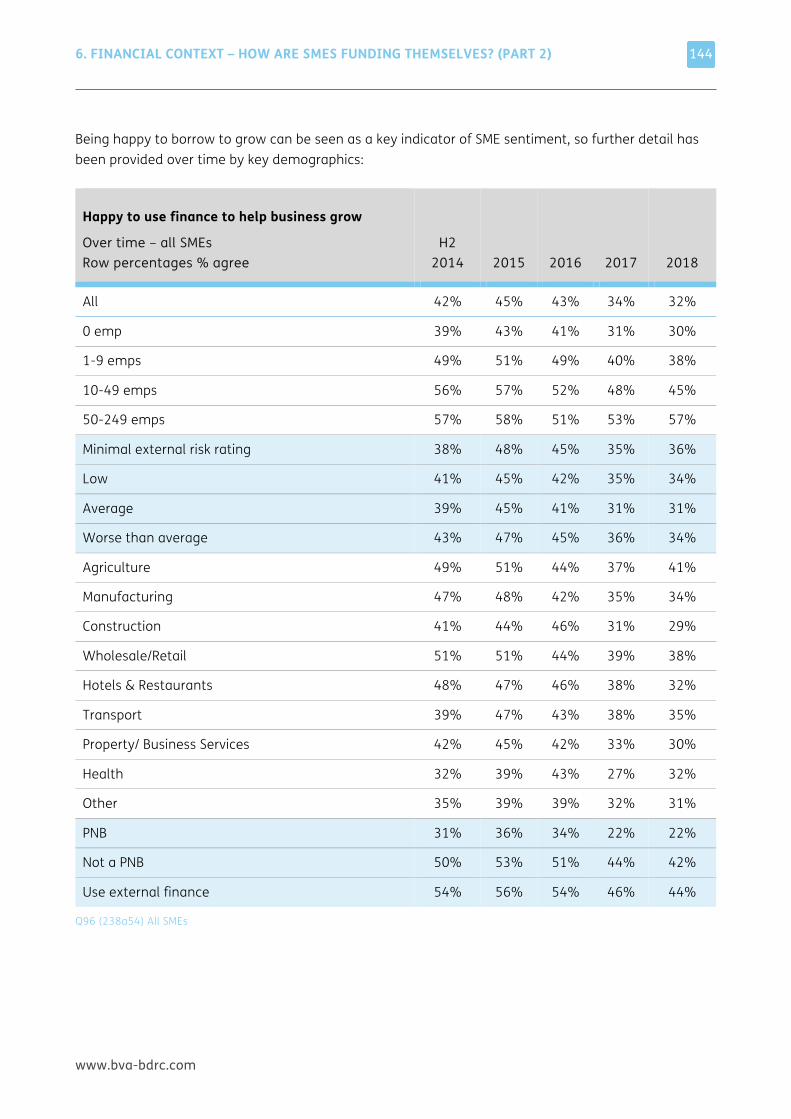
6. FINANCIAL CONTEXT – HOW ARE SMES FUNDING THEMSELVES? (PART 2)
www.bva-bdrc.com
144
Being happy to borrow to grow can be seen as a key indicator of SME sentiment, so further detail has been provided over time by key demographics:
Happy to use finance to help business grow
Over time – all SMEs Row percentages % agree
H2 2014 2015
2016
2017 2018
All 42% 45% 43% 34% 32%
0 emp 39% 43% 41% 31% 30%
1-9 emps 49% 51% 49% 40% 38%
10-49 emps 56% 57% 52% 48% 45%
50-249 emps 57% 58% 51% 53% 57%
Minimal external risk rating 38% 48% 45% 35% 36%
Low 41% 45% 42% 35% 34%
Average 39% 45% 41% 31% 31%
Worse than average 43% 47% 45% 36% 34%
Agriculture 49% 51% 44% 37% 41%
Manufacturing 47% 48% 42% 35% 34%
Construction 41% 44% 46% 31% 29%
Wholesale/Retail 51% 51% 44% 39% 38%
Hotels & Restaurants 48% 47% 46% 38% 32%
Transport 39% 47% 43% 38% 35%
Property/ Business Services 42% 45% 42% 33% 30%
Health 32% 39% 43% 27% 32%
Other 35% 39% 39% 32% 31%
PNB 31% 36% 34% 22% 22%
Not a PNB 50% 53% 51% 44% 42%
Use external finance 54% 56% 54% 46% 44%
Q96 (238a54) All SMEs
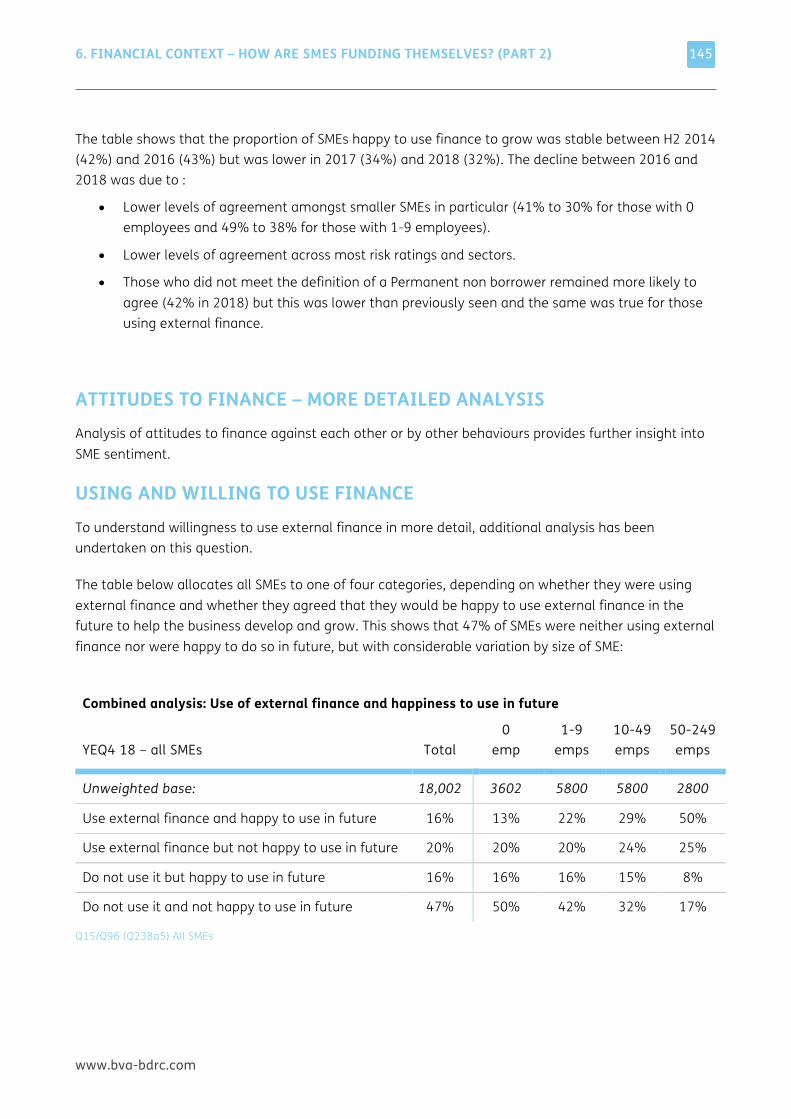
6. FINANCIAL CONTEXT – HOW ARE SMES FUNDING THEMSELVES? (PART 2)
www.bva-bdrc.com
145
The table shows that the proportion of SMEs happy to use finance to grow was stable between H2 2014 (42%) and 2016 (43%) but was lower in 2017 (34%) and 2018 (32%). The decline between 2016 and 2018 was due to :
• Lower levels of agreement amongst smaller SMEs in particular (41% to 30% for those with 0 employees and 49% to 38% for those with 1-9 employees).
• Lower levels of agreement across most risk ratings and sectors.
• Those who did not meet the definition of a Permanent non borrower remained more likely to agree (42% in 2018) but this was lower than previously seen and the same was true for those using external finance.
ATTITUDES TO FINANCE – MORE DETAILED ANALYSIS Analysis of attitudes to finance against each other or by other behaviours provides further insight into SME sentiment.
USING AND WILLING TO USE FINANCE To understand willingness to use external finance in more detail, additional analysis has been undertaken on this question.
The table below allocates all SMEs to one of four categories, depending on whether they were using external finance and whether they agreed that they would be happy to use external finance in the future to help the business develop and grow. This shows that 47% of SMEs were neither using external finance nor were happy to do so in future, but with considerable variation by size of SME:
Combined analysis: Use of external finance and happiness to use in future
YEQ4 18 – all SMEs Total 0
emp 1-9
emps 10-49 emps
50-249 emps
Unweighted base: 18,002 3602 5800 5800 2800
Use external finance and happy to use in future 16% 13% 22% 29% 50%
Use external finance but not happy to use in future 20% 20% 20% 24% 25%
Do not use it but happy to use in future 16% 16% 16% 15% 8%
Do not use it and not happy to use in future 47% 50% 42% 32% 17%
Q15/Q96 (Q238a5) All SMEs
6. FINANCIAL CONTEXT – HOW ARE SMES FUNDING THEMSELVES? (PART 2)
www.bva-bdrc.com
146
Taking these two issues in combination:
• 1 in 6 SMEs (16%) were using external finance and agreed that they would be happy to use it in future, increasing by size of SME to half of those with 50-249 employees (50%).
• The remaining users of finance, 20% of all SMEs, would not be happy to use finance in future (the equivalent of 56% of all users of finance). There was less variation by size of SME for this group, especially for those SMEs with employees.
• 1 in 6 of all SMEs (16%) were not using external finance currently but agreed that they would be happy to use it to help the business develop and grow. This proportion varied little by size of SME with the exception of those with 50-249 employees (8%).
• The remainder, almost half of SMEs (47%), were non-users of finance who would not be happy to use it in future and this was more common amongst 0 employee SMEs (50% compared to 17% of those with 50-249 employees). 8 in 10 of this group (79%) met the definition of a PNB.
COMBINING GROWTH AMBITIONS AND ATTITUDE TO RISK When the attitude statement ‘We have a long term ambition to be a significantly bigger business’ was last run, in H2 2017, further analysis was done in combination with the statement ‘As a business we are prepared to take risks to become more successful’ to profile the SMEs that agreed with both statements. This analysis has now been updated for H2 2018.
In H2 2017, 38% had agreed they wanted to be a bigger business and 42% that they were prepared to take risks, with 27% agreeing with both statements. In all instances agreement increased by size of business but decreased by age of business:
• 25% of 0 employee SMEs agreed with both statements, increasing by size to 50% of those with 50-249 employees.
• 44% of Starts agreed with both statements, decreasing by age of SME to 17% of those trading for more than 15 years.
Those SMEs that agreed with both statements were more likely to be using finance, to be innovative, international and to plan, to have grown and to be planning to grow. They could thus be seen as a key group of SMEs.
Repeating this analysis in H2 2018 showed a very similar proportion of SMEs agreeing with each statement. 39% agreed they wanted to be a bigger business and 43% that they were prepared to take risks, with 25% agreeing with both statements.
6. FINANCIAL CONTEXT – HOW ARE SMES FUNDING THEMSELVES? (PART 2)
www.bva-bdrc.com
147
Levels of agreement continued to increase by size of business and decrease by age of business:
• 23% of 0 employee SMEs agreed with both statements, increasing by size to 50% of those with 50-249 employees.
• 35% of Starts agreed with both statements, decreasing by age of SME to 15% of those trading for more than 15 years.
The table below shows the proportion of SMEs in each demographic that agreed with both statements. Whilst overall levels of agreement with both statements was stable over time, there were some differences by sub-group:
• Those less likely to agree with both statements in H2 2018 included those with a low external risk rating, those in Agriculture, Construction and Hotels & Restaurants, and Starts.
• Those more likely to agree with both statements in H2 2018 included those in Manufacturing and those trading for 2-5 years.
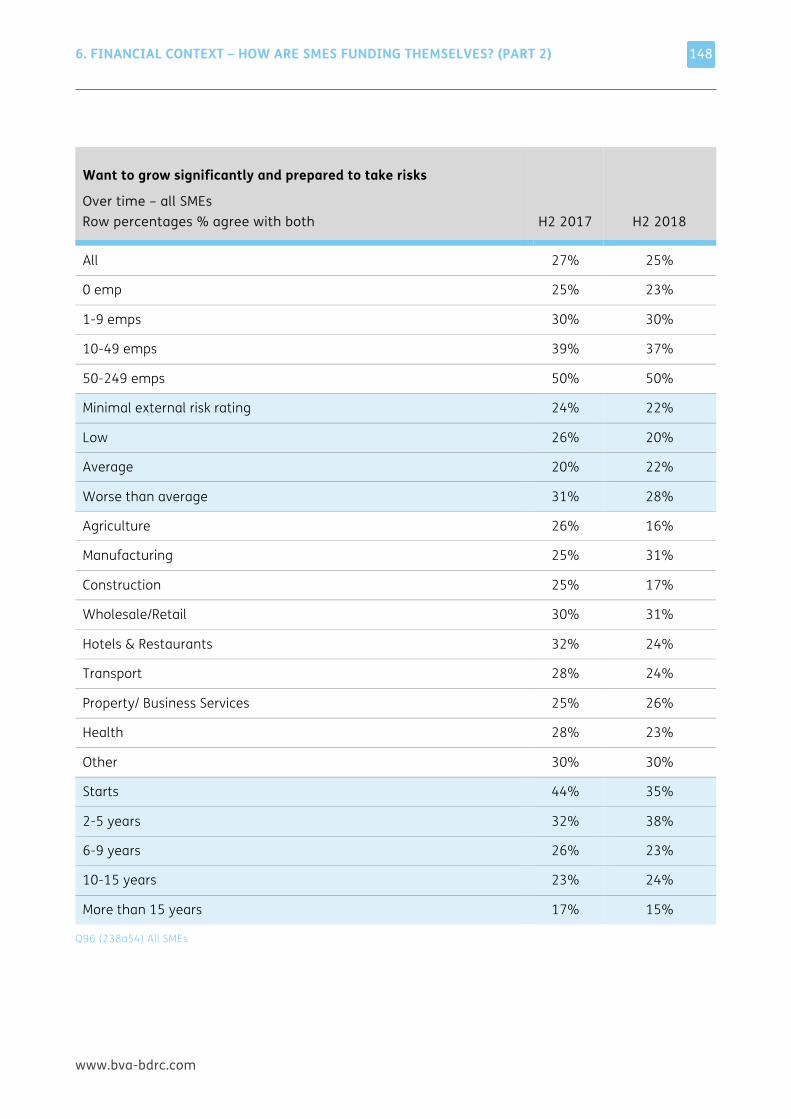
6. FINANCIAL CONTEXT – HOW ARE SMES FUNDING THEMSELVES? (PART 2)
www.bva-bdrc.com
148
Want to grow significantly and prepared to take risks
Over time – all SMEs Row percentages % agree with both H2 2017 H2 2018
All 27% 25%
0 emp 25% 23%
1-9 emps 30% 30%
10-49 emps 39% 37%
50-249 emps 50% 50%
Minimal external risk rating 24% 22%
Low 26% 20%
Average 20% 22%
Worse than average 31% 28%
Agriculture 26% 16%
Manufacturing 25% 31%
Construction 25% 17%
Wholesale/Retail 30% 31%
Hotels & Restaurants 32% 24%
Transport 28% 24%
Property/ Business Services 25% 26%
Health 28% 23%
Other 30% 30%
Starts 44% 35%
2-5 years 32% 38%
6-9 years 26% 23%
10-15 years 23% 24%
More than 15 years 17% 15%
Q96 (238a54) All SMEs
6. FINANCIAL CONTEXT – HOW ARE SMES FUNDING THEMSELVES? (PART 2)
www.bva-bdrc.com
149
Analysis of the group of SMEs that agreed with both statements in H2 2018, found they had similar characteristics to the equivalent group in H2 2017:
• These SMEs were more likely to be using external finance (48% v 39% of all SMEs in H2 2018) and to have had a finance event (29% v 14%) or to be planning to apply for finance (19% v 11%).
• They were also more likely to have innovated (47% v 34%), to trade internationally (23% v 16%) and to have grown (52% v 36%) and to be planning to grow (78% v 50%).
• These SMEs were more likely to have been trading for up to 5 years (51% v 34%) and to have an owner aged 31-50 (59% v 45%). There was little difference by gender.
• They were somewhat more concerned about the economic climate (24% v 20%) and the value of sterling (18% v 13%) and overall 57% mentioned at least one barrier (v 48% overall)
• Analysis in H2 2017 showed that being willing to borrow to grow was a key factor for these SMEs and this was still the case in H2 2018 (53% agreed with this statement v 32% of SMEs overall).
www.bva-bdrc.com
7 NEED FOR FUNDING THIS CHAPTER PROVIDES new detail on those SMEs that reported a funding need in 2018, including why the funding was needed and what steps were considered and taken to meet that need.
7. NEED FOR FUNDING
www.bva-bdrc.com
151
KEY FINDINGS 4% of SMEs interviewed in 2018 reported a need for funding in the previous 12 months, with little variation by size (3-6%), or by quarter of 2018 (4-5%).
This need was most likely to be for working capital to help with cash flow (32%) or to fund expansion in the UK (26%), while 22% wanted to invest in new plant and machinery
• Smaller SMEs were more likely to mention cash flow and larger ones funding expansion
• Mentions of funding for cash flow purposes were higher in the second half of 2018 (36%) than the first (28%) but otherwise there was little change over time
30% of those with a need for funding had wanted £25,000 or more, increasing by size of SME (19% of those with 0 employees to 90% of those with 50-249 employees).
93% of those with a need for funding took some action as a result, including 21% who spoke to their main bank, 19% who sought professional advice and 14% who discussed the matter within the business. 11% prepared a business plan or forecast
• 4 in 10 spoke to someone externally about their finance need (their bank, an advisor or another finance provider), increasing by size of SME from 38% of those with 0 employees to 65% of those with 50-249 employees
7. NEED FOR FUNDING
www.bva-bdrc.com
152
Having taken some action, 67% then considered making an application for finance, typically to their main bank (48%), while 22% considered putting some or all of the funding in themselves.
• Larger SMEs were more likely to consider making an application but there was little difference by size in terms of consideration of self-funding
• Those who had spoken to someone (the bank, an advisor or another provider) were more likely to consider making an application (79%)
In the end, 63% had a borrowing ‘event’, with most, 40%, applying to their main bank. 13% decided to fund all or part of the finance need themselves and 12% decided not to take any funding. 16% were still deciding what to do
• 84% of those who considered making an application went on to do so
• 76% of those who considered applying to their main bank went on to do so, with 83% having a borrowing event somewhere
• Similar proportions considered and then applied to an existing provider or a new provider. Fewer of those who considered applying to an online finance platform went on to do so (42%), but again, most did have a borrowing event somewhere (84%)
• Those who had spoken to someone (the bank, an advisor or another provider) were more likely to make an application (73%)
• 46% of those who considered self-funding went on to put money in, while 35% applied for finance and the rest were still deciding
7. NEED FOR FUNDING
www.bva-bdrc.com
153
The middle section of the questionnaire, around applications for finance, saw the most changes in the re-design for Q1 2018. As a result, this section of the report has also evolved, although where comparable data over time is still available, this has been reported.
This is the first of the four revised chapters, now looking at borrowing events in the wider finance market beyond loans and overdrafts:
• This chapter looks at whether SMEs identified a need for external funding and what steps they took as a result of that need, including whether they applied for finance (a Type 1a borrowing event).
• Chapter 8 provides an overview of all borrowing ‘events’ (including Type 1a events), and the types of SME more or less likely to have had such events.
• Chapter 9 looks at all the borrowing events reported in more detail.
• Chapter 10 looks specifically at the Type 1 borrowing events, the final outcome of the applications made and the impact of the application on the SME.
The definitions of all the borrowing events included in this report is provided at the start of the next chapter.
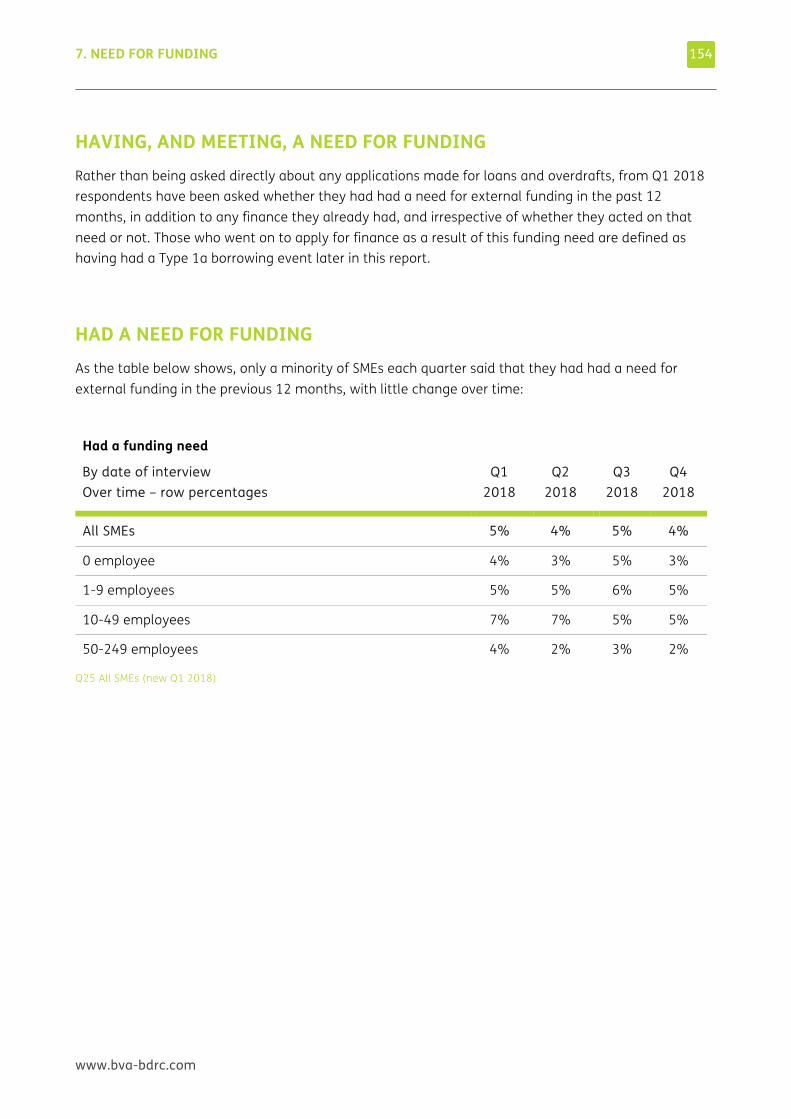
7. NEED FOR FUNDING
www.bva-bdrc.com
154
HAVING, AND MEETING, A NEED FOR FUNDING Rather than being asked directly about any applications made for loans and overdrafts, from Q1 2018 respondents have been asked whether they had had a need for external funding in the past 12 months, in addition to any finance they already had, and irrespective of whether they acted on that need or not. Those who went on to apply for finance as a result of this funding need are defined as having had a Type 1a borrowing event later in this report.
HAD A NEED FOR FUNDING As the table below shows, only a minority of SMEs each quarter said that they had had a need for external funding in the previous 12 months, with little change over time:
Q25 All SMEs (new Q1 2018)
Had a funding need
By date of interview Over time – row percentages
Q1 2018
Q2 2018
Q3 2018
Q4 2018
All SMEs 5% 4% 5% 4%
0 employee 4% 3% 5% 3%
1-9 employees 5% 5% 6% 5%
10-49 employees 7% 7% 5% 5%
50-249 employees 4% 2% 3% 2%
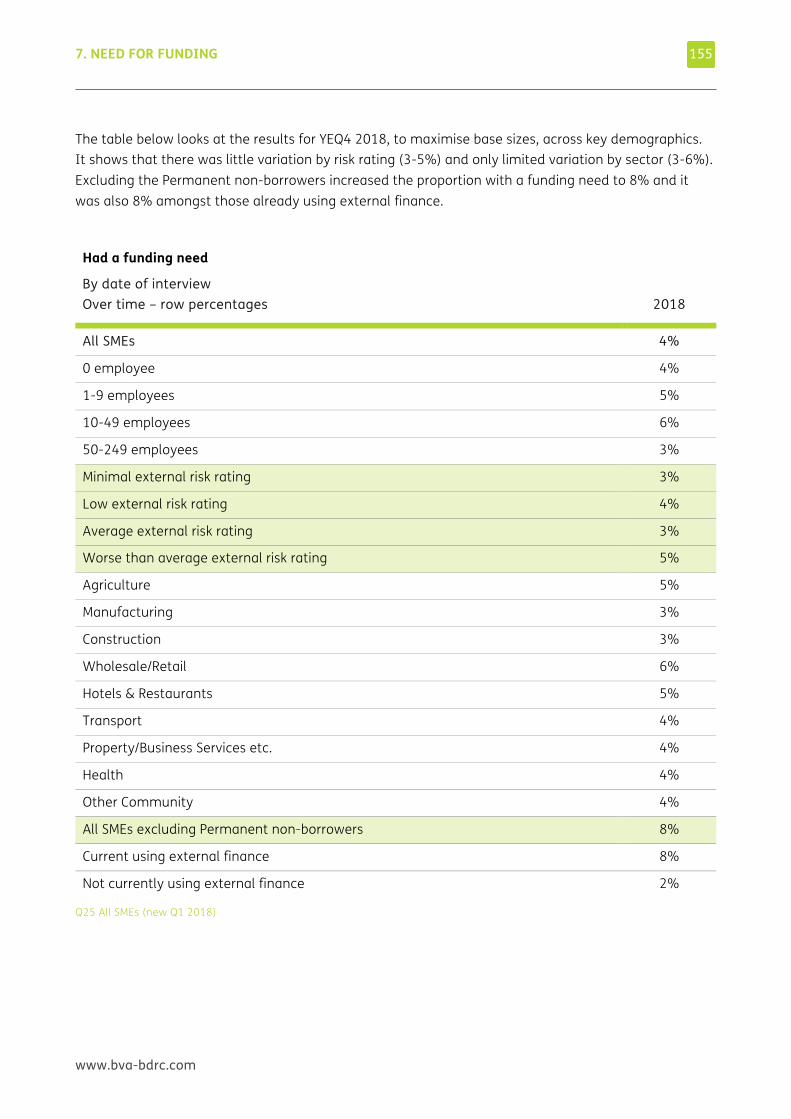
7. NEED FOR FUNDING
www.bva-bdrc.com
155
The table below looks at the results for YEQ4 2018, to maximise base sizes, across key demographics. It shows that there was little variation by risk rating (3-5%) and only limited variation by sector (3-6%). Excluding the Permanent non-borrowers increased the proportion with a funding need to 8% and it was also 8% amongst those already using external finance.
Q25 All SMEs (new Q1 2018)
Had a funding need
By date of interview Over time – row percentages 2018
All SMEs 4%
0 employee 4%
1-9 employees 5%
10-49 employees 6%
50-249 employees 3%
Minimal external risk rating 3%
Low external risk rating 4%
Average external risk rating 3%
Worse than average external risk rating 5%
Agriculture 5%
Manufacturing 3%
Construction 3%
Wholesale/Retail 6%
Hotels & Restaurants 5%
Transport 4%
Property/Business Services etc. 4%
Health 4%
Other Community 4%
All SMEs excluding Permanent non-borrowers 8%
Current using external finance 8%
Not currently using external finance 2%
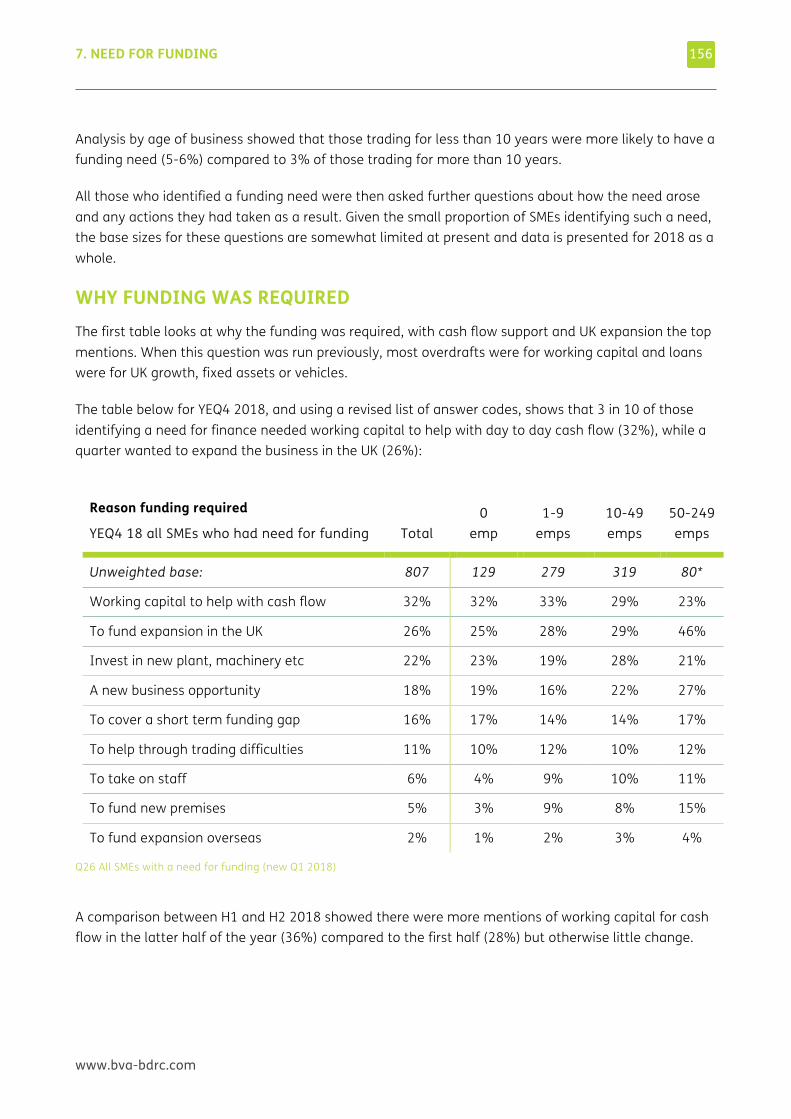
7. NEED FOR FUNDING
www.bva-bdrc.com
156
Analysis by age of business showed that those trading for less than 10 years were more likely to have a funding need (5-6%) compared to 3% of those trading for more than 10 years.
All those who identified a funding need were then asked further questions about how the need arose and any actions they had taken as a result. Given the small proportion of SMEs identifying such a need, the base sizes for these questions are somewhat limited at present and data is presented for 2018 as a whole.
WHY FUNDING WAS REQUIRED The first table looks at why the funding was required, with cash flow support and UK expansion the top mentions. When this question was run previously, most overdrafts were for working capital and loans were for UK growth, fixed assets or vehicles.
The table below for YEQ4 2018, and using a revised list of answer codes, shows that 3 in 10 of those identifying a need for finance needed working capital to help with day to day cash flow (32%), while a quarter wanted to expand the business in the UK (26%):
Reason funding required
YEQ4 18 all SMEs who had need for funding Total 0
emp 1-9
emps 10-49 emps
50-249 emps
Unweighted base: 807 129 279 319 80*
Working capital to help with cash flow 32% 32% 33% 29% 23%
To fund expansion in the UK 26% 25% 28% 29% 46%
Invest in new plant, machinery etc 22% 23% 19% 28% 21%
A new business opportunity 18% 19% 16% 22% 27%
To cover a short term funding gap 16% 17% 14% 14% 17%
To help through trading difficulties 11% 10% 12% 10% 12%
To take on staff 6% 4% 9% 10% 11%
To fund new premises 5% 3% 9% 8% 15%
To fund expansion overseas 2% 1% 2% 3% 4%
Q26 All SMEs with a need for funding (new Q1 2018)
A comparison between H1 and H2 2018 showed there were more mentions of working capital for cash flow in the latter half of the year (36%) compared to the first half (28%) but otherwise little change.
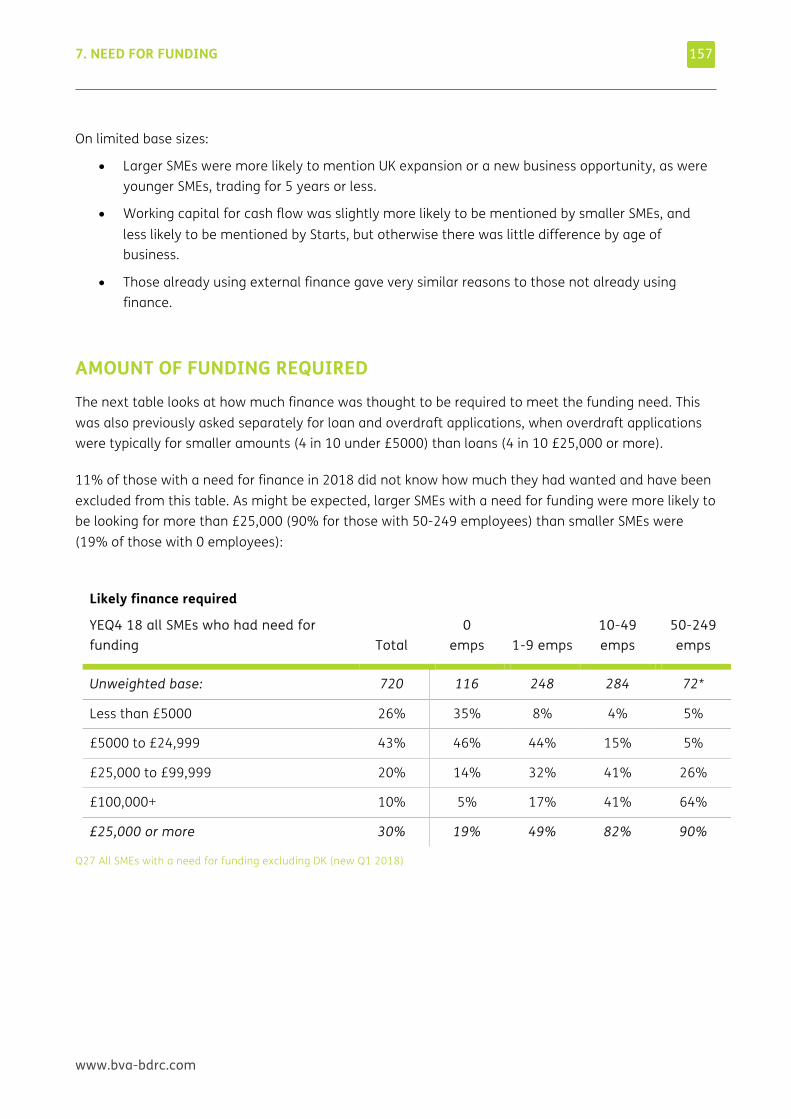
7. NEED FOR FUNDING
www.bva-bdrc.com
157
On limited base sizes:
• Larger SMEs were more likely to mention UK expansion or a new business opportunity, as were younger SMEs, trading for 5 years or less.
• Working capital for cash flow was slightly more likely to be mentioned by smaller SMEs, and less likely to be mentioned by Starts, but otherwise there was little difference by age of business.
• Those already using external finance gave very similar reasons to those not already using finance.
AMOUNT OF FUNDING REQUIRED The next table looks at how much finance was thought to be required to meet the funding need. This was also previously asked separately for loan and overdraft applications, when overdraft applications were typically for smaller amounts (4 in 10 under £5000) than loans (4 in 10 £25,000 or more).
11% of those with a need for finance in 2018 did not know how much they had wanted and have been excluded from this table. As might be expected, larger SMEs with a need for funding were more likely to be looking for more than £25,000 (90% for those with 50-249 employees) than smaller SMEs were (19% of those with 0 employees):
Likely finance required
YEQ4 18 all SMEs who had need for funding Total
0 emps 1-9 emps
10-49 emps
50-249 emps
Unweighted base: 720 116 248 284 72*
Less than £5000 26% 35% 8% 4% 5%
£5000 to £24,999 43% 46% 44% 15% 5%
£25,000 to £99,999 20% 14% 32% 41% 26%
£100,000+ 10% 5% 17% 41% 64%
£25,000 or more 30% 19% 49% 82% 90%
Q27 All SMEs with a need for funding excluding DK (new Q1 2018)
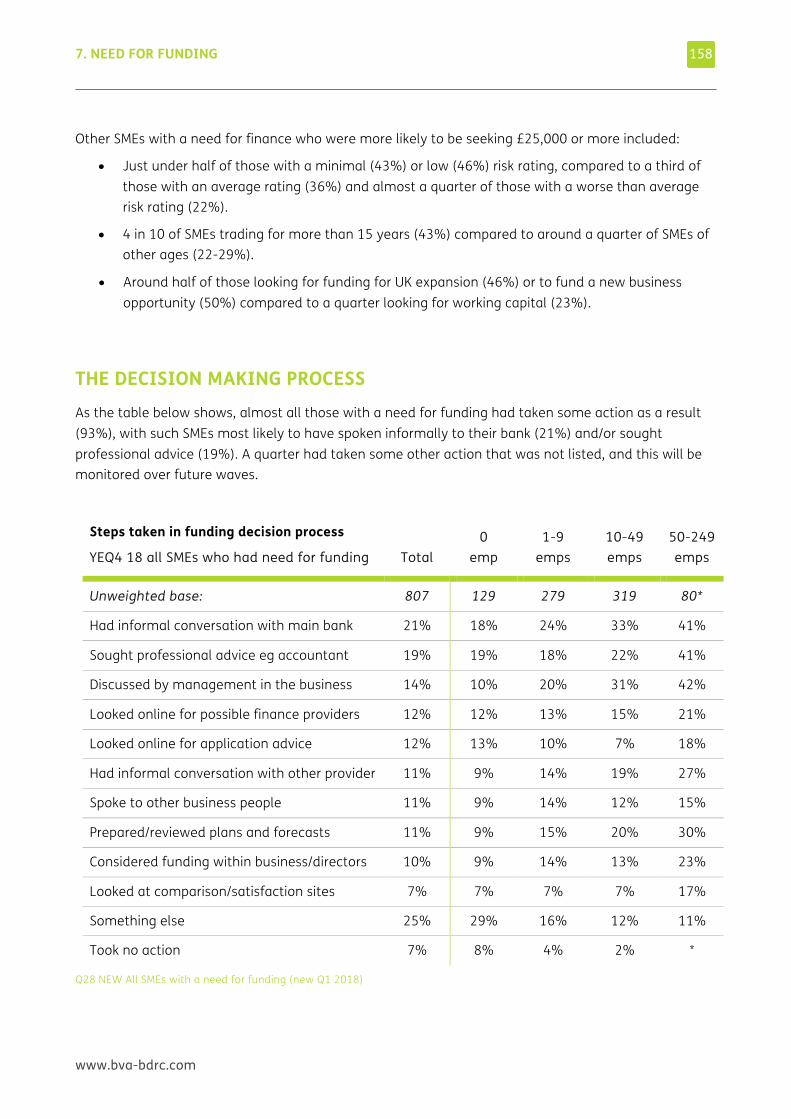
7. NEED FOR FUNDING
www.bva-bdrc.com
158
Other SMEs with a need for finance who were more likely to be seeking £25,000 or more included:
• Just under half of those with a minimal (43%) or low (46%) risk rating, compared to a third of those with an average rating (36%) and almost a quarter of those with a worse than average risk rating (22%).
• 4 in 10 of SMEs trading for more than 15 years (43%) compared to around a quarter of SMEs of other ages (22-29%).
• Around half of those looking for funding for UK expansion (46%) or to fund a new business opportunity (50%) compared to a quarter looking for working capital (23%).
THE DECISION MAKING PROCESS As the table below shows, almost all those with a need for funding had taken some action as a result (93%), with such SMEs most likely to have spoken informally to their bank (21%) and/or sought professional advice (19%). A quarter had taken some other action that was not listed, and this will be monitored over future waves.
Steps taken in funding decision process
YEQ4 18 all SMEs who had need for funding Total 0
emp 1-9
emps 10-49 emps
50-249 emps
Unweighted base: 807 129 279 319 80*
Had informal conversation with main bank 21% 18% 24% 33% 41%
Sought professional advice eg accountant 19% 19% 18% 22% 41%
Discussed by management in the business 14% 10% 20% 31% 42%
Looked online for possible finance providers 12% 12% 13% 15% 21%
Looked online for application advice 12% 13% 10% 7% 18%
Had informal conversation with other provider 11% 9% 14% 19% 27%
Spoke to other business people 11% 9% 14% 12% 15%
Prepared/reviewed plans and forecasts 11% 9% 15% 20% 30%
Considered funding within business/directors 10% 9% 14% 13% 23%
Looked at comparison/satisfaction sites 7% 7% 7% 7% 17%
Something else 25% 29% 16% 12% 11%
Took no action 7% 8% 4% 2% *
Q28 NEW All SMEs with a need for funding (new Q1 2018)
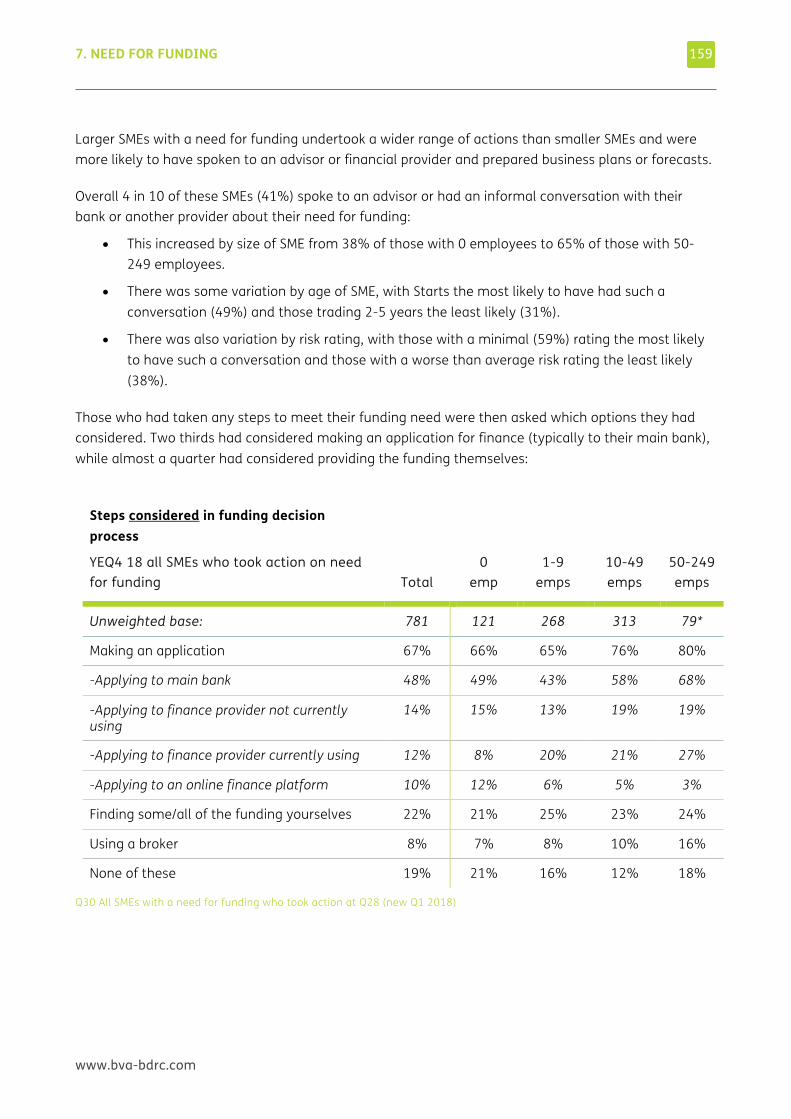
7. NEED FOR FUNDING
www.bva-bdrc.com
159
Larger SMEs with a need for funding undertook a wider range of actions than smaller SMEs and were more likely to have spoken to an advisor or financial provider and prepared business plans or forecasts.
Overall 4 in 10 of these SMEs (41%) spoke to an advisor or had an informal conversation with their bank or another provider about their need for funding:
• This increased by size of SME from 38% of those with 0 employees to 65% of those with 50-249 employees.
• There was some variation by age of SME, with Starts the most likely to have had such a conversation (49%) and those trading 2-5 years the least likely (31%).
• There was also variation by risk rating, with those with a minimal (59%) rating the most likely to have such a conversation and those with a worse than average risk rating the least likely (38%).
Those who had taken any steps to meet their funding need were then asked which options they had considered. Two thirds had considered making an application for finance (typically to their main bank), while almost a quarter had considered providing the funding themselves:
Steps considered in funding decision process
YEQ4 18 all SMEs who took action on need for funding Total
0 emp
1-9 emps
10-49 emps
50-249 emps
Unweighted base: 781 121 268 313 79*
Making an application 67% 66% 65% 76% 80%
-Applying to main bank 48% 49% 43% 58% 68%
-Applying to finance provider not currently using
14% 15% 13% 19% 19%
-Applying to finance provider currently using 12% 8% 20% 21% 27%
-Applying to an online finance platform 10% 12% 6% 5% 3%
Finding some/all of the funding yourselves 22% 21% 25% 23% 24%
Using a broker 8% 7% 8% 10% 16%
None of these 19% 21% 16% 12% 18%
Q30 All SMEs with a need for funding who took action at Q28 (new Q1 2018)
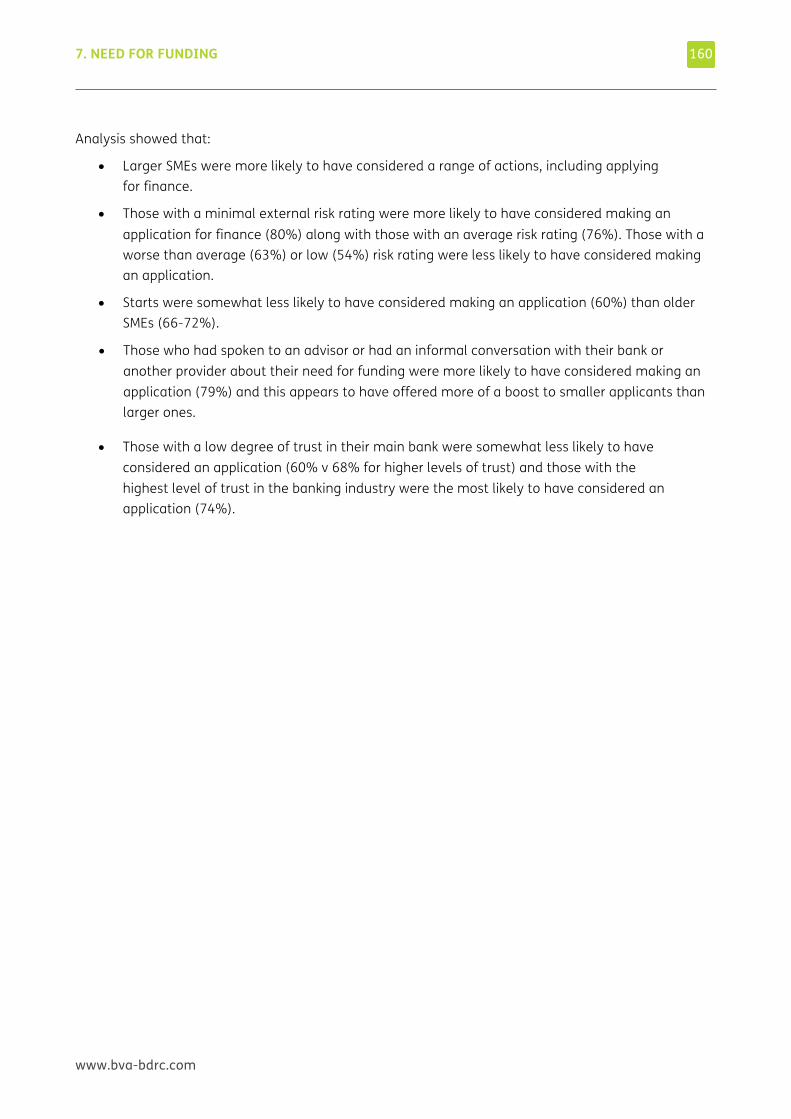
7. NEED FOR FUNDING
www.bva-bdrc.com
160
Analysis showed that:
• Larger SMEs were more likely to have considered a range of actions, including applying for finance.
• Those with a minimal external risk rating were more likely to have considered making an application for finance (80%) along with those with an average risk rating (76%). Those with a worse than average (63%) or low (54%) risk rating were less likely to have considered making an application.
• Starts were somewhat less likely to have considered making an application (60%) than older SMEs (66-72%).
• Those who had spoken to an advisor or had an informal conversation with their bank or another provider about their need for funding were more likely to have considered making an application (79%) and this appears to have offered more of a boost to smaller applicants than larger ones.
• Those with a low degree of trust in their main bank were somewhat less likely to have considered an application (60% v 68% for higher levels of trust) and those with the highest level of trust in the banking industry were the most likely to have considered an application (74%).
7. NEED FOR FUNDING
www.bva-bdrc.com
161
STEPS TAKEN TO MEET FUNDING NEED The next table looks at the steps actually taken, rather than considered, by SMEs with a funding need.
6 in 10 (63%) of all SMEs who had taken action to address a funding need went on to have a borrowing ‘event’ to meet that need (58% of all SMEs with a funding need). The most common borrowing ‘event’ was an application to the main bank, mentioned by 40% of those taking action on a need for funding and almost two thirds of those who had a borrowing event at all:
Steps taken in funding decision process
YEQ4 18 all SMEs who had need for funding Total 0
emp 1-9
emps 10-49 emps
50-249 emps
Unweighted base: 781 121 268 313 79*
Had borrowing ‘event’ re need for finance 63% 61% 64% 80% 76%
Applied to main bank 40% 39% 39% 54% 56%
Applied to finance provider currently using 12% 8% 18% 20% 22%
Applied to finance provider not currently using 14% 14% 12% 16% 11%
Applied to an online finance platform 5% 5% 5% 5% 3%
Decided to fund all or part of it yourselves 13% 9% 23% 14% 7%
Decided not to take funding 12% 14% 9% 6% 12%
Still deciding 16% 20% 8% 9% 10%
Q31 All SMEs with a need for funding who took action at Q28 (new Q1 2018)
7. NEED FOR FUNDING
www.bva-bdrc.com
162
Analysis showed that:
• Larger SMEs were somewhat more likely to have had an event than smaller ones and to have applied to their main bank.
• 84% of those who ‘considered’ applying at all went on to do so.
• Of those who had ‘considered’ applying to their main bank, three quarters (76%) went on to make an application and almost all (83%) had a borrowing ‘event’ of some kind. These proportions were very similar for those who considered applying to another existing provider or to a new provider. Those who considered applying to an online platform were less likely to go on and do so (42%) but almost all did have a borrowing event somewhere (84%), typically applying either to their main bank or to another new provider.
• Amongst those who ‘considered’ providing some or part of the funding themselves, almost half (46%) went on to provide such funding, while a third (35%) applied for finance (the rest were still deciding). Overall, 8% of those who had a borrowing event also put in some funding themselves.
• Those who had spoken to an advisor or had an informal conversation with their bank or another provider about their need for funding were more likely to have made an application (73%) and this appears to have offered more of a boost to smaller applicants than larger ones.
The 63% with a borrowing ‘event’ shown above is the equivalent of 2% of all SMEs.
Those who decided not to take finance and to put in the funds themselves or decided not to meet the funding need at all were asked further questions to determine if they had been a ‘would-be seeker of finance’ and this is reported in more detail in Chapter 11.
The outcome of these borrowing events to meet a funding need is explored in subsequent chapters. First the next chapter provides an overview of all the borrowing ‘events’ now captured on the SME Finance Monitor.
www.bva-bdrc.com
8 AN OVERVIEW OF BORROWING EVENTS THIS CHAPTER PROVIDES information on the number and range of borrowing events now captured on the SME Finance Monitor.
8. AN OVERVIEW OF BORROWING EVENTS
www.bva-bdrc.com
164
KEY FINDINGS The borrowing events arising from a need for finance are just one of the events captured on the SME Finance Monitor. Overall, in 2018:
• 4% of SMEs reported a Type 1 borrowing event, which is an application for new or renewed finance arising from a need for funding (2%) or another application (2%)
• 2% of SMEs reported a Type2/3 borrowing event, where an existing facility is cancelled by the bank or repaid early by the SME
• 9% of SMEs reported that their overdraft had been automatically renewed
14% of SMEs interviewed in 2018 reported one or more of these events in the previous 12 months. This increased by size of SME from 13% of those with 0 employees to 32% of those with 50-249 employees (due to the latter being more likely to see an overdraft automatically renewed, 27%)
• SMEs with a better risk rating, those in Agriculture or Wholesale/Retail and Starts were more likely to report an event
• There was little difference in the overall proportion reporting an event H1 2018 (15%) to H2 2018 (14%) but larger SMEs were less likely to report an event in the second half of the year (for those with 50-249 employees, 39% reported an event in H1 and 26% in H2)
8. AN OVERVIEW OF BORROWING EVENTS
www.bva-bdrc.com
165
This is the second of four revised chapters looking at borrowing events in the wider finance market beyond loans and overdrafts:
• The previous chapter looked at whether SMEs identified a need for external funding and what steps they took as a result of that need, including whether they applied for finance (a Type 1a borrowing event).
• This chapter provides an overview of all borrowing ‘events’ (including the Type 1a events), and the types of SME more or less likely to have had such events.
• Chapter 9 looks at all the borrowing events reported in more detail.
• Chapter 10 looks specifically at the Type 1 borrowing events , the final outcome of the applications made and the impact on the SME.
The information gathered on these events is not always directly comparable with that gathered for loans and overdrafts for previous reports, but where possible historical data is shown for context. Before looking at the latest findings, the summary below looks at the changes made to how borrowing events have been defined from Q1 2018.
BORROWING EVENT DEFINITIONS OVER TIME Previous SME Finance Monitor reports have focussed primarily on loan and overdraft borrowing ‘events’ reported over time by different demographics. The borrowing events included Types 1-3 described below:
• Type 1: an application for a new or renewed loan or overdraft facility. In 2017, 5% of SMEs reported such an event increasing by size from 4% of 0 employee SMEs to 10% of those with 50-249 employees.
• Type 2: a decision to cancel or re-negotiate a loan or overdraft facility by the bank ahead of time. In 2017, 1% of SMEs reported such an event.
• Type 3: a decision to reduce or pay off a loan or overdraft facility early by the SME. In 2017, 1% of SMEs reported such an event.
• In addition, those SMEs that had an overdraft were asked if this had been automatically renewed for them in the previous 12 months. In 2017, half of SMEs with an overdraft (51%) said that it has been automatically renewed, the equivalent of 9% of all SMEs.
Type 1-3 borrowing events, plus the automatic renewal of an overdraft all contributed to the previous net ‘Had an event’ code that sat beside ‘Would-be seekers’ and ‘Happy non-seekers’ to summarise behaviour in the 12 months prior to interview. In 2017, 15% of all SMEs reported a borrowing event.
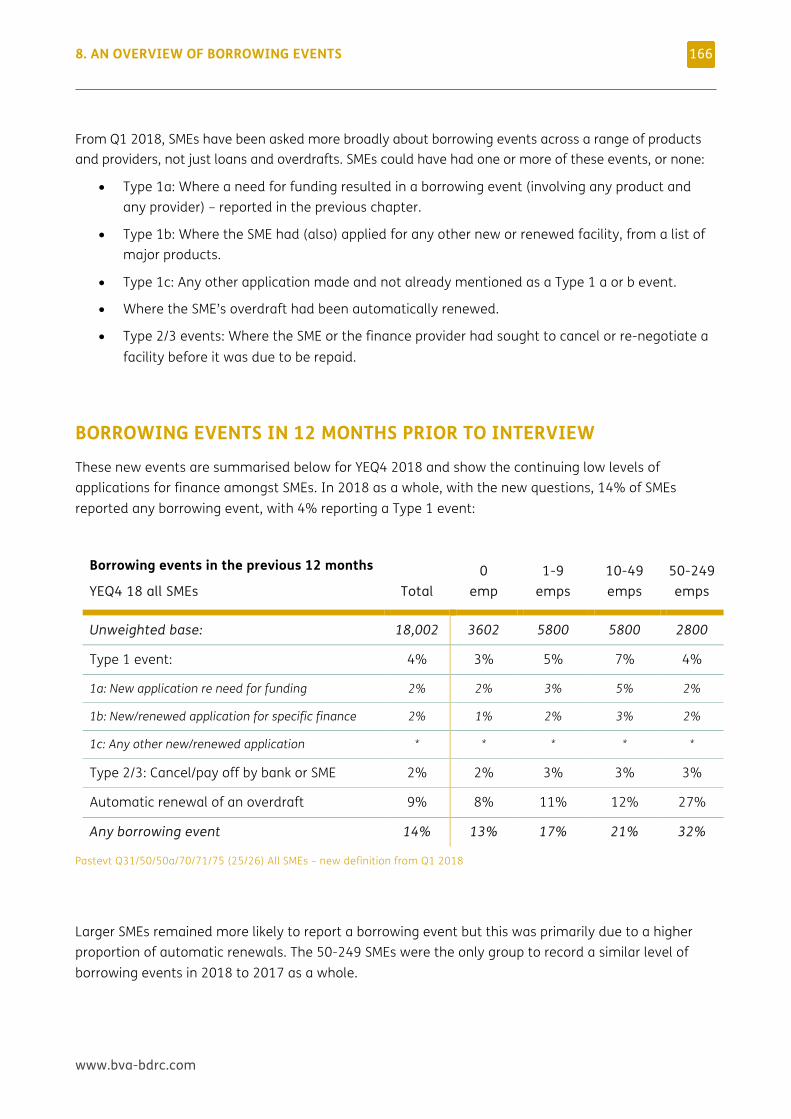
8. AN OVERVIEW OF BORROWING EVENTS
www.bva-bdrc.com
166
From Q1 2018, SMEs have been asked more broadly about borrowing events across a range of products and providers, not just loans and overdrafts. SMEs could have had one or more of these events, or none:
• Type 1a: Where a need for funding resulted in a borrowing event (involving any product and any provider) – reported in the previous chapter.
• Type 1b: Where the SME had (also) applied for any other new or renewed facility, from a list of major products.
• Type 1c: Any other application made and not already mentioned as a Type 1 a or b event.
• Where the SME’s overdraft had been automatically renewed.
• Type 2/3 events: Where the SME or the finance provider had sought to cancel or re-negotiate a facility before it was due to be repaid.
BORROWING EVENTS IN 12 MONTHS PRIOR TO INTERVIEW
These new events are summarised below for YEQ4 2018 and show the continuing low levels of applications for finance amongst SMEs. In 2018 as a whole, with the new questions, 14% of SMEs reported any borrowing event, with 4% reporting a Type 1 event:
Borrowing events in the previous 12 months
YEQ4 18 all SMEs Total 0
emp 1-9
emps 10-49 emps
50-249 emps
Unweighted base: 18,002 3602 5800 5800 2800
Type 1 event: 4% 3% 5% 7% 4%
1a: New application re need for funding 2% 2% 3% 5% 2%
1b: New/renewed application for specific finance 2% 1% 2% 3% 2%
1c: Any other new/renewed application * * * * *
Type 2/3: Cancel/pay off by bank or SME 2% 2% 3% 3% 3%
Automatic renewal of an overdraft 9% 8% 11% 12% 27%
Any borrowing event 14% 13% 17% 21% 32%
Pastevt Q31/50/50a/70/71/75 (25/26) All SMEs – new definition from Q1 2018
Larger SMEs remained more likely to report a borrowing event but this was primarily due to a higher proportion of automatic renewals. The 50-249 SMEs were the only group to record a similar level of borrowing events in 2018 to 2017 as a whole.
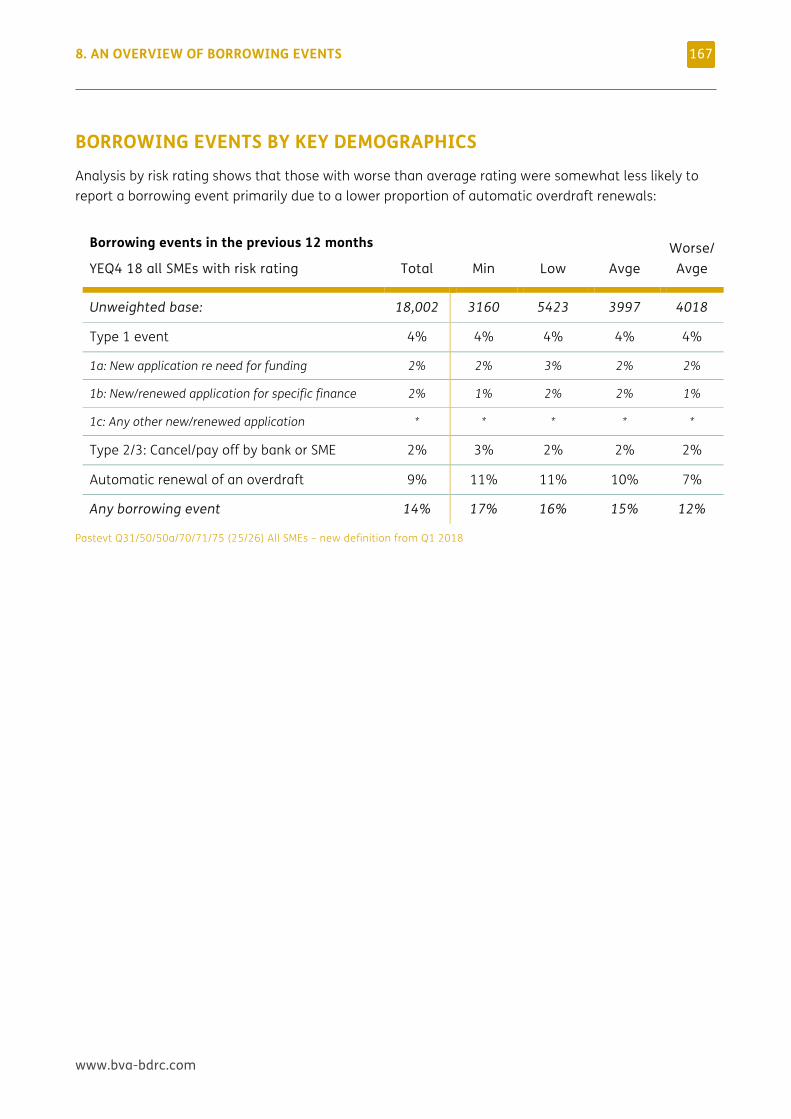
8. AN OVERVIEW OF BORROWING EVENTS
www.bva-bdrc.com
167
BORROWING EVENTS BY KEY DEMOGRAPHICS
Analysis by risk rating shows that those with worse than average rating were somewhat less likely to report a borrowing event primarily due to a lower proportion of automatic overdraft renewals:
Borrowing events in the previous 12 months
YEQ4 18 all SMEs with risk rating Total Min Low Avge Worse/
Avge
Unweighted base: 18,002 3160 5423 3997 4018
Type 1 event 4% 4% 4% 4% 4%
1a: New application re need for funding 2% 2% 3% 2% 2%
1b: New/renewed application for specific finance 2% 1% 2% 2% 1%
1c: Any other new/renewed application * * * * *
Type 2/3: Cancel/pay off by bank or SME 2% 3% 2% 2% 2%
Automatic renewal of an overdraft 9% 11% 11% 10% 7%
Any borrowing event 14% 17% 16% 15% 12%
Pastevt Q31/50/50a/70/71/75 (25/26) All SMEs – new definition from Q1 2018
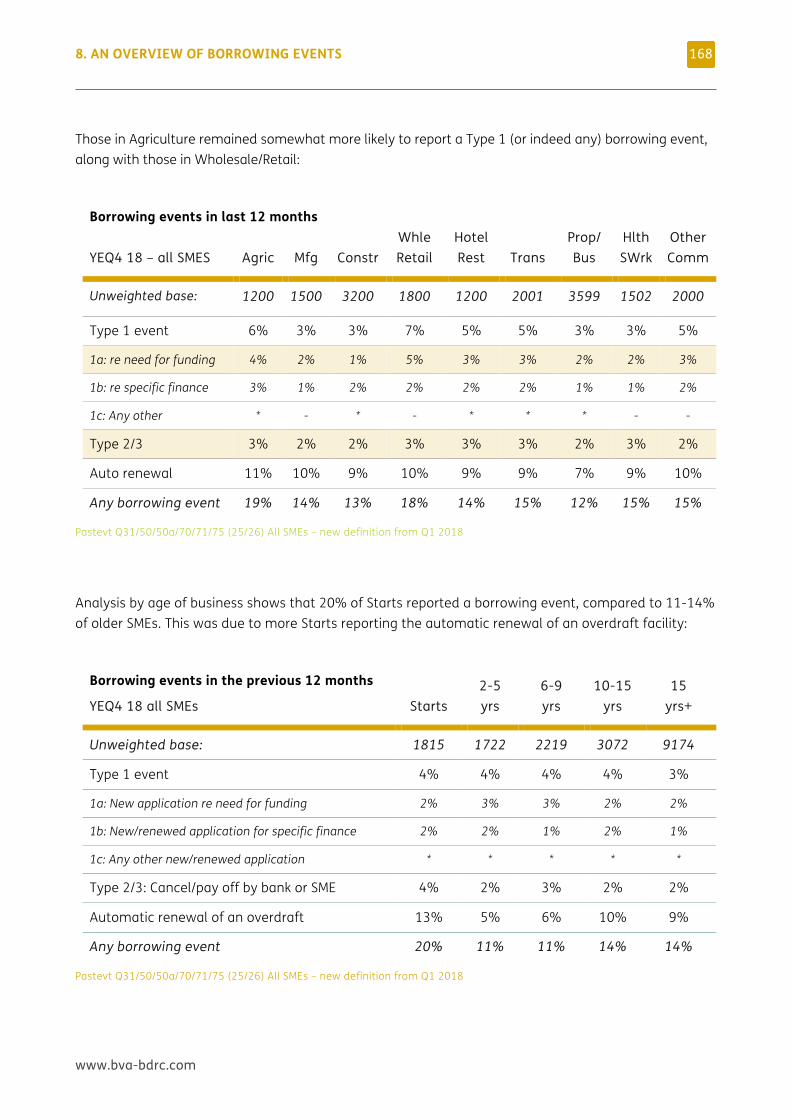
8. AN OVERVIEW OF BORROWING EVENTS
www.bva-bdrc.com
168
Those in Agriculture remained somewhat more likely to report a Type 1 (or indeed any) borrowing event, along with those in Wholesale/Retail:
Borrowing events in last 12 months
YEQ4 18 – all SMES Agric Mfg Constr Whle Retail
Hotel Rest Trans
Prop/ Bus
Hlth SWrk
Other Comm
Unweighted base: 1200 1500 3200 1800 1200 2001 3599 1502 2000
Type 1 event 6% 3% 3% 7% 5% 5% 3% 3% 5%
1a: re need for funding 4% 2% 1% 5% 3% 3% 2% 2% 3%
1b: re specific finance 3% 1% 2% 2% 2% 2% 1% 1% 2%
1c: Any other * - * - * * * - -
Type 2/3 3% 2% 2% 3% 3% 3% 2% 3% 2%
Auto renewal 11% 10% 9% 10% 9% 9% 7% 9% 10%
Any borrowing event 19% 14% 13% 18% 14% 15% 12% 15% 15%
Pastevt Q31/50/50a/70/71/75 (25/26) All SMEs – new definition from Q1 2018
Analysis by age of business shows that 20% of Starts reported a borrowing event, compared to 11-14% of older SMEs. This was due to more Starts reporting the automatic renewal of an overdraft facility:
Borrowing events in the previous 12 months
YEQ4 18 all SMEs Starts 2-5 yrs
6-9 yrs
10-15 yrs
15 yrs+
Unweighted base: 1815 1722 2219 3072 9174
Type 1 event 4% 4% 4% 4% 3%
1a: New application re need for funding 2% 3% 3% 2% 2%
1b: New/renewed application for specific finance 2% 2% 1% 2% 1%
1c: Any other new/renewed application * * * * *
Type 2/3: Cancel/pay off by bank or SME 4% 2% 3% 2% 2%
Automatic renewal of an overdraft 13% 5% 6% 10% 9%
Any borrowing event 20% 11% 11% 14% 14%
Pastevt Q31/50/50a/70/71/75 (25/26) All SMEs – new definition from Q1 2018
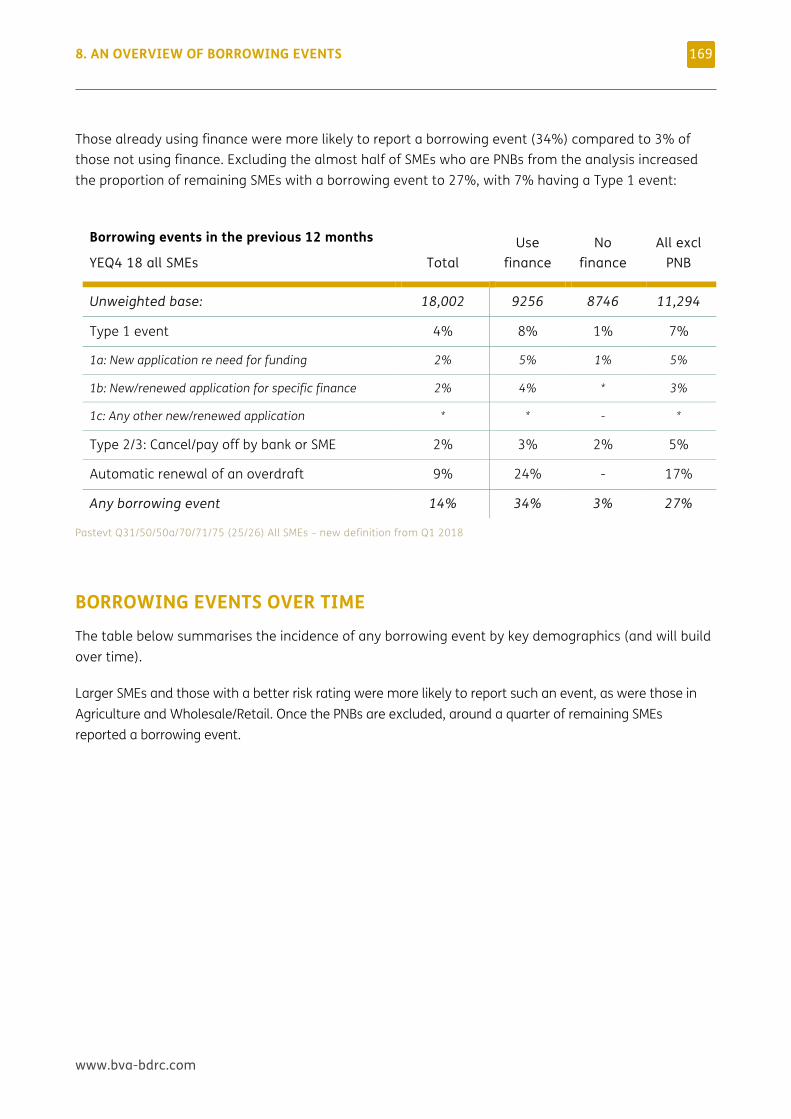
8. AN OVERVIEW OF BORROWING EVENTS
www.bva-bdrc.com
169
Those already using finance were more likely to report a borrowing event (34%) compared to 3% of those not using finance. Excluding the almost half of SMEs who are PNBs from the analysis increased the proportion of remaining SMEs with a borrowing event to 27%, with 7% having a Type 1 event:
Borrowing events in the previous 12 months
YEQ4 18 all SMEs Total Use
finance No
finance All excl
PNB
Unweighted base: 18,002 9256 8746 11,294
Type 1 event 4% 8% 1% 7%
1a: New application re need for funding 2% 5% 1% 5%
1b: New/renewed application for specific finance 2% 4% * 3%
1c: Any other new/renewed application * * - *
Type 2/3: Cancel/pay off by bank or SME 2% 3% 2% 5%
Automatic renewal of an overdraft 9% 24% - 17%
Any borrowing event 14% 34% 3% 27%
Pastevt Q31/50/50a/70/71/75 (25/26) All SMEs – new definition from Q1 2018
BORROWING EVENTS OVER TIME The table below summarises the incidence of any borrowing event by key demographics (and will build over time).
Larger SMEs and those with a better risk rating were more likely to report such an event, as were those in Agriculture and Wholesale/Retail. Once the PNBs are excluded, around a quarter of remaining SMEs reported a borrowing event.
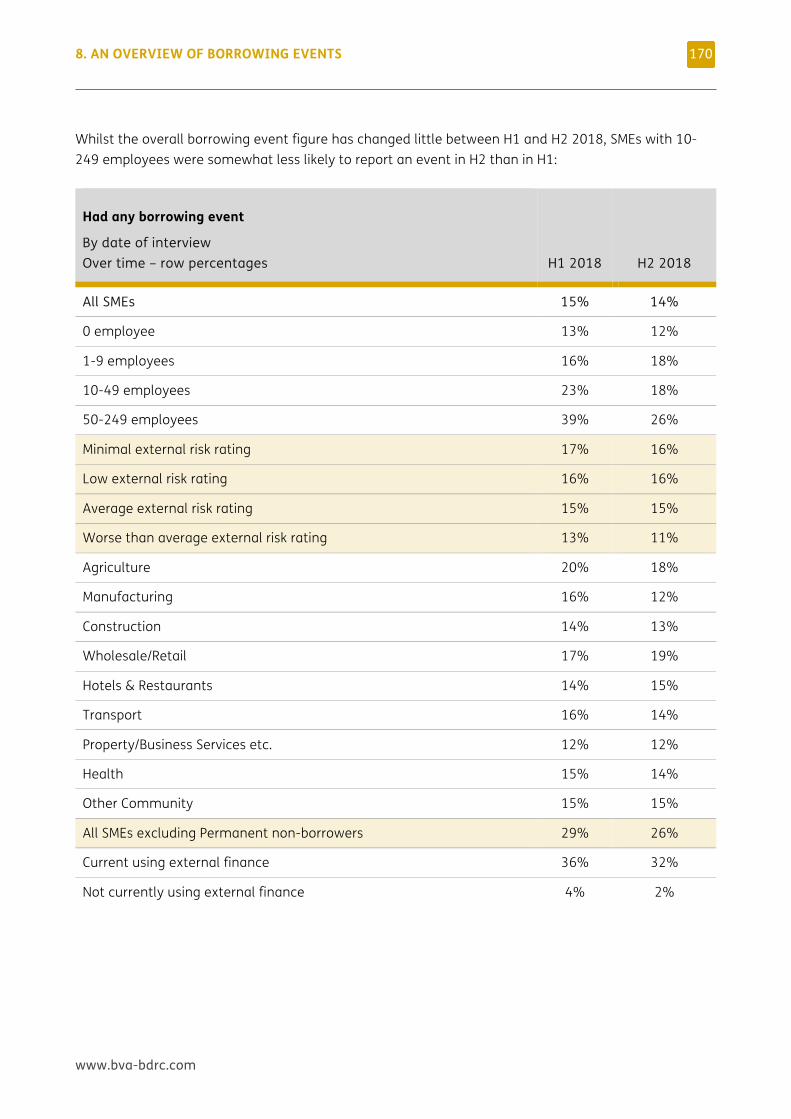
8. AN OVERVIEW OF BORROWING EVENTS
www.bva-bdrc.com
170
Whilst the overall borrowing event figure has changed little between H1 and H2 2018, SMEs with 10-249 employees were somewhat less likely to report an event in H2 than in H1:
Had any borrowing event
By date of interview Over time – row percentages H1 2018 H2 2018
All SMEs 15% 14%
0 employee 13% 12%
1-9 employees 16% 18%
10-49 employees 23% 18%
50-249 employees 39% 26%
Minimal external risk rating 17% 16%
Low external risk rating 16% 16%
Average external risk rating 15% 15%
Worse than average external risk rating 13% 11%
Agriculture 20% 18%
Manufacturing 16% 12%
Construction 14% 13%
Wholesale/Retail 17% 19%
Hotels & Restaurants 14% 15%
Transport 16% 14%
Property/Business Services etc. 12% 12%
Health 15% 14%
Other Community 15% 15%
All SMEs excluding Permanent non-borrowers 29% 26%
Current using external finance 36% 32%
Not currently using external finance 4% 2%
www.bva-bdrc.com
9 BORROWING EVENTS IN MORE DETAIL THIS CHAPTER PROVIDES more detail on the borrowing events now reported in the SME Finance Monitor.
9. BORROWING EVENTS IN MORE DETAIL
www.bva-bdrc.com
172
KEY FINDINGS 2% of SMEs reported a Type 1a borrowing event (an application for new finance as a result of a need for funding). Overall, 7 in 10 Type 1a applicants applied for a core form of finance, including 39% applying for a bank loan and 26% for a bank overdraft
• 63% applied to their main bank, typically for a bank loan (50%) or bank overdraft (38%)
• 19% applied to another provider they were already using, typically for a bank loan (46%) or leasing/hp (14%)
• 22% applied to a new provider and again a bank loan (32%) and leasing/hp (17%) were most likely to be mentioned
2% of SMEs reported a Type 1b borrowing event (another application for new or renewed finance not as a result of a need for funding). Three quarters of Type 1b applicants applied for a core form of finance, including 58% applying for a bank overdraft and 26% for a bank loan
• 66% applied to their main bank, typically for a bank overdraft (82%) or bank loan (23%)
• 13% applied to another provider they were already using, typically for leasing/hp (51%) or a commercial mortgage (35%)
• 6% applied to a new provider and again leasing/hp (58%) was most likely to have been applied for
48% of SMEs with an overdraft said that it had been automatically renewed in the previous 12 months, the equivalent of 9% of all SMEs
9. BORROWING EVENTS IN MORE DETAIL
www.bva-bdrc.com
173
This is the third of four revised chapters looking at borrowing events in the wider finance market beyond loans and overdrafts. The previous chapter identified how many SMEs had reported borrowing events, both overall and by different demographics. This chapter looks at each of these four types of event in more detail:
• Type 1a: Where a need for funding had resulted in a borrowing event (involving any product and any provider). These are an updated and extended equivalent to the previously recorded Type 1 applications for new/renewed loan or overdraft facilities and more information about the types of application made is provided below. The final outcome of these applications is covered in the next chapter (10).
• Type 1b: Where the SME has (also) applied for any other new or renewed facility, from a list of major products. These are also part of the updated and extended equivalent to the previously recorded Type 1 applications for new/renewed loan or overdraft facilities and more information about the types of application made is provided below. The final outcome of these applications is covered in the next chapter (10).
• Where the SMEs overdraft had been automatically renewed - limited information is available on these events but is reported below.
• Type 2/3 events: Where the SME or the finance provider had sought to cancel or re-negotiate a facility before it was due to be repaid (Limited information is available on these events but is reported below).
• Note that Type 1c events (any other application made and not already covered) were reported by very few SMEs and no further information is available on them.
In previous Monitor reports, where application data had built up over time, reporting of borrowing events was based on those that had occurred in the last 18 months (irrespective of the date of interview). Given that most of the data below is only available for interviews conducted from Q1 2018, base sizes are limited and so this chapter is currently based on all applications reported during interviews in 2018 (which might have occurred from Q1 2017 onwards).
Analysis by application date will be introduced as base sizes increase – these were previously reported in 18 month periods and so the current 24 month timeframe is only slightly longer than that previously used.
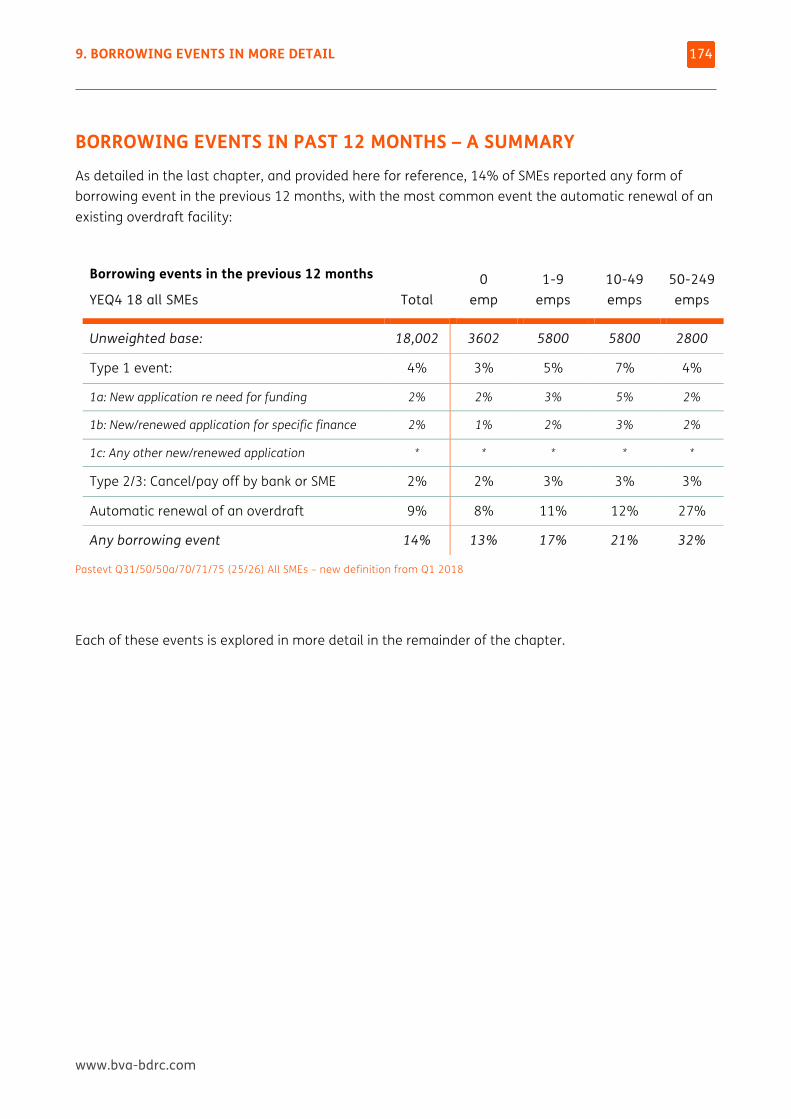
9. BORROWING EVENTS IN MORE DETAIL
www.bva-bdrc.com
174
BORROWING EVENTS IN PAST 12 MONTHS – A SUMMARY As detailed in the last chapter, and provided here for reference, 14% of SMEs reported any form of borrowing event in the previous 12 months, with the most common event the automatic renewal of an existing overdraft facility:
Borrowing events in the previous 12 months
YEQ4 18 all SMEs Total 0
emp 1-9
emps 10-49 emps
50-249 emps
Unweighted base: 18,002 3602 5800 5800 2800
Type 1 event: 4% 3% 5% 7% 4%
1a: New application re need for funding 2% 2% 3% 5% 2%
1b: New/renewed application for specific finance 2% 1% 2% 3% 2%
1c: Any other new/renewed application * * * * *
Type 2/3: Cancel/pay off by bank or SME 2% 2% 3% 3% 3%
Automatic renewal of an overdraft 9% 8% 11% 12% 27%
Any borrowing event 14% 13% 17% 21% 32%
Pastevt Q31/50/50a/70/71/75 (25/26) All SMEs – new definition from Q1 2018
Each of these events is explored in more detail in the remainder of the chapter.
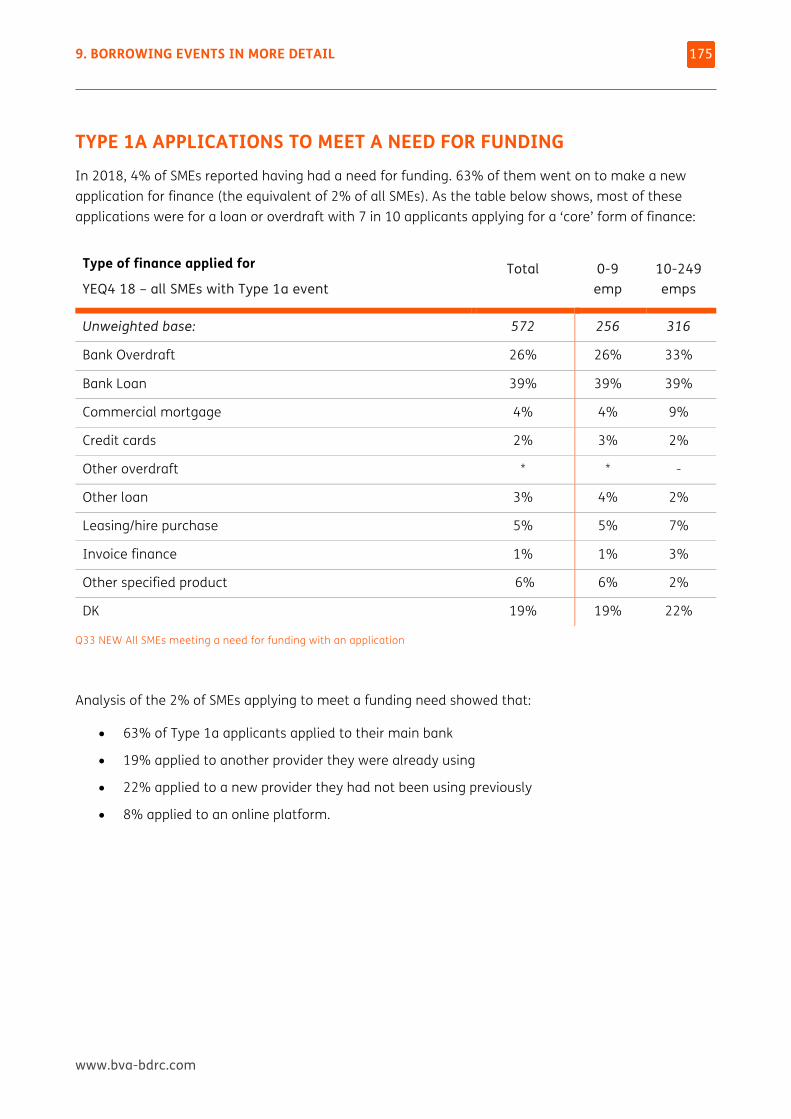
9. BORROWING EVENTS IN MORE DETAIL
www.bva-bdrc.com
175
TYPE 1A APPLICATIONS TO MEET A NEED FOR FUNDING In 2018, 4% of SMEs reported having had a need for funding. 63% of them went on to make a new application for finance (the equivalent of 2% of all SMEs). As the table below shows, most of these applications were for a loan or overdraft with 7 in 10 applicants applying for a ‘core’ form of finance:
Type of finance applied for
YEQ4 18 – all SMEs with Type 1a event Total
0-9 emp
10-249 emps
Unweighted base: 572 256 316
Bank Overdraft 26% 26% 33%
Bank Loan 39% 39% 39%
Commercial mortgage 4% 4% 9%
Credit cards 2% 3% 2%
Other overdraft * * -
Other loan 3% 4% 2%
Leasing/hire purchase 5% 5% 7%
Invoice finance 1% 1% 3%
Other specified product 6% 6% 2%
DK 19% 19% 22%
Q33 NEW All SMEs meeting a need for funding with an application
Analysis of the 2% of SMEs applying to meet a funding need showed that:
• 63% of Type 1a applicants applied to their main bank
• 19% applied to another provider they were already using
• 22% applied to a new provider they had not been using previously
• 8% applied to an online platform.
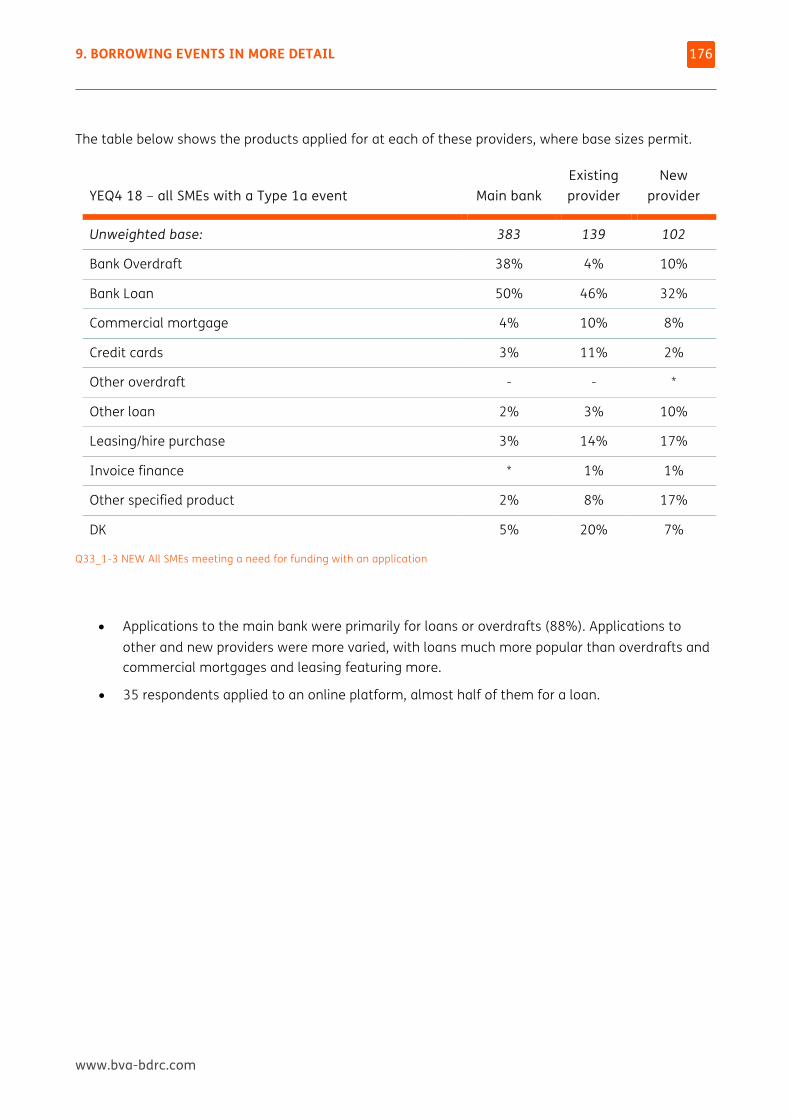
9. BORROWING EVENTS IN MORE DETAIL
www.bva-bdrc.com
176
The table below shows the products applied for at each of these providers, where base sizes permit.
YEQ4 18 – all SMEs with a Type 1a event Main bank
Existing provider
New provider
Unweighted base: 383 139 102
Bank Overdraft 38% 4% 10%
Bank Loan 50% 46% 32%
Commercial mortgage 4% 10% 8%
Credit cards 3% 11% 2%
Other overdraft - - *
Other loan 2% 3% 10%
Leasing/hire purchase 3% 14% 17%
Invoice finance * 1% 1%
Other specified product 2% 8% 17%
DK 5% 20% 7%
Q33_1-3 NEW All SMEs meeting a need for funding with an application
• Applications to the main bank were primarily for loans or overdrafts (88%). Applications to other and new providers were more varied, with loans much more popular than overdrafts and commercial mortgages and leasing featuring more.
• 35 respondents applied to an online platform, almost half of them for a loan.
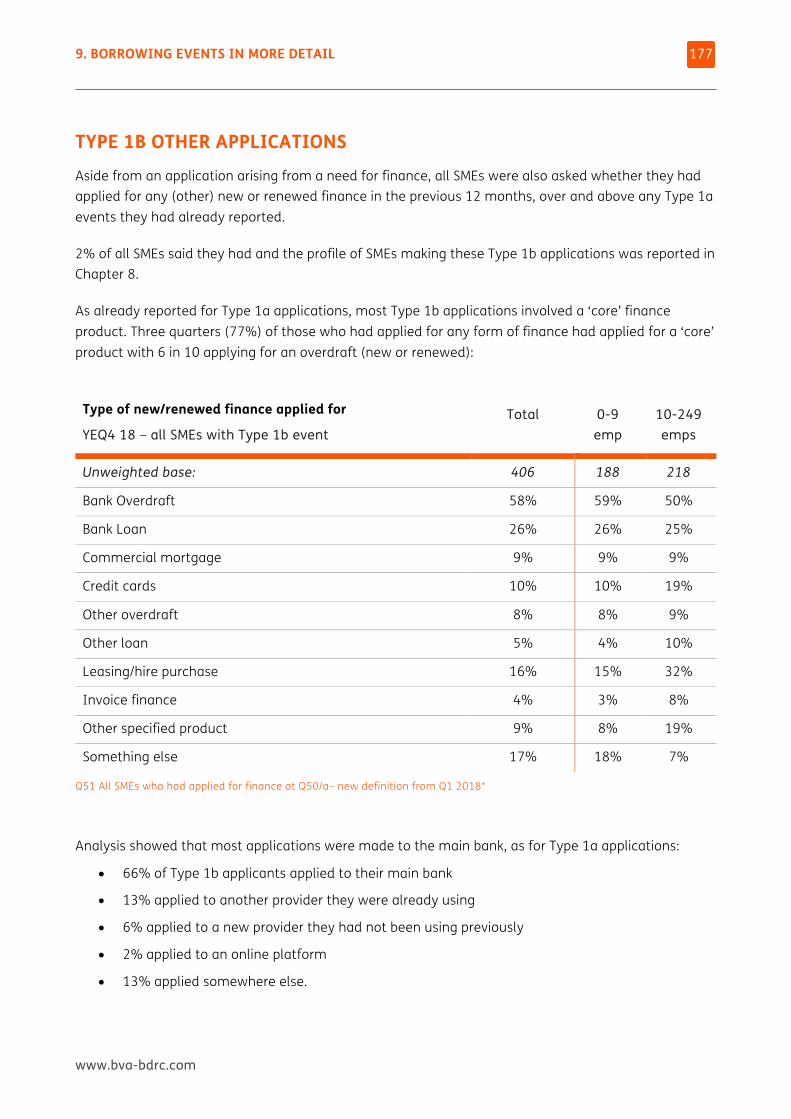
9. BORROWING EVENTS IN MORE DETAIL
www.bva-bdrc.com
177
TYPE 1B OTHER APPLICATIONS Aside from an application arising from a need for finance, all SMEs were also asked whether they had applied for any (other) new or renewed finance in the previous 12 months, over and above any Type 1a events they had already reported.
2% of all SMEs said they had and the profile of SMEs making these Type 1b applications was reported in Chapter 8.
As already reported for Type 1a applications, most Type 1b applications involved a ‘core’ finance product. Three quarters (77%) of those who had applied for any form of finance had applied for a ‘core’ product with 6 in 10 applying for an overdraft (new or renewed):
Type of new/renewed finance applied for
YEQ4 18 – all SMEs with Type 1b event Total
0-9 emp
10-249 emps
Unweighted base: 406 188 218
Bank Overdraft 58% 59% 50%
Bank Loan 26% 26% 25%
Commercial mortgage 9% 9% 9%
Credit cards 10% 10% 19%
Other overdraft 8% 8% 9%
Other loan 5% 4% 10%
Leasing/hire purchase 16% 15% 32%
Invoice finance 4% 3% 8%
Other specified product 9% 8% 19%
Something else 17% 18% 7%
Q51 All SMEs who had applied for finance at Q50/a– new definition from Q1 2018*
Analysis showed that most applications were made to the main bank, as for Type 1a applications:
• 66% of Type 1b applicants applied to their main bank
• 13% applied to another provider they were already using
• 6% applied to a new provider they had not been using previously
• 2% applied to an online platform
• 13% applied somewhere else.
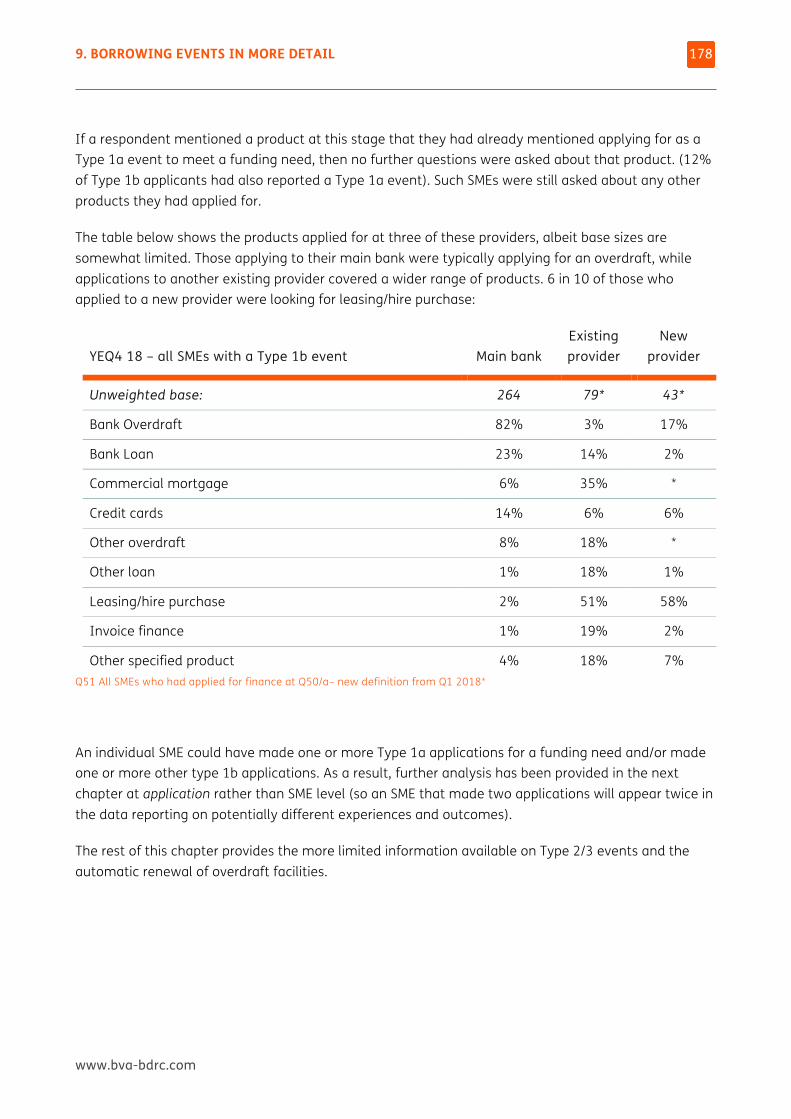
9. BORROWING EVENTS IN MORE DETAIL
www.bva-bdrc.com
178
If a respondent mentioned a product at this stage that they had already mentioned applying for as a Type 1a event to meet a funding need, then no further questions were asked about that product. (12% of Type 1b applicants had also reported a Type 1a event). Such SMEs were still asked about any other products they had applied for.
The table below shows the products applied for at three of these providers, albeit base sizes are somewhat limited. Those applying to their main bank were typically applying for an overdraft, while applications to another existing provider covered a wider range of products. 6 in 10 of those who applied to a new provider were looking for leasing/hire purchase:
YEQ4 18 – all SMEs with a Type 1b event Main bank
Existing provider
New provider
Unweighted base: 264 79* 43*
Bank Overdraft 82% 3% 17%
Bank Loan 23% 14% 2%
Commercial mortgage 6% 35% *
Credit cards 14% 6% 6%
Other overdraft 8% 18% *
Other loan 1% 18% 1%
Leasing/hire purchase 2% 51% 58%
Invoice finance 1% 19% 2%
Other specified product 4% 18% 7% Q51 All SMEs who had applied for finance at Q50/a– new definition from Q1 2018*
An individual SME could have made one or more Type 1a applications for a funding need and/or made one or more other type 1b applications. As a result, further analysis has been provided in the next chapter at application rather than SME level (so an SME that made two applications will appear twice in the data reporting on potentially different experiences and outcomes).
The rest of this chapter provides the more limited information available on Type 2/3 events and the automatic renewal of overdraft facilities.
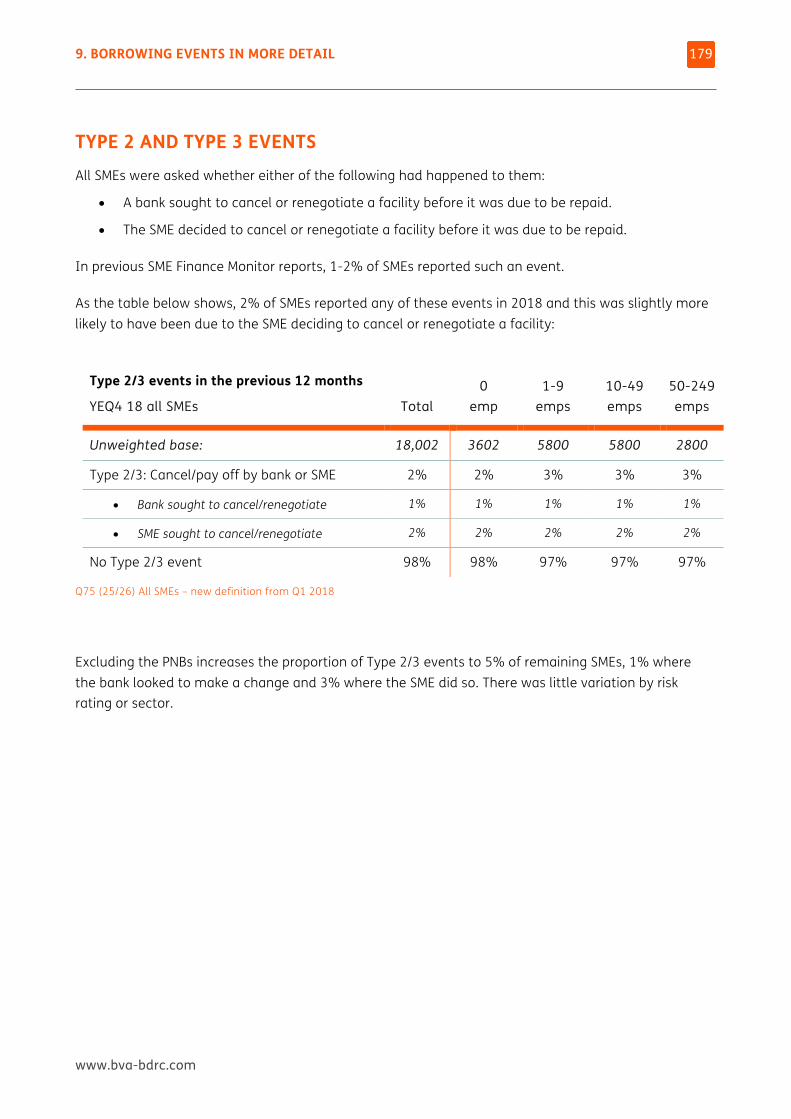
9. BORROWING EVENTS IN MORE DETAIL
www.bva-bdrc.com
179
TYPE 2 AND TYPE 3 EVENTS All SMEs were asked whether either of the following had happened to them:
• A bank sought to cancel or renegotiate a facility before it was due to be repaid.
• The SME decided to cancel or renegotiate a facility before it was due to be repaid.
In previous SME Finance Monitor reports, 1-2% of SMEs reported such an event.
As the table below shows, 2% of SMEs reported any of these events in 2018 and this was slightly more likely to have been due to the SME deciding to cancel or renegotiate a facility:
Type 2/3 events in the previous 12 months
YEQ4 18 all SMEs Total 0
emp 1-9
emps 10-49 emps
50-249 emps
Unweighted base: 18,002 3602 5800 5800 2800
Type 2/3: Cancel/pay off by bank or SME 2% 2% 3% 3% 3%
• Bank sought to cancel/renegotiate 1% 1% 1% 1% 1%
• SME sought to cancel/renegotiate 2% 2% 2% 2% 2%
No Type 2/3 event 98% 98% 97% 97% 97%
Q75 (25/26) All SMEs – new definition from Q1 2018
Excluding the PNBs increases the proportion of Type 2/3 events to 5% of remaining SMEs, 1% where the bank looked to make a change and 3% where the SME did so. There was little variation by risk rating or sector.
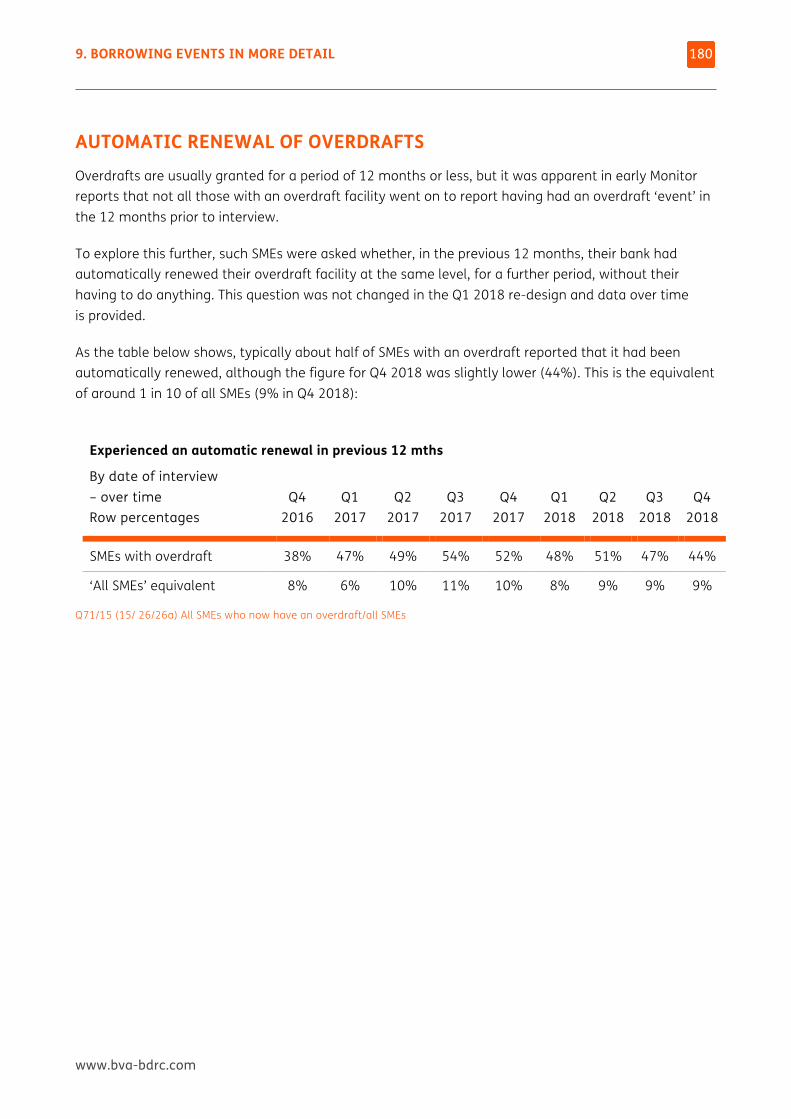
9. BORROWING EVENTS IN MORE DETAIL
www.bva-bdrc.com
180
AUTOMATIC RENEWAL OF OVERDRAFTS Overdrafts are usually granted for a period of 12 months or less, but it was apparent in early Monitor reports that not all those with an overdraft facility went on to report having had an overdraft ‘event’ in the 12 months prior to interview.
To explore this further, such SMEs were asked whether, in the previous 12 months, their bank had automatically renewed their overdraft facility at the same level, for a further period, without their having to do anything. This question was not changed in the Q1 2018 re-design and data over time is provided.
As the table below shows, typically about half of SMEs with an overdraft reported that it had been automatically renewed, although the figure for Q4 2018 was slightly lower (44%). This is the equivalent of around 1 in 10 of all SMEs (9% in Q4 2018):
Experienced an automatic renewal in previous 12 mths
By date of interview – over time Row percentages
Q4 2016
Q1 2017
Q2 2017
Q3 2017
Q4 2017
Q1 2018
Q2 2018
Q3 2018
Q4 2018
SMEs with overdraft 38% 47% 49% 54% 52% 48% 51% 47% 44%
‘All SMEs’ equivalent 8% 6% 10% 11% 10% 8% 9% 9% 9%
Q71/15 (15/ 26/26a) All SMEs who now have an overdraft/all SMEs
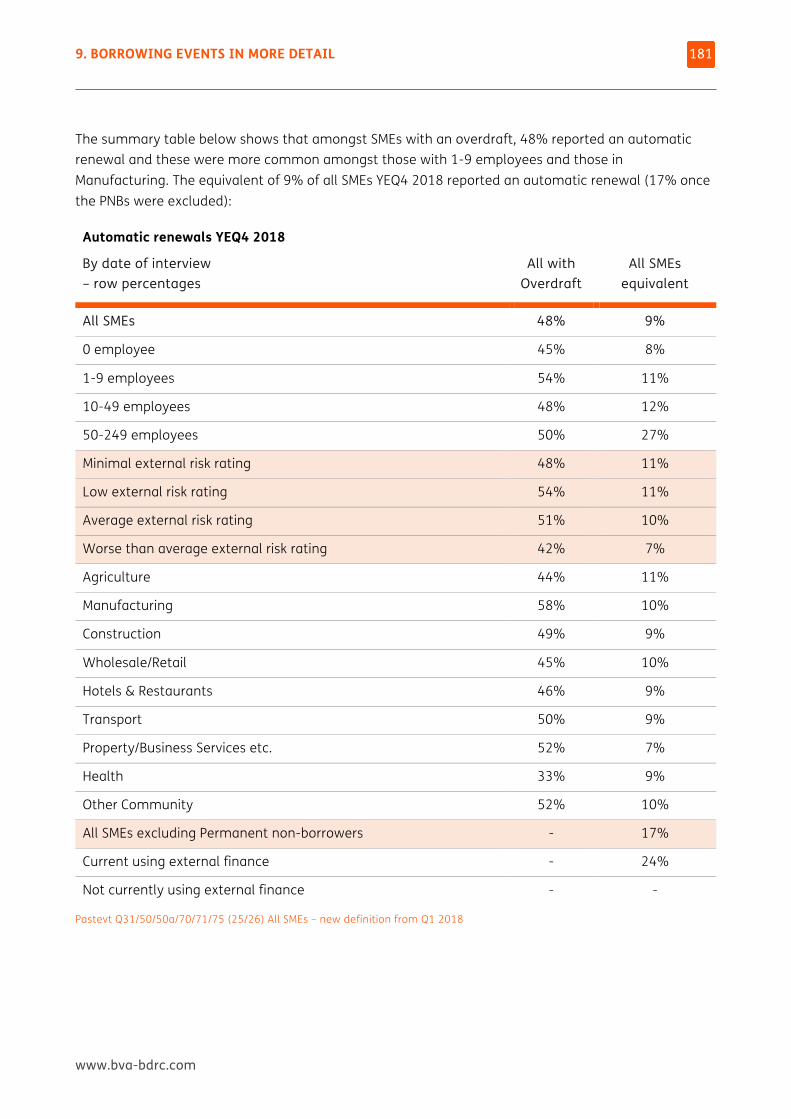
9. BORROWING EVENTS IN MORE DETAIL
www.bva-bdrc.com
181
The summary table below shows that amongst SMEs with an overdraft, 48% reported an automatic renewal and these were more common amongst those with 1-9 employees and those in Manufacturing. The equivalent of 9% of all SMEs YEQ4 2018 reported an automatic renewal (17% once the PNBs were excluded):
Pastevt Q31/50/50a/70/71/75 (25/26) All SMEs – new definition from Q1 2018
Automatic renewals YEQ4 2018
By date of interview – row percentages
All with Overdraft
All SMEs equivalent
All SMEs 48% 9%
0 employee 45% 8%
1-9 employees 54% 11%
10-49 employees 48% 12%
50-249 employees 50% 27%
Minimal external risk rating 48% 11%
Low external risk rating 54% 11%
Average external risk rating 51% 10%
Worse than average external risk rating 42% 7%
Agriculture 44% 11%
Manufacturing 58% 10%
Construction 49% 9%
Wholesale/Retail 45% 10%
Hotels & Restaurants 46% 9%
Transport 50% 9%
Property/Business Services etc. 52% 7%
Health 33% 9%
Other Community 52% 10%
All SMEs excluding Permanent non-borrowers - 17%
Current using external finance - 24%
Not currently using external finance - -
www.bva-bdrc.com
10 OUTCOME OF TYPE 1 APPLICATIONS THIS CHAPTER PROVIDES more detail on the outcome of all Type 1a and Type 1b borrowing events for new/renewed finance, including the amount granted and whether security was required.
10. OUTCOME OF TYPE 1 APPLICATIONS
www.bva-bdrc.com
183
KEY FINDINGS This chapter is based on all Type 1 applications made, so an SME that had several Type 1a and/or Type 1b events will appear more than once in the analysis.
1305 Type 1a/1b applications were reported in 2018 (made between Q1 2017 and Q4 2018):
• 64% were made to their main bank, 17% to another existing provider, 12% to a new provider, 3% to an online platform and 4% elsewhere
• 35% of applications were made online
• 48% were applications for a product they had not used before
• 82% were in the name of the business
• 64% were for either a bank loan (32%) or a bank overdraft (32%). 9% were for leasing/hp
1233 of the applications reported had received a response:
• 80% ended the process with a facility: 71% were offered the facility they wanted and took it, 7% had their facility after issues and 2% took a different product to the one they applied for
• 5% were offered a facility but declined it, typically due to cost, or a better offer elsewhere
• 15% were turned down for a facility
Those more likely to end the process with a facility (80% overall) included:
• SMEs with 50-249 employees (91%), those applying to an existing provider (93%), those not applying for the first time (86%), those applying for leasing/hp or a credit card (both 97%)
10. OUTCOME OF TYPE 1 APPLICATIONS
www.bva-bdrc.com
184
Those more likely to be declined (15% overall) included:
• Those applying to a new provider (24%), those applying for the first time (18%) and those applying for a bank loan (28%)
• Just over half (57%) of those declined by their main bank said their bank had taken some action, with 34% saying the bank explained why they could not lend to them. 21% of these applicants recalled being made aware of the appeals process and 2% of the referrals process but none took these options
Analysis by 18 month application period (on partial data) showed very consistent success rates overall:
• 80% of applications that took place Q1 2017 to Q2 2018 were successful and 81% of those that took place Q3 2017 to Q4 2018
• There was also little change in specific success rates for bank overdrafts, bank loans or leasing/hp
82% of applications were handled satisfactorily:
• This increased to 93% of applications made to an existing provider, compared to 77% to a new provider (where more facilities were declined), and 96% of applications made for leasing/hp
• This also increased to 94% where they had been offered what they wanted but decreased to 28% of those who were turned down
80% of applications were thought to have had a satisfactory outcome:
• Those who were offered what they wanted (94%) and those who took their facility after issues (91%) were more likely to have been satisfied with the outcome than those declined (22%)
• 95% of applications for leasing/hp and credit cards had a satisfactory outcome, compared to 73% of loan applications
10. OUTCOME OF TYPE 1 APPLICATIONS
www.bva-bdrc.com
185
70% were either very satisfied with the outcome of their application or said that there had been no adverse effects. The main adverse effect was running the business being more of a struggle (17% of applications)
• 81% of those offered what they wanted were either very satisfied with the outcome or said there had been no adverse impact, decreasing to 28% of those declined, where 40% said running the business was more of struggle, 42% said they had not expanded as they would have liked and 30% had made spending cuts
10. OUTCOME OF TYPE 1 APPLICATIONS
www.bva-bdrc.com
186
This is the final of the four revised chapters looking at all borrowing events in the wider finance market beyond loans and overdrafts. It looks at the application process, the final outcome of these Type 1 borrowing events and the impact on the SME of the outcome of the application(s) made. The new questionnaire was designed to provide an overall view of all applications for finance (across providers and products) and how successful these applications were, but some analysis is now possible by specific type of provider and product.
THE OUTCOME OF ALL TYPE 1A/1B NEW AND RENEWED APPLICATIONS Those who had applied for a facility to meet a finance need and those who reported making any other application for new or renewed finance were asked a series of questions about this/these application(s), including their outcome. This chapter currently includes all Type 1a and 1b applications reported to date with the revised questionnaire (ie from those interviewed in 2018 reporting events dating back to Q1 2017).
Compared to previous reports, this section:
• Has been expanded to include applications for a wider range of products and providers other than the main bank to provide a more holistic view of finance applied for
• Has been simplified in terms of the number of questions asked about each application
The analysis below is based on the total number of Type 1a and 1b applications made, as one SME could make several applications for different products and to different providers.
The first half of this chapter presents the overall application success rates and impact of the application, across all products, with some analysis by size of SME and finance provider. The second half of the chapter provides this data by product, where base sizes are sufficient.
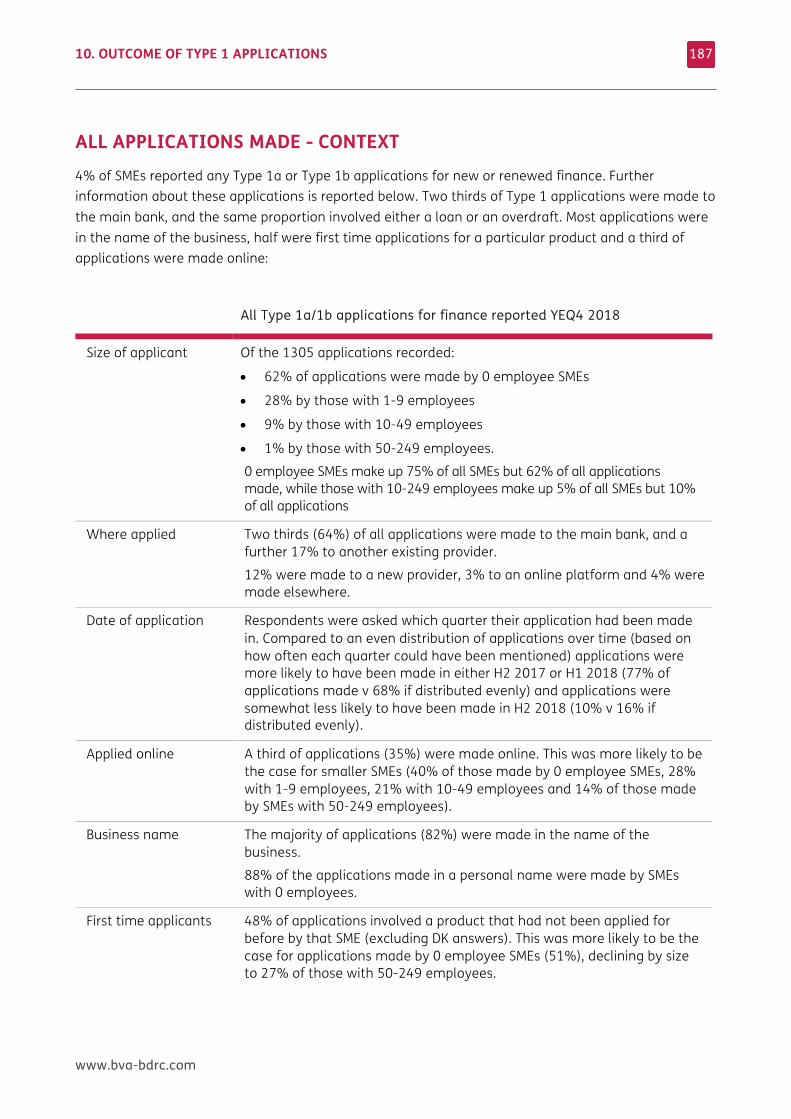
10. OUTCOME OF TYPE 1 APPLICATIONS
www.bva-bdrc.com
187
ALL APPLICATIONS MADE - CONTEXT 4% of SMEs reported any Type 1a or Type 1b applications for new or renewed finance. Further information about these applications is reported below. Two thirds of Type 1 applications were made to the main bank, and the same proportion involved either a loan or an overdraft. Most applications were in the name of the business, half were first time applications for a particular product and a third of applications were made online:
All Type 1a/1b applications for finance reported YEQ4 2018
Size of applicant Of the 1305 applications recorded:
• 62% of applications were made by 0 employee SMEs
• 28% by those with 1-9 employees
• 9% by those with 10-49 employees
• 1% by those with 50-249 employees.
0 employee SMEs make up 75% of all SMEs but 62% of all applications made, while those with 10-249 employees make up 5% of all SMEs but 10% of all applications
Where applied Two thirds (64%) of all applications were made to the main bank, and a further 17% to another existing provider.
12% were made to a new provider, 3% to an online platform and 4% were made elsewhere.
Date of application Respondents were asked which quarter their application had been made in. Compared to an even distribution of applications over time (based on how often each quarter could have been mentioned) applications were more likely to have been made in either H2 2017 or H1 2018 (77% of applications made v 68% if distributed evenly) and applications were somewhat less likely to have been made in H2 2018 (10% v 16% if distributed evenly).
Applied online A third of applications (35%) were made online. This was more likely to be the case for smaller SMEs (40% of those made by 0 employee SMEs, 28% with 1-9 employees, 21% with 10-49 employees and 14% of those made by SMEs with 50-249 employees).
Business name The majority of applications (82%) were made in the name of the business.
88% of the applications made in a personal name were made by SMEs with 0 employees.
First time applicants 48% of applications involved a product that had not been applied for before by that SME (excluding DK answers). This was more likely to be the case for applications made by 0 employee SMEs (51%), declining by size to 27% of those with 50-249 employees.
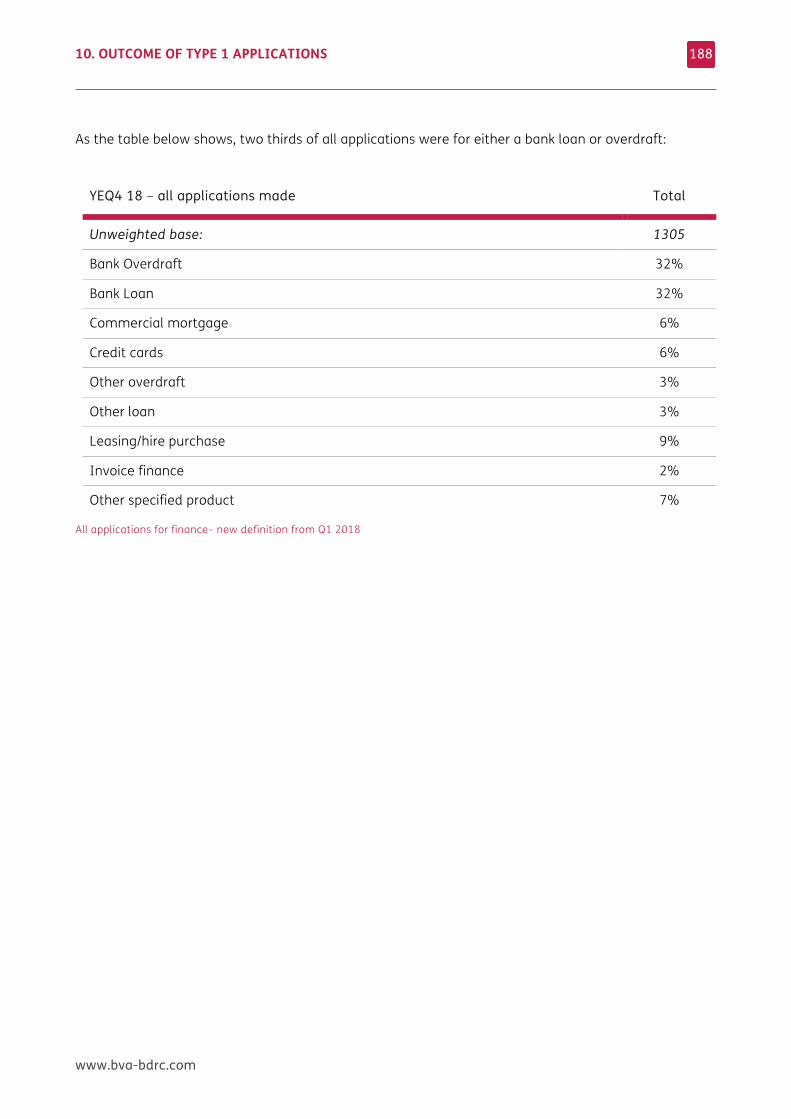
10. OUTCOME OF TYPE 1 APPLICATIONS
www.bva-bdrc.com
188
As the table below shows, two thirds of all applications were for either a bank loan or overdraft:
YEQ4 18 – all applications made Total
Unweighted base: 1305
Bank Overdraft 32%
Bank Loan 32%
Commercial mortgage 6%
Credit cards 6%
Other overdraft 3%
Other loan 3%
Leasing/hire purchase 9%
Invoice finance 2%
Other specified product 7%
All applications for finance– new definition from Q1 2018
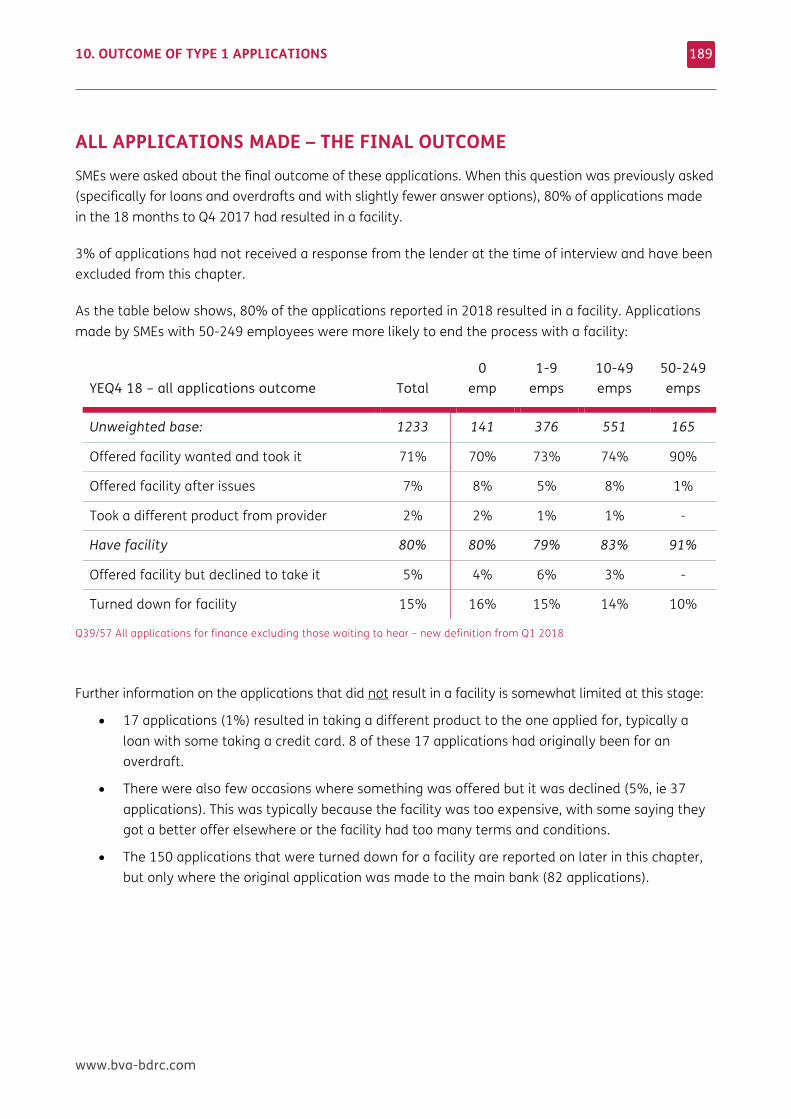
10. OUTCOME OF TYPE 1 APPLICATIONS
www.bva-bdrc.com
189
ALL APPLICATIONS MADE – THE FINAL OUTCOME SMEs were asked about the final outcome of these applications. When this question was previously asked (specifically for loans and overdrafts and with slightly fewer answer options), 80% of applications made in the 18 months to Q4 2017 had resulted in a facility.
3% of applications had not received a response from the lender at the time of interview and have been excluded from this chapter.
As the table below shows, 80% of the applications reported in 2018 resulted in a facility. Applications made by SMEs with 50-249 employees were more likely to end the process with a facility:
YEQ4 18 – all applications outcome Total
0 emp
1-9 emps
10-49 emps
50-249 emps
Unweighted base: 1233 141 376 551 165
Offered facility wanted and took it 71% 70% 73% 74% 90%
Offered facility after issues 7% 8% 5% 8% 1%
Took a different product from provider 2% 2% 1% 1% -
Have facility 80% 80% 79% 83% 91%
Offered facility but declined to take it 5% 4% 6% 3% -
Turned down for facility 15% 16% 15% 14% 10%
Q39/57 All applications for finance excluding those waiting to hear – new definition from Q1 2018
Further information on the applications that did not result in a facility is somewhat limited at this stage:
• 17 applications (1%) resulted in taking a different product to the one applied for, typically a loan with some taking a credit card. 8 of these 17 applications had originally been for an overdraft.
• There were also few occasions where something was offered but it was declined (5%, ie 37 applications). This was typically because the facility was too expensive, with some saying they got a better offer elsewhere or the facility had too many terms and conditions.
• The 150 applications that were turned down for a facility are reported on later in this chapter, but only where the original application was made to the main bank (82 applications).
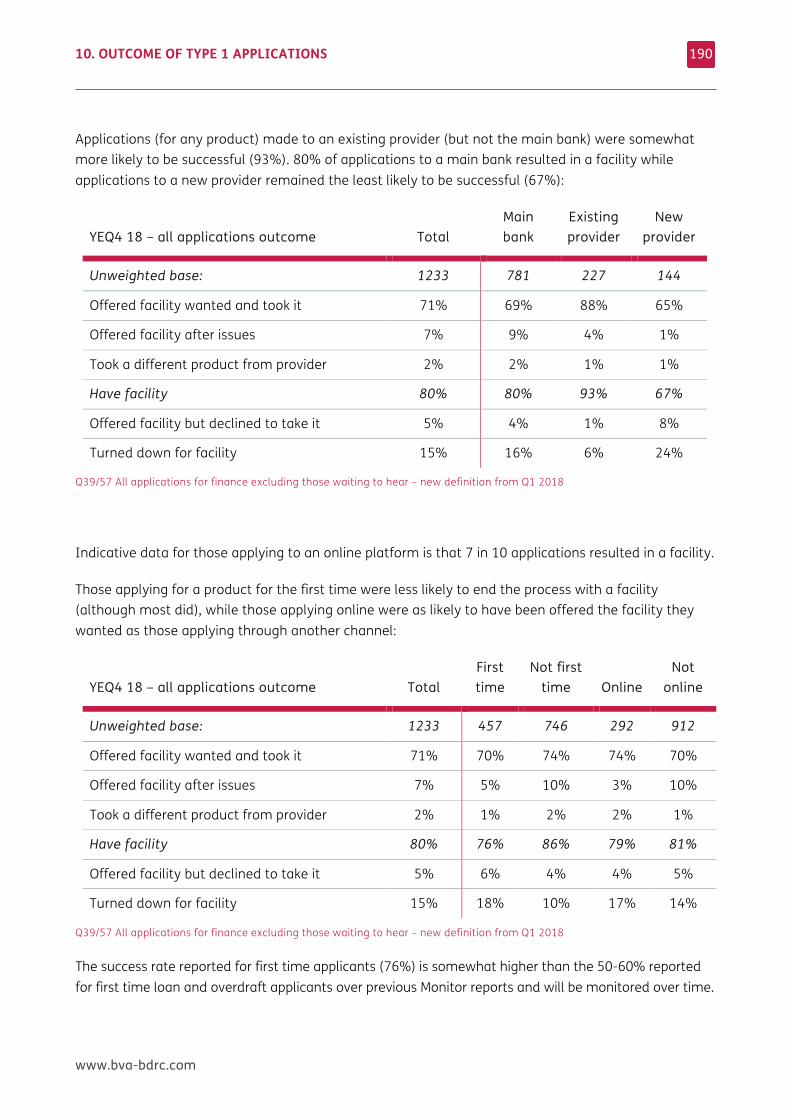
10. OUTCOME OF TYPE 1 APPLICATIONS
www.bva-bdrc.com
190
Applications (for any product) made to an existing provider (but not the main bank) were somewhat more likely to be successful (93%). 80% of applications to a main bank resulted in a facility while applications to a new provider remained the least likely to be successful (67%):
YEQ4 18 – all applications outcome Total
Main bank
Existing provider
New provider
Unweighted base: 1233 781 227 144
Offered facility wanted and took it 71% 69% 88% 65%
Offered facility after issues 7% 9% 4% 1%
Took a different product from provider 2% 2% 1% 1%
Have facility 80% 80% 93% 67%
Offered facility but declined to take it 5% 4% 1% 8%
Turned down for facility 15% 16% 6% 24%
Q39/57 All applications for finance excluding those waiting to hear – new definition from Q1 2018
Indicative data for those applying to an online platform is that 7 in 10 applications resulted in a facility.
Those applying for a product for the first time were less likely to end the process with a facility (although most did), while those applying online were as likely to have been offered the facility they wanted as those applying through another channel:
YEQ4 18 – all applications outcome Total
First time
Not first time Online
Not online
Unweighted base: 1233 457 746 292 912
Offered facility wanted and took it 71% 70% 74% 74% 70%
Offered facility after issues 7% 5% 10% 3% 10%
Took a different product from provider 2% 1% 2% 2% 1%
Have facility 80% 76% 86% 79% 81%
Offered facility but declined to take it 5% 6% 4% 4% 5%
Turned down for facility 15% 18% 10% 17% 14%
Q39/57 All applications for finance excluding those waiting to hear – new definition from Q1 2018
The success rate reported for first time applicants (76%) is somewhat higher than the 50-60% reported for first time loan and overdraft applicants over previous Monitor reports and will be monitored over time.
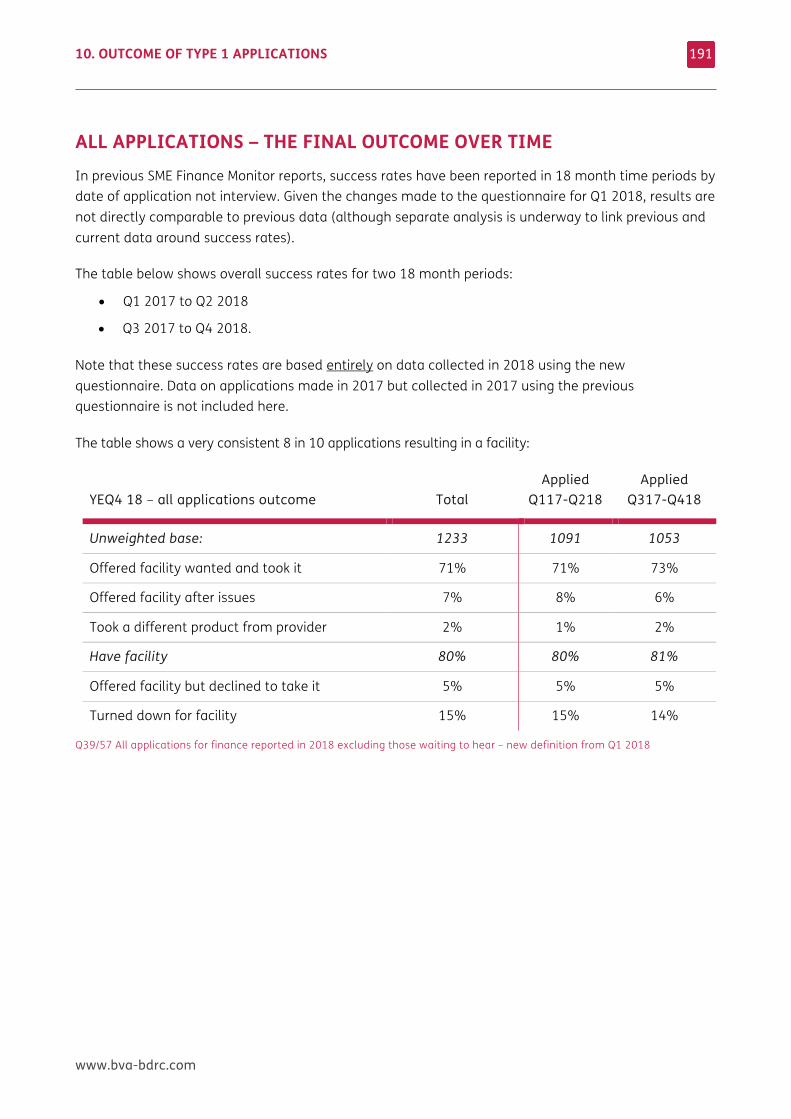
10. OUTCOME OF TYPE 1 APPLICATIONS
www.bva-bdrc.com
191
ALL APPLICATIONS – THE FINAL OUTCOME OVER TIME In previous SME Finance Monitor reports, success rates have been reported in 18 month time periods by date of application not interview. Given the changes made to the questionnaire for Q1 2018, results are not directly comparable to previous data (although separate analysis is underway to link previous and current data around success rates).
The table below shows overall success rates for two 18 month periods:
• Q1 2017 to Q2 2018
• Q3 2017 to Q4 2018.
Note that these success rates are based entirely on data collected in 2018 using the new questionnaire. Data on applications made in 2017 but collected in 2017 using the previous questionnaire is not included here.
The table shows a very consistent 8 in 10 applications resulting in a facility:
YEQ4 18 – all applications outcome Total
Applied Q117-Q218
Applied Q317-Q418
Unweighted base: 1233 1091 1053
Offered facility wanted and took it 71% 71% 73%
Offered facility after issues 7% 8% 6%
Took a different product from provider 2% 1% 2%
Have facility 80% 80% 81%
Offered facility but declined to take it 5% 5% 5%
Turned down for facility 15% 15% 14%
Q39/57 All applications for finance reported in 2018 excluding those waiting to hear – new definition from Q1 2018
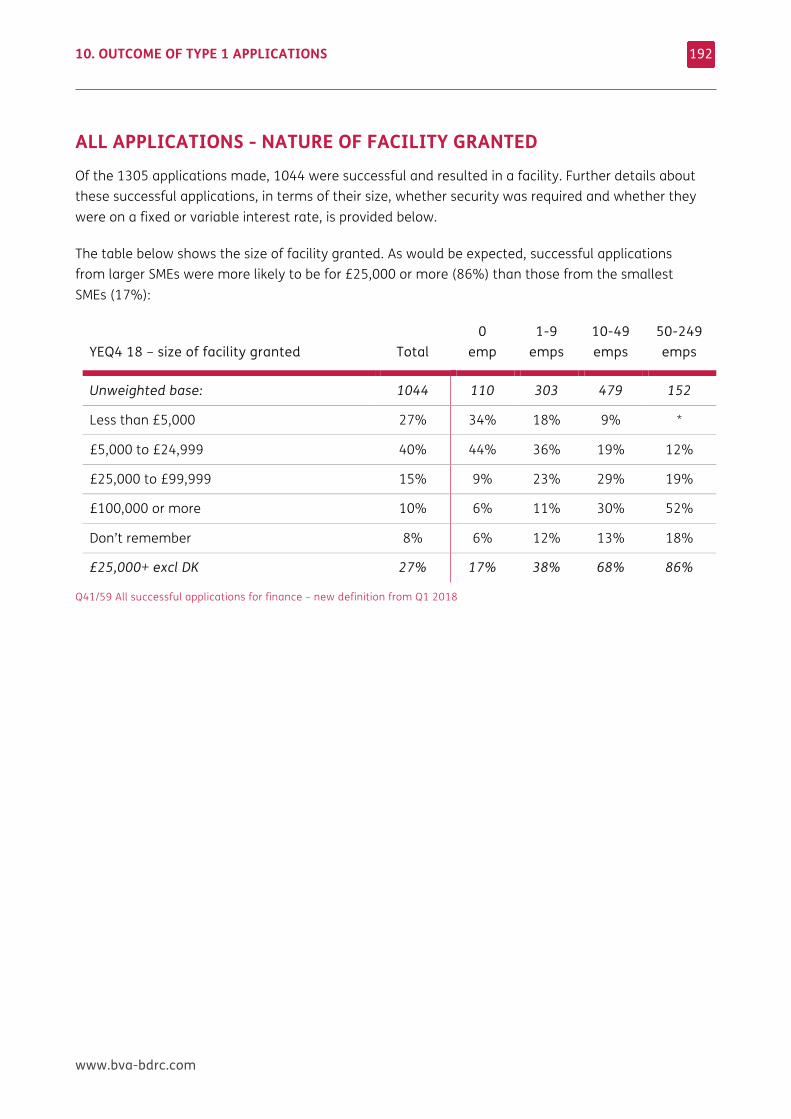
10. OUTCOME OF TYPE 1 APPLICATIONS
www.bva-bdrc.com
192
ALL APPLICATIONS - NATURE OF FACILITY GRANTED Of the 1305 applications made, 1044 were successful and resulted in a facility. Further details about these successful applications, in terms of their size, whether security was required and whether they were on a fixed or variable interest rate, is provided below.
The table below shows the size of facility granted. As would be expected, successful applications from larger SMEs were more likely to be for £25,000 or more (86%) than those from the smallest SMEs (17%):
YEQ4 18 – size of facility granted Total
0 emp
1-9 emps
10-49 emps
50-249 emps
Unweighted base: 1044 110 303 479 152
Less than £5,000 27% 34% 18% 9% *
£5,000 to £24,999 40% 44% 36% 19% 12%
£25,000 to £99,999 15% 9% 23% 29% 19%
£100,000 or more 10% 6% 11% 30% 52%
Don’t remember 8% 6% 12% 13% 18%
£25,000+ excl DK 27% 17% 38% 68% 86%
Q41/59 All successful applications for finance – new definition from Q1 2018
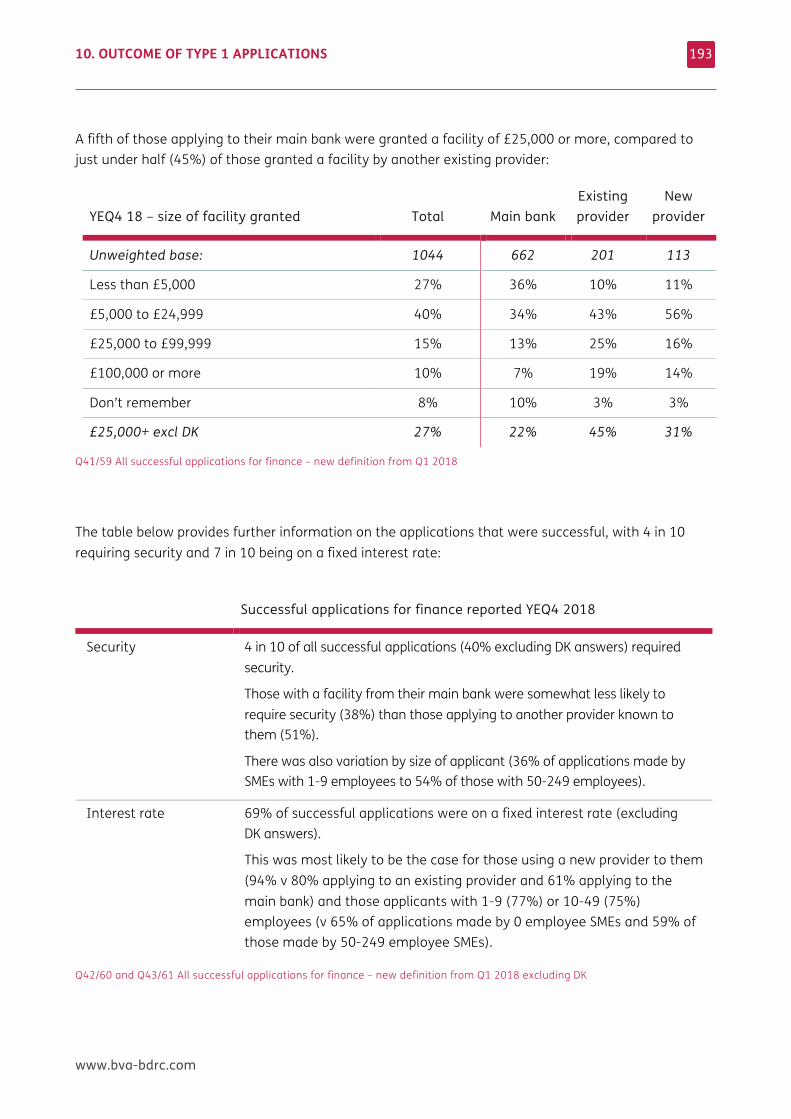
10. OUTCOME OF TYPE 1 APPLICATIONS
www.bva-bdrc.com
193
A fifth of those applying to their main bank were granted a facility of £25,000 or more, compared to just under half (45%) of those granted a facility by another existing provider:
YEQ4 18 – size of facility granted Total Main bank
Existing provider
New provider
Unweighted base: 1044 662 201 113
Less than £5,000 27% 36% 10% 11%
£5,000 to £24,999 40% 34% 43% 56%
£25,000 to £99,999 15% 13% 25% 16%
£100,000 or more 10% 7% 19% 14%
Don’t remember 8% 10% 3% 3%
£25,000+ excl DK 27% 22% 45% 31%
Q41/59 All successful applications for finance – new definition from Q1 2018
The table below provides further information on the applications that were successful, with 4 in 10 requiring security and 7 in 10 being on a fixed interest rate:
Successful applications for finance reported YEQ4 2018
Security 4 in 10 of all successful applications (40% excluding DK answers) required security.
Those with a facility from their main bank were somewhat less likely to require security (38%) than those applying to another provider known to them (51%).
There was also variation by size of applicant (36% of applications made by SMEs with 1-9 employees to 54% of those with 50-249 employees).
Interest rate 69% of successful applications were on a fixed interest rate (excluding DK answers).
This was most likely to be the case for those using a new provider to them (94% v 80% applying to an existing provider and 61% applying to the main bank) and those applicants with 1-9 (77%) or 10-49 (75%) employees (v 65% of applications made by 0 employee SMEs and 59% of those made by 50-249 employee SMEs).
Q42/60 and Q43/61 All successful applications for finance – new definition from Q1 2018 excluding DK
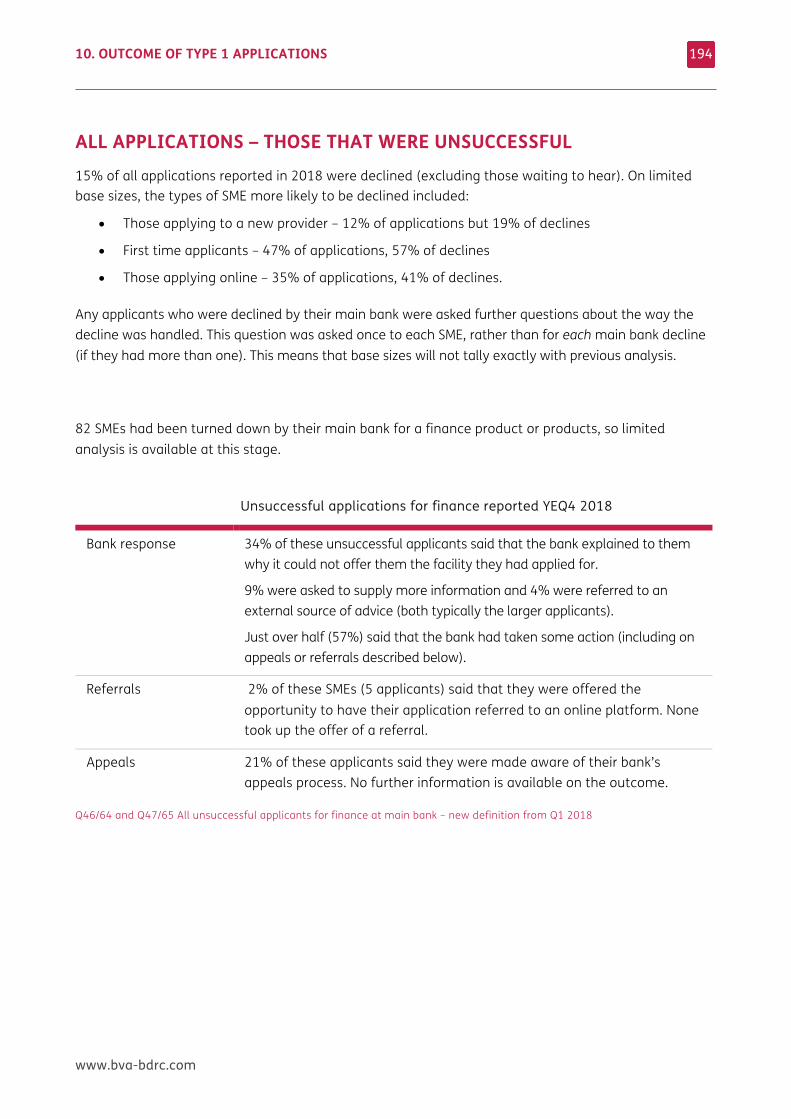
10. OUTCOME OF TYPE 1 APPLICATIONS
www.bva-bdrc.com
194
ALL APPLICATIONS – THOSE THAT WERE UNSUCCESSFUL 15% of all applications reported in 2018 were declined (excluding those waiting to hear). On limited base sizes, the types of SME more likely to be declined included:
• Those applying to a new provider – 12% of applications but 19% of declines
• First time applicants – 47% of applications, 57% of declines
• Those applying online – 35% of applications, 41% of declines.
Any applicants who were declined by their main bank were asked further questions about the way the decline was handled. This question was asked once to each SME, rather than for each main bank decline (if they had more than one). This means that base sizes will not tally exactly with previous analysis.
82 SMEs had been turned down by their main bank for a finance product or products, so limited analysis is available at this stage.
Unsuccessful applications for finance reported YEQ4 2018
Bank response 34% of these unsuccessful applicants said that the bank explained to them why it could not offer them the facility they had applied for.
9% were asked to supply more information and 4% were referred to an external source of advice (both typically the larger applicants).
Just over half (57%) said that the bank had taken some action (including on appeals or referrals described below).
Referrals 2% of these SMEs (5 applicants) said that they were offered the opportunity to have their application referred to an online platform. None took up the offer of a referral.
Appeals 21% of these applicants said they were made aware of their bank’s appeals process. No further information is available on the outcome.
Q46/64 and Q47/65 All unsuccessful applicants for finance at main bank – new definition from Q1 2018
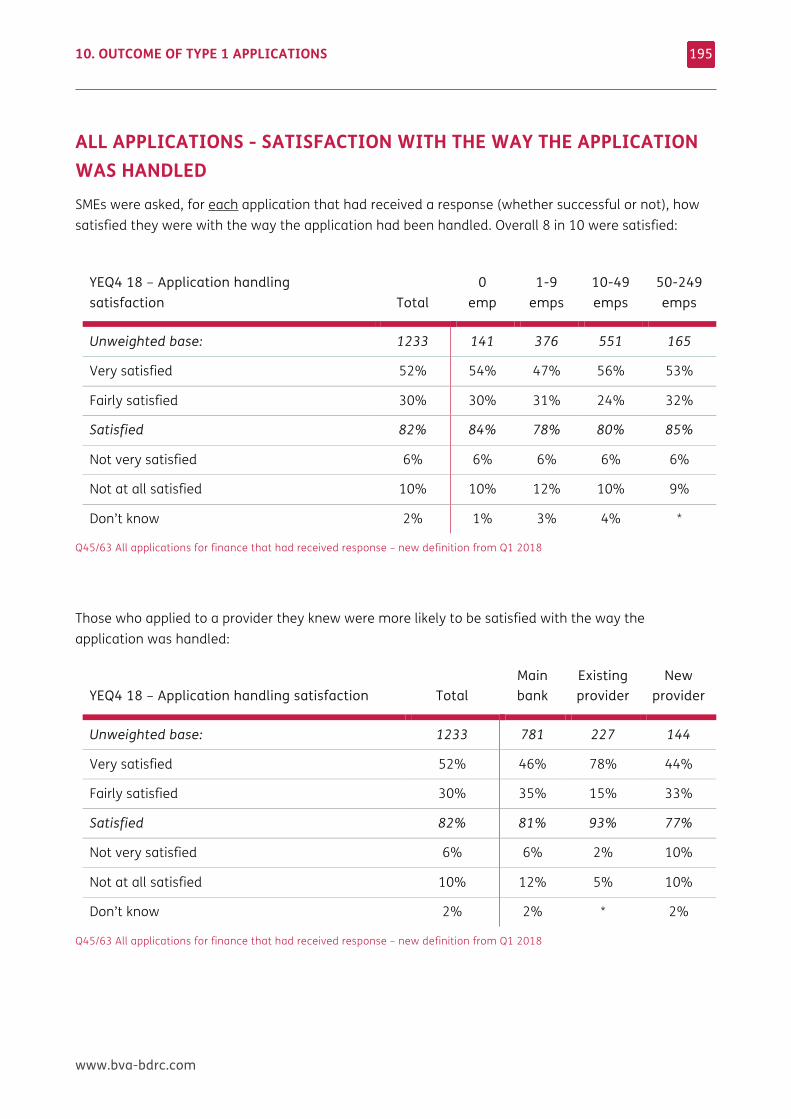
10. OUTCOME OF TYPE 1 APPLICATIONS
www.bva-bdrc.com
195
ALL APPLICATIONS - SATISFACTION WITH THE WAY THE APPLICATION WAS HANDLED SMEs were asked, for each application that had received a response (whether successful or not), how satisfied they were with the way the application had been handled. Overall 8 in 10 were satisfied:
YEQ4 18 – Application handling satisfaction Total
0 emp
1-9 emps
10-49 emps
50-249 emps
Unweighted base: 1233 141 376 551 165
Very satisfied 52% 54% 47% 56% 53%
Fairly satisfied 30% 30% 31% 24% 32%
Satisfied 82% 84% 78% 80% 85%
Not very satisfied 6% 6% 6% 6% 6%
Not at all satisfied 10% 10% 12% 10% 9%
Don’t know 2% 1% 3% 4% *
Q45/63 All applications for finance that had received response – new definition from Q1 2018
Those who applied to a provider they knew were more likely to be satisfied with the way the application was handled:
YEQ4 18 – Application handling satisfaction Total
Main bank
Existing provider
New provider
Unweighted base: 1233 781 227 144
Very satisfied 52% 46% 78% 44%
Fairly satisfied 30% 35% 15% 33%
Satisfied 82% 81% 93% 77%
Not very satisfied 6% 6% 2% 10%
Not at all satisfied 10% 12% 5% 10%
Don’t know 2% 2% * 2%
Q45/63 All applications for finance that had received response – new definition from Q1 2018
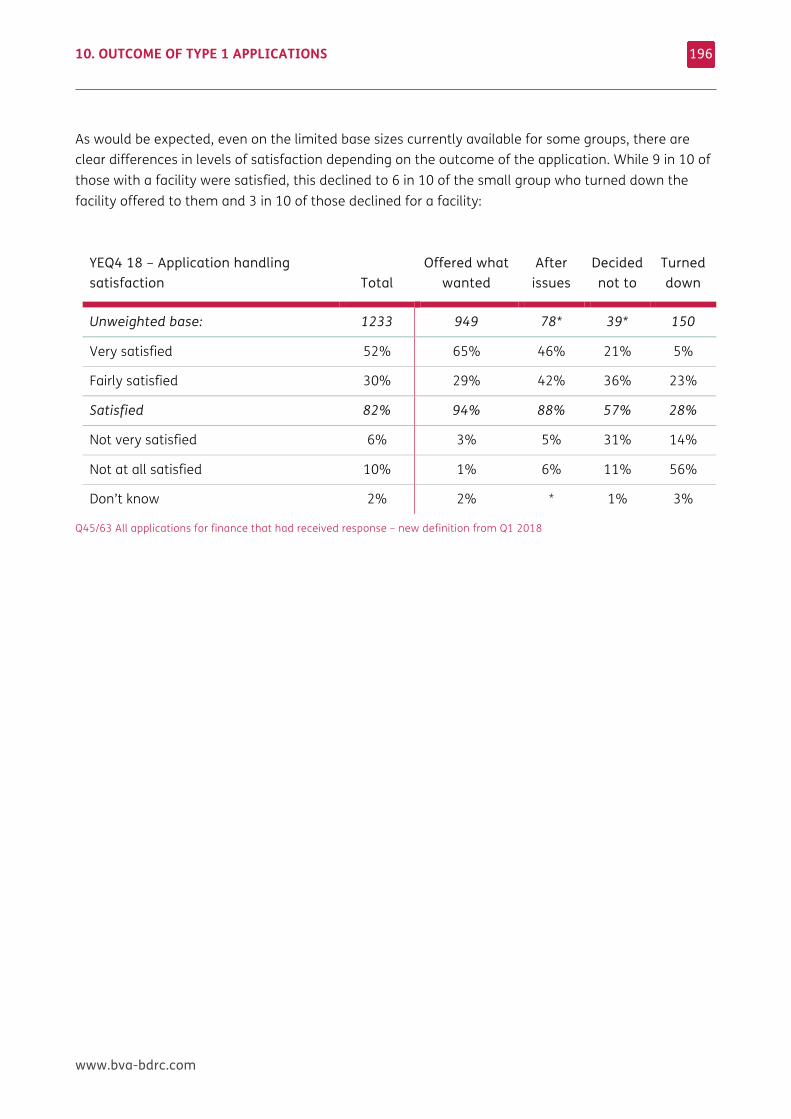
10. OUTCOME OF TYPE 1 APPLICATIONS
www.bva-bdrc.com
196
As would be expected, even on the limited base sizes currently available for some groups, there are clear differences in levels of satisfaction depending on the outcome of the application. While 9 in 10 of those with a facility were satisfied, this declined to 6 in 10 of the small group who turned down the facility offered to them and 3 in 10 of those declined for a facility:
YEQ4 18 – Application handling satisfaction Total
Offered what wanted
After issues
Decided not to
Turned down
Unweighted base: 1233 949 78* 39* 150
Very satisfied 52% 65% 46% 21% 5%
Fairly satisfied 30% 29% 42% 36% 23%
Satisfied 82% 94% 88% 57% 28%
Not very satisfied 6% 3% 5% 31% 14%
Not at all satisfied 10% 1% 6% 11% 56%
Don’t know 2% 2% * 1% 3%
Q45/63 All applications for finance that had received response – new definition from Q1 2018
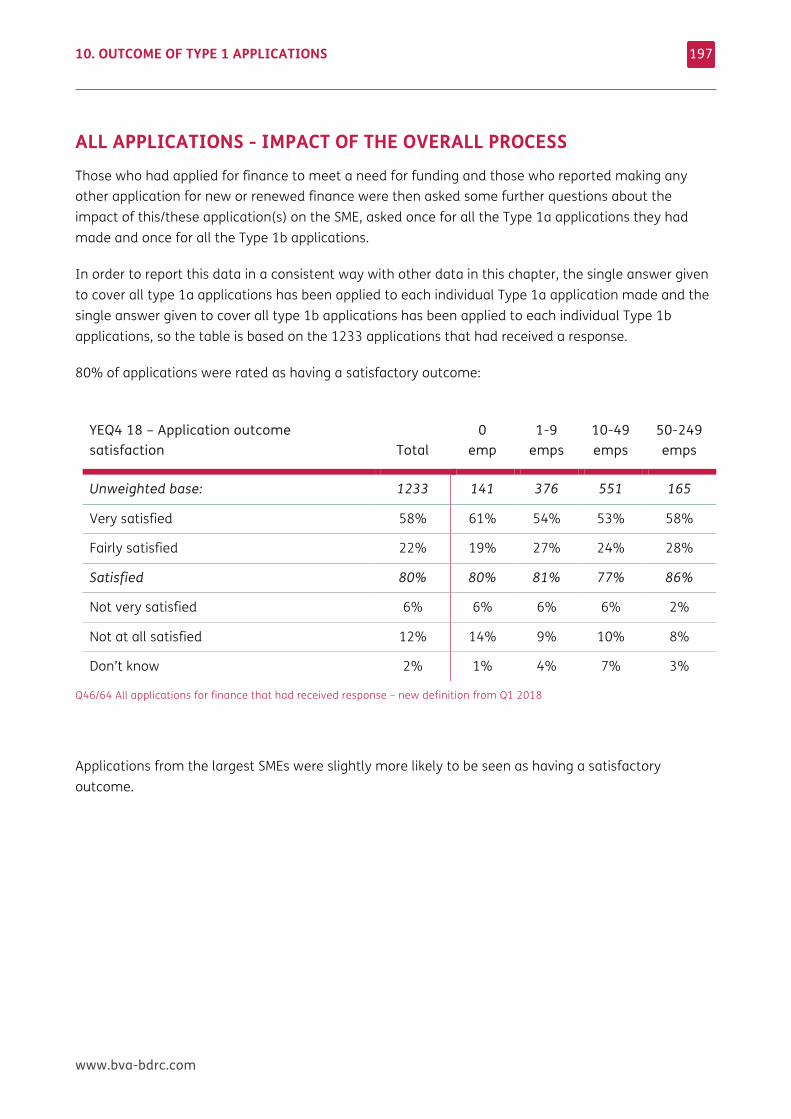
10. OUTCOME OF TYPE 1 APPLICATIONS
www.bva-bdrc.com
197
ALL APPLICATIONS - IMPACT OF THE OVERALL PROCESS Those who had applied for finance to meet a need for funding and those who reported making any other application for new or renewed finance were then asked some further questions about the impact of this/these application(s) on the SME, asked once for all the Type 1a applications they had made and once for all the Type 1b applications.
In order to report this data in a consistent way with other data in this chapter, the single answer given to cover all type 1a applications has been applied to each individual Type 1a application made and the single answer given to cover all type 1b applications has been applied to each individual Type 1b applications, so the table is based on the 1233 applications that had received a response.
80% of applications were rated as having a satisfactory outcome:
YEQ4 18 – Application outcome satisfaction Total
0 emp
1-9 emps
10-49 emps
50-249 emps
Unweighted base: 1233 141 376 551 165
Very satisfied 58% 61% 54% 53% 58%
Fairly satisfied 22% 19% 27% 24% 28%
Satisfied 80% 80% 81% 77% 86%
Not very satisfied 6% 6% 6% 6% 2%
Not at all satisfied 12% 14% 9% 10% 8%
Don’t know 2% 1% 4% 7% 3%
Q46/64 All applications for finance that had received response – new definition from Q1 2018
Applications from the largest SMEs were slightly more likely to be seen as having a satisfactory outcome.
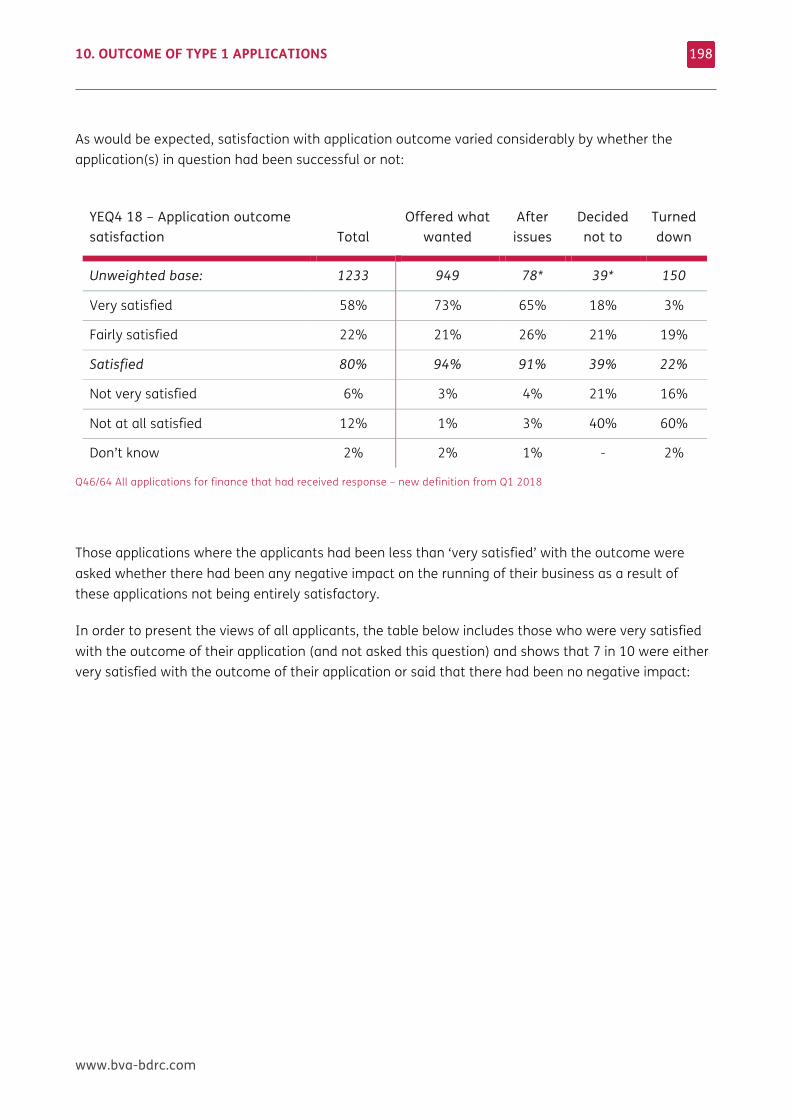
10. OUTCOME OF TYPE 1 APPLICATIONS
www.bva-bdrc.com
198
As would be expected, satisfaction with application outcome varied considerably by whether the application(s) in question had been successful or not:
YEQ4 18 – Application outcome satisfaction Total
Offered what wanted
After issues
Decided not to
Turned down
Unweighted base: 1233 949 78* 39* 150
Very satisfied 58% 73% 65% 18% 3%
Fairly satisfied 22% 21% 26% 21% 19%
Satisfied 80% 94% 91% 39% 22%
Not very satisfied 6% 3% 4% 21% 16%
Not at all satisfied 12% 1% 3% 40% 60%
Don’t know 2% 2% 1% - 2%
Q46/64 All applications for finance that had received response – new definition from Q1 2018
Those applications where the applicants had been less than ‘very satisfied’ with the outcome were asked whether there had been any negative impact on the running of their business as a result of these applications not being entirely satisfactory.
In order to present the views of all applicants, the table below includes those who were very satisfied with the outcome of their application (and not asked this question) and shows that 7 in 10 were either very satisfied with the outcome of their application or said that there had been no negative impact:
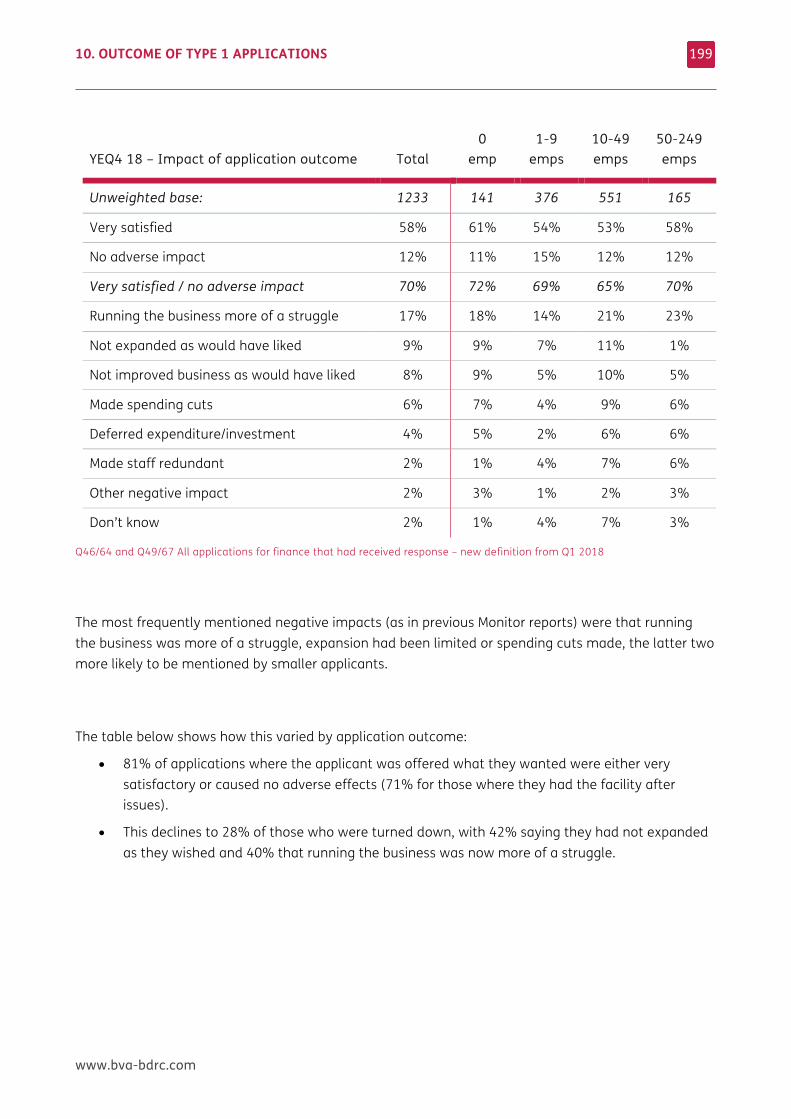
10. OUTCOME OF TYPE 1 APPLICATIONS
www.bva-bdrc.com
199
YEQ4 18 – Impact of application outcome Total
0 emp
1-9 emps
10-49 emps
50-249 emps
Unweighted base: 1233 141 376 551 165
Very satisfied 58% 61% 54% 53% 58%
No adverse impact 12% 11% 15% 12% 12%
Very satisfied / no adverse impact 70% 72% 69% 65% 70%
Running the business more of a struggle 17% 18% 14% 21% 23%
Not expanded as would have liked 9% 9% 7% 11% 1%
Not improved business as would have liked 8% 9% 5% 10% 5%
Made spending cuts 6% 7% 4% 9% 6%
Deferred expenditure/investment 4% 5% 2% 6% 6%
Made staff redundant 2% 1% 4% 7% 6%
Other negative impact 2% 3% 1% 2% 3%
Don’t know 2% 1% 4% 7% 3%
Q46/64 and Q49/67 All applications for finance that had received response – new definition from Q1 2018
The most frequently mentioned negative impacts (as in previous Monitor reports) were that running the business was more of a struggle, expansion had been limited or spending cuts made, the latter two more likely to be mentioned by smaller applicants.
The table below shows how this varied by application outcome:
• 81% of applications where the applicant was offered what they wanted were either very satisfactory or caused no adverse effects (71% for those where they had the facility after issues).
• This declines to 28% of those who were turned down, with 42% saying they had not expanded as they wished and 40% that running the business was now more of a struggle.
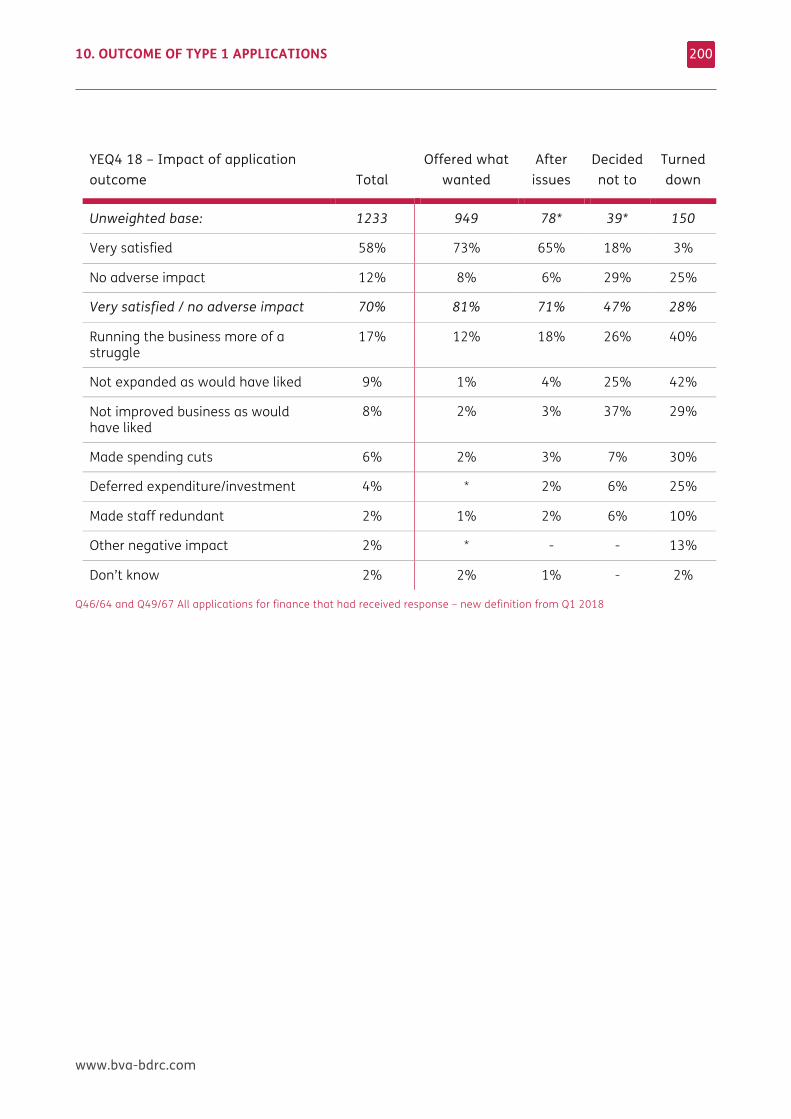
10. OUTCOME OF TYPE 1 APPLICATIONS
www.bva-bdrc.com
200
YEQ4 18 – Impact of application outcome Total
Offered what wanted
After issues
Decided not to
Turned down
Unweighted base: 1233 949 78* 39* 150
Very satisfied 58% 73% 65% 18% 3%
No adverse impact 12% 8% 6% 29% 25%
Very satisfied / no adverse impact 70% 81% 71% 47% 28%
Running the business more of a struggle
17% 12% 18% 26% 40%
Not expanded as would have liked 9% 1% 4% 25% 42%
Not improved business as would have liked
8% 2% 3% 37% 29%
Made spending cuts 6% 2% 3% 7% 30%
Deferred expenditure/investment 4% * 2% 6% 25%
Made staff redundant 2% 1% 2% 6% 10%
Other negative impact 2% * - - 13%
Don’t know 2% 2% 1% - 2%
Q46/64 and Q49/67 All applications for finance that had received response – new definition from Q1 2018
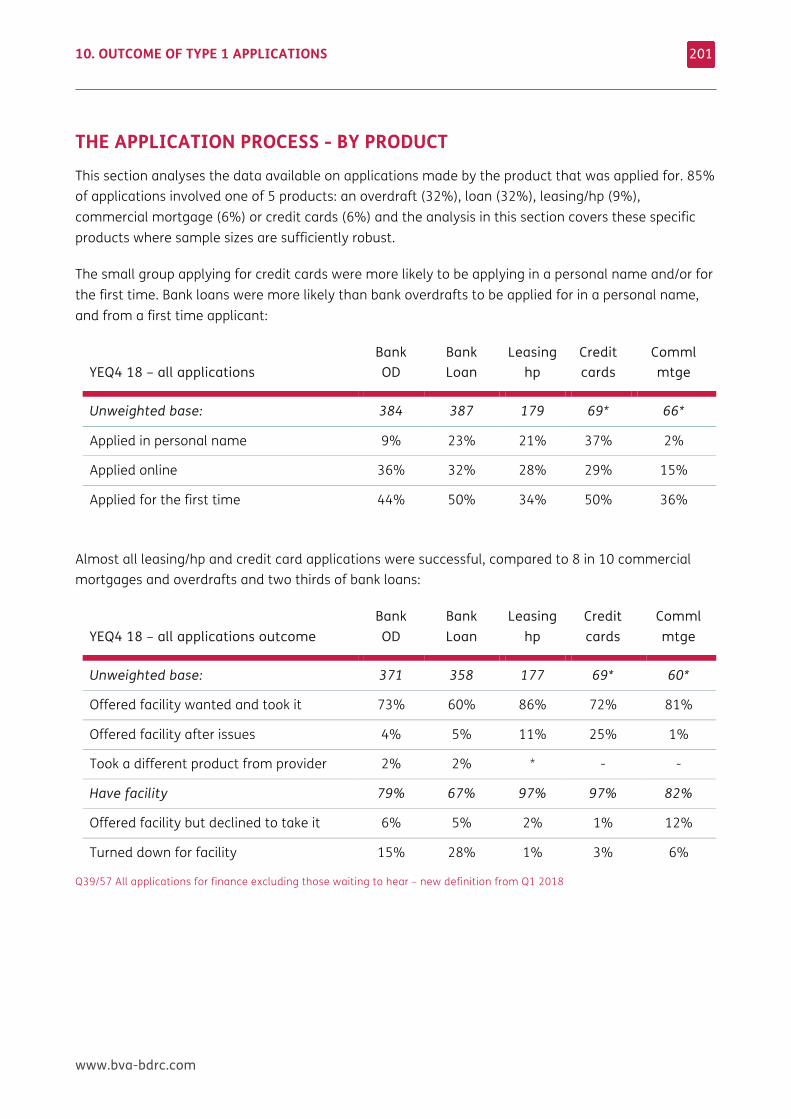
10. OUTCOME OF TYPE 1 APPLICATIONS
www.bva-bdrc.com
201
THE APPLICATION PROCESS - BY PRODUCT This section analyses the data available on applications made by the product that was applied for. 85% of applications involved one of 5 products: an overdraft (32%), loan (32%), leasing/hp (9%), commercial mortgage (6%) or credit cards (6%) and the analysis in this section covers these specific products where sample sizes are sufficiently robust.
The small group applying for credit cards were more likely to be applying in a personal name and/or for the first time. Bank loans were more likely than bank overdrafts to be applied for in a personal name, and from a first time applicant:
YEQ4 18 – all applications Bank OD
Bank Loan
Leasing hp
Credit cards
Comml mtge
Unweighted base: 384 387 179 69* 66*
Applied in personal name 9% 23% 21% 37% 2%
Applied online 36% 32% 28% 29% 15%
Applied for the first time 44% 50% 34% 50% 36%
Almost all leasing/hp and credit card applications were successful, compared to 8 in 10 commercial mortgages and overdrafts and two thirds of bank loans:
YEQ4 18 – all applications outcome Bank OD
Bank Loan
Leasing hp
Credit cards
Comml mtge
Unweighted base: 371 358 177 69* 60*
Offered facility wanted and took it 73% 60% 86% 72% 81%
Offered facility after issues 4% 5% 11% 25% 1%
Took a different product from provider 2% 2% * - -
Have facility 79% 67% 97% 97% 82%
Offered facility but declined to take it 6% 5% 2% 1% 12%
Turned down for facility 15% 28% 1% 3% 6%
Q39/57 All applications for finance excluding those waiting to hear – new definition from Q1 2018
10. OUTCOME OF TYPE 1 APPLICATIONS
www.bva-bdrc.com
202
Those applying for a bank loan were more likely to be declined (28%) than those applying for an overdraft (15%), and this was also true in previous Monitor reports. In the Q4 2017 Monitor report, the combined overdraft and loan success rate was 80% (71% offered what they wanted and 9% taking a facility after issues). Here for overdrafts and loan combined (including commercial mortgages) it is 72%, with 68% offered what they wanted.
When the equivalent questions were last reported (excluding those waiting to hear), the success rate for loans was in line, but the success rate for overdrafts was somewhat higher:
• 85% of overdraft applicants ended the process with a facility (88% if the previous ‘took another form of funding’ code were to be included) and 11% ended the process with no facility.
• 67% of loan applicants ended the process with a facility (74% if the previous ‘took another form of funding’ code were to be included) and 26% ended the process with no facility.
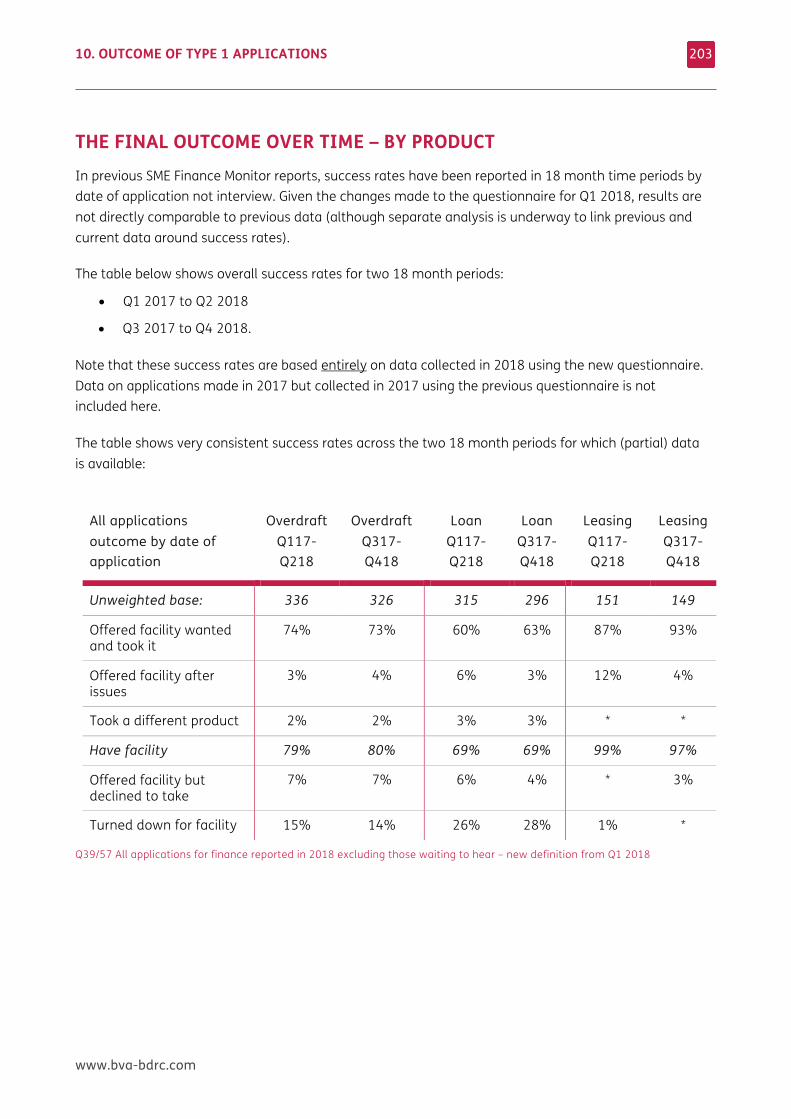
10. OUTCOME OF TYPE 1 APPLICATIONS
www.bva-bdrc.com
203
THE FINAL OUTCOME OVER TIME – BY PRODUCT In previous SME Finance Monitor reports, success rates have been reported in 18 month time periods by date of application not interview. Given the changes made to the questionnaire for Q1 2018, results are not directly comparable to previous data (although separate analysis is underway to link previous and current data around success rates).
The table below shows overall success rates for two 18 month periods:
• Q1 2017 to Q2 2018
• Q3 2017 to Q4 2018.
Note that these success rates are based entirely on data collected in 2018 using the new questionnaire. Data on applications made in 2017 but collected in 2017 using the previous questionnaire is not included here.
The table shows very consistent success rates across the two 18 month periods for which (partial) data is available:
All applications outcome by date of application
Overdraft Q117-Q218
Overdraft Q317-Q418
Loan Q117-Q218
Loan Q317-Q418
Leasing Q117-Q218
Leasing Q317-Q418
Unweighted base: 336 326 315 296 151 149
Offered facility wanted and took it
74% 73% 60% 63% 87% 93%
Offered facility after issues
3% 4% 6% 3% 12% 4%
Took a different product 2% 2% 3% 3% * *
Have facility 79% 80% 69% 69% 99% 97%
Offered facility but declined to take
7% 7% 6% 4% * 3%
Turned down for facility 15% 14% 26% 28% 1% *
Q39/57 All applications for finance reported in 2018 excluding those waiting to hear – new definition from Q1 2018
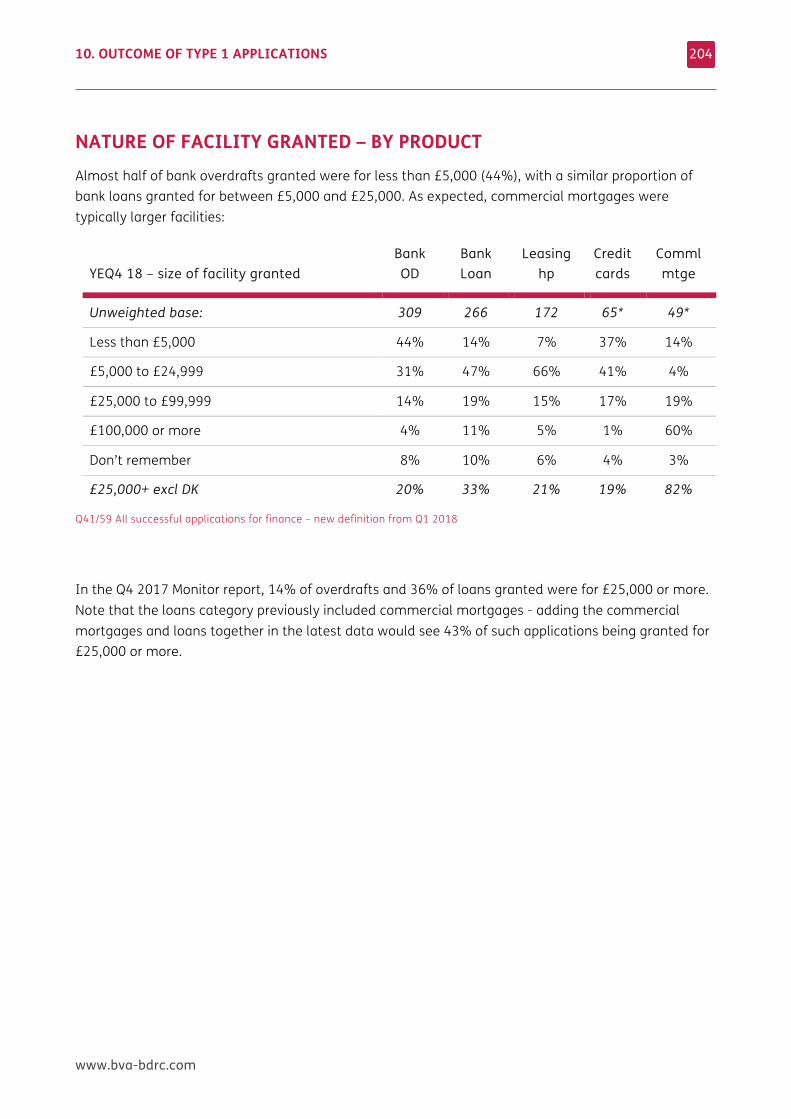
10. OUTCOME OF TYPE 1 APPLICATIONS
www.bva-bdrc.com
204
NATURE OF FACILITY GRANTED – BY PRODUCT Almost half of bank overdrafts granted were for less than £5,000 (44%), with a similar proportion of bank loans granted for between £5,000 and £25,000. As expected, commercial mortgages were typically larger facilities:
YEQ4 18 – size of facility granted Bank OD
Bank Loan
Leasing hp
Credit cards
Comml mtge
Unweighted base: 309 266 172 65* 49*
Less than £5,000 44% 14% 7% 37% 14%
£5,000 to £24,999 31% 47% 66% 41% 4%
£25,000 to £99,999 14% 19% 15% 17% 19%
£100,000 or more 4% 11% 5% 1% 60%
Don’t remember 8% 10% 6% 4% 3%
£25,000+ excl DK 20% 33% 21% 19% 82%
Q41/59 All successful applications for finance – new definition from Q1 2018
In the Q4 2017 Monitor report, 14% of overdrafts and 36% of loans granted were for £25,000 or more. Note that the loans category previously included commercial mortgages - adding the commercial mortgages and loans together in the latest data would see 43% of such applications being granted for £25,000 or more.
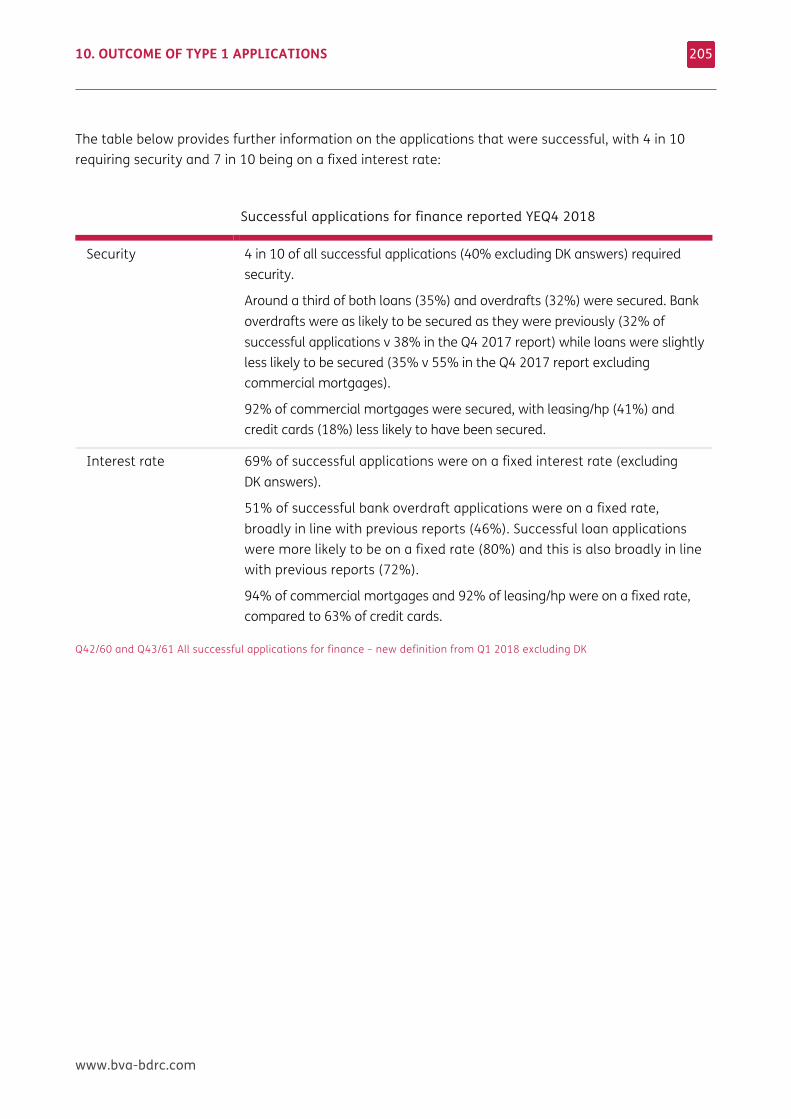
10. OUTCOME OF TYPE 1 APPLICATIONS
www.bva-bdrc.com
205
The table below provides further information on the applications that were successful, with 4 in 10 requiring security and 7 in 10 being on a fixed interest rate:
Successful applications for finance reported YEQ4 2018
Security 4 in 10 of all successful applications (40% excluding DK answers) required security.
Around a third of both loans (35%) and overdrafts (32%) were secured. Bank overdrafts were as likely to be secured as they were previously (32% of successful applications v 38% in the Q4 2017 report) while loans were slightly less likely to be secured (35% v 55% in the Q4 2017 report excluding commercial mortgages).
92% of commercial mortgages were secured, with leasing/hp (41%) and credit cards (18%) less likely to have been secured.
Interest rate 69% of successful applications were on a fixed interest rate (excluding DK answers).
51% of successful bank overdraft applications were on a fixed rate, broadly in line with previous reports (46%). Successful loan applications were more likely to be on a fixed rate (80%) and this is also broadly in line with previous reports (72%).
94% of commercial mortgages and 92% of leasing/hp were on a fixed rate, compared to 63% of credit cards.
Q42/60 and Q43/61 All successful applications for finance – new definition from Q1 2018 excluding DK
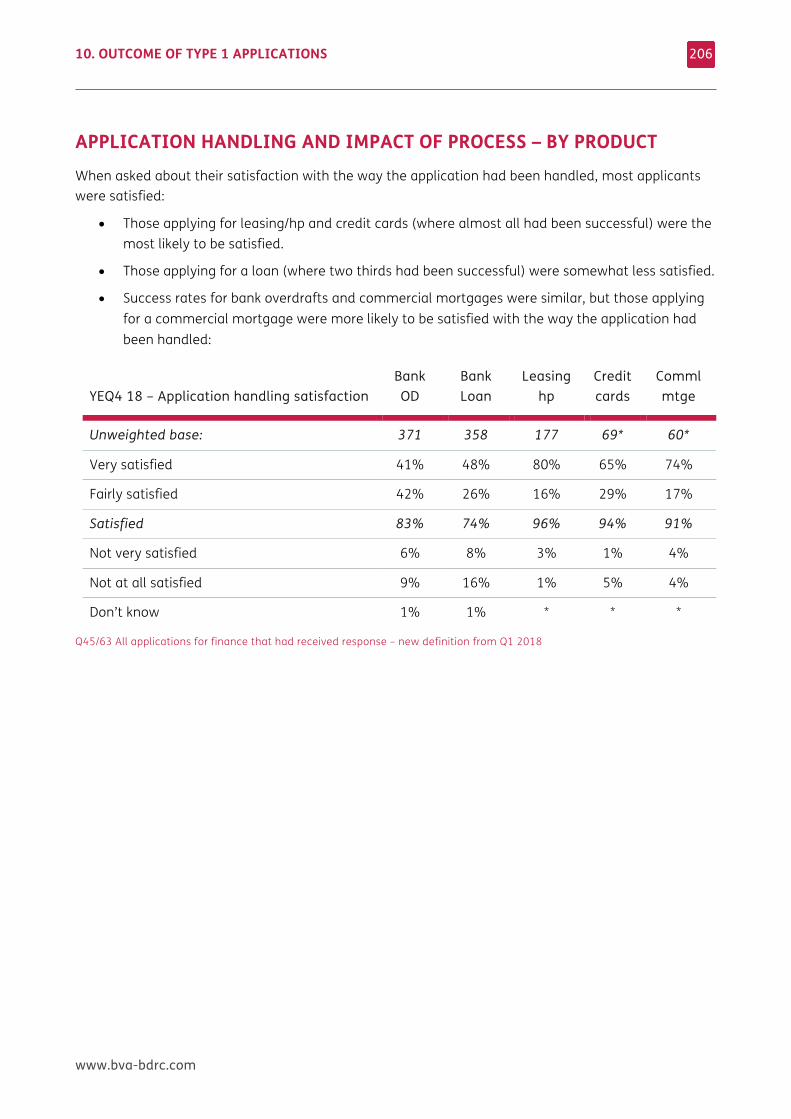
10. OUTCOME OF TYPE 1 APPLICATIONS
www.bva-bdrc.com
206
APPLICATION HANDLING AND IMPACT OF PROCESS – BY PRODUCT When asked about their satisfaction with the way the application had been handled, most applicants were satisfied:
• Those applying for leasing/hp and credit cards (where almost all had been successful) were the most likely to be satisfied.
• Those applying for a loan (where two thirds had been successful) were somewhat less satisfied.
• Success rates for bank overdrafts and commercial mortgages were similar, but those applying for a commercial mortgage were more likely to be satisfied with the way the application had been handled:
YEQ4 18 – Application handling satisfaction
Bank OD
Bank Loan
Leasing hp
Credit cards
Comml mtge
Unweighted base: 371 358 177 69* 60*
Very satisfied 41% 48% 80% 65% 74%
Fairly satisfied 42% 26% 16% 29% 17%
Satisfied 83% 74% 96% 94% 91%
Not very satisfied 6% 8% 3% 1% 4%
Not at all satisfied 9% 16% 1% 5% 4%
Don’t know 1% 1% * * *
Q45/63 All applications for finance that had received response – new definition from Q1 2018
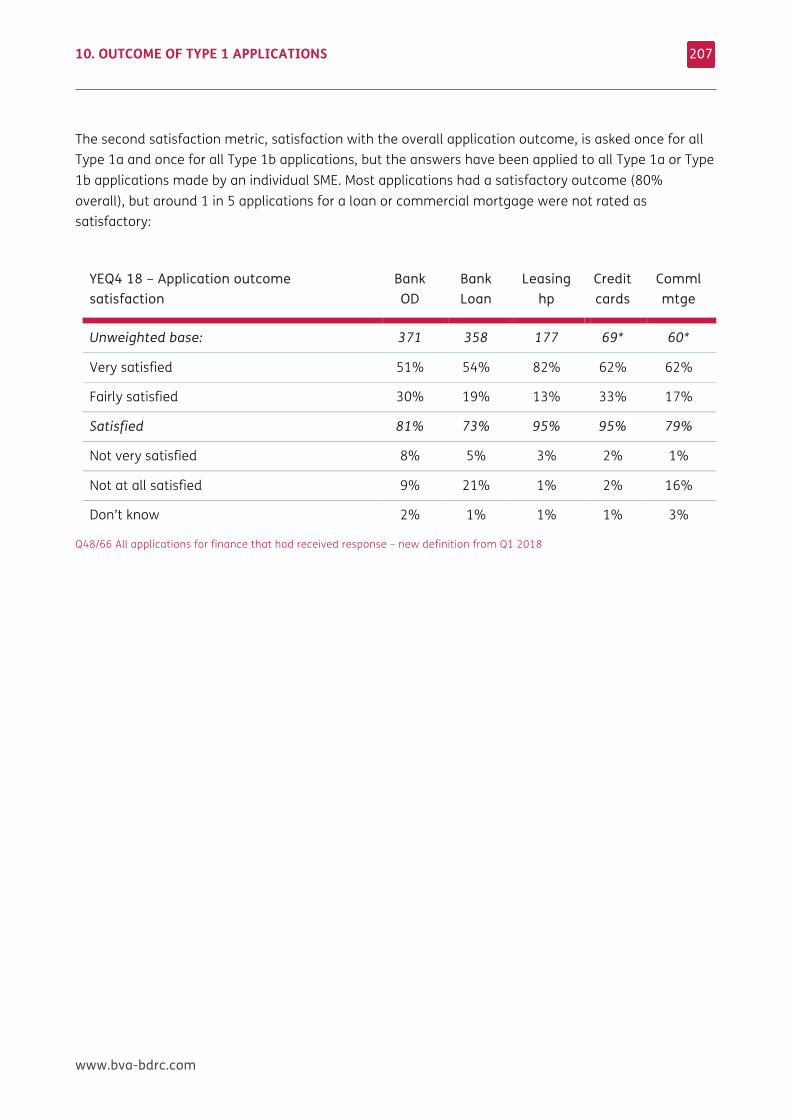
10. OUTCOME OF TYPE 1 APPLICATIONS
www.bva-bdrc.com
207
The second satisfaction metric, satisfaction with the overall application outcome, is asked once for all Type 1a and once for all Type 1b applications, but the answers have been applied to all Type 1a or Type 1b applications made by an individual SME. Most applications had a satisfactory outcome (80% overall), but around 1 in 5 applications for a loan or commercial mortgage were not rated as satisfactory:
YEQ4 18 – Application outcome satisfaction
Bank OD
Bank Loan
Leasing hp
Credit cards
Comml mtge
Unweighted base: 371 358 177 69* 60*
Very satisfied 51% 54% 82% 62% 62%
Fairly satisfied 30% 19% 13% 33% 17%
Satisfied 81% 73% 95% 95% 79%
Not very satisfied 8% 5% 3% 2% 1%
Not at all satisfied 9% 21% 1% 2% 16%
Don’t know 2% 1% 1% 1% 3%
Q48/66 All applications for finance that had received response – new definition from Q1 2018
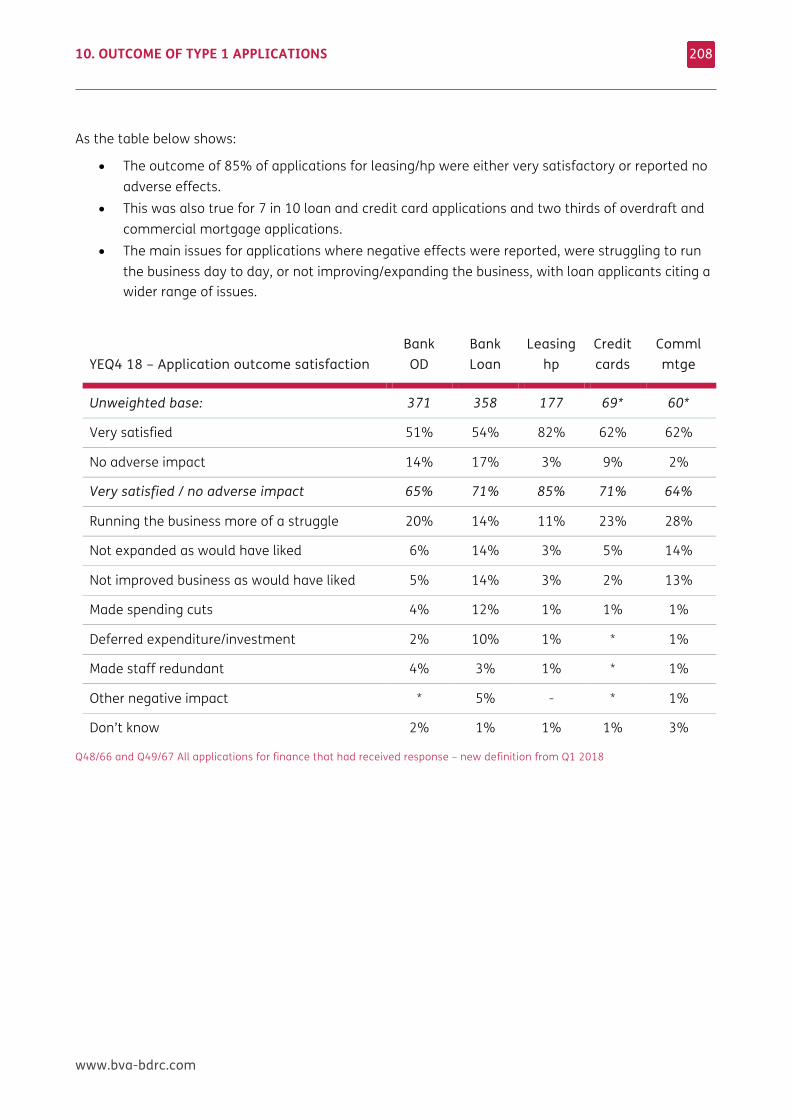
10. OUTCOME OF TYPE 1 APPLICATIONS
www.bva-bdrc.com
208
As the table below shows:
• The outcome of 85% of applications for leasing/hp were either very satisfactory or reported no adverse effects.
• This was also true for 7 in 10 loan and credit card applications and two thirds of overdraft and commercial mortgage applications.
• The main issues for applications where negative effects were reported, were struggling to run the business day to day, or not improving/expanding the business, with loan applicants citing a wider range of issues.
YEQ4 18 – Application outcome satisfaction Bank OD
Bank Loan
Leasing hp
Credit cards
Comml mtge
Unweighted base: 371 358 177 69* 60*
Very satisfied 51% 54% 82% 62% 62%
No adverse impact 14% 17% 3% 9% 2%
Very satisfied / no adverse impact 65% 71% 85% 71% 64%
Running the business more of a struggle 20% 14% 11% 23% 28%
Not expanded as would have liked 6% 14% 3% 5% 14%
Not improved business as would have liked 5% 14% 3% 2% 13%
Made spending cuts 4% 12% 1% 1% 1%
Deferred expenditure/investment 2% 10% 1% * 1%
Made staff redundant 4% 3% 1% * 1%
Other negative impact * 5% - * 1%
Don’t know 2% 1% 1% 1% 3%
Q48/66 and Q49/67 All applications for finance that had received response – new definition from Q1 2018
www.bva-bdrc.com
11 NOT LOOKING TO BORROW THIS CHAPTER PROVIDES at those that had not had a borrowing event, to explore whether they wanted to apply for finance in the previous 12 months and any barriers to applying.
11. NOT LOOKING TO BORROW
www.bva-bdrc.com
210
KEY FINDINGS Most SMEs continued to meet the definition of a Happy non-seeker of finance (83% in 2018)
• Happy non-seekers can and do use external finance, they just hadn’t applied for any in the previous 12 months. In 2018, 28% of HNS were using external finance
• The proportion of Happy non-seekers increased from 68% in 2012 to 84% in 2016 and has been stable since. Excluding the Permanent non-borrowers sees the proportion of Happy non-seekers decrease to 68% but they remained the largest group
14% of SMEs reported a borrowing event in the 12 months prior to interview. This has declined steadily over time from 23% in 2012. Excluding the PNBs increases the size of this group to 27% of remaining SMEs.
2% of SMEs met the definition of a Would-be seeker of finance – someone who wanted to apply but something stopped them. This group has decreased in size from 10% of SMEs in 2012 to 2% in 2016 and subsequent years. Excluding the PNBs increases the size of this group to 3% of SMEs.
Would-be seekers were asked why they had not applied for finance:
• 32% cited the process of borrowing as their main reason, typically the expense
• 27% cited discouragement, almost all of it indirect where the SME assumes they will be turned down so does not apply
• 23% cited the principle of borrowing, typically being able to raise personal funds if they needed to
• 17% cited the economic climate
11. NOT LOOKING TO BORROW
www.bva-bdrc.com
211
Attitudinally, would-be seekers were similar to those who had applied for finance but were more likely to think that it might be difficult for them to get finance and less likely to be put off by an increase in the cost of credit.
A small minority of SMEs (3%) reported having ever been declined for a facility. 7 in 10 said it has made them more reluctant to apply for finance subsequently (the equivalent of 2% of all SMEs), with smaller SMEs somewhat more likely to be reluctant.
• That said, half of all those made more reluctant by a previous decline were using finance (52%), compared to 60% of those not made more reluctant by a decline and 36% that have never been declined
• Those made more reluctant by a previous decline were though more likely to meet the definition of a Would-be seeker of finance (12%) compared to 5% of those not made more reluctant by a decline and 1% of those never declined
11. NOT LOOKING TO BORROW
www.bva-bdrc.com
212
As already detailed in this report, a minority of SMEs reported any borrowing event in the 12 months prior to interview. This chapter looks in more detail at those that had not had a borrowing event, to explore whether they had wanted to apply for finance in the previous 12 months, and any barriers to such an application being made. Because this chapter covers those that have not had a borrowing event, analysis continues to be based on the date of interview.
DEFINITIONS OVER TIME In previous reports all SMEs were allocated to one of three groups, depending of their experience in the previous 12 months of both overdrafts and loans:
• Had an event: those SMEs reporting any Type 1, 2 or 3 loan or overdraft borrowing event in the previous 12 months, or an automatic renewal of an overdraft facility.
• Would-be seekers: those SMEs that had not had a loan or overdraft borrowing event/automatic renewal, and said something had stopped them applying for either loan or overdraft funding in the previous 12 months.
• Happy non-seekers: those SMEs that had not had a loan/overdraft borrowing event/automatic renewal, but said that nothing had stopped them applying for either loan or overdraft funding in the previous 12 months.
From Q1 2018, the scope of the SME Finance Monitor was widened to include more products than just loans and overdrafts. The definitions in this chapter have also been widened to cover all external funding, but the structure of the three groups remains essentially the same:
• Had an event: those SMEs reporting a Type 1 new or renewed borrowing event in the previous 12 months, or an automatic renewal of an overdraft facility, or any Type 2 or 3 borrowing event where either the bank or the SME was looking to reduce or repay an existing facility. These events were described in more detail in Chapter 8.
• Would-be seekers: those SMEs that not had a borrowing event of any kind and said something had stopped them applying for finance in the previous 12 months.
• Happy non-seekers: those SMEs that had not had a borrowing event of any kind, but said that nothing had stopped them applying for finance in the previous 12 months.
Where applicable, data is shown over time, accepting the changes made to the definitions in Q1 2018.
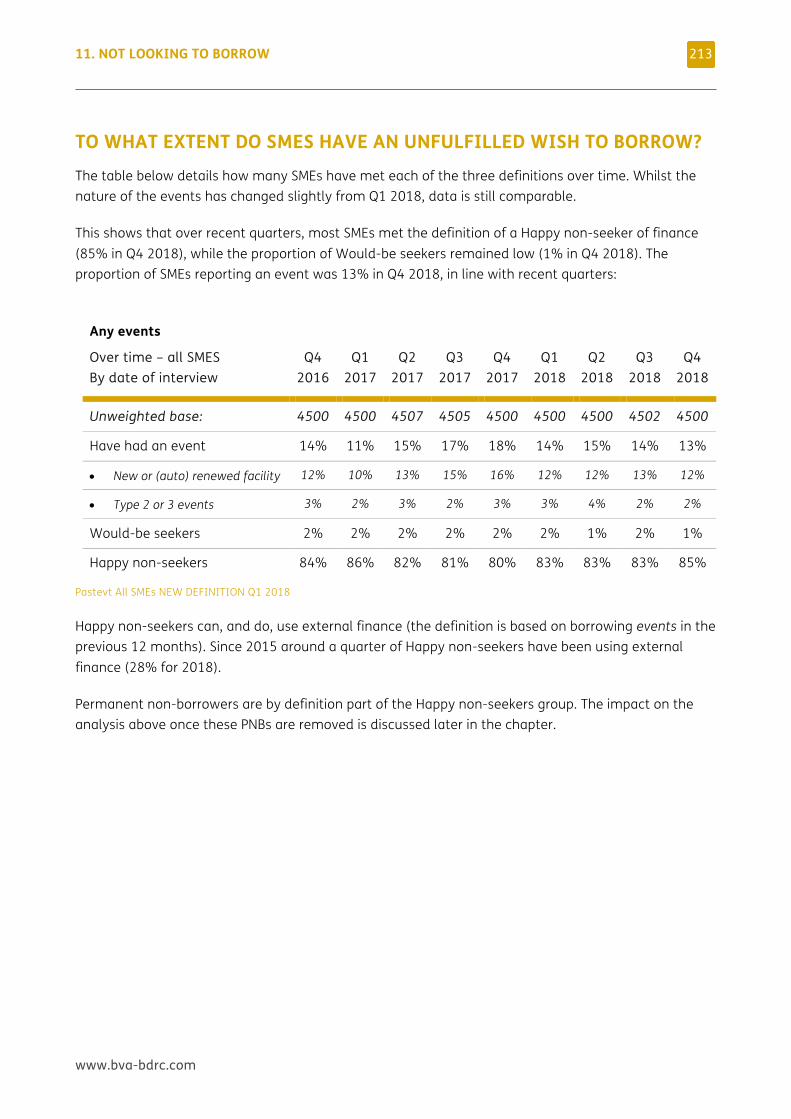
11. NOT LOOKING TO BORROW
www.bva-bdrc.com
213
TO WHAT EXTENT DO SMES HAVE AN UNFULFILLED WISH TO BORROW? The table below details how many SMEs have met each of the three definitions over time. Whilst the nature of the events has changed slightly from Q1 2018, data is still comparable.
This shows that over recent quarters, most SMEs met the definition of a Happy non-seeker of finance (85% in Q4 2018), while the proportion of Would-be seekers remained low (1% in Q4 2018). The proportion of SMEs reporting an event was 13% in Q4 2018, in line with recent quarters:
Any events
Over time – all SMES By date of interview
Q4 2016
Q1 2017
Q2 2017
Q3 2017
Q4 2017
Q1 2018
Q2 2018
Q3 2018
Q4 2018
Unweighted base: 4500 4500 4507 4505 4500 4500 4500 4502 4500
Have had an event 14% 11% 15% 17% 18% 14% 15% 14% 13%
• New or (auto) renewed facility 12% 10% 13% 15% 16% 12% 12% 13% 12%
• Type 2 or 3 events 3% 2% 3% 2% 3% 3% 4% 2% 2%
Would-be seekers 2% 2% 2% 2% 2% 2% 1% 2% 1%
Happy non-seekers 84% 86% 82% 81% 80% 83% 83% 83% 85%
Pastevt All SMEs NEW DEFINITION Q1 2018
Happy non-seekers can, and do, use external finance (the definition is based on borrowing events in the previous 12 months). Since 2015 around a quarter of Happy non-seekers have been using external finance (28% for 2018).
Permanent non-borrowers are by definition part of the Happy non-seekers group. The impact on the analysis above once these PNBs are removed is discussed later in the chapter.
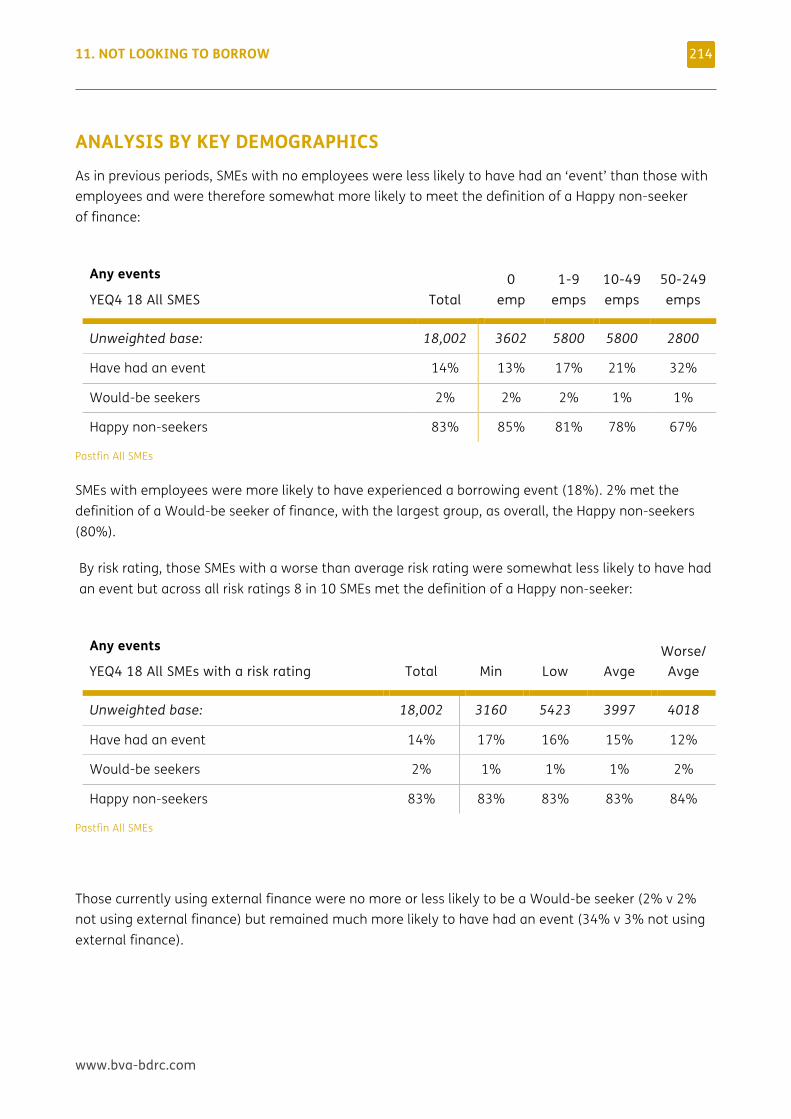
11. NOT LOOKING TO BORROW
www.bva-bdrc.com
214
ANALYSIS BY KEY DEMOGRAPHICS As in previous periods, SMEs with no employees were less likely to have had an ‘event’ than those with employees and were therefore somewhat more likely to meet the definition of a Happy non-seeker of finance:
Any events
YEQ4 18 All SMES Total 0
emp 1-9
emps 10-49 emps
50-249 emps
Unweighted base: 18,002 3602 5800 5800 2800
Have had an event 14% 13% 17% 21% 32%
Would-be seekers 2% 2% 2% 1% 1%
Happy non-seekers 83% 85% 81% 78% 67%
Pastfin All SMEs
SMEs with employees were more likely to have experienced a borrowing event (18%). 2% met the definition of a Would-be seeker of finance, with the largest group, as overall, the Happy non-seekers (80%).
By risk rating, those SMEs with a worse than average risk rating were somewhat less likely to have had an event but across all risk ratings 8 in 10 SMEs met the definition of a Happy non-seeker:
Any events
YEQ4 18 All SMEs with a risk rating Total Min Low Avge Worse/
Avge
Unweighted base: 18,002 3160 5423 3997 4018
Have had an event 14% 17% 16% 15% 12%
Would-be seekers 2% 1% 1% 1% 2%
Happy non-seekers 83% 83% 83% 83% 84%
Pastfin All SMEs
Those currently using external finance were no more or less likely to be a Would-be seeker (2% v 2% not using external finance) but remained much more likely to have had an event (34% v 3% not using external finance).
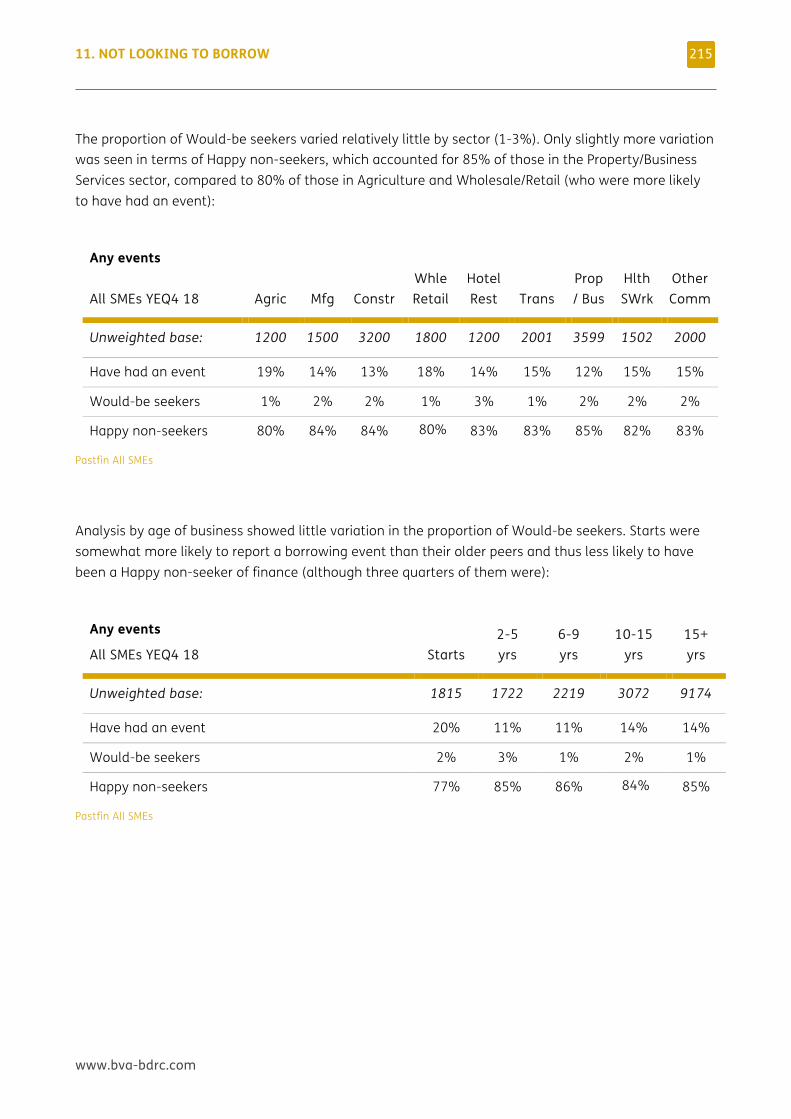
11. NOT LOOKING TO BORROW
www.bva-bdrc.com
215
The proportion of Would-be seekers varied relatively little by sector (1-3%). Only slightly more variation was seen in terms of Happy non-seekers, which accounted for 85% of those in the Property/Business Services sector, compared to 80% of those in Agriculture and Wholesale/Retail (who were more likely to have had an event):
Any events
All SMEs YEQ4 18 Agric Mfg Constr Whle Retail
Hotel Rest Trans
Prop/ Bus
Hlth SWrk
Other Comm
Unweighted base: 1200 1500 3200 1800 1200 2001 3599 1502 2000
Have had an event 19% 14% 13% 18% 14% 15% 12% 15% 15%
Would-be seekers 1% 2% 2% 1% 3% 1% 2% 2% 2%
Happy non-seekers 80% 84% 84% 80% 83% 83% 85% 82% 83%
Pastfin All SMEs
Analysis by age of business showed little variation in the proportion of Would-be seekers. Starts were somewhat more likely to report a borrowing event than their older peers and thus less likely to have been a Happy non-seeker of finance (although three quarters of them were):
Any events
All SMEs YEQ4 18 Starts 2-5 yrs
6-9 yrs
10-15 yrs
15+ yrs
Unweighted base: 1815 1722 2219 3072 9174
Have had an event 20% 11% 11% 14% 14%
Would-be seekers 2% 3% 1% 2% 1%
Happy non-seekers 77% 85% 86% 84% 85%
Pastfin All SMEs
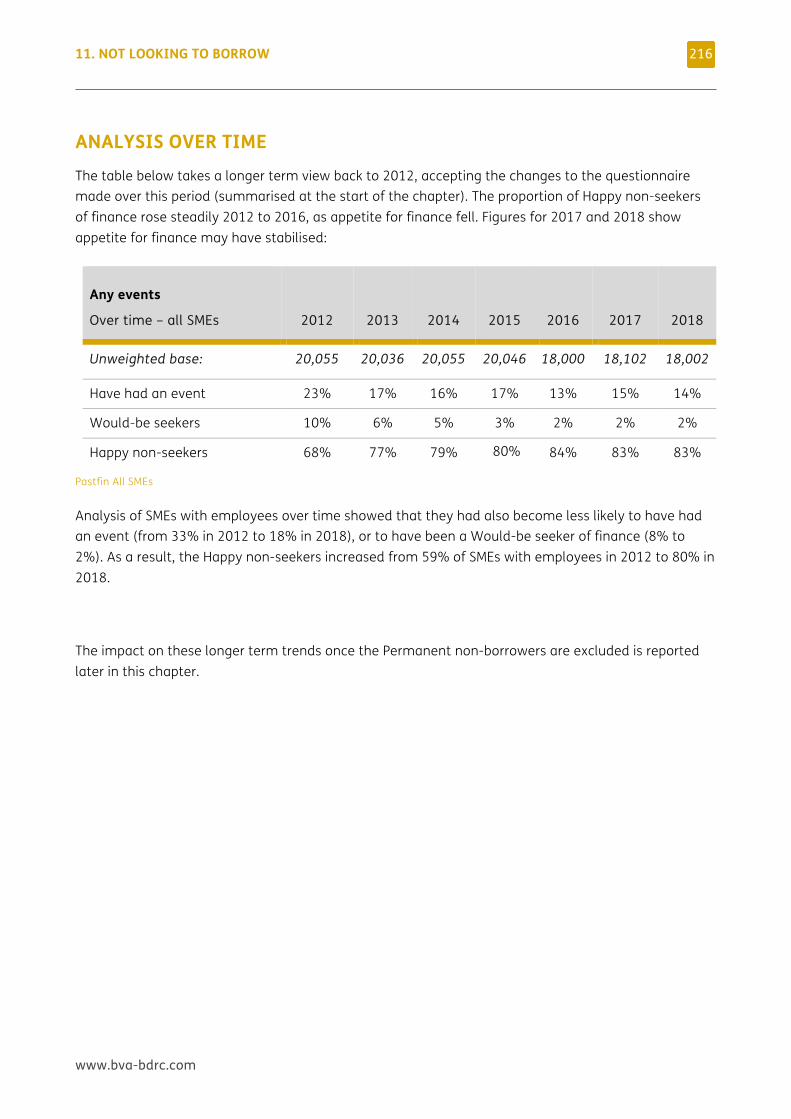
11. NOT LOOKING TO BORROW
www.bva-bdrc.com
216
ANALYSIS OVER TIME The table below takes a longer term view back to 2012, accepting the changes to the questionnaire made over this period (summarised at the start of the chapter). The proportion of Happy non-seekers of finance rose steadily 2012 to 2016, as appetite for finance fell. Figures for 2017 and 2018 show appetite for finance may have stabilised:
Any events
Over time – all SMEs 2012 2013 2014 2015
2016 2017 2018
Unweighted base: 20,055 20,036 20,055 20,046 18,000 18,102 18,002
Have had an event 23% 17% 16% 17% 13% 15% 14%
Would-be seekers 10% 6% 5% 3% 2% 2% 2%
Happy non-seekers 68% 77% 79% 80% 84% 83% 83%
Pastfin All SMEs
Analysis of SMEs with employees over time showed that they had also become less likely to have had an event (from 33% in 2012 to 18% in 2018), or to have been a Would-be seeker of finance (8% to 2%). As a result, the Happy non-seekers increased from 59% of SMEs with employees in 2012 to 80% in 2018.
The impact on these longer term trends once the Permanent non-borrowers are excluded is reported later in this chapter.
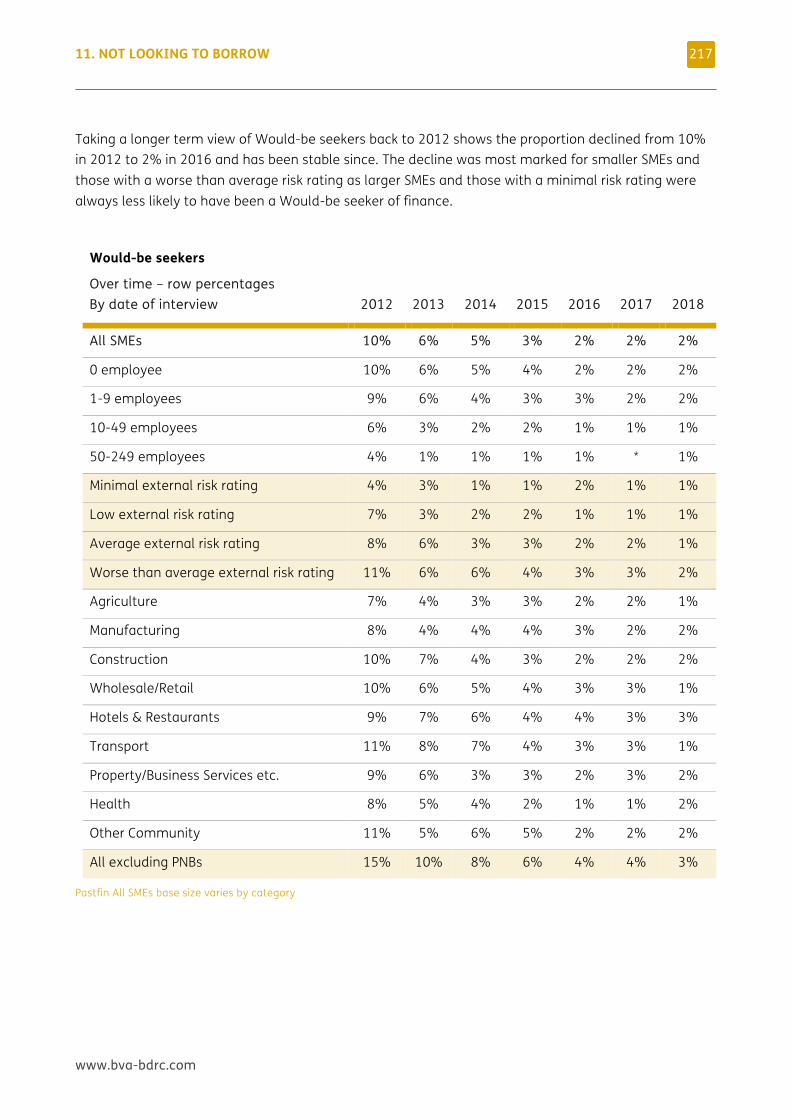
11. NOT LOOKING TO BORROW
www.bva-bdrc.com
217
Taking a longer term view of Would-be seekers back to 2012 shows the proportion declined from 10% in 2012 to 2% in 2016 and has been stable since. The decline was most marked for smaller SMEs and those with a worse than average risk rating as larger SMEs and those with a minimal risk rating were always less likely to have been a Would-be seeker of finance.
Would-be seekers
Over time – row percentages By date of interview 2012 2013 2014 2015 2016 2017 2018
All SMEs 10% 6% 5% 3% 2% 2% 2%
0 employee 10% 6% 5% 4% 2% 2% 2%
1-9 employees 9% 6% 4% 3% 3% 2% 2%
10-49 employees 6% 3% 2% 2% 1% 1% 1%
50-249 employees 4% 1% 1% 1% 1% * 1%
Minimal external risk rating 4% 3% 1% 1% 2% 1% 1%
Low external risk rating 7% 3% 2% 2% 1% 1% 1%
Average external risk rating 8% 6% 3% 3% 2% 2% 1%
Worse than average external risk rating 11% 6% 6% 4% 3% 3% 2%
Agriculture 7% 4% 3% 3% 2% 2% 1%
Manufacturing 8% 4% 4% 4% 3% 2% 2%
Construction 10% 7% 4% 3% 2% 2% 2%
Wholesale/Retail 10% 6% 5% 4% 3% 3% 1%
Hotels & Restaurants 9% 7% 6% 4% 4% 3% 3%
Transport 11% 8% 7% 4% 3% 3% 1%
Property/Business Services etc. 9% 6% 3% 3% 2% 3% 2%
Health 8% 5% 4% 2% 1% 1% 2%
Other Community 11% 5% 6% 5% 2% 2% 2%
All excluding PNBs 15% 10% 8% 6% 4% 4% 3%
Pastfin All SMEs base size varies by category
11. NOT LOOKING TO BORROW
www.bva-bdrc.com
218
BARRIERS TO APPLICATION FOR WOULD-BE SEEKERS SMEs that were identified as Would-be seekers (i.e. they had wanted to apply for finance in the 12 months prior to their interview but felt that something had stopped them) were asked about the barriers to making such an application.
These are reported below, firstly in terms of how frequently they were mentioned at all and secondly how frequently they were nominated as the main barrier.
The reasons have been grouped into the themes shown below, and respondents could initially nominate as many reasons as they wished for not having applied when they wanted to.
The reasons given in 2018, using the new questionnaire structure were:
Discouragement – those that had been put off, either directly (they made informal enquiries of the bank and were put off) or indirectly (they thought they would be turned down by the bank so did not ask). This was given as a reason by 29% of all Would-be seekers in 2018 and was somewhat less of an issue than in previous years (50% in 2017).
Process of borrowing – those who did not want to apply because they thought it would be too expensive, too much hassle etc. This was given as a reason by 37% of all Would-be seekers in 2018 having been 48% in 2017.
Principle of borrowing – those that did not apply because they feared they might lose control of their business, or preferred to seek alternative sources of funding. This was given as a reason by 29% of all Would-be seekers in 2018, up from 19% in 2017 and back to levels previously seen (29% in 2015).
Current economic climate – those that felt that it had not been the right time to borrow. This was given as a reason by 19% of all Would-be seekers in 2018, the highest level seen to date (9% in 2017).
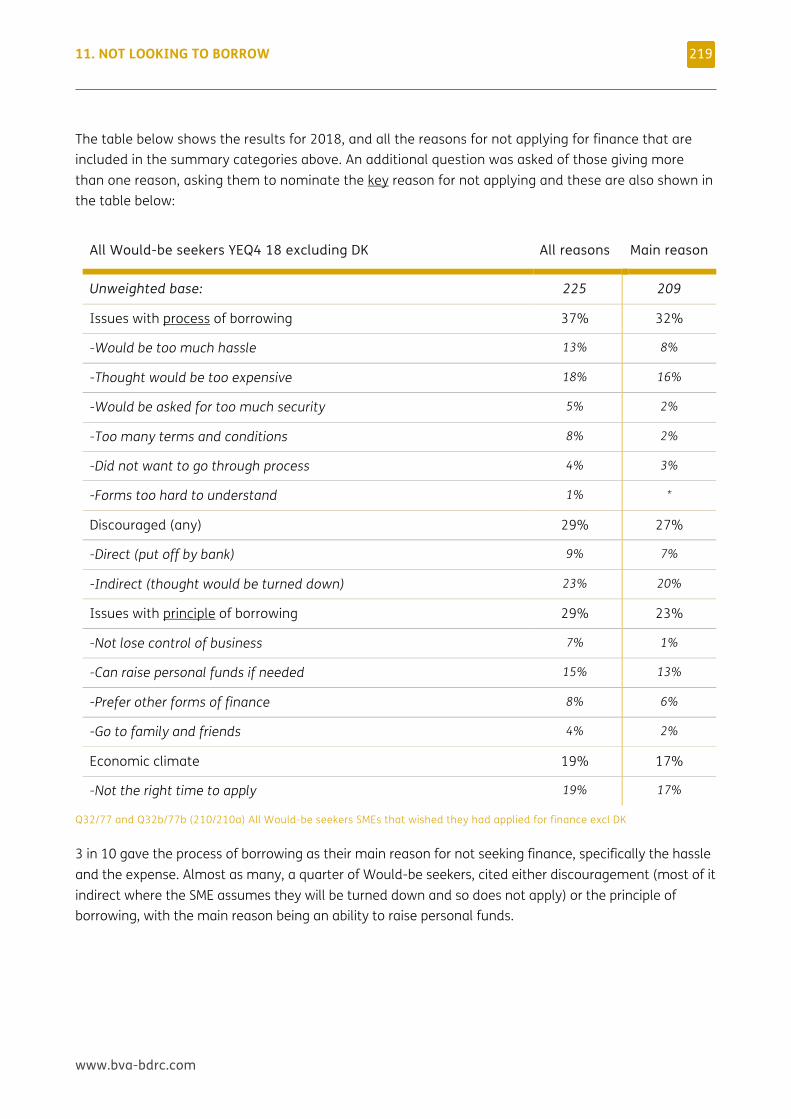
11. NOT LOOKING TO BORROW
www.bva-bdrc.com
219
The table below shows the results for 2018, and all the reasons for not applying for finance that are included in the summary categories above. An additional question was asked of those giving more than one reason, asking them to nominate the key reason for not applying and these are also shown in the table below:
All Would-be seekers YEQ4 18 excluding DK All reasons Main reason
Unweighted base: 225 209
Issues with process of borrowing 37% 32%
-Would be too much hassle 13% 8%
-Thought would be too expensive 18% 16%
-Would be asked for too much security 5% 2%
-Too many terms and conditions 8% 2%
-Did not want to go through process 4% 3%
-Forms too hard to understand 1% *
Discouraged (any) 29% 27%
-Direct (put off by bank) 9% 7%
-Indirect (thought would be turned down) 23% 20%
Issues with principle of borrowing 29% 23%
-Not lose control of business 7% 1%
-Can raise personal funds if needed 15% 13%
-Prefer other forms of finance 8% 6%
-Go to family and friends 4% 2%
Economic climate 19% 17%
-Not the right time to apply 19% 17%
Q32/77 and Q32b/77b (210/210a) All Would-be seekers SMEs that wished they had applied for finance excl DK
3 in 10 gave the process of borrowing as their main reason for not seeking finance, specifically the hassle and the expense. Almost as many, a quarter of Would-be seekers, cited either discouragement (most of it indirect where the SME assumes they will be turned down and so does not apply) or the principle of borrowing, with the main reason being an ability to raise personal funds.
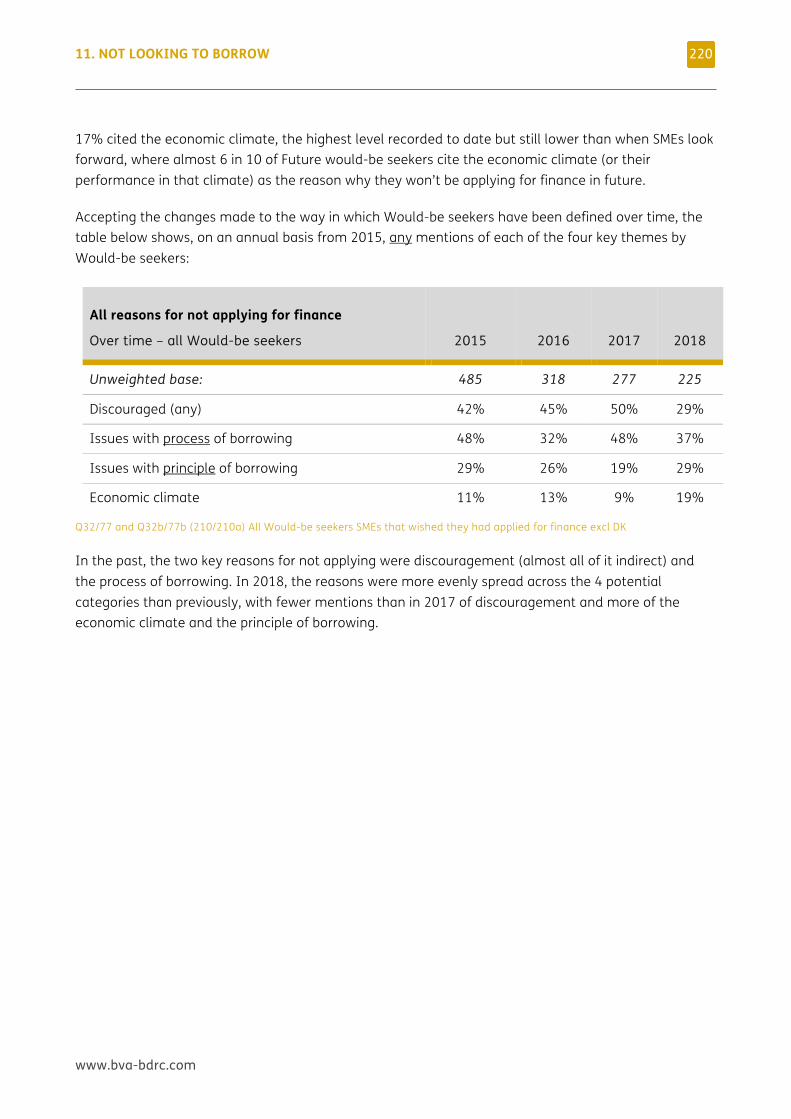
11. NOT LOOKING TO BORROW
www.bva-bdrc.com
220
17% cited the economic climate, the highest level recorded to date but still lower than when SMEs look forward, where almost 6 in 10 of Future would-be seekers cite the economic climate (or their performance in that climate) as the reason why they won’t be applying for finance in future.
Accepting the changes made to the way in which Would-be seekers have been defined over time, the table below shows, on an annual basis from 2015, any mentions of each of the four key themes by Would-be seekers:
All reasons for not applying for finance
Over time – all Would-be seekers 2015 2016 2017 2018
Unweighted base: 485 318 277 225
Discouraged (any) 42% 45% 50% 29%
Issues with process of borrowing 48% 32% 48% 37%
Issues with principle of borrowing 29% 26% 19% 29%
Economic climate 11% 13% 9% 19%
Q32/77 and Q32b/77b (210/210a) All Would-be seekers SMEs that wished they had applied for finance excl DK
In the past, the two key reasons for not applying were discouragement (almost all of it indirect) and the process of borrowing. In 2018, the reasons were more evenly spread across the 4 potential categories than previously, with fewer mentions than in 2017 of discouragement and more of the economic climate and the principle of borrowing.
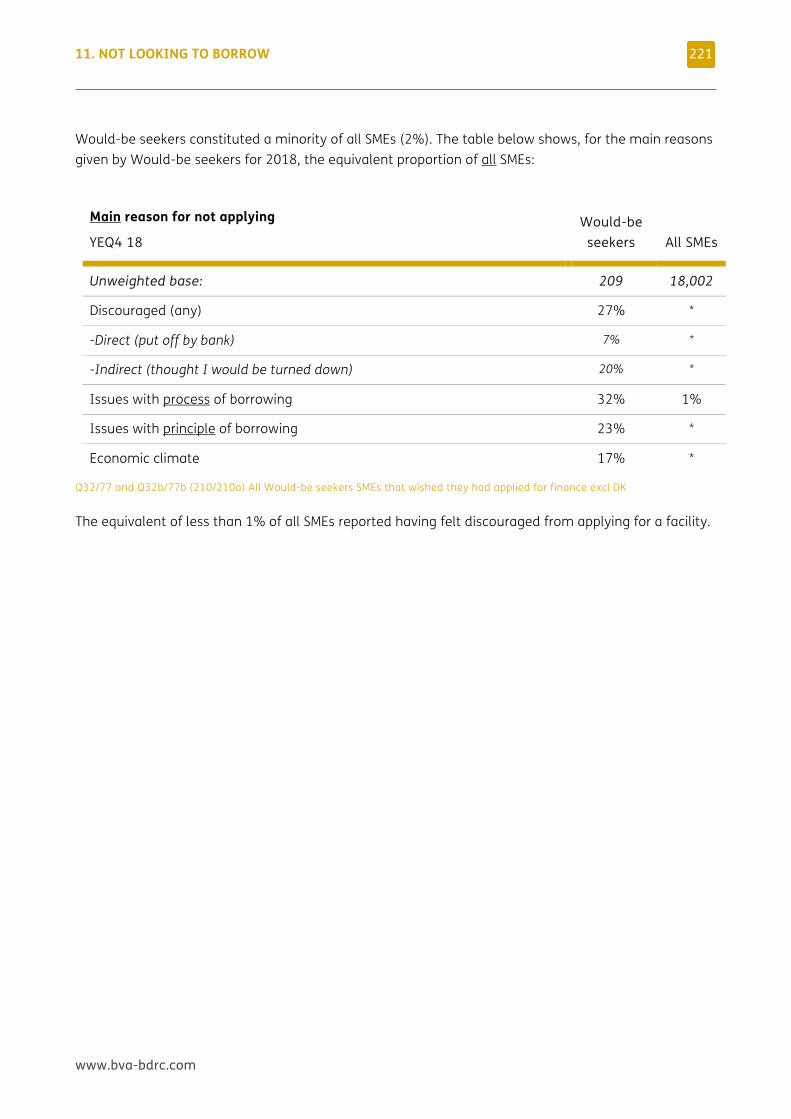
11. NOT LOOKING TO BORROW
www.bva-bdrc.com
221
Would-be seekers constituted a minority of all SMEs (2%). The table below shows, for the main reasons given by Would-be seekers for 2018, the equivalent proportion of all SMEs:
Main reason for not applying
YEQ4 18 Would-be
seekers All SMEs
Unweighted base: 209 18,002
Discouraged (any) 27% *
-Direct (put off by bank) 7% *
-Indirect (thought I would be turned down) 20% *
Issues with process of borrowing 32% 1%
Issues with principle of borrowing 23% *
Economic climate 17% *
Q32/77 and Q32b/77b (210/210a) All Would-be seekers SMEs that wished they had applied for finance excl DK
The equivalent of less than 1% of all SMEs reported having felt discouraged from applying for a facility.
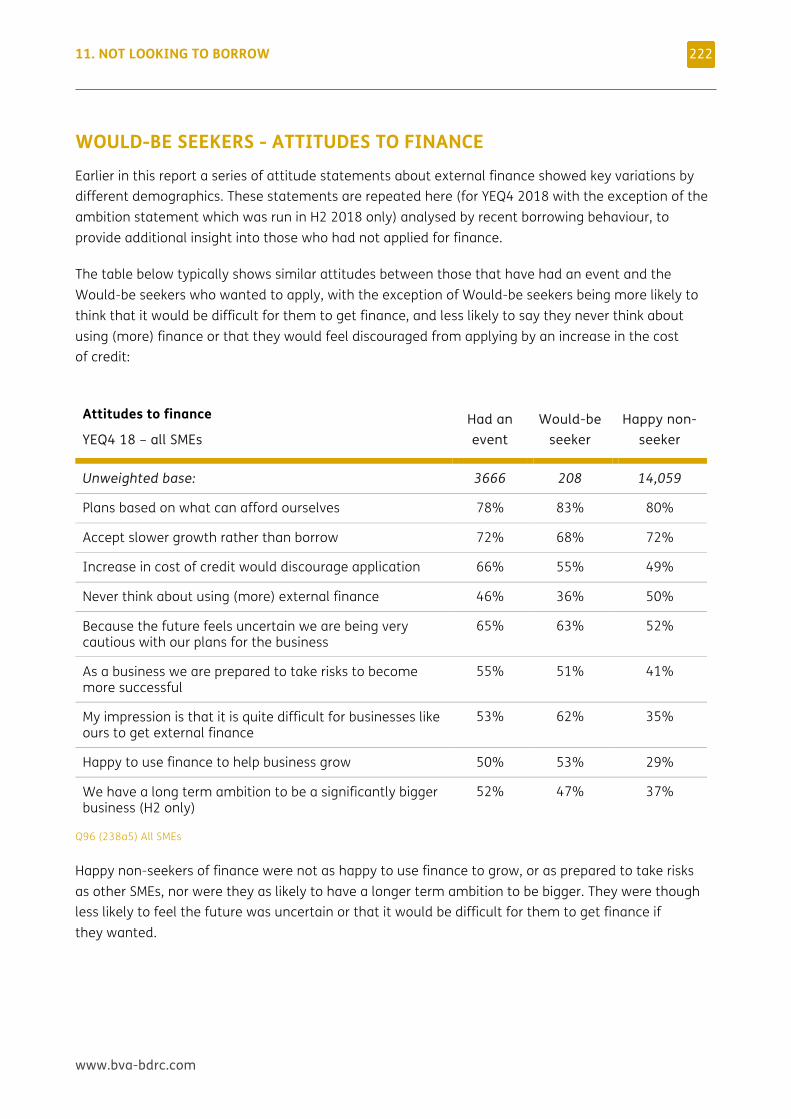
11. NOT LOOKING TO BORROW
www.bva-bdrc.com
222
WOULD-BE SEEKERS - ATTITUDES TO FINANCE Earlier in this report a series of attitude statements about external finance showed key variations by different demographics. These statements are repeated here (for YEQ4 2018 with the exception of the ambition statement which was run in H2 2018 only) analysed by recent borrowing behaviour, to provide additional insight into those who had not applied for finance.
The table below typically shows similar attitudes between those that have had an event and the Would-be seekers who wanted to apply, with the exception of Would-be seekers being more likely to think that it would be difficult for them to get finance, and less likely to say they never think about using (more) finance or that they would feel discouraged from applying by an increase in the cost of credit:
Attitudes to finance
YEQ4 18 – all SMEs Had an event
Would-be seeker
Happy non-seeker
Unweighted base: 3666 208 14,059
Plans based on what can afford ourselves 78% 83% 80%
Accept slower growth rather than borrow 72% 68% 72%
Increase in cost of credit would discourage application 66% 55% 49%
Never think about using (more) external finance 46% 36% 50%
Because the future feels uncertain we are being very cautious with our plans for the business
65% 63% 52%
As a business we are prepared to take risks to become more successful
55% 51% 41%
My impression is that it is quite difficult for businesses like ours to get external finance
53% 62% 35%
Happy to use finance to help business grow 50% 53% 29%
We have a long term ambition to be a significantly bigger business (H2 only)
52% 47% 37%
Q96 (238a5) All SMEs
Happy non-seekers of finance were not as happy to use finance to grow, or as prepared to take risks as other SMEs, nor were they as likely to have a longer term ambition to be bigger. They were though less likely to feel the future was uncertain or that it would be difficult for them to get finance if they wanted.
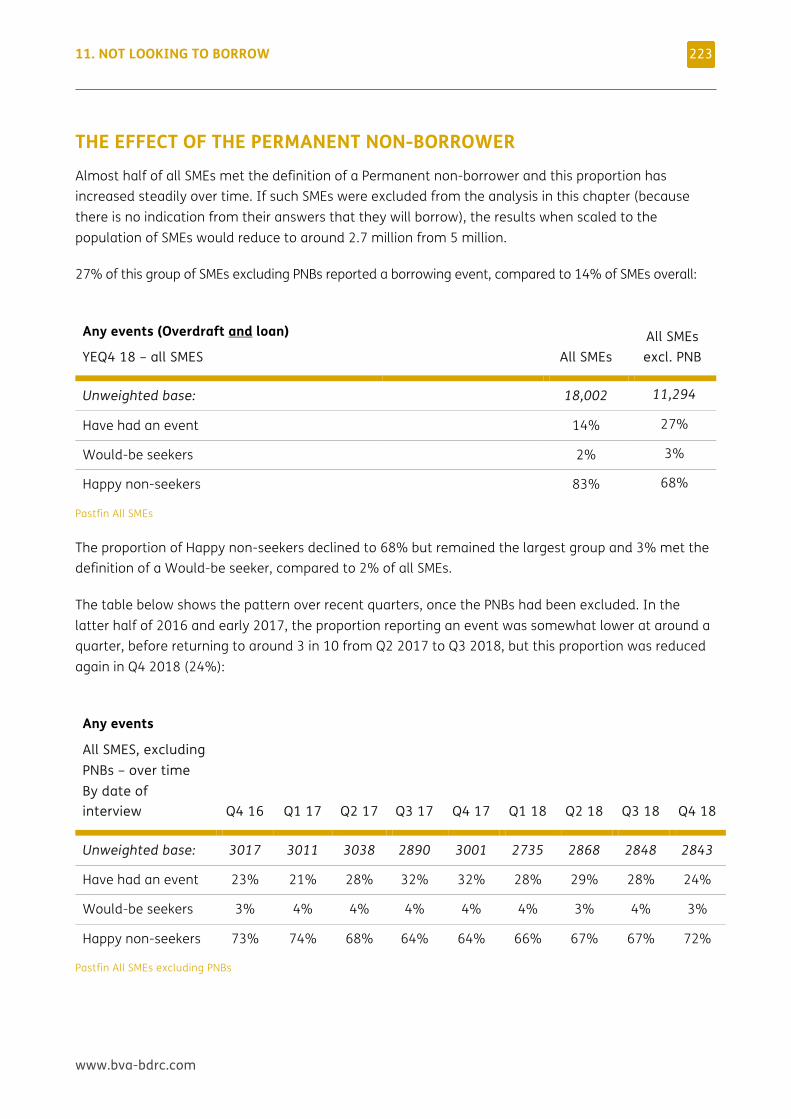
11. NOT LOOKING TO BORROW
www.bva-bdrc.com
223
THE EFFECT OF THE PERMANENT NON-BORROWER Almost half of all SMEs met the definition of a Permanent non-borrower and this proportion has increased steadily over time. If such SMEs were excluded from the analysis in this chapter (because there is no indication from their answers that they will borrow), the results when scaled to the population of SMEs would reduce to around 2.7 million from 5 million.
27% of this group of SMEs excluding PNBs reported a borrowing event, compared to 14% of SMEs overall:
Any events (Overdraft and loan)
YEQ4 18 – all SMES All SMEs All SMEs excl. PNB
Unweighted base: 18,002 11,294
Have had an event 14% 27%
Would-be seekers 2% 3%
Happy non-seekers 83% 68%
Pastfin All SMEs
The proportion of Happy non-seekers declined to 68% but remained the largest group and 3% met the definition of a Would-be seeker, compared to 2% of all SMEs.
The table below shows the pattern over recent quarters, once the PNBs had been excluded. In the latter half of 2016 and early 2017, the proportion reporting an event was somewhat lower at around a quarter, before returning to around 3 in 10 from Q2 2017 to Q3 2018, but this proportion was reduced again in Q4 2018 (24%):
Any events
All SMES, excluding PNBs – over time By date of interview Q4 16 Q1 17 Q2 17 Q3 17 Q4 17 Q1 18 Q2 18 Q3 18 Q4 18
Unweighted base: 3017 3011 3038 2890 3001 2735 2868 2848 2843
Have had an event 23% 21% 28% 32% 32% 28% 29% 28% 24%
Would-be seekers 3% 4% 4% 4% 4% 4% 3% 4% 3%
Happy non-seekers 73% 74% 68% 64% 64% 66% 67% 67% 72%
Pastfin All SMEs excluding PNBs
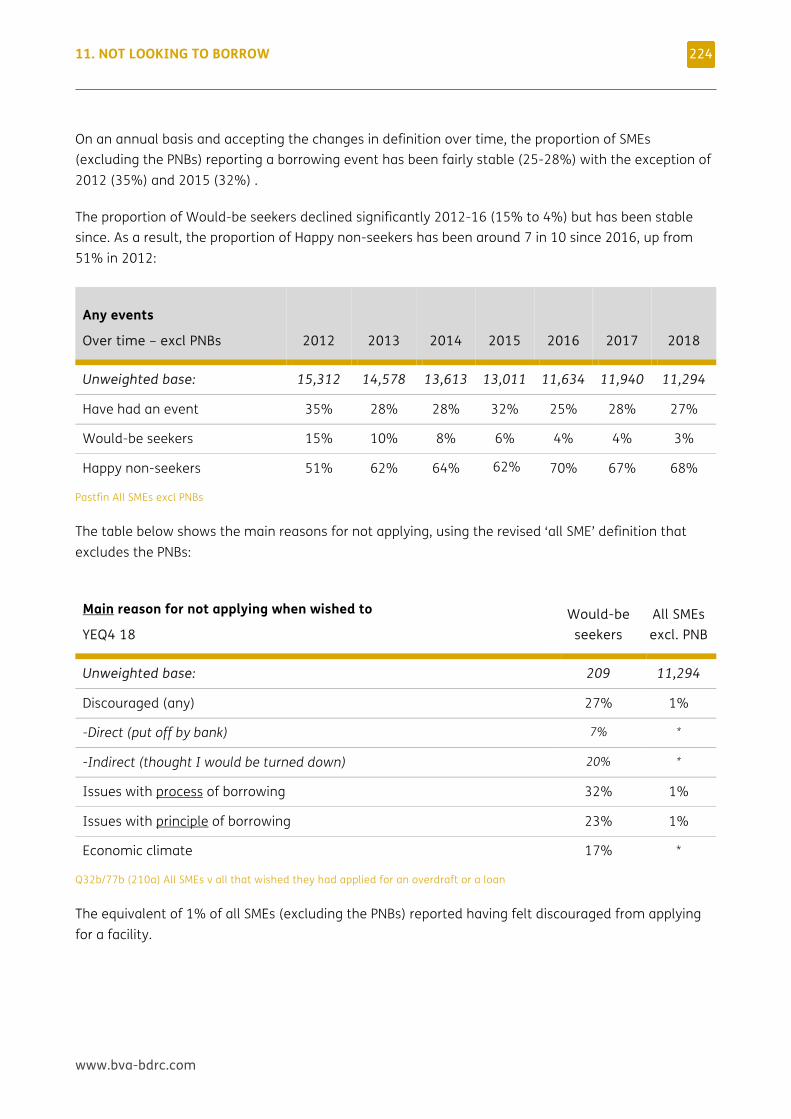
11. NOT LOOKING TO BORROW
www.bva-bdrc.com
224
On an annual basis and accepting the changes in definition over time, the proportion of SMEs (excluding the PNBs) reporting a borrowing event has been fairly stable (25-28%) with the exception of 2012 (35%) and 2015 (32%) .
The proportion of Would-be seekers declined significantly 2012-16 (15% to 4%) but has been stable since. As a result, the proportion of Happy non-seekers has been around 7 in 10 since 2016, up from 51% in 2012:
Any events
Over time – excl PNBs 2012 2013 2014 2015 2016 2017 2018
Unweighted base: 15,312 14,578 13,613 13,011 11,634 11,940 11,294
Have had an event 35% 28% 28% 32% 25% 28% 27%
Would-be seekers 15% 10% 8% 6% 4% 4% 3%
Happy non-seekers 51% 62% 64% 62% 70% 67% 68%
Pastfin All SMEs excl PNBs
The table below shows the main reasons for not applying, using the revised ‘all SME’ definition that excludes the PNBs:
Main reason for not applying when wished to
YEQ4 18 Would-be
seekers All SMEs excl. PNB
Unweighted base: 209 11,294
Discouraged (any) 27% 1%
-Direct (put off by bank) 7% *
-Indirect (thought I would be turned down) 20% *
Issues with process of borrowing 32% 1%
Issues with principle of borrowing 23% 1%
Economic climate 17% *
Q32b/77b (210a) All SMEs v all that wished they had applied for an overdraft or a loan
The equivalent of 1% of all SMEs (excluding the PNBs) reported having felt discouraged from applying for a facility.
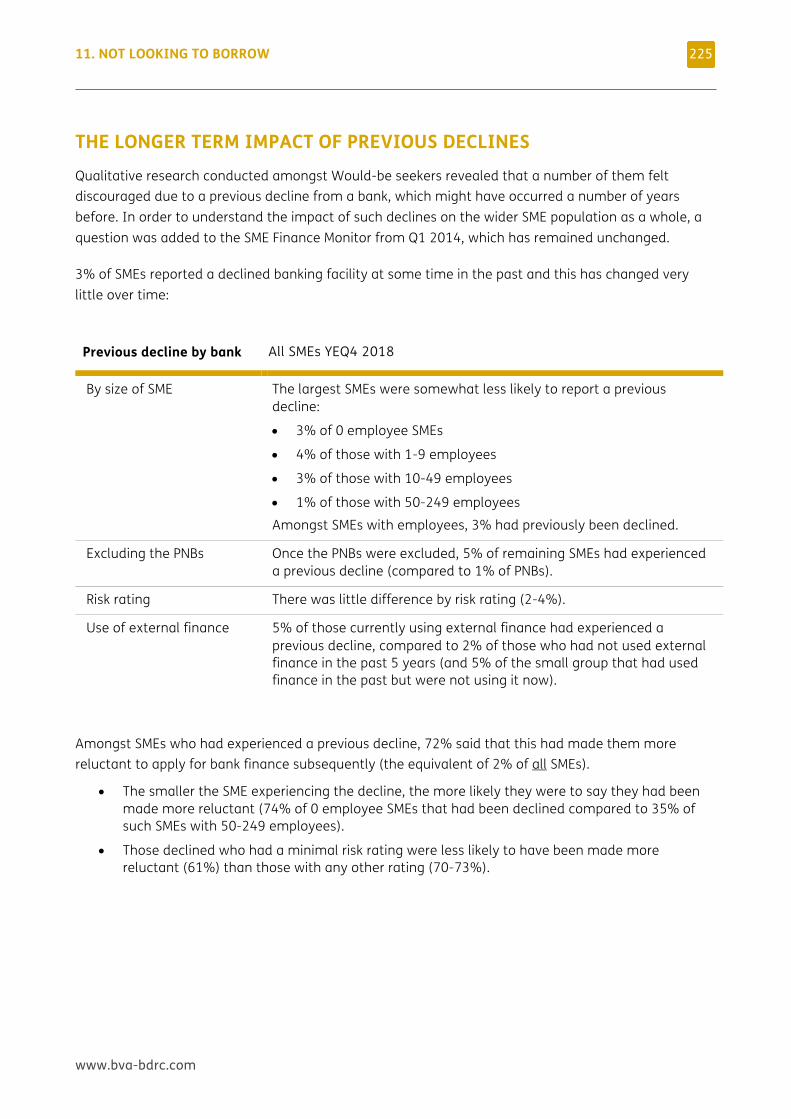
11. NOT LOOKING TO BORROW
www.bva-bdrc.com
225
THE LONGER TERM IMPACT OF PREVIOUS DECLINES Qualitative research conducted amongst Would-be seekers revealed that a number of them felt discouraged due to a previous decline from a bank, which might have occurred a number of years before. In order to understand the impact of such declines on the wider SME population as a whole, a question was added to the SME Finance Monitor from Q1 2014, which has remained unchanged.
3% of SMEs reported a declined banking facility at some time in the past and this has changed very little over time:
Previous decline by bank All SMEs YEQ4 2018
By size of SME The largest SMEs were somewhat less likely to report a previous decline:
• 3% of 0 employee SMEs
• 4% of those with 1-9 employees
• 3% of those with 10-49 employees
• 1% of those with 50-249 employees
Amongst SMEs with employees, 3% had previously been declined.
Excluding the PNBs Once the PNBs were excluded, 5% of remaining SMEs had experienced a previous decline (compared to 1% of PNBs).
Risk rating There was little difference by risk rating (2-4%).
Use of external finance 5% of those currently using external finance had experienced a previous decline, compared to 2% of those who had not used external finance in the past 5 years (and 5% of the small group that had used finance in the past but were not using it now).
Amongst SMEs who had experienced a previous decline, 72% said that this had made them more reluctant to apply for bank finance subsequently (the equivalent of 2% of all SMEs).
• The smaller the SME experiencing the decline, the more likely they were to say they had been made more reluctant (74% of 0 employee SMEs that had been declined compared to 35% of such SMEs with 50-249 employees).
• Those declined who had a minimal risk rating were less likely to have been made more reluctant (61%) than those with any other rating (70-73%).
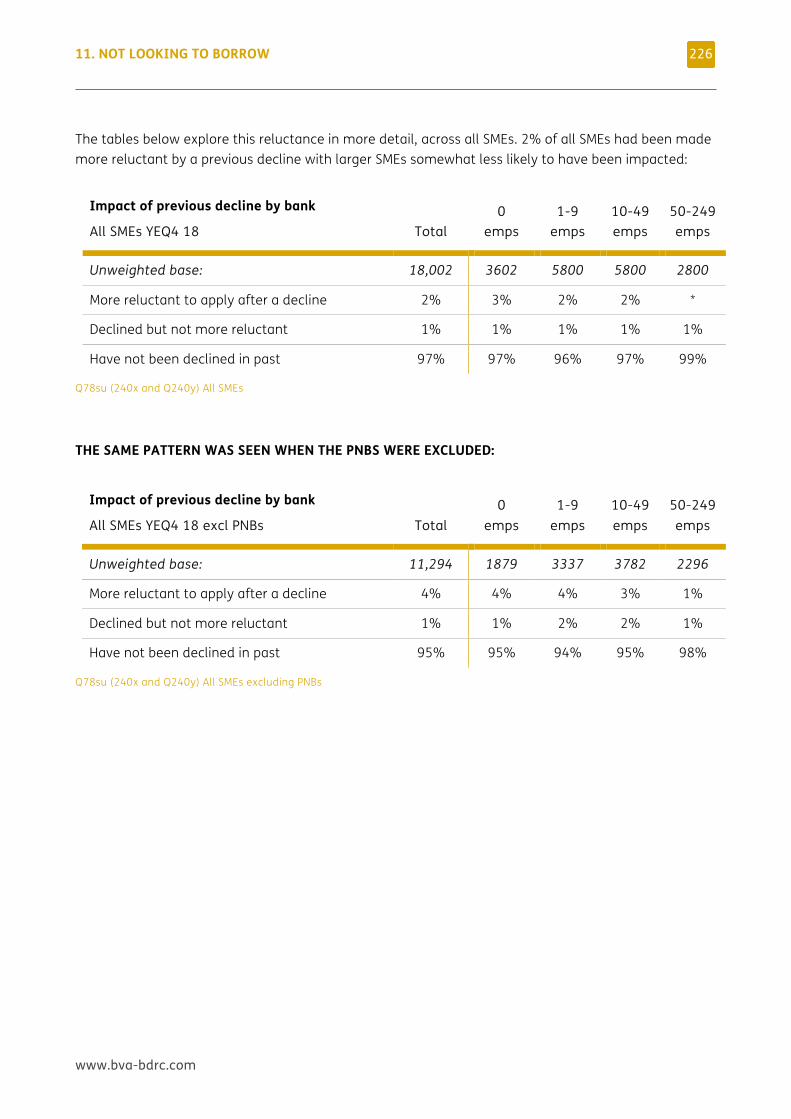
11. NOT LOOKING TO BORROW
www.bva-bdrc.com
226
The tables below explore this reluctance in more detail, across all SMEs. 2% of all SMEs had been made more reluctant by a previous decline with larger SMEs somewhat less likely to have been impacted:
Impact of previous decline by bank
All SMEs YEQ4 18 Total 0
emps 1-9
emps 10-49 emps
50-249 emps
Unweighted base: 18,002 3602 5800 5800 2800
More reluctant to apply after a decline 2% 3% 2% 2% *
Declined but not more reluctant 1% 1% 1% 1% 1%
Have not been declined in past 97% 97% 96% 97% 99%
Q78su (240x and Q240y) All SMEs
THE SAME PATTERN WAS SEEN WHEN THE PNBS WERE EXCLUDED:
Impact of previous decline by bank
All SMEs YEQ4 18 excl PNBs Total 0
emps 1-9
emps 10-49 emps
50-249 emps
Unweighted base: 11,294 1879 3337 3782 2296
More reluctant to apply after a decline 4% 4% 4% 3% 1%
Declined but not more reluctant 1% 1% 2% 2% 1%
Have not been declined in past 95% 95% 94% 95% 98%
Q78su (240x and Q240y) All SMEs excluding PNBs
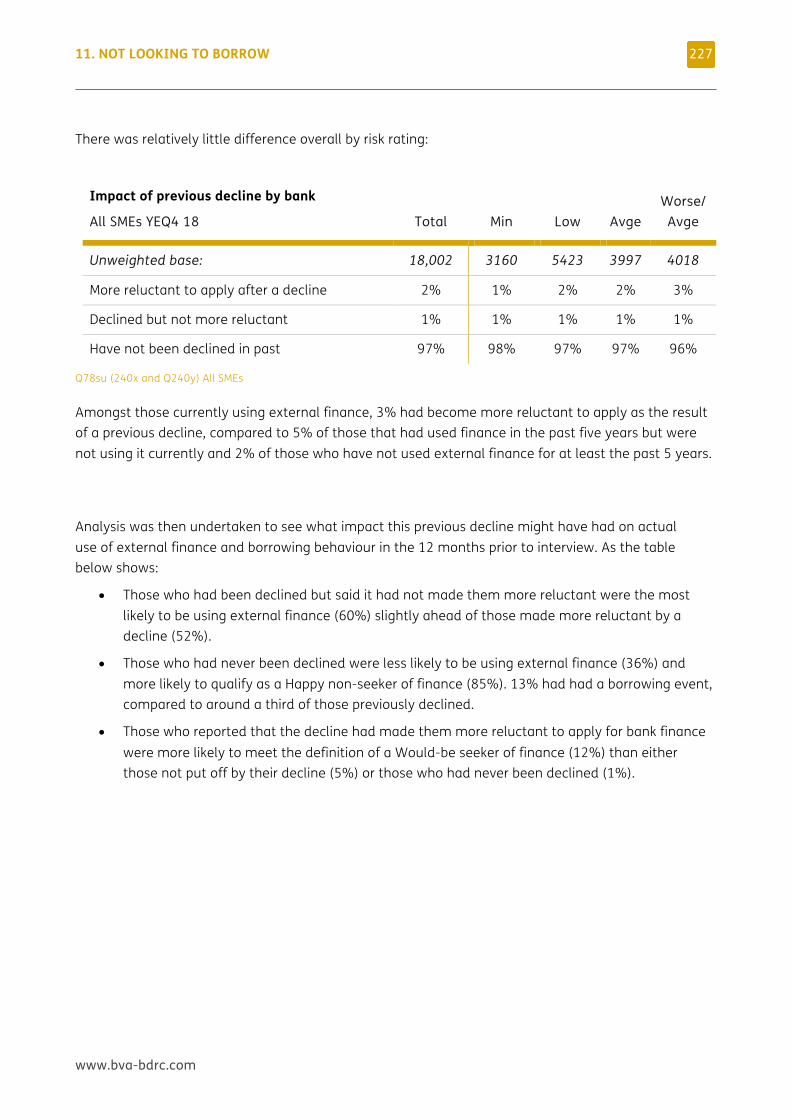
11. NOT LOOKING TO BORROW
www.bva-bdrc.com
227
There was relatively little difference overall by risk rating:
Impact of previous decline by bank
All SMEs YEQ4 18 Total Min Low Avge Worse/
Avge
Unweighted base: 18,002 3160 5423 3997 4018
More reluctant to apply after a decline 2% 1% 2% 2% 3%
Declined but not more reluctant 1% 1% 1% 1% 1%
Have not been declined in past 97% 98% 97% 97% 96%
Q78su (240x and Q240y) All SMEs
Amongst those currently using external finance, 3% had become more reluctant to apply as the result of a previous decline, compared to 5% of those that had used finance in the past five years but were not using it currently and 2% of those who have not used external finance for at least the past 5 years.
Analysis was then undertaken to see what impact this previous decline might have had on actual use of external finance and borrowing behaviour in the 12 months prior to interview. As the table below shows:
• Those who had been declined but said it had not made them more reluctant were the most likely to be using external finance (60%) slightly ahead of those made more reluctant by a decline (52%).
• Those who had never been declined were less likely to be using external finance (36%) and more likely to qualify as a Happy non-seeker of finance (85%). 13% had had a borrowing event, compared to around a third of those previously declined.
• Those who reported that the decline had made them more reluctant to apply for bank finance were more likely to meet the definition of a Would-be seeker of finance (12%) than either those not put off by their decline (5%) or those who had never been declined (1%).
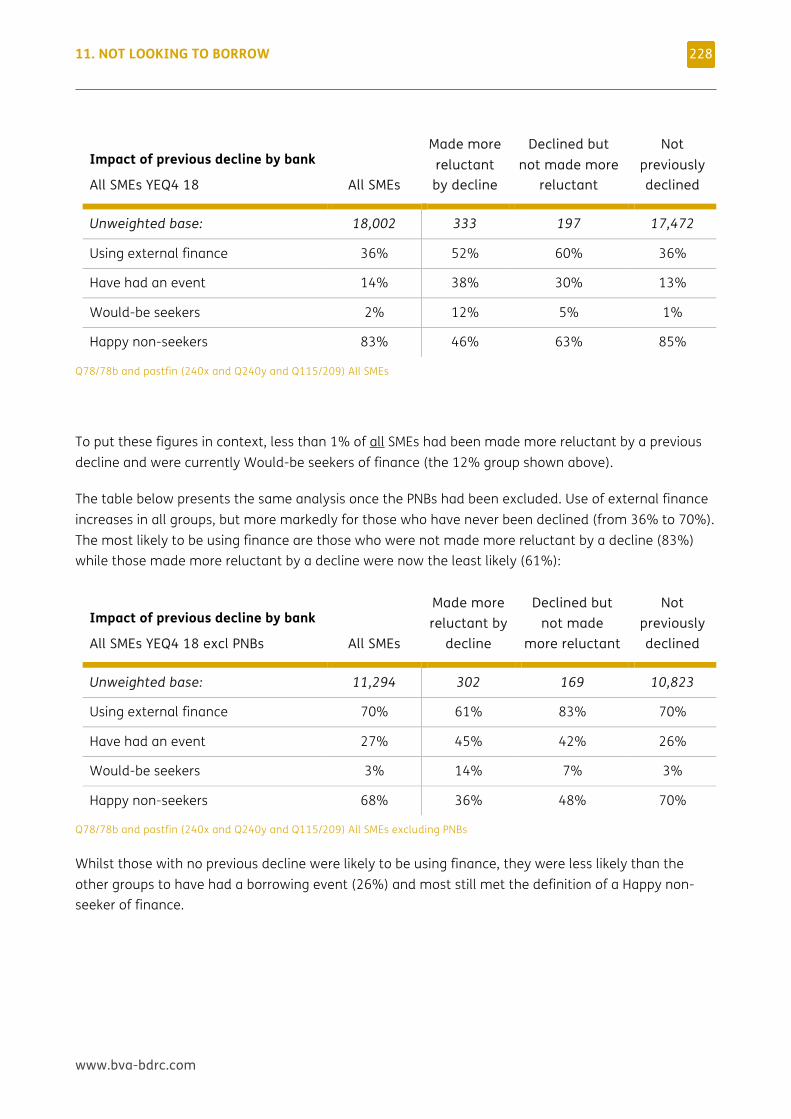
11. NOT LOOKING TO BORROW
www.bva-bdrc.com
228
Impact of previous decline by bank
All SMEs YEQ4 18 All SMEs
Made more reluctant by decline
Declined but not made more
reluctant
Not previously declined
Unweighted base: 18,002 333 197 17,472
Using external finance 36% 52% 60% 36%
Have had an event 14% 38% 30% 13%
Would-be seekers 2% 12% 5% 1%
Happy non-seekers 83% 46% 63% 85%
Q78/78b and pastfin (240x and Q240y and Q115/209) All SMEs
To put these figures in context, less than 1% of all SMEs had been made more reluctant by a previous decline and were currently Would-be seekers of finance (the 12% group shown above).
The table below presents the same analysis once the PNBs had been excluded. Use of external finance increases in all groups, but more markedly for those who have never been declined (from 36% to 70%). The most likely to be using finance are those who were not made more reluctant by a decline (83%) while those made more reluctant by a decline were now the least likely (61%):
Impact of previous decline by bank
All SMEs YEQ4 18 excl PNBs All SMEs
Made more reluctant by
decline
Declined but not made
more reluctant
Not previously declined
Unweighted base: 11,294 302 169 10,823
Using external finance 70% 61% 83% 70%
Have had an event 27% 45% 42% 26%
Would-be seekers 3% 14% 7% 3%
Happy non-seekers 68% 36% 48% 70%
Q78/78b and pastfin (240x and Q240y and Q115/209) All SMEs excluding PNBs
Whilst those with no previous decline were likely to be using finance, they were less likely than the other groups to have had a borrowing event (26%) and most still met the definition of a Happy non-seeker of finance.
www.bva-bdrc.com
12 THE FUTURE THIS CHAPTER PROVIDES on growth plans and perceived barriers to that growth. It then explores SMEs’ intentions for the next 3 months, in terms of finance and the reasons why SMEs think that they will/will not be applying for new/renewed finance in that time period.
12. THE FUTURE
www.bva-bdrc.com
230
KEY FINDINGS Future growth: In Q4 2018, 50% of SMEs were planning to grow in the next 12 months, increasing by size of SME from 48% of those with 0 employees to 76% of those with 50-249 employees
• In 2018 as a whole, 49% were planning to grow, the highest proportion recorded since 2013 (also 49%), up from 45% in 2017
• This was due to more of the 0 employee SMEs planning to grow (46% from 41% in 2017) and also those with 50-249 employees (79% from 69% in 2017)
• Almost all of those planning to grow (98%) said this would be achieved through more sales in the UK while 11% planned to sell more overseas (the equivalent of 5% of all SMEs)
• Exporters remained more likely to be planning to grow (60%) than non- exporters (47%) and to plan to grow overseas (23% of those planning to grow v 3% of non-exporters planning to grow)
• 34% of all SMEs were planning any of a series of activities usually associated with growth, such as taking on more staff or developing a new product or service. This increased by size of SME from 30% of those with 0 employees to 64% of those with 50-249 employees and to 51% of those planning to grow (compared to 17% of those with no such plans)
• The proportion planning any growth related activity has decreased from 42% in H2 2017, when the question was first asked, to 37% in H2 2018, and across all size bands except those with 50-249 employees
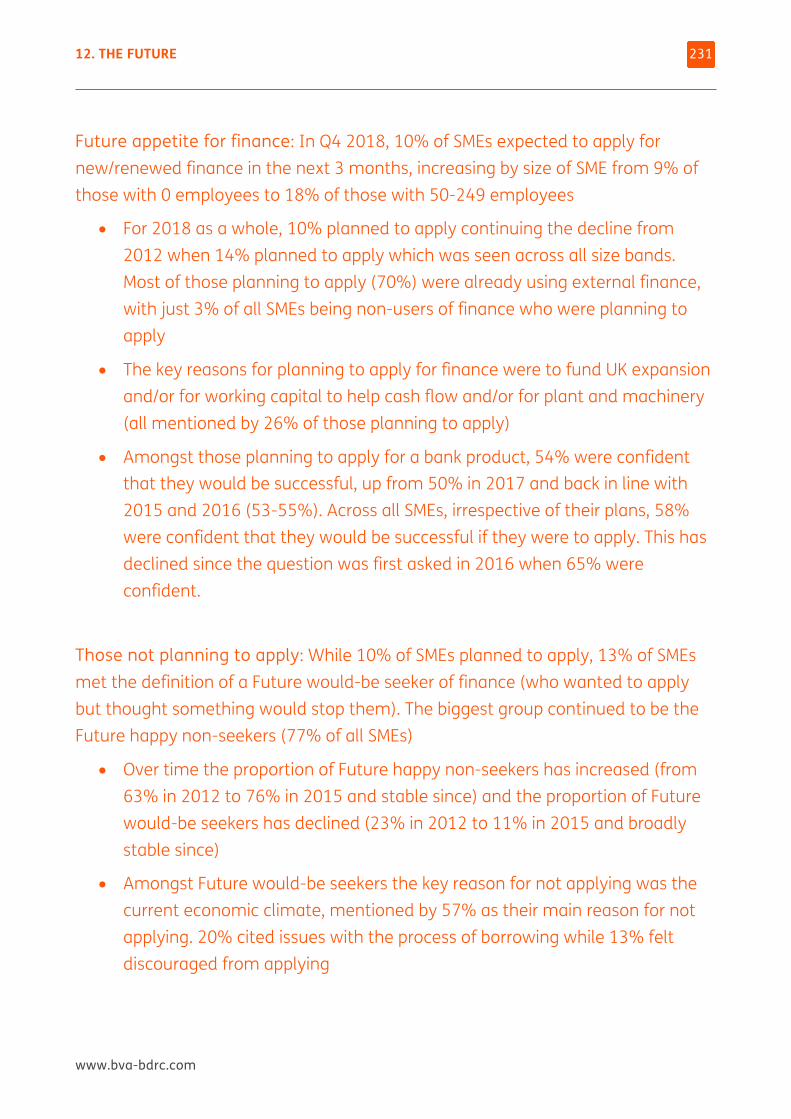
12. THE FUTURE
www.bva-bdrc.com
231
Future appetite for finance: In Q4 2018, 10% of SMEs expected to apply for new/renewed finance in the next 3 months, increasing by size of SME from 9% of those with 0 employees to 18% of those with 50-249 employees
• For 2018 as a whole, 10% planned to apply continuing the decline from 2012 when 14% planned to apply which was seen across all size bands. Most of those planning to apply (70%) were already using external finance, with just 3% of all SMEs being non-users of finance who were planning to apply
• The key reasons for planning to apply for finance were to fund UK expansion and/or for working capital to help cash flow and/or for plant and machinery (all mentioned by 26% of those planning to apply)
• Amongst those planning to apply for a bank product, 54% were confident that they would be successful, up from 50% in 2017 and back in line with 2015 and 2016 (53-55%). Across all SMEs, irrespective of their plans, 58% were confident that they would be successful if they were to apply. This has declined since the question was first asked in 2016 when 65% were confident.
Those not planning to apply: While 10% of SMEs planned to apply, 13% of SMEs met the definition of a Future would-be seeker of finance (who wanted to apply but thought something would stop them). The biggest group continued to be the Future happy non-seekers (77% of all SMEs)
• Over time the proportion of Future happy non-seekers has increased (from 63% in 2012 to 76% in 2015 and stable since) and the proportion of Future would-be seekers has declined (23% in 2012 to 11% in 2015 and broadly stable since)
• Amongst Future would-be seekers the key reason for not applying was the current economic climate, mentioned by 57% as their main reason for not applying. 20% cited issues with the process of borrowing while 13% felt discouraged from applying
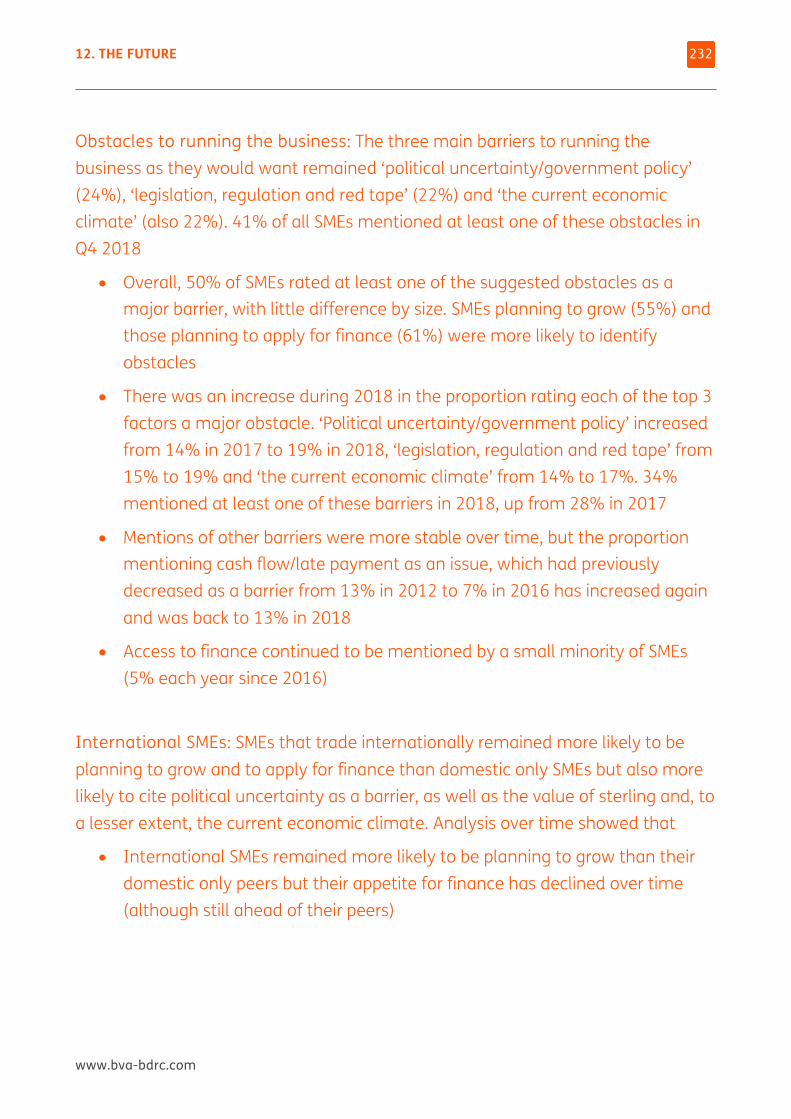
12. THE FUTURE
www.bva-bdrc.com
232
Obstacles to running the business: The three main barriers to running the business as they would want remained ‘political uncertainty/government policy’ (24%), ‘legislation, regulation and red tape’ (22%) and ‘the current economic climate’ (also 22%). 41% of all SMEs mentioned at least one of these obstacles in Q4 2018
• Overall, 50% of SMEs rated at least one of the suggested obstacles as a major barrier, with little difference by size. SMEs planning to grow (55%) and those planning to apply for finance (61%) were more likely to identify obstacles
• There was an increase during 2018 in the proportion rating each of the top 3 factors a major obstacle. ‘Political uncertainty/government policy’ increased from 14% in 2017 to 19% in 2018, ‘legislation, regulation and red tape’ from 15% to 19% and ‘the current economic climate’ from 14% to 17%. 34% mentioned at least one of these barriers in 2018, up from 28% in 2017
• Mentions of other barriers were more stable over time, but the proportion mentioning cash flow/late payment as an issue, which had previously decreased as a barrier from 13% in 2012 to 7% in 2016 has increased again and was back to 13% in 2018
• Access to finance continued to be mentioned by a small minority of SMEs (5% each year since 2016)
International SMEs: SMEs that trade internationally remained more likely to be planning to grow and to apply for finance than domestic only SMEs but also more likely to cite political uncertainty as a barrier, as well as the value of sterling and, to a lesser extent, the current economic climate. Analysis over time showed that
• International SMEs remained more likely to be planning to grow than their domestic only peers but their appetite for finance has declined over time (although still ahead of their peers)
12. THE FUTURE
www.bva-bdrc.com
233
Having reviewed performance over the 12 months prior to interview, SMEs were then asked about the future. As this is looking forward, the results from each quarter can more easily be compared to each other, providing a guide to SME sentiment over time.
This chapter reports on growth objectives and perceived barriers to future business performance. It then explores SMEs’ intentions for the next 3 months in terms of finance and the reasons why SMEs think that they will/will not be applying for new/renewed finance in that time period.
Most of this chapter therefore is based on Q4 2018 data gathered between October and December 2018, as Brexit negotiations and parliamentary votes continued in a climate of uncertainty.
SMEs that trade internationally will potentially be anticipating more of an impact post-Brexit, so this chapter also includes a summary of how such SMEs have been feeling since the referendum result.
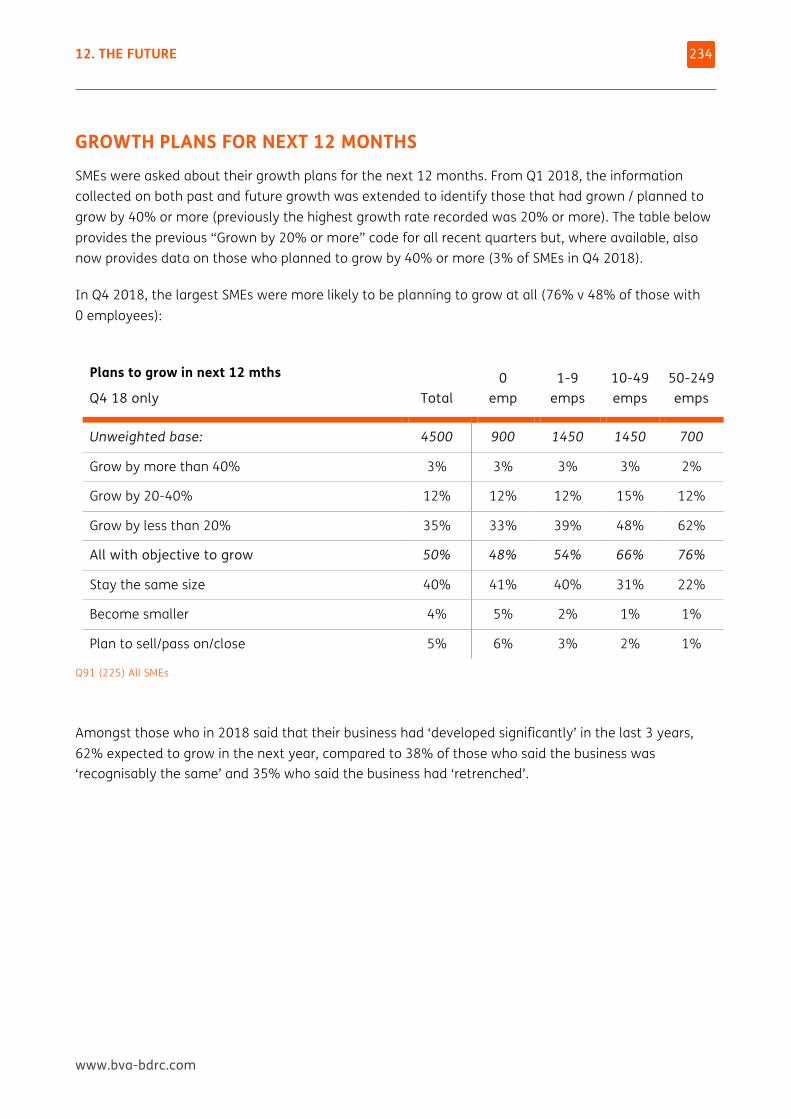
12. THE FUTURE
www.bva-bdrc.com
234
GROWTH PLANS FOR NEXT 12 MONTHS SMEs were asked about their growth plans for the next 12 months. From Q1 2018, the information collected on both past and future growth was extended to identify those that had grown / planned to grow by 40% or more (previously the highest growth rate recorded was 20% or more). The table below provides the previous “Grown by 20% or more” code for all recent quarters but, where available, also now provides data on those who planned to grow by 40% or more (3% of SMEs in Q4 2018).
In Q4 2018, the largest SMEs were more likely to be planning to grow at all (76% v 48% of those with 0 employees):
Plans to grow in next 12 mths
Q4 18 only Total 0
emp 1-9
emps 10-49 emps
50-249 emps
Unweighted base: 4500 900 1450 1450 700
Grow by more than 40% 3% 3% 3% 3% 2%
Grow by 20-40% 12% 12% 12% 15% 12%
Grow by less than 20% 35% 33% 39% 48% 62%
All with objective to grow 50% 48% 54% 66% 76%
Stay the same size 40% 41% 40% 31% 22%
Become smaller 4% 5% 2% 1% 1%
Plan to sell/pass on/close 5% 6% 3% 2% 1%
Q91 (225) All SMEs
Amongst those who in 2018 said that their business had ‘developed significantly’ in the last 3 years, 62% expected to grow in the next year, compared to 38% of those who said the business was ‘recognisably the same’ and 35% who said the business had ‘retrenched’.
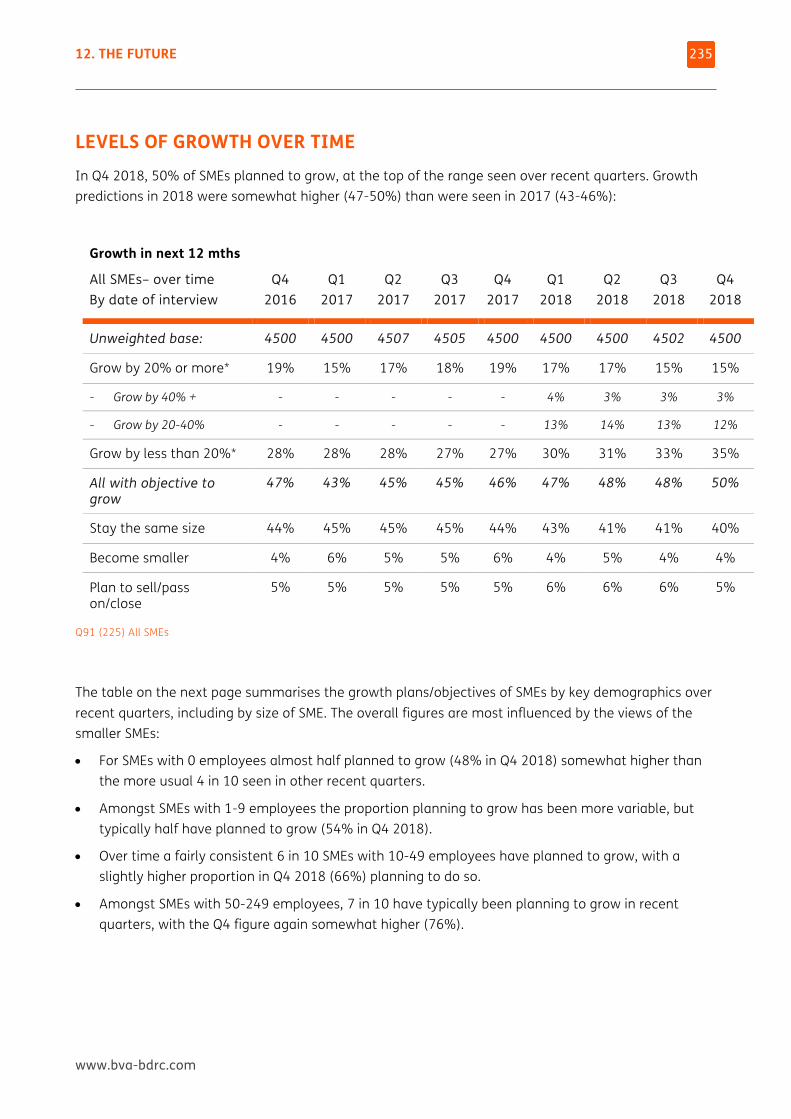
12. THE FUTURE
www.bva-bdrc.com
235
LEVELS OF GROWTH OVER TIME In Q4 2018, 50% of SMEs planned to grow, at the top of the range seen over recent quarters. Growth predictions in 2018 were somewhat higher (47-50%) than were seen in 2017 (43-46%):
Growth in next 12 mths
All SMEs– over time By date of interview
Q4 2016
Q1 2017
Q2 2017
Q3 2017
Q4 2017
Q1 2018
Q2 2018
Q3 2018
Q4 2018
Unweighted base: 4500 4500 4507 4505 4500 4500 4500 4502 4500
Grow by 20% or more* 19% 15% 17% 18% 19% 17% 17% 15% 15%
- Grow by 40% + - - - - - 4% 3% 3% 3%
- Grow by 20-40% - - - - - 13% 14% 13% 12%
Grow by less than 20%* 28% 28% 28% 27% 27% 30% 31% 33% 35%
All with objective to grow
47% 43% 45% 45% 46% 47% 48% 48% 50%
Stay the same size 44% 45% 45% 45% 44% 43% 41% 41% 40%
Become smaller 4% 6% 5% 5% 6% 4% 5% 4% 4%
Plan to sell/pass on/close
5% 5% 5% 5% 5% 6% 6% 6% 5%
Q91 (225) All SMEs
The table on the next page summarises the growth plans/objectives of SMEs by key demographics over recent quarters, including by size of SME. The overall figures are most influenced by the views of the smaller SMEs:
• For SMEs with 0 employees almost half planned to grow (48% in Q4 2018) somewhat higher than the more usual 4 in 10 seen in other recent quarters.
• Amongst SMEs with 1-9 employees the proportion planning to grow has been more variable, but typically half have planned to grow (54% in Q4 2018).
• Over time a fairly consistent 6 in 10 SMEs with 10-49 employees have planned to grow, with a slightly higher proportion in Q4 2018 (66%) planning to do so.
• Amongst SMEs with 50-249 employees, 7 in 10 have typically been planning to grow in recent quarters, with the Q4 figure again somewhat higher (76%).
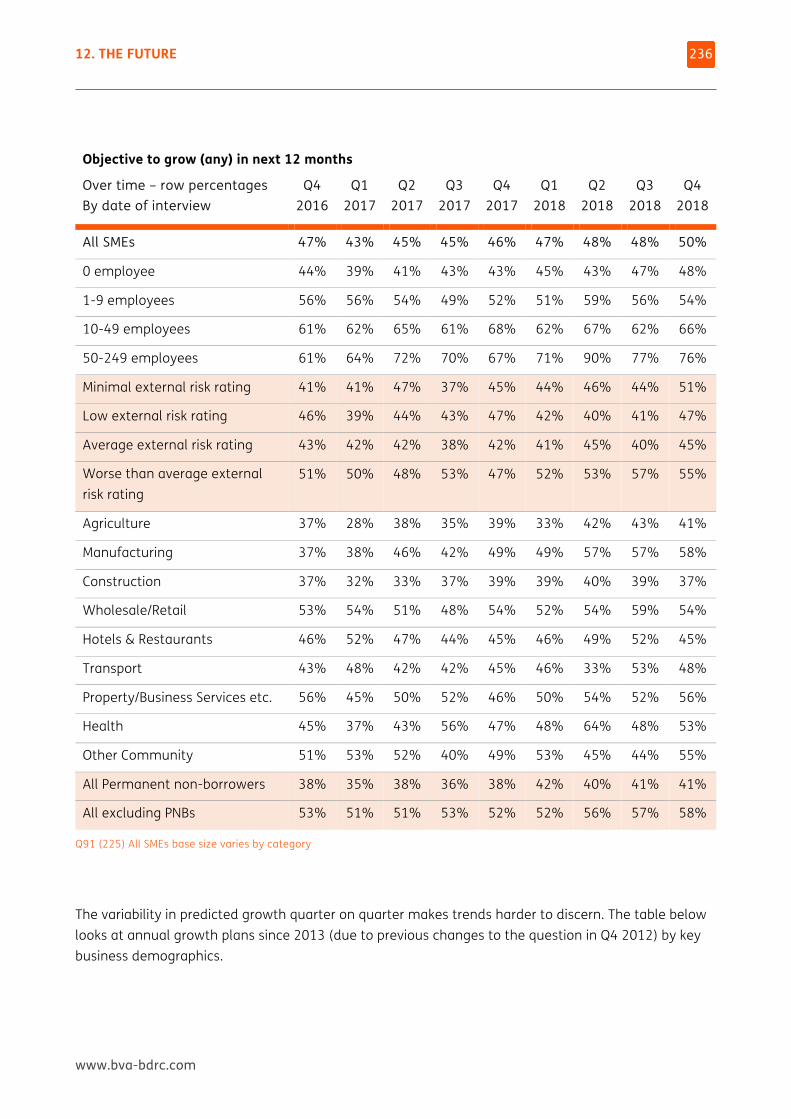
12. THE FUTURE
www.bva-bdrc.com
236
Objective to grow (any) in next 12 months
Over time – row percentages By date of interview
Q4 2016
Q1 2017
Q2 2017
Q3 2017
Q4 2017
Q1 2018
Q2 2018
Q3 2018
Q4 2018
All SMEs 47% 43% 45% 45% 46% 47% 48% 48% 50%
0 employee 44% 39% 41% 43% 43% 45% 43% 47% 48%
1-9 employees 56% 56% 54% 49% 52% 51% 59% 56% 54%
10-49 employees 61% 62% 65% 61% 68% 62% 67% 62% 66%
50-249 employees 61% 64% 72% 70% 67% 71% 90% 77% 76%
Minimal external risk rating 41% 41% 47% 37% 45% 44% 46% 44% 51%
Low external risk rating 46% 39% 44% 43% 47% 42% 40% 41% 47%
Average external risk rating 43% 42% 42% 38% 42% 41% 45% 40% 45%
Worse than average external risk rating
51% 50% 48% 53% 47% 52% 53% 57% 55%
Agriculture 37% 28% 38% 35% 39% 33% 42% 43% 41%
Manufacturing 37% 38% 46% 42% 49% 49% 57% 57% 58%
Construction 37% 32% 33% 37% 39% 39% 40% 39% 37%
Wholesale/Retail 53% 54% 51% 48% 54% 52% 54% 59% 54%
Hotels & Restaurants 46% 52% 47% 44% 45% 46% 49% 52% 45%
Transport 43% 48% 42% 42% 45% 46% 33% 53% 48%
Property/Business Services etc. 56% 45% 50% 52% 46% 50% 54% 52% 56%
Health 45% 37% 43% 56% 47% 48% 64% 48% 53%
Other Community 51% 53% 52% 40% 49% 53% 45% 44% 55%
All Permanent non-borrowers 38% 35% 38% 36% 38% 42% 40% 41% 41%
All excluding PNBs 53% 51% 51% 53% 52% 52% 56% 57% 58%
Q91 (225) All SMEs base size varies by category
The variability in predicted growth quarter on quarter makes trends harder to discern. The table below looks at annual growth plans since 2013 (due to previous changes to the question in Q4 2012) by key business demographics.
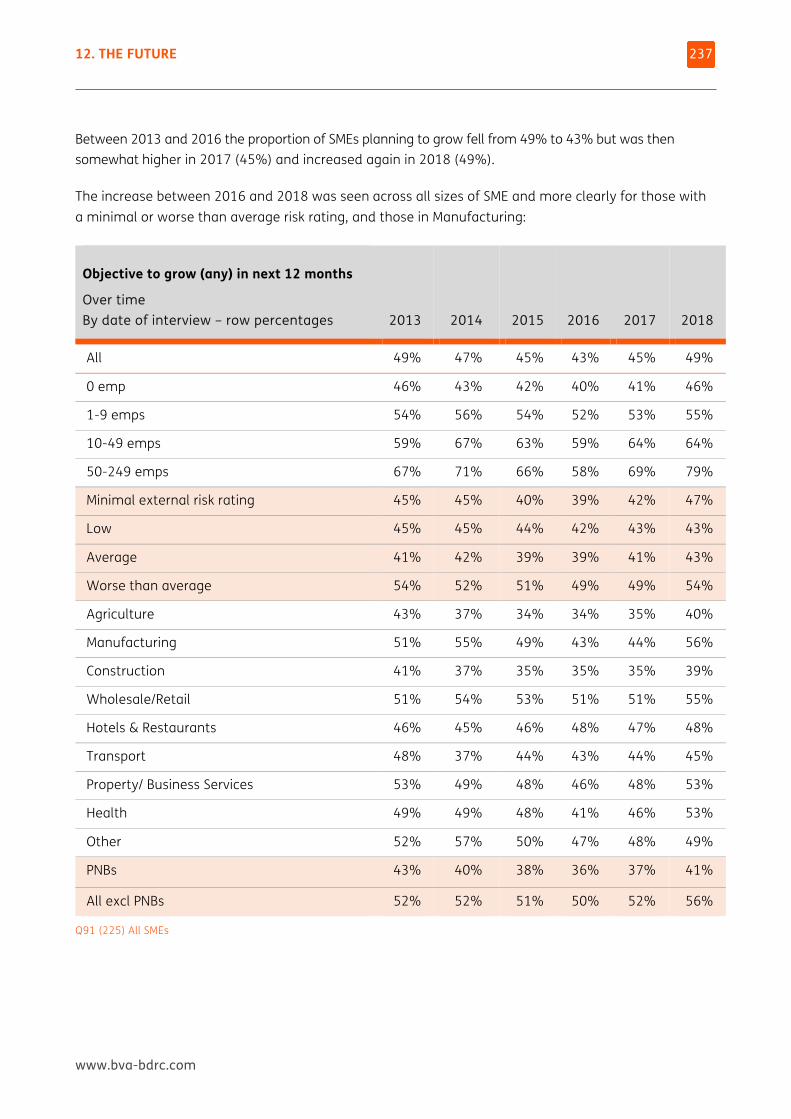
12. THE FUTURE
www.bva-bdrc.com
237
Between 2013 and 2016 the proportion of SMEs planning to grow fell from 49% to 43% but was then somewhat higher in 2017 (45%) and increased again in 2018 (49%).
The increase between 2016 and 2018 was seen across all sizes of SME and more clearly for those with a minimal or worse than average risk rating, and those in Manufacturing:
Objective to grow (any) in next 12 months
Over time By date of interview – row percentages 2013 2014 2015
2016 2017 2018
All 49% 47% 45% 43% 45% 49%
0 emp 46% 43% 42% 40% 41% 46%
1-9 emps 54% 56% 54% 52% 53% 55%
10-49 emps 59% 67% 63% 59% 64% 64%
50-249 emps 67% 71% 66% 58% 69% 79%
Minimal external risk rating 45% 45% 40% 39% 42% 47%
Low 45% 45% 44% 42% 43% 43%
Average 41% 42% 39% 39% 41% 43%
Worse than average 54% 52% 51% 49% 49% 54%
Agriculture 43% 37% 34% 34% 35% 40%
Manufacturing 51% 55% 49% 43% 44% 56%
Construction 41% 37% 35% 35% 35% 39%
Wholesale/Retail 51% 54% 53% 51% 51% 55%
Hotels & Restaurants 46% 45% 46% 48% 47% 48%
Transport 48% 37% 44% 43% 44% 45%
Property/ Business Services 53% 49% 48% 46% 48% 53%
Health 49% 49% 48% 41% 46% 53%
Other 52% 57% 50% 47% 48% 49%
PNBs 43% 40% 38% 36% 37% 41%
All excl PNBs 52% 52% 51% 50% 52% 56%
Q91 (225) All SMEs
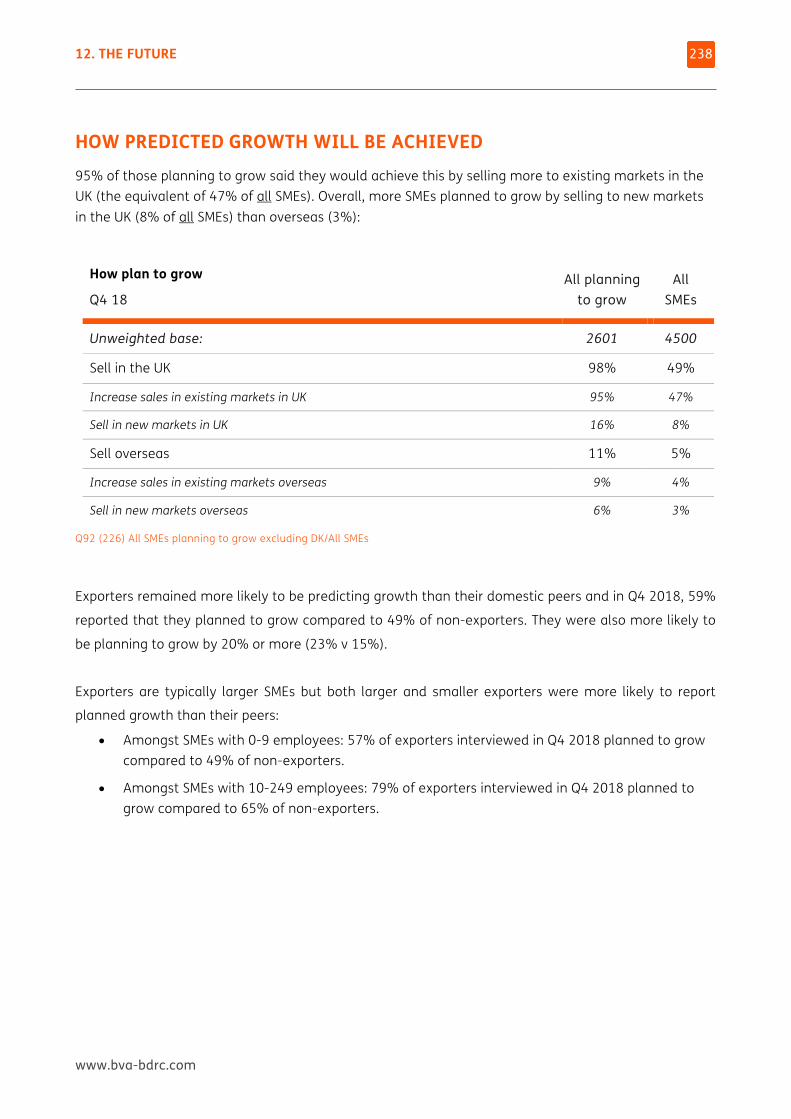
12. THE FUTURE
www.bva-bdrc.com
238
HOW PREDICTED GROWTH WILL BE ACHIEVED 95% of those planning to grow said they would achieve this by selling more to existing markets in the UK (the equivalent of 47% of all SMEs). Overall, more SMEs planned to grow by selling to new markets in the UK (8% of all SMEs) than overseas (3%):
How plan to grow
Q4 18 All planning
to grow All
SMEs
Unweighted base: 2601 4500
Sell in the UK 98% 49%
Increase sales in existing markets in UK 95% 47%
Sell in new markets in UK 16% 8%
Sell overseas 11% 5%
Increase sales in existing markets overseas 9% 4%
Sell in new markets overseas 6% 3%
Q92 (226) All SMEs planning to grow excluding DK/All SMEs
Exporters remained more likely to be predicting growth than their domestic peers and in Q4 2018, 59%
reported that they planned to grow compared to 49% of non-exporters. They were also more likely to
be planning to grow by 20% or more (23% v 15%).
Exporters are typically larger SMEs but both larger and smaller exporters were more likely to report
planned growth than their peers:
• Amongst SMEs with 0-9 employees: 57% of exporters interviewed in Q4 2018 planned to grow compared to 49% of non-exporters.
• Amongst SMEs with 10-249 employees: 79% of exporters interviewed in Q4 2018 planned to grow compared to 65% of non-exporters.
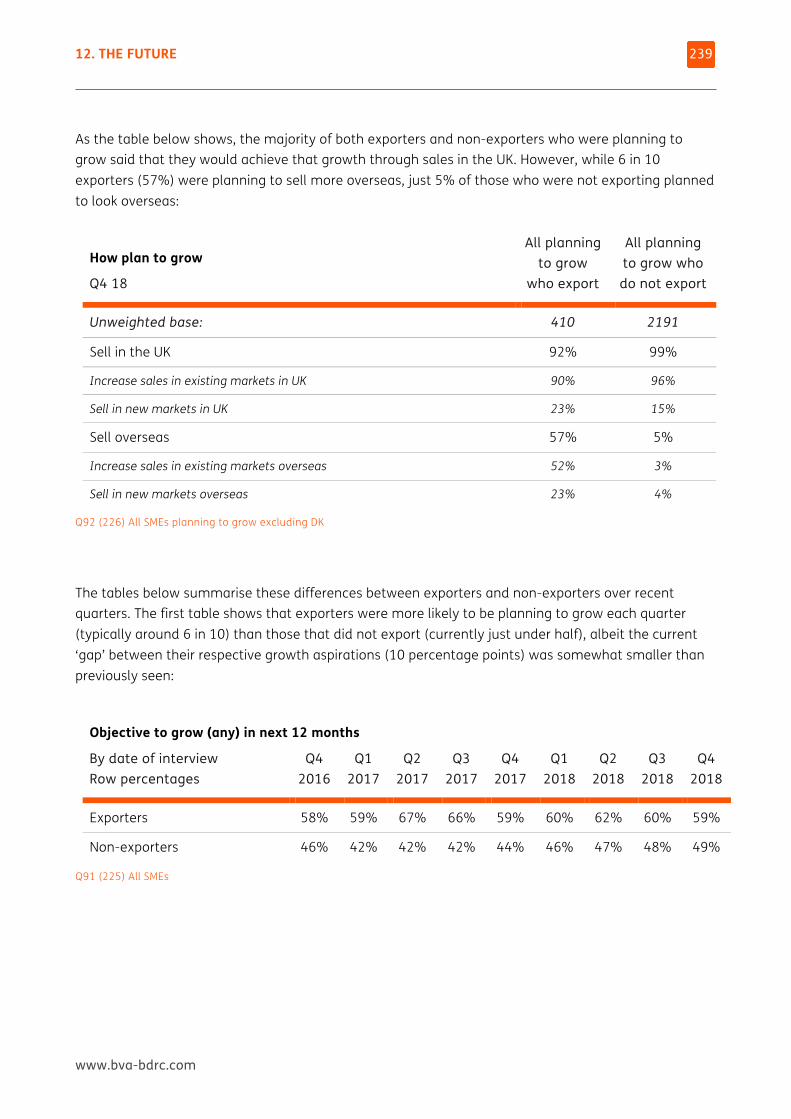
12. THE FUTURE
www.bva-bdrc.com
239
As the table below shows, the majority of both exporters and non-exporters who were planning to grow said that they would achieve that growth through sales in the UK. However, while 6 in 10 exporters (57%) were planning to sell more overseas, just 5% of those who were not exporting planned to look overseas:
How plan to grow
Q4 18
All planning to grow
who export
All planning to grow who do not export
Unweighted base: 410 2191
Sell in the UK 92% 99%
Increase sales in existing markets in UK 90% 96%
Sell in new markets in UK 23% 15%
Sell overseas 57% 5%
Increase sales in existing markets overseas 52% 3%
Sell in new markets overseas 23% 4%
Q92 (226) All SMEs planning to grow excluding DK
The tables below summarise these differences between exporters and non-exporters over recent quarters. The first table shows that exporters were more likely to be planning to grow each quarter (typically around 6 in 10) than those that did not export (currently just under half), albeit the current ‘gap’ between their respective growth aspirations (10 percentage points) was somewhat smaller than previously seen:
Objective to grow (any) in next 12 months
By date of interview Row percentages
Q4 2016
Q1 2017
Q2 2017
Q3 2017
Q4 2017
Q1 2018
Q2 2018
Q3 2018
Q4 2018
Exporters 58% 59% 67% 66% 59% 60% 62% 60% 59%
Non-exporters 46% 42% 42% 42% 44% 46% 47% 48% 49%
Q91 (225) All SMEs
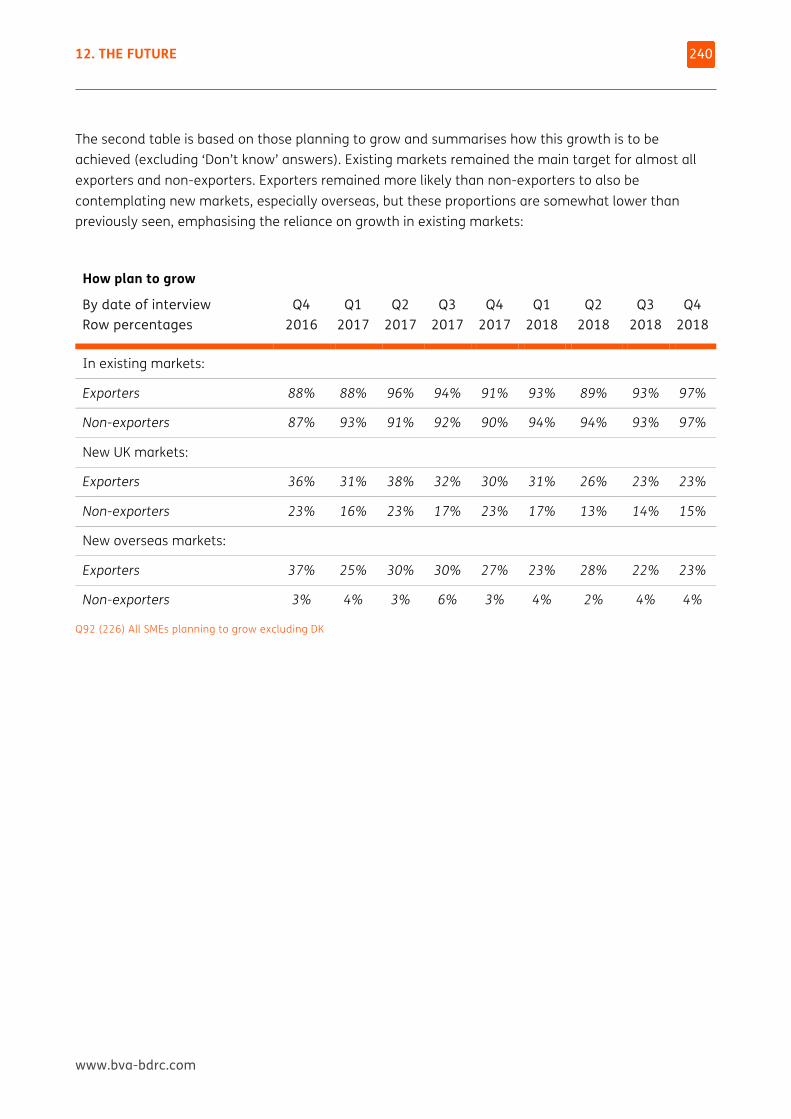
12. THE FUTURE
www.bva-bdrc.com
240
The second table is based on those planning to grow and summarises how this growth is to be achieved (excluding ‘Don’t know’ answers). Existing markets remained the main target for almost all exporters and non-exporters. Exporters remained more likely than non-exporters to also be contemplating new markets, especially overseas, but these proportions are somewhat lower than previously seen, emphasising the reliance on growth in existing markets:
How plan to grow
By date of interview Row percentages
Q4 2016
Q1 2017
Q2 2017
Q3 2017
Q4 2017
Q1 2018
Q2 2018
Q3 2018
Q4 2018
In existing markets:
Exporters 88% 88% 96% 94% 91% 93% 89% 93% 97%
Non-exporters 87% 93% 91% 92% 90% 94% 94% 93% 97%
New UK markets:
Exporters 36% 31% 38% 32% 30% 31% 26% 23% 23%
Non-exporters 23% 16% 23% 17% 23% 17% 13% 14% 15%
New overseas markets:
Exporters 37% 25% 30% 30% 27% 23% 28% 22% 23%
Non-exporters 3% 4% 3% 6% 3% 4% 2% 4% 4%
Q92 (226) All SMEs planning to grow excluding DK
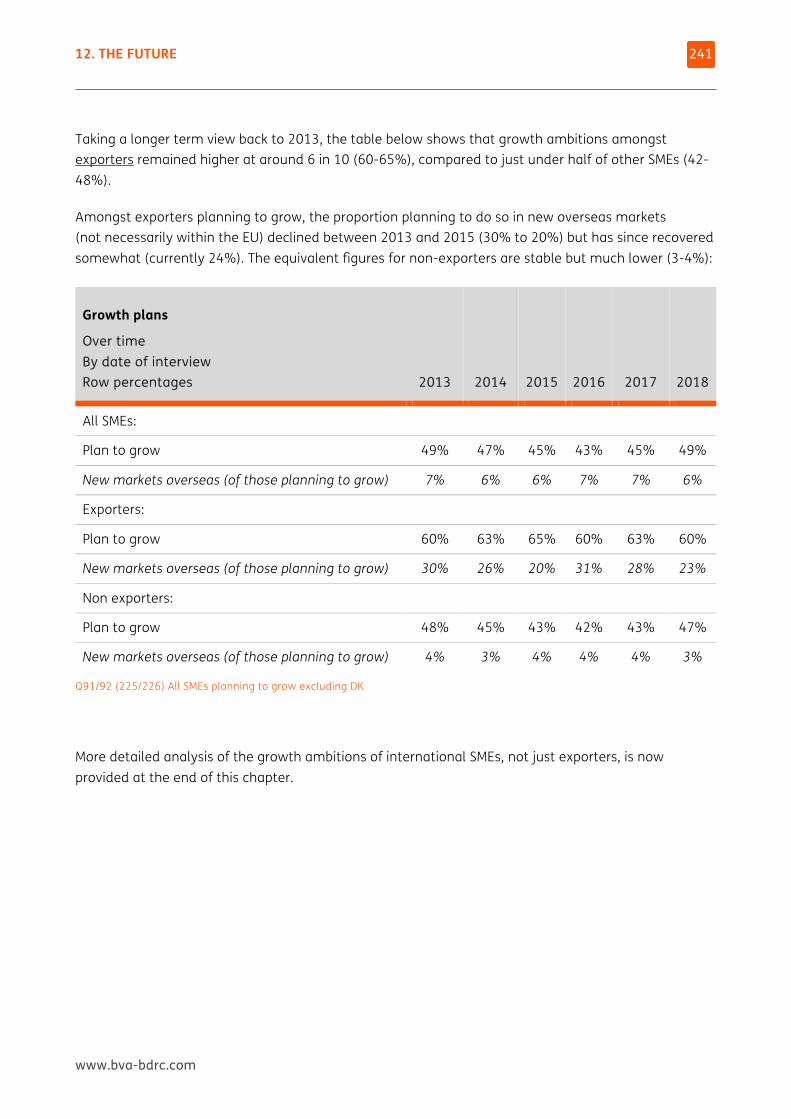
12. THE FUTURE
www.bva-bdrc.com
241
Taking a longer term view back to 2013, the table below shows that growth ambitions amongst exporters remained higher at around 6 in 10 (60-65%), compared to just under half of other SMEs (42-48%).
Amongst exporters planning to grow, the proportion planning to do so in new overseas markets (not necessarily within the EU) declined between 2013 and 2015 (30% to 20%) but has since recovered somewhat (currently 24%). The equivalent figures for non-exporters are stable but much lower (3-4%):
Growth plans
Over time By date of interview Row percentages 2013 2014 2015 2016 2017 2018
All SMEs:
Plan to grow 49% 47% 45% 43% 45% 49%
New markets overseas (of those planning to grow) 7% 6% 6% 7% 7% 6%
Exporters:
Plan to grow 60% 63% 65% 60% 63% 60%
New markets overseas (of those planning to grow) 30% 26% 20% 31% 28% 23%
Non exporters:
Plan to grow 48% 45% 43% 42% 43% 47%
New markets overseas (of those planning to grow) 4% 3% 4% 4% 4% 3%
Q91/92 (225/226) All SMEs planning to grow excluding DK
More detailed analysis of the growth ambitions of international SMEs, not just exporters, is now provided at the end of this chapter.
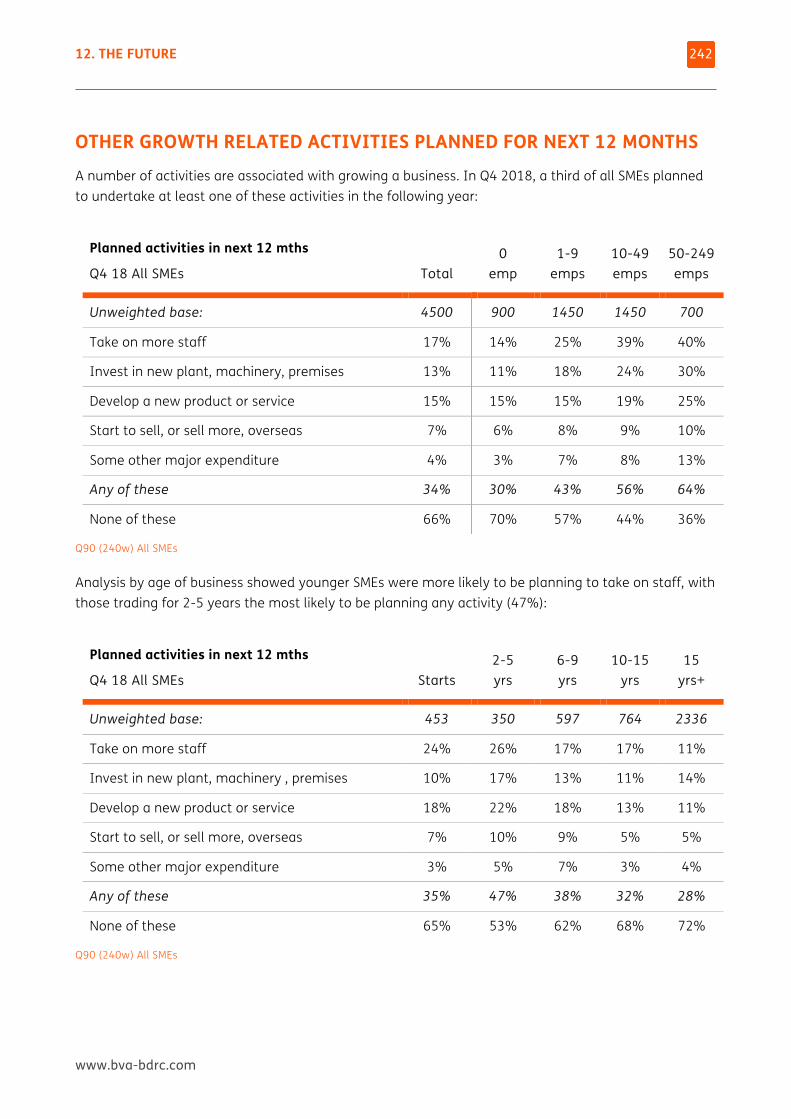
12. THE FUTURE
www.bva-bdrc.com
242
OTHER GROWTH RELATED ACTIVITIES PLANNED FOR NEXT 12 MONTHS A number of activities are associated with growing a business. In Q4 2018, a third of all SMEs planned to undertake at least one of these activities in the following year:
Planned activities in next 12 mths
Q4 18 All SMEs Total 0
emp 1-9
emps 10-49 emps
50-249 emps
Unweighted base: 4500 900 1450 1450 700
Take on more staff 17% 14% 25% 39% 40%
Invest in new plant, machinery, premises 13% 11% 18% 24% 30%
Develop a new product or service 15% 15% 15% 19% 25%
Start to sell, or sell more, overseas 7% 6% 8% 9% 10%
Some other major expenditure 4% 3% 7% 8% 13%
Any of these 34% 30% 43% 56% 64%
None of these 66% 70% 57% 44% 36%
Q90 (240w) All SMEs
Analysis by age of business showed younger SMEs were more likely to be planning to take on staff, with those trading for 2-5 years the most likely to be planning any activity (47%):
Planned activities in next 12 mths
Q4 18 All SMEs Starts 2-5 yrs
6-9 yrs
10-15 yrs
15 yrs+
Unweighted base: 453 350 597 764 2336
Take on more staff 24% 26% 17% 17% 11%
Invest in new plant, machinery , premises 10% 17% 13% 11% 14%
Develop a new product or service 18% 22% 18% 13% 11%
Start to sell, or sell more, overseas 7% 10% 9% 5% 5%
Some other major expenditure 3% 5% 7% 3% 4%
Any of these 35% 47% 38% 32% 28%
None of these 65% 53% 62% 68% 72%
Q90 (240w) All SMEs
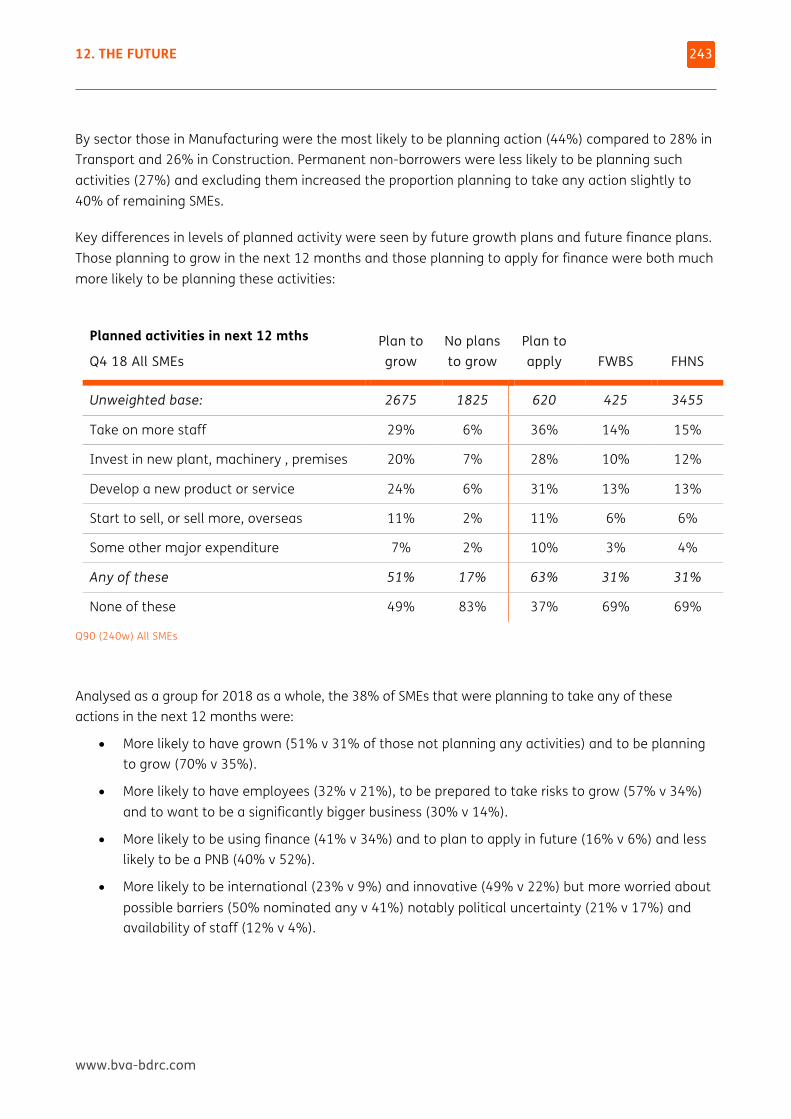
12. THE FUTURE
www.bva-bdrc.com
243
By sector those in Manufacturing were the most likely to be planning action (44%) compared to 28% in Transport and 26% in Construction. Permanent non-borrowers were less likely to be planning such activities (27%) and excluding them increased the proportion planning to take any action slightly to 40% of remaining SMEs.
Key differences in levels of planned activity were seen by future growth plans and future finance plans. Those planning to grow in the next 12 months and those planning to apply for finance were both much more likely to be planning these activities:
Planned activities in next 12 mths
Q4 18 All SMEs Plan to grow
No plans to grow
Plan to apply FWBS FHNS
Unweighted base: 2675 1825 620 425 3455
Take on more staff 29% 6% 36% 14% 15%
Invest in new plant, machinery , premises 20% 7% 28% 10% 12%
Develop a new product or service 24% 6% 31% 13% 13%
Start to sell, or sell more, overseas 11% 2% 11% 6% 6%
Some other major expenditure 7% 2% 10% 3% 4%
Any of these 51% 17% 63% 31% 31%
None of these 49% 83% 37% 69% 69%
Q90 (240w) All SMEs
Analysed as a group for 2018 as a whole, the 38% of SMEs that were planning to take any of these actions in the next 12 months were:
• More likely to have grown (51% v 31% of those not planning any activities) and to be planning to grow (70% v 35%).
• More likely to have employees (32% v 21%), to be prepared to take risks to grow (57% v 34%) and to want to be a significantly bigger business (30% v 14%).
• More likely to be using finance (41% v 34%) and to plan to apply in future (16% v 6%) and less likely to be a PNB (40% v 52%).
• More likely to be international (23% v 9%) and innovative (49% v 22%) but more worried about possible barriers (50% nominated any v 41%) notably political uncertainty (21% v 17%) and availability of staff (12% v 4%).
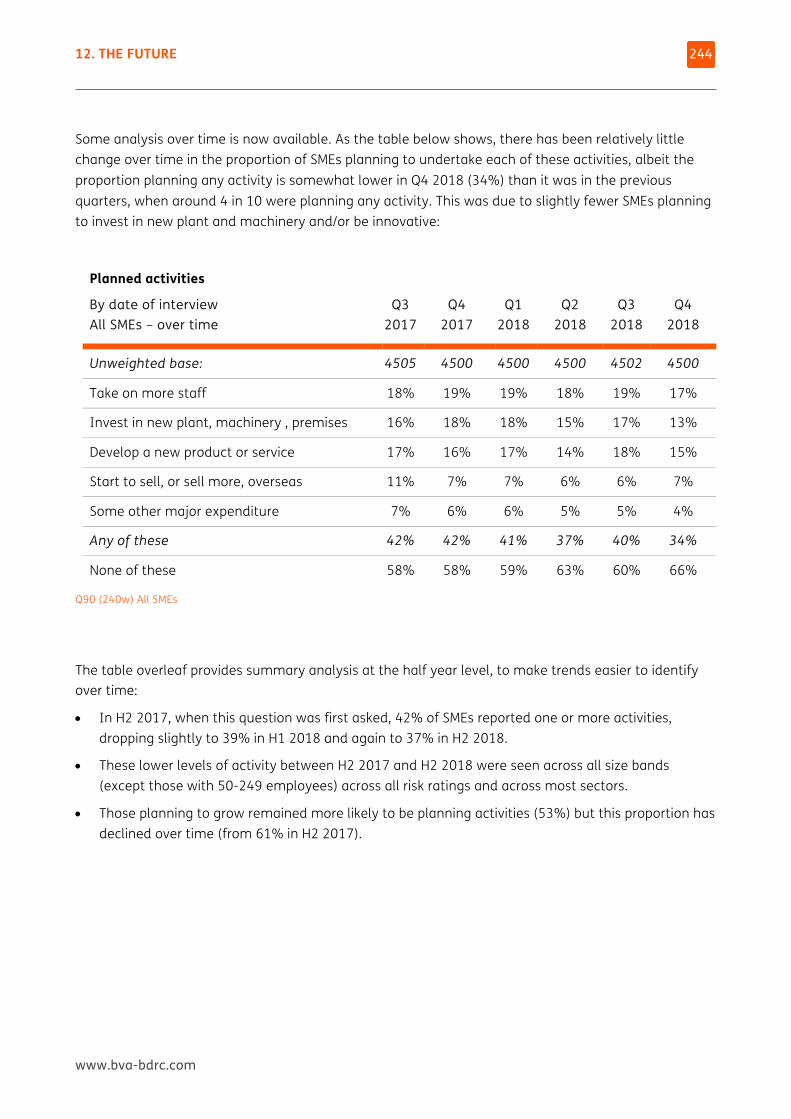
12. THE FUTURE
www.bva-bdrc.com
244
Some analysis over time is now available. As the table below shows, there has been relatively little change over time in the proportion of SMEs planning to undertake each of these activities, albeit the proportion planning any activity is somewhat lower in Q4 2018 (34%) than it was in the previous quarters, when around 4 in 10 were planning any activity. This was due to slightly fewer SMEs planning to invest in new plant and machinery and/or be innovative:
Planned activities
By date of interview All SMEs – over time
Q3 2017
Q4 2017
Q1 2018
Q2 2018
Q3 2018
Q4 2018
Unweighted base: 4505 4500 4500 4500 4502 4500
Take on more staff 18% 19% 19% 18% 19% 17%
Invest in new plant, machinery , premises 16% 18% 18% 15% 17% 13%
Develop a new product or service 17% 16% 17% 14% 18% 15%
Start to sell, or sell more, overseas 11% 7% 7% 6% 6% 7%
Some other major expenditure 7% 6% 6% 5% 5% 4%
Any of these 42% 42% 41% 37% 40% 34%
None of these 58% 58% 59% 63% 60% 66%
Q90 (240w) All SMEs
The table overleaf provides summary analysis at the half year level, to make trends easier to identify over time:
• In H2 2017, when this question was first asked, 42% of SMEs reported one or more activities, dropping slightly to 39% in H1 2018 and again to 37% in H2 2018.
• These lower levels of activity between H2 2017 and H2 2018 were seen across all size bands (except those with 50-249 employees) across all risk ratings and across most sectors.
• Those planning to grow remained more likely to be planning activities (53%) but this proportion has declined over time (from 61% in H2 2017).
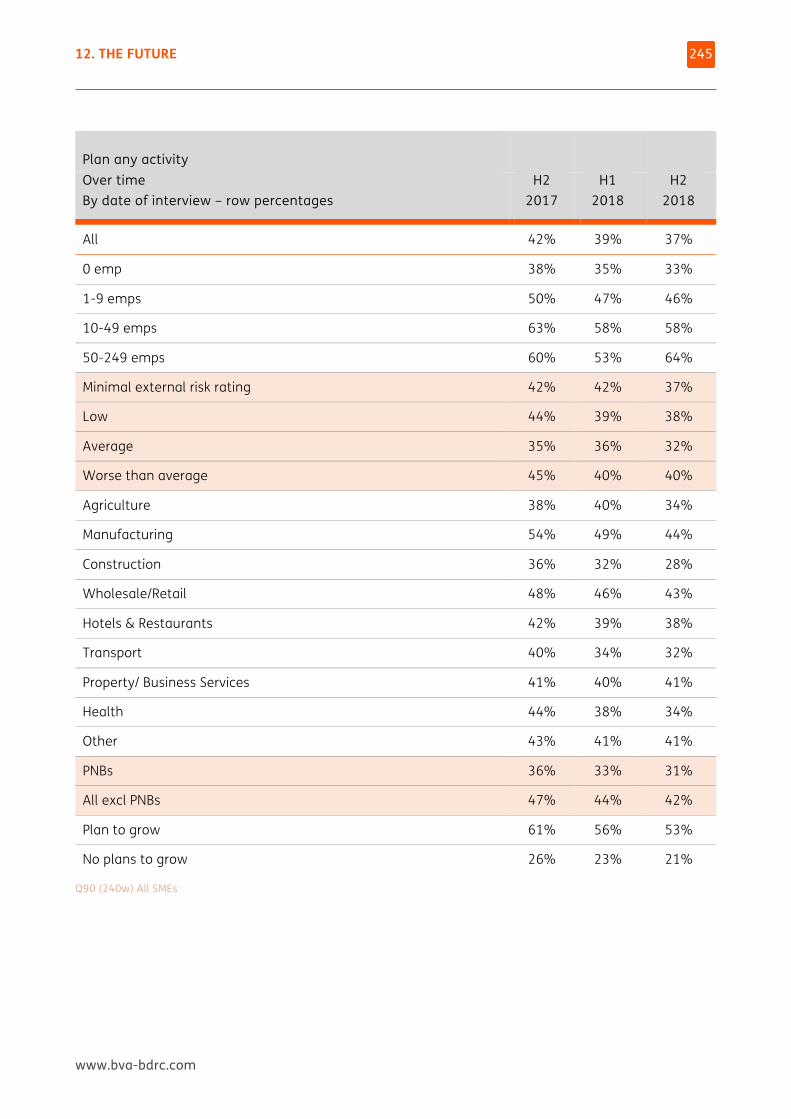
12. THE FUTURE
www.bva-bdrc.com
245
Plan any activity
Over time By date of interview – row percentages
H2 2017
H1 2018
H2 2018
All 42% 39% 37%
0 emp 38% 35% 33%
1-9 emps 50% 47% 46%
10-49 emps 63% 58% 58%
50-249 emps 60% 53% 64%
Minimal external risk rating 42% 42% 37%
Low 44% 39% 38%
Average 35% 36% 32%
Worse than average 45% 40% 40%
Agriculture 38% 40% 34%
Manufacturing 54% 49% 44%
Construction 36% 32% 28%
Wholesale/Retail 48% 46% 43%
Hotels & Restaurants 42% 39% 38%
Transport 40% 34% 32%
Property/ Business Services 41% 40% 41%
Health 44% 38% 34%
Other 43% 41% 41%
PNBs 36% 33% 31%
All excl PNBs 47% 44% 42%
Plan to grow 61% 56% 53%
No plans to grow 26% 23% 21%
Q90 (240w) All SMEs
12. THE FUTURE
www.bva-bdrc.com
246
OBSTACLES TO RUNNING THE BUSINESS IN THE NEXT 12 MONTHS SMEs were asked to rate the extent to which each of a number of factors were perceived as obstacles to them running the business as they would wish in the next 12 months, using a 1 to 10 scale (where 1 meant the factor was not an obstacle at all, and 10 that it was seen as a major obstacle). Scores have been analysed in 3 bands:
• 1-4 = a minor obstacle
• 5-7 = a moderate obstacle
• 8-10 = a major obstacle.
Over time, some amendements have been made to the list of possible obstacles tested, including two changes for Q1 2017:
• ‘Changes in the value of sterling’ replaced ‘The quality of management and leadership in the business’ which had been added in Q3 2015.
• The existing code ‘Legislation and regulation’ was extended to include ‘red tape’.
The data for Q4 2018 was collected as the Brexit debate continued and a ‘meaningful vote’ in Parliament was planned and then cancelled. At an overall level the proportion of SMEs rating either the current economic climate or ‘Political uncertainty and future government policy’ as major obstacles, continued to increase quarter by quarter. Amongst international SMEs both of these factors were mentioned more as major obstacles, although views remained somewhat volatile as is reported later in this section.
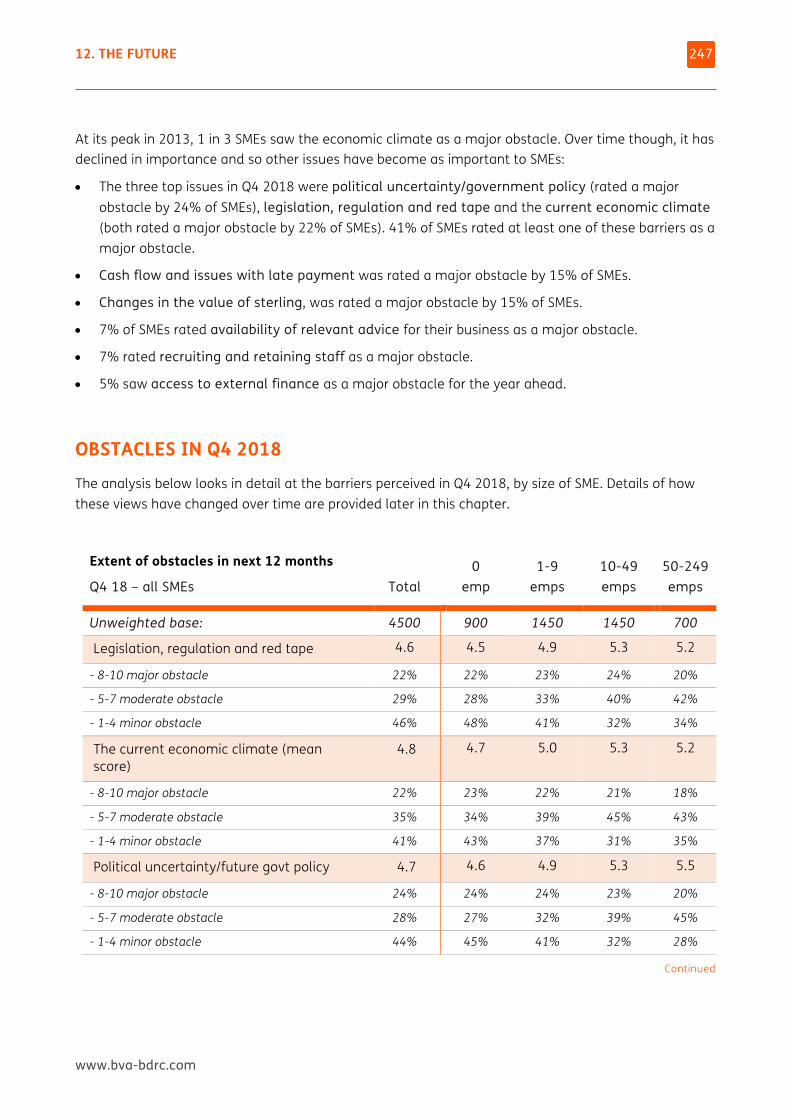
12. THE FUTURE
www.bva-bdrc.com
247
At its peak in 2013, 1 in 3 SMEs saw the economic climate as a major obstacle. Over time though, it has declined in importance and so other issues have become as important to SMEs:
• The three top issues in Q4 2018 were political uncertainty/government policy (rated a major obstacle by 24% of SMEs), legislation, regulation and red tape and the current economic climate (both rated a major obstacle by 22% of SMEs). 41% of SMEs rated at least one of these barriers as a major obstacle.
• Cash flow and issues with late payment was rated a major obstacle by 15% of SMEs.
• Changes in the value of sterling, was rated a major obstacle by 15% of SMEs.
• 7% of SMEs rated availability of relevant advice for their business as a major obstacle.
• 7% rated recruiting and retaining staff as a major obstacle.
• 5% saw access to external finance as a major obstacle for the year ahead.
OBSTACLES IN Q4 2018 The analysis below looks in detail at the barriers perceived in Q4 2018, by size of SME. Details of how these views have changed over time are provided later in this chapter.
Extent of obstacles in next 12 months
Q4 18 – all SMEs Total 0
emp 1-9
emps 10-49 emps
50-249 emps
Unweighted base: 4500 900 1450 1450 700
Legislation, regulation and red tape 4.6 4.5 4.9 5.3 5.2
- 8-10 major obstacle 22% 22% 23% 24% 20%
- 5-7 moderate obstacle 29% 28% 33% 40% 42%
- 1-4 minor obstacle 46% 48% 41% 32% 34%
The current economic climate (mean score)
4.8 4.7 5.0 5.3 5.2
- 8-10 major obstacle 22% 23% 22% 21% 18%
- 5-7 moderate obstacle 35% 34% 39% 45% 43%
- 1-4 minor obstacle 41% 43% 37% 31% 35%
Political uncertainty/future govt policy 4.7 4.6 4.9 5.3 5.5
- 8-10 major obstacle 24% 24% 24% 23% 20%
- 5-7 moderate obstacle 28% 27% 32% 39% 45%
- 1-4 minor obstacle 44% 45% 41% 32% 28%
Continued
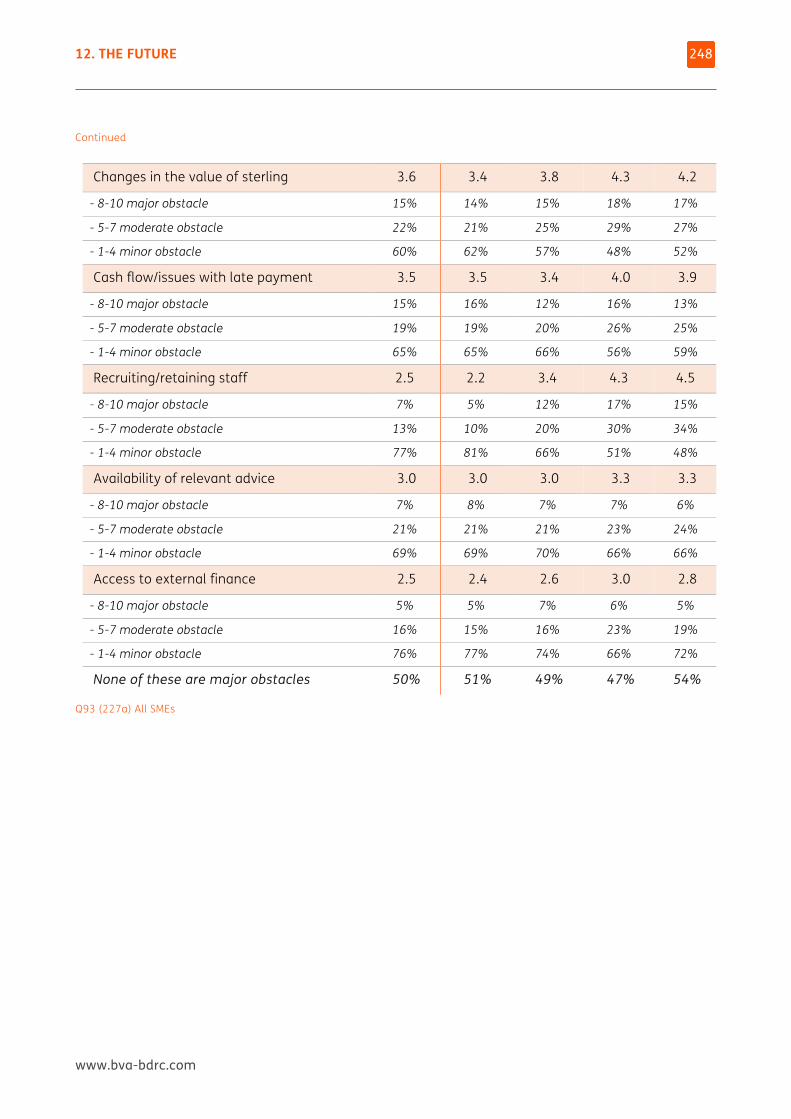
12. THE FUTURE
www.bva-bdrc.com
248
Continued
Changes in the value of sterling 3.6 3.4 3.8 4.3 4.2
- 8-10 major obstacle 15% 14% 15% 18% 17%
- 5-7 moderate obstacle 22% 21% 25% 29% 27%
- 1-4 minor obstacle 60% 62% 57% 48% 52%
Cash flow/issues with late payment 3.5 3.5 3.4 4.0 3.9
- 8-10 major obstacle 15% 16% 12% 16% 13%
- 5-7 moderate obstacle 19% 19% 20% 26% 25%
- 1-4 minor obstacle 65% 65% 66% 56% 59%
Recruiting/retaining staff 2.5 2.2 3.4 4.3 4.5
- 8-10 major obstacle 7% 5% 12% 17% 15%
- 5-7 moderate obstacle 13% 10% 20% 30% 34%
- 1-4 minor obstacle 77% 81% 66% 51% 48%
Availability of relevant advice 3.0 3.0 3.0 3.3 3.3
- 8-10 major obstacle 7% 8% 7% 7% 6%
- 5-7 moderate obstacle 21% 21% 21% 23% 24%
- 1-4 minor obstacle 69% 69% 70% 66% 66%
Access to external finance 2.5 2.4 2.6 3.0 2.8
- 8-10 major obstacle 5% 5% 7% 6% 5%
- 5-7 moderate obstacle 16% 15% 16% 23% 19%
- 1-4 minor obstacle 76% 77% 74% 66% 72%
None of these are major obstacles 50% 51% 49% 47% 54%
Q93 (227a) All SMEs
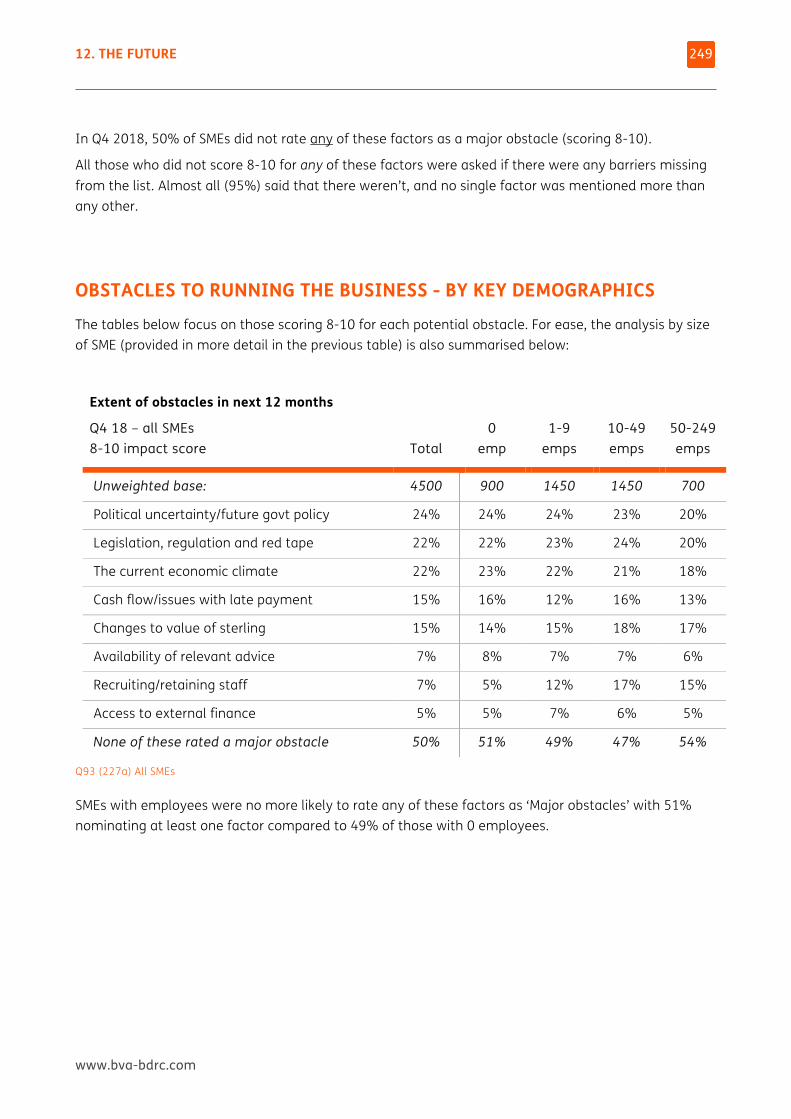
12. THE FUTURE
www.bva-bdrc.com
249
In Q4 2018, 50% of SMEs did not rate any of these factors as a major obstacle (scoring 8-10).
All those who did not score 8-10 for any of these factors were asked if there were any barriers missing from the list. Almost all (95%) said that there weren’t, and no single factor was mentioned more than any other.
OBSTACLES TO RUNNING THE BUSINESS - BY KEY DEMOGRAPHICS The tables below focus on those scoring 8-10 for each potential obstacle. For ease, the analysis by size of SME (provided in more detail in the previous table) is also summarised below:
Extent of obstacles in next 12 months
Q4 18 – all SMEs 8-10 impact score Total
0 emp
1-9 emps
10-49 emps
50-249 emps
Unweighted base: 4500 900 1450 1450 700
Political uncertainty/future govt policy 24% 24% 24% 23% 20%
Legislation, regulation and red tape 22% 22% 23% 24% 20%
The current economic climate 22% 23% 22% 21% 18%
Cash flow/issues with late payment 15% 16% 12% 16% 13%
Changes to value of sterling 15% 14% 15% 18% 17%
Availability of relevant advice 7% 8% 7% 7% 6%
Recruiting/retaining staff 7% 5% 12% 17% 15%
Access to external finance 5% 5% 7% 6% 5%
None of these rated a major obstacle 50% 51% 49% 47% 54%
Q93 (227a) All SMEs
SMEs with employees were no more likely to rate any of these factors as ‘Major obstacles’ with 51% nominating at least one factor compared to 49% of those with 0 employees.
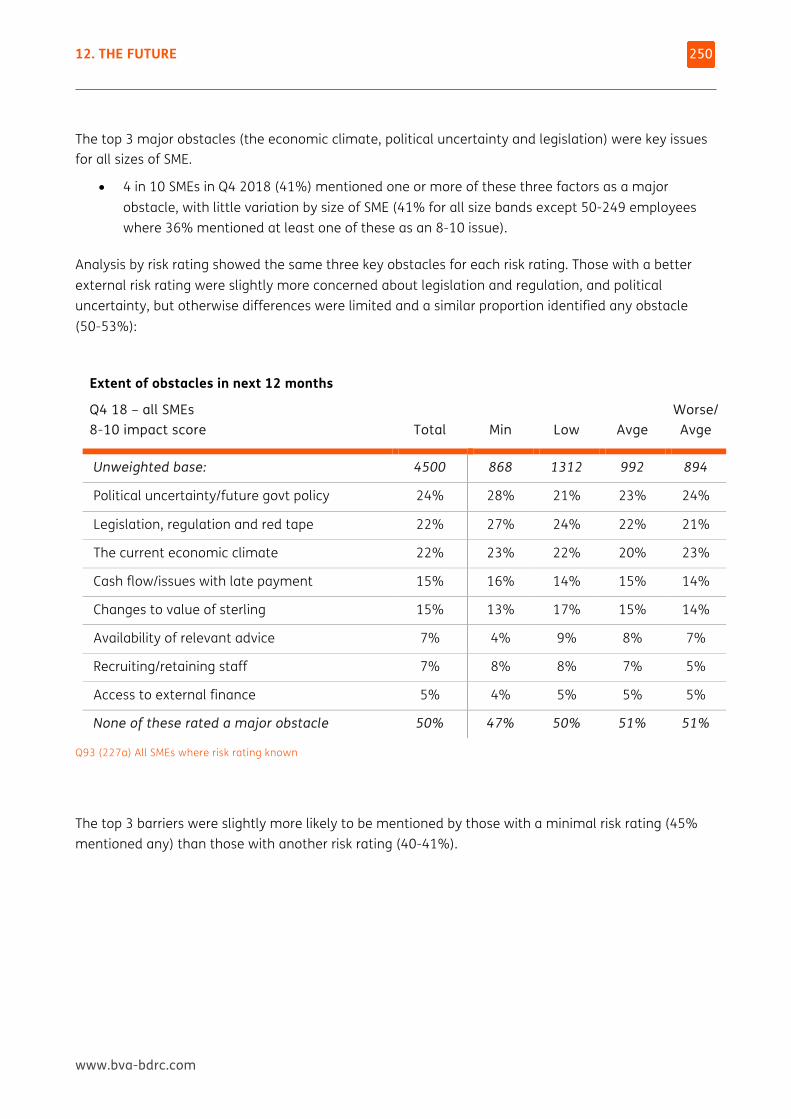
12. THE FUTURE
www.bva-bdrc.com
250
The top 3 major obstacles (the economic climate, political uncertainty and legislation) were key issues for all sizes of SME.
• 4 in 10 SMEs in Q4 2018 (41%) mentioned one or more of these three factors as a major obstacle, with little variation by size of SME (41% for all size bands except 50-249 employees where 36% mentioned at least one of these as an 8-10 issue).
Analysis by risk rating showed the same three key obstacles for each risk rating. Those with a better external risk rating were slightly more concerned about legislation and regulation, and political uncertainty, but otherwise differences were limited and a similar proportion identified any obstacle (50-53%):
Extent of obstacles in next 12 months
Q4 18 – all SMEs 8-10 impact score Total Min Low Avge
Worse/ Avge
Unweighted base: 4500 868 1312 992 894
Political uncertainty/future govt policy 24% 28% 21% 23% 24%
Legislation, regulation and red tape 22% 27% 24% 22% 21%
The current economic climate 22% 23% 22% 20% 23%
Cash flow/issues with late payment 15% 16% 14% 15% 14%
Changes to value of sterling 15% 13% 17% 15% 14%
Availability of relevant advice 7% 4% 9% 8% 7%
Recruiting/retaining staff 7% 8% 8% 7% 5%
Access to external finance 5% 4% 5% 5% 5%
None of these rated a major obstacle 50% 47% 50% 51% 51%
Q93 (227a) All SMEs where risk rating known
The top 3 barriers were slightly more likely to be mentioned by those with a minimal risk rating (45% mentioned any) than those with another risk rating (40-41%).
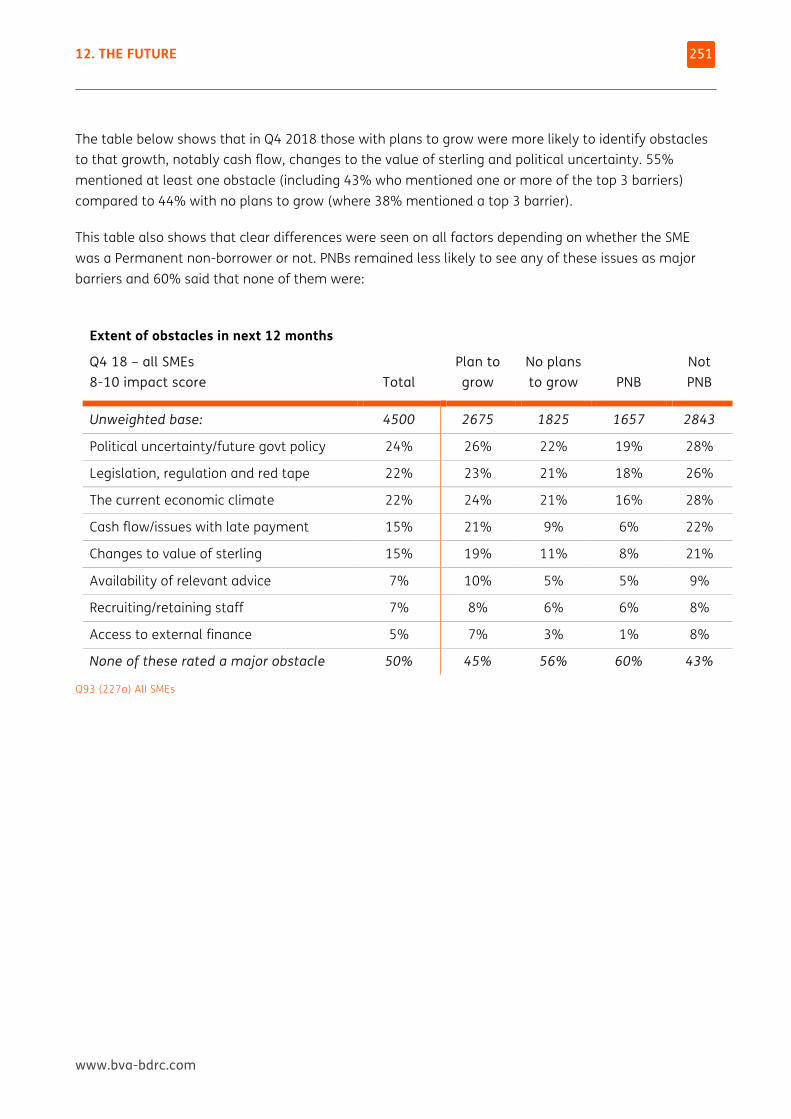
12. THE FUTURE
www.bva-bdrc.com
251
The table below shows that in Q4 2018 those with plans to grow were more likely to identify obstacles to that growth, notably cash flow, changes to the value of sterling and political uncertainty. 55% mentioned at least one obstacle (including 43% who mentioned one or more of the top 3 barriers) compared to 44% with no plans to grow (where 38% mentioned a top 3 barrier).
This table also shows that clear differences were seen on all factors depending on whether the SME was a Permanent non-borrower or not. PNBs remained less likely to see any of these issues as major barriers and 60% said that none of them were:
Extent of obstacles in next 12 months
Q4 18 – all SMEs 8-10 impact score Total
Plan to grow
No plans to grow PNB
Not PNB
Unweighted base: 4500 2675 1825 1657 2843
Political uncertainty/future govt policy 24% 26% 22% 19% 28%
Legislation, regulation and red tape 22% 23% 21% 18% 26%
The current economic climate 22% 24% 21% 16% 28%
Cash flow/issues with late payment 15% 21% 9% 6% 22%
Changes to value of sterling 15% 19% 11% 8% 21%
Availability of relevant advice 7% 10% 5% 5% 9%
Recruiting/retaining staff 7% 8% 6% 6% 8%
Access to external finance 5% 7% 3% 1% 8%
None of these rated a major obstacle 50% 45% 56% 60% 43%
Q93 (227a) All SMEs
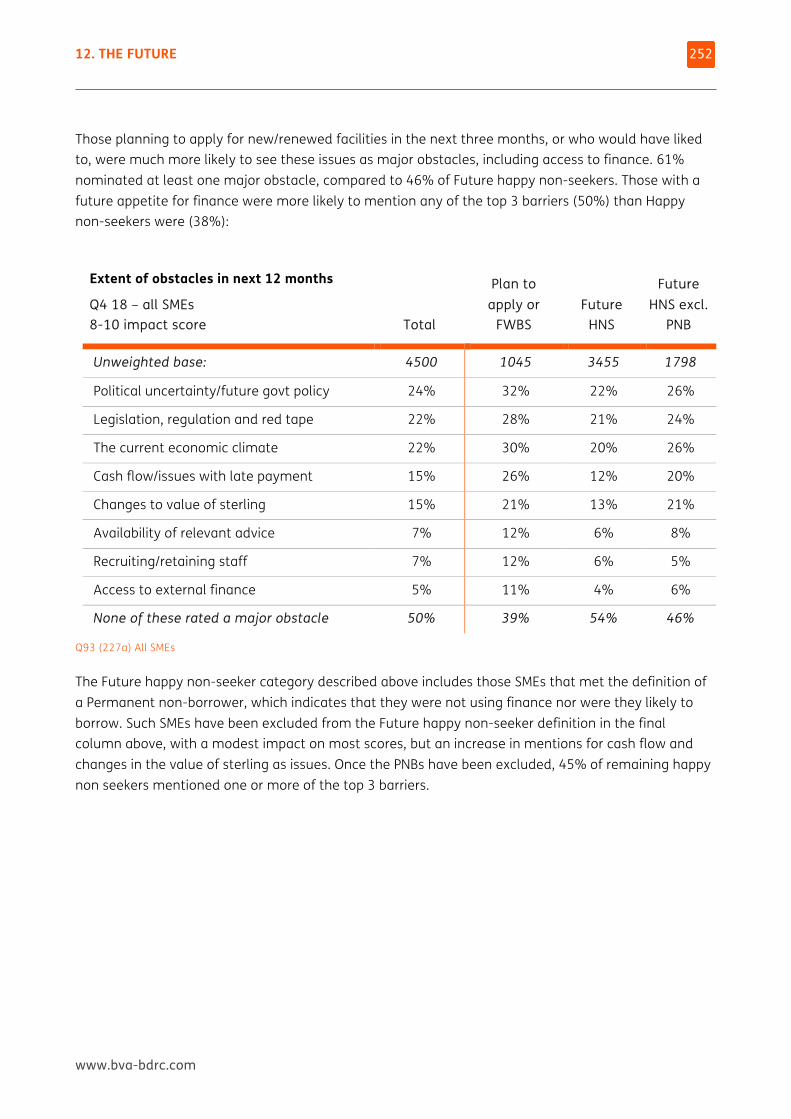
12. THE FUTURE
www.bva-bdrc.com
252
Those planning to apply for new/renewed facilities in the next three months, or who would have liked to, were much more likely to see these issues as major obstacles, including access to finance. 61% nominated at least one major obstacle, compared to 46% of Future happy non-seekers. Those with a future appetite for finance were more likely to mention any of the top 3 barriers (50%) than Happy non-seekers were (38%):
Extent of obstacles in next 12 months
Q4 18 – all SMEs 8-10 impact score Total
Plan to apply or
FWBS Future
HNS
Future HNS excl.
PNB
Unweighted base: 4500 1045 3455 1798
Political uncertainty/future govt policy 24% 32% 22% 26%
Legislation, regulation and red tape 22% 28% 21% 24%
The current economic climate 22% 30% 20% 26%
Cash flow/issues with late payment 15% 26% 12% 20%
Changes to value of sterling 15% 21% 13% 21%
Availability of relevant advice 7% 12% 6% 8%
Recruiting/retaining staff 7% 12% 6% 5%
Access to external finance 5% 11% 4% 6%
None of these rated a major obstacle 50% 39% 54% 46%
Q93 (227a) All SMEs
The Future happy non-seeker category described above includes those SMEs that met the definition of a Permanent non-borrower, which indicates that they were not using finance nor were they likely to borrow. Such SMEs have been excluded from the Future happy non-seeker definition in the final column above, with a modest impact on most scores, but an increase in mentions for cash flow and changes in the value of sterling as issues. Once the PNBs have been excluded, 45% of remaining happy non seekers mentioned one or more of the top 3 barriers.
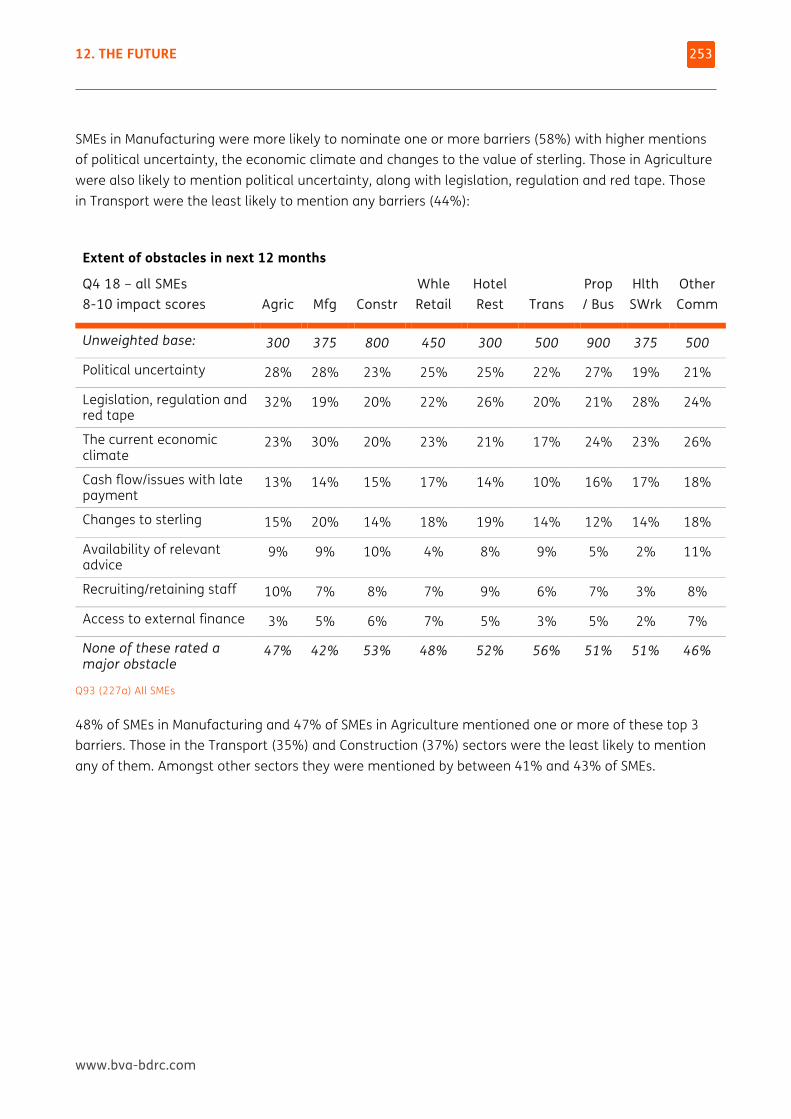
12. THE FUTURE
www.bva-bdrc.com
253
SMEs in Manufacturing were more likely to nominate one or more barriers (58%) with higher mentions of political uncertainty, the economic climate and changes to the value of sterling. Those in Agriculture were also likely to mention political uncertainty, along with legislation, regulation and red tape. Those in Transport were the least likely to mention any barriers (44%):
Extent of obstacles in next 12 months
Q4 18 – all SMEs 8-10 impact scores Agric Mfg Constr
Whle Retail
Hotel Rest Trans
Prop/ Bus
Hlth SWrk
Other Comm
Unweighted base: 300 375 800 450 300 500 900 375 500
Political uncertainty 28% 28% 23% 25% 25% 22% 27% 19% 21%
Legislation, regulation and red tape
32% 19% 20% 22% 26% 20% 21% 28% 24%
The current economic climate
23% 30% 20% 23% 21% 17% 24% 23% 26%
Cash flow/issues with late payment
13% 14% 15% 17% 14% 10% 16% 17% 18%
Changes to sterling 15% 20% 14% 18% 19% 14% 12% 14% 18%
Availability of relevant advice
9% 9% 10% 4% 8% 9% 5% 2% 11%
Recruiting/retaining staff 10% 7% 8% 7% 9% 6% 7% 3% 8%
Access to external finance 3% 5% 6% 7% 5% 3% 5% 2% 7%
None of these rated a major obstacle
47% 42% 53% 48% 52% 56% 51% 51% 46%
Q93 (227a) All SMEs
48% of SMEs in Manufacturing and 47% of SMEs in Agriculture mentioned one or more of these top 3 barriers. Those in the Transport (35%) and Construction (37%) sectors were the least likely to mention any of them. Amongst other sectors they were mentioned by between 41% and 43% of SMEs.
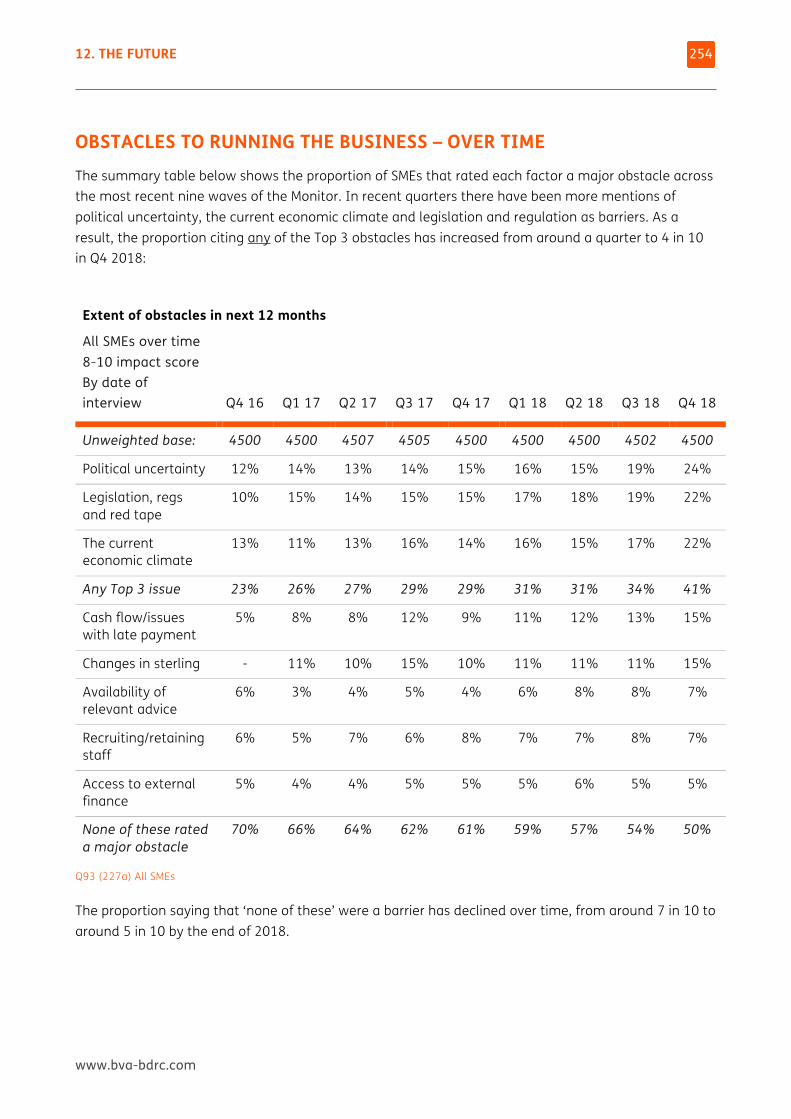
12. THE FUTURE
www.bva-bdrc.com
254
OBSTACLES TO RUNNING THE BUSINESS – OVER TIME The summary table below shows the proportion of SMEs that rated each factor a major obstacle across the most recent nine waves of the Monitor. In recent quarters there have been more mentions of political uncertainty, the current economic climate and legislation and regulation as barriers. As a result, the proportion citing any of the Top 3 obstacles has increased from around a quarter to 4 in 10 in Q4 2018:
Extent of obstacles in next 12 months
All SMEs over time 8-10 impact score By date of interview Q4 16 Q1 17 Q2 17 Q3 17 Q4 17 Q1 18 Q2 18 Q3 18 Q4 18
Unweighted base: 4500 4500 4507 4505 4500 4500 4500 4502 4500
Political uncertainty 12% 14% 13% 14% 15% 16% 15% 19% 24%
Legislation, regs and red tape
10% 15% 14% 15% 15% 17% 18% 19% 22%
The current economic climate
13% 11% 13% 16% 14% 16% 15% 17% 22%
Any Top 3 issue 23% 26% 27% 29% 29% 31% 31% 34% 41%
Cash flow/issues with late payment
5% 8% 8% 12% 9% 11% 12% 13% 15%
Changes in sterling - 11% 10% 15% 10% 11% 11% 11% 15%
Availability of relevant advice
6% 3% 4% 5% 4% 6% 8% 8% 7%
Recruiting/retaining staff
6% 5% 7% 6% 8% 7% 7% 8% 7%
Access to external finance
5% 4% 4% 5% 5% 5% 6% 5% 5%
None of these rated a major obstacle
70% 66% 64% 62% 61% 59% 57% 54% 50%
Q93 (227a) All SMEs
The proportion saying that ‘none of these’ were a barrier has declined over time, from around 7 in 10 to around 5 in 10 by the end of 2018.
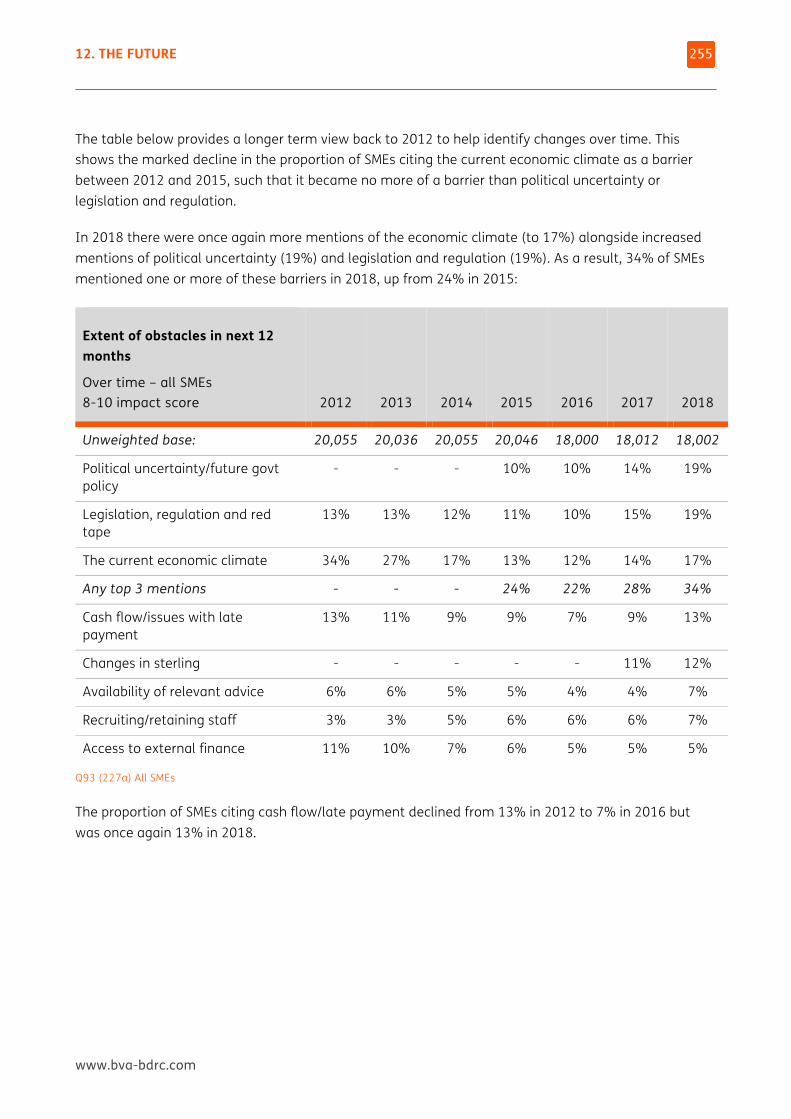
12. THE FUTURE
www.bva-bdrc.com
255
The table below provides a longer term view back to 2012 to help identify changes over time. This shows the marked decline in the proportion of SMEs citing the current economic climate as a barrier between 2012 and 2015, such that it became no more of a barrier than political uncertainty or legislation and regulation.
In 2018 there were once again more mentions of the economic climate (to 17%) alongside increased mentions of political uncertainty (19%) and legislation and regulation (19%). As a result, 34% of SMEs mentioned one or more of these barriers in 2018, up from 24% in 2015:
Extent of obstacles in next 12 months
Over time – all SMEs 8-10 impact score 2012 2013 2014 2015 2016 2017 2018
Unweighted base: 20,055 20,036 20,055 20,046 18,000 18,012 18,002
Political uncertainty/future govt policy
- - - 10% 10% 14% 19%
Legislation, regulation and red tape
13% 13% 12% 11% 10% 15% 19%
The current economic climate 34% 27% 17% 13% 12% 14% 17%
Any top 3 mentions - - - 24% 22% 28% 34%
Cash flow/issues with late payment
13% 11% 9% 9% 7% 9% 13%
Changes in sterling - - - - - 11% 12%
Availability of relevant advice 6% 6% 5% 5% 4% 4% 7%
Recruiting/retaining staff 3% 3% 5% 6% 6% 6% 7%
Access to external finance 11% 10% 7% 6% 5% 5% 5%
Q93 (227a) All SMEs
The proportion of SMEs citing cash flow/late payment declined from 13% in 2012 to 7% in 2016 but was once again 13% in 2018.
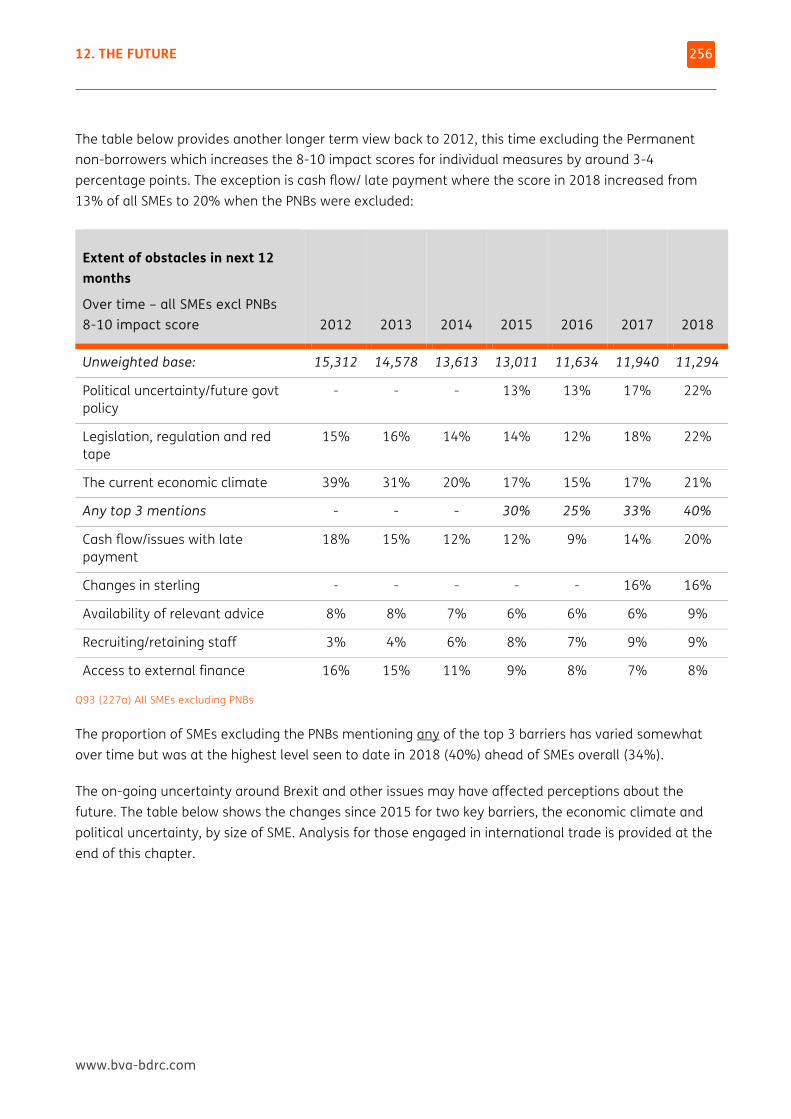
12. THE FUTURE
www.bva-bdrc.com
256
The table below provides another longer term view back to 2012, this time excluding the Permanent non-borrowers which increases the 8-10 impact scores for individual measures by around 3-4 percentage points. The exception is cash flow/ late payment where the score in 2018 increased from 13% of all SMEs to 20% when the PNBs were excluded:
Extent of obstacles in next 12 months
Over time – all SMEs excl PNBs 8-10 impact score 2012 2013 2014 2015 2016 2017 2018
Unweighted base: 15,312 14,578 13,613 13,011 11,634 11,940 11,294
Political uncertainty/future govt policy
- - - 13% 13% 17% 22%
Legislation, regulation and red tape
15% 16% 14% 14% 12% 18% 22%
The current economic climate 39% 31% 20% 17% 15% 17% 21%
Any top 3 mentions - - - 30% 25% 33% 40%
Cash flow/issues with late payment
18% 15% 12% 12% 9% 14% 20%
Changes in sterling - - - - - 16% 16%
Availability of relevant advice 8% 8% 7% 6% 6% 6% 9%
Recruiting/retaining staff 3% 4% 6% 8% 7% 9% 9%
Access to external finance 16% 15% 11% 9% 8% 7% 8%
Q93 (227a) All SMEs excluding PNBs
The proportion of SMEs excluding the PNBs mentioning any of the top 3 barriers has varied somewhat over time but was at the highest level seen to date in 2018 (40%) ahead of SMEs overall (34%).
The on-going uncertainty around Brexit and other issues may have affected perceptions about the future. The table below shows the changes since 2015 for two key barriers, the economic climate and political uncertainty, by size of SME. Analysis for those engaged in international trade is provided at the end of this chapter.
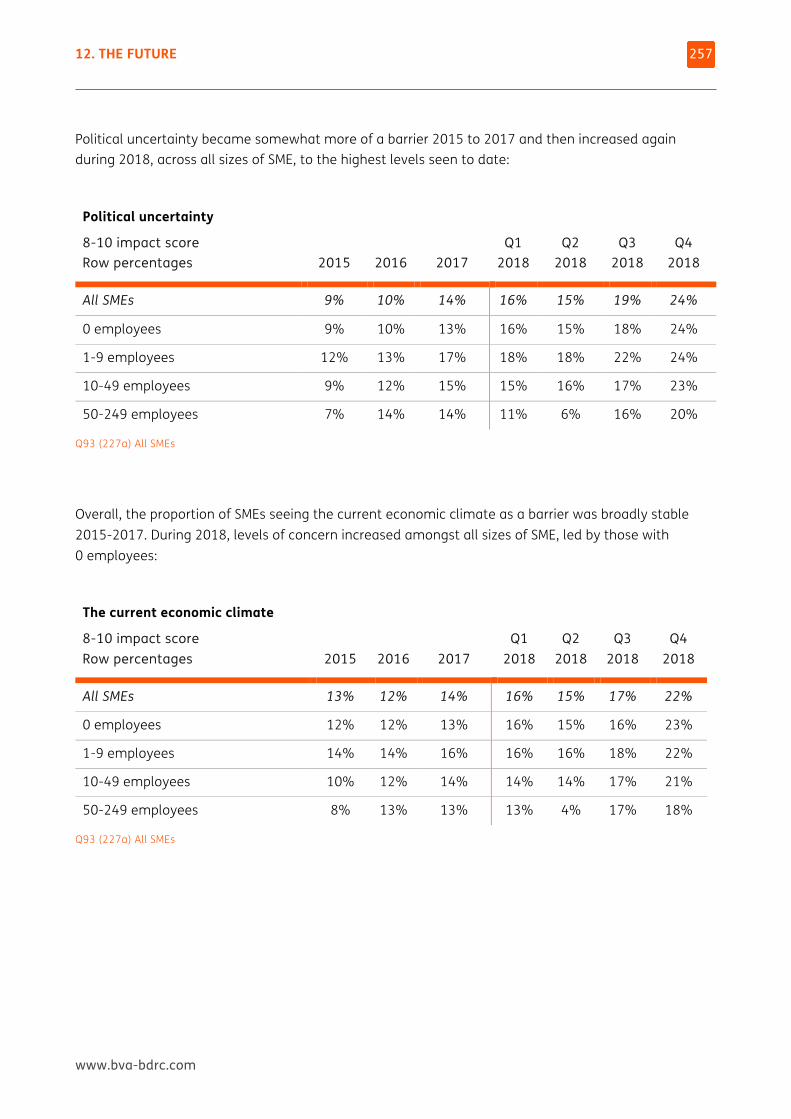
12. THE FUTURE
www.bva-bdrc.com
257
Political uncertainty became somewhat more of a barrier 2015 to 2017 and then increased again during 2018, across all sizes of SME, to the highest levels seen to date:
Political uncertainty
8-10 impact score Row percentages 2015
2016
2017
Q1 2018
Q2 2018
Q3 2018
Q4 2018
All SMEs 9% 10% 14% 16% 15% 19% 24%
0 employees 9% 10% 13% 16% 15% 18% 24%
1-9 employees 12% 13% 17% 18% 18% 22% 24%
10-49 employees 9% 12% 15% 15% 16% 17% 23%
50-249 employees 7% 14% 14% 11% 6% 16% 20%
Q93 (227a) All SMEs
Overall, the proportion of SMEs seeing the current economic climate as a barrier was broadly stable 2015-2017. During 2018, levels of concern increased amongst all sizes of SME, led by those with 0 employees:
The current economic climate
8-10 impact score Row percentages 2015
2016
2017
Q1 2018
Q2 2018
Q3 2018
Q4 2018
All SMEs 13% 12% 14% 16% 15% 17% 22%
0 employees 12% 12% 13% 16% 15% 16% 23%
1-9 employees 14% 14% 16% 16% 16% 18% 22%
10-49 employees 10% 12% 14% 14% 14% 17% 21%
50-249 employees 8% 13% 13% 13% 4% 17% 18%
Q93 (227a) All SMEs
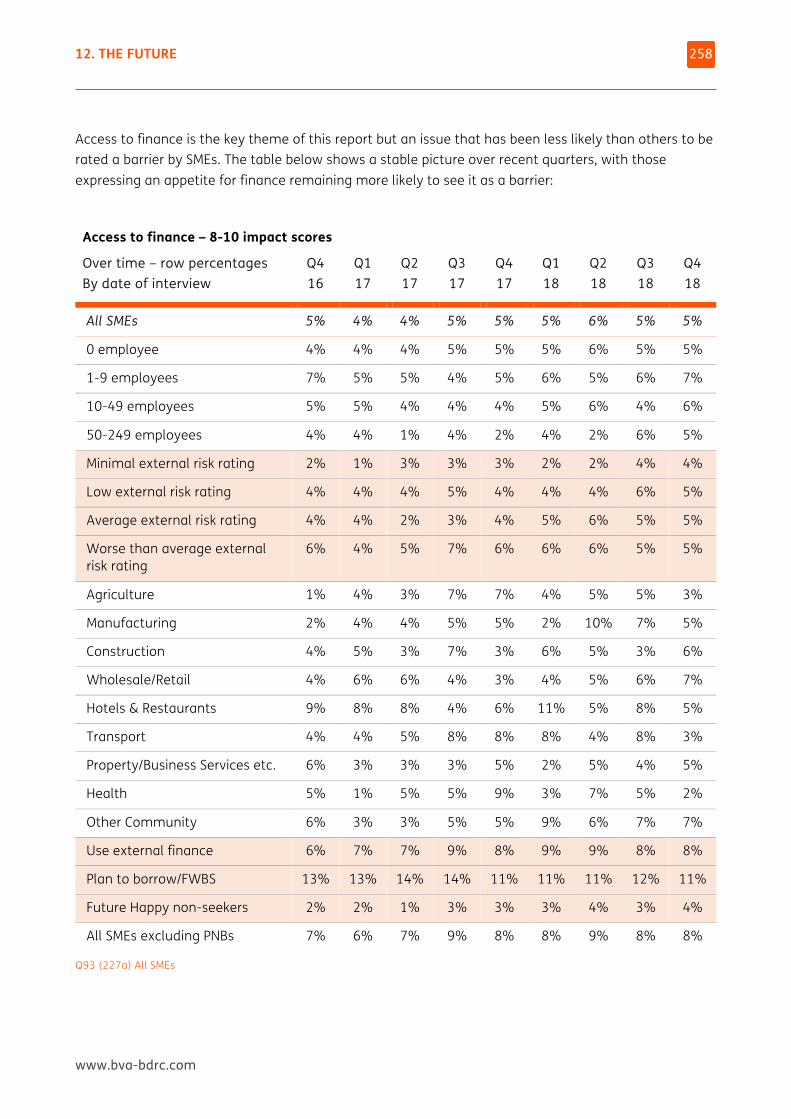
12. THE FUTURE
www.bva-bdrc.com
258
Access to finance is the key theme of this report but an issue that has been less likely than others to be rated a barrier by SMEs. The table below shows a stable picture over recent quarters, with those expressing an appetite for finance remaining more likely to see it as a barrier:
Access to finance – 8-10 impact scores
Over time – row percentages By date of interview
Q4 16
Q1 17
Q2 17
Q3 17
Q4 17
Q1 18
Q2 18
Q3 18
Q4 18
All SMEs 5% 4% 4% 5% 5% 5% 6% 5% 5%
0 employee 4% 4% 4% 5% 5% 5% 6% 5% 5%
1-9 employees 7% 5% 5% 4% 5% 6% 5% 6% 7%
10-49 employees 5% 5% 4% 4% 4% 5% 6% 4% 6%
50-249 employees 4% 4% 1% 4% 2% 4% 2% 6% 5%
Minimal external risk rating 2% 1% 3% 3% 3% 2% 2% 4% 4%
Low external risk rating 4% 4% 4% 5% 4% 4% 4% 6% 5%
Average external risk rating 4% 4% 2% 3% 4% 5% 6% 5% 5%
Worse than average external risk rating
6% 4% 5% 7% 6% 6% 6% 5% 5%
Agriculture 1% 4% 3% 7% 7% 4% 5% 5% 3%
Manufacturing 2% 4% 4% 5% 5% 2% 10% 7% 5%
Construction 4% 5% 3% 7% 3% 6% 5% 3% 6%
Wholesale/Retail 4% 6% 6% 4% 3% 4% 5% 6% 7%
Hotels & Restaurants 9% 8% 8% 4% 6% 11% 5% 8% 5%
Transport 4% 4% 5% 8% 8% 8% 4% 8% 3%
Property/Business Services etc. 6% 3% 3% 3% 5% 2% 5% 4% 5%
Health 5% 1% 5% 5% 9% 3% 7% 5% 2%
Other Community 6% 3% 3% 5% 5% 9% 6% 7% 7%
Use external finance 6% 7% 7% 9% 8% 9% 9% 8% 8%
Plan to borrow/FWBS 13% 13% 14% 14% 11% 11% 11% 12% 11%
Future Happy non-seekers 2% 2% 1% 3% 3% 3% 4% 3% 4%
All SMEs excluding PNBs 7% 6% 7% 9% 8% 8% 9% 8% 8%
Q93 (227a) All SMEs
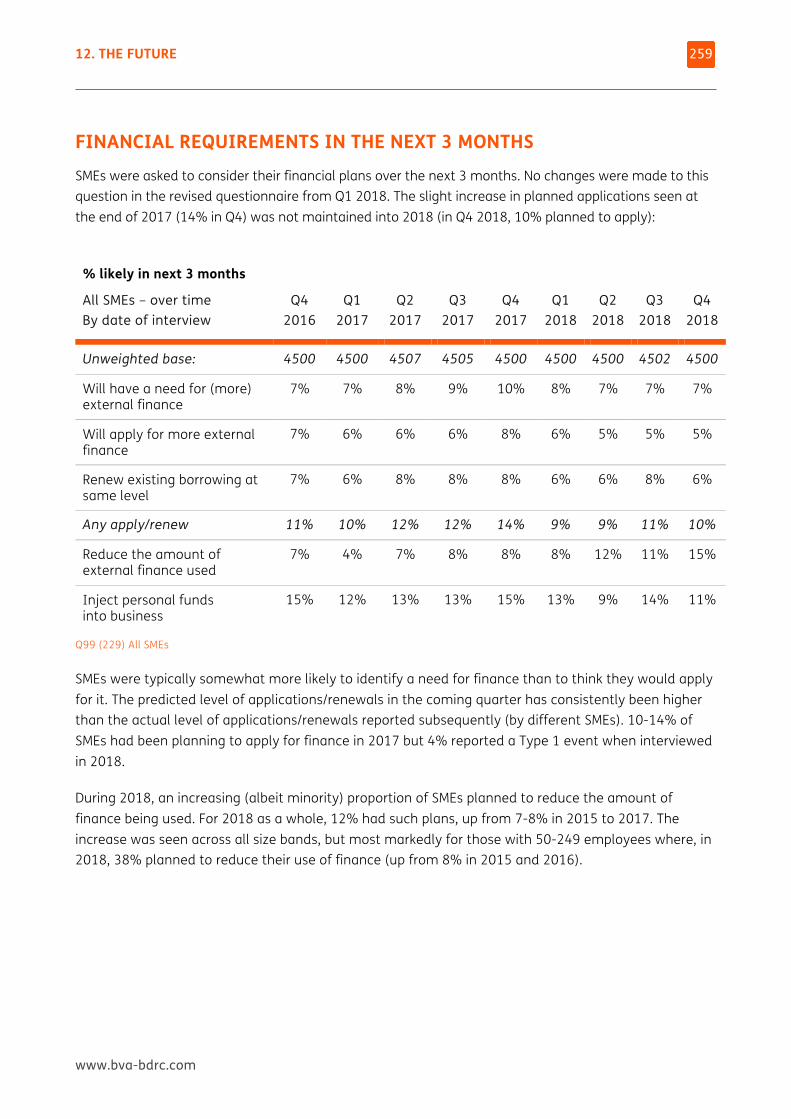
12. THE FUTURE
www.bva-bdrc.com
259
FINANCIAL REQUIREMENTS IN THE NEXT 3 MONTHS SMEs were asked to consider their financial plans over the next 3 months. No changes were made to this question in the revised questionnaire from Q1 2018. The slight increase in planned applications seen at the end of 2017 (14% in Q4) was not maintained into 2018 (in Q4 2018, 10% planned to apply):
% likely in next 3 months
All SMEs – over time By date of interview
Q4 2016
Q1 2017
Q2 2017
Q3 2017
Q4 2017
Q1 2018
Q2 2018
Q3 2018
Q4 2018
Unweighted base: 4500 4500 4507 4505 4500 4500 4500 4502 4500
Will have a need for (more) external finance
7% 7% 8% 9% 10% 8% 7% 7% 7%
Will apply for more external finance
7% 6% 6% 6% 8% 6% 5% 5% 5%
Renew existing borrowing at same level
7% 6% 8% 8% 8% 6% 6% 8% 6%
Any apply/renew 11% 10% 12% 12% 14% 9% 9% 11% 10%
Reduce the amount of external finance used
7% 4% 7% 8% 8% 8% 12% 11% 15%
Inject personal funds into business
15% 12% 13% 13% 15% 13% 9% 14% 11%
Q99 (229) All SMEs
SMEs were typically somewhat more likely to identify a need for finance than to think they would apply for it. The predicted level of applications/renewals in the coming quarter has consistently been higher than the actual level of applications/renewals reported subsequently (by different SMEs). 10-14% of SMEs had been planning to apply for finance in 2017 but 4% reported a Type 1 event when interviewed in 2018.
During 2018, an increasing (albeit minority) proportion of SMEs planned to reduce the amount of finance being used. For 2018 as a whole, 12% had such plans, up from 7-8% in 2015 to 2017. The increase was seen across all size bands, but most markedly for those with 50-249 employees where, in 2018, 38% planned to reduce their use of finance (up from 8% in 2015 and 2016).
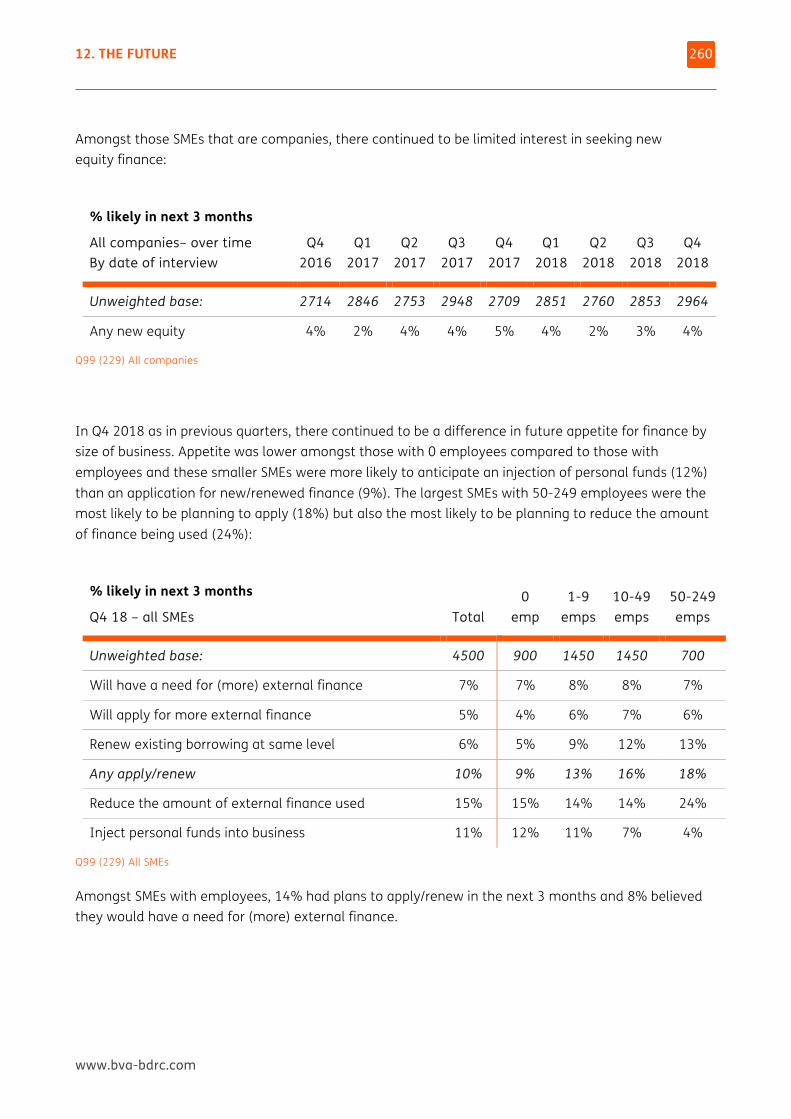
12. THE FUTURE
www.bva-bdrc.com
260
Amongst those SMEs that are companies, there continued to be limited interest in seeking new equity finance:
% likely in next 3 months
All companies– over time By date of interview
Q4 2016
Q1 2017
Q2 2017
Q3 2017
Q4 2017
Q1 2018
Q2 2018
Q3 2018
Q4 2018
Unweighted base: 2714 2846 2753 2948 2709 2851 2760 2853 2964
Any new equity 4% 2% 4% 4% 5% 4% 2% 3% 4%
Q99 (229) All companies
In Q4 2018 as in previous quarters, there continued to be a difference in future appetite for finance by size of business. Appetite was lower amongst those with 0 employees compared to those with employees and these smaller SMEs were more likely to anticipate an injection of personal funds (12%) than an application for new/renewed finance (9%). The largest SMEs with 50-249 employees were the most likely to be planning to apply (18%) but also the most likely to be planning to reduce the amount of finance being used (24%):
% likely in next 3 months
Q4 18 – all SMEs Total 0
emp 1-9
emps 10-49 emps
50-249 emps
Unweighted base: 4500 900 1450 1450 700
Will have a need for (more) external finance 7% 7% 8% 8% 7%
Will apply for more external finance 5% 4% 6% 7% 6%
Renew existing borrowing at same level 6% 5% 9% 12% 13%
Any apply/renew 10% 9% 13% 16% 18%
Reduce the amount of external finance used 15% 15% 14% 14% 24%
Inject personal funds into business 11% 12% 11% 7% 4%
Q99 (229) All SMEs
Amongst SMEs with employees, 14% had plans to apply/renew in the next 3 months and 8% believed they would have a need for (more) external finance.
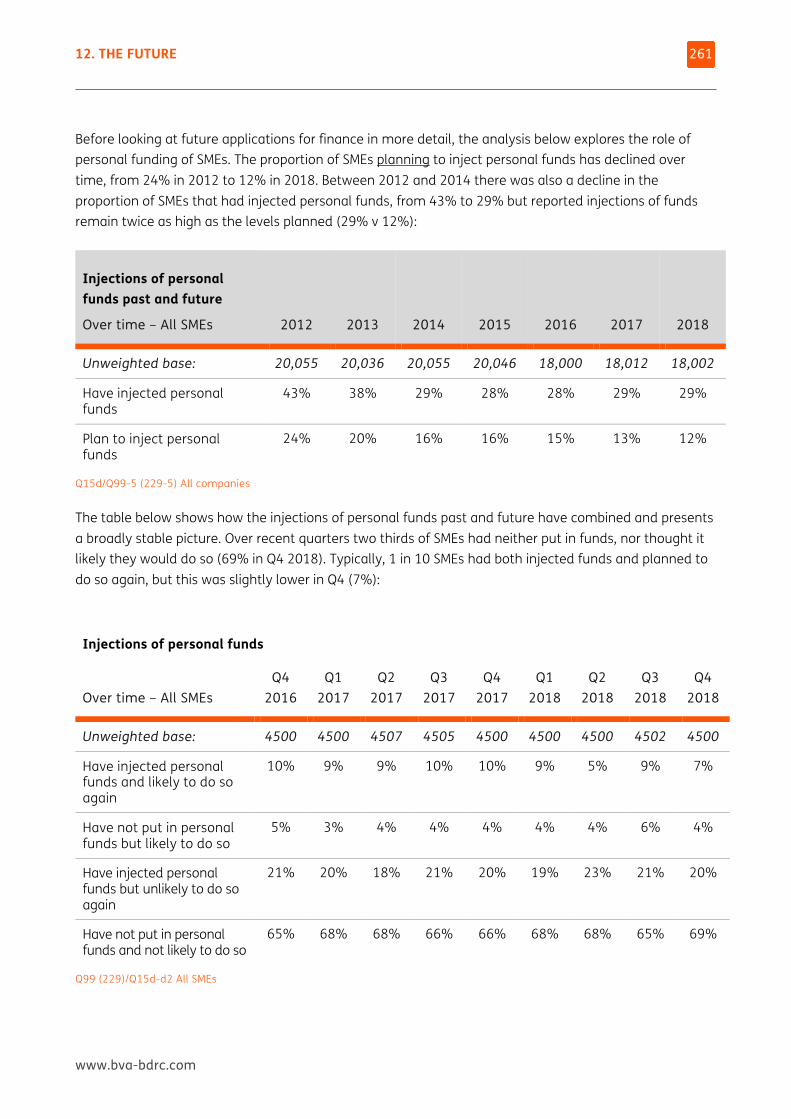
12. THE FUTURE
www.bva-bdrc.com
261
Before looking at future applications for finance in more detail, the analysis below explores the role of personal funding of SMEs. The proportion of SMEs planning to inject personal funds has declined over time, from 24% in 2012 to 12% in 2018. Between 2012 and 2014 there was also a decline in the proportion of SMEs that had injected personal funds, from 43% to 29% but reported injections of funds remain twice as high as the levels planned (29% v 12%):
Injections of personal funds past and future
Over time – All SMEs 2012 2013 2014 2015 2016 2017 2018
Unweighted base: 20,055 20,036 20,055 20,046 18,000 18,012 18,002
Have injected personal funds
43% 38% 29% 28% 28% 29% 29%
Plan to inject personal funds
24% 20% 16% 16% 15% 13% 12%
Q15d/Q99-5 (229-5) All companies
The table below shows how the injections of personal funds past and future have combined and presents a broadly stable picture. Over recent quarters two thirds of SMEs had neither put in funds, nor thought it likely they would do so (69% in Q4 2018). Typically, 1 in 10 SMEs had both injected funds and planned to do so again, but this was slightly lower in Q4 (7%):
Injections of personal funds
Over time – All SMEs
Q4 2016
Q1 2017
Q2 2017
Q3 2017
Q4 2017
Q1 2018
Q2 2018
Q3 2018
Q4 2018
Unweighted base: 4500 4500 4507 4505 4500 4500 4500 4502 4500
Have injected personal funds and likely to do so again
10% 9% 9% 10% 10% 9% 5% 9% 7%
Have not put in personal funds but likely to do so
5% 3% 4% 4% 4% 4% 4% 6% 4%
Have injected personal funds but unlikely to do so again
21% 20% 18% 21% 20% 19% 23% 21% 20%
Have not put in personal funds and not likely to do so
65% 68% 68% 66% 66% 68% 68% 65% 69%
Q99 (229)/Q15d-d2 All SMEs
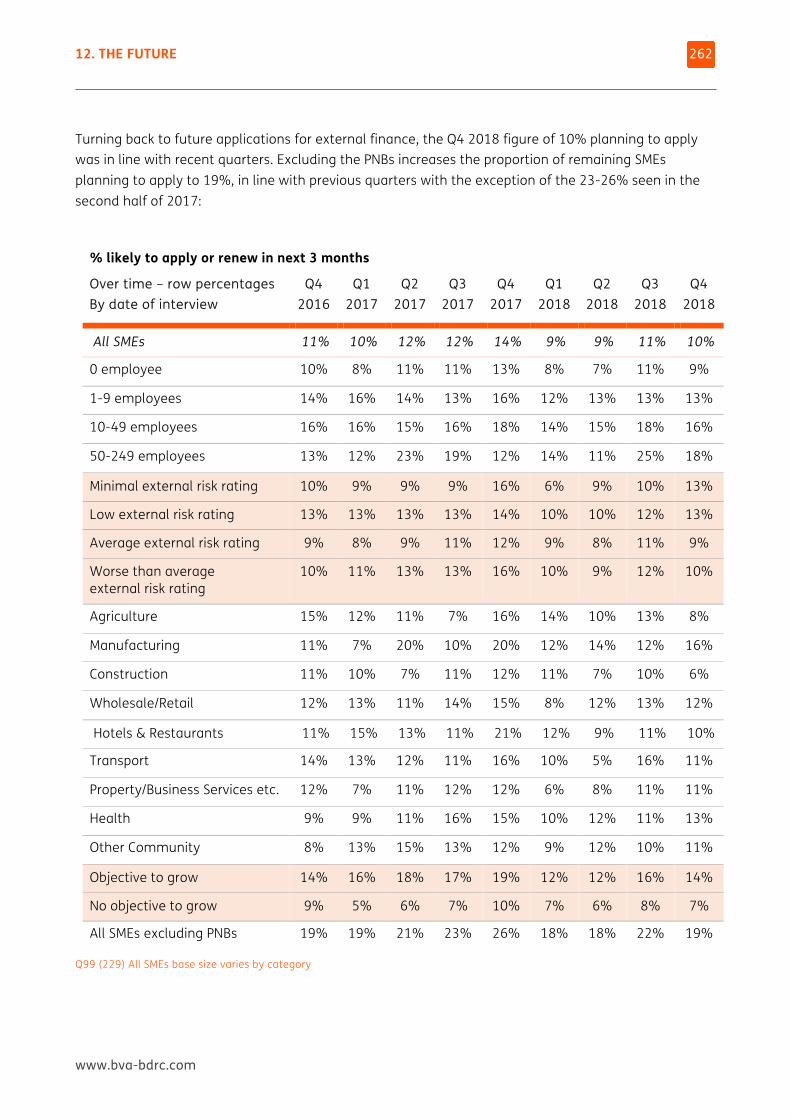
12. THE FUTURE
www.bva-bdrc.com
262
Turning back to future applications for external finance, the Q4 2018 figure of 10% planning to apply was in line with recent quarters. Excluding the PNBs increases the proportion of remaining SMEs planning to apply to 19%, in line with previous quarters with the exception of the 23-26% seen in the second half of 2017:
% likely to apply or renew in next 3 months
Over time – row percentages By date of interview
Q4 2016
Q1 2017
Q2 2017
Q3 2017
Q4 2017
Q1 2018
Q2 2018
Q3 2018
Q4 2018
All SMEs 11% 10% 12% 12% 14% 9% 9% 11% 10%
0 employee 10% 8% 11% 11% 13% 8% 7% 11% 9%
1-9 employees 14% 16% 14% 13% 16% 12% 13% 13% 13%
10-49 employees 16% 16% 15% 16% 18% 14% 15% 18% 16%
50-249 employees 13% 12% 23% 19% 12% 14% 11% 25% 18%
Minimal external risk rating 10% 9% 9% 9% 16% 6% 9% 10% 13%
Low external risk rating 13% 13% 13% 13% 14% 10% 10% 12% 13%
Average external risk rating 9% 8% 9% 11% 12% 9% 8% 11% 9%
Worse than average external risk rating
10% 11% 13% 13% 16% 10% 9% 12% 10%
Agriculture 15% 12% 11% 7% 16% 14% 10% 13% 8%
Manufacturing 11% 7% 20% 10% 20% 12% 14% 12% 16%
Construction 11% 10% 7% 11% 12% 11% 7% 10% 6%
Wholesale/Retail 12% 13% 11% 14% 15% 8% 12% 13% 12%
Hotels & Restaurants 11% 15% 13% 11% 21% 12% 9% 11% 10%
Transport 14% 13% 12% 11% 16% 10% 5% 16% 11%
Property/Business Services etc. 12% 7% 11% 12% 12% 6% 8% 11% 11%
Health 9% 9% 11% 16% 15% 10% 12% 11% 13%
Other Community 8% 13% 15% 13% 12% 9% 12% 10% 11%
Objective to grow 14% 16% 18% 17% 19% 12% 12% 16% 14%
No objective to grow 9% 5% 6% 7% 10% 7% 6% 8% 7%
All SMEs excluding PNBs 19% 19% 21% 23% 26% 18% 18% 22% 19%
Q99 (229) All SMEs base size varies by category
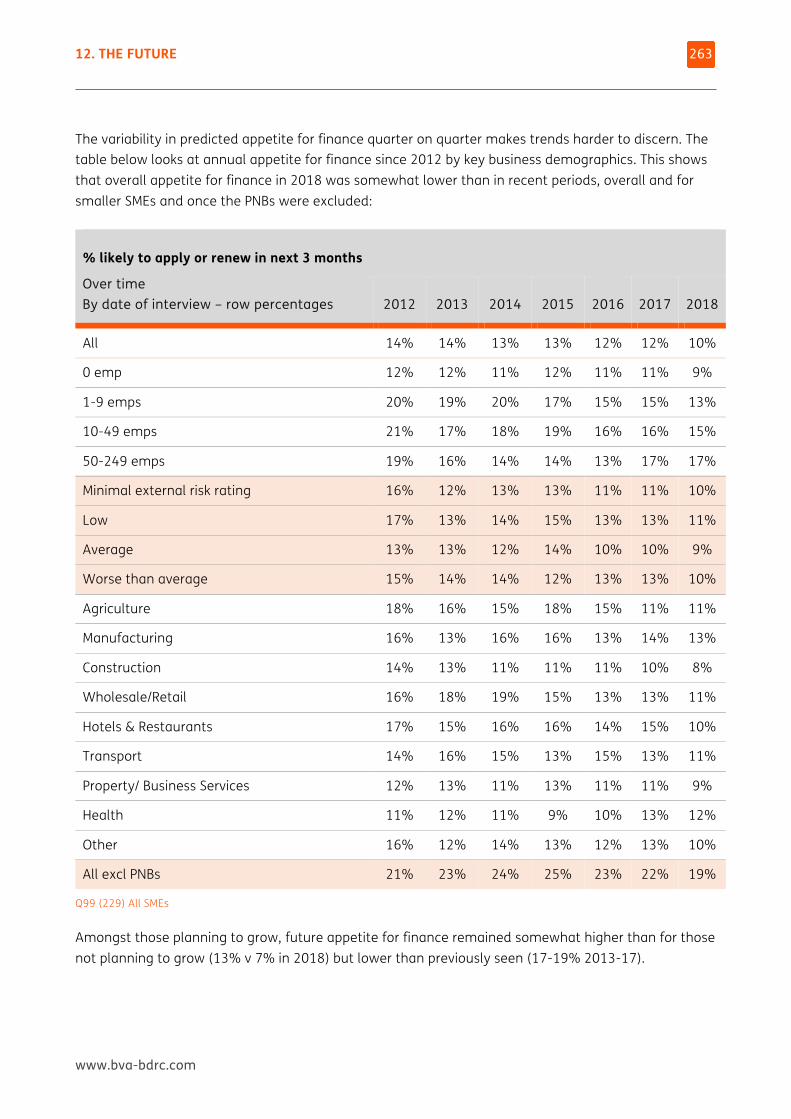
12. THE FUTURE
www.bva-bdrc.com
263
The variability in predicted appetite for finance quarter on quarter makes trends harder to discern. The table below looks at annual appetite for finance since 2012 by key business demographics. This shows that overall appetite for finance in 2018 was somewhat lower than in recent periods, overall and for smaller SMEs and once the PNBs were excluded:
% likely to apply or renew in next 3 months
Over time By date of interview – row percentages 2012 2013 2014 2015
2016 2017 2018
All 14% 14% 13% 13% 12% 12% 10%
0 emp 12% 12% 11% 12% 11% 11% 9%
1-9 emps 20% 19% 20% 17% 15% 15% 13%
10-49 emps 21% 17% 18% 19% 16% 16% 15%
50-249 emps 19% 16% 14% 14% 13% 17% 17%
Minimal external risk rating 16% 12% 13% 13% 11% 11% 10%
Low 17% 13% 14% 15% 13% 13% 11%
Average 13% 13% 12% 14% 10% 10% 9%
Worse than average 15% 14% 14% 12% 13% 13% 10%
Agriculture 18% 16% 15% 18% 15% 11% 11%
Manufacturing 16% 13% 16% 16% 13% 14% 13%
Construction 14% 13% 11% 11% 11% 10% 8%
Wholesale/Retail 16% 18% 19% 15% 13% 13% 11%
Hotels & Restaurants 17% 15% 16% 16% 14% 15% 10%
Transport 14% 16% 15% 13% 15% 13% 11%
Property/ Business Services 12% 13% 11% 13% 11% 11% 9%
Health 11% 12% 11% 9% 10% 13% 12%
Other 16% 12% 14% 13% 12% 13% 10%
All excl PNBs 21% 23% 24% 25% 23% 22% 19%
Q99 (229) All SMEs
Amongst those planning to grow, future appetite for finance remained somewhat higher than for those not planning to grow (13% v 7% in 2018) but lower than previously seen (17-19% 2013-17).
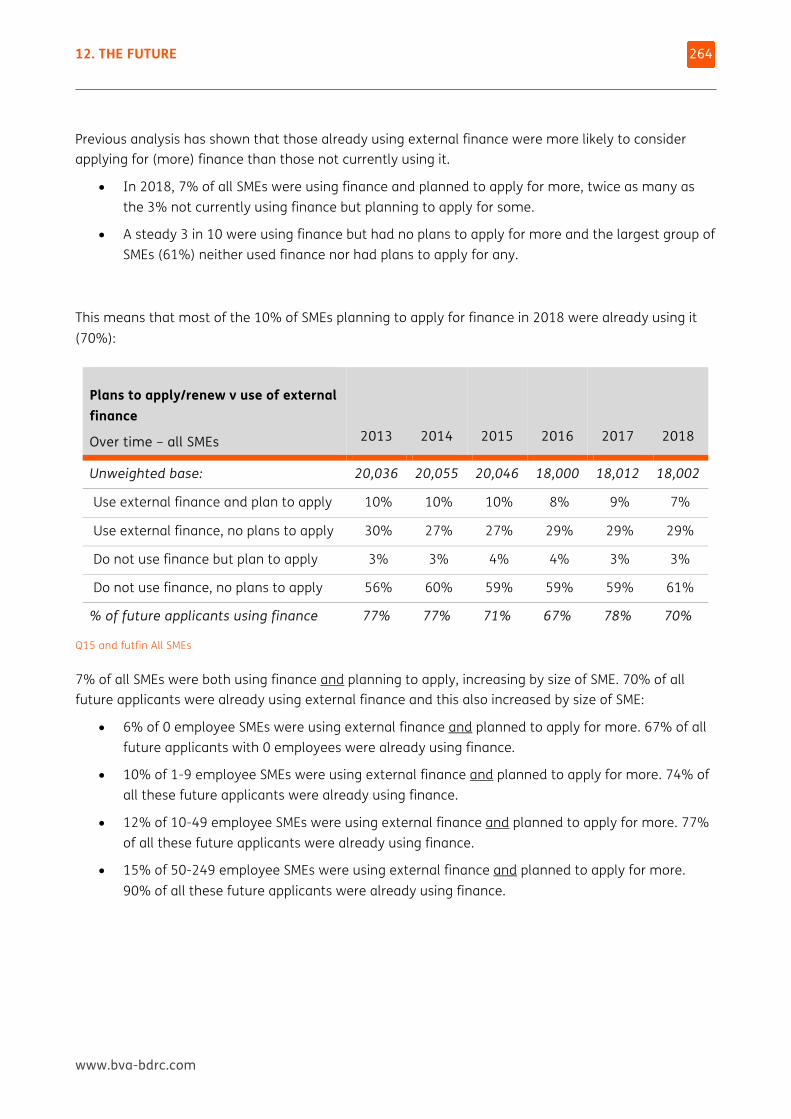
12. THE FUTURE
www.bva-bdrc.com
264
Previous analysis has shown that those already using external finance were more likely to consider applying for (more) finance than those not currently using it.
• In 2018, 7% of all SMEs were using finance and planned to apply for more, twice as many as the 3% not currently using finance but planning to apply for some.
• A steady 3 in 10 were using finance but had no plans to apply for more and the largest group of SMEs (61%) neither used finance nor had plans to apply for any.
This means that most of the 10% of SMEs planning to apply for finance in 2018 were already using it (70%):
Plans to apply/renew v use of external finance
Over time – all SMEs 2013 2014 2015
2016 2017 2018
Unweighted base: 20,036 20,055 20,046 18,000 18,012 18,002
Use external finance and plan to apply 10% 10% 10% 8% 9% 7%
Use external finance, no plans to apply 30% 27% 27% 29% 29% 29%
Do not use finance but plan to apply 3% 3% 4% 4% 3% 3%
Do not use finance, no plans to apply 56% 60% 59% 59% 59% 61%
% of future applicants using finance 77% 77% 71% 67% 78% 70%
Q15 and futfin All SMEs
7% of all SMEs were both using finance and planning to apply, increasing by size of SME. 70% of all future applicants were already using external finance and this also increased by size of SME:
• 6% of 0 employee SMEs were using external finance and planned to apply for more. 67% of all future applicants with 0 employees were already using finance.
• 10% of 1-9 employee SMEs were using external finance and planned to apply for more. 74% of all these future applicants were already using finance.
• 12% of 10-49 employee SMEs were using external finance and planned to apply for more. 77% of all these future applicants were already using finance.
• 15% of 50-249 employee SMEs were using external finance and planned to apply for more. 90% of all these future applicants were already using finance.
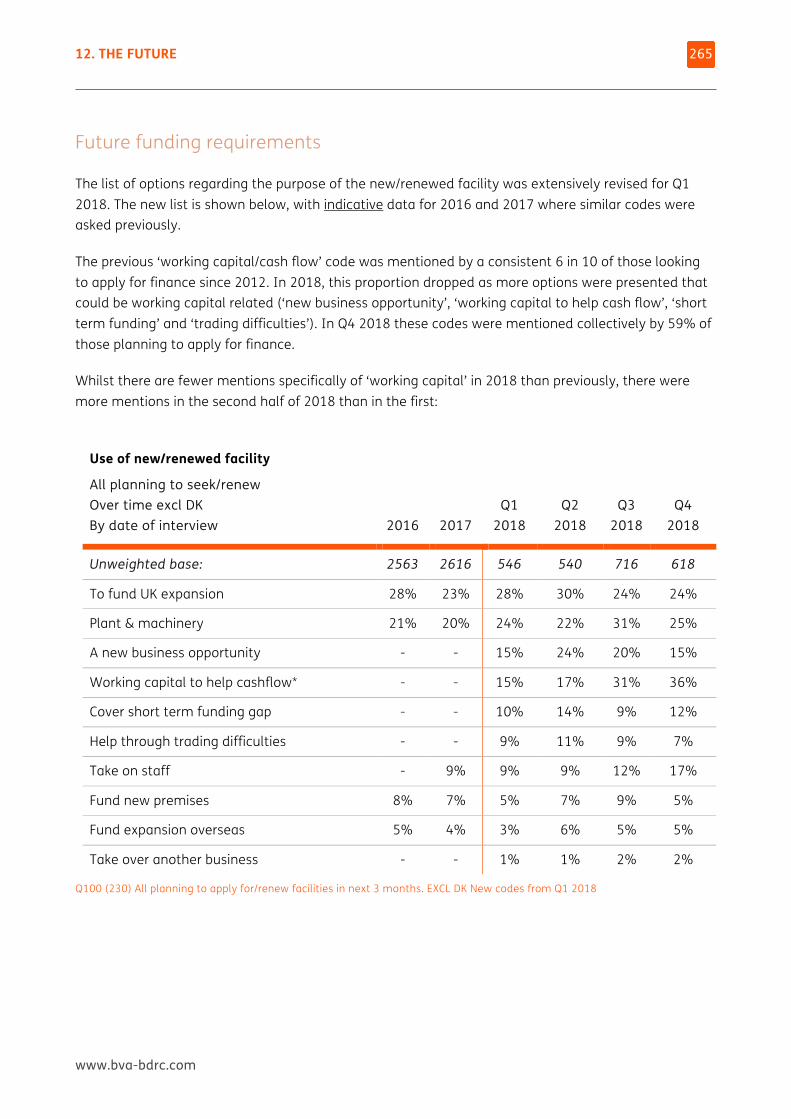
12. THE FUTURE
www.bva-bdrc.com
265
Future funding requirements
The list of options regarding the purpose of the new/renewed facility was extensively revised for Q1 2018. The new list is shown below, with indicative data for 2016 and 2017 where similar codes were asked previously.
The previous ‘working capital/cash flow’ code was mentioned by a consistent 6 in 10 of those looking to apply for finance since 2012. In 2018, this proportion dropped as more options were presented that could be working capital related (‘new business opportunity’, ‘working capital to help cash flow’, ‘short term funding’ and ‘trading difficulties’). In Q4 2018 these codes were mentioned collectively by 59% of those planning to apply for finance.
Whilst there are fewer mentions specifically of ‘working capital’ in 2018 than previously, there were more mentions in the second half of 2018 than in the first:
Use of new/renewed facility
All planning to seek/renew Over time excl DK By date of interview 2016 2017
Q1 2018
Q2 2018
Q3 2018
Q4 2018
Unweighted base: 2563 2616 546 540 716 618
To fund UK expansion 28% 23% 28% 30% 24% 24%
Plant & machinery 21% 20% 24% 22% 31% 25%
A new business opportunity - - 15% 24% 20% 15%
Working capital to help cashflow* - - 15% 17% 31% 36%
Cover short term funding gap - - 10% 14% 9% 12%
Help through trading difficulties - - 9% 11% 9% 7%
Take on staff - 9% 9% 9% 12% 17%
Fund new premises 8% 7% 5% 7% 9% 5%
Fund expansion overseas 5% 4% 3% 6% 5% 5%
Take over another business - - 1% 1% 2% 2%
Q100 (230) All planning to apply for/renew facilities in next 3 months. EXCL DK New codes from Q1 2018
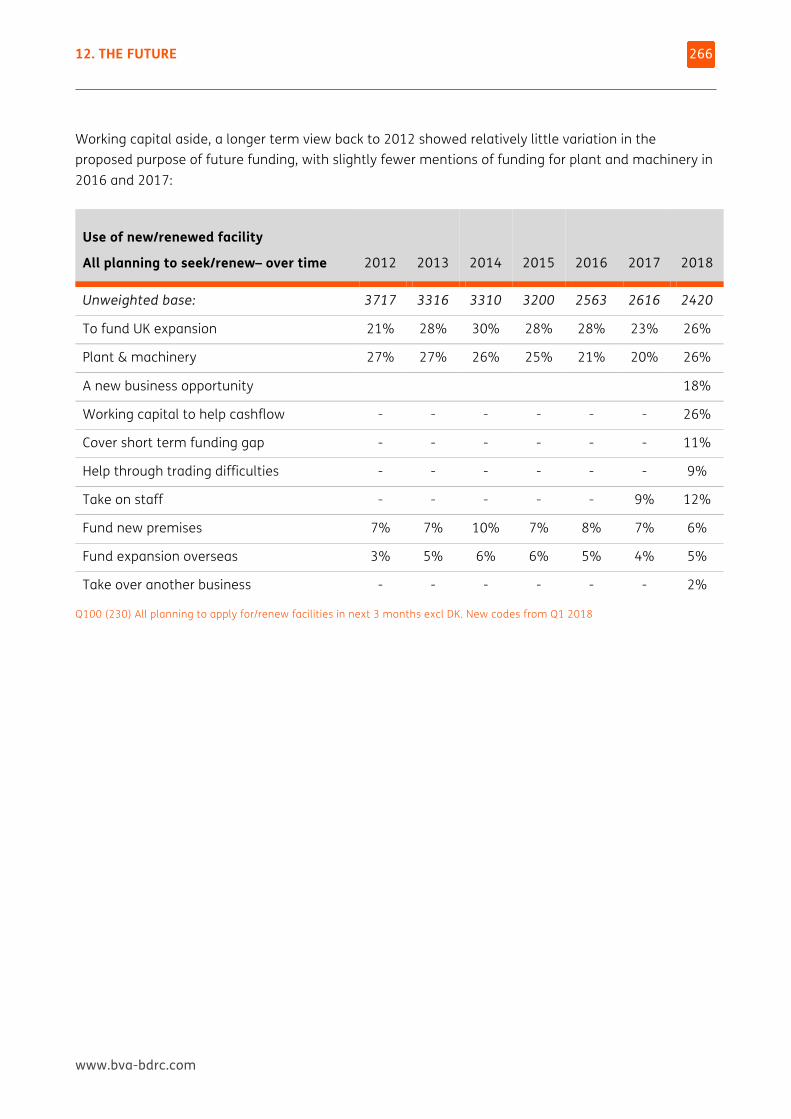
12. THE FUTURE
www.bva-bdrc.com
266
Working capital aside, a longer term view back to 2012 showed relatively little variation in the proposed purpose of future funding, with slightly fewer mentions of funding for plant and machinery in 2016 and 2017:
Use of new/renewed facility
All planning to seek/renew– over time 2012 2013 2014 2015
2016 2017 2018
Unweighted base: 3717 3316 3310 3200 2563 2616 2420
To fund UK expansion 21% 28% 30% 28% 28% 23% 26%
Plant & machinery 27% 27% 26% 25% 21% 20% 26%
A new business opportunity 18%
Working capital to help cashflow - - - - - - 26%
Cover short term funding gap - - - - - - 11%
Help through trading difficulties - - - - - - 9%
Take on staff - - - - - 9% 12%
Fund new premises 7% 7% 10% 7% 8% 7% 6%
Fund expansion overseas 3% 5% 6% 6% 5% 4% 5%
Take over another business - - - - - - 2%
Q100 (230) All planning to apply for/renew facilities in next 3 months excl DK. New codes from Q1 2018
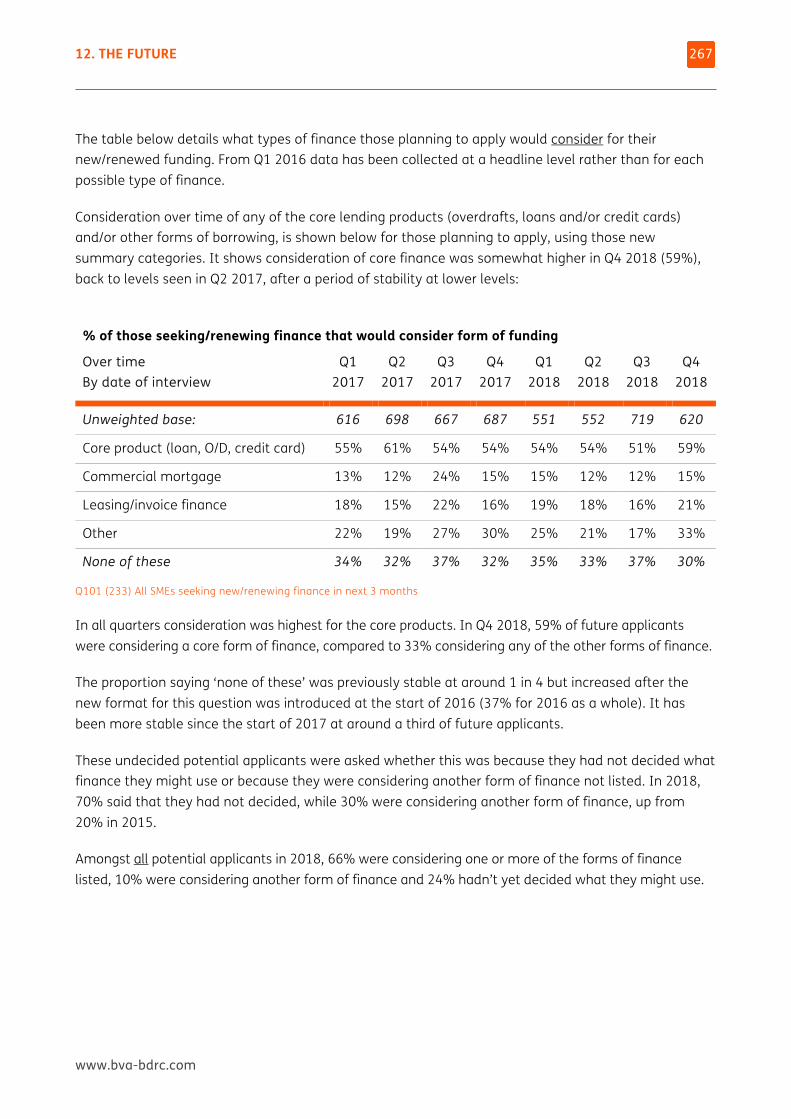
12. THE FUTURE
www.bva-bdrc.com
267
The table below details what types of finance those planning to apply would consider for their new/renewed funding. From Q1 2016 data has been collected at a headline level rather than for each possible type of finance.
Consideration over time of any of the core lending products (overdrafts, loans and/or credit cards) and/or other forms of borrowing, is shown below for those planning to apply, using those new summary categories. It shows consideration of core finance was somewhat higher in Q4 2018 (59%), back to levels seen in Q2 2017, after a period of stability at lower levels:
% of those seeking/renewing finance that would consider form of funding
Over time By date of interview
Q1 2017
Q2 2017
Q3 2017
Q4 2017
Q1 2018
Q2 2018
Q3 2018
Q4 2018
Unweighted base: 616 698 667 687 551 552 719 620
Core product (loan, O/D, credit card) 55% 61% 54% 54% 54% 54% 51% 59%
Commercial mortgage 13% 12% 24% 15% 15% 12% 12% 15%
Leasing/invoice finance 18% 15% 22% 16% 19% 18% 16% 21%
Other 22% 19% 27% 30% 25% 21% 17% 33%
None of these 34% 32% 37% 32% 35% 33% 37% 30%
Q101 (233) All SMEs seeking new/renewing finance in next 3 months
In all quarters consideration was highest for the core products. In Q4 2018, 59% of future applicants were considering a core form of finance, compared to 33% considering any of the other forms of finance.
The proportion saying ‘none of these’ was previously stable at around 1 in 4 but increased after the new format for this question was introduced at the start of 2016 (37% for 2016 as a whole). It has been more stable since the start of 2017 at around a third of future applicants.
These undecided potential applicants were asked whether this was because they had not decided what finance they might use or because they were considering another form of finance not listed. In 2018, 70% said that they had not decided, while 30% were considering another form of finance, up from 20% in 2015.
Amongst all potential applicants in 2018, 66% were considering one or more of the forms of finance listed, 10% were considering another form of finance and 24% hadn’t yet decided what they might use.
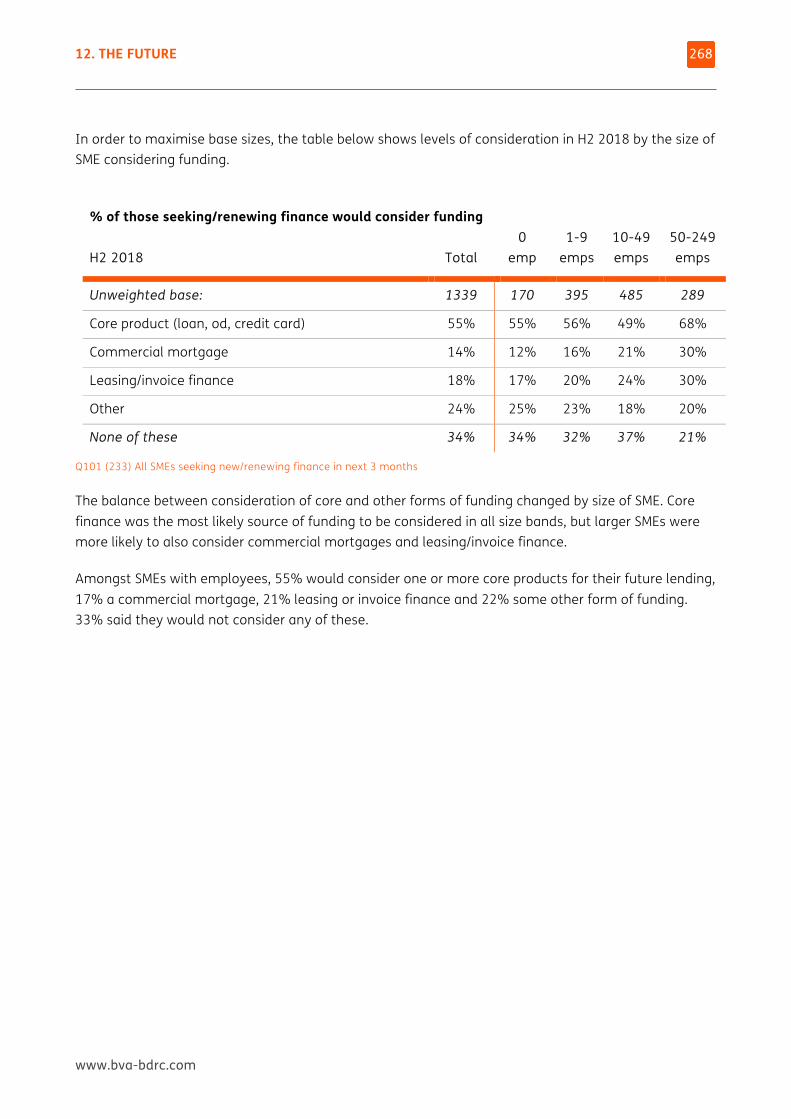
12. THE FUTURE
www.bva-bdrc.com
268
In order to maximise base sizes, the table below shows levels of consideration in H2 2018 by the size of SME considering funding.
% of those seeking/renewing finance would consider funding
H2 2018 Total 0
emp 1-9
emps 10-49 emps
50-249 emps
Unweighted base: 1339 170 395 485 289
Core product (loan, od, credit card) 55% 55% 56% 49% 68%
Commercial mortgage 14% 12% 16% 21% 30%
Leasing/invoice finance 18% 17% 20% 24% 30%
Other 24% 25% 23% 18% 20%
None of these 34% 34% 32% 37% 21%
Q101 (233) All SMEs seeking new/renewing finance in next 3 months
The balance between consideration of core and other forms of funding changed by size of SME. Core finance was the most likely source of funding to be considered in all size bands, but larger SMEs were more likely to also consider commercial mortgages and leasing/invoice finance.
Amongst SMEs with employees, 55% would consider one or more core products for their future lending, 17% a commercial mortgage, 21% leasing or invoice finance and 22% some other form of funding. 33% said they would not consider any of these.
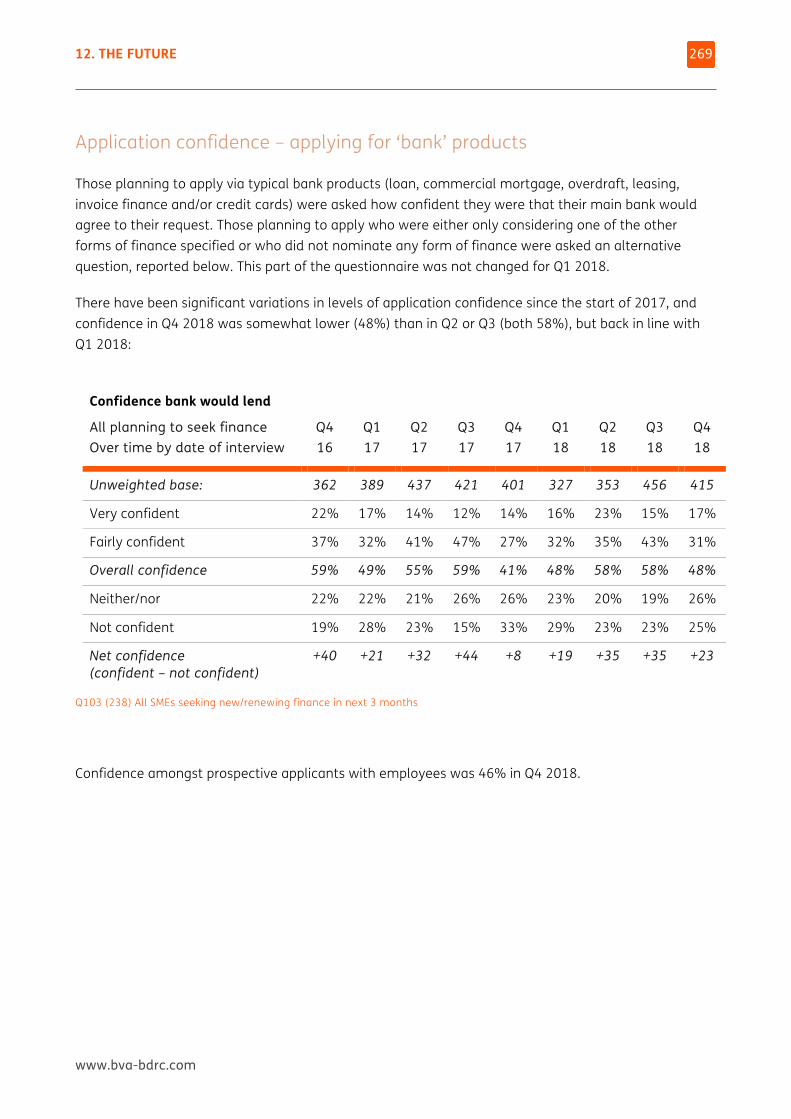
12. THE FUTURE
www.bva-bdrc.com
269
Application confidence – applying for ‘bank’ products
Those planning to apply via typical bank products (loan, commercial mortgage, overdraft, leasing, invoice finance and/or credit cards) were asked how confident they were that their main bank would agree to their request. Those planning to apply who were either only considering one of the other forms of finance specified or who did not nominate any form of finance were asked an alternative question, reported below. This part of the questionnaire was not changed for Q1 2018.
There have been significant variations in levels of application confidence since the start of 2017, and confidence in Q4 2018 was somewhat lower (48%) than in Q2 or Q3 (both 58%), but back in line with Q1 2018:
Confidence bank would lend
All planning to seek finance Over time by date of interview
Q4 16
Q1 17
Q2 17
Q3 17
Q4 17
Q1 18
Q2 18
Q3 18
Q4 18
Unweighted base: 362 389 437 421 401 327 353 456 415
Very confident 22% 17% 14% 12% 14% 16% 23% 15% 17%
Fairly confident 37% 32% 41% 47% 27% 32% 35% 43% 31%
Overall confidence 59% 49% 55% 59% 41% 48% 58% 58% 48%
Neither/nor 22% 22% 21% 26% 26% 23% 20% 19% 26%
Not confident 19% 28% 23% 15% 33% 29% 23% 23% 25%
Net confidence (confident – not confident)
+40 +21 +32 +44 +8 +19 +35 +35 +23
Q103 (238) All SMEs seeking new/renewing finance in next 3 months
Confidence amongst prospective applicants with employees was 46% in Q4 2018.
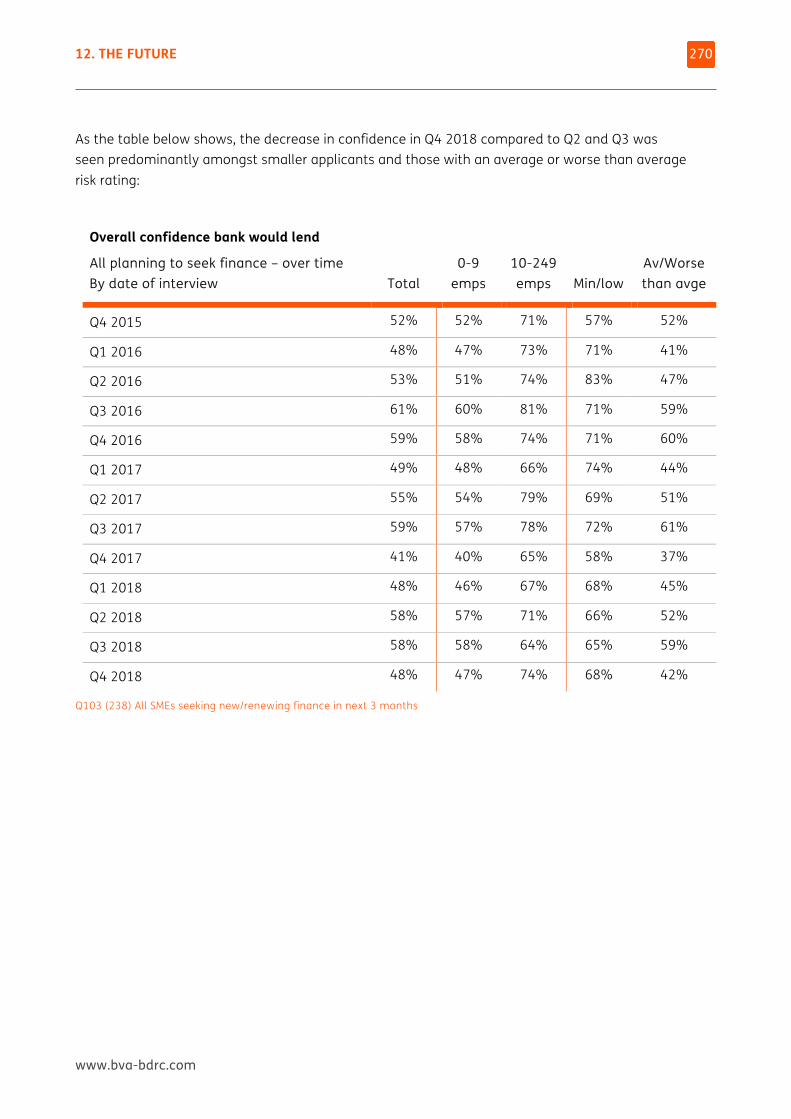
12. THE FUTURE
www.bva-bdrc.com
270
As the table below shows, the decrease in confidence in Q4 2018 compared to Q2 and Q3 was seen predominantly amongst smaller applicants and those with an average or worse than average risk rating:
Overall confidence bank would lend
All planning to seek finance – over time By date of interview Total
0-9 emps
10-249 emps Min/low
Av/Worse than avge
Q4 2015 52% 52% 71% 57% 52%
Q1 2016 48% 47% 73% 71% 41%
Q2 2016 53% 51% 74% 83% 47%
Q3 2016 61% 60% 81% 71% 59%
Q4 2016 59% 58% 74% 71% 60%
Q1 2017 49% 48% 66% 74% 44%
Q2 2017 55% 54% 79% 69% 51%
Q3 2017 59% 57% 78% 72% 61%
Q4 2017 41% 40% 65% 58% 37%
Q1 2018 48% 46% 67% 68% 45%
Q2 2018 58% 57% 71% 66% 52%
Q3 2018 58% 58% 64% 65% 59%
Q4 2018 48% 47% 74% 68% 42%
Q103 (238) All SMEs seeking new/renewing finance in next 3 months
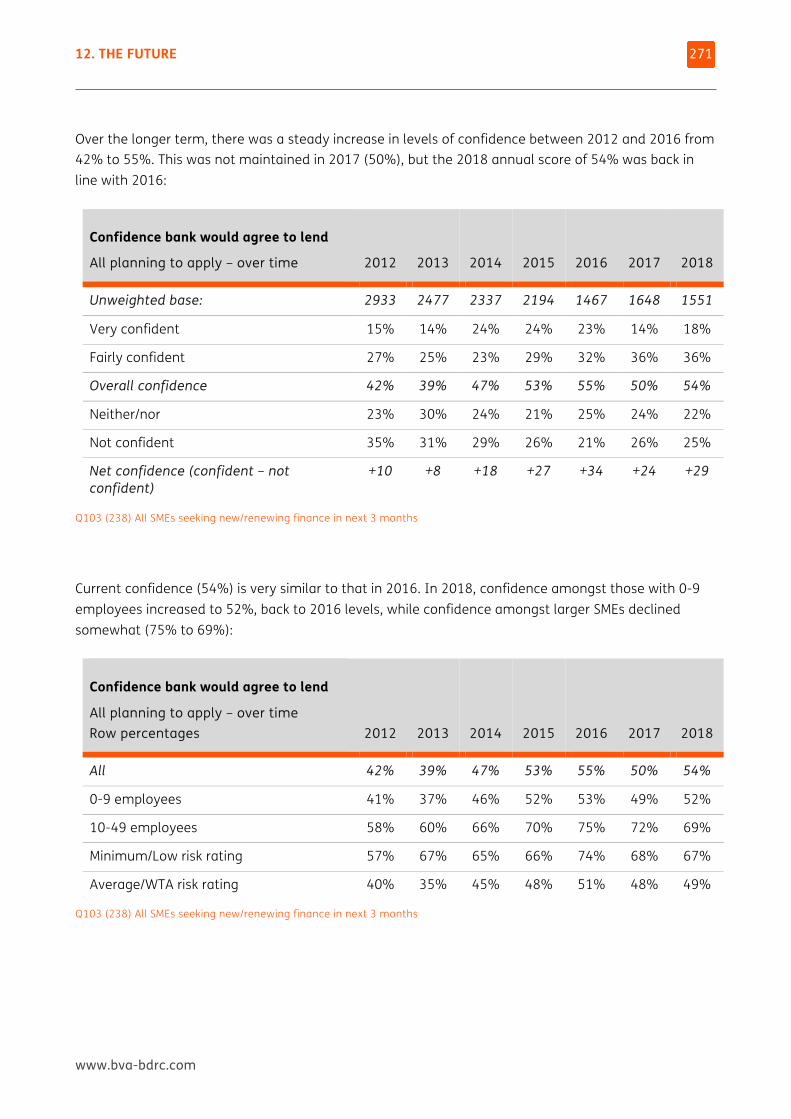
12. THE FUTURE
www.bva-bdrc.com
271
Over the longer term, there was a steady increase in levels of confidence between 2012 and 2016 from 42% to 55%. This was not maintained in 2017 (50%), but the 2018 annual score of 54% was back in line with 2016:
Confidence bank would agree to lend
All planning to apply – over time 2012 2013 2014 2015
2016 2017 2018
Unweighted base: 2933 2477 2337 2194 1467 1648 1551
Very confident 15% 14% 24% 24% 23% 14% 18%
Fairly confident 27% 25% 23% 29% 32% 36% 36%
Overall confidence 42% 39% 47% 53% 55% 50% 54%
Neither/nor 23% 30% 24% 21% 25% 24% 22%
Not confident 35% 31% 29% 26% 21% 26% 25%
Net confidence (confident – not confident)
+10 +8 +18 +27 +34 +24 +29
Q103 (238) All SMEs seeking new/renewing finance in next 3 months
Current confidence (54%) is very similar to that in 2016. In 2018, confidence amongst those with 0-9 employees increased to 52%, back to 2016 levels, while confidence amongst larger SMEs declined somewhat (75% to 69%):
Confidence bank would agree to lend
All planning to apply – over time Row percentages 2012 2013 2014 2015
2016 2017 2018
All 42% 39% 47% 53% 55% 50% 54%
0-9 employees 41% 37% 46% 52% 53% 49% 52%
10-49 employees 58% 60% 66% 70% 75% 72% 69%
Minimum/Low risk rating 57% 67% 65% 66% 74% 68% 67%
Average/WTA risk rating 40% 35% 45% 48% 51% 48% 49%
Q103 (238) All SMEs seeking new/renewing finance in next 3 months
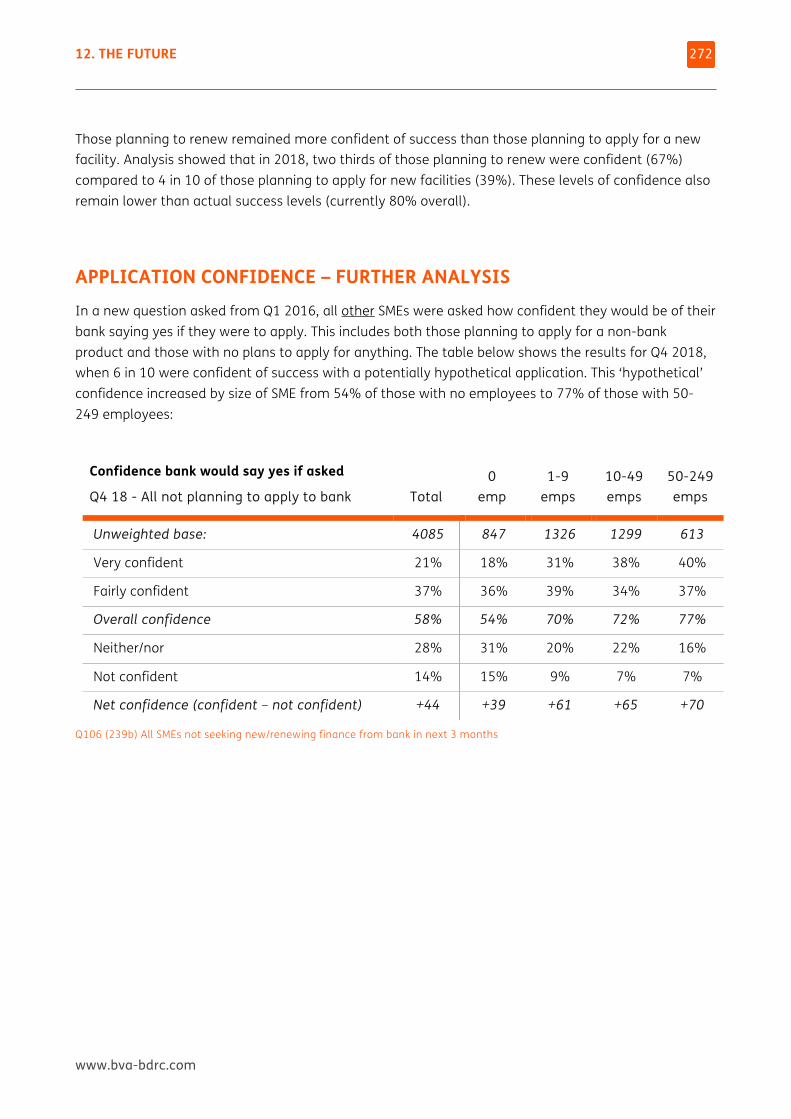
12. THE FUTURE
www.bva-bdrc.com
272
Those planning to renew remained more confident of success than those planning to apply for a new facility. Analysis showed that in 2018, two thirds of those planning to renew were confident (67%) compared to 4 in 10 of those planning to apply for new facilities (39%). These levels of confidence also remain lower than actual success levels (currently 80% overall).
APPLICATION CONFIDENCE – FURTHER ANALYSIS In a new question asked from Q1 2016, all other SMEs were asked how confident they would be of their bank saying yes if they were to apply. This includes both those planning to apply for a non-bank product and those with no plans to apply for anything. The table below shows the results for Q4 2018, when 6 in 10 were confident of success with a potentially hypothetical application. This ‘hypothetical’ confidence increased by size of SME from 54% of those with no employees to 77% of those with 50-249 employees:
Confidence bank would say yes if asked
Q4 18 - All not planning to apply to bank Total 0
emp 1-9
emps 10-49 emps
50-249 emps
Unweighted base: 4085 847 1326 1299 613
Very confident 21% 18% 31% 38% 40%
Fairly confident 37% 36% 39% 34% 37%
Overall confidence 58% 54% 70% 72% 77%
Neither/nor 28% 31% 20% 22% 16%
Not confident 14% 15% 9% 7% 7%
Net confidence (confident – not confident) +44 +39 +61 +65 +70
Q106 (239b) All SMEs not seeking new/renewing finance from bank in next 3 months
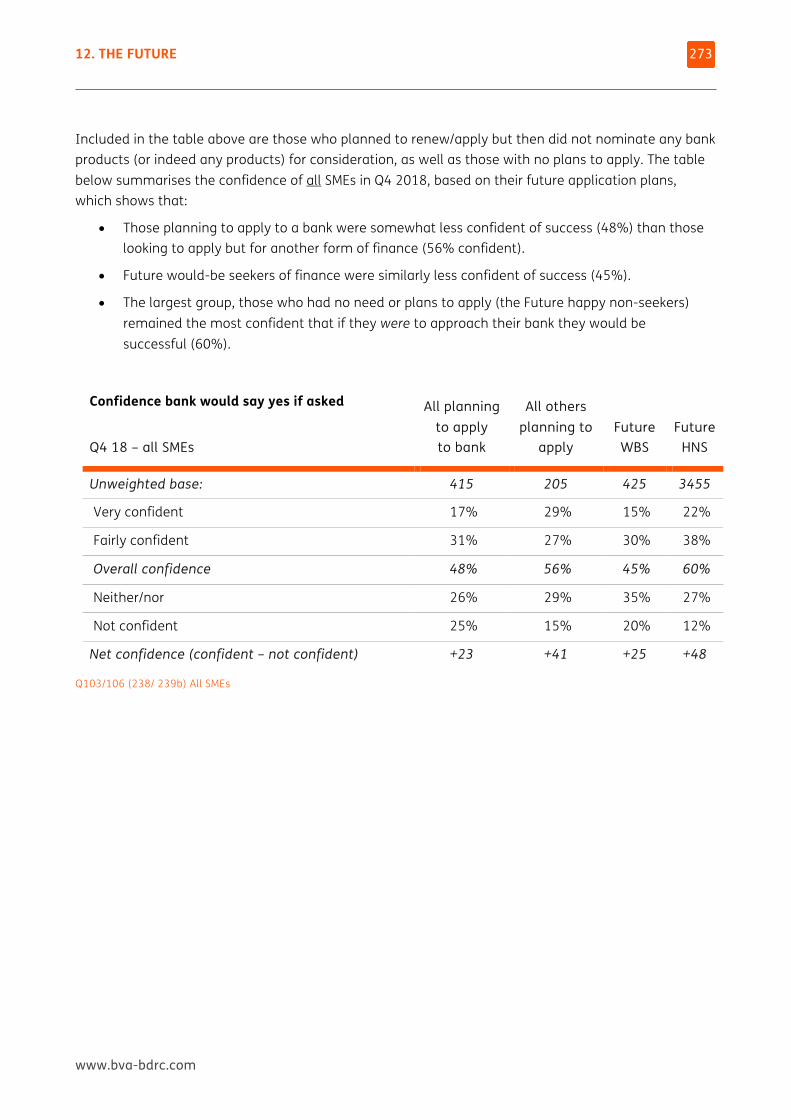
12. THE FUTURE
www.bva-bdrc.com
273
Included in the table above are those who planned to renew/apply but then did not nominate any bank products (or indeed any products) for consideration, as well as those with no plans to apply. The table below summarises the confidence of all SMEs in Q4 2018, based on their future application plans, which shows that:
• Those planning to apply to a bank were somewhat less confident of success (48%) than those looking to apply but for another form of finance (56% confident).
• Future would-be seekers of finance were similarly less confident of success (45%).
• The largest group, those who had no need or plans to apply (the Future happy non-seekers) remained the most confident that if they were to approach their bank they would be successful (60%).
Confidence bank would say yes if asked
Q4 18 – all SMEs
All planning to apply to bank
All others planning to
apply Future WBS
Future HNS
Unweighted base: 415 205 425 3455
Very confident 17% 29% 15% 22%
Fairly confident 31% 27% 30% 38%
Overall confidence 48% 56% 45% 60%
Neither/nor 26% 29% 35% 27%
Not confident 25% 15% 20% 12%
Net confidence (confident – not confident) +23 +41 +25 +48
Q103/106 (238/ 239b) All SMEs
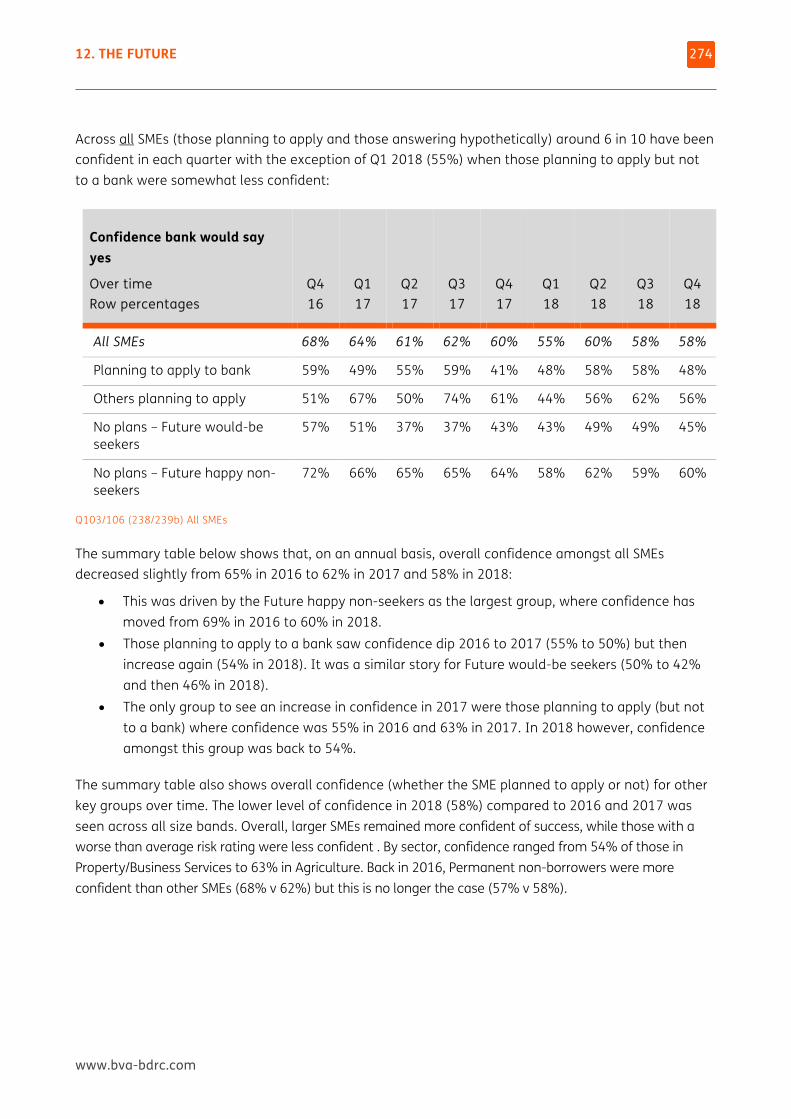
12. THE FUTURE
www.bva-bdrc.com
274
Across all SMEs (those planning to apply and those answering hypothetically) around 6 in 10 have been confident in each quarter with the exception of Q1 2018 (55%) when those planning to apply but not to a bank were somewhat less confident:
Confidence bank would say yes
Over time Row percentages
Q4 16
Q1 17
Q2 17
Q3 17
Q4 17
Q1 18
Q2 18
Q3 18
Q4 18
All SMEs 68% 64% 61% 62% 60% 55% 60% 58% 58%
Planning to apply to bank 59% 49% 55% 59% 41% 48% 58% 58% 48%
Others planning to apply 51% 67% 50% 74% 61% 44% 56% 62% 56%
No plans – Future would-be seekers
57% 51% 37% 37% 43% 43% 49% 49% 45%
No plans – Future happy non-seekers
72% 66% 65% 65% 64% 58% 62% 59% 60%
Q103/106 (238/239b) All SMEs
The summary table below shows that, on an annual basis, overall confidence amongst all SMEs decreased slightly from 65% in 2016 to 62% in 2017 and 58% in 2018:
• This was driven by the Future happy non-seekers as the largest group, where confidence has moved from 69% in 2016 to 60% in 2018.
• Those planning to apply to a bank saw confidence dip 2016 to 2017 (55% to 50%) but then increase again (54% in 2018). It was a similar story for Future would-be seekers (50% to 42% and then 46% in 2018).
• The only group to see an increase in confidence in 2017 were those planning to apply (but not to a bank) where confidence was 55% in 2016 and 63% in 2017. In 2018 however, confidence amongst this group was back to 54%.
The summary table also shows overall confidence (whether the SME planned to apply or not) for other key groups over time. The lower level of confidence in 2018 (58%) compared to 2016 and 2017 was seen across all size bands. Overall, larger SMEs remained more confident of success, while those with a worse than average risk rating were less confident . By sector, confidence ranged from 54% of those in Property/Business Services to 63% in Agriculture. Back in 2016, Permanent non-borrowers were more confident than other SMEs (68% v 62%) but this is no longer the case (57% v 58%).
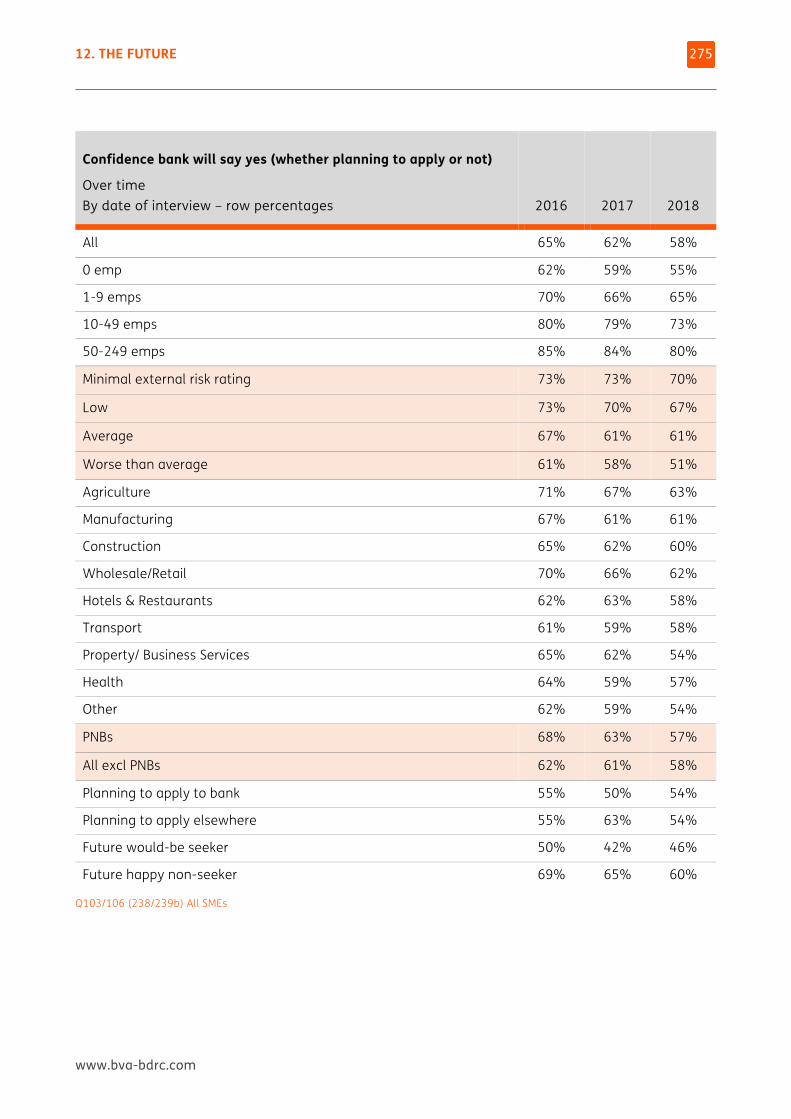
12. THE FUTURE
www.bva-bdrc.com
275
Confidence bank will say yes (whether planning to apply or not)
Over time By date of interview – row percentages 2016 2017 2018
All 65% 62% 58%
0 emp 62% 59% 55%
1-9 emps 70% 66% 65%
10-49 emps 80% 79% 73%
50-249 emps 85% 84% 80%
Minimal external risk rating 73% 73% 70%
Low 73% 70% 67%
Average 67% 61% 61%
Worse than average 61% 58% 51%
Agriculture 71% 67% 63%
Manufacturing 67% 61% 61%
Construction 65% 62% 60%
Wholesale/Retail 70% 66% 62%
Hotels & Restaurants 62% 63% 58%
Transport 61% 59% 58%
Property/ Business Services 65% 62% 54%
Health 64% 59% 57%
Other 62% 59% 54%
PNBs 68% 63% 57%
All excl PNBs 62% 61% 58%
Planning to apply to bank 55% 50% 54%
Planning to apply elsewhere 55% 63% 54%
Future would-be seeker 50% 42% 46%
Future happy non-seeker 69% 65% 60%
Q103/106 (238/239b) All SMEs
12. THE FUTURE
www.bva-bdrc.com
276
THOSE NOT PLANNING TO SEEK OR RENEW FACILITIES IN THE NEXT 3 MONTHS In Q4 2018, 10% of all SMEs reported plans to apply for, or renew, facilities in the following 3 months, leaving the majority (90%) with no such plans. Analysis showed that overall, 56% of all SMEs in Q4 2018 neither used external finance nor had any immediate plans to apply for any.
On an annual basis, the proportion neither using finance nor planning to apply for it increased from 50% of SMEs in 2011 to 60% for 2014 and has been stable since (58-59% for 2015 to 2017 and 61% in 2018).
When thinking about SMEs with no plans to apply/renew, it is important to distinguish between two groups:
• Those that were happy with the decision because they did not need to borrow (more) or already had the facilities they needed – the Future happy non-seekers.
• Those that felt that there were barriers that might stop them making an application (such as discouragement, the economy or the principle or process of borrowing) – the Future would-be seekers.
These Future would-be seekers can then be split into 2 further groups:
• Those that had already identified that they were likely to need external finance in the coming 3 months (and could foresee barriers to an application that met that need).
• Those that thought it unlikely that they would have a need for external finance in the next 3 months but who thought there would be barriers to their applying, were a need to emerge.
As reported later in this chapter, very few of the Future would-be seekers had an actual need for finance already identified, and thus they were a wider group than the Would-be seekers of the past 12 months, all of whom reported having an identified need for finance that they had not applied for.
There have been no changes over time to these definitions, and these questions have been asked in 2018 in the same way as they were in 2017 and previous waves.
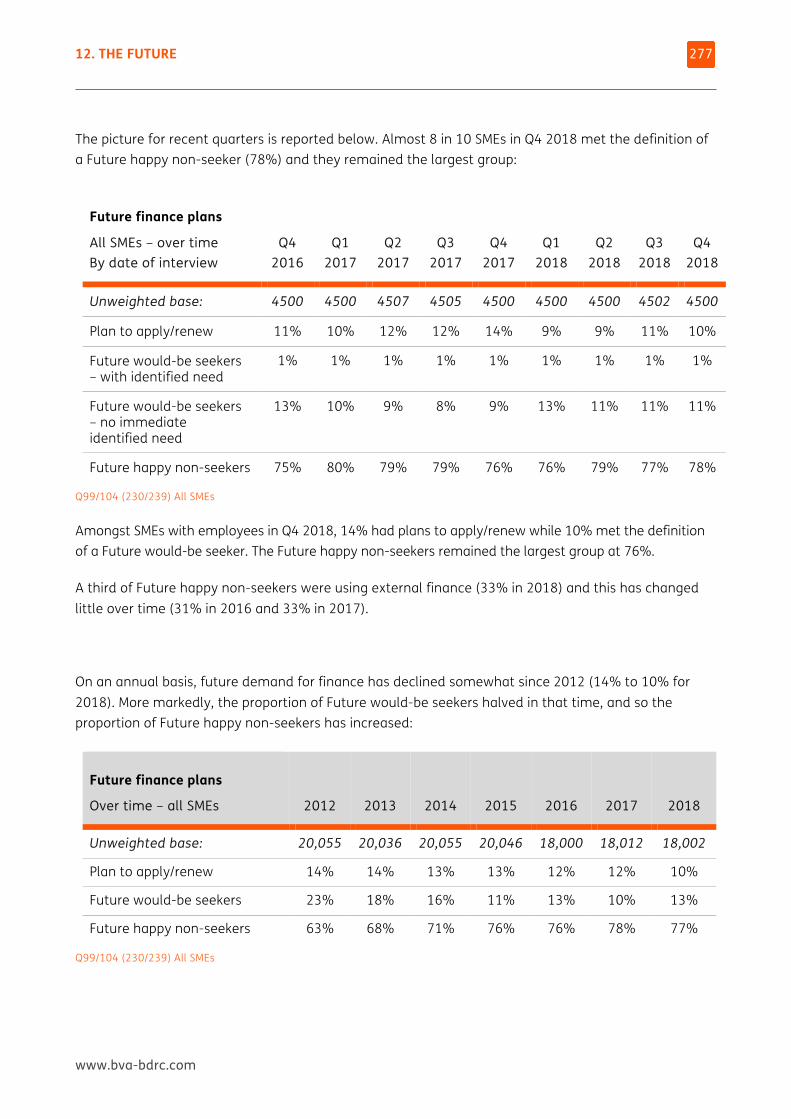
12. THE FUTURE
www.bva-bdrc.com
277
The picture for recent quarters is reported below. Almost 8 in 10 SMEs in Q4 2018 met the definition of a Future happy non-seeker (78%) and they remained the largest group:
Future finance plans
All SMEs – over time By date of interview
Q4 2016
Q1 2017
Q2 2017
Q3 2017
Q4 2017
Q1 2018
Q2 2018
Q3 2018
Q4 2018
Unweighted base: 4500 4500 4507 4505 4500 4500 4500 4502 4500
Plan to apply/renew 11% 10% 12% 12% 14% 9% 9% 11% 10%
Future would-be seekers – with identified need
1% 1% 1% 1% 1% 1% 1% 1% 1%
Future would-be seekers – no immediate identified need
13% 10% 9% 8% 9% 13% 11% 11% 11%
Future happy non-seekers 75% 80% 79% 79% 76% 76% 79% 77% 78%
Q99/104 (230/239) All SMEs
Amongst SMEs with employees in Q4 2018, 14% had plans to apply/renew while 10% met the definition of a Future would-be seeker. The Future happy non-seekers remained the largest group at 76%.
A third of Future happy non-seekers were using external finance (33% in 2018) and this has changed little over time (31% in 2016 and 33% in 2017).
On an annual basis, future demand for finance has declined somewhat since 2012 (14% to 10% for 2018). More markedly, the proportion of Future would-be seekers halved in that time, and so the proportion of Future happy non-seekers has increased:
Future finance plans
Over time – all SMEs 2012 2013 2014 2015
2016 2017 2018
Unweighted base: 20,055 20,036 20,055 20,046 18,000 18,012 18,002
Plan to apply/renew 14% 14% 13% 13% 12% 12% 10%
Future would-be seekers 23% 18% 16% 11% 13% 10% 13%
Future happy non-seekers 63% 68% 71% 76% 76% 78% 77%
Q99/104 (230/239) All SMEs
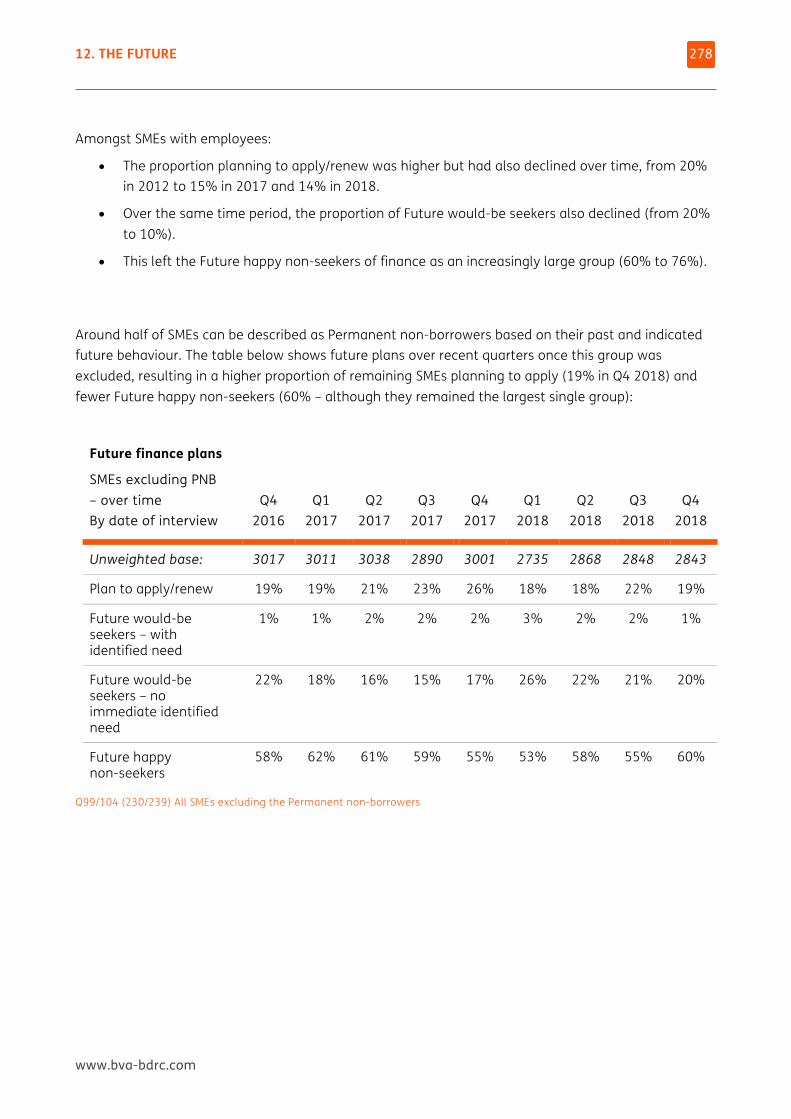
12. THE FUTURE
www.bva-bdrc.com
278
Amongst SMEs with employees:
• The proportion planning to apply/renew was higher but had also declined over time, from 20% in 2012 to 15% in 2017 and 14% in 2018.
• Over the same time period, the proportion of Future would-be seekers also declined (from 20% to 10%).
• This left the Future happy non-seekers of finance as an increasingly large group (60% to 76%).
Around half of SMEs can be described as Permanent non-borrowers based on their past and indicated future behaviour. The table below shows future plans over recent quarters once this group was excluded, resulting in a higher proportion of remaining SMEs planning to apply (19% in Q4 2018) and fewer Future happy non-seekers (60% – although they remained the largest single group):
Future finance plans
SMEs excluding PNB – over time By date of interview
Q4 2016
Q1 2017
Q2 2017
Q3 2017
Q4 2017
Q1 2018
Q2 2018
Q3 2018
Q4 2018
Unweighted base: 3017 3011 3038 2890 3001 2735 2868 2848 2843
Plan to apply/renew 19% 19% 21% 23% 26% 18% 18% 22% 19%
Future would-be seekers – with identified need
1% 1% 2% 2% 2% 3% 2% 2% 1%
Future would-be seekers – no immediate identified need
22% 18% 16% 15% 17% 26% 22% 21% 20%
Future happy non-seekers
58% 62% 61% 59% 55% 53% 58% 55% 60%
Q99/104 (230/239) All SMEs excluding the Permanent non-borrowers
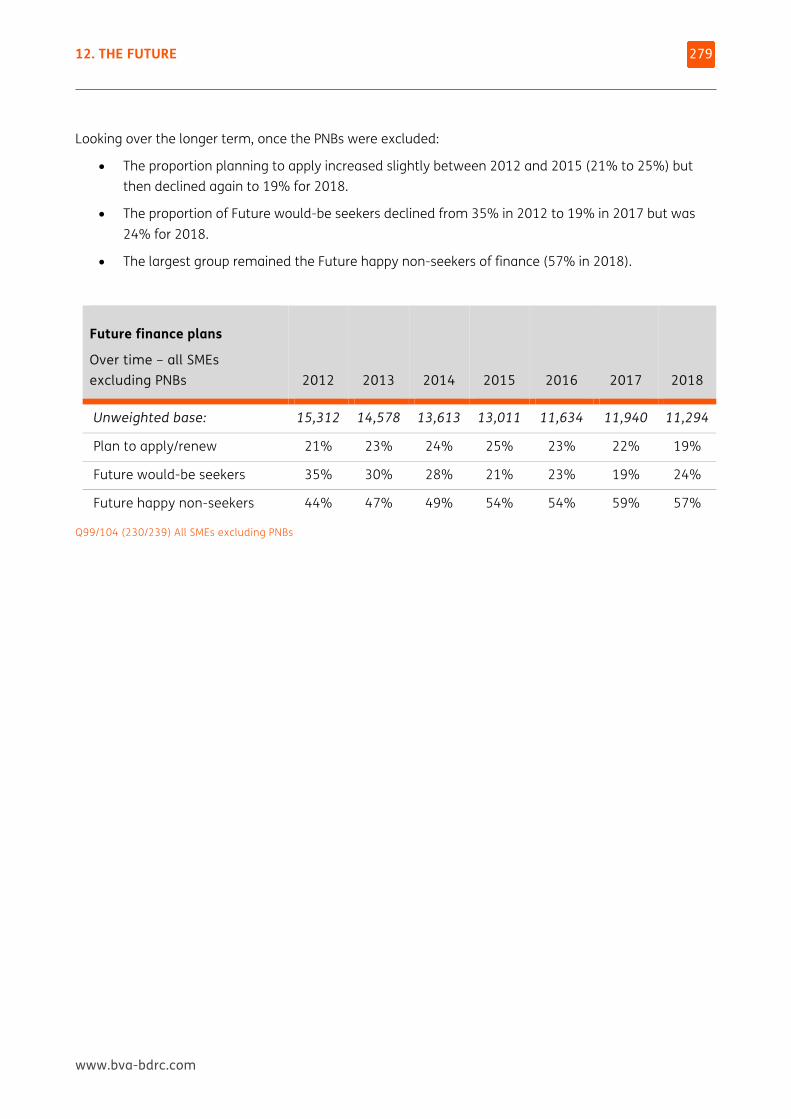
12. THE FUTURE
www.bva-bdrc.com
279
Looking over the longer term, once the PNBs were excluded:
• The proportion planning to apply increased slightly between 2012 and 2015 (21% to 25%) but then declined again to 19% for 2018.
• The proportion of Future would-be seekers declined from 35% in 2012 to 19% in 2017 but was 24% for 2018.
• The largest group remained the Future happy non-seekers of finance (57% in 2018).
Future finance plans
Over time – all SMEs excluding PNBs 2012 2013 2014 2015
2016 2017 2018
Unweighted base: 15,312 14,578 13,613 13,011 11,634 11,940 11,294
Plan to apply/renew 21% 23% 24% 25% 23% 22% 19%
Future would-be seekers 35% 30% 28% 21% 23% 19% 24%
Future happy non-seekers 44% 47% 49% 54% 54% 59% 57%
Q99/104 (230/239) All SMEs excluding PNBs
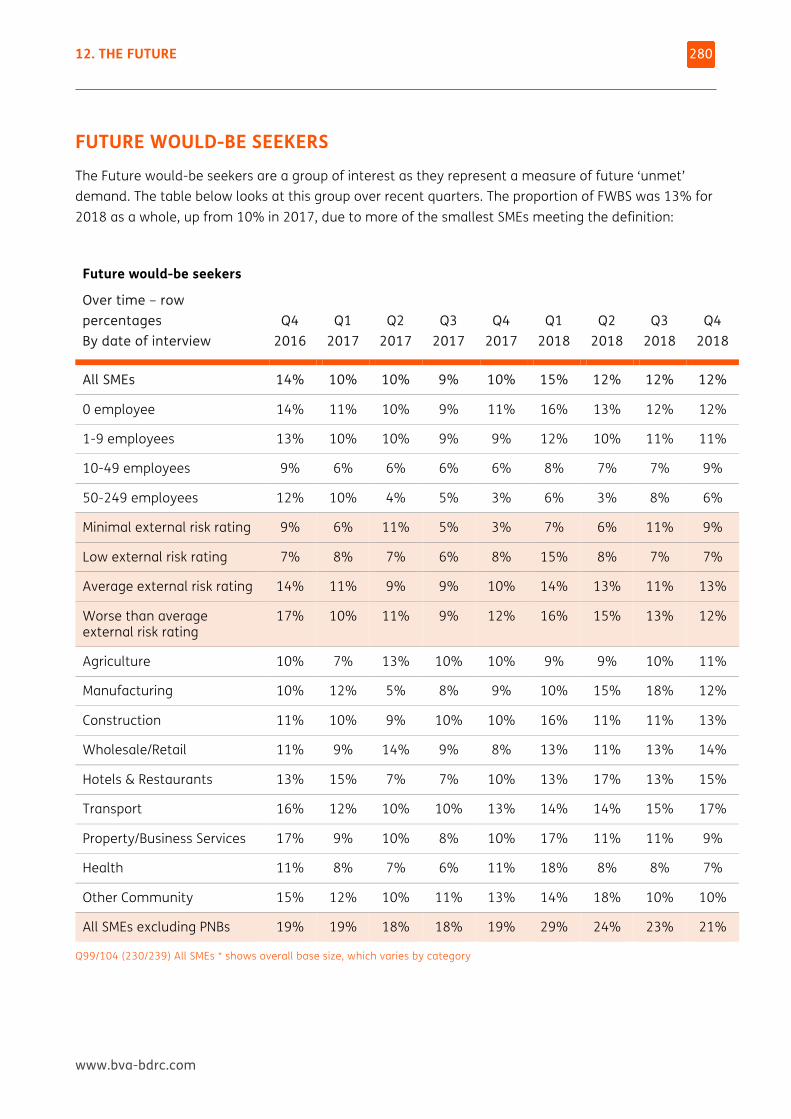
12. THE FUTURE
www.bva-bdrc.com
280
FUTURE WOULD-BE SEEKERS The Future would-be seekers are a group of interest as they represent a measure of future ‘unmet’ demand. The table below looks at this group over recent quarters. The proportion of FWBS was 13% for 2018 as a whole, up from 10% in 2017, due to more of the smallest SMEs meeting the definition:
Future would-be seekers
Over time – row percentages By date of interview
Q4 2016
Q1 2017
Q2 2017
Q3 2017
Q4 2017
Q1 2018
Q2 2018
Q3 2018
Q4 2018
All SMEs 14% 10% 10% 9% 10% 15% 12% 12% 12%
0 employee 14% 11% 10% 9% 11% 16% 13% 12% 12%
1-9 employees 13% 10% 10% 9% 9% 12% 10% 11% 11%
10-49 employees 9% 6% 6% 6% 6% 8% 7% 7% 9%
50-249 employees 12% 10% 4% 5% 3% 6% 3% 8% 6%
Minimal external risk rating 9% 6% 11% 5% 3% 7% 6% 11% 9%
Low external risk rating 7% 8% 7% 6% 8% 15% 8% 7% 7%
Average external risk rating 14% 11% 9% 9% 10% 14% 13% 11% 13%
Worse than average external risk rating
17% 10% 11% 9% 12% 16% 15% 13% 12%
Agriculture 10% 7% 13% 10% 10% 9% 9% 10% 11%
Manufacturing 10% 12% 5% 8% 9% 10% 15% 18% 12%
Construction 11% 10% 9% 10% 10% 16% 11% 11% 13%
Wholesale/Retail 11% 9% 14% 9% 8% 13% 11% 13% 14%
Hotels & Restaurants 13% 15% 7% 7% 10% 13% 17% 13% 15%
Transport 16% 12% 10% 10% 13% 14% 14% 15% 17%
Property/Business Services 17% 9% 10% 8% 10% 17% 11% 11% 9%
Health 11% 8% 7% 6% 11% 18% 8% 8% 7%
Other Community 15% 12% 10% 11% 13% 14% 18% 10% 10%
All SMEs excluding PNBs 19% 19% 18% 18% 19% 29% 24% 23% 21%
Q99/104 (230/239) All SMEs * shows overall base size, which varies by category
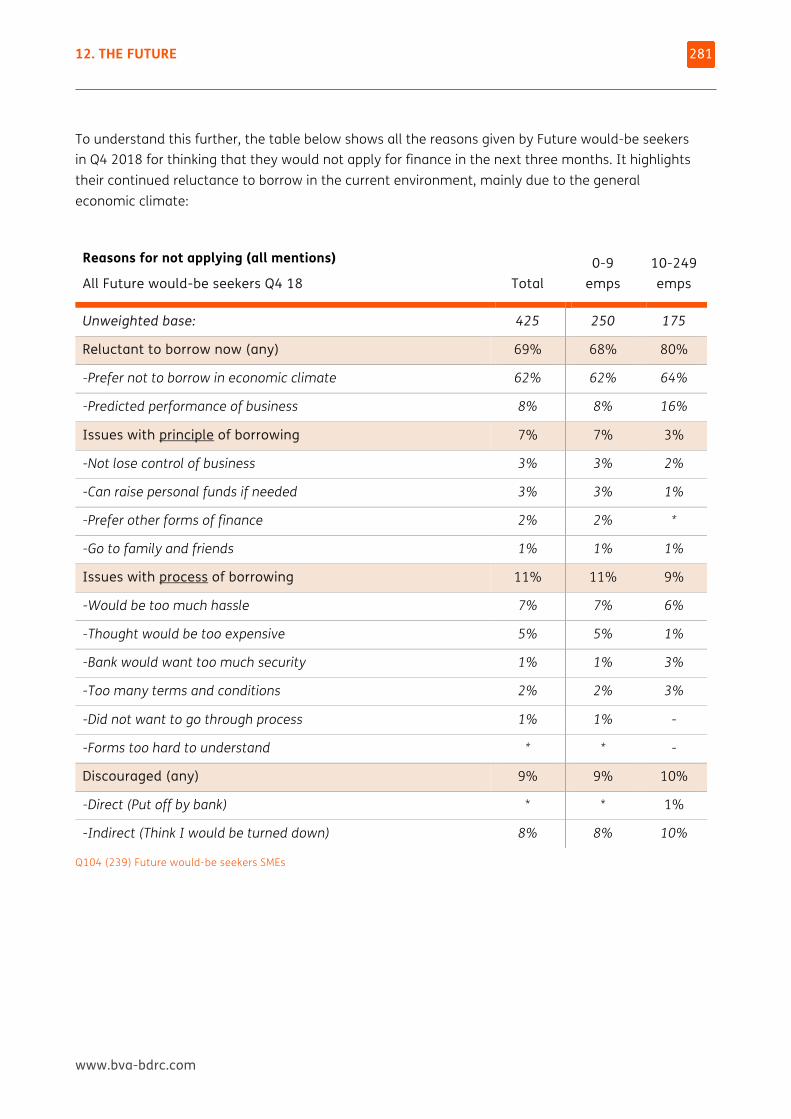
12. THE FUTURE
www.bva-bdrc.com
281
To understand this further, the table below shows all the reasons given by Future would-be seekers in Q4 2018 for thinking that they would not apply for finance in the next three months. It highlights their continued reluctance to borrow in the current environment, mainly due to the general economic climate:
Reasons for not applying (all mentions)
All Future would-be seekers Q4 18 Total 0-9
emps 10-249 emps
Unweighted base: 425 250 175
Reluctant to borrow now (any) 69% 68% 80%
-Prefer not to borrow in economic climate 62% 62% 64%
-Predicted performance of business 8% 8% 16%
Issues with principle of borrowing 7% 7% 3%
-Not lose control of business 3% 3% 2%
-Can raise personal funds if needed 3% 3% 1%
-Prefer other forms of finance 2% 2% *
-Go to family and friends 1% 1% 1%
Issues with process of borrowing 11% 11% 9%
-Would be too much hassle 7% 7% 6%
-Thought would be too expensive 5% 5% 1%
-Bank would want too much security 1% 1% 3%
-Too many terms and conditions 2% 2% 3%
-Did not want to go through process 1% 1% -
-Forms too hard to understand * * -
Discouraged (any) 9% 9% 10%
-Direct (Put off by bank) * * 1%
-Indirect (Think I would be turned down) 8% 8% 10%
Q104 (239) Future would-be seekers SMEs
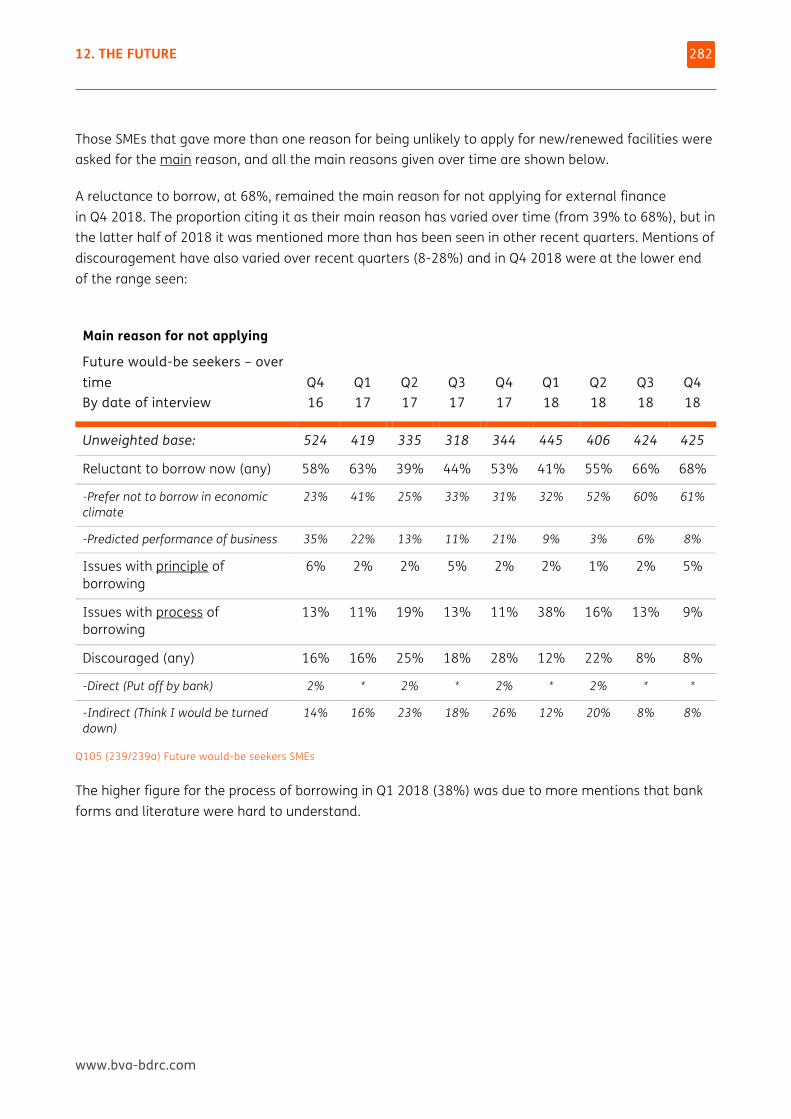
12. THE FUTURE
www.bva-bdrc.com
282
Those SMEs that gave more than one reason for being unlikely to apply for new/renewed facilities were asked for the main reason, and all the main reasons given over time are shown below.
A reluctance to borrow, at 68%, remained the main reason for not applying for external finance in Q4 2018. The proportion citing it as their main reason has varied over time (from 39% to 68%), but in the latter half of 2018 it was mentioned more than has been seen in other recent quarters. Mentions of discouragement have also varied over recent quarters (8-28%) and in Q4 2018 were at the lower end of the range seen:
Main reason for not applying
Future would-be seekers – over time By date of interview
Q4 16
Q1 17
Q2 17
Q3 17
Q4 17
Q1 18
Q2 18
Q3 18
Q4 18
Unweighted base: 524 419 335 318 344 445 406 424 425
Reluctant to borrow now (any) 58% 63% 39% 44% 53% 41% 55% 66% 68%
-Prefer not to borrow in economic climate
23% 41% 25% 33% 31% 32% 52% 60% 61%
-Predicted performance of business 35% 22% 13% 11% 21% 9% 3% 6% 8%
Issues with principle of borrowing
6% 2% 2% 5% 2% 2% 1% 2% 5%
Issues with process of borrowing
13% 11% 19% 13% 11% 38% 16% 13% 9%
Discouraged (any) 16% 16% 25% 18% 28% 12% 22% 8% 8%
-Direct (Put off by bank) 2% * 2% * 2% * 2% * *
-Indirect (Think I would be turned down)
14% 16% 23% 18% 26% 12% 20% 8% 8%
Q105 (239/239a) Future would-be seekers SMEs
The higher figure for the process of borrowing in Q1 2018 (38%) was due to more mentions that bank forms and literature were hard to understand.
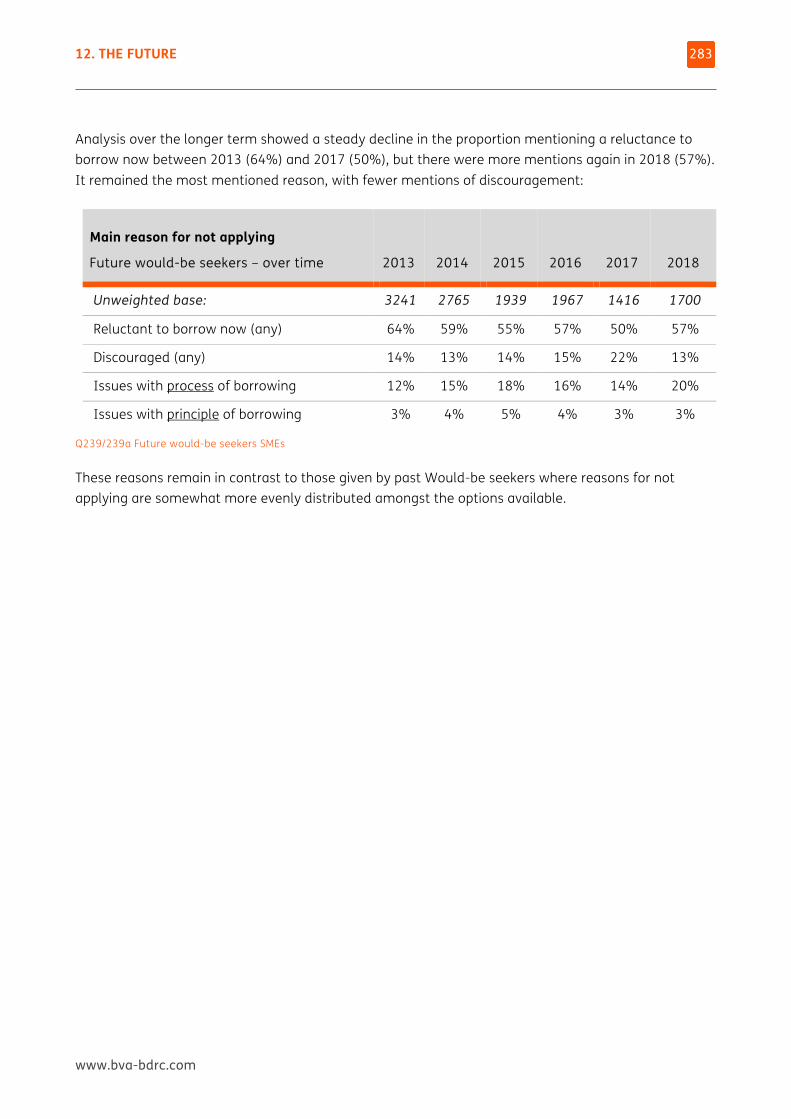
12. THE FUTURE
www.bva-bdrc.com
283
Analysis over the longer term showed a steady decline in the proportion mentioning a reluctance to borrow now between 2013 (64%) and 2017 (50%), but there were more mentions again in 2018 (57%). It remained the most mentioned reason, with fewer mentions of discouragement:
Main reason for not applying
Future would-be seekers – over time 2013 2014 2015
2016 2017 2018
Unweighted base: 3241 2765 1939 1967 1416 1700
Reluctant to borrow now (any) 64% 59% 55% 57% 50% 57%
Discouraged (any) 14% 13% 14% 15% 22% 13%
Issues with process of borrowing 12% 15% 18% 16% 14% 20%
Issues with principle of borrowing 3% 4% 5% 4% 3% 3%
Q239/239a Future would-be seekers SMEs
These reasons remain in contrast to those given by past Would-be seekers where reasons for not applying are somewhat more evenly distributed amongst the options available.
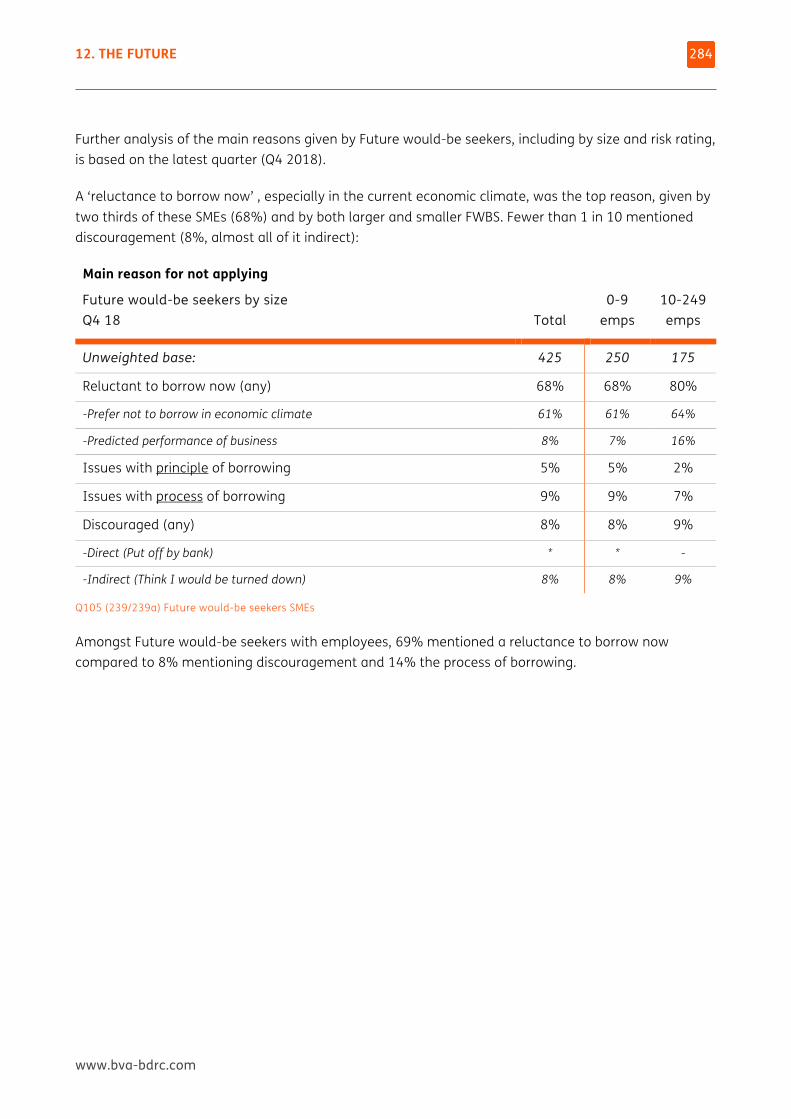
12. THE FUTURE
www.bva-bdrc.com
284
Further analysis of the main reasons given by Future would-be seekers, including by size and risk rating, is based on the latest quarter (Q4 2018).
A ‘reluctance to borrow now’ , especially in the current economic climate, was the top reason, given by two thirds of these SMEs (68%) and by both larger and smaller FWBS. Fewer than 1 in 10 mentioned discouragement (8%, almost all of it indirect):
Main reason for not applying
Future would-be seekers by size Q4 18 Total
0-9 emps
10-249 emps
Unweighted base: 425 250 175
Reluctant to borrow now (any) 68% 68% 80%
-Prefer not to borrow in economic climate 61% 61% 64%
-Predicted performance of business 8% 7% 16%
Issues with principle of borrowing 5% 5% 2%
Issues with process of borrowing 9% 9% 7%
Discouraged (any) 8% 8% 9%
-Direct (Put off by bank) * * -
-Indirect (Think I would be turned down) 8% 8% 9%
Q105 (239/239a) Future would-be seekers SMEs
Amongst Future would-be seekers with employees, 69% mentioned a reluctance to borrow now compared to 8% mentioning discouragement and 14% the process of borrowing.
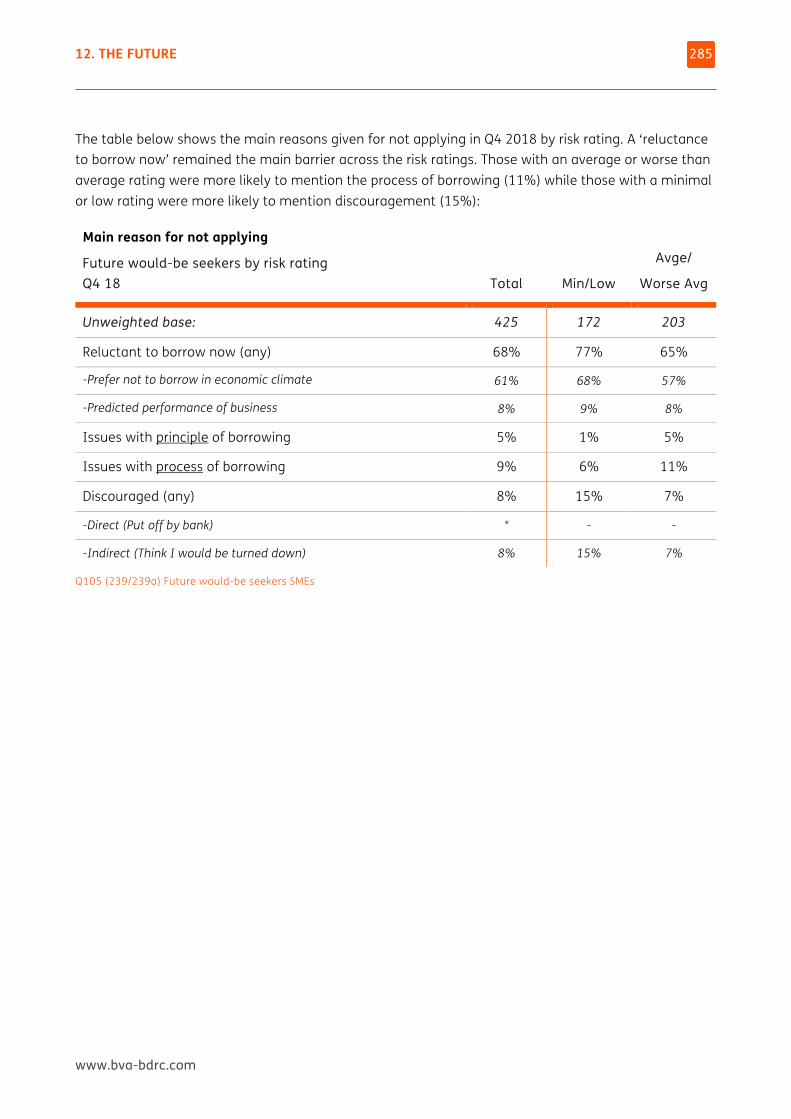
12. THE FUTURE
www.bva-bdrc.com
285
The table below shows the main reasons given for not applying in Q4 2018 by risk rating. A ‘reluctance to borrow now’ remained the main barrier across the risk ratings. Those with an average or worse than average rating were more likely to mention the process of borrowing (11%) while those with a minimal or low rating were more likely to mention discouragement (15%):
Main reason for not applying
Future would-be seekers by risk rating Q4 18 Total Min/Low
Avge/
Worse Avg
Unweighted base: 425 172 203
Reluctant to borrow now (any) 68% 77% 65%
-Prefer not to borrow in economic climate 61% 68% 57%
-Predicted performance of business 8% 9% 8%
Issues with principle of borrowing 5% 1% 5%
Issues with process of borrowing 9% 6% 11%
Discouraged (any) 8% 15% 7%
-Direct (Put off by bank) * - -
-Indirect (Think I would be turned down) 8% 15% 7%
Q105 (239/239a) Future would-be seekers SMEs
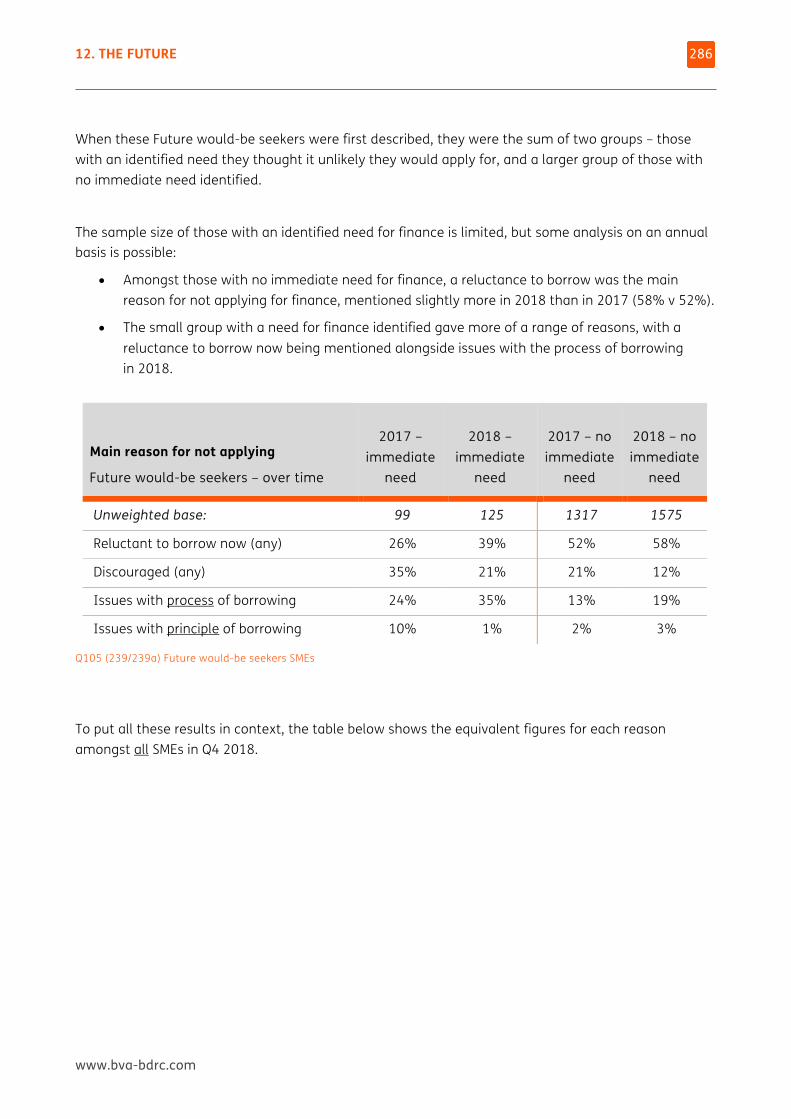
12. THE FUTURE
www.bva-bdrc.com
286
When these Future would-be seekers were first described, they were the sum of two groups – those with an identified need they thought it unlikely they would apply for, and a larger group of those with no immediate need identified.
The sample size of those with an identified need for finance is limited, but some analysis on an annual basis is possible:
• Amongst those with no immediate need for finance, a reluctance to borrow was the main reason for not applying for finance, mentioned slightly more in 2018 than in 2017 (58% v 52%).
• The small group with a need for finance identified gave more of a range of reasons, with a reluctance to borrow now being mentioned alongside issues with the process of borrowing in 2018.
Main reason for not applying
Future would-be seekers – over time
2017 – immediate
need
2018 – immediate
need
2017 – no immediate
need
2018 – no immediate
need
Unweighted base: 99 125 1317 1575
Reluctant to borrow now (any) 26% 39% 52% 58%
Discouraged (any) 35% 21% 21% 12%
Issues with process of borrowing 24% 35% 13% 19%
Issues with principle of borrowing 10% 1% 2% 3%
Q105 (239/239a) Future would-be seekers SMEs
To put all these results in context, the table below shows the equivalent figures for each reason amongst all SMEs in Q4 2018.
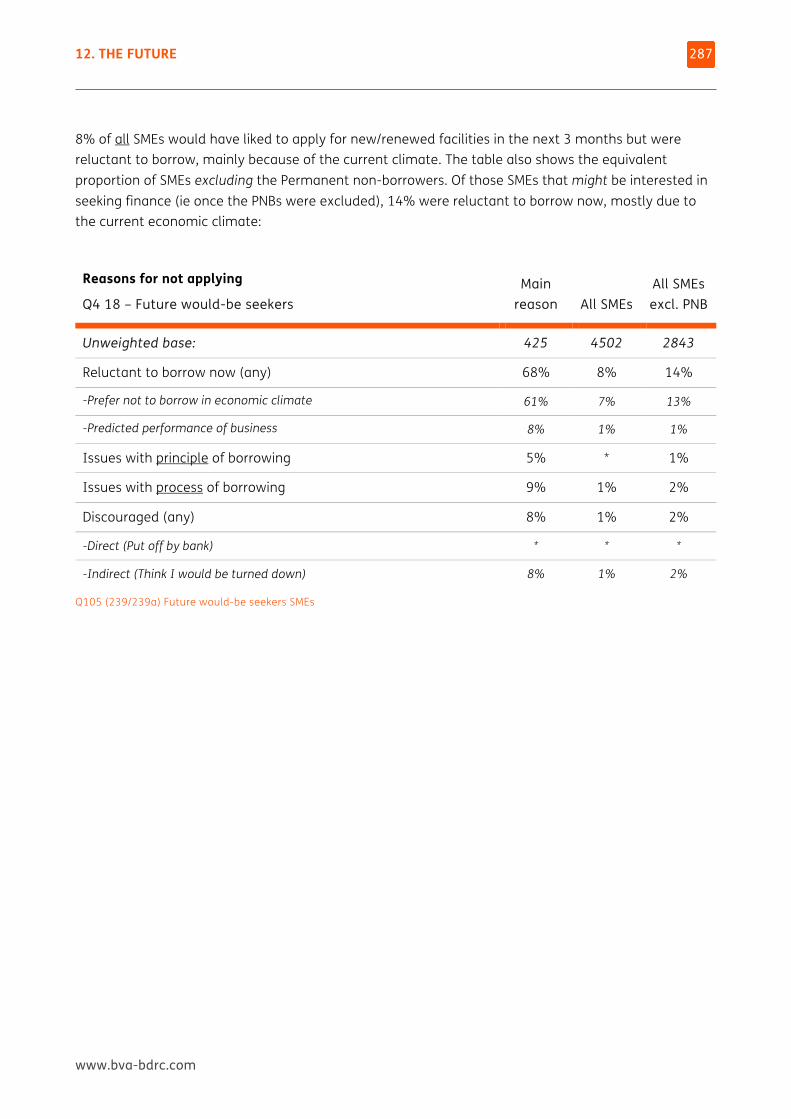
12. THE FUTURE
www.bva-bdrc.com
287
8% of all SMEs would have liked to apply for new/renewed facilities in the next 3 months but were reluctant to borrow, mainly because of the current climate. The table also shows the equivalent proportion of SMEs excluding the Permanent non-borrowers. Of those SMEs that might be interested in seeking finance (ie once the PNBs were excluded), 14% were reluctant to borrow now, mostly due to the current economic climate:
Reasons for not applying
Q4 18 – Future would-be seekers Main
reason All SMEs All SMEs excl. PNB
Unweighted base: 425 4502 2843
Reluctant to borrow now (any) 68% 8% 14%
-Prefer not to borrow in economic climate 61% 7% 13%
-Predicted performance of business 8% 1% 1%
Issues with principle of borrowing 5% * 1%
Issues with process of borrowing 9% 1% 2%
Discouraged (any) 8% 1% 2%
-Direct (Put off by bank) * * *
-Indirect (Think I would be turned down) 8% 1% 2%
Q105 (239/239a) Future would-be seekers SMEs
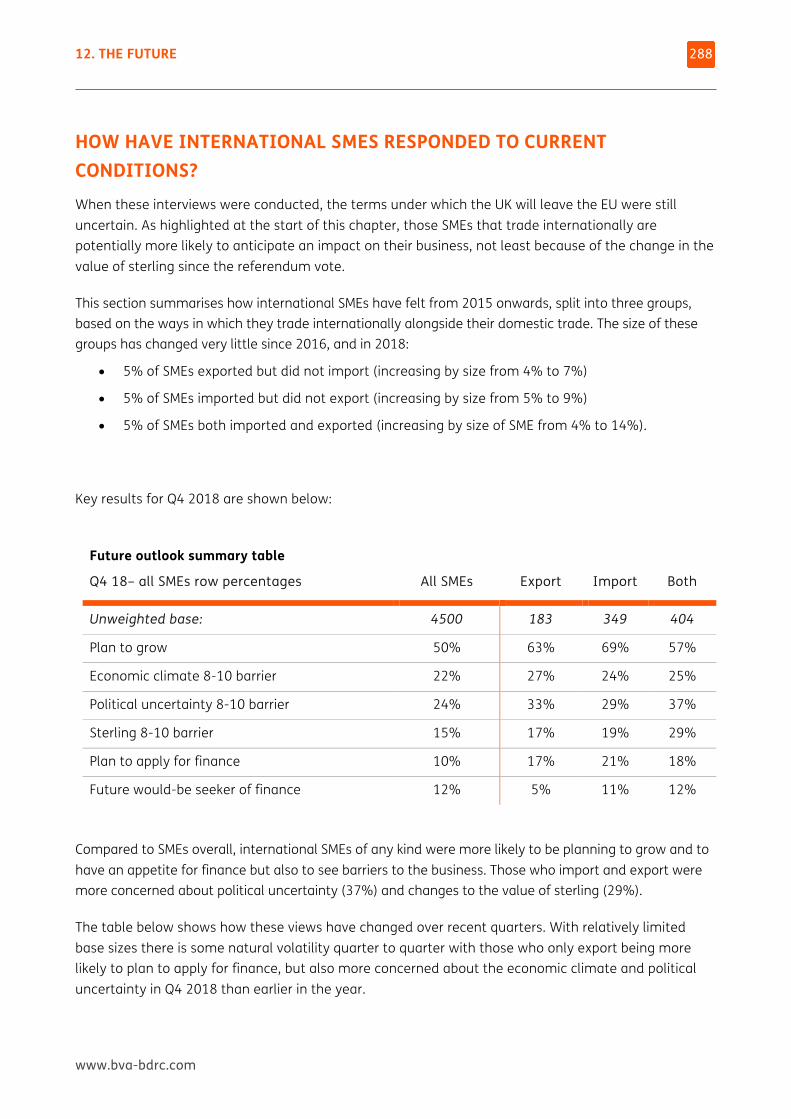
12. THE FUTURE
www.bva-bdrc.com
288
HOW HAVE INTERNATIONAL SMES RESPONDED TO CURRENT CONDITIONS? When these interviews were conducted, the terms under which the UK will leave the EU were still uncertain. As highlighted at the start of this chapter, those SMEs that trade internationally are potentially more likely to anticipate an impact on their business, not least because of the change in the value of sterling since the referendum vote.
This section summarises how international SMEs have felt from 2015 onwards, split into three groups, based on the ways in which they trade internationally alongside their domestic trade. The size of these groups has changed very little since 2016, and in 2018:
• 5% of SMEs exported but did not import (increasing by size from 4% to 7%)
• 5% of SMEs imported but did not export (increasing by size from 5% to 9%)
• 5% of SMEs both imported and exported (increasing by size of SME from 4% to 14%).
Key results for Q4 2018 are shown below:
Future outlook summary table
Q4 18– all SMEs row percentages All SMEs Export Import Both
Unweighted base: 4500 183 349 404
Plan to grow 50% 63% 69% 57%
Economic climate 8-10 barrier 22% 27% 24% 25%
Political uncertainty 8-10 barrier 24% 33% 29% 37%
Sterling 8-10 barrier 15% 17% 19% 29%
Plan to apply for finance 10% 17% 21% 18%
Future would-be seeker of finance 12% 5% 11% 12%
Compared to SMEs overall, international SMEs of any kind were more likely to be planning to grow and to have an appetite for finance but also to see barriers to the business. Those who import and export were more concerned about political uncertainty (37%) and changes to the value of sterling (29%).
The table below shows how these views have changed over recent quarters. With relatively limited base sizes there is some natural volatility quarter to quarter with those who only export being more likely to plan to apply for finance, but also more concerned about the economic climate and political uncertainty in Q4 2018 than earlier in the year.
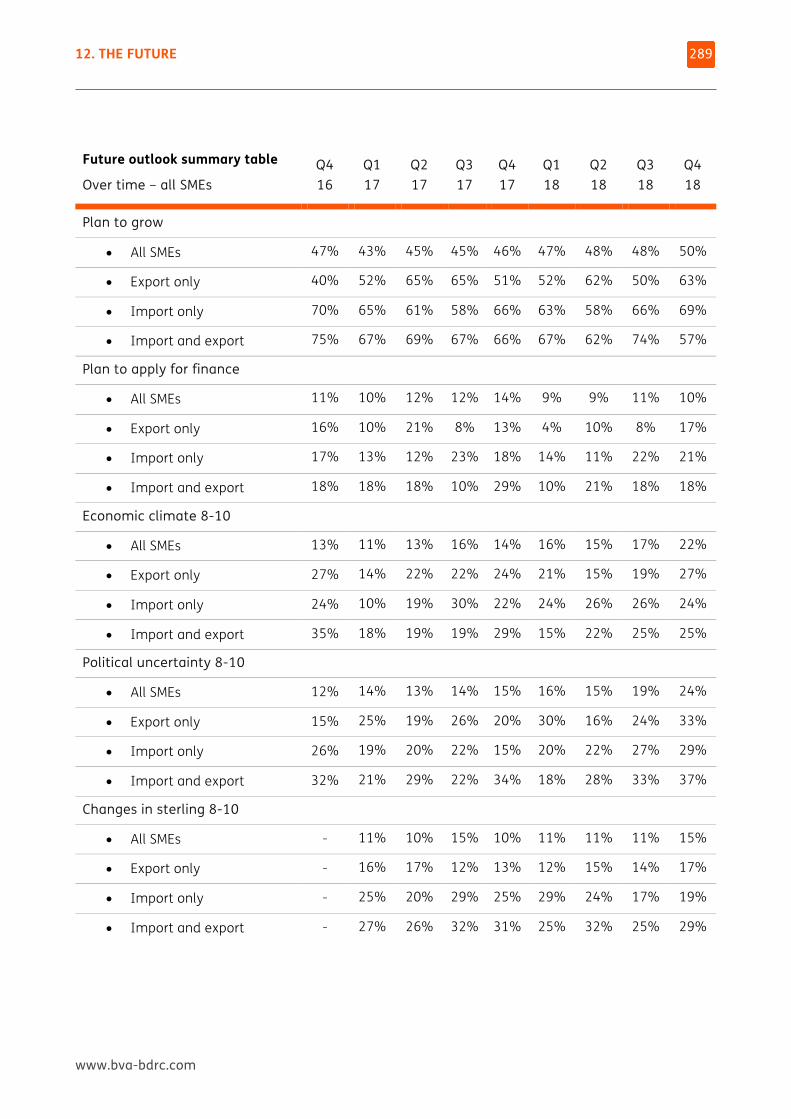
12. THE FUTURE
www.bva-bdrc.com
289
Future outlook summary table
Over time – all SMEs Q4 16
Q1 17
Q2 17
Q3 17
Q4 17
Q1 18
Q2 18
Q3 18
Q4 18
Plan to grow
• All SMEs 47% 43% 45% 45% 46% 47% 48% 48% 50%
• Export only 40% 52% 65% 65% 51% 52% 62% 50% 63%
• Import only 70% 65% 61% 58% 66% 63% 58% 66% 69%
• Import and export 75% 67% 69% 67% 66% 67% 62% 74% 57%
Plan to apply for finance
• All SMEs 11% 10% 12% 12% 14% 9% 9% 11% 10%
• Export only 16% 10% 21% 8% 13% 4% 10% 8% 17%
• Import only 17% 13% 12% 23% 18% 14% 11% 22% 21%
• Import and export 18% 18% 18% 10% 29% 10% 21% 18% 18%
Economic climate 8-10
• All SMEs 13% 11% 13% 16% 14% 16% 15% 17% 22%
• Export only 27% 14% 22% 22% 24% 21% 15% 19% 27%
• Import only 24% 10% 19% 30% 22% 24% 26% 26% 24%
• Import and export 35% 18% 19% 19% 29% 15% 22% 25% 25%
Political uncertainty 8-10
• All SMEs 12% 14% 13% 14% 15% 16% 15% 19% 24%
• Export only 15% 25% 19% 26% 20% 30% 16% 24% 33%
• Import only 26% 19% 20% 22% 15% 20% 22% 27% 29%
• Import and export 32% 21% 29% 22% 34% 18% 28% 33% 37%
Changes in sterling 8-10
• All SMEs - 11% 10% 15% 10% 11% 11% 11% 15%
• Export only - 16% 17% 12% 13% 12% 15% 14% 17%
• Import only - 25% 20% 29% 25% 29% 24% 17% 19%
• Import and export - 27% 26% 32% 31% 25% 32% 25% 29%
12. THE FUTURE
www.bva-bdrc.com
290
The second table takes a longer term view back to 2013 where data exists. This shows the following patterns:
• Exporters have always been more likely to be planning to grow than SMEs generally, but ambition dipped in 2016, before recovering in 2017 and 2018 (56%). Their future appetite for finance peaked at 22% in 2015 and is currently 10%, albeit this is in line with the market. They became more worried about political uncertainty in 2017 and maintained this concern in 2018 (25%), while concerns about the economic climate have been more stable since 2015.
• Importers too have always been more likely to be planning to grow than SMEs generally, and a stable 6 in 10 have been planning to grow. Their appetite for finance has declined since 2014 but at 17% in 2018 is ahead of SMEs overall. Levels of concern about both the economic climate and political uncertainty have increased somewhat since 2015 with a quarter concerned about each barrier and also about changes in the value of sterling.
• Those who import and export have also always been more likely to be planning to grow than SMEs generally, peaking at 72% in 2015 and declining somewhat since (to 64% in 2018). They have more of an appetite for finance than SMEs generally, but it has varied over time and was somewhat lower in 2017 and 2018 than in 2016. Levels of concern about the economic climate and changes in the value of sterling are stable but higher than for SMEs overall, with a slight increase seen in levels of concern about political uncertainty in 2018.
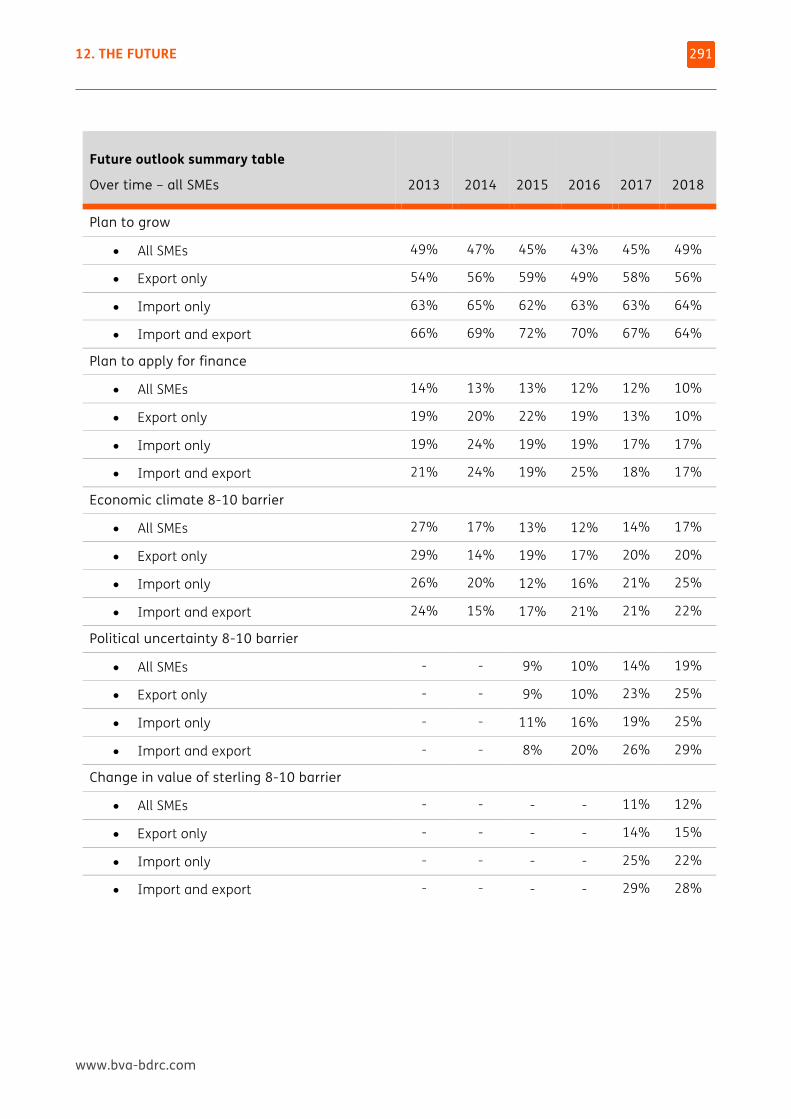
12. THE FUTURE
www.bva-bdrc.com
291
Future outlook summary table
Over time – all SMEs 2013 2014 2015 2016 2017 2018
Plan to grow
• All SMEs 49% 47% 45% 43% 45% 49%
• Export only 54% 56% 59% 49% 58% 56%
• Import only 63% 65% 62% 63% 63% 64%
• Import and export 66% 69% 72% 70% 67% 64%
Plan to apply for finance
• All SMEs 14% 13% 13% 12% 12% 10%
• Export only 19% 20% 22% 19% 13% 10%
• Import only 19% 24% 19% 19% 17% 17%
• Import and export 21% 24% 19% 25% 18% 17%
Economic climate 8-10 barrier
• All SMEs 27% 17% 13% 12% 14% 17%
• Export only 29% 14% 19% 17% 20% 20%
• Import only 26% 20% 12% 16% 21% 25%
• Import and export 24% 15% 17% 21% 21% 22%
Political uncertainty 8-10 barrier
• All SMEs - - 9% 10% 14% 19%
• Export only - - 9% 10% 23% 25%
• Import only - - 11% 16% 19% 25%
• Import and export - - 8% 20% 26% 29%
Change in value of sterling 8-10 barrier
• All SMEs - - - - 11% 12%
• Export only - - - - 14% 15%
• Import only - - - - 25% 22%
• Import and export - - - - 29% 28%
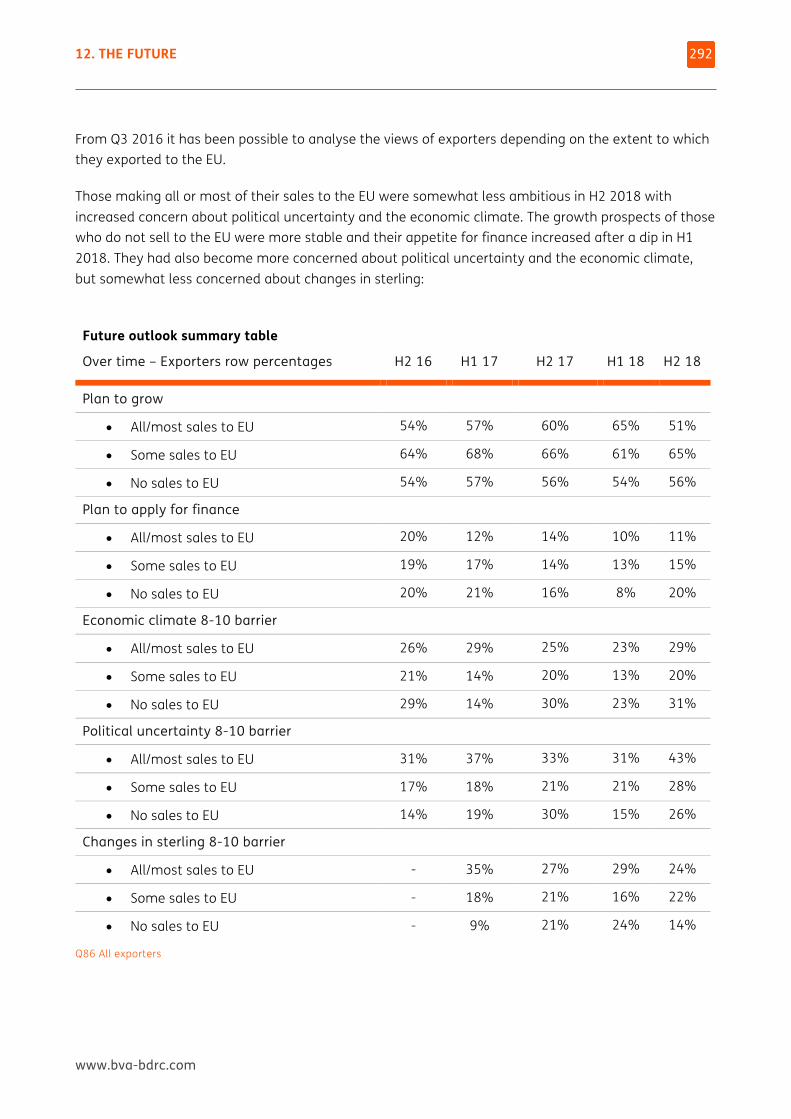
12. THE FUTURE
www.bva-bdrc.com
292
From Q3 2016 it has been possible to analyse the views of exporters depending on the extent to which they exported to the EU.
Those making all or most of their sales to the EU were somewhat less ambitious in H2 2018 with increased concern about political uncertainty and the economic climate. The growth prospects of those who do not sell to the EU were more stable and their appetite for finance increased after a dip in H1 2018. They had also become more concerned about political uncertainty and the economic climate, but somewhat less concerned about changes in sterling:
Future outlook summary table
Over time – Exporters row percentages H2 16 H1 17 H2 17 H1 18 H2 18
Plan to grow
• All/most sales to EU 54% 57% 60% 65% 51%
• Some sales to EU 64% 68% 66% 61% 65%
• No sales to EU 54% 57% 56% 54% 56%
Plan to apply for finance
• All/most sales to EU 20% 12% 14% 10% 11%
• Some sales to EU 19% 17% 14% 13% 15%
• No sales to EU 20% 21% 16% 8% 20%
Economic climate 8-10 barrier
• All/most sales to EU 26% 29% 25% 23% 29%
• Some sales to EU 21% 14% 20% 13% 20%
• No sales to EU 29% 14% 30% 23% 31%
Political uncertainty 8-10 barrier
• All/most sales to EU 31% 37% 33% 31% 43%
• Some sales to EU 17% 18% 21% 21% 28%
• No sales to EU 14% 19% 30% 15% 26%
Changes in sterling 8-10 barrier
• All/most sales to EU - 35% 27% 29% 24%
• Some sales to EU - 18% 21% 16% 22%
• No sales to EU - 9% 21% 24% 14%
Q86 All exporters
www.bva-bdrc.com
13 AWARENESS OF TASKFORCE AND OTHER INITIATIVES THIS FINAL SECTION OF THE REPORT LOOKS at awareness amongst SMEs of some of the Business Finance Taskforce commitments, together with other relevant initiatives.
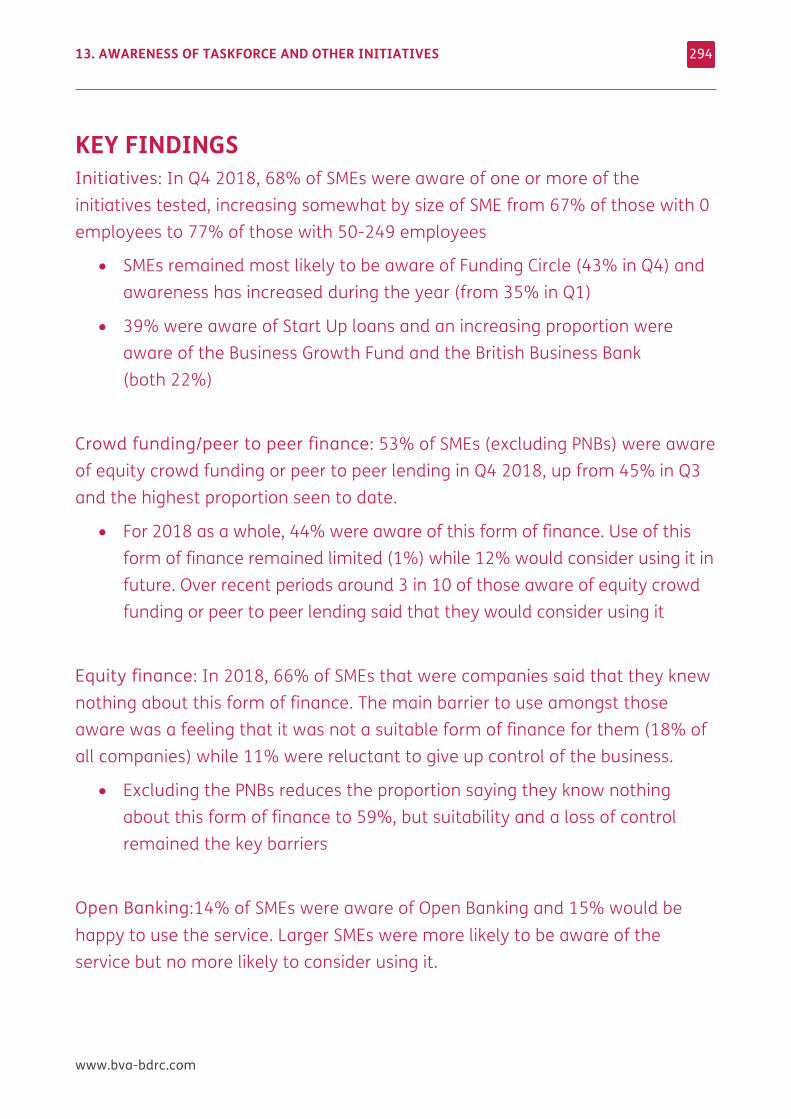
13. AWARENESS OF TASKFORCE AND OTHER INITIATIVES
www.bva-bdrc.com
294
KEY FINDINGS Initiatives: In Q4 2018, 68% of SMEs were aware of one or more of the initiatives tested, increasing somewhat by size of SME from 67% of those with 0 employees to 77% of those with 50-249 employees
• SMEs remained most likely to be aware of Funding Circle (43% in Q4) and awareness has increased during the year (from 35% in Q1)
• 39% were aware of Start Up loans and an increasing proportion were aware of the Business Growth Fund and the British Business Bank (both 22%)
Crowd funding/peer to peer finance: 53% of SMEs (excluding PNBs) were aware of equity crowd funding or peer to peer lending in Q4 2018, up from 45% in Q3 and the highest proportion seen to date.
• For 2018 as a whole, 44% were aware of this form of finance. Use of this form of finance remained limited (1%) while 12% would consider using it in future. Over recent periods around 3 in 10 of those aware of equity crowd funding or peer to peer lending said that they would consider using it
Equity finance: In 2018, 66% of SMEs that were companies said that they knew nothing about this form of finance. The main barrier to use amongst those aware was a feeling that it was not a suitable form of finance for them (18% of all companies) while 11% were reluctant to give up control of the business.
• Excluding the PNBs reduces the proportion saying they know nothing about this form of finance to 59%, but suitability and a loss of control remained the key barriers
Open Banking:14% of SMEs were aware of Open Banking and 15% would be happy to use the service. Larger SMEs were more likely to be aware of the service but no more likely to consider using it.
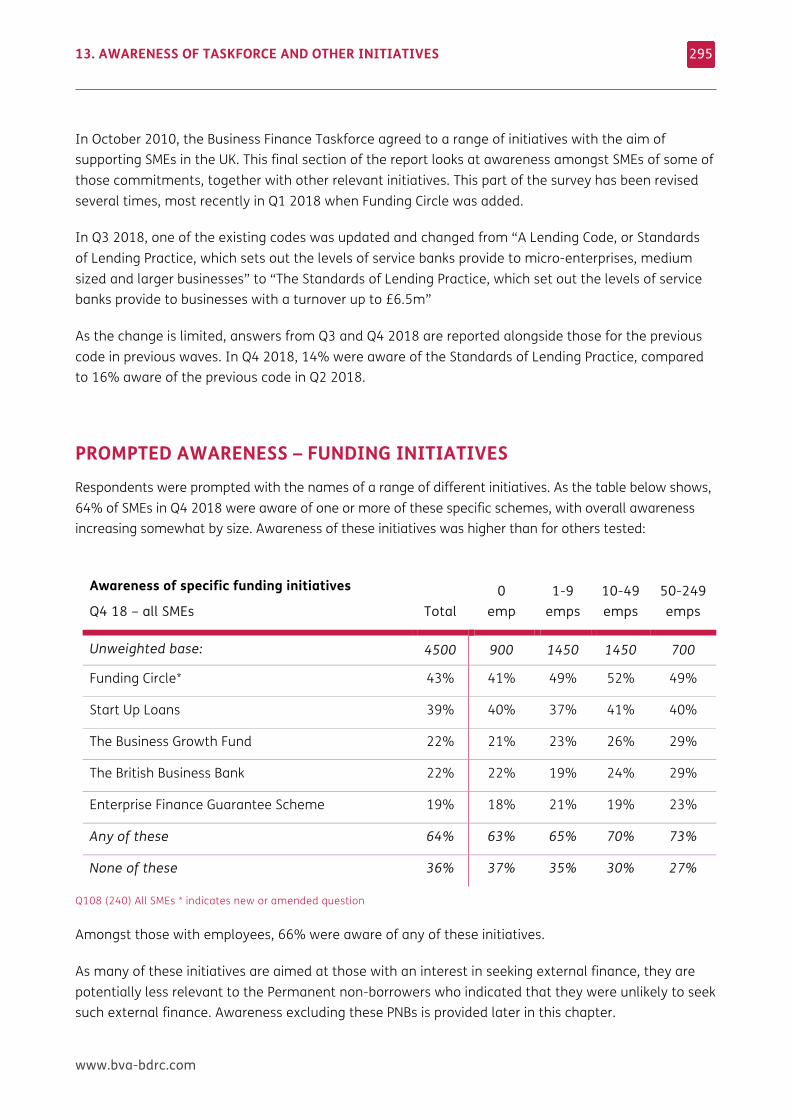
13. AWARENESS OF TASKFORCE AND OTHER INITIATIVES
www.bva-bdrc.com
295
In October 2010, the Business Finance Taskforce agreed to a range of initiatives with the aim of supporting SMEs in the UK. This final section of the report looks at awareness amongst SMEs of some of those commitments, together with other relevant initiatives. This part of the survey has been revised several times, most recently in Q1 2018 when Funding Circle was added.
In Q3 2018, one of the existing codes was updated and changed from “A Lending Code, or Standards of Lending Practice, which sets out the levels of service banks provide to micro-enterprises, medium sized and larger businesses” to “The Standards of Lending Practice, which set out the levels of service banks provide to businesses with a turnover up to £6.5m”
As the change is limited, answers from Q3 and Q4 2018 are reported alongside those for the previous code in previous waves. In Q4 2018, 14% were aware of the Standards of Lending Practice, compared to 16% aware of the previous code in Q2 2018.
PROMPTED AWARENESS – FUNDING INITIATIVES Respondents were prompted with the names of a range of different initiatives. As the table below shows, 64% of SMEs in Q4 2018 were aware of one or more of these specific schemes, with overall awareness increasing somewhat by size. Awareness of these initiatives was higher than for others tested:
Awareness of specific funding initiatives
Q4 18 – all SMEs Total 0
emp 1-9
emps 10-49 emps
50-249 emps
Unweighted base: 4500 900 1450 1450 700
Funding Circle* 43% 41% 49% 52% 49%
Start Up Loans 39% 40% 37% 41% 40%
The Business Growth Fund 22% 21% 23% 26% 29%
The British Business Bank 22% 22% 19% 24% 29%
Enterprise Finance Guarantee Scheme 19% 18% 21% 19% 23%
Any of these 64% 63% 65% 70% 73%
None of these 36% 37% 35% 30% 27%
Q108 (240) All SMEs * indicates new or amended question
Amongst those with employees, 66% were aware of any of these initiatives.
As many of these initiatives are aimed at those with an interest in seeking external finance, they are potentially less relevant to the Permanent non-borrowers who indicated that they were unlikely to seek such external finance. Awareness excluding these PNBs is provided later in this chapter.
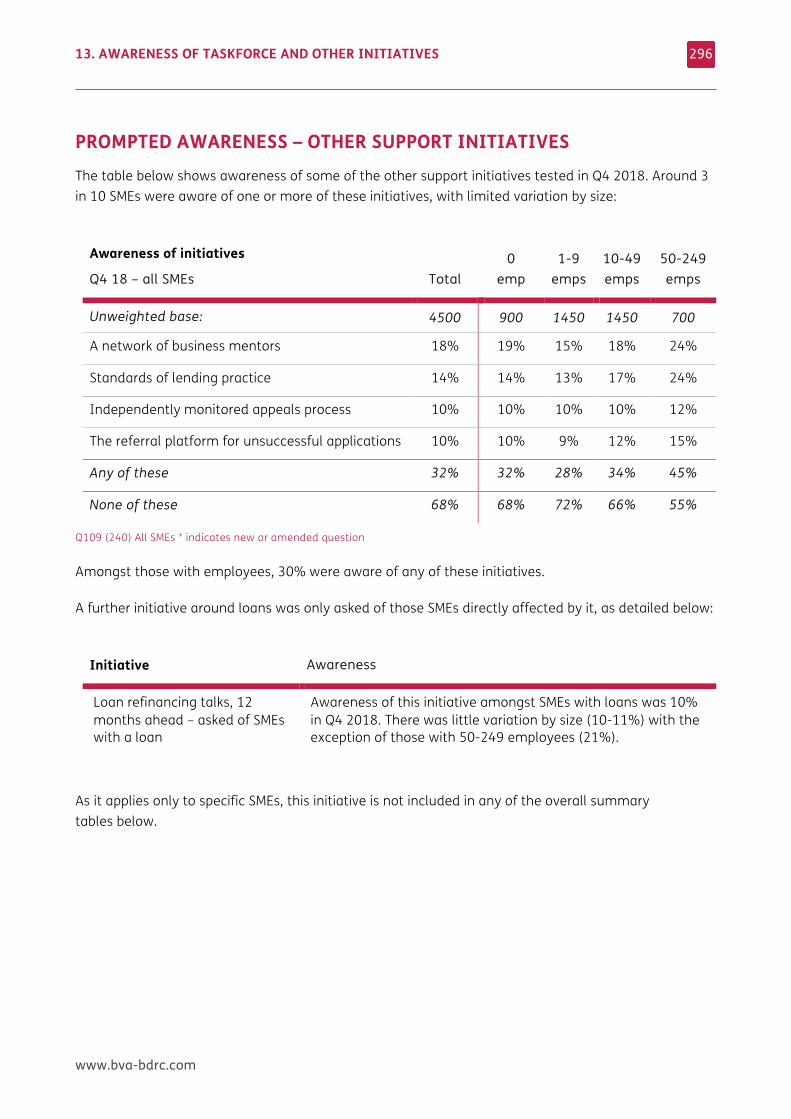
13. AWARENESS OF TASKFORCE AND OTHER INITIATIVES
www.bva-bdrc.com
296
PROMPTED AWARENESS – OTHER SUPPORT INITIATIVES The table below shows awareness of some of the other support initiatives tested in Q4 2018. Around 3 in 10 SMEs were aware of one or more of these initiatives, with limited variation by size:
Awareness of initiatives
Q4 18 – all SMEs Total 0
emp 1-9
emps 10-49 emps
50-249 emps
Unweighted base: 4500 900 1450 1450 700
A network of business mentors 18% 19% 15% 18% 24%
Standards of lending practice 14% 14% 13% 17% 24%
Independently monitored appeals process 10% 10% 10% 10% 12%
The referral platform for unsuccessful applications 10% 10% 9% 12% 15%
Any of these 32% 32% 28% 34% 45%
None of these 68% 68% 72% 66% 55%
Q109 (240) All SMEs * indicates new or amended question
Amongst those with employees, 30% were aware of any of these initiatives.
A further initiative around loans was only asked of those SMEs directly affected by it, as detailed below:
Initiative Awareness
Loan refinancing talks, 12 months ahead – asked of SMEs with a loan
Awareness of this initiative amongst SMEs with loans was 10% in Q4 2018. There was little variation by size (10-11%) with the exception of those with 50-249 employees (21%).
As it applies only to specific SMEs, this initiative is not included in any of the overall summary tables below.
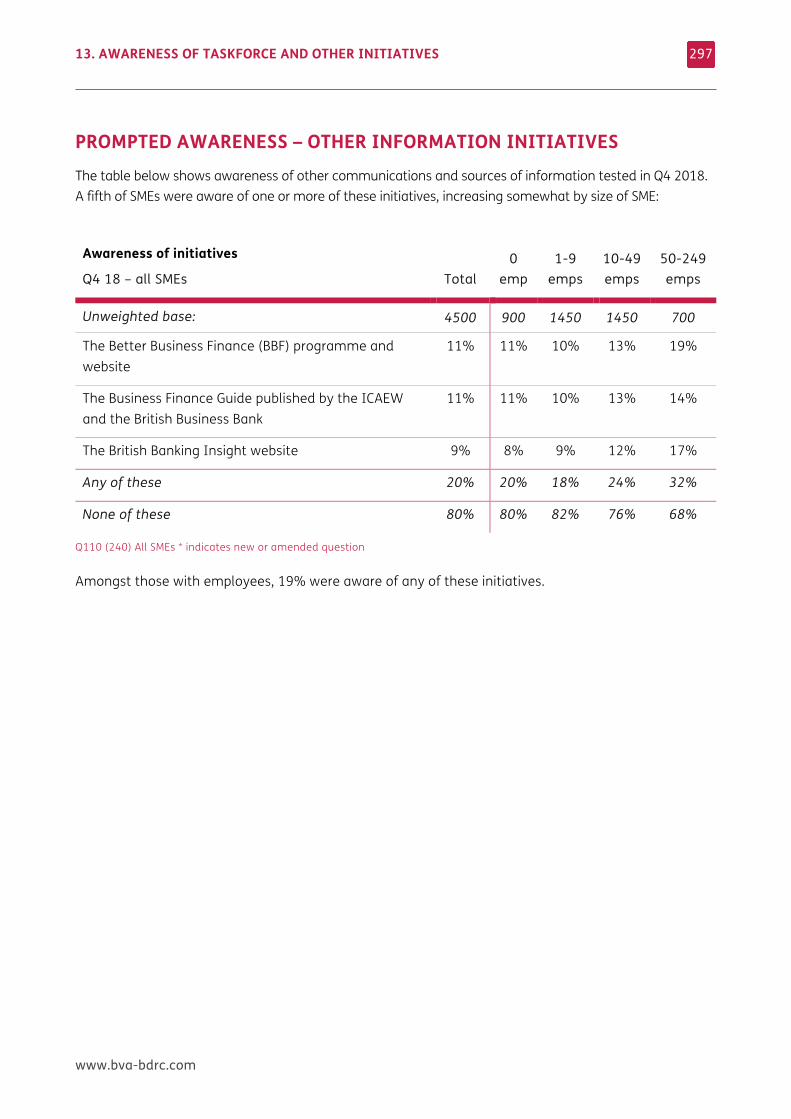
13. AWARENESS OF TASKFORCE AND OTHER INITIATIVES
www.bva-bdrc.com
297
PROMPTED AWARENESS – OTHER INFORMATION INITIATIVES The table below shows awareness of other communications and sources of information tested in Q4 2018. A fifth of SMEs were aware of one or more of these initiatives, increasing somewhat by size of SME:
Awareness of initiatives
Q4 18 – all SMEs Total 0
emp 1-9
emps 10-49 emps
50-249 emps
Unweighted base: 4500 900 1450 1450 700
The Better Business Finance (BBF) programme and website
11% 11% 10% 13% 19%
The Business Finance Guide published by the ICAEW and the British Business Bank
11% 11% 10% 13% 14%
The British Banking Insight website 9% 8% 9% 12% 17%
Any of these 20% 20% 18% 24% 32%
None of these 80% 80% 82% 76% 68%
Q110 (240) All SMEs * indicates new or amended question
Amongst those with employees, 19% were aware of any of these initiatives.
13. AWARENESS OF TASKFORCE AND OTHER INITIATIVES
www.bva-bdrc.com
298
AWARENESS OF ANY INITIATIVES BY KEY GROUPS 68% of all SMEs in Q4 2018 were aware of one or more of these initiatives after prompting. This was in line with Q4 2016 when 64% were aware (of any from a slightly different list) but higher than in Q4 2017 when 53% were aware (also of a slightly different list and before Funding Circle was included).
Total awareness increased somewhat by size of SME:
• 67% of SMEs with 0 employees were aware of any of these initiatives
• 69% of those with 1-9 employees were aware of any of these initiatives
• 74% of those with 10-49 employees were aware of any of these initiatives
• 77% of SMEs with 50-249 employees were aware of any of these initiatives.
Excluding the PNBs increased overall awareness to 74%.
Overall awareness by age of business ranged from 79% of Starts to 62% of those trading for more than 15 years.
Those currently using external finance were more likely to be aware (77%) than those not using finance (61%), as were those planning to apply in the next 3 months (86%, compared to 61% of Future would-be seekers and 66% of Future happy non-seekers).
Whilst awareness was highest for Funding Circle (43% in Q4 2018) SMEs aware of this provider were also aware of at least one other initiative, so there is no net effect on overall awareness.
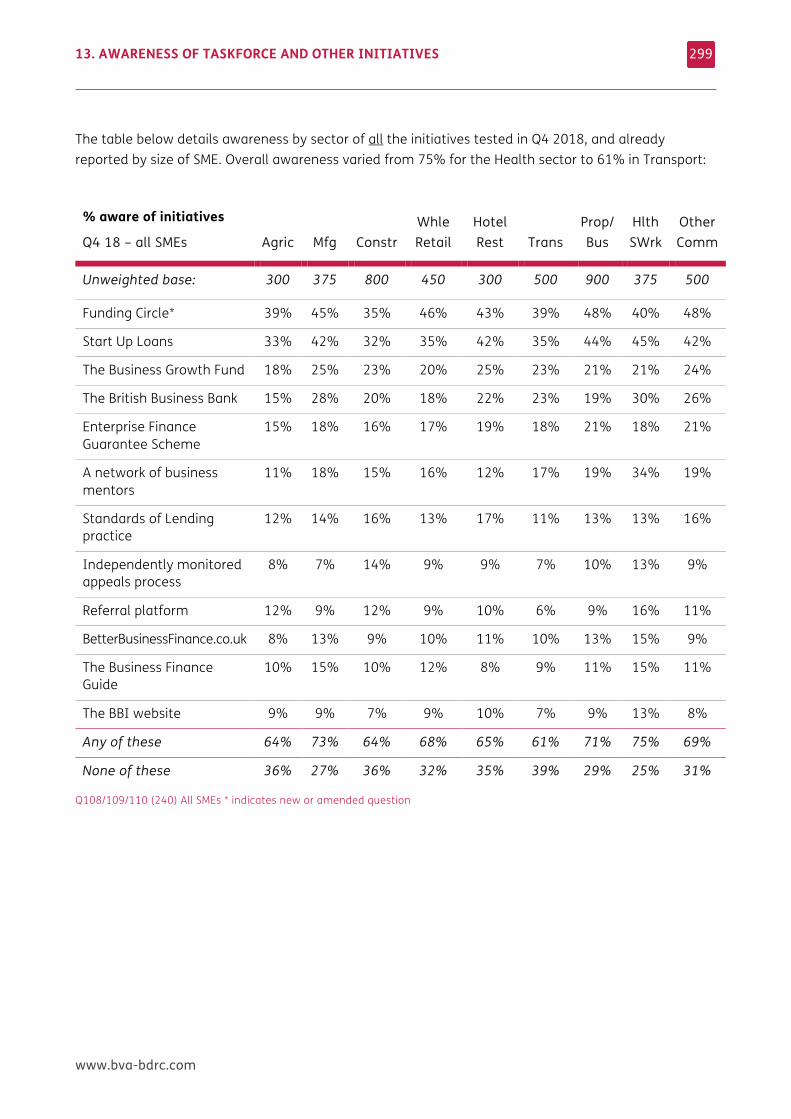
13. AWARENESS OF TASKFORCE AND OTHER INITIATIVES
www.bva-bdrc.com
299
The table below details awareness by sector of all the initiatives tested in Q4 2018, and already reported by size of SME. Overall awareness varied from 75% for the Health sector to 61% in Transport:
% aware of initiatives
Q4 18 – all SMEs Agric Mfg Constr Whle Retail
Hotel Rest Trans
Prop/ Bus
Hlth SWrk
Other Comm
Unweighted base: 300 375 800 450 300 500 900 375 500
Funding Circle* 39% 45% 35% 46% 43% 39% 48% 40% 48%
Start Up Loans 33% 42% 32% 35% 42% 35% 44% 45% 42%
The Business Growth Fund 18% 25% 23% 20% 25% 23% 21% 21% 24%
The British Business Bank 15% 28% 20% 18% 22% 23% 19% 30% 26%
Enterprise Finance Guarantee Scheme
15% 18% 16% 17% 19% 18% 21% 18% 21%
A network of business mentors
11% 18% 15% 16% 12% 17% 19% 34% 19%
Standards of Lending practice
12% 14% 16% 13% 17% 11% 13% 13% 16%
Independently monitored appeals process
8% 7% 14% 9% 9% 7% 10% 13% 9%
Referral platform 12% 9% 12% 9% 10% 6% 9% 16% 11%
BetterBusinessFinance.co.uk 8% 13% 9% 10% 11% 10% 13% 15% 9%
The Business Finance Guide
10% 15% 10% 12% 8% 9% 11% 15% 11%
The BBI website 9% 9% 7% 9% 10% 7% 9% 13% 8%
Any of these 64% 73% 64% 68% 65% 61% 71% 75% 69%
None of these 36% 27% 36% 32% 35% 39% 29% 25% 31%
Q108/109/110 (240) All SMEs * indicates new or amended question
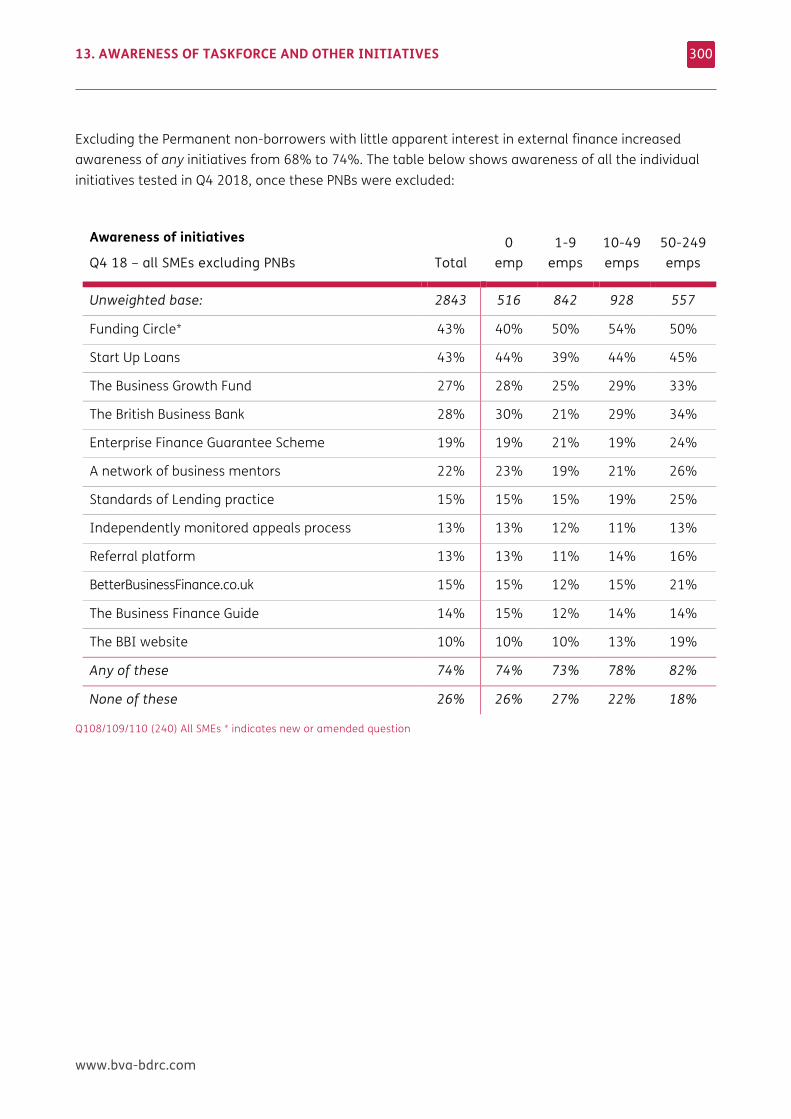
13. AWARENESS OF TASKFORCE AND OTHER INITIATIVES
www.bva-bdrc.com
300
Excluding the Permanent non-borrowers with little apparent interest in external finance increased awareness of any initiatives from 68% to 74%. The table below shows awareness of all the individual initiatives tested in Q4 2018, once these PNBs were excluded:
Awareness of initiatives
Q4 18 – all SMEs excluding PNBs Total 0
emp 1-9
emps 10-49 emps
50-249 emps
Unweighted base: 2843 516 842 928 557
Funding Circle* 43% 40% 50% 54% 50%
Start Up Loans 43% 44% 39% 44% 45%
The Business Growth Fund 27% 28% 25% 29% 33%
The British Business Bank 28% 30% 21% 29% 34%
Enterprise Finance Guarantee Scheme 19% 19% 21% 19% 24%
A network of business mentors 22% 23% 19% 21% 26%
Standards of Lending practice 15% 15% 15% 19% 25%
Independently monitored appeals process 13% 13% 12% 11% 13%
Referral platform 13% 13% 11% 14% 16%
BetterBusinessFinance.co.uk 15% 15% 12% 15% 21%
The Business Finance Guide 14% 15% 12% 14% 14%
The BBI website 10% 10% 10% 13% 19%
Any of these 74% 74% 73% 78% 82%
None of these 26% 26% 27% 22% 18%
Q108/109/110 (240) All SMEs * indicates new or amended question
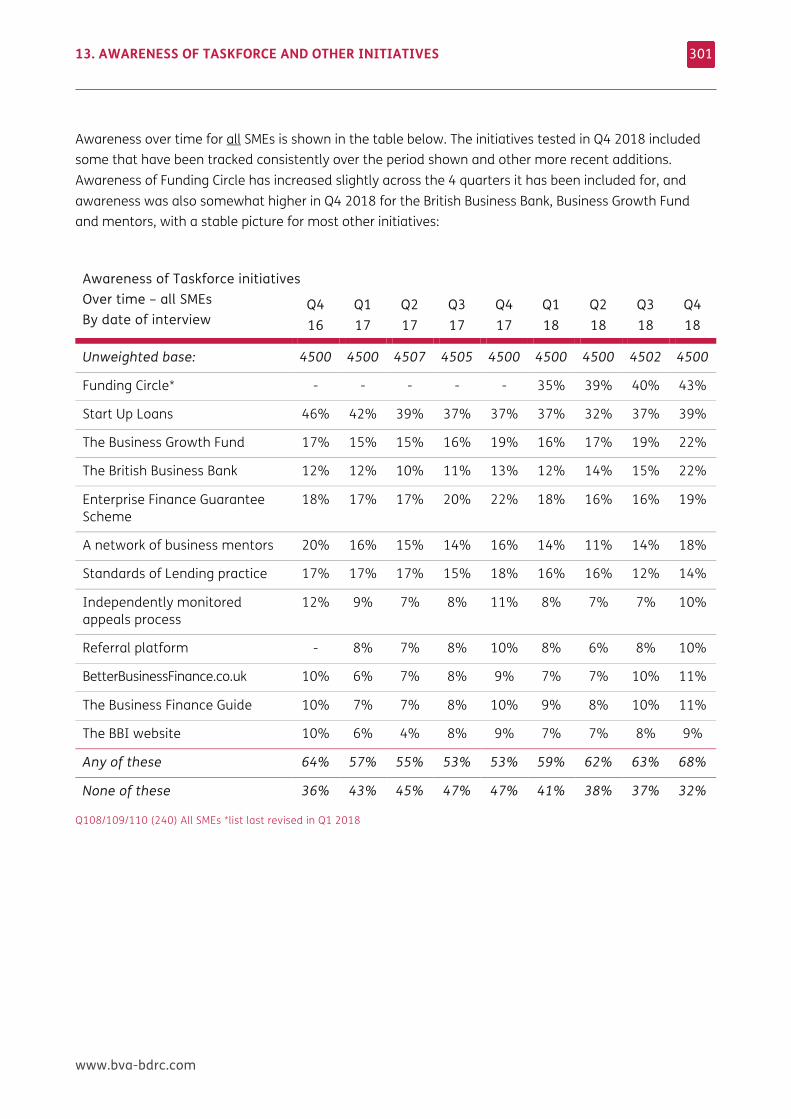
13. AWARENESS OF TASKFORCE AND OTHER INITIATIVES
www.bva-bdrc.com
301
Awareness over time for all SMEs is shown in the table below. The initiatives tested in Q4 2018 included some that have been tracked consistently over the period shown and other more recent additions. Awareness of Funding Circle has increased slightly across the 4 quarters it has been included for, and awareness was also somewhat higher in Q4 2018 for the British Business Bank, Business Growth Fund and mentors, with a stable picture for most other initiatives:
Awareness of Taskforce initiatives Over time – all SMEs By date of interview
Q4 16
Q1 17
Q2 17
Q3 17
Q4 17
Q1 18
Q2 18
Q3 18
Q4 18
Unweighted base: 4500 4500 4507 4505 4500 4500 4500 4502 4500
Funding Circle* - - - - - 35% 39% 40% 43%
Start Up Loans 46% 42% 39% 37% 37% 37% 32% 37% 39%
The Business Growth Fund 17% 15% 15% 16% 19% 16% 17% 19% 22%
The British Business Bank 12% 12% 10% 11% 13% 12% 14% 15% 22%
Enterprise Finance Guarantee Scheme
18% 17% 17% 20% 22% 18% 16% 16% 19%
A network of business mentors 20% 16% 15% 14% 16% 14% 11% 14% 18%
Standards of Lending practice 17% 17% 17% 15% 18% 16% 16% 12% 14%
Independently monitored appeals process
12% 9% 7% 8% 11% 8% 7% 7% 10%
Referral platform - 8% 7% 8% 10% 8% 6% 8% 10%
BetterBusinessFinance.co.uk 10% 6% 7% 8% 9% 7% 7% 10% 11%
The Business Finance Guide 10% 7% 7% 8% 10% 9% 8% 10% 11%
The BBI website 10% 6% 4% 8% 9% 7% 7% 8% 9%
Any of these 64% 57% 55% 53% 53% 59% 62% 63% 68%
None of these 36% 43% 45% 47% 47% 41% 38% 37% 32%
Q108/109/110 (240) All SMEs *list last revised in Q1 2018
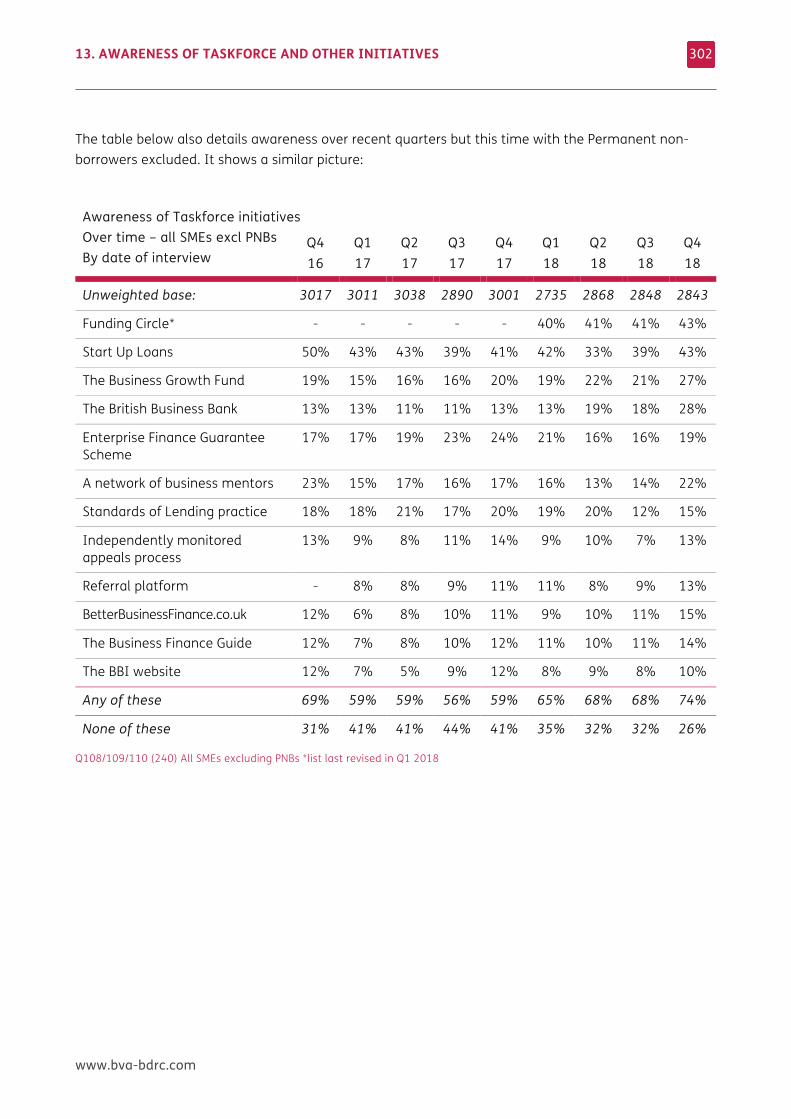
13. AWARENESS OF TASKFORCE AND OTHER INITIATIVES
www.bva-bdrc.com
302
The table below also details awareness over recent quarters but this time with the Permanent non-borrowers excluded. It shows a similar picture:
Awareness of Taskforce initiatives Over time – all SMEs excl PNBs By date of interview
Q4 16
Q1 17
Q2 17
Q3 17
Q4 17
Q1 18
Q2 18
Q3 18
Q4 18
Unweighted base: 3017 3011 3038 2890 3001 2735 2868 2848 2843
Funding Circle* - - - - - 40% 41% 41% 43%
Start Up Loans 50% 43% 43% 39% 41% 42% 33% 39% 43%
The Business Growth Fund 19% 15% 16% 16% 20% 19% 22% 21% 27%
The British Business Bank 13% 13% 11% 11% 13% 13% 19% 18% 28%
Enterprise Finance Guarantee Scheme
17% 17% 19% 23% 24% 21% 16% 16% 19%
A network of business mentors 23% 15% 17% 16% 17% 16% 13% 14% 22%
Standards of Lending practice 18% 18% 21% 17% 20% 19% 20% 12% 15%
Independently monitored appeals process
13% 9% 8% 11% 14% 9% 10% 7% 13%
Referral platform - 8% 8% 9% 11% 11% 8% 9% 13%
BetterBusinessFinance.co.uk 12% 6% 8% 10% 11% 9% 10% 11% 15%
The Business Finance Guide 12% 7% 8% 10% 12% 11% 10% 11% 14%
The BBI website 12% 7% 5% 9% 12% 8% 9% 8% 10%
Any of these 69% 59% 59% 56% 59% 65% 68% 68% 74%
None of these 31% 41% 41% 44% 41% 35% 32% 32% 26%
Q108/109/110 (240) All SMEs excluding PNBs *list last revised in Q1 2018
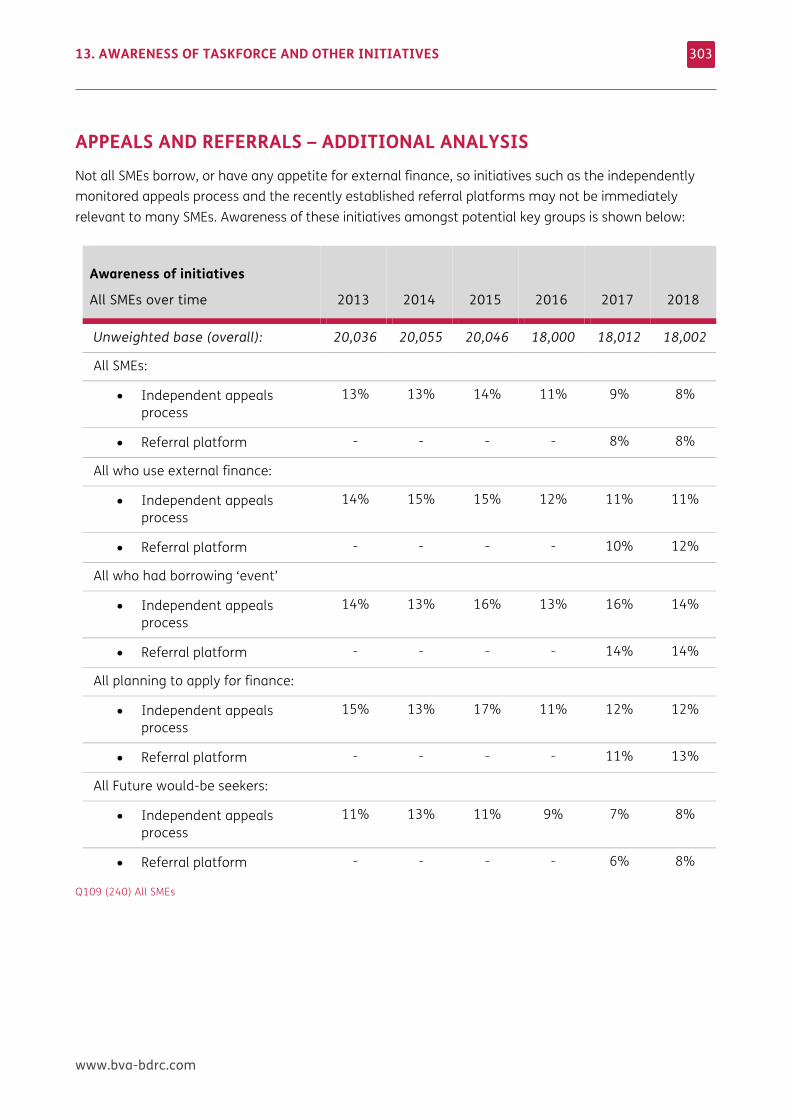
13. AWARENESS OF TASKFORCE AND OTHER INITIATIVES
www.bva-bdrc.com
303
APPEALS AND REFERRALS – ADDITIONAL ANALYSIS Not all SMEs borrow, or have any appetite for external finance, so initiatives such as the independently monitored appeals process and the recently established referral platforms may not be immediately relevant to many SMEs. Awareness of these initiatives amongst potential key groups is shown below:
Awareness of initiatives
All SMEs over time 2013 2014 2015 2016 2017 2018
Unweighted base (overall): 20,036 20,055 20,046 18,000 18,012 18,002
All SMEs:
• Independent appeals process
13% 13% 14% 11% 9% 8%
• Referral platform - - - - 8% 8%
All who use external finance:
• Independent appeals process
14% 15% 15% 12% 11% 11%
• Referral platform - - - - 10% 12%
All who had borrowing ‘event’
• Independent appeals process
14% 13% 16% 13% 16% 14%
• Referral platform - - - - 14% 14%
All planning to apply for finance:
• Independent appeals process
15% 13% 17% 11% 12% 12%
• Referral platform - - - - 11% 13%
All Future would-be seekers:
• Independent appeals process
11% 13% 11% 9% 7% 8%
• Referral platform - - - - 6% 8%
Q109 (240) All SMEs
13. AWARENESS OF TASKFORCE AND OTHER INITIATIVES
www.bva-bdrc.com
304
This shows broadly stable awareness of the appeals process between 2013 and 2015 (13-14%), before awareness declined slightly, now 8% for 2018:
• Awareness of the appeals process was highest for those who had had a borrowing event (14% in 2018) with little variation over time (13-16%).
• 12% of those planning to apply were aware of the appeals process, somewhat lower than the 17% of this group aware in 2015. Their awareness remained higher than amongst those expecting to be a Future would-be seeker of finance, where 8% were aware of the appeals process.
Data on awareness of the referrals process is now available for 2017 and 2018, with 8% of all SMEs aware of it in both years, in line with current awareness of the appeals process:
• In 2018 awareness of the referral process was highest amongst those reporting a borrowing event (14%) and those planning to apply for finance (13%).
• Future would-be seekers remained slightly less likely to be aware (8%).
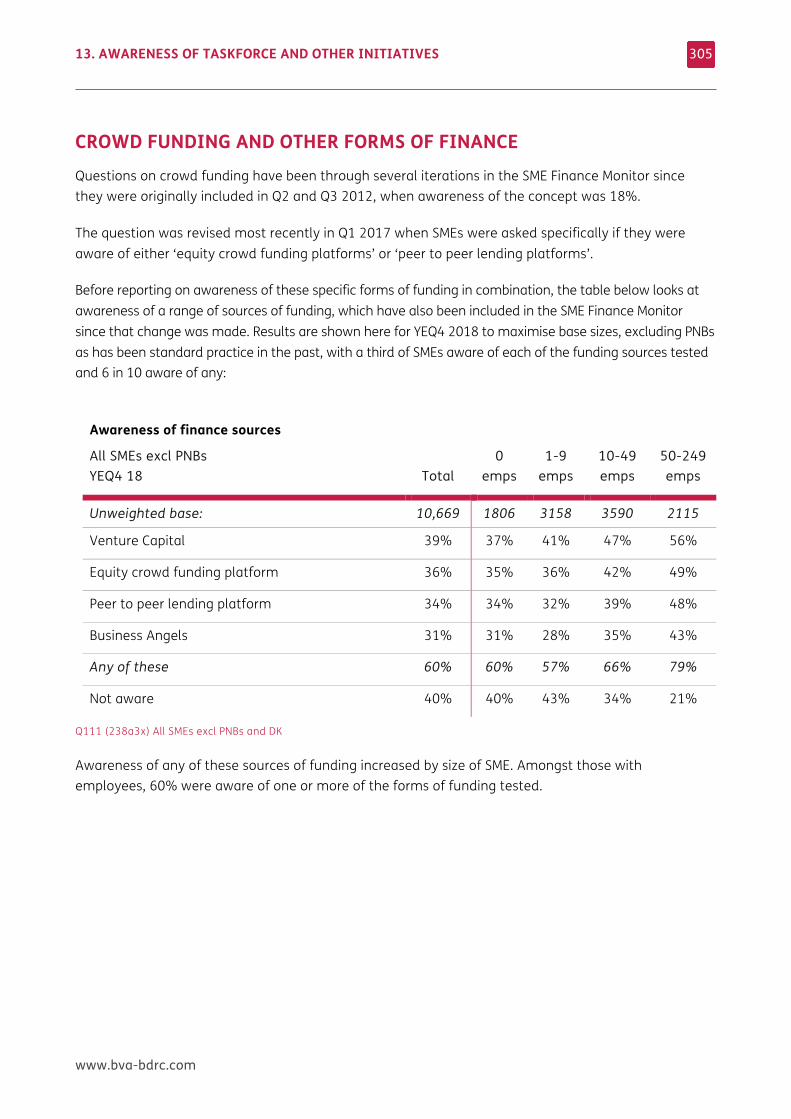
13. AWARENESS OF TASKFORCE AND OTHER INITIATIVES
www.bva-bdrc.com
305
CROWD FUNDING AND OTHER FORMS OF FINANCE Questions on crowd funding have been through several iterations in the SME Finance Monitor since they were originally included in Q2 and Q3 2012, when awareness of the concept was 18%.
The question was revised most recently in Q1 2017 when SMEs were asked specifically if they were aware of either ‘equity crowd funding platforms’ or ‘peer to peer lending platforms’.
Before reporting on awareness of these specific forms of funding in combination, the table below looks at awareness of a range of sources of funding, which have also been included in the SME Finance Monitor since that change was made. Results are shown here for YEQ4 2018 to maximise base sizes, excluding PNBs as has been standard practice in the past, with a third of SMEs aware of each of the funding sources tested and 6 in 10 aware of any:
Awareness of finance sources
All SMEs excl PNBs YEQ4 18 Total
0 emps
1-9 emps
10-49 emps
50-249 emps
Unweighted base: 10,669 1806 3158 3590 2115
Venture Capital 39% 37% 41% 47% 56%
Equity crowd funding platform 36% 35% 36% 42% 49%
Peer to peer lending platform 34% 34% 32% 39% 48%
Business Angels 31% 31% 28% 35% 43%
Any of these 60% 60% 57% 66% 79%
Not aware 40% 40% 43% 34% 21%
Q111 (238a3x) All SMEs excl PNBs and DK
Awareness of any of these sources of funding increased by size of SME. Amongst those with employees, 60% were aware of one or more of the forms of funding tested.
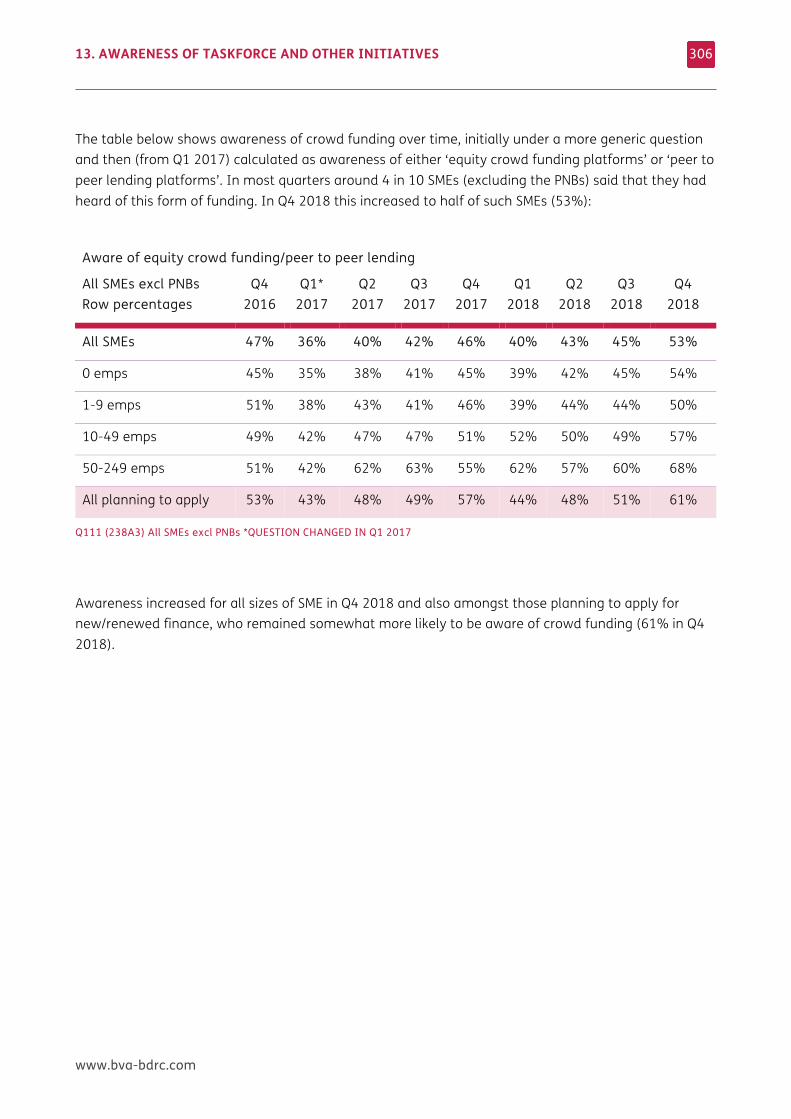
13. AWARENESS OF TASKFORCE AND OTHER INITIATIVES
www.bva-bdrc.com
306
The table below shows awareness of crowd funding over time, initially under a more generic question and then (from Q1 2017) calculated as awareness of either ‘equity crowd funding platforms’ or ‘peer to peer lending platforms’. In most quarters around 4 in 10 SMEs (excluding the PNBs) said that they had heard of this form of funding. In Q4 2018 this increased to half of such SMEs (53%):
Aware of equity crowd funding/peer to peer lending
All SMEs excl PNBs Row percentages
Q4 2016
Q1* 2017
Q2 2017
Q3 2017
Q4 2017
Q1 2018
Q2 2018
Q3 2018
Q4 2018
All SMEs 47% 36% 40% 42% 46% 40% 43% 45% 53%
0 emps 45% 35% 38% 41% 45% 39% 42% 45% 54%
1-9 emps 51% 38% 43% 41% 46% 39% 44% 44% 50%
10-49 emps 49% 42% 47% 47% 51% 52% 50% 49% 57%
50-249 emps 51% 42% 62% 63% 55% 62% 57% 60% 68%
All planning to apply 53% 43% 48% 49% 57% 44% 48% 51% 61%
Q111 (238A3) All SMEs excl PNBs *QUESTION CHANGED IN Q1 2017
Awareness increased for all sizes of SME in Q4 2018 and also amongst those planning to apply for new/renewed finance, who remained somewhat more likely to be aware of crowd funding (61% in Q4 2018).
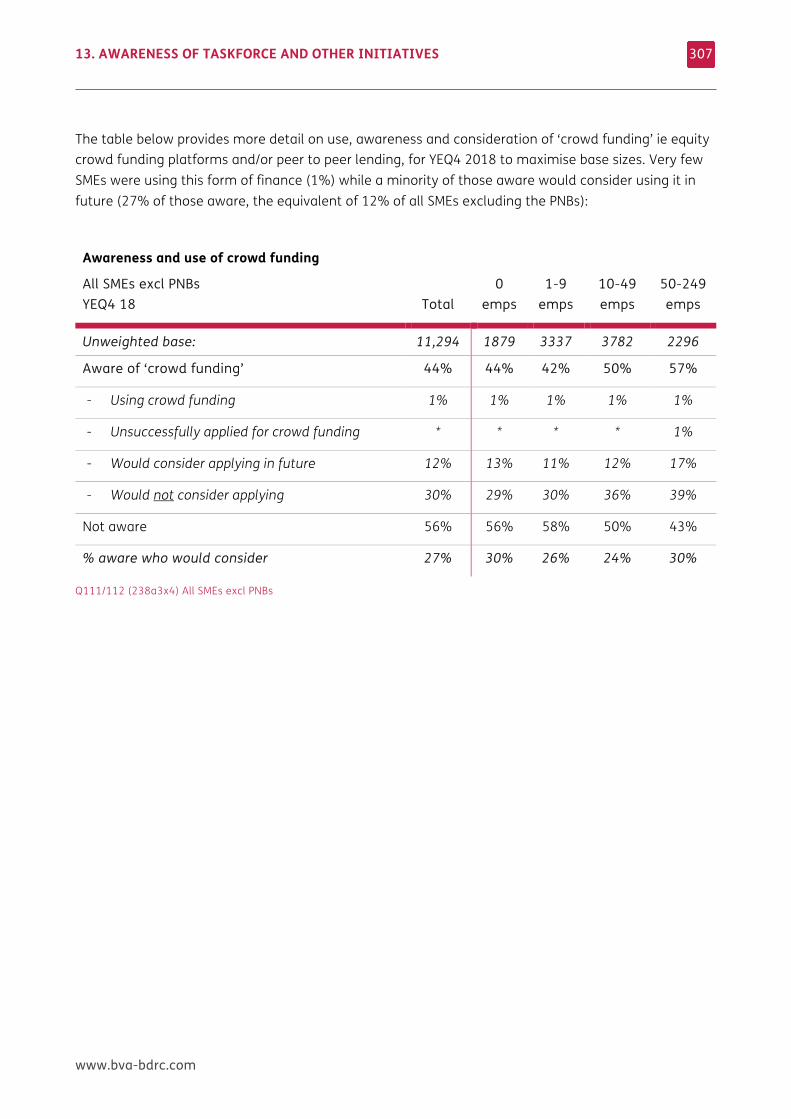
13. AWARENESS OF TASKFORCE AND OTHER INITIATIVES
www.bva-bdrc.com
307
The table below provides more detail on use, awareness and consideration of ‘crowd funding’ ie equity crowd funding platforms and/or peer to peer lending, for YEQ4 2018 to maximise base sizes. Very few SMEs were using this form of finance (1%) while a minority of those aware would consider using it in future (27% of those aware, the equivalent of 12% of all SMEs excluding the PNBs):
Awareness and use of crowd funding
All SMEs excl PNBs YEQ4 18 Total
0 emps
1-9 emps
10-49 emps
50-249 emps
Unweighted base: 11,294 1879 3337 3782 2296
Aware of ‘crowd funding’ 44% 44% 42% 50% 57%
- Using crowd funding 1% 1% 1% 1% 1%
- Unsuccessfully applied for crowd funding * * * * 1%
- Would consider applying in future 12% 13% 11% 12% 17%
- Would not consider applying 30% 29% 30% 36% 39%
Not aware 56% 56% 58% 50% 43%
% aware who would consider 27% 30% 26% 24% 30%
Q111/112 (238a3x4) All SMEs excl PNBs
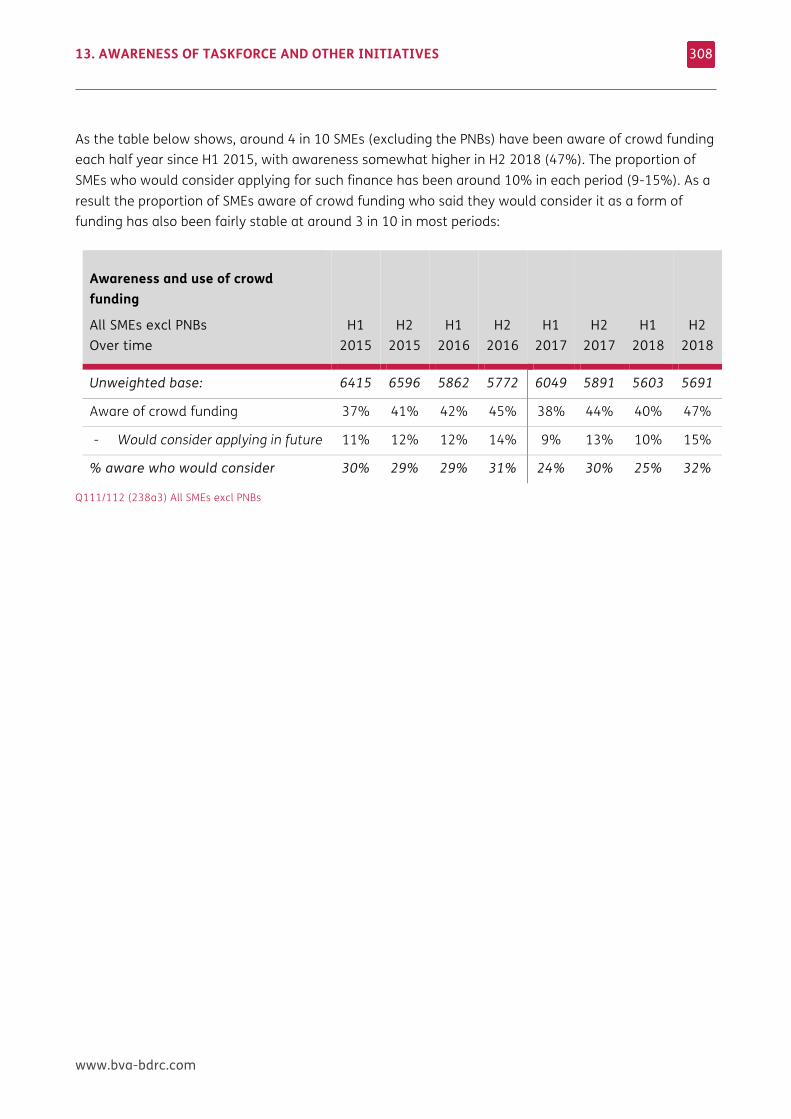
13. AWARENESS OF TASKFORCE AND OTHER INITIATIVES
www.bva-bdrc.com
308
As the table below shows, around 4 in 10 SMEs (excluding the PNBs) have been aware of crowd funding each half year since H1 2015, with awareness somewhat higher in H2 2018 (47%). The proportion of SMEs who would consider applying for such finance has been around 10% in each period (9-15%). As a result the proportion of SMEs aware of crowd funding who said they would consider it as a form of funding has also been fairly stable at around 3 in 10 in most periods:
Awareness and use of crowd funding
All SMEs excl PNBs Over time
H1 2015
H2 2015
H1 2016
H2 2016
H1 2017
H2 2017
H1 2018
H2 2018
Unweighted base: 6415 6596 5862 5772 6049 5891 5603 5691
Aware of crowd funding 37% 41% 42% 45% 38% 44% 40% 47%
- Would consider applying in future 11% 12% 12% 14% 9% 13% 10% 15%
% aware who would consider 30% 29% 29% 31% 24% 30% 25% 32%
Q111/112 (238a3) All SMEs excl PNBs
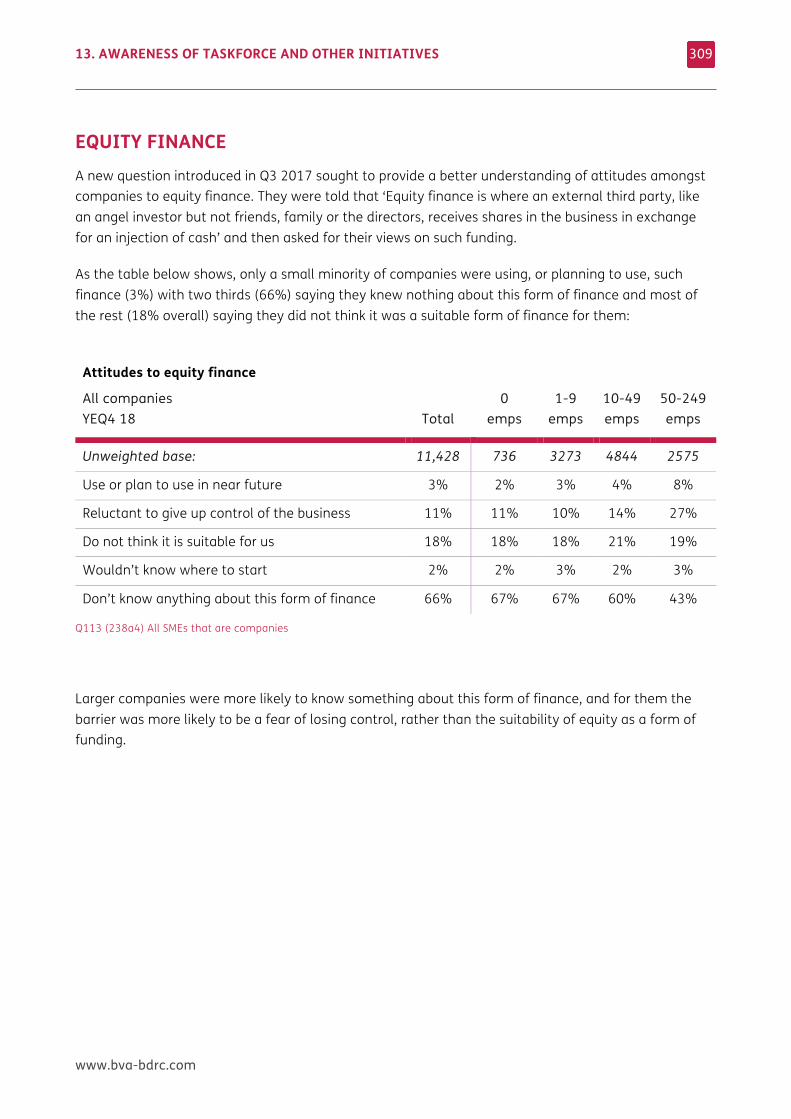
13. AWARENESS OF TASKFORCE AND OTHER INITIATIVES
www.bva-bdrc.com
309
EQUITY FINANCE A new question introduced in Q3 2017 sought to provide a better understanding of attitudes amongst companies to equity finance. They were told that ‘Equity finance is where an external third party, like an angel investor but not friends, family or the directors, receives shares in the business in exchange for an injection of cash’ and then asked for their views on such funding.
As the table below shows, only a small minority of companies were using, or planning to use, such finance (3%) with two thirds (66%) saying they knew nothing about this form of finance and most of the rest (18% overall) saying they did not think it was a suitable form of finance for them:
Attitudes to equity finance
All companies YEQ4 18 Total
0 emps
1-9 emps
10-49 emps
50-249 emps
Unweighted base: 11,428 736 3273 4844 2575
Use or plan to use in near future 3% 2% 3% 4% 8%
Reluctant to give up control of the business 11% 11% 10% 14% 27%
Do not think it is suitable for us 18% 18% 18% 21% 19%
Wouldn’t know where to start 2% 2% 3% 2% 3%
Don’t know anything about this form of finance 66% 67% 67% 60% 43%
Q113 (238a4) All SMEs that are companies
Larger companies were more likely to know something about this form of finance, and for them the barrier was more likely to be a fear of losing control, rather than the suitability of equity as a form of funding.
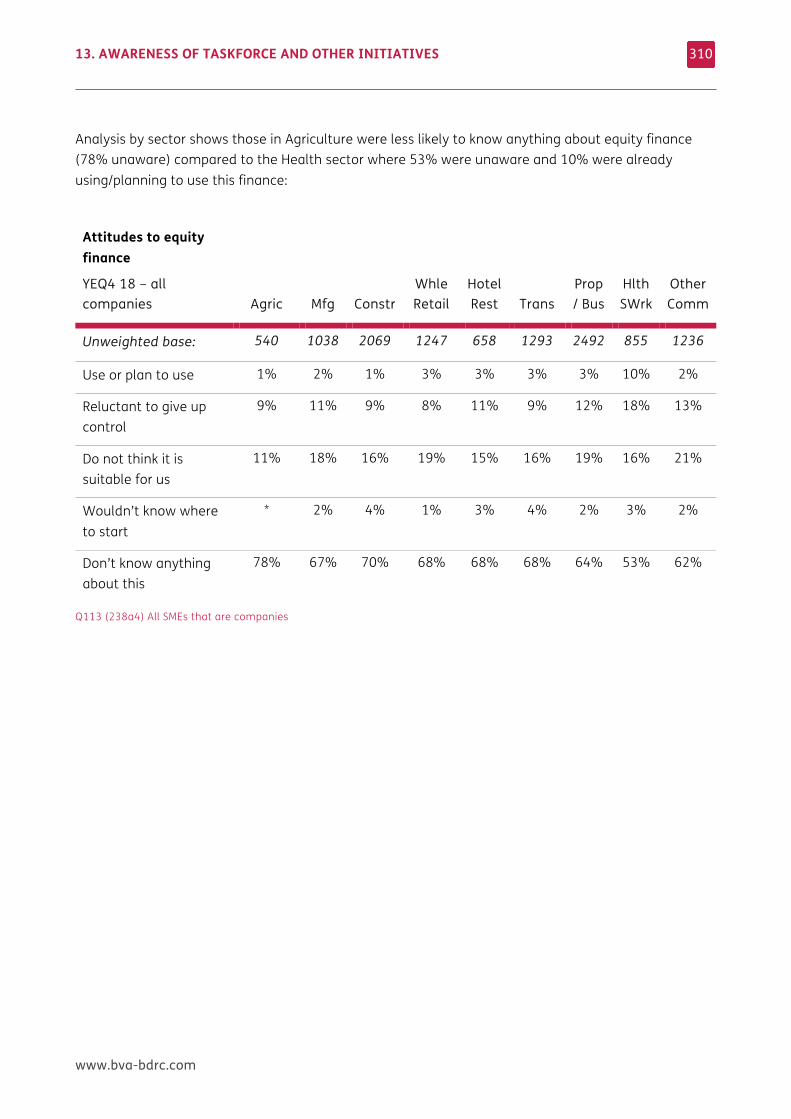
13. AWARENESS OF TASKFORCE AND OTHER INITIATIVES
www.bva-bdrc.com
310
Analysis by sector shows those in Agriculture were less likely to know anything about equity finance (78% unaware) compared to the Health sector where 53% were unaware and 10% were already using/planning to use this finance:
Attitudes to equity finance
YEQ4 18 – all companies Agric Mfg Constr
Whle Retail
Hotel Rest Trans
Prop/ Bus
Hlth SWrk
Other Comm
Unweighted base: 540 1038 2069 1247 658 1293 2492 855 1236
Use or plan to use 1% 2% 1% 3% 3% 3% 3% 10% 2%
Reluctant to give up control
9% 11% 9% 8% 11% 9% 12% 18% 13%
Do not think it is suitable for us
11% 18% 16% 19% 15% 16% 19% 16% 21%
Wouldn’t know where to start
* 2% 4% 1% 3% 4% 2% 3% 2%
Don’t know anything about this
78% 67% 70% 68% 68% 68% 64% 53% 62%
Q113 (238a4) All SMEs that are companies
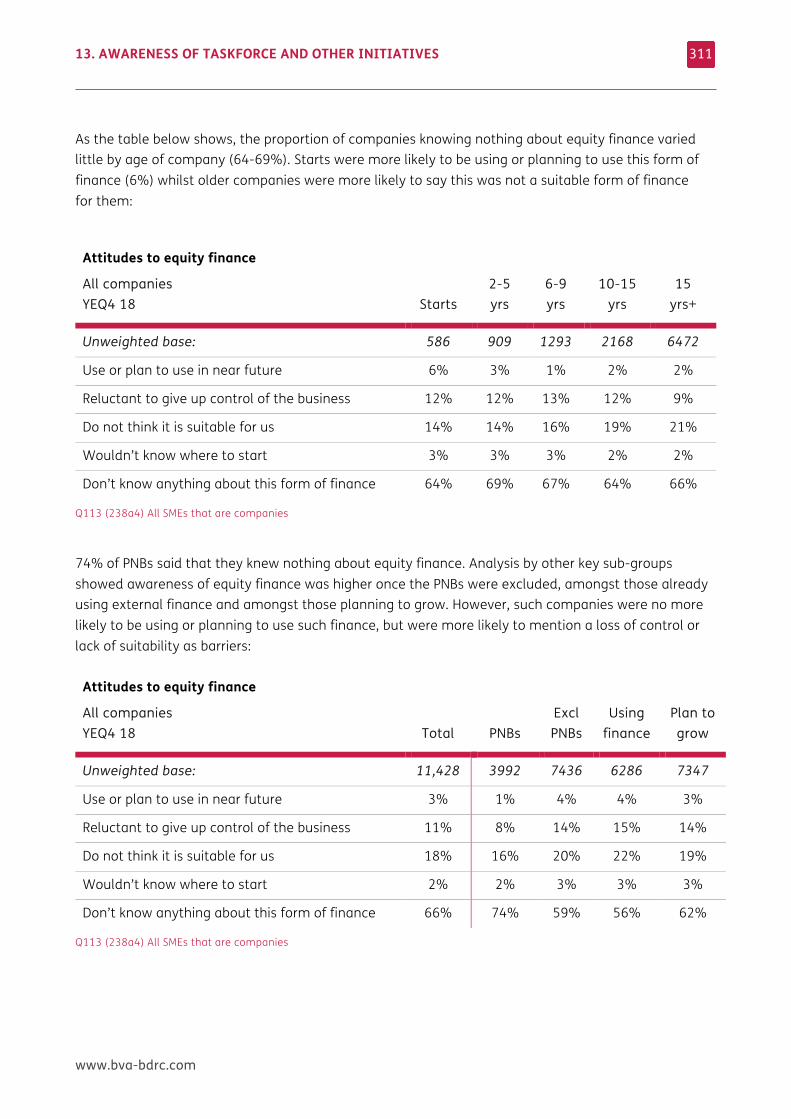
13. AWARENESS OF TASKFORCE AND OTHER INITIATIVES
www.bva-bdrc.com
311
As the table below shows, the proportion of companies knowing nothing about equity finance varied little by age of company (64-69%). Starts were more likely to be using or planning to use this form of finance (6%) whilst older companies were more likely to say this was not a suitable form of finance for them:
Attitudes to equity finance
All companies YEQ4 18 Starts
2-5 yrs
6-9 yrs
10-15 yrs
15 yrs+
Unweighted base: 586 909 1293 2168 6472
Use or plan to use in near future 6% 3% 1% 2% 2%
Reluctant to give up control of the business 12% 12% 13% 12% 9%
Do not think it is suitable for us 14% 14% 16% 19% 21%
Wouldn’t know where to start 3% 3% 3% 2% 2%
Don’t know anything about this form of finance 64% 69% 67% 64% 66%
Q113 (238a4) All SMEs that are companies
74% of PNBs said that they knew nothing about equity finance. Analysis by other key sub-groups showed awareness of equity finance was higher once the PNBs were excluded, amongst those already using external finance and amongst those planning to grow. However, such companies were no more likely to be using or planning to use such finance, but were more likely to mention a loss of control or lack of suitability as barriers:
Attitudes to equity finance
All companies YEQ4 18 Total PNBs
Excl PNBs
Using finance
Plan to grow
Unweighted base: 11,428 3992 7436 6286 7347
Use or plan to use in near future 3% 1% 4% 4% 3%
Reluctant to give up control of the business 11% 8% 14% 15% 14%
Do not think it is suitable for us 18% 16% 20% 22% 19%
Wouldn’t know where to start 2% 2% 3% 3% 3%
Don’t know anything about this form of finance 66% 74% 59% 56% 62%
Q113 (238a4) All SMEs that are companies
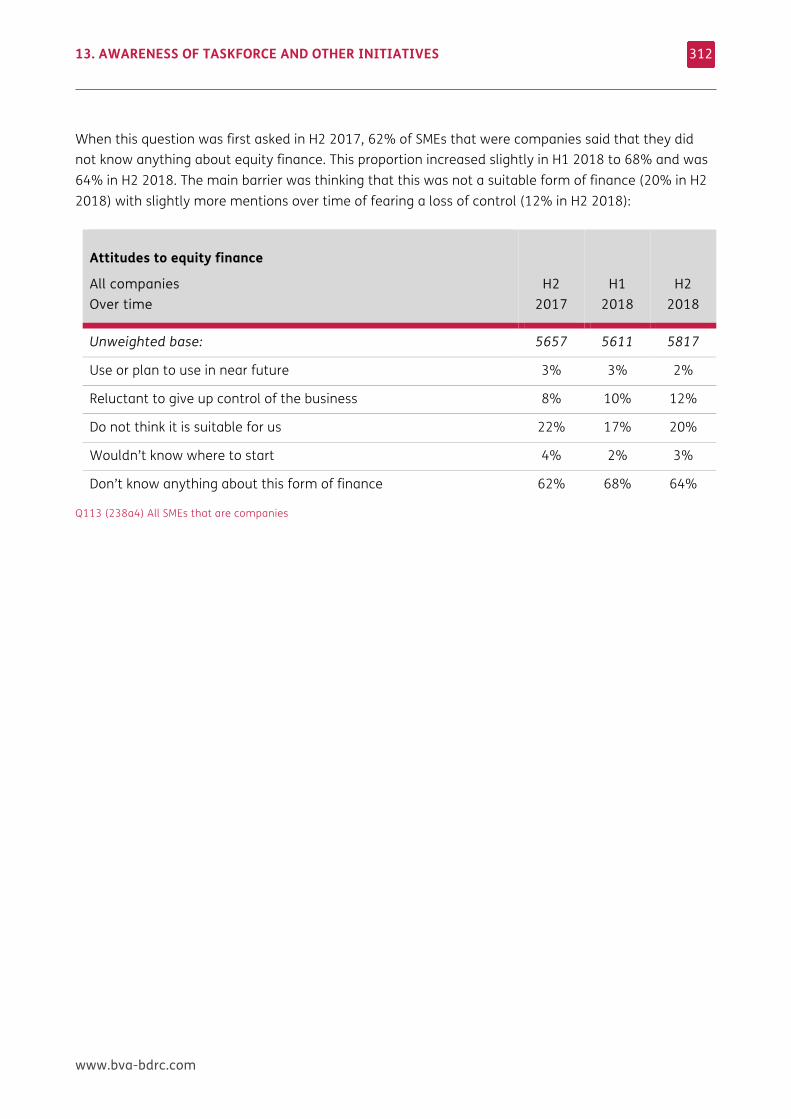
13. AWARENESS OF TASKFORCE AND OTHER INITIATIVES
www.bva-bdrc.com
312
When this question was first asked in H2 2017, 62% of SMEs that were companies said that they did not know anything about equity finance. This proportion increased slightly in H1 2018 to 68% and was 64% in H2 2018. The main barrier was thinking that this was not a suitable form of finance (20% in H2 2018) with slightly more mentions over time of fearing a loss of control (12% in H2 2018):
Attitudes to equity finance
All companies Over time
H2 2017
H1 2018
H2 2018
Unweighted base: 5657 5611 5817
Use or plan to use in near future 3% 3% 2%
Reluctant to give up control of the business 8% 10% 12%
Do not think it is suitable for us 22% 17% 20%
Wouldn’t know where to start 4% 2% 3%
Don’t know anything about this form of finance 62% 68% 64%
Q113 (238a4) All SMEs that are companies
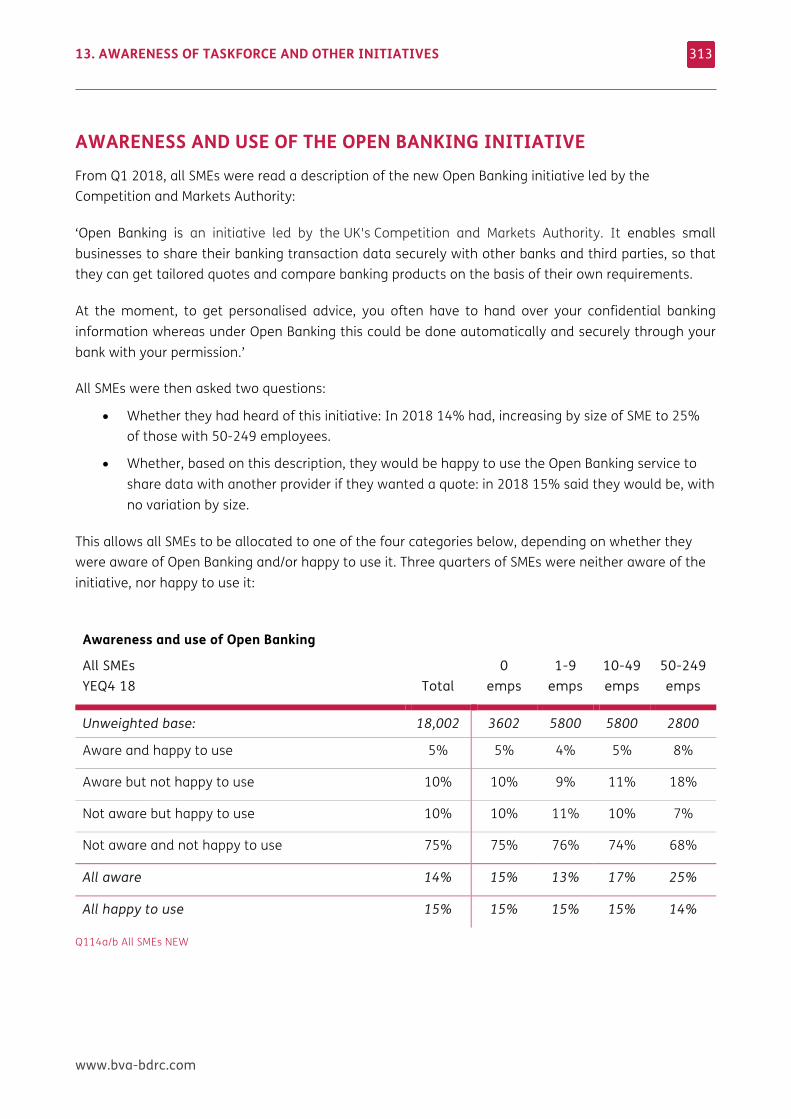
13. AWARENESS OF TASKFORCE AND OTHER INITIATIVES
www.bva-bdrc.com
313
AWARENESS AND USE OF THE OPEN BANKING INITIATIVE From Q1 2018, all SMEs were read a description of the new Open Banking initiative led by the Competition and Markets Authority:
‘Open Banking is an initiative led by the UK's Competition and Markets Authority. It enables small businesses to share their banking transaction data securely with other banks and third parties, so that they can get tailored quotes and compare banking products on the basis of their own requirements.
At the moment, to get personalised advice, you often have to hand over your confidential banking information whereas under Open Banking this could be done automatically and securely through your bank with your permission.’
All SMEs were then asked two questions:
• Whether they had heard of this initiative: In 2018 14% had, increasing by size of SME to 25% of those with 50-249 employees.
• Whether, based on this description, they would be happy to use the Open Banking service to share data with another provider if they wanted a quote: in 2018 15% said they would be, with no variation by size.
This allows all SMEs to be allocated to one of the four categories below, depending on whether they were aware of Open Banking and/or happy to use it. Three quarters of SMEs were neither aware of the initiative, nor happy to use it:
Awareness and use of Open Banking
All SMEs YEQ4 18 Total
0 emps
1-9 emps
10-49 emps
50-249 emps
Unweighted base: 18,002 3602 5800 5800 2800
Aware and happy to use 5% 5% 4% 5% 8%
Aware but not happy to use 10% 10% 9% 11% 18%
Not aware but happy to use 10% 10% 11% 10% 7%
Not aware and not happy to use 75% 75% 76% 74% 68%
All aware 14% 15% 13% 17% 25%
All happy to use 15% 15% 15% 15% 14%
Q114a/b All SMEs NEW
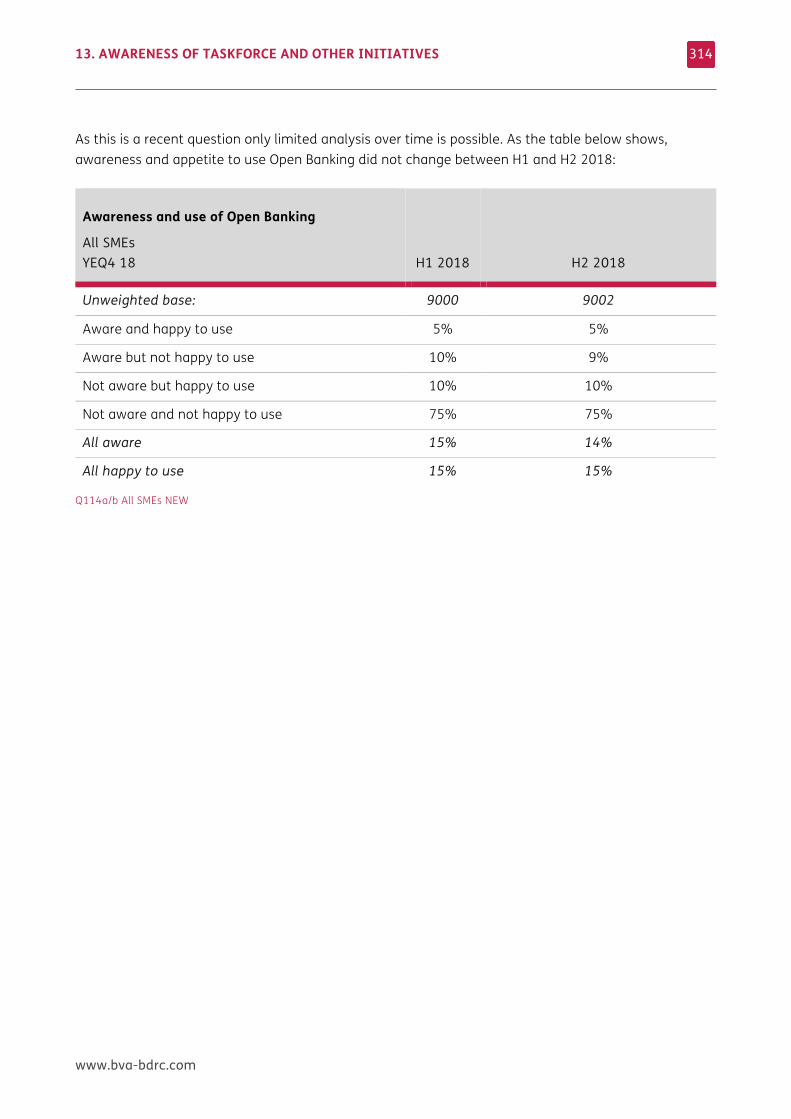
13. AWARENESS OF TASKFORCE AND OTHER INITIATIVES
www.bva-bdrc.com
314
As this is a recent question only limited analysis over time is possible. As the table below shows, awareness and appetite to use Open Banking did not change between H1 and H2 2018:
Awareness and use of Open Banking
All SMEs YEQ4 18 H1 2018 H2 2018
Unweighted base: 9000 9002
Aware and happy to use 5% 5%
Aware but not happy to use 10% 9%
Not aware but happy to use 10% 10%
Not aware and not happy to use 75% 75%
All aware 15% 14%
All happy to use 15% 15%
Q114a/b All SMEs NEW

www.bva-bdrc.com
14 GRAPHS AND CHARTS THIS CHAPTER PRESENTS some of the key data in graphical form to provide data on longer term trends.
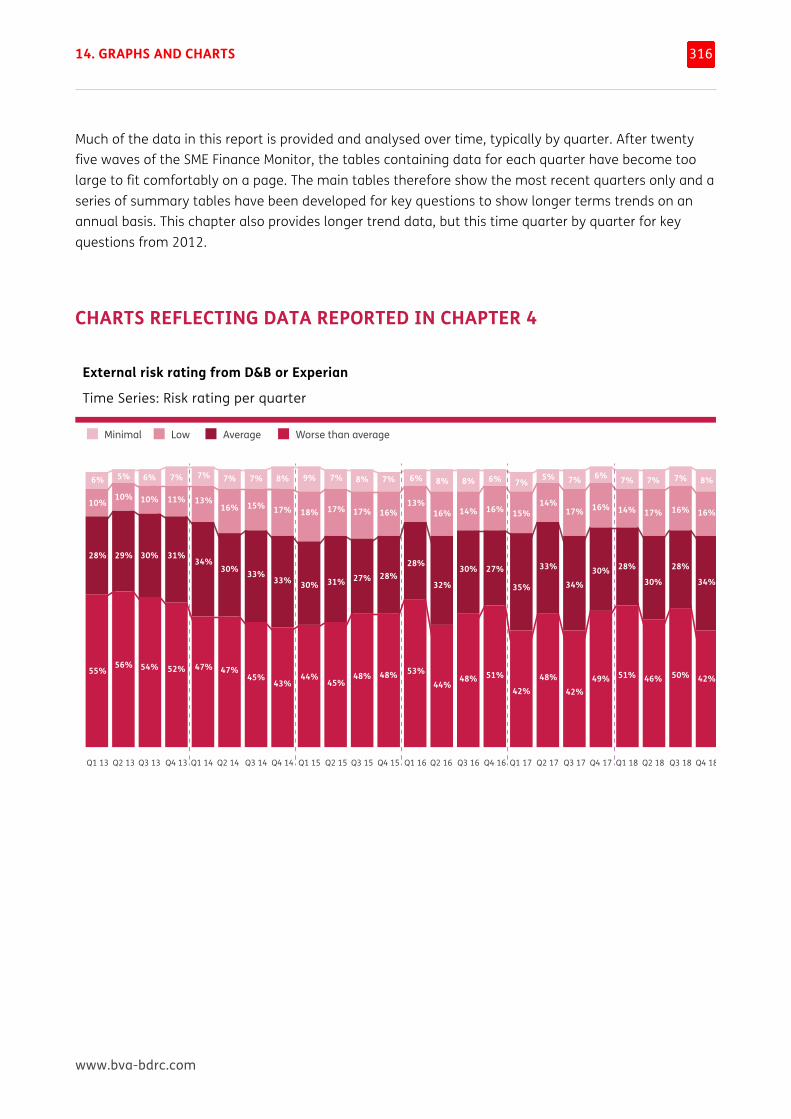
14. GRAPHS AND CHARTS
www.bva-bdrc.com
316
Much of the data in this report is provided and analysed over time, typically by quarter. After twenty five waves of the SME Finance Monitor, the tables containing data for each quarter have become too large to fit comfortably on a page. The main tables therefore show the most recent quarters only and a series of summary tables have been developed for key questions to show longer terms trends on an annual basis. This chapter also provides longer trend data, but this time quarter by quarter for key questions from 2012.
CHARTS REFLECTING DATA REPORTED IN CHAPTER 4 External risk rating from D&B or Experian
Time Series: Risk rating per quarter
Risk rating
External risk rating from D&B or ExperianTime series: Risk rating per quarter
Q2 13 Q3 13 Q4 13
5%
10%
29%
56%
6%
10%
30%
54%
Q1 13
6%
10%
28%
55%
Minimal Average Worse than averageLow
7%
11%
31%
52%
Q1 14 Q2 14
7%
13%
34%
47%
7%
16%
30%
47%
Q3 14 Q4 14
7%
15%
33%
45%
8%
17%
33%
43%
Q1 15 Q2 15
9%
18%
30%
44%
7%
17%
31%
45%
Q3 15 Q4 15
8%
17%
27%
48%
7%
16%
28%
48%
Q1 16
6%
13%
28%
53%
Q2 16
8%
16%
32%
44%
Q3 16
8%
14%
30%
48%
Q4 16
6%
16%
27%
51%
Q1 17
7%
15%
35%
42%
Q2 17
5%
14%
33%
48%
Q3 17
7%
17%
34%
42%
Q4 17 Q1 18 Q2 18
6%
16%
30%
49%
7%
14%
28%
51%
7%
17%
30%
46%
Q3 18 Q4 18
7%
16%
28%
50%
8%
16%
34%
42%
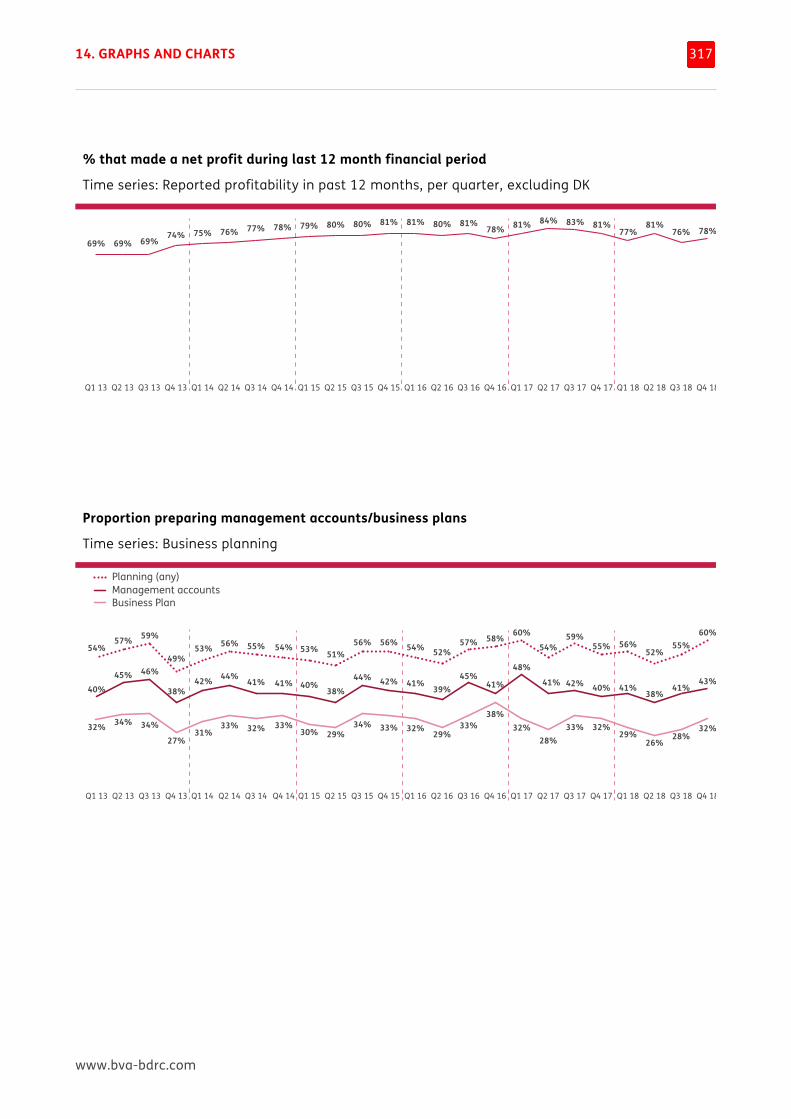
14. GRAPHS AND CHARTS
www.bva-bdrc.com
317
% that made a net profit during last 12 month financial period
Time series: Reported profitability in past 12 months, per quarter, excluding DK
Proportion preparing management accounts/business plans
Time series: Business planning
Q1 13 Q2 13
Q241
% that made a net profit during last 12 month financial periodTime series: Reported profitability in past 12 months, per quarter, excluding DK
69% 69%
Q3 13
69%
Q4 13
74%
Q1 14
75%
Q2 14
76%
Q3 14
77%
Q4 14
78% 79% 80%
Q1 15 Q2 15
80% 81%
Q3 15
80%
Q2 16
81%
Q3 16
78% 77%
Q4 16
81% 81% 81%83%
Q1 17
84%
Q2 17 Q3 17 Q4 17Q4 15
81%
Q1 16 Q1 18 Q2 18
76% 78%
Q3 18 Q4 18
54%57%
32% 34%
40%45%
Q223
Proportion preparing management accounts/business plansTime series: Business planning
Q1 13 Q2 13
59%
34%
46%
Q3 13
Planning (any)Management accountsBusiness Plan
49%
27%
38%
Q4 13
53%
31%
42%
Q1 14
56%
33%
44%
Q2 14
55%
32%
41%
Q3 14
54%
33%
41%
32%
54%
41%
Q4 14
53%
30%
40%
Q1 15
51%
29% 29%
38%
Q2 15
56%
34%
44%
Q3 15
56%
33%
42%
Q4 15 Q1 16
52%
39%
Q2 16
33%
57%
45%
Q3 16
38%
58%
41%
Q4 16
32%
60%
48%
Q1 17
28%
54%
41%
Q2 17
33%
59%
42%
Q3 17
32%
55%
40%
29%
56%
41%
26%
52%
38%
Q4 17 Q1 18 Q2 18
28%
55%
41%
32%
60%
43%
Q3 18 Q4 18
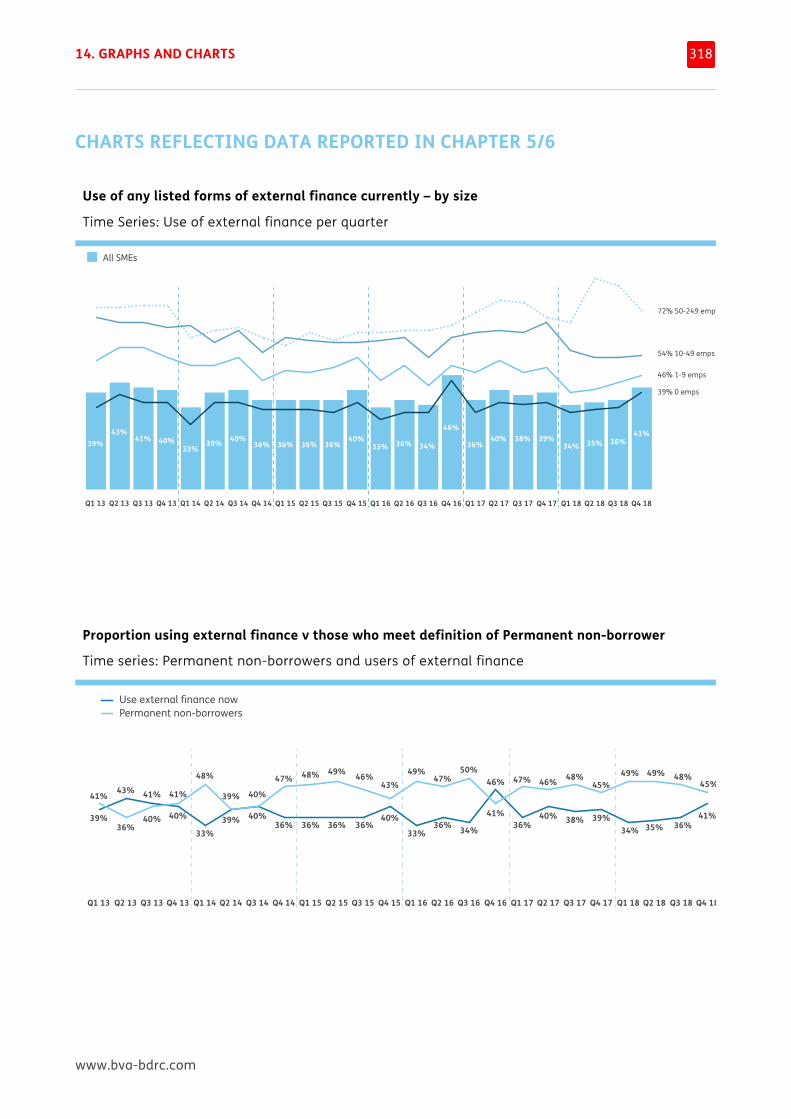
14. GRAPHS AND CHARTS
www.bva-bdrc.com
318
CHARTS REFLECTING DATA REPORTED IN CHAPTER 5/6 Use of any listed forms of external finance currently – by size
Time Series: Use of external finance per quarter
Proportion using external finance v those who meet definition of Permanent non-borrower
Time series: Permanent non-borrowers and users of external finance
Q15
Use of any listed forms of external finance currently – by sizeTime series: Use of external finance per quarter
Q1 13
39%
Q2 13 Q3 13
43%41%
All SMEs
72% 50-249 emps
54% 10-49 emps
46% 1-9 emps
39% 0 emps
Q4 13
40%
Q1 14
33%
Q2 14
39%
Q3 14
40%
Q4 14
36%
Q1 15
36%
Q2 15
36% 36%40%
Q3 15 Q4 15
33%
Q1 16
36%
Q2 16
34%
Q3 16
46%
Q4 16
36%
Q1 17
40%
Q2 17
38%
Q3 17
39%34% 35%
Q4 17 Q1 18 Q2 18
36%41%
Q3 18 Q4 18
41%
40%39%
41%
Q15/14 and others
Proportion using external finance v those who meet definition of “Permanent non-borrower”Time series: Permanent non-borrowers and users of external finance
Q1 13 Q3 13
36%
43%
Q2 13
Permanent non-borrowersUse external finance now
40%
41%
Q4 13
33%
48%
Q1 14
39%
39%
Q2 14
40%
40%
Q3 14
36%
47% 47%
Q4 14
36%
48%
Q1 15
36%
49%
Q2 15
36% 36%
46%
40%
43%
Q3 15 Q4 15
33%
49%
Q1 16 Q2 16
50%
34%
Q3 16
41%
46%
Q4 16
47%
36%
Q1 17
46%
40%
Q2 17
34%
49%
Q1 18
35%
49%
Q2 18
36%
48%
Q3 18
41%
45%
Q4 18
48%
38%
Q3 17
45%
39%
Q4 17
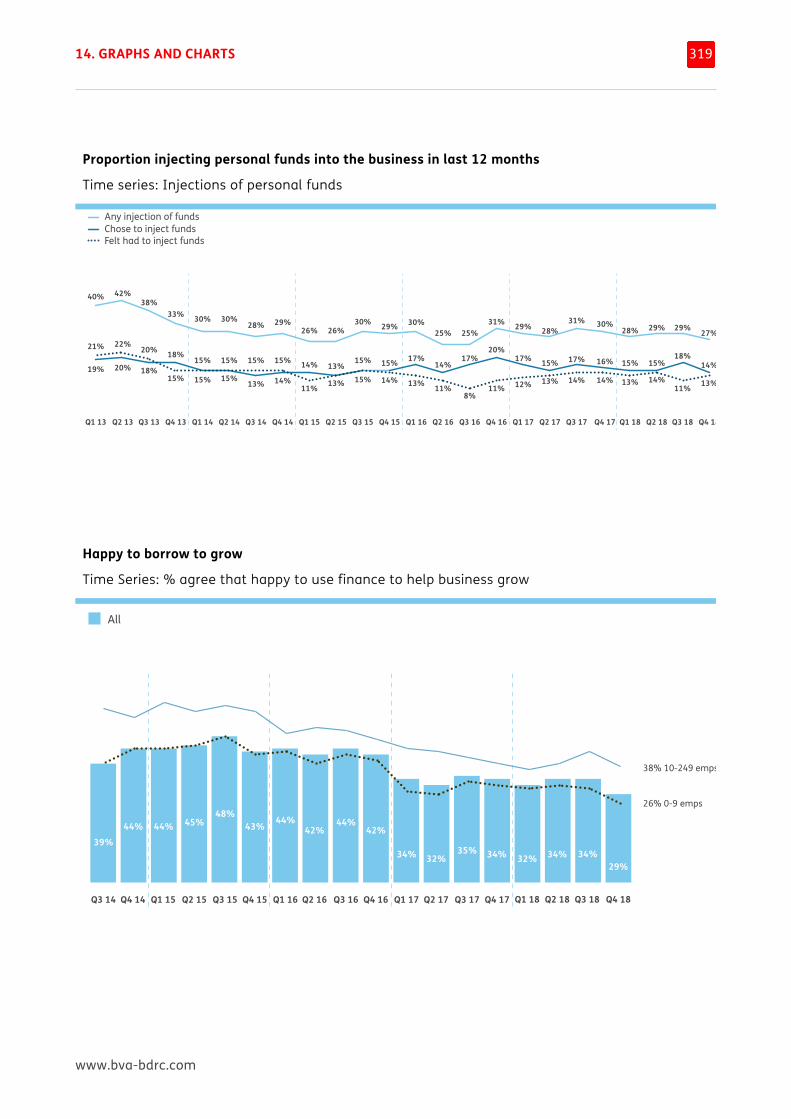
14. GRAPHS AND CHARTS
www.bva-bdrc.com
319
Proportion injecting personal funds into the business in last 12 months
Time series: Injections of personal funds
Happy to borrow to grow
Time Series: % agree that happy to use finance to help business grow
19% 20%
40% 42%
21% 22%
Q15/14 and others
Proportion injecting personal funds into the business in last 12 monthsTime series: Injections of personal funds
Q1 13 Q2 13
18%
38%
20%
Q3 13
Any injection of fundsChose to inject fundsFelt had to inject funds
15%
33%
18%
Q4 13
15%
30%
15%
Q1 14
15%
30%
15%
Q2 14
15%
28%
13%
Q3 14
14%
29%
15%
Q4 14
14% 14%
26% 25%
11% 11%
Q1 15
13% 13%
26%
13%15%
30%
15% 14%
29%
15%
Q2 15 Q3 15 Q4 15
30%
17%
Q1 16 Q2 16
17%
25%
8%
Q3 16
20%
31%
11%
Q4 16
17%
29%
12%
Q1 17
15%
28%
13%
Q2 17
15%
29%
13%
Q1 18
15%
28%
14%
Q2 18
18%
27%
11%
Q3 18
14%
29%
13%
Q4 18
17%
31%
14%
Q3 17
16%
30%
14%
Q4 17
Q238
Happy to borrow to growTime series: % agree that happy to use finance to help business grow
All
38% 10-249 emps
26% 0-9 emps
Q3 14
39%
Q4 14
44%
Q1 15
44%
Q2 15
45%
Q3 15
48%
Q4 15
43%
Q1 16
44%
Q2 16
42%
Q3 16
44%
Q4 16
42%
Q1 17
34% 34% 34% 34%29%
35%32% 32%
Q2 17 Q3 17 Q4 17 Q1 18 Q2 18 Q3 18 Q4 18
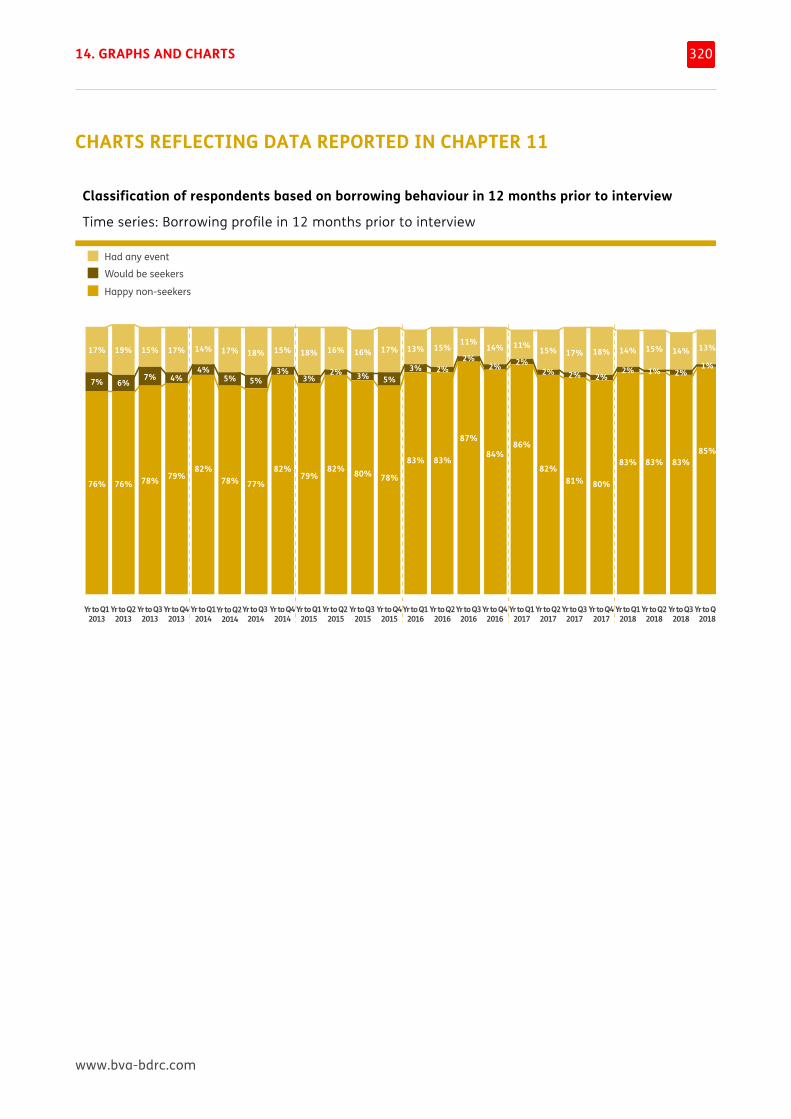
14. GRAPHS AND CHARTS
www.bva-bdrc.com
320
CHARTS REFLECTING DATA REPORTED IN CHAPTER 11 Classification of respondents based on borrowing behaviour in 12 months prior to interview
Time series: Borrowing profile in 12 months prior to interview
17%
7%
76%
Yr to Q12013
19%
6%
76%
Yr to Q22013
15%
7%
78%
Yr to Q32013
Q115/209
Classification of respondents based on borrowing behaviour in 12 months prior to interviewTime series: Borrowing profile in 12 months prior to interview
Had any event
Happy non-seekers
Would be seekers
17%
4%
79%
Yr to Q42013
17%
5%
78%
Yr to Q2 2014
14%
4%
82%
Yr to Q12014
15%
3%
82%
Yr to Q42014
18%
5%
77%
Yr to Q3 2014
16%
2%
82%
Yr to Q2 2015
18%
3%
79%
Yr to Q12015
Yr to Q42015
Yr to Q3 2015
17%
5%
78%
Yr to Q12016
13%
3%
83%
Yr to Q22016
15%
2%
83%
Yr to Q32016
11%
2%
87%
Yr to Q42016
14%
2%
84%
Yr to Q12017
11%
2%
86%
Yr to Q22017
15%
2%
82%
Yr to Q32017
17%
2%
81%
Yr to Q42017
18%
2%
80%
16%
3%
80%
Yr to Q12018
14%
2%
83%
Yr to Q22018
15%
1%
83%
Yr to Q32018
14%
2%
83%
Yr to Q42018
13%
1%
85%
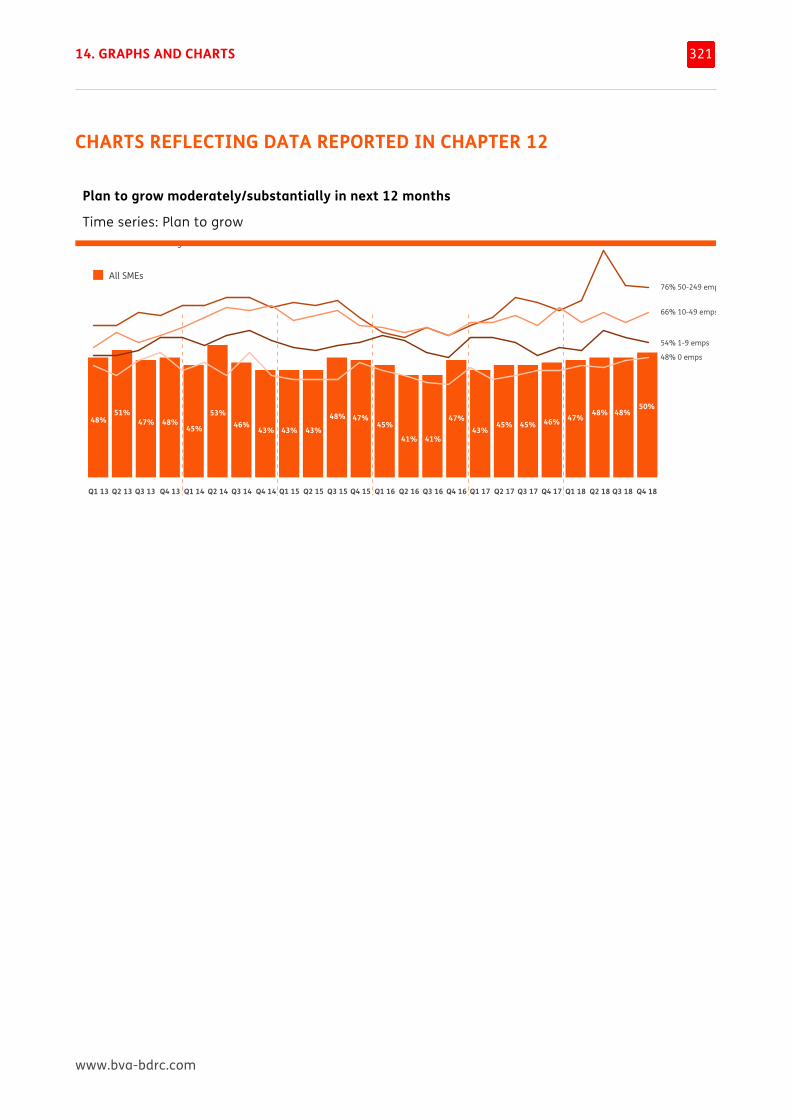
14. GRAPHS AND CHARTS
www.bva-bdrc.com
321
CHARTS REFLECTING DATA REPORTED IN CHAPTER 12 Plan to grow moderately/substantially in next 12 months
Time series: Plan to grow
Q26/Q225
Plan to grow moderately/substantially in next 12 monthsTime series: Plan to grow
Q1 13
48%
Q2 13
51%
Q3 13
47%
Q4 13
48%
All SMEs76% 50-249 emps
66% 10-49 emps
54% 1-9 emps
48% 0 emps
Q1 14
45%
Q2 14
53%
Q3 14
46%
Q4 14
43%
Q1 15
43%
Q2 15
48%
Q3 15
47%
Q4 15
45%
Q1 16
41%
Q2 16
41%
Q3 16
47%
Q4 16
43%
Q1 17
45%
Q2 17
45%
Q3 17
46%
Q4 17
43%47%
Q1 18
48%
Q2 18
48%
Q3 18
50%
Q4 18
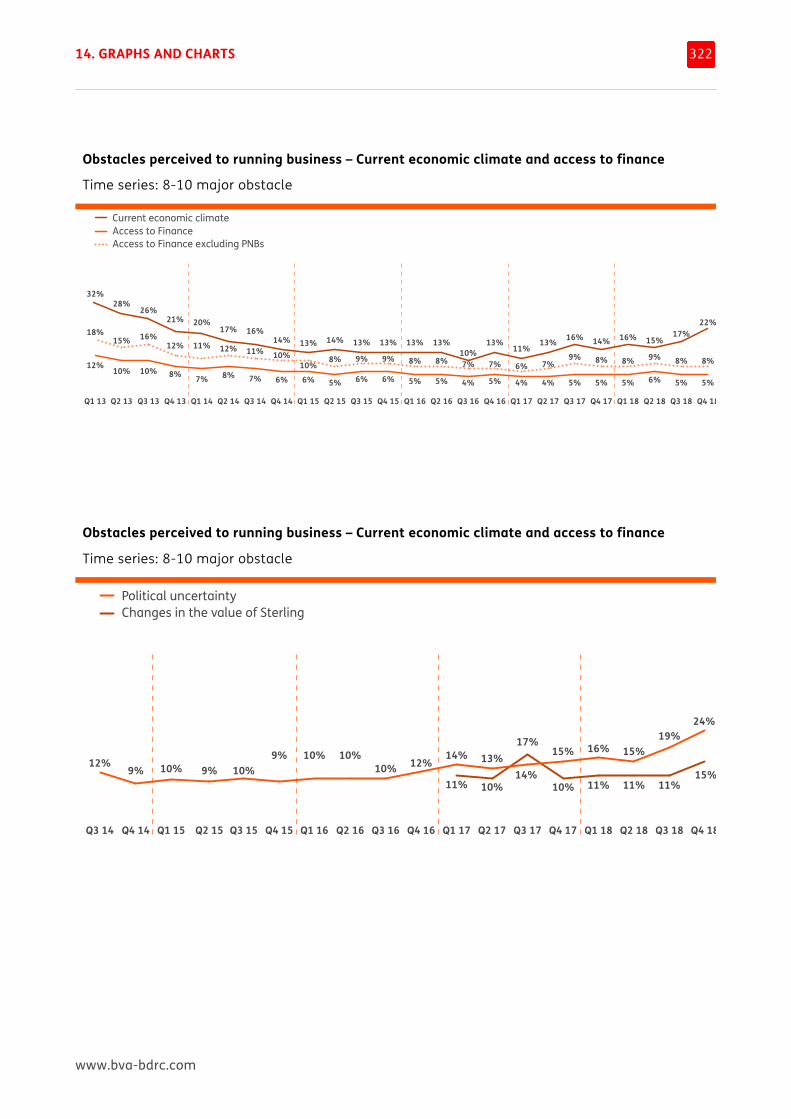
14. GRAPHS AND CHARTS
www.bva-bdrc.com
322
Obstacles perceived to running business – Current economic climate and access to finance
Time series: 8-10 major obstacle
Obstacles perceived to running business – Current economic climate and access to finance
Time series: 8-10 major obstacle
32%28%
18%15%
12%10%
Q227
Obstacles perceived to running business – Current economic climate and access to financeTime series: 8-10 major obstacle
Q1 13 Q2 13
26%
16%
10%
Q3 13
21%
12%
8%
Q4 13
Access to FinanceAccess to Finance excluding PNBs
Current economic climate
20%
11%
7%
Q1 14
17%
12%
8%
Q2 14
16%
11%
7%
Q3 14
14%
10%
6%
Q4 14
13%
10%6%
Q1 15
14%
8%
5%
Q2 15
13%
9%
6%
Q3 15 Q4 15
13%
9%
6%
Q1 16
13%
8%
5%
Q2 16
13%
8%
5%
Q4 16
13%
7%
5%
Q3 16
10%7%
4%
Q2 17
13%
7%
4%
Q3 17
16%
9%
5%
Q4 17
14%
8%
5%
Q1 17
11%
6%
4%
Q2 18
15%
9%
6%
Q1 18
16%
8%
5%
Q4 18
22%
8%
5%
Q3 18
17%
8%
5%
Obstacles perceived to running business – Current economic climate and access to financeTime series: 8-10 major obstacle
Changes in the value of SterlingPolitical uncertainty
12%
Q3 14
9%
Q4 14
10%
Q1 15
9%
Q2 15
10%
Q3 15 Q4 15
9%
Q1 16
10%
Q2 16
10%
Q4 16
12%
Q3 16
10%
Q2 17
13%
11%
Q3 17
14%10%
Q4 17
15%17%
Q1 17
14%
Q2 18
15%
11%
Q1 18
16%
10%
Q4 18
24%
11%15%
Q3 18
19%
11%
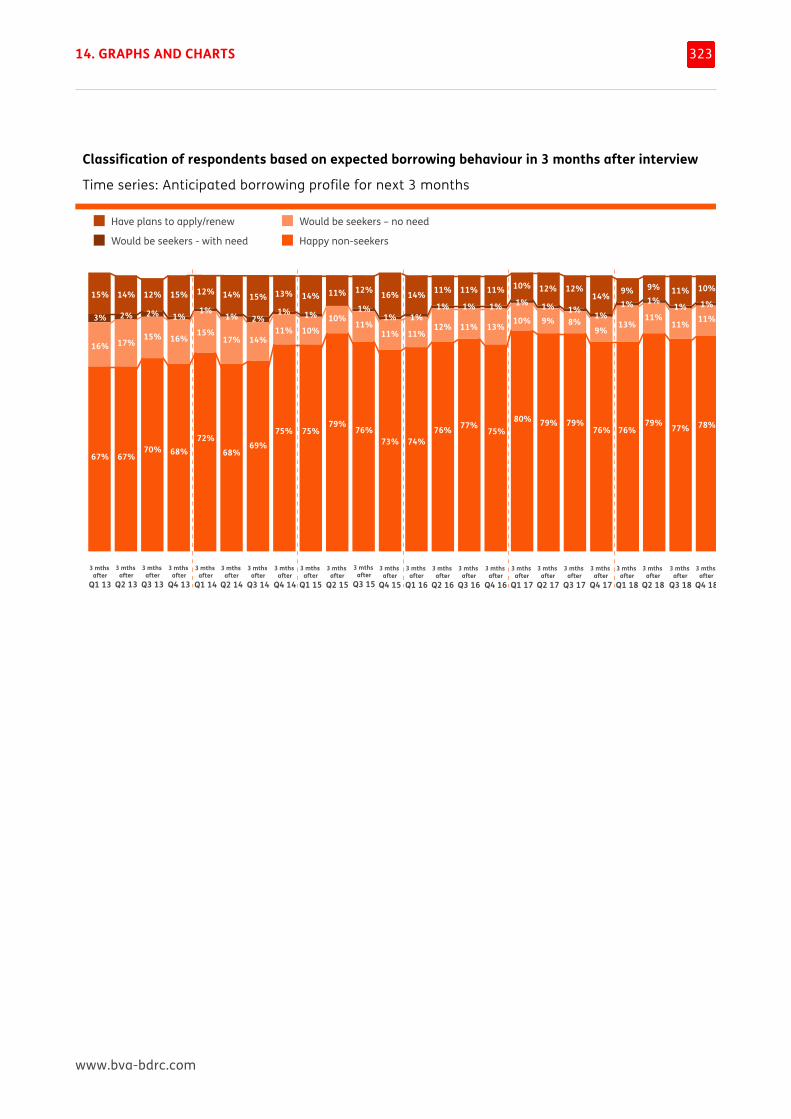
14. GRAPHS AND CHARTS
www.bva-bdrc.com
323
Classification of respondents based on expected borrowing behaviour in 3 months after interview
Time series: Anticipated borrowing profile for next 3 months
Q229
Classification of respondents based on expected borrowing behaviour in 3 months after interviewTime series: Anticipated borrowing profile for next 3 months
3 mths after
Q2 13
14%
2%
17%
67%
3 mths after
Q3 13
12%
2%
15%
70%
3 mths after
Q4 13
15%
1%
16%
68%
3 mths after
Q1 13
15%
3%
16%
67%
Have plans to apply/renew Would be seekers – no need
Happy non-seekersWould be seekers - with need
3 mths after
Q1 14
12%
1%
15%
72%
3 mths after
Q2 14
14%
1%
17%
68%
3 mths after
Q3 14
15%
2%
14%
69%
3 mths after
Q4 14
13%
1%
11%
75%
3 mths after
Q1 15
14%
1%
10%
75%
3 mths after
Q2 15
11%
10%
79%
3 mths after
Q3 15
3 mths after
Q4 15
12%
1%
11%
76%
16%
11%
73%
1%
3 mths after
Q1 16
14%
11%
74%
1%
3 mths after
Q2 16
11%
12%
76%
1%
3 mths after
Q3 16
11%
11%11%
77%
1%
3 mths after
Q4 16
11%
13% 13%
75%
1%
3 mths after
Q1 17
10%
10%
80%
1%
3 mths after
Q2 17
3 mths after
Q1 18
3 mths after
Q2 18
12%
9%
79%
1%
3 mths after
Q3 17
12%
8%
79% 79%
1%
3 mths after
Q4 17
14% 9%
9%
76% 76%
1%1%
9%1%
11%11%
3 mths after
Q3 18
3 mths after
Q4 18
78%
11%
77%
1%
10%
1%
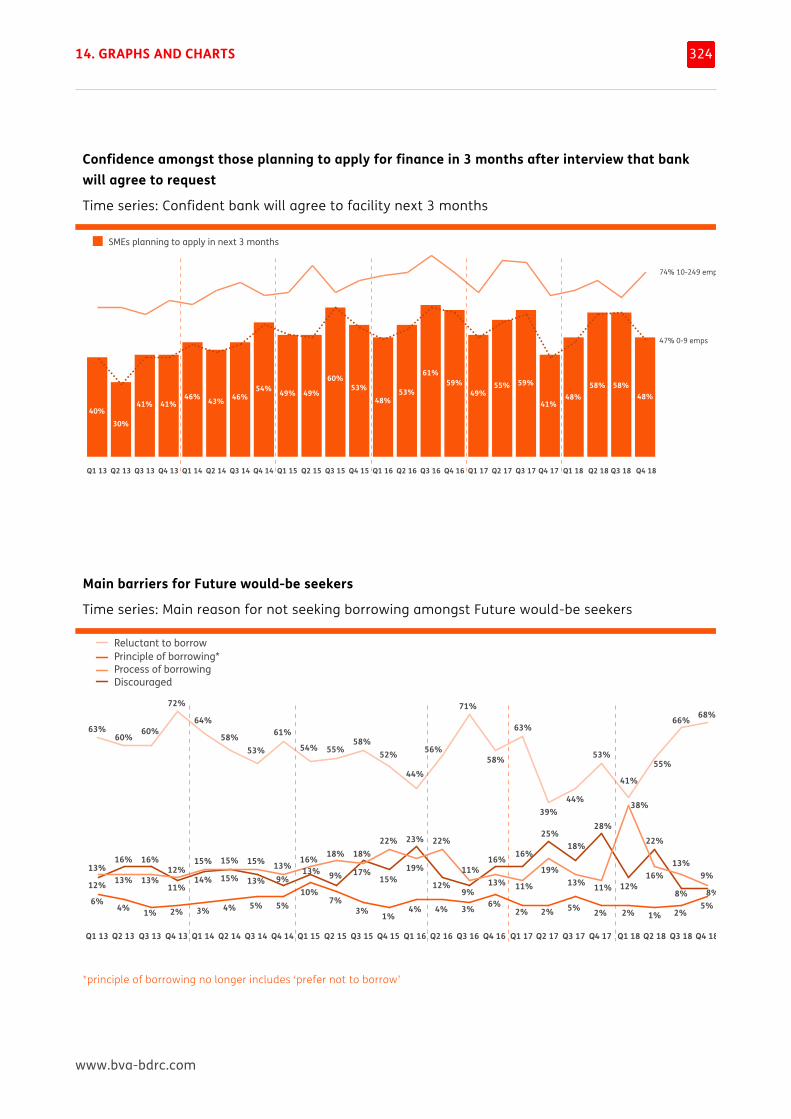
14. GRAPHS AND CHARTS
www.bva-bdrc.com
324
Confidence amongst those planning to apply for finance in 3 months after interview that bank will agree to request
Time series: Confident bank will agree to facility next 3 months
Main barriers for Future would-be seekers
Time series: Main reason for not seeking borrowing amongst Future would-be seekers
*principle of borrowing no longer includes ‘prefer not to borrow’
Q238
Confidence amongst those planning to apply for finance in 3 months after interview that bank will agree to requestTime series: Confident bank will agree to facility next 3 months
Q1 13
40%
Q2 13
30%
Q3 13
41%
Q4 13
41%
SMEs planning to apply in next 3 months
74% 10-249 emps
47% 0-9 emps
Q1 14
46%
Q2 14
43%
Q3 14
46%
Q4 14
54%
Q1 15
49%
Q2 15
49%
Q3 15
60%
Q4 15
53%
Q1 16
48%
Q2 16
53%
Q3 16
61%
Q4 16
59%
Q1 17
49% 48%
Q2 17
55%
Q3 17
59% 58%
Q4 17
41%
Q1 18 Q2 18
58%48%
Q3 18 Q4 18
Q239a *‘Principle of borrowing’ no longer includes ‘prefer not to borrow’
Main barriers for future “would-be seekers”Time series: Main reason for not seeking borrowing amongst future “would-be seekers”
Principle of borrowing*Process of borrowingDiscouraged
Reluctant to borrow
12%
16%
63%60%
13%13%
6%4%
16%
60%
13%
1%
11%
72%
12%
2%
64%
3%
15%
58%
15%
14%
15%
4%
Q1 13 Q2 13 Q3 13 Q4 13 Q1 14 Q2 14
53%
5%
9%
61%
13%
13%
15%
5%
Q3 14 Q4 14
13%
54%
16%
10%
Q1 15
55%
7%
9%
18%
Q2 15 Q3 15 Q4 15
18%
58%
17%
3%
52%
1%
15% 12%
22% 22%
Q1 16 Q2 16
44%
56%
4% 4%
9%
11%
Q3 16
71%
58%
3%
16%
13%
Q4 16
6%
63%
16%
11%
Q1 17
2%
39%
25%
19%
Q2 17
2%
44%
41%
18%
13%
Q3 17
5%
53%55%
28%
12%
22%
11%
38%
16%
Q4 17
2% 2% 1%
23%
19%
Q1 18 Q2 18
66% 68%
8% 8%
13%9%
2%5%
Q3 18 Q4 18
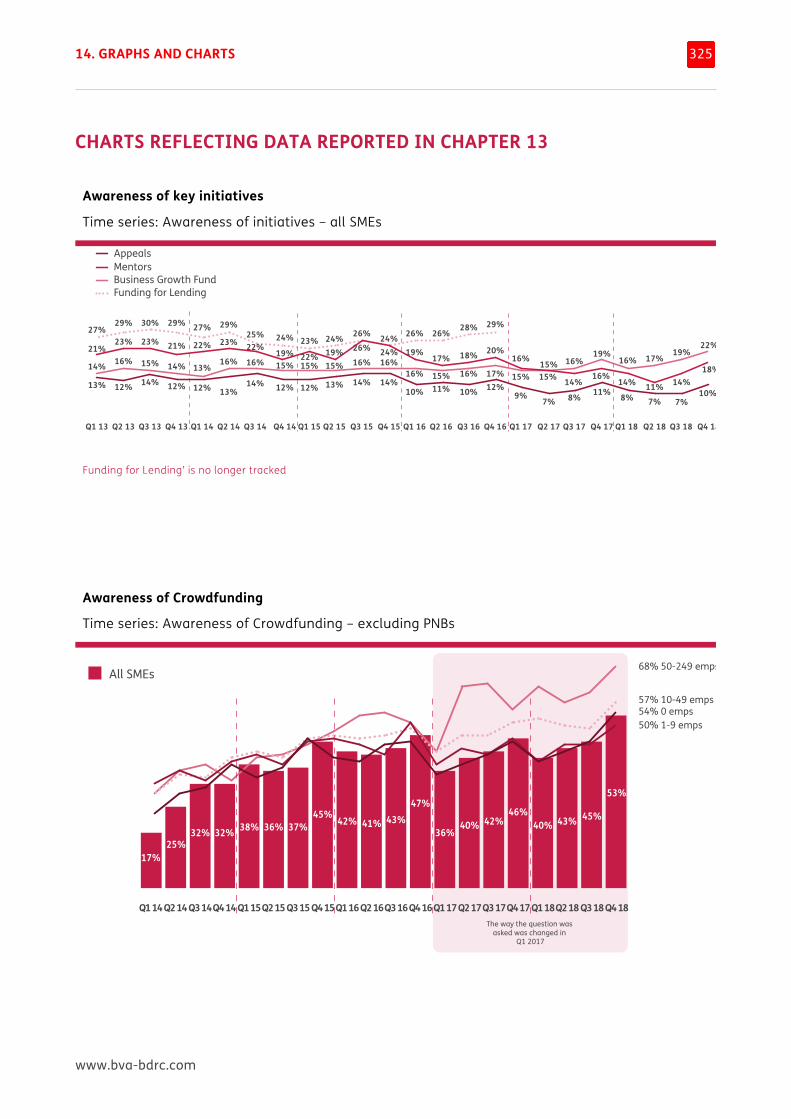
14. GRAPHS AND CHARTS
www.bva-bdrc.com
325
CHARTS REFLECTING DATA REPORTED IN CHAPTER 13 Awareness of key initiatives
Time series: Awareness of initiatives – all SMEs
Funding for Lending’ is no longer tracked
Awareness of Crowdfunding
Time series: Awareness of Crowdfunding – excluding PNBs
Q240‘Funding for Lending’ is no longer tracked
Awareness of key initiativesTime series: Awareness of initiatives – all SMEs
MentorsBusiness Growth FundFunding for Lending
Appeals
27%29%
13% 12%
14% 16%21%
23%
30%
14%
15%
23%
29%
12%
14%
21%
27%
12%
13%
22%
29%
13%
16%
23%
Q1 13 Q2 13 Q3 13 Q4 13 Q1 14 Q2 14
25%
14%
16%
22%24%
12%
15%19%
Q3 14 Q4 14
23%
12%
15%22%
Q1 15
24%
13%
15%19%
Q2 15
26%
14%
16%26%
Q3 15
24%
14%
16%24%
Q4 15
26%
10%
16%
19%
Q1 16
26%
11%15%
17%
Q2 16
28%
10%
16%
18%
Q3 16
29%
12%17%
20%
Q4 16
9%
15%
16%
Q1 17
7% 7%
15%15%
Q2 17
8% 8%
14% 14% 11%
16%
Q3 17
11%
16%
19%16% 17%
Q4 17 Q1 18 Q2 18
10%7%
14%18%
19%22%
Q3 18 Q4 18
Q236a2
Awareness of CrowdfundingTime series: Awareness of Crowdfunding – excluding PNBs
Q1 14
17%
All SMEs
The way the question was asked was changed in
Q1 2017
68% 50-249 emps
57% 10-49 emps
50% 1-9 emps54% 0 emps
Q2 14Q3 14
25%32%
Q4 14Q1 15
32% 38%
Q2 15Q3 15
36% 37%
Q4 15
45%
Q1 16
42%
Q2 16
41%
Q3 16
43%
Q4 16
47%
Q1 17
36%
Q2 17 Q1 18Q2 18
40%
Q3 17
42% 43%40%
Q3 18Q4 18
53%
45%
Q4 17
46%
www.bva-bdrc.com
15 TECHNICAL APPENDIX THIS CHAPTER COVERS the technical elements of the report – sample size and structure, weighting and analysis techniques.
15. TECHNICAL APPENDIX
www.bva-bdrc.com
327
ELIGIBLE SMES In order to qualify for interview, SMEs had to meet the following criteria in addition to the quotas by size, sector and region:
• not 50%+ owned by another company
• not run as a social enterprise or as a not for profit organisation
• turnover of less than £25m.
The respondent was the person in charge of managing the business’s finances. No changes have been made to the screening criteria in any of the waves conducted to date.
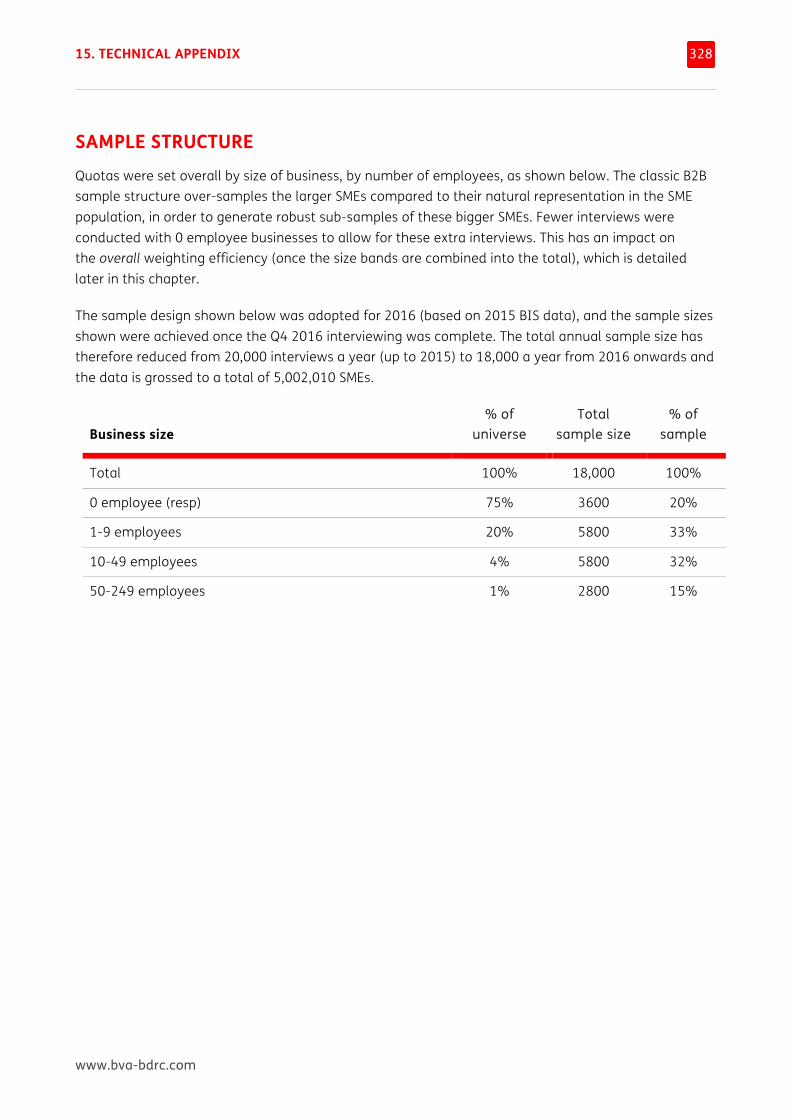
15. TECHNICAL APPENDIX
www.bva-bdrc.com
328
SAMPLE STRUCTURE Quotas were set overall by size of business, by number of employees, as shown below. The classic B2B sample structure over-samples the larger SMEs compared to their natural representation in the SME population, in order to generate robust sub-samples of these bigger SMEs. Fewer interviews were conducted with 0 employee businesses to allow for these extra interviews. This has an impact on the overall weighting efficiency (once the size bands are combined into the total), which is detailed later in this chapter.
The sample design shown below was adopted for 2016 (based on 2015 BIS data), and the sample sizes shown were achieved once the Q4 2016 interviewing was complete. The total annual sample size has therefore reduced from 20,000 interviews a year (up to 2015) to 18,000 a year from 2016 onwards and the data is grossed to a total of 5,002,010 SMEs.
Business size
% of universe
Total sample size
% of sample
Total 100% 18,000 100%
0 employee (resp) 75% 3600 20%
1-9 employees 20% 5800 33%
10-49 employees 4% 5800 32%
50-249 employees 1% 2800 15%
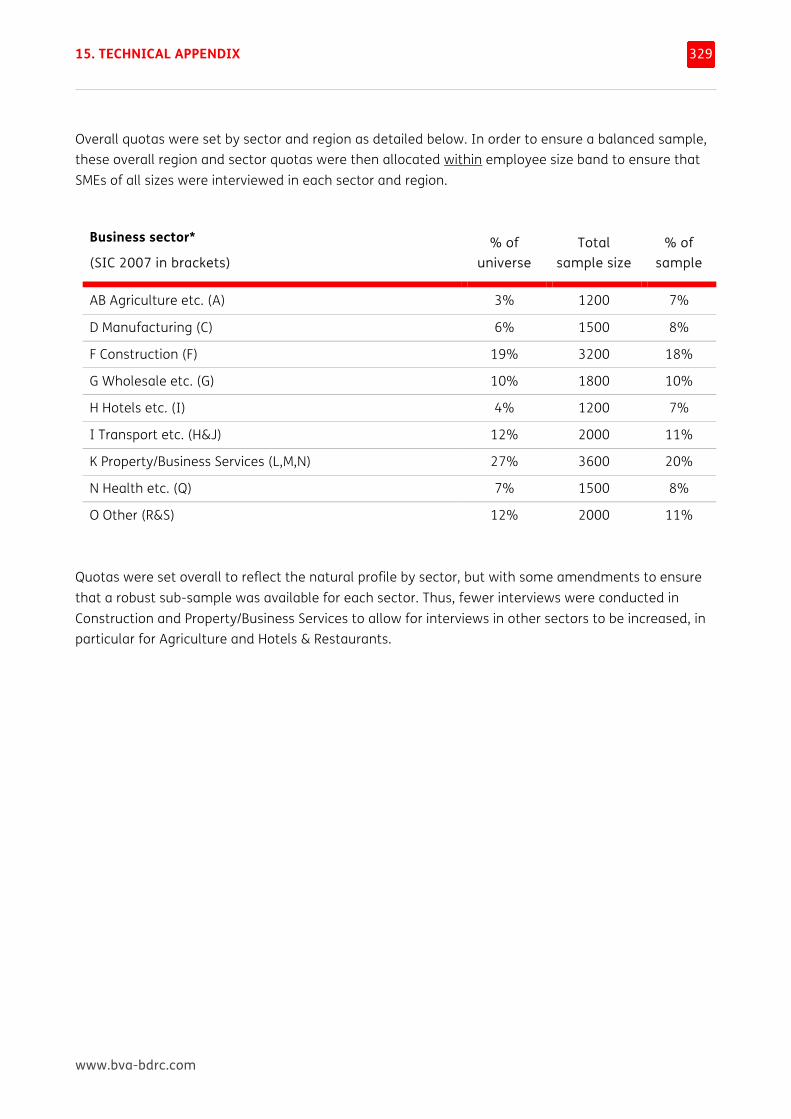
15. TECHNICAL APPENDIX
www.bva-bdrc.com
329
Overall quotas were set by sector and region as detailed below. In order to ensure a balanced sample, these overall region and sector quotas were then allocated within employee size band to ensure that SMEs of all sizes were interviewed in each sector and region.
Business sector*
(SIC 2007 in brackets) % of
universe Total
sample size % of
sample
AB Agriculture etc. (A) 3% 1200 7%
D Manufacturing (C) 6% 1500 8%
F Construction (F) 19% 3200 18%
G Wholesale etc. (G) 10% 1800 10%
H Hotels etc. (I) 4% 1200 7%
I Transport etc. (H&J) 12% 2000 11%
K Property/Business Services (L,M,N) 27% 3600 20%
N Health etc. (Q) 7% 1500 8%
O Other (R&S) 12% 2000 11%
Quotas were set overall to reflect the natural profile by sector, but with some amendments to ensure that a robust sub-sample was available for each sector. Thus, fewer interviews were conducted in Construction and Property/Business Services to allow for interviews in other sectors to be increased, in particular for Agriculture and Hotels & Restaurants.
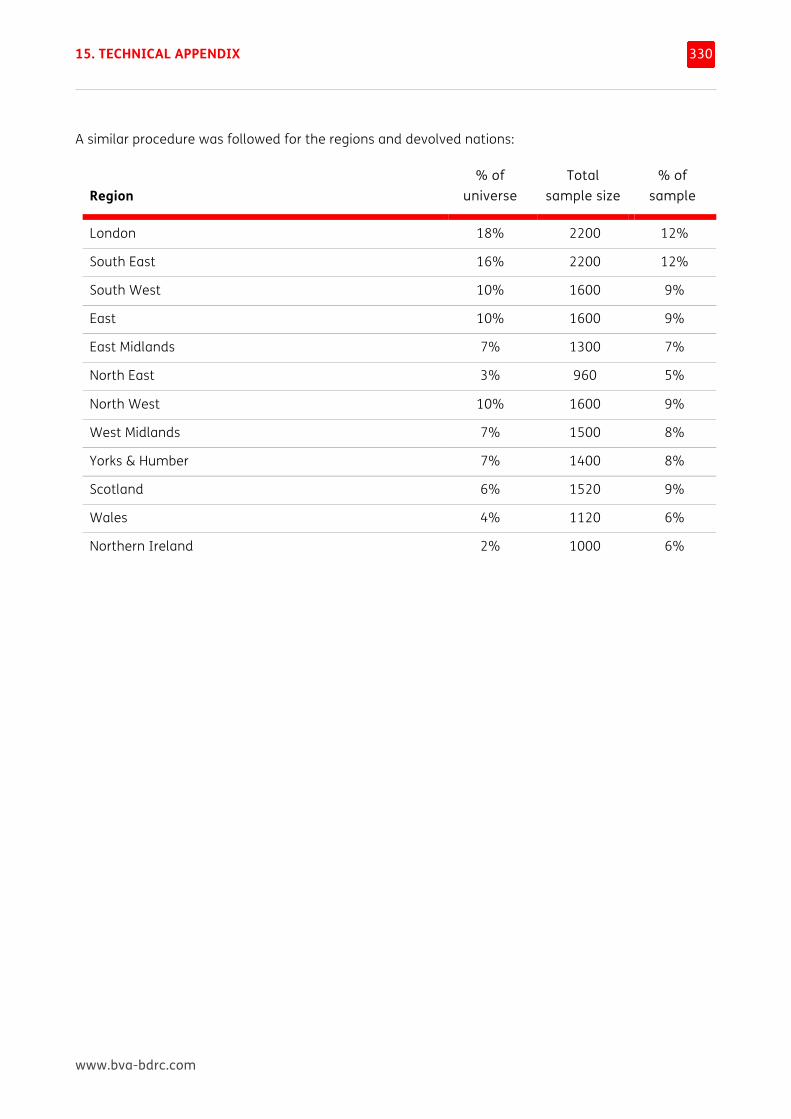
15. TECHNICAL APPENDIX
www.bva-bdrc.com
330
A similar procedure was followed for the regions and devolved nations:
Region
% of universe
Total sample size
% of sample
London 18% 2200 12%
South East 16% 2200 12%
South West 10% 1600 9%
East 10% 1600 9%
East Midlands 7% 1300 7%
North East 3% 960 5%
North West 10% 1600 9%
West Midlands 7% 1500 8%
Yorks & Humber 7% 1400 8%
Scotland 6% 1520 9%
Wales 4% 1120 6%
Northern Ireland 2% 1000 6%
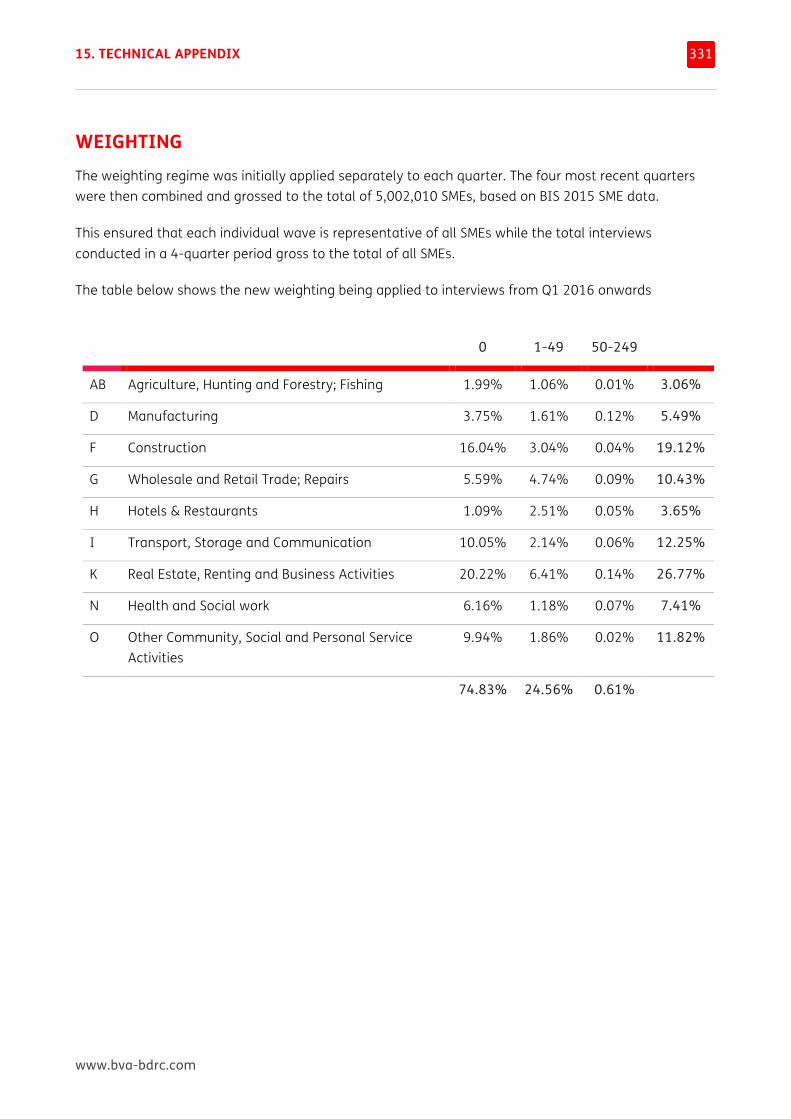
15. TECHNICAL APPENDIX
www.bva-bdrc.com
331
WEIGHTING The weighting regime was initially applied separately to each quarter. The four most recent quarters were then combined and grossed to the total of 5,002,010 SMEs, based on BIS 2015 SME data.
This ensured that each individual wave is representative of all SMEs while the total interviews conducted in a 4-quarter period gross to the total of all SMEs.
The table below shows the new weighting being applied to interviews from Q1 2016 onwards
0 1-49 50-249
AB Agriculture, Hunting and Forestry; Fishing 1.99% 1.06% 0.01% 3.06%
D Manufacturing 3.75% 1.61% 0.12% 5.49%
F Construction 16.04% 3.04% 0.04% 19.12%
G Wholesale and Retail Trade; Repairs 5.59% 4.74% 0.09% 10.43%
H Hotels & Restaurants 1.09% 2.51% 0.05% 3.65%
I Transport, Storage and Communication 10.05% 2.14% 0.06% 12.25%
K Real Estate, Renting and Business Activities 20.22% 6.41% 0.14% 26.77%
N Health and Social work 6.16% 1.18% 0.07% 7.41%
O Other Community, Social and Personal Service Activities
9.94% 1.86% 0.02% 11.82%
74.83% 24.56% 0.61%
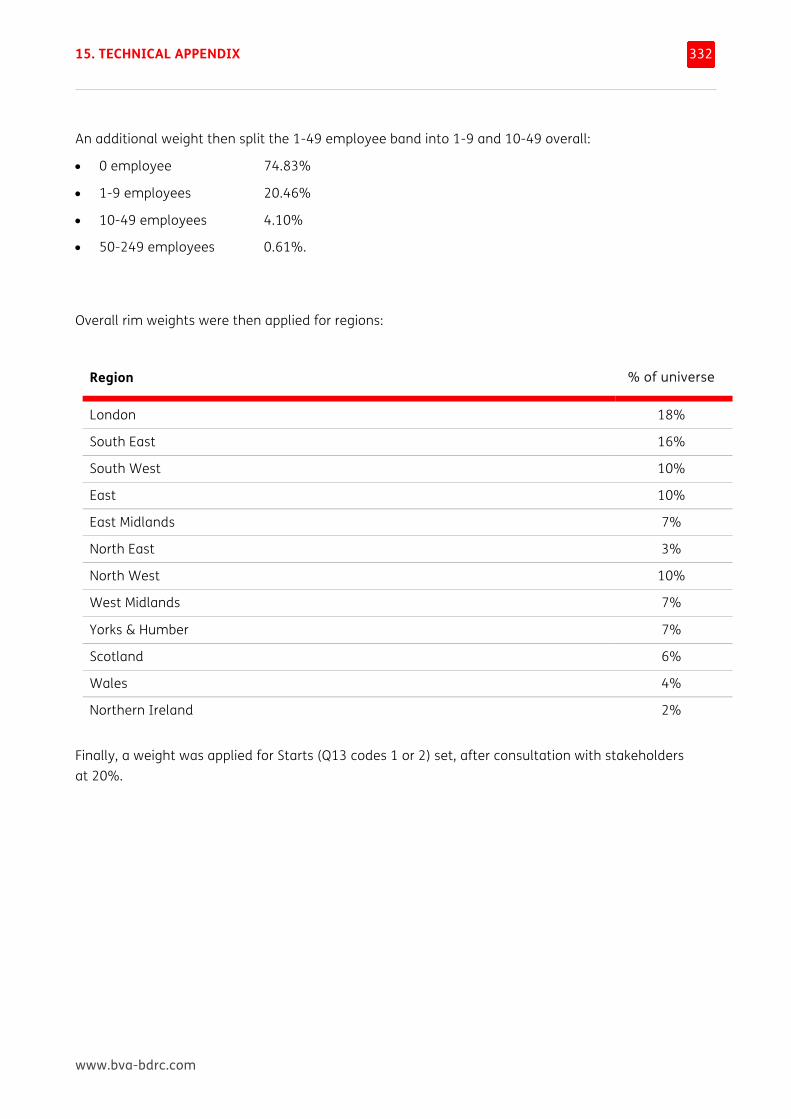
15. TECHNICAL APPENDIX
www.bva-bdrc.com
332
An additional weight then split the 1-49 employee band into 1-9 and 10-49 overall:
• 0 employee 74.83%
• 1-9 employees 20.46%
• 10-49 employees 4.10%
• 50-249 employees 0.61%.
Overall rim weights were then applied for regions:
Region % of universe
London 18%
South East 16%
South West 10%
East 10%
East Midlands 7%
North East 3%
North West 10%
West Midlands 7%
Yorks & Humber 7%
Scotland 6%
Wales 4%
Northern Ireland 2%
Finally, a weight was applied for Starts (Q13 codes 1 or 2) set, after consultation with stakeholders at 20%.
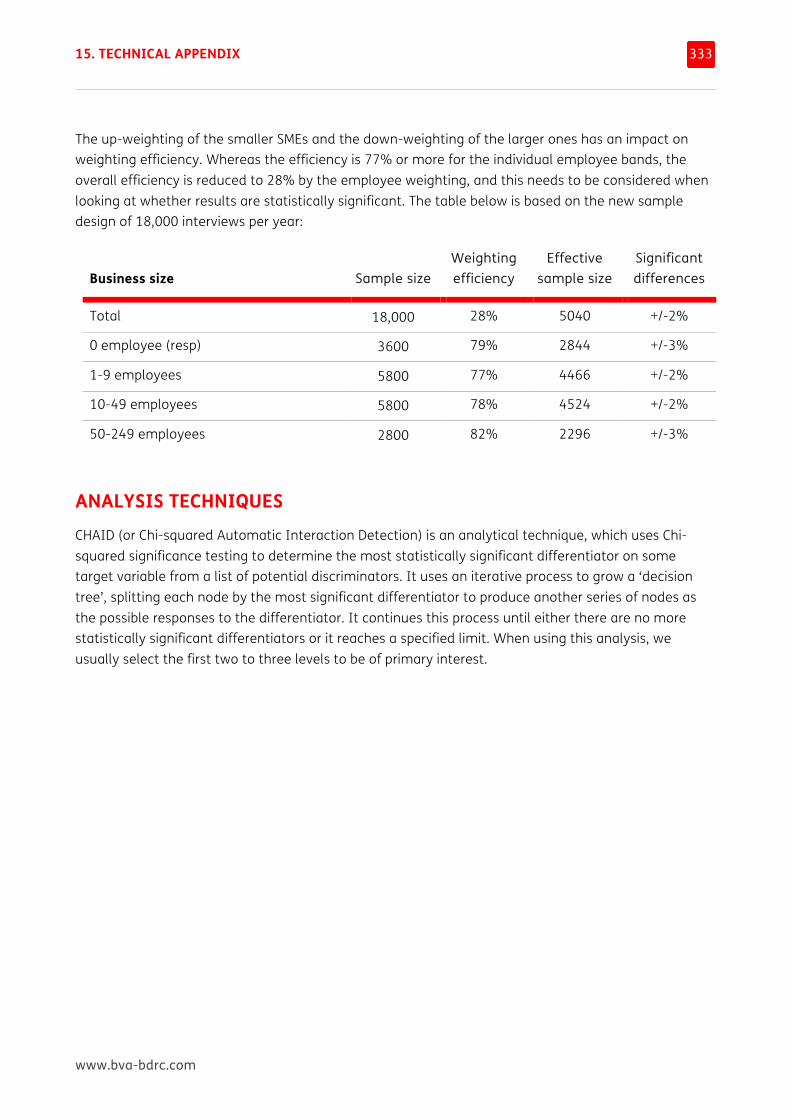
15. TECHNICAL APPENDIX
www.bva-bdrc.com
333
The up-weighting of the smaller SMEs and the down-weighting of the larger ones has an impact on weighting efficiency. Whereas the efficiency is 77% or more for the individual employee bands, the overall efficiency is reduced to 28% by the employee weighting, and this needs to be considered when looking at whether results are statistically significant. The table below is based on the new sample design of 18,000 interviews per year:
Business size Sample size
Weighting efficiency
Effective sample size
Significant differences
Total 18,000 28% 5040 +/-2%
0 employee (resp) 3600 79% 2844 +/-3%
1-9 employees 5800 77% 4466 +/-2%
10-49 employees 5800 78% 4524 +/-2%
50-249 employees 2800 82% 2296 +/-3%
ANALYSIS TECHNIQUES CHAID (or Chi-squared Automatic Interaction Detection) is an analytical technique, which uses Chi-squared significance testing to determine the most statistically significant differentiator on some target variable from a list of potential discriminators. It uses an iterative process to grow a ‘decision tree’, splitting each node by the most significant differentiator to produce another series of nodes as the possible responses to the differentiator. It continues this process until either there are no more statistically significant differentiators or it reaches a specified limit. When using this analysis, we usually select the first two to three levels to be of primary interest.
15. TECHNICAL APPENDIX
www.bva-bdrc.com
334
This report is the largest and most detailed study of SMEs’ views of bank finance ever undertaken in the UK. More importantly, this report is one of a series of regular reports. So not only is it based on a large enough sample for its findings to be robust, but over time the dataset has been building into a hugely valuable source of evidence about what is really happening in the SME finance market.
A report such as this can only cover the main headlines emerging from the results. Information within this report and extracts and summaries thereof are not offered as advice and must not be treated as a substitute for financial or economic advice. This report represents BVA BDRC’s interpretation of the research information and is not intended to be used as a basis for financial or investment decisions. Advice from a suitably qualified professional should always be sought in relation to any particular matter or circumstance.