Embed Size (px)
Citation preview

HOW COMMERCIAL SHIPPING IS POLLUTING OUR AIR
Smog Alert


Smog Alert
HOW COMMERCIAL SHIPPING IS POLLUTING OUR AIR
AUTHORS
Vickie Patton
Janea Scott
Nancy Spencer

2
We would like to acknowledge the many individuals who have contributed to this report. Carrie Atiyeh Kowalski and Michelle Bicek provided extensive anal-ysis, research and expertise. Isabelle Silverman also provided valuable research. John Kowalczyk conducted the technical analysis in the Executive Summary and Appendix A comparing pollution from commercial marine vessels to pollution from highway vehicles. And many reviewers provided thoughtful and useful comments. Thank you all.
On the cover: Left: Jessica Mendelowitz (Environmental Defense). Right: U.S. Department of Transportation, Maritime Administration.
Our mission Environmental Defense is dedicated to protecting the environmental rights of all people, including the right to clean air, clean water, healthy food and flourishing ecosystems. Guided by science, we work to create practical solutions that win lasting political, economic and social support because they are nonpartisan, cost-effective and fair.
©2004 Environmental Defense
The report is available online at www.environmentaldefense.org.

3
Contents
Executive Summary 5
CHAPTER 1 Air pollution from ships threatens public health and the environment 9
CHAPTER 2 The Mighty Mississippi: huge ports are huge polluters 13
CHAPTER 3 Controlling ship pollution is critical in smog-plagued cities 14
CHAPTER 4 Small local vessels are big polluters in New York Harbor 15
CHAPTER 5 Ships in port deliver high levels of uncontrolled pollution into the City of Angels 18 CHAPTER 6 Inland ports and waterways rival coastal ship pollution 21
CHAPTER 7 Policy recommendations 23

4
Figure 1 NOx emissions from shipping
Emissions from Waterborne Commerce Vessels in United States Continental and Inland Waterways, Environ. Sci. Technol. 2000, 34, 3254-3260, Figure 3. Reprinted with permission from Environ. Sci. Technol., Copyright 2000 American Chemical Society.

5
Executive summary
A huge container ship docks at the Port of Los Angeles, where it unloads tons of cargo and a plume of black exhaust. This scene is repeated across the country, wherever commercial ships operate: from the ports of the West Coast to New York Harbor, along the Gulf Coast to Houston, up the Mississippi River to the great inland ports of Louisiana, and further even to landlocked states far from the coasts where major ports like Pittsburgh send cargo downriver by barge.
The air pollution from these floating smokestacks is pervasive. It is con-centrated in the densely populated urban centers that are also major hubs for international shipping. But commercial shipping reaches well beyond these major cities. Figure 1 shows how smog-forming oxides of nitrogen (NOx) follow commercial shipping traffic to America’s coastal ports and deep into the heart-land, hundreds of miles from the ocean.
The U.S. Environmental Protection Agency (EPA) estimates that each year commercial marine vessels discharge 1 million tons of NOx, 40,000 tons of microscopic particles and 160,000 tons of sulfur dioxide, contaminants that con-tribute to excessive smog and particulate pollution in communities nationwide. And, according to EPA, high concentrations of smog and particulate pollution produce a ripple of public health and environmental harm each year, including many thousands of premature deaths, hospitalizations, and emergency room visits for children due to asthma attacks.
Some 159 million Americans in 474 counties live in areas with unhealthy smog levels, EPA recently determined. The finding brought 31 states into the nation’s smog pollution abatement program. The states are required to submit plans by June 2007 detailing measures they will take to restore healthy air. Later this year, EPA will identify the communities with unhealthy particulate levels, and trigger additional state pollution control responsibilities.
To achieve clean air, all major sources of smog and particulate pollution will need to clean up. Leaving some pollution sources out of the equation will only slow vital progress to protect public health and impose heightened pollution control burdens on other economic sectors.
This report documents how commercial shipping pollutes our air. While it closely examines the contribution to smog pollution, commercial shipping also has an important role in harmful particulate pollution. Simply put, many com-munities face choppy waters ahead unless EPA brings these ships in line with the strong pollution control standards that apply to other parts of the transportation sector.
EPA has announced an initiative to curb the harmful pollution from diesel-powered commercial marine vessels such as tugboats, barges and ferries. EPA’s action will determine whether diesel ships will be held to the same rigorous pollution control standards as land-based diesel engines. And it will determine whether pollution controls for these engines become an integral part of com-munities’ efforts to achieve clean and healthful air.

6
Air pollution from ships is a growing threat to public health and the environment Ships comprise a major part of many local air pollution inventories. Table 1 compares the smog-forming NOx pollution discharged by commercial marine vessels with onroad vehicles including passenger cars and trucks, urban buses, and large diesel freight trucks. It shows that the pollution levels from commercial shipping are analogous to those discharged by hundreds of thousands of vehicles used on roadways.
While lowering pollution from the vehicles on the nation’s roadways has been a cornerstone of the country’s clean air strategies, pollution from com-mercial shipping until recently has been overlooked. Even today, ship emissions are subject only to sporadic and weak air quality protections that leave most vessels fuel completely uncontrolled. Predictions indicate the problem of ship pollution will only get worse: U.S. ports expect shipping traffic to double over the next ten years.
TABLE 1 Comparison of smog-forming pollution from commercial marine vessels in key ports with onroad vehicles (including passenger cars and trucks, urban buses and large diesel freight trucks)
Port Number of onroad vehicles discharging NOx pollution levels comparable to commercial shipping
Houston-Galveston 288,000 onroad vehicles Los Angeles/South Coast 442,000 onroad vehicles Lower Mississippi 585,000 onroad vehicles New York/New Jersey Ports 303,000 onroad vehicles
Huge ports are huge polluters The deepwater ports of the Lower Mississippi River from Baton Rouge to the Gulf of Mexico together form the largest port complex in the world. Oceangoing ships, as well as the tugboats that move barges, are a major source of smog-forming pollution in this stretch of the river. Figure 1 shows that the intensity of NOx pollution here is among the highest in the nation.
Controlling ship pollution is critical in high smog areas While areas around the country struggle to lower unhealthy smog levels, the pollution from commercial marine vessels has yet to be meaningfully controlled. Houston-Galveston is one area that has begun to recognize the scope of its commercial marine pollution.
Small local vessels can be big pollution sources Ship pollution does not come solely from large, foreign-flagged ships like tankers and container ships. Smaller watercraft can have a big impact on air qual-ity depending on their engine type and the fuel they burn. In New York,

7
Environmental Defense has partnered with major ferry operators and government agencies to clean up the pollution from existing boats. Retrofit, repower and voluntary clean fuel programs such as this are a critical way to jumpstart emis-sions reductions from existing marine engines in the period before newer, cleaner engines come into wide use.
Ships at dock deliver uncontrolled air pollution into the heart of crowded cities When oceangoing vessels are “hotelling” in port, loading and unloading cargo, many of their engines continue to run to provide power for loading equipment, heating and cooling. At dock, frequently in dense urban areas, these ships carry out the activities of land-based industries. Yet unlike land-based facilities, the resulting harmful air pollution is not controlled. Los Angeles area ports have begun to examine solutions such as limiting the use of ship engines at dock and building facilities for hotelling ships to use land-based electrical power.
Inland ports and waterways rival coastal ship pollution The nation’s inland commercial waterway system extends along the East and Gulf coasts, through the St. Lawrence Seaway to the Great Lakes, and up rivers more than a thousand miles from the open ocean. Barges, rafted together and moved by tugboats, carry most of the cargo on these routes. These small but powerful craft deliver pollution to urban and rural areas along rivers far from the sea. Leading researchers have estimated that at inland ports like Pittsburgh commercial marine traffic produces as much smog-forming NOx per mile as passenger cars on a crowded urban highway.
Ports are the natural focus for ship emissions because ships gather there. But researchers have also estimated that a high percentage of ship emissions in the U.S. occur outside port facilities, in shipping channels located on rivers or coastal waterways within 200 miles of shore.
Recommendations Federal, state and local governments must work together to cut the airborne contaminants from both new and existing high-polluting marine diesel engines.
• EPA must set rigorous national particulate and NOx emission standards for new marine engines to aid state and local governments in restoring healthful air. Table 2 lists the top 50 American ports by cargo volume and shows how many communities are impacted by air pollution from commercial shipping. EPA’s recent decision to require low sulfur fuel for small and medium-sized commercial ships will lower harmful pollution in its own right and enable the advanced technology necessary to cut particulate and NOx emissions.
• The United States Government must undertake a renewed effort—through federal standards and international agreements—to curtail the pollution from large oceangoing ships. This includes prompt action by the United States Senate to ratify amendments to the international convention to control pollution

8
from ships, which the President transmitted to the Senate for its advice and consent on May 15, 2003.
• EPA and local governments should clean up the harmful pollution from existing diesel marine engines, relying on near-term pollution abatement strategies such as retrofit and repower programs. This will help clean up the pollution from existing ships that will not be controlled by new federal emission standards.
• Regulatory agencies, port authorities and commercial shipping firms should provide cleaner land-based power for ships at dock to curb hotelling pollution.
• Regulatory agencies and port authorities should also establish operational requirements, including fuel-switching and speed reduction in and near ports, to reduce nearshore pollution levels.
• Governments at all levels should develop accurate and up-to-date vessel pollution inventories to better assess and control threats from commercial marine pollution.
TABLE 2 Top U.S. ports ranked by cargo volume (tons)
Rank Port Millions of tons Rank Port Millions of tons1 South Louisiana, LA 216.4 26 Portland, OR 26.6 2 Houston, TX 177.6 27 Paulsboro, NJ 26.4 3 New York/New Jersey 134.5 28 Marcus Hook, PA 25.2 4 Beaumont, TX 85.9 29 Charleston, SC 25.0 5 New Orleans, LA 85.0 30 Port Arthur, TX 22.7 6 Huntington, WV 81.1 31 Richmond, CA 21.9 7 Corpus Christi, TX 72.0 32 Port Everglades, FL 21.3 8 Long Beach, CA 67.9 33 Savannah, GA 20.7 9 Baton Rouge, LA 60.6 34 Tacoma, WA 20.6 10 Plaquemines, LA 59.1 35 Chicago, IL 20.4 11 Texas City, TX 55.2 36 Boston, MA 20.3 12 Los Angeles, CA 52.2 37 Seattle, WA 19.6 13 Pittsburg, PA 52.1 38 Jacksonville, FL 17.9 14 Valdez, AK 50.5 39 Detroit, MI 17.3 15 Tampa, FL 48.4 40 Honolulu, HI 16.6 16 Lake Charles, LA 47.5 41 Memphis, TN 16.4 17 Mobile, AL 46.0 42 Anacortes, WA 15.4 18 Duluth-Superior, MN, WI 44.2 43 Two Harbors, MN 14.9 19 Hampton Roads, VA 39.2 44 Indiana Harbor, IN 13.8 20 Baltimore, MD 38.8 45 Cincinnati, OH 13.0 21 Philadelphia, PA 34.1 46 Oakland, CA 12.5 22 St. Louis, MO and IL 32.6 47 San Juan, PR 12.4 23 Pascagoula, MS 31.9 48 Cleveland, OH 11.4 24 Freeport, TX 27.2 49 Toledo, OH 11.1 25 Portland, ME 27.1 50 Presque Isle, MI 10.6
Source: American Association of Port Authorities (www.aapa-ports.org/pdf/2002_US_Cargo_Rank.pdf)

9
CHAPTER 1
Air pollution from ships threatens public health and the environment
According to EPA’s national emission inventory data, commercial ships annually emit about 1 million tons of smog-forming NOx, 40,000 tons of small particulates, and 160,000 tons of sulfur dioxide.1 Ship emissions are significant contributors to many local air pollution inventories as well. In various cities around the country, commercial marine vessels pollute as much as hundreds of thousands of onroad vehicles, including diesel freight trucks, passenger cars, and buses.
Despite the magnitude of air pollution they produce, ships are subject only to sporadic and weak air quality protections that leave most vessels poorly controlled. The small and medium-sized diesel marine engines that power watercraft such as barges, tugboats and ferries will be subject to weak limits on smog-forming pollution for new engines in 2004 and 2007, depending on engine size. And existing engines are not subject to these or any other standards.
EPA has unveiled the preliminary features of a new program to address the pollution from small and medium-sized commercial ships. EPA’s recent decision to lower the sulfur content of the diesel fuel used in these engines will cut harmful pollution and provide the cleaner fuel necessary for strong emission standards. But EPA must build from this foundation to establish tough emission limits on the contaminants from these high-emitting diesel engines.
For the larger engines that power oceangoing ships, EPA has adopted federal emission standards identical to those contained in the international marine pollution treaty known as MARPOL Annex VI. Annex VI has yet to be ratified by the required number of countries to become binding and, in any event, needs bolstering. When it does go into effect, its lenient emission standards for NOx and SOx pollution from new oceangoing marine engines will not lower the current high levels of air pollution. And neither Annex VI or EPA regulations impose any limits on the extremely high sulfur content in the residual fuel burned in oceangoing vessels or any controls on pollution from existing ships.
Commercial marine shipping is a booming business. The volume of goods moving in and out of the United States on container ships is expected to double in the next ten to 15 years after already doubling in the last decade.2 As more ships make more calls in U.S. ports to carry this traffic, they will produce more pollution. Commercial marine traffic will therefore be responsible for an increasingly large share of the air pollution that Americans breathe over the coming years due to the dual effect of this upward growth trend and weak pollution control standards.
Ship exhaust – what’s in it? Commercial marine vessels are generally powered by compression-ignition engines; the same diesel technology that powers highway trucks and buses and
10
nonroad diesel equipment used in construction, agriculture, mining and industrial applications. While the massive diesel engines that power oceangoing vessels have no land-based counterparts, the medium-sized engines that power tugboats, ferries and harbor craft are in many cases analogous to locomotive engines. And smaller craft including fishing boats run on engines comparable to those in construction equipment.
The similarity between marine and land-based diesel engines extends to their exhaust, which contains the same pollutants and poses the same hazards that led EPA to pursue more comprehensive air quality controls on land-based diesel engines and their fuel. Diesel exhaust is among the most dangerous forms of air pollution. The critical constituents of diesel exhaust include particulates, smog-forming NOx, sulfur dioxide, carbon monoxide and a laundry list of toxic chemicals. More than 40 constituents of diesel exhaust are listed by either the EPA or the California Air Resources Board as hazardous air pollutants or toxic air contaminants. Numerous governmental agencies and scientific bodies in the U.S. and worldwide – including the World Health Organization, National Insitute for Occupational Safety and Health, EPA, and the U.S. Department of Health and Human Services National Toxicology Program – have each found that diesel engine exhaust is a probable human carcinogen.
Fine particulate like that emitted from marine diesel engines has been implicated in a host of adverse and deadly health effects: asthma attacks3, stroke4, increased risk of hospitalization5 and death from lung cancer and cardiopulmonary disease.6
Marine engines produce dangerous particulate pollution several ways. They directly discharge fine particles, combustion of the high sulfur fuel produces a sulfur dioxide gas that transforms in the atmosphere into fine particles and the
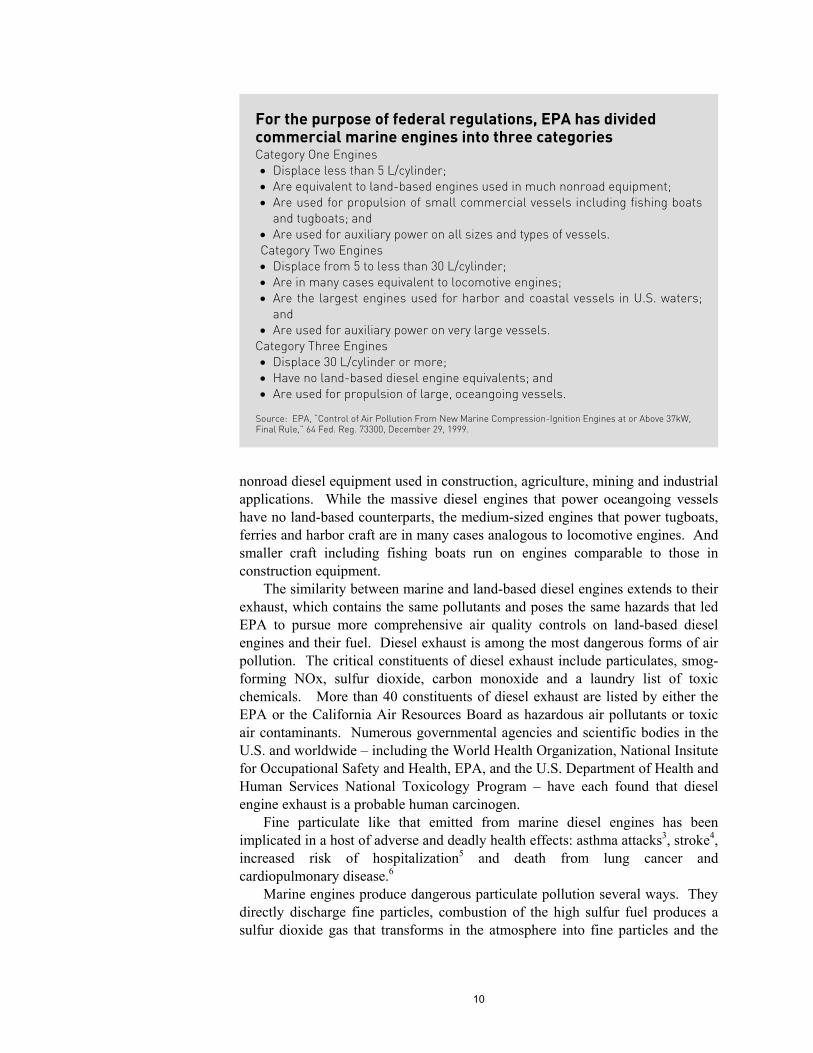
For the purpose of federal regulations, EPA has divided commercial marine engines into three categories Category One Engines • Displace less than 5 L/cylinder; • Are equivalent to land-based engines used in much nonroad equipment; • Are used for propulsion of small commercial vessels including fishing boats
and tugboats; and • Are used for auxiliary power on all sizes and types of vessels. Category Two Engines • Displace from 5 to less than 30 L/cylinder; • Are in many cases equivalent to locomotive engines; • Are the largest engines used for harbor and coastal vessels in U.S. waters;
and • Are used for auxiliary power on very large vessels.
Category Three Engines • Displace 30 L/cylinder or more; • Have no land-based diesel engine equivalents; and • Are used for propulsion of large, oceangoing vessels.
Source: EPA, “Control of Air Pollution From New Marine Compression-Ignition Engines at or Above 37kW, Final Rule,” 64 Fed. Reg. 73300, December 29, 1999.

11
NOx discharged from marine diesel engines can likewise transform into particles. Oceangoing vessels, for example, burn residual fuel that contains sulfur at levels up to 3000 times that required for land-based highway and nonroad diesel fuels.
Marine engines are a significant source of ozone-forming NOx. When NOx is released on hot, stagnant days, it can combine with volatile organic chemicals in the atmosphere to form ground-level ozone or smog. Ozone exacerbates the severity and frequency of asthma attacks. It causes coughing, throat irritation and congestion in healthy adults. Like most air pollutants, its adverse health effects are more extreme in small children and the elderly.
In 1997, EPA strengthened the national health-based air quality standard for ozone to protect children and other vulnerable populations against decreased lung function, respiratory ailments, hospital admissions and emergency room visits for respiratory causes, inflammation of the lungs, and possible long-term lung damage caused by high ozone levels.7
Since 1997, the public health imperative for the standard has become even stronger as further scientific investigation has documented ozone’s adverse health effects. Post-1997 studies have linked ozone with school absences resulting from sore throat, coughs, asthma attacks8, decreased lung function in girls with asthma9, and long-term lung damage in children.10
On April 15, 2004, EPA found that 474 counties across the country comprising some 159 million Americans violate the federal health-based air quality standard for ozone smog. As state and local governments work to protect their citizens from high ozone levels and comply with the Clean Air Act, they will need federal leadership to aid them in controlling the sources of smog-forming contaminants. It is particularly urgent for EPA to establish rigorous

12
federal emission standards for marine engines because of their significant contribution to unhealthy smog levels in highly populated regions, because they are poorly controlled and because emission and fuel standards are primarily within federal, rather than state or local, jurisdiction.
Marine fuels are the dirtiest of the dirty Commercial marine vessels burn two distinct types of fuel. Large oceangoing vessels generally burn residual fuel, also known as bunker fuel. Residual fuel is the tar-like product left behind after all the lighter petroleum fractions are refined from crude oil. Depending on the sulfur content of the crude oil, residual fuel sulfur levels can be as high as 45,000 ppm – an astonishing 4.5% sulfur. EPA reports that the worldwide average sulfur content of residual fuel is 27,000 ppm. This is more than ten times as high as the average sulfur level in distillate fuel burned by smaller marine vessels such as ferries and tugboats, and nearly 2000 times the 15 ppm level soon to be achieved for on-highway diesel fuels. The extraordinarily high sulfur content of residual fuel makes shipping one of the biggest sources of sulfur oxides pollution on earth, despite the relatively small number of large oceangoing ships in existence.
Smaller vessels, including harbor craft and tugboats on inland waterways, generally burn marine distillate fuel, which is refined from crude oil in a distillation process and is lighter than residual fuel. At present, marine distillate fuel is generally comparable to the diesel fuel used in much land-based nonroad equipment. Sulfur levels in marine distillate fuel vary with the specific grade of fuel, ranging from 115 ppm to 3493 ppm,a although EPA recently adopted a two-phase program to lower the sulfur fuel levels to 15 ppm by 2012.
Limiting marine fuel sulfur content to 15 ppm will yield two important benefits. First, curbing the fuel sulfur content of diesel engines will immediately lower sulfur dioxide and the resulting sulfate particulate pollution, regardless of the age or condition of the engine. Fine particle pollution levels tend to be highest in dense urban areas where many ports are located. The human health benefits from reducing sulfur dioxide and sulfate particulate pollution in these areas amply justifies limiting marine fuel sulfur content.
Second, lowering fuel sulfur content paves the way for the use of emission control technologies to reduce smog-forming NOx and direct particulates discharged from marine engines. Meaningful reduction of smog-forming NOx pollution and sooty particulates from commercial marine vessels therefore hinges upon EPA maintaining its commitment to lower the sulfur content in marine fuels to 15 ppm, as it has for land-based diesel fuels. a U.S. Environmental Protection Agency, Draft Regulatory Impact Analysis: Control of Emissions from
Nonroad Diesel Engines, EPA 420-R-03-008, Table 5.1-1 at p. 5-3, available online hwww.epa.gov/nonroad/r03008f.pdf (last visited May 5, 2004).

13
CHAPTER 2
The Mighty Mississippi: Huge ports are huge polluters
From Baton Rouge to the mouth of the Mississippi, along 254 miles of river, five deep water ports handle cargo coming down the Mississippi River and up from the Gulf of Mexico: Baton Rouge, South Louisiana, New Orleans, Plaquemine and Lake Charles. Together, these ports handle more cargo volume than any port complex in the world. Export traffic consists mainly of grain grown in the American heartland, transported by barge down the inland waterways of the Mississippi, Missouri and Ohio River systems, and loaded onto oceangoing freighters bound for ports around the world. The largest of the lower Mississippi ports, the Port of South Louisiana, alone accounts for 15% of total U.S. exports.11 The ports of the lower Mississippi also handle a huge volume of domestic trade, including petrochemicals, crude oil, coal and coke, and grain.
An EPA-commissioned study estimated annual pollution levels from oceangoing ships in the four largest ports of the Lower Mississippi. Notably,
these figures do not include emissions from the many tugboats that move barges down the Mississippi. Yet even this incomplete account-ing of ship emissions represents the highest level of marine vessel pollution anywhere in the country. Smog-forming NOx pollution from oceangoing craft operating in the Lower Mississippi is an estimated 60 percent of the NOx pollution from onroad vehicles in the New Orleans and Baton Rouge areas. In 1999, oceangoing ships were responsible for
about 23,000 tons of NOx per year. By comparison, onroad vehicles such as passenger cars and diesel freight trucks emitted about 37,000 tons of NOx that year.12
The Baton Rouge area violates the national health-based ozone standard. No area out of compliance with the federal health standard would try to clean up its air without considering measures to cut pollution from cars and trucks. Yet like other areas that have both a bad ozone problem and a busy commercial shipping business, Baton Rouge has yet to integrate commercial marine vessels into its air pollution control plans. If Baton Rouge is going to comprehensively address its harmful smog pollution levels and deliver cleaner, healthier air, it must take local action to curb pollution from commercial marine vessels, and EPA must do its share by requiring cleaner engines.
TOWBOAT PUSHING BARGES. ELSAH, ILLINOIS. 1988. PHOTO BY: DAVE THOMSON

14
CHAPTER 3
Controlling ship pollution is critical in smog-plagued cities
The Port of Houston lies at the top of Galveston Bay on the Texas Gulf Coast. Its public and private facilities stretch over 25 miles, and it handles more tons of cargo in international trade than any other port in the United States. It encompasses the largest chemical and petrochemical complex in the country, along the banks of the Houston Ship Channel. Dry and liquid bulk shipments dominate shipping traffic here, which also includes container and vehicle carriers. Approximately 175 million tons of cargo moved through the port in 2002 in over 6000 vessel calls.13
The Houston-Galveston area has the worst smog in Texas and is one of the highest smog pollution areas in the country. The area has never complied with the federal one-hour ozone standard, and violates the new more protective eight-hour ozone standard even more frequently.
During 2003, monitors in the area registered violations of the eight-hour ozone standard on 45 days.14 On 24 of these high ozone days, ozone readings reached “Code Red” levels, at which Houston schools are directed to restrict children’s outdoor activities. 15 On seven of these days, ozone levels climbed high enough to trigger an Air Quality Index in the “purple” range, which merits the following advisory to schools:
Level Purple (Very Unhealthy)
• All children should discontinue vigorous outdoor activities, regardless of
duration, and they should remain indoors in air-conditioned spaces. • All outdoor physical education classes, sports practices and athletic
competitions should be rescheduled. According to a recent vessel emission inventory, commercial marine vessels
in the Houston Galveston Area released 11,478 tons of NOx in 1997.16 This is as much NOx as 288,000 onroad vehicles, which includes passenger cars and trucks, urban buses and diesel freight trucks. Local officials in Houston have begun to address ship pollution through incentive programs and voluntary measures. But they also need federal leadership to establish rigorous NOx emission standards.

15
CHAPTER 4
Small local vessels are big polluters in New York harbor
New York Harbor bustles with commercial ships of all sizes, from the huge oceangoing ships that deliver cars, bulk commodities and containers of goods to the ports of New York and New Jersey, to the ferries, excursion boats and tugboats that move barges and larger craft in and out of port. All of this takes place within the New York-Northern New Jersey-Long Island region that violates the federal health standard for ozone smog.
New York City has a high asthma rate. Citywide, over 1,000,000 people, including more than 300,000 children, have asthma.17 In some Harlem neighborhoods, 25% of children have asthma, with serious consequences for school attendance, emergency room visits and quality of life.
A recent detailed emission inventory shows that commercial marine vessels in and near New York Harbor each year discharge more than 12,000 tons of NOx and a host of other contaminants.18 Commercial marine vessels emit as much NOx in the New York area as 300,000 onroad vehicles, including both smaller passenger vehicles and large diesel trucks and buses.
Oceangoing vessels carrying international cargo are the largest source of ship emissions in New York, but they are closely followed by the much smaller towboats that push and pull barges and oceangoing ships in the harbor. Ferry boats are also a major source of NOx pollution in New York.
Before September 2001, ferries carried 85,000 commuters a day into and out of Manhattan.19 Since the September 11 terrorist attacks, private ferry service has doubled to 1,000 trips a day. More than 40 boats ply these routes, and ferry traffic is expected to increase as the redevelopment of Lower Manhattan moves

16
forward. At present, these boats are not required to have pollution controls. So while passengers are enjoying a scenic trip to work, the diesel engines that power their ride discharge almost twenty percent of the total NOx emissions from all ships of any size in the New York Harbor.
FIGURE 2 2000 CMV NOx emissions by vessel type for NY and NJ
The New York, Northern New Jersey, Long Island Nonattainment Area Commercial Marine Vessel Emissions Inventory (prepared for the Port Authority of New York and New Jersey, USACE, New York District, Starcrest Consulting Group, LLC, April 2003),
In response to the growing problem of ferry pollution, a coalition of state, city, federal, educational and environmental organizations, including Environ-mental Defense, has worked with ferry operators to cut ferry pollution. The Clean Ferry Emissions Reduction Initiative will use $6.8 million from New York City’s Department of Transportation, the New York State Energy Research and Development Authority, and the Federal Transit Administration to evaluate, demonstrate and then deploy emission reduction technologies on virtually all ferries now serving New York City. By the time it is complete, the Clean Ferry Project aims to achieve a 75-95% reduction in ferry pollution.
To comprehensively cut pollution from ships, it is essential to pair strong emission standards for new ships with programs to lower pollution from existing vessels that will remain in service for many years to come. Like most ships, ferryboats are used for decades, and so new engine standards alone will take many years to realize clean air benefits. Retrofit and repower programs like the Clean Ferry Initiative will yield more immediate results. And powering a vessel with low sulfur diesel fuel immediately curbs some harmful contaminants regardless of the vessel’s age.

17
New York Harbor dredging Like most harbors, New York Harbor must be continually dredged to clear sediments brought downstream in tributary rivers and to maintain navigation channels for oceangoing ships. The twice a day reversal of tidal flow constantly stirs up and redeposits sediments on the Hudson River floor and in the Harbor. Runoff from the surrounding areas contributes to additional sediment build-up. Each year, from 2 to 4 million cubic yards of material are dredged from New York Harbor.a
New York and New Jersey are currently planning to deepen nine navigation channels by 2016. The marine equipment used in this dredging project is forecast to produce almost 525 tons of NOx in 2004. These high levels of NOx pollution will continue through at least 2013, averaging around 351 tons in 2009 and 2010, and then they will taper off to approximately 29 tons at the project’s scheduled completion in 2016.b
Figure 3 New York Army Corps of Engineers Map: Federal shipping channels (dark blue) in the New York/ New Jersey harbor. Source: http://www.nan.usace.army.mil/harbor
As Figure 3 shows, the navigation channels to be dredged in this project wrap around some of the most densely populated square miles in America, an area already struggling to control ozone pollution and its dangerous health effects. The States of New York and New Jersey have proposed to mitigate the health and environmental impacts of dredging NOx emissions by retrofitting the Staten Island ferryboats with Selective Catalytic Reduction (SCR), one of the best available technologies for controlling NOx. Retrofitting the Staten Island ferries could lower NOx emissions by 500 tons per year, and could produce clean air benefits long after the dredging project is complete. a http://www.nynjcoast.org/ARGO/Issues/dmmwig.htm (last visited May 5, 2004). b New York/New Jersey Harbor Navigation Project (2016): Status Report on General Conformity by Lingard Knutson.
http://www.marad.dot.gov/NMREC/conferences_workshops/jan%2029-30%202002/knutson.pdf (last visited May 5, 2004).
18
CHAPTER 5
Ships in port deliver high levels of uncontrolled pollution into the City of Angels
The Los Angeles area has both the worst smog in the country and two of the busiest ports. This confluence is no accident. The Ports of Los Angeles and Long Beach, which sit near each other on San Pedro Bay, together form one of the largest sources of air pollution in the Los Angeles basin. Like many ports across the country, they are located in a densely populated urban area, whose residents already bear a heavy load of pollutants from industrial activities and transportation emissions. Along with their cargo, ships calling on Los Angeles and Long Beach deliver dangerous levels of ozone-forming NOx, sulfur dioxide and fine particles directly into the most polluted air in the country.
Los Angeles has profound air pollution problems, and has consistently violated the federal air quality standards for ozone and particulate matter. In 2003, after years of improving air quality, Los Angeles experienced a major setback with the worst smog season in eight years. On July 11, 2003 the South Coast Air Quality Management District declared its first Stage 1 Ozone Episode since 1998. On that day, the District advised that “most people would notice some adverse effects such as shortness of breath, and everyone is urged to avoid strenuous outdoor exercise. Those who are sensitive to smog, including children, the elderly and people with heart and lung diseases, are advised to stay indoors.”20
Los Angeles violates the federal air quality standard for particulate pollution. It is classified as serious nonattainment for the PM10 standard, and most monitoring locations in the Basin violate both the annual and 24-hour federal standards for PM2.5.21 Diesel particulate pollution, including ship emissions, is the most dangerous form of particulate pollution for Los Angeles residents. According to the groundbreaking Multiple Air Toxics Exposure Study sponsored by the South Coast Air Quality Management District, diesel particulate accounts for 70% of the cancer risk to people in Los Angeles from air pollution.22
Ship pollution from diesel-powered ships contributes to all of these air quality and public health problems. Ships in the Los Angeles area emit 17,000 tons of NOx per year or as much NOx as 440,000 onroad vehicles, and approximately 1,100 tons of PM2.5 annually or as much particulate as over one million vehicles.23 If Los Angeles is ever to attain the air quality standards for ozone and particulate and make its air healthy, ship pollution must be reduced.
Yet cargo statistics for Los Angeles area ports show that ship pollution will grow in the coming years. International shipping has continued to boom through the recent recession. At the Port of Los Angeles, the total volume of containerized cargo grew 87% from 1999 to 2003. And once again, 2004 container volumes are running ahead of 2003 levels.24 Planners expect this rapid growth to continue; consequently ship emissions will increase unless new pollution limits are imposed.

19
Between 2000 and 2020, the South Coast Air Quality Management District projects that NOx, particulate and sulfur dioxide pollution from oceangoing vessels will nearly double. At the same time, pollution from other sources that are subject to more protective clean air standards is expected to fall. The result of this policy mismatch is that by 2020, ship emissions will represent a dramatically larger share of total air pollution in the Los Angeles area than they do today. In the long life of an oceangoing vessel, 2020 is not far off. Unless ship builders and engine manufacturers start designing cleaner ships today, years or even decades will pass before the upward trend of ship pollution can be reversed.
FIGURE 4 Upward trend of Los Angeles ship emissions for NOx
010203040506070
1993 1997 2000 2010 2020
Year
Tons
of N
Ox
per D
ay
ARCADIS Geraghty & Miller, Marine Vessels Emissions Inventory. UPDATE to 1996 Report: Marine Vessel Emissions Inventory and Control Strategies, Final Report, Prepared for South Coast Air Quality Management District. P 2-42. September 23, 1999.
In recognition of this growing threat, reducing ship emissions at the ports of Los Angeles and Long Beach has become a priority for local air quality managers. Programs in place already include voluntary speed reduction that calls for ships to slow down when entering port, and repowering tugboats with ultra-low emission diesel engines. Thus far, the Port of Los Angeles estimates that these programs have reduced more than one ton of smog-forming emissions each day. 25
But local governments and port authorities face serious jurisdictional hurdles in dealing with ship pollution. If state and local governments are to fulfill their obligation to deliver cleaner, healthier air to their citizens, the federal govern-ment must provide the tools they need to address ship pollution.

20
Hotelling ships to check out of Los Angeles On a typical day, 15 oceangoing ships arrive at Los Angeles area ports.a At their berths loading, unloading or waiting for cargo, these ships continue to run some of their engines, in some cases burning the same extremely high sulfur fuel they use on the open sea. “Hotelling” refers to a ship’s operations at anchor, and includes providing electric power for lights and loading equipment, climate control for cargo and crew, and heating for residual fuel that would otherwise revert to its nearly solid tar-like form.
A hotelling ship has all the same power needs as a warehouse or office building onshore, with the critical difference that power generation for onshore buildings is typically subject to pollution limits, while hotelling ships and the high-sulfur fuel they burn are subject to little or no air quality controls. The practice of using a ship’s engines for hotelling creates an absurd and dangerous circumstance in which a container ship at dock burns residual fuel containing tens of thousands of parts per million sulfur, within sight and breathing distance of diesel freight trucks burning highway diesel fuel limited to a small fraction of this sulfur pollution.
Hotelling ships in Los Angeles and Long Beach emit an estimated 4635 tons of NOx a year, and a single container ship can emit as much as one ton of NOx in a day.b Pollution from ships at berth is released directly into nearby com-munities and port facilities where thousands of people work. These emissions contribute to the hotspots of air pollution that exist near ports, exposing residents and workers to dangerous levels of pollutants including carcinogenic diesel particulate matter.
The Port of Los Angeles has begun to take steps to control hotelling emis-sions. In response to a lawsuit brought by a coalition of community and envi-ronmental groups, in 2003 the Port committed to providing facilities that will allow container ships at the 154-acre China Shipping Terminal facility to plug into land-based electricity to power hotelling operations.c These steps need to be expanded in Los Angeles and in all ports where oceangoing ships currently run their engines at dock. a Marine Exchange Southern California, News Release, “Marine Exchange Reports Increased Vessel Traffic
at Los Angeles/Long Beach Harbor in 2003,” (January 12, 2004) available online at http://www. misnadata.org/files_T/7_PR%20Vessel%20Traffic%20Stats%20for%2020032.doc (last visited May 9, 2004) (5654 oceangoing vessel calls in 2003).
b ARCADIS Geraghty & Miller, Marine Vessels Emissions Inventory, Update to 1996 Report, Prepared for South Coast Air Quality Management District (1999) at 2-40; Los Angeles Department of Water and Power, Press Release, “Mayor Hahn Pledges to ‘Amp up’ Port of LA,” (Nov. 22, 2002), available online at http://www.ladwp.com/ladwp/cms/ladwp004265.jsp.
c Natural Resources Defense Council, press release: City of Los Angeles and Community and Environ-mental Groups Reach Record Settlement of Challenge to China Shipping terminal Project at Port,” March 5, 2003, http://www.nrdc.org/media/pressreleases/030305.asp (last visited May 5, 2004); Los Angeles Times, Editorial “Pioneering Cleanup at Ports,” March 17, 2003.
21
CHAPTER 6
Inland ports and waterways rival coastal ship pollution
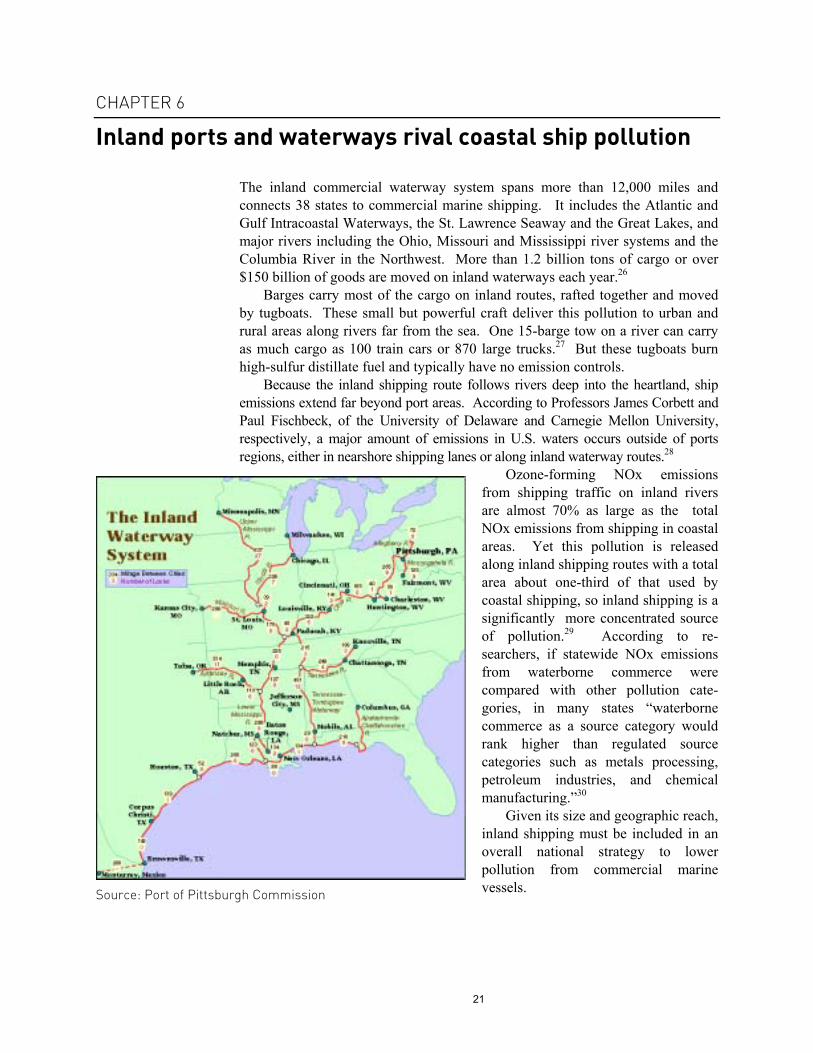
The inland commercial waterway system spans more than 12,000 miles and connects 38 states to commercial marine shipping. It includes the Atlantic and Gulf Intracoastal Waterways, the St. Lawrence Seaway and the Great Lakes, and major rivers including the Ohio, Missouri and Mississippi river systems and the Columbia River in the Northwest. More than 1.2 billion tons of cargo or over $150 billion of goods are moved on inland waterways each year.26
Barges carry most of the cargo on inland routes, rafted together and moved by tugboats. These small but powerful craft deliver this pollution to urban and rural areas along rivers far from the sea. One 15-barge tow on a river can carry as much cargo as 100 train cars or 870 large trucks.27 But these tugboats burn high-sulfur distillate fuel and typically have no emission controls.
Because the inland shipping route follows rivers deep into the heartland, ship emissions extend far beyond port areas. According to Professors James Corbett and Paul Fischbeck, of the University of Delaware and Carnegie Mellon University, respectively, a major amount of emissions in U.S. waters occurs outside of ports regions, either in nearshore shipping lanes or along inland waterway routes.28
Ozone-forming NOx emissions from shipping traffic on inland rivers are almost 70% as large as the total NOx emissions from shipping in coastal areas. Yet this pollution is released along inland shipping routes with a total area about one-third of that used by coastal shipping, so inland shipping is a significantly more concentrated source of pollution.29 According to re-searchers, if statewide NOx emissions from waterborne commerce were compared with other pollution cate-gories, in many states “waterborne commerce as a source category would rank higher than regulated source categories such as metals processing, petroleum industries, and chemical manufacturing.”30
Given its size and geographic reach, inland shipping must be included in an overall national strategy to lower pollution from commercial marine vessels. Source: Port of Pittsburgh Commission

22
Three Rivers City Pittsburgh is a major inland river port, surrounded by coal fields and sitting at the head of the Ohio River, which connects it to Mississippi River commerce and to the Gulf of Mexico. Pittsburgh is the second busiest inland port in the nation and the 13th busiest port of any kind.a In 2002, 52 million tons of cargo came through Pittsburgh, including almost 41 million tons of coal and 1.9 million tons of petroleum and petroleum products.b
Pittsburgh suffers from chronic air quality problems, and violates the national air quality standards for both ozone and particulate matter. No comprehensive inventory of commercial marine emissions has been prepared for Pittsburgh. But researchers at Carnegie Mellon University have concluded that here as in other riverside cities like St. Louis, Nashville and New Orleans, ships discharge as much NOx per mile as passenger cars on major highways.c
Pittsburgh’s situation illustrates that ship pollution is not just a coastal problem. Pittsburgh is also a city that stands to benefit tremendously from EPA’s action to lower the sulfur content of marine distillate fuel. Since marine distillate is the predominant fuel on inland waterways, the elimination of sulfur from this fuel will immediately reduce sulfate particulates, and will allow ship owners to use emission controls that will cut smog-forming NOx.
a http://www.port.pittsburgh.pa.us/pi/inland_port.html last visited on May 5, 2004. b http://www.port.pittsburgh.pa.us/pi/2002det.html. last visited on May 5, 2004. c Corbett, supra note 28 at 3260.

23
CHAPTER 7
Policy recommendations
This report describes the surprising scope of air pollution from commercial shipping in the United States. But while this problem is large, it is far from intractable. The same strategies that have been effective in addressing land-based diesel engines can be extended to marine diesel engines. Environmental Defense recommends the following seven steps to cut the harmful air pollution from commercial marine vessels.
1. Control marine fuel sulfur levels Commercial marine ships burn pollutant-laden fuel. Phenomenally high levels of sulfur and a witches’ brew of chemicals from the dregs of the refining process produce huge amounts of sulfur pollution from oceangoing ships burning residual fuel. Smaller craft that burn marine distillate fuels produce pollution at the high levels characteristic of the large land-based diesel engines that currently burn similar fuel.
EPA’s recent decision to curtail the sulfur levels in marine distillate fuel will allow the use of advanced emission controls that cannot operate in the presence of fuel sulfur. Advanced controls can be used to address the full suite of pollutants released from these engines, including the NOx that leads to ozone formation and the particulate pollution that has serious health effects. And even before the implementation of advanced emission controls for marine engines, reduction of marine distillate fuel sulfur levels will yield immediate results in the form of reduced sulfur dioxide and sulfate particles.
In order to comprehensively address ship pollution, EPA and the international community must also address sulfur levels in the heavy tar-like residual fuel burned in oceangoing vessels. Until this fuel is cleaned up, international shipping will continue to be a massive global source of sulfur pollution.
2. Cleaner engines for cleaner ships Once marine fuel sulfur levels are well-controlled, an array of emission control strategies for marine engines can be developed. Because ships are so long-lived, it is critical to put in place clean engine standards during the ongoing ship-building boom. Unless effective emission controls are installed on the new ships being built now, it will be decades before the cargo they carry is transported in clean ships. EPA should press ahead with its preliminary plan to establish more stringent emission standards for small and medium-sized marine engines.

24
3. Retrofit and repower existing ships The communities living with ship pollution cannot wait the years that will pass before dirty ships are scrapped. Retrofit and repower programs have proven successful in spurring the cleanup of dirty land-based diesel engines. These programs should also be used to accelerate the cleanup of old ship engines that would otherwise continue to pollute.
New York City’s program to reduce ferry pollution shows how local governments can work with ship owners and state and federal authorities to build incentive programs to cut ship pollution. EPA should provide leadership to extend this model to other areas around the country.
4. Build port facilities to eliminate hotelling pollution As shipping traffic increases, ports around the country are expanding their facilities to handle more cargo. And as cargo ships grow larger, they will spend more time in port loading and unloading, potentially increasing hotelling emissions beyond their already unacceptably high levels. New port facilities should include land-based electrical power that will allow ships to turn off their engines while hotelling, and existing facilities should upgrade to include this capacity. This would produce a dramatic reduction of ship pollution especially for dockworkers and nearby residents who bear the heaviest burden from ship emissions.
5. Control nearshore pollution Individual ports can implement operational requirements to reduce ship emissions in nearshore areas. Los Angeles’ speed reduction program has reported average emission reductions of one ton per day of NOx. If ports around the country took similar steps, nearshore emissions could be significantly reduced.
6. Curb pollution from ocean-going vessels EPA should reinvigorate efforts to lower airborne contaminants from high-polluting ocean-going vessels through federal administrative action. As a first step, EPA should thoroughly re-evaluate its authority to establish emission standards for foreign-flagged vessels operating in U.S. waters. And the United States Senate should promptly ratify Annex VI to the international convention to control pollution from ships (MARPOL Annex VI), which the President transmitted to the Senate for its advice and consent on May 15, 2003. MARPOL Annex VI will not go into effect until it has been ratified by 15 nations that together represent at least half of global shipping traffic. While this international treaty has serious limitations, it is the most advanced international agreement addressing ship emissions to date. Most critically, once MARPOL Annex VI is ratified, it will allow for the establishment of sulfur emission control areas that provide for more protective limits on the sulfur content of residual fuel. Ratification will bolster United States leadership on marine vessel air pollution,

25
encourage other countries to ratify, and provide the framework for securing more meaningful pollution reductions.
7. Develop accurate inventories of marine vessel emissions Only a few ports have developed comprehensive and updated inventories that accurately characterize the full extent of ship emissions and the types of engines and activities that cause the most pollution. Accurate, comprehensive inventories such as those prepared for Los Angeles, Houston-Galveston and New York-New Jersey are a necessary first step in controlling commercial marine vessels pollution in areas facing the most challenging air pollution problems.

26
APPENDIX A
Methodology for comparison of pollution from commercial marine vessels to pollution from onroad vehicles
Background Commercial marine vessels, which include towboats, ocean-going vessels and passenger ferries, emit a significant amount of air pollution. This source category had not received much attention by agencies responsible for control of air pollution.
Objective The purpose of this analysis is to characterize the magnitude of air pollution emissions from commercial marine vessels in certain areas of the country in terms of passenger vehicles and motor vehicles used to carry goods in commerce. The areas of interest and estimated emissions are presented in Table 1 below.
TABLE 1 Commercial Marine Vessel Emissions in Areas of Interest (tons per year)
Area NOx PM2.5 SO2
Houston-Galveston1 11,478 691 Not available
Los Angeles/ South Coast2
17,637 1,142 10,067
Lower Mississippi3 23,344 1,358 9,583
New York/New Jersey Ports4
12,107 461 6,667
1The Houston-Galveston Area Commercial Marine Vessel Emissions Inventory (Starcrest Consulting Group, LLC2000) – Year 1997 data
2South Coast Air Quality Management District, 2003 Air Quality Management Plan, “Annual Average Emissions by Major Source Category,” Attachment A to Appendix III – Year 2002 data
3Revised Draft Final Report, Commercial Marine Emission Inventory Development (ENVIRON International Corp., April 2002) – Year 1996 data
4The New York, Northern New Jersey, Long Island Nonattainment Area Commercial Marine Vessel Emissions Inventory (prepared for the Port Authority of New York and New Jersey, USACE, New York District, Starcrest Consulting Group, LLC, April 2003) – Year 2000 data
Methodology The emissions from commercial marine vessels can be expressed in terms of the equivalent number of onroad vehicles. Onroad vehicles include all light-duty gasoline and diesel passenger vehicles and trucks as well as all heavy-duty gasoline and diesel trucks and buses. The most current and accurate national

27
emission inventory of onroad vehicles, produced by EPA, is presented in Table 2. This inventory uses the new MOBILE 6 model.
TABLE 2 EPA 2001 National Onroad Vehicles Emission Inventory5
Emission (tons)
NOx 8,249,000
PM2.5 162,000
SO2 261,000 5 EPA Average Annual Emissions, All Criteria Pollutants Years Including 1980, 1985, 1989-2001, dated February 2003
There were an estimated 207,246,9066 onroad vehicles in the United States in 2001. The numbers of onroad vehicles per ton of emissions are presented in Table 3.
TABLE 3 Numbers of Onroad Vehicles per ton of emissions in 2001
Air Pollutant Vehicles per tons/year
NOx 25.1
PM2.5 1279.3
SO2 794.0 6U.S. EPA, “Fleet Characterization Data for MOBILE 6: Development and Use of Age Distributions, Average Annual Mileage Accumulation Rates, and Projected Vehicle Counts for Use in MOBILE6,” EPA 420-R-01-047 (Sept. 2001)
Results Emissions from commercial marine vessels in areas of interest can be expressed in terms of the equivalent number of onroad vehicles using data from Tables 1 and 3. The equivalency is presented in Table 4. This is an estimate since avail-able commercial marine emission inventory years are somewhat different from the most accurate onroad emission inventory and the onroad emissions in areas of interest may be somewhat different from the national average in Table 3 because of such factors as vehicle fleet age and implementation of vehicle inspection/maintenance programs. However, the overall accuracy of the com-parison is expected to be within 10 to 20 percent.
TABLE 4 Commercial marine vessel emissions in terms of comparable number of onroad vehicles
Area NOx SO2 PM2.5
Houston-Galveston 288,000 Not available 883,000
Los Angeles/South Coast 442,000 7,993,000 1,460,000
Lower Mississippi 585,000 7,608,000 1,737,000
New York/New Jersey Ports 303,000 5,293,000 589,000
28
Endnotes
1 U.S. Environmental Protection Agency, National Emission Inventory, Air Pollutant Emission
Trends: Criteria Pollutant Data, Current Emission Trends Summaries (estimates based on 2001 data) http://www.epa.gov/ttnchie1/trends/ (last visited May 10, 2004).
2 American Association of Port Authorities, www.aapa-ports.org/industryinfo/currentissues.html (last visited May 5, 2004)
3 See, e.g., G. Norris et al., “An Association Between Fine Particles and Asthma in Emergency Department Visits for Children in Seattle,” Environ Health Perspect. 107 (1999) 489–493; P.E. Tolbert, et al., “Air Quality and Pediatric Emergency Room Visits for Asthma in Atlanta, Georgia,” Am. J. Epidemiol. 151 (2000) 798–810; J.W. Gauderman, et al., “Association Between Air Pollution and Lung Function Growth in Southern California Children,” American Journal of Respiratory and Critical Care Medicine 162 (2000) 1383–1390; H. Desqueroux et al. “Short-Term Effects of Low-Level Air Pollution on Respiratory Health of Adults Suffering From Moderate to Severe Asthma,” Environmental Research Vol 89 (Section A) (2002) 29–37.
4 Yun-Chul Hong et al. “Effects of Air Pollutants on Acute Stroke Mortality,” Environmental Health Perspectives 110, no. 2 (February 2002).
5 See, e.g., Joel Schwartz, “Air Pollution and Hospital Admissions for Heart Disease in Eight U.S. Counties” Epidemiology 10 (1999) 17–22.
6 C.A. Pope et al. “Lung Cancer, Cardiopulmonary Mortality, and Long-Term Exposure to Fine Particulate Air Pollution,” Journal of the American Medical Association 287, no. 9 (March 6, 2002); J.M. Samet et al., “The National Morbidity, Mortality and Air Pollution Study Part II: Morbidity, Mortality and Air Pollution in the United States,” Health Effects Institute Research Report 94, Part II, June 2000; J.M. Samet et al., “Fine Particulate Air Pollution and Mortality in 20 U.S. Cities, 1987-1994,” New England Journal of Medicine, 343, no. 24, (December 14, 2000), 1742-1749; Bert Brunekreef, “Air Pollution and Life Expectancy: Is There a Relation?” Occup. Environ. Med. 54, no. 11 (1997) 781–4; C.A.. Pope, “Epidemiology of Fine Particulate Air Pollution and Human Health: Biological Mechanisms and Who’s at Risk?” Environ. Health Perspect. 108 (Suppl 4) (2000) 713–723; G. Hoek et al., “Association Between Mortality and Indicators of Traffic-related Air Pollution in the Netherlands: a Cohort Study,” Lancet 360 (2002) 1203.
7 62 Fed. Reg. 38,856 (July 18, 1997). 8 F.D. Gilliland et al. "The Effects of Ambient Air Pollution on School Absenteeism Due to
Respiratory Illnesses," Epidemiology, 12 (2001) 43-54; L. Chen et al. "Elementary School Absenteeism and Air Pollution," Inhalation Toxicology, 12 (2000) 997-1016.
9 J. M. Peters et al. "A Study of Twelve Southern California Communities with Differing Levels and Types of Air Pollution," Am J Respir Crit Care Med, 159 (1999) 768-775.
10 T. Frischer et al. "Lung Function Growth and Ambient Ozone: A Three-Year Population Study in School Children," Am. J. Respir Crit Care Med, 160 (1999) 390-396.
11 http://www.portsl.com/pages/15_overview.html (last visited May 5, 2004). 12 Revised Draft Final Report, Commercial Marine Emission Inventory Development (ENVIRON
International Corp., April 2002) App. A, Detailed Port Emissions for 1996. 13 http://www.portofhouston.com/geninfo/overview1.html (last visited May 12, 2004). 14 Texas Commission on Environmental Quality, “Houston High Ozone Event October 23, 2003,”
http://www.tnrcc.state.tx.us/updated/air/monops/airpollevents/2003/event2003-10-23hou.html (last visited May 5, 2004).
15 Houston Department of Health and Human Services, “Guidance on Ozone Pollution and Physical Activities,” http://www.cleanairaction.org/pubs/pdfs/old_pubs/schoolguidance.pdf (last visited May 5, 2004).
16 Houston_Galveston Area Commercial Marine Vessel Emissions Inventory (Starcrest Consulting Group, LLC 2000) at 28.
17NYC Vital Signs, vol. 2, no 4, April 2003. available online at http://www.nyc.gov/ html/doh/pdf/survey/survey-2003asthma.pdf (last visited May 5, 2004).
29
18 The New York, Northern New Jersey, Long Island Nonattainment Area Commercial Marine
Vessel Emissions Inventory (prepared for the Port Authority of New York and New Jersey, USACE, New York District, Starcrest Consulting Group, LLC, April 2003), Tables 4.1, 4.5 and 4.6.
19 Id. at p. 88. 20 South Coast Air Quality Management District, press release: “Southland’s First Stage 1 Episode
in Five Years Underscores Need to Accelerate Air Pollution Control Program,” July 11, 2003 (emphasis added).
21 South Coast Air Quality Management District, 2003 Air Quality Management Plan, 2-14 ff., http://www.aqmd.gov/aqmp/AQMD03AQMP.htm (last visited May 5, 2004).
22 South Coast Air Quality Management District, Multiple Air Toxics Exposure Study in the South Coast Air Basin (MATES-II), March 2000, http://www.aqmd.gov/matesiidf/es.pdf (last visited May 5, 2004).
23 South Coast Air Quality Management District, 2003 Air Quality Management Plan, “Annual Average Emissions by Major Source Category, Year 2002,” Attachment A to Appendix III, Table A-4, http://www.aqmd.gov/aqmp/docs/2003AQMPAppIII_AtchA.pdf (last visited May 8, 2004).
24 Port of Los Angeles, cargo statistics, http://www.portoflosangeles.org/statistics.htm (last visited May 6, 2004).
25 Port of Los Angeles, Press release: Port of Los Angeles’ Air Quality Efforts Cut 1000 Tons of Emissions,” October 17, 2003, http://www.portoflosangeles.org/press/portoflapress31014683_ 10172003.PDF (last visited May 8, 2004).
26 Mercer Management Consulting, “The Importance of Inland and Intracoastal Waterways to State Economies,” August 1995.
27 http://www.house.gov/transportation/water/09-17-03/09-17-03memo.html (last visited May 5, 2004).
28 James J. Corbett and Paul S. Fischbeck, “Emissions from Waterborne Commerce Vessels in United States Continental and Inland Waterways,” Environ. Sci. Technol. 2000, 34, 3254-3260.
29 U.S. Environmental Protection Agency, Commercial Marine Emissions Inventory for EPA Category 2 and 3 Compression Ignition Marine Engines in the United States Continental and In-land Waters, EPA420-R-020, at ps. 3 & 11 and Tables 3 & 8, available online www.epa. gov/otaq/regs/nonroad/marine/ci/fr/r98020.pdf (last visited May 5, 2004); Corbett, supra note 28 at 3255.
30 Corbett, supra note 28 at 3259.

National Headquarters257 Park Avenue SouthNew York, NY 10010212-505-2100
1875 Connecticut Avenue, NWWashington, DC 20009202-387-3500
5655 College AvenueOakland, CA 94618510-658-8008
2334 North BroadwayBoulder, CO 80304303-440-4901
2500 Blue Ridge RoadRaleigh, NC 27607919-881-2601
44 East AvenueAustin, TX 78701512-478-5161
18 Tremont StreetBoston, MA 02108617-723-5111
Project Office3250 Wilshire BoulevardLos Angeles, CA 90010213-386-5501