Embed Size (px)
Citation preview

1
Smoke control in case of fire in a large car park: CFD Simulations of Full-Scale Configurations
X. Deckers1,2, S. Haga1,3, N. Tilley1 and B. Merci1
1Ghent University, Dept. Flow, Heat and Combustion Mechanics, Belgium
2Fire Engineered Solutions BVBA, Belgium
3NorConsult, Norway
Abstract
Computational Fluid Dynamics (CFD) simulation results are presented of full-scale car park fire
experiments with smoke and heat control (SHC) by forced mechanical horizontal ventilation. A
well-controlled liquid pool fire heat release rate (HRR) is set as an input parameter. The effect of
the SHC system on the smoke movement in fire conditions is examined. The following
parameters are varied: fire HRR; smoke extraction flow rate; openings for incoming air (so that
different flow patterns have been created); presence of beams. The impact of jet fans (induction
type) is also addressed in a number of simulations. The trends observed in the full-scale
experimental campaign are well captured and additional insight is provided for the interpretation
of the results. The sensitivity of the CFD results to input parameters is highlighted. For a 4 MW
HRR fire, which is the order of magnitude for a car fire, the required ventilation velocity to limit
smoke back-layering in a flat ceiling car park is around 1.1 m/s. When beams are present, the
average velocity must be higher, particularly for longitudinal beams. If smoke is trapped inside a
recirculation region, increasing the smoke extraction rate does not help to remove the smoke.
Keywords: Car park fire safety; smoke and heat control; CFD simulations

2
1. Introduction
In this paper, Computational Fluid Dynamics (CFD) simulation results are presented regarding
smoke and heat control (SHC) by forced mechanical horizontal ventilation in case of a car park
fire. the settings correspond to the full-scale experimental campaign, as described in [1]. The
reader is referred to [1] for a complete description of the experimental set-up, including the
accuracy of the data. The heat release rate (HRR) of the fire, introduced as well-controlled liquid
pool fire, is an input parameter in the study of the effect of the SHC system on the smoke
movement in fire conditions. The motivation of the study concerns the need for scientific support
in the development of standards and guidelines for design of SHC systems in car parks, which
cannot be treated as ‘tunnel-like’ geometries (see e.g. [2]). In tunnel geometries, zone modeling
can be applied in regions far away from the fire (see e.g. [3]). Flow patterns in car parks can be
complex and flow momentum always plays a crucial role, so that the use of zone models, where
momentum equations are not solved, is not recommended.
The fire (size and heat release rate) is introduced as input parameter for the problem. The choice
of design fire for use in standards for design of SHC systems in car parks constitutes an
interesting study on itself. The reader is referred to [4] for a discussion on this topic, based on
recent full-scale tests and statistics from car park fire hazards.
The use of CFD for calculations of smoke movement in case of fire in complex buildings is
increasingly popular. This is not only reflected in a large number of recent journal publications, a
few examples of which are references [3, 5-9], but it is also becoming more and more common
practice in design calculations. Therefore, it is very important to gain trust in CFD on one hand,
and to illustrate sensitivity in CFD results to e.g. mesh size and boundary conditions on the other
hand. Consequently, this paper targets multiple objectives. Firstly, it is illustrated that the trends

3
observed in the results of the full-scale experimental campaign of [1] are well captured in the
CFD simulations. Secondly, additional insight is provided for the interpretation of the results,
thanks to additional information from CFD that has not been measured. Throughout the paper an
indication is provided regarding the sensitivity of the CFD results to input parameters.
The results discussed below stem from more than 500 CFD simulations. They have been
obtained with FDS, version 5.4.1 [10]. The authors are well aware of the fact that FDS has not
been designed as a CFD code for research purposes and the authors are also well aware that the
meshes used below are not sufficiently fine to guarantee high-quality LES (Large-Eddy
Simulations) results (see e.g. [9,11,12] for more discussion on this point). On the other hand, the
package is used worldwide for design calculations, with meshes comparable to what is used
below, so already for the sake of practical relevance, it makes sense to investigate the potential
and limitations of the code in the context of reproducing full-scale experimental test results.
Moreover, the issue is not to examine in all detail e.g. the flow around the fire source or the
entrainment of air into smoke. Rather, the goal of the study is in the first place to explore to what
extent smoke patterns can be predicted, more particularly the smoke back-layering distance for a
number of set-ups. To that purpose, FDS is very well-suited, since results can be obtained within
reasonable computing times. Whereas it is worth-wile to examine the performance of other CFD
packages as well, such a comparative study is work in progress and considered beyond the scope
of the present paper.
As mentioned, it is investigated first to what extent the trends in the experimental results of [1]
are captured in the CFD simulations. The following parameters are varied:
- Fire HRR;

4
- Smoke extraction flow rate;
- Opening for incoming air (so that different flow patterns have been created);
- Presence of beams.
The impact of jet fans (induction type) is also addressed in a number of simulations.
The structure of the paper is as follows. First of all, the global set-up of the CFD simulations is
described. Secondly, the accuracy, in terms of sensitivity, and the manner of presentation of the
results is explained. Finally, the comparison to the experimental data of [1] is provided.
2. Set-up of the Numerical Simulations
First, the basic simulation settings are described. Afterwards, the sensitivity study is briefly
introduced. More details on the sensitivity study are found in section 4 during the discussion of
the results. Figure 1 provides a schematic view of the set-up. The basic simulation settings are:
- Car park dimensions: 28.6 m (width) x 30 m (length) x 2.7 m.
- Mesh cells size: 0.2 m x 0.2 m x 0.15 m (refinement near the ceiling: 0.05 m).
- Models:
o Turbulence model: standard Smagorinsky LES, CD = 0.20.
o Baroclinic generation of vorticity has been taken into account.
o Combustion model: default mixture fraction combustion model.
o Smoke production: conversion of a fixed fraction of consumed fuel mass into
smoke particulates, with ‘soot yield’ set to 0.22, in agreement with e.g. [13].
o Radiation: fixed percentage heat loss, in order to eliminate uncertainty from
radiation modelling. The default value used is 20 %. The sensitivity to this choice
is discussed below.

5
- Boundary conditions:
o The ceiling, floor and side walls are adiabatic. In real car parks there can be
conductive heat losses to the structure.. Admittedly, heat losses from the smoke
layer through the structure can lead to more de-stratification of the smoke layer
due to reduced buoyancy force. Yet, this is not crucial for the present study: the
smoke back-layering distance, given the fire source and ventilation conditions, is
hardly affected by the adiabatic assumption and the smoke-free height within the
region of smoke back-layering is of secondary importance. As such, for smoke
control calculations, the adiabatic boundary condition is reasonable [9]
Moreover, the ceiling is well insulated in all experiments [1].
o The 4 equidistant supporting beams under the ceiling have depth 25 cm and width
20 cm. The columns have dimensions 0.2 m x 0.2 m.
o The smoke extraction rate is imposed through 4 openings in the ceiling of 1m x
1m each, positioned 1 m from the back wall.
o The surrounding environment, as in reality for the large-scale experiments of the
research project, is considered. The domain has been extended 15 m in front of
the car park opening, 1.8 m laterally at each side, 3 m at the back side and 0.9 m
vertically above the car park. Atmospheric pressure boundary conditions are
imposed at all exterior boundaries (open vents). Possible wind effects are not
taken into account, as wind conditions were fortunately very mild during the
experiments [1].
o The fire is modelled as a fuel source of fixed area (3m x 1.5m) at height equal to
45 cm, corresponding to the situation in the experiments of [1], in the middle of

6
the car park. All simulations concern (quasi-)steady state conditions with fixed
heat release rate. As in the experiments [1], hexane (C6H14) is used as fuel.
The sensitivity study concerns:
- The mesh: results of mesh refinement are shown in the next section for one case to
illustrate the results on the basic mesh can be trusted as sufficiently accurate for the sake
of the present paper (namely to capture trends in different configurations accurately).
- The fire source: the height of the pool fire has been varied from 45 cm height to flush
with the floor.
- Radiative heat loss fraction (10 %, 30 %, 50 %).
- The geometry:
o Presence of beams.
o Position of the extraction fans.
- Variation of the fire HRR and smoke extraction rate by +/- 10 %, in order to quantify the
effect of such variations on the calculated smoke back-layering distance.

7
Figure 1. Schematic presentation of the car park as modelled in the simulations.
Some of the experiments in [1] included 2 induction type jet fans with 50 N thrust each. Special
care must be taken when fans are included in CFD simulations. Therefore, the way the fans have
been introduced in our simulations, is described first here. The jet fan exit flow is not horizontal:
there is a downward angle, in order to avoid a Coanda effect under the ceiling. It is important to
include this downward angle in the simulations. Not only the downward angle is important, also
the distance from the ceiling must be respected as accurately as possible. Differences have been
observed between flow fields from a jet fan, mounted at the ceiling, and the same jet fan, 10 cm
below the ceiling (not shown). Apart from the vertically downward angle, also a horizontal angle
must be given to the flow at the fan exit plane, in order to ‘stimulate’ the spreading rate of the jet
fan stream, which is otherwise under-predicted in the numerical simulations for the meshes
applied in the present paper. The fan exit plane is divided into 3 equal parts, each accounting for
1/3rd of the 50 N thrust. The velocity imposed (21.6 m/s) has been split into a different
horizontal, vertical and transversal component in each of the 3 parts. In the central part, the flow
burner location
2 jet fans
(50 N)
4 x 50.000 m³/h extraction
Equipment
house

8
is perpendicular to the fan exit plane, whereas in the side parts an outward horizontal angle is
given to the flow to resemble the jet spreading rate. A sideward angle of 10o seems reasonable to
that purpose [14] (where, admittedly, the jet fans are of a different type and the simulations were
performed with RANS turbulence models). However, in situ velocity measurements revealed
that the flow out of the fans’ exit plane was not at all uniform in the experiments of [1]. The
main reason is most probably the fact that the fan is not positioned centrally inside the jet fan
device. Based on the velocity measurements, the 3 parts of the jet fan were modeled with a
downward angle of 25 o, the left part with a horizontal outward angle of 18 o and the middle and
right part with a flow perpendicular to the exit plane. In general, it is clear that detailed
information on the flow pattern at the jet fan exit plane and the first few meters downstream is
important to guarantee reliable CFD simulations with jet fans. With the information currently
available on the technical specification sheets of jet fans (velocity, flow rate and thrust), the
characteristics of the jet flow are not sufficiently described.
3. Simulation Results: Presentation and Uncertainty
Most results are presented in terms of temperature profiles along lines, with data collected at
exactly the same positions of the thermocouples in [1], i.e. at different positions, 5 cm below the
ceiling. Obviously, there is unsteadiness in the results, due to the inherent nature of LES
simulations. The data as presented have been averaged over a period of 40 s. The exact length of
the averaging period is not crucial, as long as it is sufficiently longer than typical fluctuation
times in the physical problem at hand (which are in the order of seconds here, e.g. the puffing
frequency of the fire source).

9
Additionally, contour plots of velocity and temperature are presented in horizontal or vertical
planes, in order to provide additional insight. For obvious reasons, such results cannot be directly
compared to experimental data.
With respect to uncertainties, a number of potential issues in the experiments are absent in
numerical simulations. Indeed, when a fire HRR or a smoke extraction rate is imposed, it is in
principle perfectly imposed in the simulations, while there is inevitable uncertainty in the real-
life experiments. Therefore, a sensitivity study is presented as well below, so that in that sense an
indication is found with respect to ‘uncertainty’ in the CFD results, from the point of view of
comparison to experimental data.

10
Figure 2. Comparison of results on the default mesh used in this paper (left) and a uniform mesh
with cells of 0.1 m x 0.1 m x 0.1 m (right): top view of instantaneous smoke pattern after 120 s
(top) and averaged (over 40 s) temperatures (middle pictures) and velocities (bottom pictures) in
vertical symmetry plane in steady state conditions. HRR = 500 kW, extraction rate = 200000
m3/h.
Obviously, CFD results depend on the mesh chosen for the calculations [11,12]. Therefore, it is
important to illustrate that the mesh chosen is appropriate. This is not done for all simulations, as
this would be too cumbersome and time-consuming. Results are presented here for a steady-state
fire of 500 kW and extraction rate equal to 200000 m3/h. Figure 2, however, showing
instantaneous smoke patterns after 120 s (top view) and averaged (over 40 s) temperatures and
velocities in the vertical symmetry plane in steady state conditions, reveals that results obtained
on the basic mesh can be trusted for the objectives in the present paper. The figures on the left
hand side (top view of smoke pattern) and the upper side (averaged temperatures and velocities
in the vertical symmetry plane) have been obtained on a mesh with cubic cells of size 0.2 m x 0.2
m x 0.15 m (and refinement to 0.05 m near the ceiling), while the other ones stem from a
uniform mesh with cells of 0.1 m x 0.1 m x 0.1 m. As expected, more detail is observed on the

11
finer mesh, but the global picture, definitely in terms of smoke back-layering as well as
temperature fields and flow pattern, is very similar on both meshes.
In section 4.c, the influence of the flow pattern is investigated. Therefore, we also present results
from a grid sensitivity study for the 500 kW fire (extraction rate equal to 200000 m3/h) in a set-
up where 80 % of the inlet opening is blocked, and a large recirculation region is created
(XXXXO configuration, see Table 2). Figure 3 shows mean temperature contours (averaged over
a period of 40 s) in the horizontal plane at ceiling level. Generally higher temperatures are
obtained on the finer mesh, but the global pattern does not change substantially. Also the flow
pattern remains very similar (not shown).
Figure 3. Comparison of results on a mesh with the default mesh used in this paper (left) and a uniform mesh with cells of 0.1 m x 0.1 m x 0.1 m (right): top view of averaged (over 40 s) temperature contours at ceiling level after 120 s. HRR = 500 kW , extraction rate = 200000
m3/h.
As the grid study reveals no substantial changes with respect to the smoke pattern, the results
below are therefore only presented on the ‘basic mesh’ as described in the previous section.

12
4. Simulations of Full-Scale Experiments
It is important to appreciate that, while most of the results are presented in terms of temperature
profiles, the actual end result concerns the shape of the smoke pattern, more particularly in terms
of smoke back-layering distance. It is not intended to compare absolute temperatures directly. To
that purpose, a radiation correction on the measurement data would be necessary. Such a
correction concerns the solution of a heat transfer balance equation (see e.g. [15]). For the
configuration at hand, with the thermocouples mounted a few cm below the ceiling, this is not a
straightforward task. The thermocouples receive incoming radiation from the fire source (this
fraction must be estimated), transfer heat by convection with the gas in which they are immersed
(air or smoke, depending on the thermocouple location) and ‘see’ the ceiling and the floor and
side walls for exchange of radiation. Yet, as long as the temperatures are used to determine
whether smoke is present or not, the absolute values are not essential. It is the shape of the
temperature profiles which determines up to what location smoke is present.
Table 1 first provides an overview of the full-scale experiments of [1]. The notation for the
configurations is introduced in Table 2. The letter ‘O’ refers to ‘open’, while ‘X’ denotes
‘blocked’. V1 – V4 refer to the extraction fans. The column ‘Jet-fans’ indicates whether the jet
fans have been activated or not. The column ‘Beam’ refers to the presence of a transversal beam
or not.

13
Table 1. Overview of all tests in [1].

14
Table 1 (Continued). Overview of all tests in [1].
15
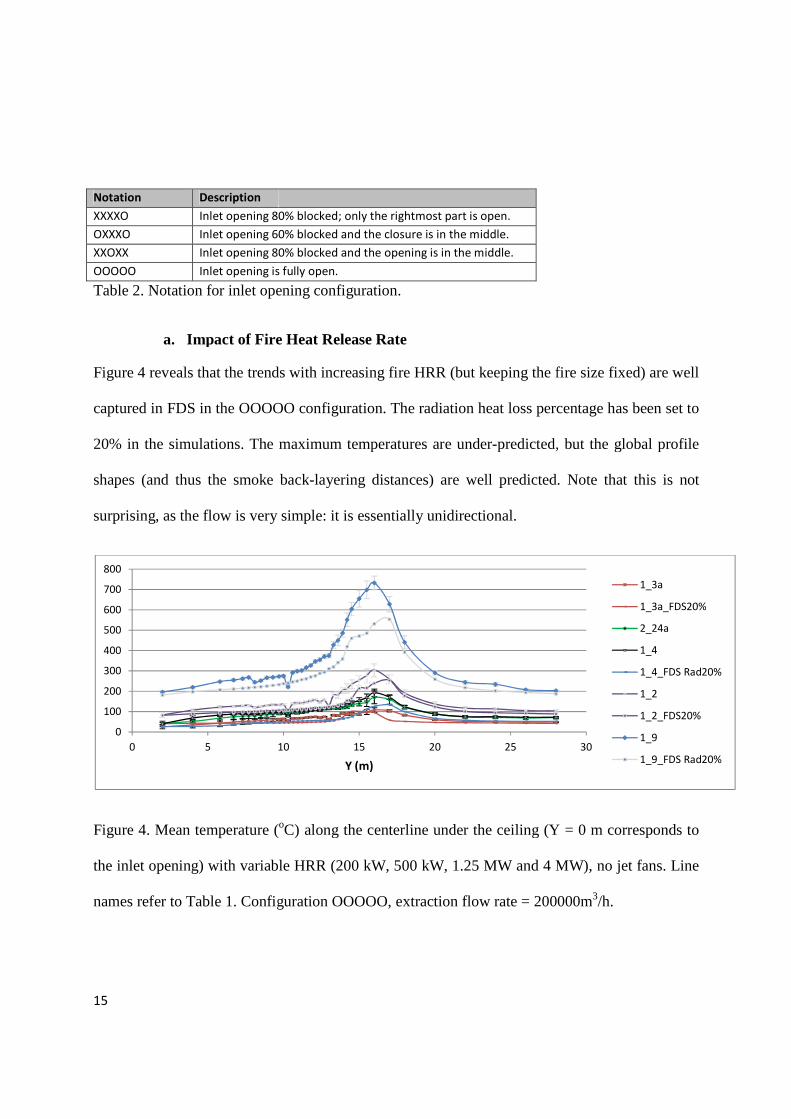
Notation Description
XXXXO Inlet opening 80% blocked; only the rightmost part is open.
OXXXO Inlet opening 60% blocked and the closure is in the middle.
XXOXX Inlet opening 80%
OOOOO Inlet opening is fully open.
Table 2. Notation for inlet opening configuration.
a. Impact of Fire Heat Release Rate
Figure 4 reveals that the trends with increasing fire HRR
captured in FDS in the OOOOO configuration. The radiation heat loss percentage has been set to
20% in the simulations. The maximum temperatures are under
shapes (and thus the smoke back
surprising, as the flow is very simple: it is essentially unidirectional.
Figure 4. Mean temperature (
the inlet opening) with variable HRR
names refer to Table 1. Configuration OOOOO, extraction flow rate = 200000m
0
100
200
300
400
500
600
700
800
0 5 10
Inlet opening 80% blocked; only the rightmost part is open.
Inlet opening 60% blocked and the closure is in the middle.
Inlet opening 80% blocked and the opening is in the middle.
Inlet opening is fully open.
Table 2. Notation for inlet opening configuration.
Impact of Fire Heat Release Rate
reveals that the trends with increasing fire HRR (but keeping the fire size fixed)
captured in FDS in the OOOOO configuration. The radiation heat loss percentage has been set to
20% in the simulations. The maximum temperatures are under-predicted, but the global profile
shapes (and thus the smoke back-layering distances) are well predicted. Note that this is not
surprising, as the flow is very simple: it is essentially unidirectional.
(oC) along the centerline under the ceiling (Y = 0 m corresponds to
with variable HRR (200 kW, 500 kW, 1.25 MW and 4 MW), no jet fans. Line
. Configuration OOOOO, extraction flow rate = 200000m
10 15 20 25
Y (m)
(but keeping the fire size fixed) are well
captured in FDS in the OOOOO configuration. The radiation heat loss percentage has been set to
predicted, but the global profile
l predicted. Note that this is not
along the centerline under the ceiling (Y = 0 m corresponds to
(200 kW, 500 kW, 1.25 MW and 4 MW), no jet fans. Line
. Configuration OOOOO, extraction flow rate = 200000m3/h.
30
1_3a
1_3a_FDS20%
2_24a
1_4
1_4_FDS Rad20%
1_2
1_2_FDS20%
1_9
1_9_FDS Rad20%

16
Figure 5 shows the very moderate impact of activation of the jet fans for the fire HRR of 500 kW
and extraction rate equal to 200000m3/h. Similar findings have been obtained for other HRR
values in the configuration at hand. High local velocities are found near the fans, but the effect
on the temperature field, or the smoke pattern, is very small.
Figure 5. Temperature pattern (top) and longitudinal velocity contour plots in horizontal plane Z
= 2.4 m without (left) and with (right) jet fans. Fire HRR = 500 kW, smoke extraction rate =
200000m3/h, jet fans each have 50 N thrust.
As mentioned in the introduction, a sensitivity study has been performed in the numerical
simulations. Increasing the fire HRR with fixed extraction rate does not substantially modify the

17
profile shapes. Only the absolute values of temperature increase (not shown), not the smoke
pattern. Likewise, a modification of the radiative fraction only modifies the absolute temperature
values, not so much the profile shapes. Obviously, the back-layering distance is higher for lower
radiative fraction values, due to the stronger upward momentum at the fire source and the
resulting stronger smoke dynamics, but the effect is not extremely strong: in Figure 6 the
differences between very low (10%) and high (50%) values are moderate.
Figure 6. Mean temperature (oC) profiles along the centerline under the ceiling from the CFD
simulations: sensitivity to variations in radiative fraction (top) and smoke extraction rate
(bottom). Basic smoke extraction rate = 200000m3/h.
Decreasing the extraction rate with constant fire HRR results in an upstream shift of the position
of maximum temperature, as well as a temperature increase due to reduced cooling by the
incoming fresh air (Figure 6). The effect of the extraction rate is stronger than the effect of the
fire HRR, as is also reflected in the correlation of [16] and as has been observed in [1].
b. Impact of Smoke Extraction Rate
In this section the discussion is restricted to configurations OOOOO and XXOXX, where the
oncoming air reaches the fire source in a relatively straight longitudinal manner. The discussion

18
of the more complex flow patterns, and the influence thereof on the efficiency of increased
smoke extraction rates, is postponed until the next section.
From Figure 6 it can already be expected that the smoke extraction rate has a strong impact on
the smoke pattern and smoke back-layering distance in particular. Figure 7 presents mean
temperature profiles along the centerline for OOOOO and XXOXX for HRR = 500 kW (left) and
4 MW (right), for different values of extraction rates. Experimental data has been added for
comparison purposes.
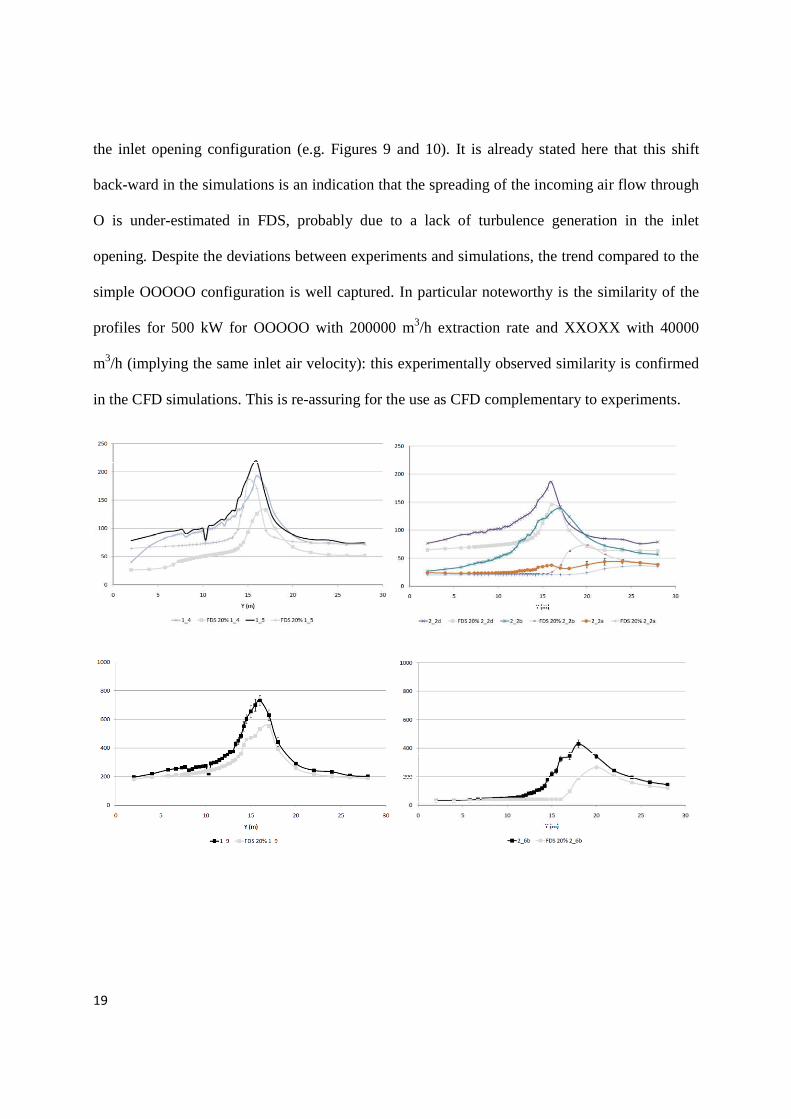
The top left figure shows that in the OOOOO configuration, the position of the peak temperature
is very well predicted for the 500 kW HRR with extraction flow rates 100000m3/h and 200000
m3/h. Thus, the fire plume tilting is well captured. The CFD simulations confirm the
experimental observation that an extraction rate of 200000 m3/h is necessary to prevent smoke
back-layering up to the car park inlet (temperature drop to ambient temperature at Y = 0 m). The
bottom left figure confirms the good agreement between CFD and experiments for the 4 MW
HRR value. The temperature under-prediction by FDS is expected as FDS automatically applies
a radiation correction to the temperature of the thermocouples. As explained, this is not essential
for the present paper, though.
For XXOXX, there is practically no temperature rise for 500 kW for the extraction rate of
200000 m3/h. This is well predicted. The shift upward( i.e. more upstream and towards higher
values) for lower extraction rate is well captured. Compared to the experimental data, the
simulation results are shifted towards the back wall, though (best seen for the extraction rate of
100000m3/h). The same observation, combined with an under-prediction of temperatures, holds
for the 4 MW case. In the next section, a more extensive discussion is devoted to the impact of
19
the inlet opening configuration (e.g. Figures 9 and 10). It is already stated here that this shift
back-ward in the simulations is an indication that the spreading of the incoming air flow through
O is under-estimated in FDS, probably due to a lack of turbulence generation in the inlet
opening. Despite the deviations between experiments and simulations, the trend compared to the
simple OOOOO configuration is well captured. In particular noteworthy is the similarity of the
profiles for 500 kW for OOOOO with 200000 m3/h extraction rate and XXOXX with 40000
m3/h (implying the same inlet air velocity): this experimentally observed similarity is confirmed
in the CFD simulations. This is re-assuring for the use as CFD complementary to experiments.
20
Figure 7. Mean temperature (oC) profiles along the centerline under the ceiling. Top left:
OOOOO, 500 kW; top right: XXOXX, 500 kW. Bottom left: OOOOO, 4 MW. Bottom right:
XXOXX, 4 MW. Smoke extraction rate = 40000 – 200000 m3/h (for 500 kW) and 200000 m3/h
(for 4 MW).
c. Impact of Flow Pattern
In this section, different flow patterns are discussed in more detail, along with the effect on the
resulting smoke pattern for identical fire HRR and smoke extraction rate. It is a particular
strength of CFD that such flow features can easily be demonstrated.
Figure 8 shows fields of longitudinal velocity in horizontal planes at height Z = 1.2 m (well
below the smoke layer) and Z = 2.65 m (inside the smoke layer under the ceiling), for smoke
extraction rate equal to 200000 m3/h and fire HRR equal to 500 kW, for configurations OOOOO,
XXOXX, OXXXO and XXXXO. Negative values indicate recirculation. For OOOOO extremely
simple, unidirectional flow patterns are observed. At Z = 1.2 m, a relatively uniform flow is seen,
from inlet towards extraction. At Z = 2.65 m, behind the fire source there is stronger flow
towards the extraction fans than at Z = 1.2 m, but back-flow is also observed, mainly in the
central part between the fire source and the inlet opening, due to the channeling effect of the
longitudinal beams. This is in line with the results discussed in section 4.a: the smoke back-
layering distance exceeds 15 m for OOOOO with 500 kW and extraction rate 200000 m3/h
(Figure 4). Close to the fire, the highest velocities are observed due to the plume impingement
onto the ceiling. For XXOXX, at Z = 1.2 m a strong central flow through O is observed, with
relatively little spreading. Two recirculation regions are recognized along the side walls over the
entire car park length, i.e. all the way from the back to the front. At Z = 2.65 m, essentially the
same pattern is observed. Unlike in OOOOO, the fire is now not strong enough to affect the flow

21
pattern substantially. It is overwhelmed by the strong air flow. The small recirculation region
close to the inlet is due to inclusion of the surroundings in the CFD simulations: a small
recirculation region appears just beneath the ceiling as the air enters into the car park. In
OXXXO, at Z = 1.2 m two strong air streams through the O’s are observed and a large central
recirculation region appears in the middle of these streams. This recirculation region extends
from the back side, all the way to the front side. Interestingly, the fire source is thus approached
by air from the back side! At Z = 2.65 m, the flow pattern is entirely different. The streams from
O are much weaker, basically because the smoke flow from the fire source acts as an obstruction
for the air flow, pushing it downward (so it is less visible than at Z = 1.2 m height). The large
central recirculation region, observed at Z = 1.2 m, is broken into 2 recirculation regions by the
fire plume: one from the back side to the fire and one from the fire to the front side. The smoke
that gets trapped into the latter, cannot easily be extracted. For XXXXO, at Z = 1.2 m one strong
air stream is observed from the O to the back. A single large counter-clockwise recirculation
pattern is recognized, covering almost the entire car park. At Z = 2.65 m, the strong air stream is
still clearly visible. It is pushed toward the side wall by the smoke from the fire source and close
to the fire, high velocities are observed due to the plume impingement onto the ceiling. Globally
the pattern does not deviate too strongly from what is observed at Z = 1.2 m.
Figure 9 provides the same information for HRR equal to 4 MW. At Z = 1.2 m, the patterns are
very much alike the ones in Figure 8. The fire is much stronger here, but the dominant effect is
near the ceiling, not at low heights. Only in the XXXXO configuration, where the fire is close to
the centre of the large recirculation zone, the fire is visible at Z = 1.2 m, much more than was the
case in Figure 9. In general, though, it is clear that the flow pattern at low heights is determined
by the geometry and the extraction rate basically. As expected, larger differences are observed at

22
Z = 2.65 m. For OOOOO, the flow pattern remains conceptually the same, but with much
stronger back-flow over the entire width between the fire source and the inlet opening, due to the
stronger fire source. The buoyant source is much stronger so the channeling effect of the beams
is not seen here. Along the side wall, back-flow is even observed all the way from the back
corners of the car park up to the opening. The extraction rate is not high enough to prevent this.
For XXOXX, the pattern is very similar to the one in Figure 8. The oncoming air flow is now
strong enough to overcome the smoke dynamics from the 4 MW fire. The resistance to the air
flow is stronger, as visible in the breaking of the central air stream and the shift of the
recirculation regions at the sides towards the front side of the car park, but the global flow
pattern remains the same. This is not the case for OXXXO. The recirculation region between the
back side of the car park and the fire plume is now destroyed by the dynamics of the smoke,
emerging from the strong fire source. The recirculation region between the fire source and the
front side now also becomes stronger and wider. The strong incoming air streams, clearly visible
at Z = 1.2 m, are not observed at all at Z = 2.65 m. For XXXXO, the difference between the 500
kW and the 4 MW fire is also substantial: whereas the strong air stream is clearly visible in
Figure 8 at Z = 2.65 m, it is completely squeezed to the side wall by the strong smoke from the 4
MW fire source. Inside the large recirculation region, the plume impingement is very clear: high
velocities behind the fire source towards the extraction and strong back-flow as well towards the
front wall. The back-flow at the left wall is also ‘broken’ by the smoke impingement flow under
the ceiling.

23
Figure 8. Longitudinal velocity in horizontal planes at height Z = 1.2 m (left) and Z = 2.65 m
(right). Fire HRR = 500 kW, smoke extraction rate = 200000 m3/h. Top: OOOOO; 2nd row:
XXOXX; 3rd row: OXXXO; bottom: XXXXO. Negative values indicate recirculation. Arrows
indicate flow pattern.

24
Figure 9. Longitudinal velocity in horizontal planes at height Z = 1.2 m (left) and Z = 2.65 m
(right). Fire HRR = 4 MW, smoke extraction rate = 200000 m3/h. Top: OOOOO; 2nd row:
XXOXX; 3rd row: OXXXO; bottom: XXXXO. Negative values indicate recirculation.
indicate flow pattern.
Longitudinal velocity in horizontal planes at height Z = 1.2 m (left) and Z = 2.65 m
(right). Fire HRR = 4 MW, smoke extraction rate = 200000 m3/h. Top: OOOOO; 2nd row:
XXOXX; 3rd row: OXXXO; bottom: XXXXO. Negative values indicate recirculation.
Longitudinal velocity in horizontal planes at height Z = 1.2 m (left) and Z = 2.65 m
(right). Fire HRR = 4 MW, smoke extraction rate = 200000 m3/h. Top: OOOOO; 2nd row:
XXOXX; 3rd row: OXXXO; bottom: XXXXO. Negative values indicate recirculation. Arrows

25
Figure 10 shows the resulting mean temperature profiles along the different thermocouple lines
under the ceiling for 500 kW and 4 MW. Recall that mainly the profile shape is important, rather
than absolute values. The impact of the flow pattern is clearly huge, as could be expected from
Figures 8 and 9. For OOOOO, agreement between simulations and experiments is good, both for
500 kW and 4 MW, as discussed before (Figure 7). For XXOXX, it has already been mentioned
that the spreading of the incoming air flow through O is probably under-estimated in FDS,
leading to lower temperatures and a shift of the temperature peak towards the back side of the car
park in the centerline profile. Yet, the order of magnitude in shift from OOOOO to XXOXX is
well captured. For the 500 kW HRR, essentially no temperature rise is observed, nor in the
experiments, nor in the simulations. The configurations OXXXO and XXXXO are more
complex, as they involve recirculation patterns. If these are not well predicted, seemingly large
deviations between experiments and temperature profiles from the simulations must become
visible. Agreement between experiments and simulations is indeed less satisfactory. The
upstream shift of the position of peak temperature due to the recirculation zone in the OXXXO
set-up is well predicted, but the shift in position is too strong in the simulations and the
temperatures relatively too high. This is again an indication of too low turbulence levels: there is
less mixing in the flow, causing too strong recirculation and too low temperature fluctuations.
The most complex case, XXXXO, is relatively poorly predicted for the 500 kW HRR, basically
again due to too strong recirculation (lack of turbulent mixing). Interestingly, the agreement is
better for the 4 MW HRR: as the fire source becomes stronger, the impact of the incoming air
flow loses strength compared to the smoke’s own dynamics and FDS provides simulation results
in better agreement with the experimental data.

26
Figure 10. Centerline profiles of mean temperature (oC) under the ceiling for HRR = 500 kW
(left) and 4 MW (right) for OOOOO, XXOXX, OXXXO and XXXXO. Smoke extraction rate =
200000 m3/h.
Activation of the jet fans hardly affects the results. This is probably due to the quite strongly
downward angle at the jet fans’ exit: the situation at the ceiling is hardly affected in the set-up at
hand.
Thus far, the discussion focused on confirmation of the observations made in the full-scale
experiments of [1]. It is re-assuring and comforting that trends are essentially well captured in
the CFD simulations. As such, it can be concluded at this stage that CFD simulations are a
reliable tool in the design stage, provided they are performed appropriately.
Now the discussion is extended to cases which have not been examined experimentally. More
particularly, the effect of increased smoke extraction rate (400000 m3/h) is examined for the

27
different inlet opening configurations or, in other words, for the different resulting flow patterns.
The intuitive expectation is that increasing the smoke extraction rate results in lower
temperatures, less smoke back-layering and more back-ward flame tilting. Comparison of
Figures 10 and 11, however, reveals that this is only true for the OOOOO and XXOXX
configuration, where the oncoming air flow ‘cannot miss’ the fire source, i.e. the oncoming air
flow is essentially unidirectional from inlet to extraction point and ‘hits’ the fire source
automatically. In the OOOOO configuration, the extraction rate of 400000 m3/h is sufficient to
prevent smoke back-layering up to the car park inlet for the 4 MW fire HRR (the temperature
becomes ambient temperature near the inlet). This is in line with the correlation of [11].
A more important observation is that, in all configurations, the basic flow pattern does not
change when the smoke extraction rate increases (not shown). In particular, recirculation regions
do not disappear or change in shape. As a consequence, in configurations OXXXO and XXXXO,
where the fire source is inside a recirculation region behind the XXX(X) parts of the inlet
opening, much of the incoming air bypasses the fire source to a certain extent and the smoke is
trapped inside the recirculation region. Increasing the smoke extraction rate clearly does not help
to extract the smoke more efficiently. Indeed, in Figure 11, even for the low fire HRR of 500
kW, though the temperatures are lower due to more cooling by the increased air flow rate, the
presence of smoke near the car park inlet (Y = 0 m) is practically the same as in Figure 10 for the
OXXXO and XXXXO configuration.

28
Figure 11. Centerline profiles of mean temperature
(left) and 4 MW (right) for OOOOO, XXOXX, OXXXO and XXXXO.
400000 m3/h.
d. Impact of Presence of Beam
In this section the possible impact of the presence of longitudinal and transversal beams is
examined. As in the previous sections, the configuration of [1] is examined first, i.e. a 17 m
transversal beam of 50 cm depth
of the temperature in the vertical symmetry plane for HRR equ
XXOXX. In the OOOOO configuration, the blocking effect by the beam is clearly observed (but
smoke back-layering up to the car park inlet is not prevented). In the XXOXX configuration, the
effect of the beam is minor: also without b
smoke back-layering. For OXXXO and XXXXO, there is a recirculation region and the
the beam is not very crucial.
Centerline profiles of mean temperature (oC) under the ceiling for HRR = 500 kW
(left) and 4 MW (right) for OOOOO, XXOXX, OXXXO and XXXXO. Smoke extraction rate =
Impact of Presence of Beams
In this section the possible impact of the presence of longitudinal and transversal beams is
examined. As in the previous sections, the configuration of [1] is examined first, i.e. a 17 m
cm depth is positioned at position Y = 10 m. Figure
the temperature in the vertical symmetry plane for HRR equal to 4 MW
In the OOOOO configuration, the blocking effect by the beam is clearly observed (but
layering up to the car park inlet is not prevented). In the XXOXX configuration, the
effect of the beam is minor: also without beam the air velocity was high enough to prevent
For OXXXO and XXXXO, there is a recirculation region and the
under the ceiling for HRR = 500 kW
Smoke extraction rate =
In this section the possible impact of the presence of longitudinal and transversal beams is
examined. As in the previous sections, the configuration of [1] is examined first, i.e. a 17 m long
Figure 12 shows a snapshot
al to 4 MW for OOOOO and
In the OOOOO configuration, the blocking effect by the beam is clearly observed (but
layering up to the car park inlet is not prevented). In the XXOXX configuration, the
eam the air velocity was high enough to prevent
For OXXXO and XXXXO, there is a recirculation region and the effect of

29
Figure 12. Temperature in vertical symmetry plane. Left: OOOOO; right: XXOXX. Fire HRR =
4 MW. Smoke extraction rate = 200000 m3/h.
Figure 13 allows a quantitative discussion. For the 500 kW fire HRR, the effect of the beam is
negligible in the XXOXX configuration: regardless of the presence of the beam, there is hardly
any temperature rise due to the very strong oncoming air flow. In the OXXXO configuration, the
beam is situated inside the recirculation region and, although a temperature jump is observed at
the beam location, the effect of the beam is small, as already mentioned. In the OOOOO
configuration, though, the beam effectively blocks the smoke and back-layering up to the car
park inlet is avoided. The explanation is simple: the momentum of the smoke, flowing at the
ceiling, is broken and the momentum of the oncoming air suffices to push the smoke, trying to
flow beneath the beam, backward. For the 4 MW fire HRR, this is not true: a clear temperature
jump is observed at the beam location, but back-layering is visible up until the car park inlet, in
line with Figure 12. Behind the beam, in the fire source area, temperatures are higher than when
the beam is absent: the fresh air cannot reach this region and as such, there is less cooling effect.
In the XXOXX configuration, the effect of the beam is negligible again, as could be expected.
The effect of the jet fans, implemented as described above, is small (not shown).

30
Figure 13. Profiles of mean temperature (oC) along the centerline under the ceiling for HRR =
500 kW (left) and 4 MW (right) for OOOOO, XXOXX and OXXXO, with and without
transversal beam. Smoke extraction rate = 200000 m3/h.
Clearly, the presence of beams is very important. Therefore, the CFD study has been extended
beyond what has been measured in [1]. Obviously, care must be taken not to accept the results
obtained (reported in Table 3) as perfect representations of reality. The results from the previous
sections provide some confidence in the quality of the CFD results. Still, the numbers as
obtained from the simulations must be regarded as indicative for reality, not as absolute values
without any uncertainty.
Pressure losses are not considered: a fixed extraction rate is imposed, regardless of possible
pressure losses due to flow obstruction. Figure 14 summarises the results in terms of back-
layering distance and smoke extraction rate for a 4 MW HRR fire in a 30 m x 30 m x 2.4 m car
park. The following observations can be made:
- For a flat ceiling, the extraction flow rate, corresponding to a back-layering distance d of
15 m, is around 300000 m3/h, with an inlet air velocity of about 1.1 m/s.
- When 40 cm deep longitudinal beams are present (with distance of 11 m in between them
here), the extraction flow rate for d = 15 m increases to 355000 m3/h, i.e. an increase of
almost 20 % compared to a flat ceiling. This is due to the channeling effect by the beams:
the momentum of the smoke from the fire source is directed more into the longitudinal
direction, so that more momentum is required in the ventilation air flow.
- When a 40 cm deep transversal beam is present, the extraction flow rate for d = 15 m
decreases to around 290000 m3/h. In this case, the main effect is the breaking of the

31
momentum of the smoke in the longitudinal direction. The oncoming air is forced under
the beam and as such even gains momentum. Interestingly, the decrease in required
extraction rate for a back-layering distance of 15 m, compared to the flat ceiling
configuration, is much smaller than the reduction in cross-section area for the air flow
(height reduction from 2.4 m to 2 m), implying that the required average velocity beneath
the beam is higher than what is needed in a flat ceiling configuration. This implies that
design calculations, based on the free height between floor and bottom side of beams,
using velocities for flat ceilings, are not safe. As soon as the extraction rate exceeds
320000 m3/h, the smoke is effectively blocked by the beam.
- When both transversal and longitudinal beams are present, the combined effect strongly
depends on the beam depth. The global trend is a decrease in required extraction flow rate
as the beam depth increases. For 20 cm deep beams, the extraction flow rate for d = 15 m
is around 295000 m3/h, which is comparable to what is obtained with the flat ceiling. For
40 cm deep beams, the extraction flow rate is around 270000 m3/h. Interestingly, this is
lower than for the configuration with only a transversal beam. The reason is that, with
both transversal and longitudinal beams, the smoke momentum is broken in all directions.
In the case of a transversal beam alone, the sideward momentum of the smoke is so
strong that, hitting the side walls, smoke back-layering is more pronounced there and the
required extraction flow rate to limit back-layering to a distance of 15 m is higher. This
effect would not be visible if the side walls were further away.
Transform the extraction flow rates to average air velocities, determined as the average velocity
from floor to either bottom side of beams or to ceiling height (when no transversal beam is
present), reveals that all velocities are clearly higher than the value for the flat ceiling (Table 3).

32
This implies that SHC design calculations, determining the required smoke extraction rate from
average velocities below beams and assuming these velocities are the same as for a flat ceiling
configuration, are not conservative.
Figure 14. Variation of back-layering distance with smoke extraction rate for a 4 MW fire (30 %
radiation losses) in a 30 m x 30 m x 2.4 m car park, OOOOO configuration.
Config. Flat L_40cm T_40cm LT_20cm LT_40cm LT_60cm
vair,av (m/s) 1.1 1.25 1.23 1.15 1.15 1.17
Table 3. Required average air velocity (from floor level to bottom side of beams or to ceiling
height) as obtained from the simulations to limit the smoke back-layering distance to d = 15m for
a 4 MW fire in a 30 m x 30 m x 2.4 m car park. L: longitudinal beams present; T: transversal
beams present.
240000
260000
280000
300000
320000
340000
360000
380000
5 7 9 11 13 15
Q_
ex
tr
Back-layering distance [m]
HRR= 4MW
2.4 m
2.4 m + beams_20cm
2.4 m +beams_40cm
2.4 m +beams_60cm
2.4 m +long_40cm
2.4 m +transv_40cm

33
5. Conclusions
CFD results have been presented for a large number of car park fire configurations. The
following conclusions can be drawn:
- The trends, observed in full-scale experiments, are captured well, so that CFD
simulations, when performed properly, are reliable and complementary to experiments in
the sense that additional insight is gained from the CFD.
- As long as the flow is essentially unidirectional, increased fire HRR and decreased smoke
extraction rates lead to more smoke back-layering, the effect of the smoke extraction rate
being much stronger than the fire HRR.
- When recirculation regions appear and smoke gets trapped, increasing the smoke
extraction rate is not a solution to remove the smoke.
- On the meshes applied, FDS has the tendency to under-predict turbulent mixing of the
incoming air flow with the flows inside the car park, probably due to lack of turbulence at
inlet openings. As a consequence, differences in flow patterns due to modifications in the
car park inlet opening are too much pronounced in the simulations. Still, the simulated
flow patterns agree well with experimental observations.
- When beams are present, the required smoke extraction rate decreases when there are
transversal beams and increases when there are only longitudinal beams. In any case, the
average velocity between floor and bottom side of beams is higher than for the flat
ceiling configuration, so that design calculations based on a flat ceiling are not safe.
- The order of magnitude of required air velocity to limit smoke back-layering to a distance
of 15 m for a 4 MW fire, representative of a car fire, is 1.1 m/s.

34
6. Acknowledgements
The results presented have been obtained through the SBO project 080010, funded by IWT
(Flanders, Belgium).
7. References
[1] X. Deckers, S. Haga, N. Tilley, B. Sette and B. Merci, “Smoke control in case of fire in a large car park: Full-Scale Experiments”, Fire Safety Journal (submitted).
[2] W.K. Chow, “Use of a Time Constant for Designing a Smoke Control System in Car Parks”, J. of Fire Sciences 13 (5), pp. 357-377 (1995).
[3] F. Colella G. Rein, R. Borchiellini and J.L. Torero, “A Novel Multiscale Methodology for Simulating Tunnel Ventilation Flows during Fires”, Fire Technology (2011), 47(1):221-253
[4]. B. Merci and M. Sjipp, “Smoke and heat control for fires in large car parks: Lessons learnt from research?”,Fire Safety Journal (submitted).
[5] F. Colella, G. Rein, R. Carvel, P. Reszka and J.L. Torero "Analysis of the ventilation systems in the Dartford tunnels using a multi-scale modelling approach", Tunnelling and Underground Space Technology 25, pp. 423-432 (2010).
[6] F. Colella, G. Rein, R. Borchiellini and V. Verda “Multiscale Modelling of the Transient Flows from Fire and Ventilation in Long Tunnels, Computer & Fluids (2011), 51(1): 16-29.
[7] K. Kang, “A smoke model and its application for smoke management in an underground mass transit station ” Fire Safety Journal 42 (3), pp. 218-231 (2007).
[8] S. Kumar, G. Cox, P.H. Thomas, “Air entrainment into balcony spill plumes”, Fire Safety Journal 45 (3), pp. 159-167 (2010).
[9] N. Tilley, P. Rauwoens and B. Merci, “Verification of the Accuracy of CFD Simulations in Small-Scale Tunnel and Atrium Fire Configurations”, Fire Safety Journal 46, pp. 186 – 193 (2011).
[10] Fire Dynamics Simulator (Version 5), National Institute of Standards and Technology, USA (2010). http://www. fire.nist.gov/fds/
[11] S.B. Pope, Turbulent Flows, Cambridge University Press (2000).
[12] K. Van Maele and B. Merci, “Application of RANS and LES Field Simulations to Predict the Critical Ventilation Velocity in Longitudinally Ventilated Horizontal Tunnels”, Fire Safety Journal 43 (8), pp. 598-609 (2008).

35
[13] NBN S21-208-2: “Fire protection inside buildings - Design of smoke and heat exhaust ventilation systems (SHEVS) for indoor car parks”, Belgium (2011).
[14] B.J.M. v.d.Giesen, S.H.A. Penders, M.G.L.C. Loomans, P.G.S. Rutten and J.L.M. Hensen, “Modelling and simulation of a jet fan for controlled air flow in large enclosures”, Environmental Modelling & Software 26 (2011) 191-200.
[15] S. Brohez, C. Delvosalle and G. Marlair, “A two-thermocouples probe for radiation corrections of measured temperatures in compartment fires”, Fire Safety Journal, 39 (5) (2004) 399-411
[16] N. Tilley, X. Deckers and B. Merci, “CFD Study of Ventilation Velocity and Smoke Back-Layering Distance in Car Parks”, Fire Safety Journal (submitted).
![CFD Modelling for Smoke Movementfe.hkie.org.hk/Upload/Doc/4c0725e5-5732-4355-9885... · CFD modelling examples 27 . Temperature Visibility [CO] 28 Key Parameters from CFD simulation](https://img.pdfslide.net/doc/110x75/5e903441bf32a85bcb51aef9/cfd-modelling-for-smoke-cfd-modelling-examples-27-temperature-visibility-co.jpg)


![Car Alarms & Smoke Alarms [Monitorama]](https://img.pdfslide.net/doc/110x75/54b6cdf94a7959d84d8b45a5/car-alarms-smoke-alarms-monitorama.jpg)