Embed Size (px)
Citation preview
Smoking Cessation and Mortality Trends among 118,000 Californians, 1960-1997
James E. Enstrom; Clark W. Heath, Jr.
Epidemiology, Vol. 10, No. 5. (Sep., 1999), pp. 500-512.
Stable URL:
http://links.jstor.org/sici?sici=1044-3983%28199909%2910%3A5%3C500%3ASCAMTA%3E2.0.CO%3B2-Y
Epidemiology is currently published by Lippincott Williams & Wilkins.
Your use of the JSTOR archive indicates your acceptance of JSTOR's Terms and Conditions of Use, available athttp://www.jstor.org/about/terms.html. JSTOR's Terms and Conditions of Use provides, in part, that unless you have obtainedprior permission, you may not download an entire issue of a journal or multiple copies of articles, and you may use content inthe JSTOR archive only for your personal, non-commercial use.
Please contact the publisher regarding any further use of this work. Publisher contact information may be obtained athttp://www.jstor.org/journals/lww.html.
Each copy of any part of a JSTOR transmission must contain the same copyright notice that appears on the screen or printedpage of such transmission.
JSTOR is an independent not-for-profit organization dedicated to and preserving a digital archive of scholarly journals. Formore information regarding JSTOR, please contact [email protected].
http://www.jstor.orgTue Jun 12 18:59:49 2007
Smoking Cessation and Mortality Trends among 118,000 Californians, 1960-1997
James E. Enstroml and Clark W. Heath, Jr .2J
We assessed the impact of smoking cessation on subsequent death rates among a cohort of 51,343 men and 66,751 women in California enrolled in late 1959 in the original American Cancer Society (ACS) Cancer Prevention Study (CPS I) and followed for 38 years. We compared the age-adjusted death rate, expressed as deaths per 1,000 person-years, among all subjects who smoked cigarettes in 1959 but who had largely quit as of 1997 with the death rate among never smokers over a 38-year period. The all causes death rate for males decreased from 20.67 during 1960-1969 to 18.68 during 1960-1997 for smokers and decreased from 10.51 to 9.46 for never smokers. The lung cancer death rate for males increased from 1.558 to 1.728 for smokers and increased from 0.127 to 0.133 for never
smokers. The all causes death rate for females increased from 9.54 to 10.14 for smokers and decreased from 6.95 to 6.44 for never smokers. The lung cancer death rate for females in- creased greatly from 0.208 to 0.806 for smokers and increased from 0.094 to 0.116 for never smokers. These results indicate there has been no important decline in either the absolute or relative death rates from all causes and lung cancer for ciga- rette smokers as a whole compared with never smokers in this large cohort, in spite of a substantial degree of smoking cessa- tion. While cessation clearlv reduces the mortalitv risk among long-term former smokers, ;he population irnpact'of cessatio; appears to be less than currently believed. (Epidemiology 1999; 10:500-512)
Keywords: cigarette smoking, smoking cessation, mortality, lung cancer, trends, Cancer Prevention Study.
It has been estimated that cigarette smoking causes about one-fifth of all U.S. deaths.' This figure represents over 400,000 deaths per year, mainly from coronary heart disease, lung cancer, and other respiratory diseases, that in principle can be substantially reduced by smok- ing cessation. Nevertheless, in spite of a substantial degree of cigarette smoking cessation and a large reduc- tion in tar and nicotine levels in ciearettes durine the
c, u
past 35 years in the general U.S. population,* the lung cancer death rate remains persistently high.3 Indeed, among U.S. adults since 1966 the percentage of current cigarette smokers has declined from 43% to 25% and the Dercentaee of former smokers has increased from 13% to -25%. and vet the lune cancer death rate has increased bv about 100%. Thus, it-is important to evaluate the impac; of smoking cessation from a perspective that may ex- plain these trends.
From the 'School of Public Health and Jonsson Comprehensive Cancer Center, University of Califomia, Los Angeles, CA, and 2Amer~can Cancer Society, Atlanta, GA. )Present address: Radiation Effects Research Foundation, 5-2 Hijiyama Park, Minami-ku, Hiroshima City, 732-0815, Japan.
Address correspondence to: James E. Enstrom, School of Public Health, Uni- versity of Califomia, Los Angeles, CA 90095-1772.
This study was initiated by the American Cancer Society and extended follow-up was supported by a research grant from the Tobacco-Related Disease Research Program of the University of Califomia.
Submitted June 2, 1998; final version accepted February 11, 1999.
O 1999 by Epidemiology Resources Inc
The mortality benefits of smoking cessation are based primarily on nonexperimental observational epidemio- logic studies, which consistently indicate that the death rates of former cigarette smokers are lower than those of current cigarette smokers, and that the former smoker death rates converge toward those of never smokers the longer the former smokers have not ~ m o k e d . ~ Among former smokers whose smoking status was determined at the time they entered an epidemiologic study, the de- cline in risk of death compared with never smokers begins during the first 5 years after quitting and contin- ues for at least 10-15 years. After 15-20 years, the risk of all-cause mortality returns nearly to that of never smokers and the risk of lung cancer mortality drops to about twice that of never smokers.
These nonexperimental studies have the limitation that the reported benefits of cessation are based on mortality patterns among persons who were already former smokers at the time they enrolled and were classified by the number of years since they last smoked at time of enrollment. The self-selected former smokers who enrolled in these studies are those who were alive at the time the study began. A former smoker who stopped 15 years before the study began is by definition one who remained alive those 15 years. Former smokers who died before the study began would obviously not be included and might be different from the self-selected former smokers who were included. Also, former smokers who have only stopped for a short time period (generally less than 5 years) and/or former smokers who were in poor
Epidemiology September 1999, Vol. 10 No. 5 S M O K I N G C E S S A T I O N AND M O R T A L I T Y T R E N D S 501
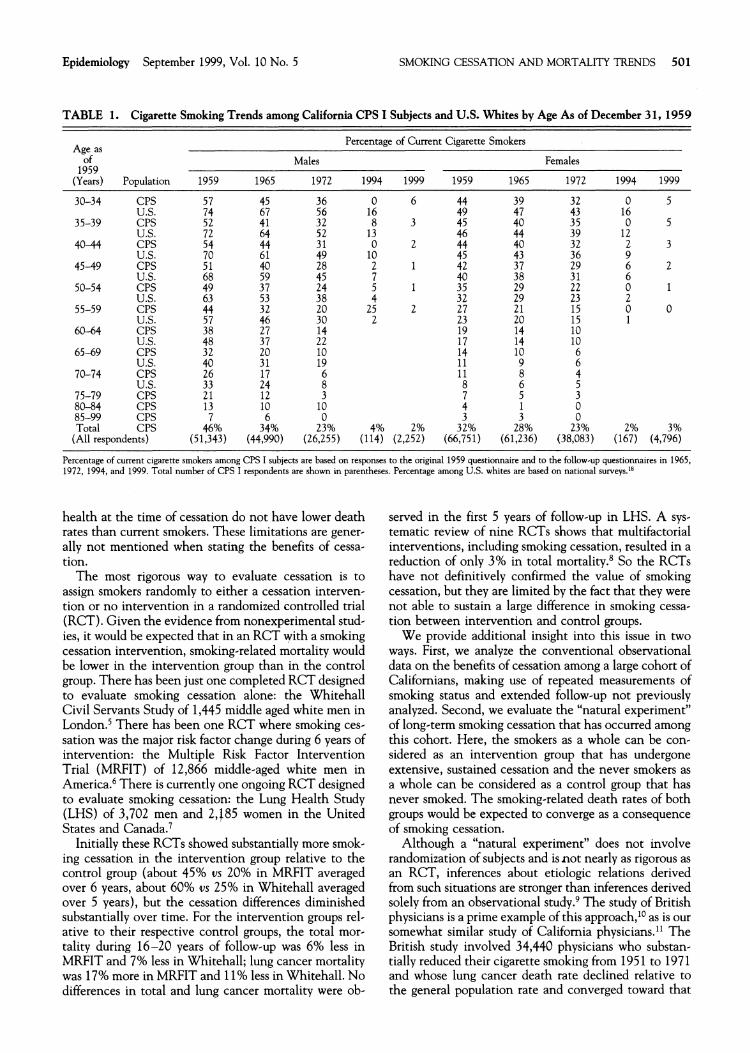
TABLE 1. Cigarette Smoking Trends among California CPS I Subjects and U.S. Whites by Age As of December 31, 1959
Percentage of Current Cigarette Smokers A g e as
of Males Females 1959
(Years) Population 1959 1965 1972 1994 1999 1959 1965 1972 1994 1999
30-34 C P S U.S.
35-39 C P S U.S.
40-44 CPS U.S.
45-49 CPS U.S.
50-54 CPS U.S.
55-59 C P S U.S.
6 0 4 4 C P S U.S.
6549 C P S U.S.
70-74 C P S U.S.
75-79 C P S 80-84 C P S 85-99 C P S T o t a l CPS
(Al l respondents)
Percentage of current cigarette smokers among CPS I subjects are based on responses to the original 1959 questionnaire and to the follow.up questionnaires in 1965, 1972, 1994, and 1999. Total number of CPS I respondents are shown in parentheses. Percentage among U.S. whites are based on nat~onal surveys.18
health at the time of cessation do not have lower death rates than current smokers. These limitations are gener- ally not mentioned when stating the benefits of cessa- tion.
The most rigorous way to evaluate cessation is to assign smokers randomly to either a cessation interven- tion or no intervention in a randomized controlled trial (RCT). Given the evidence from nonexperimental stud- ies, it would be expected that in an RCT with a smoking cessation intervention, smoking-related mortality would be lower in the intervention group than in the control group. There has been just one completed RCT designed to evaluate smoking cessation alone: the Whitehall Civil Servants Study of 1,445 middle aged white men in L ~ n d o n . ~There has been one RCT where smoking ces- sation was the major risk factor change during 6 years of intervention: the Multiple Risk Factor Intervention Trial (MRFIT) of 12,866 middle-aged white men in A m e r i ~ a . ~There is currently one ongoing RCT designed to evaluate smoking cessation: the Lung Health Study (LHS) of 3,702 men and 2,185 women in the United States and Canada.'
Initially these RCTs showed substantially more smok- ing cessation in the intervention group relative to the control group (about 45% us 20% in MRFIT averaged over 6 years, about 60% us 25% in Whitehall averaged over 5 years), but the cessation differences diminished substantially over time. For the intervention groups rel- ative to their respective control groups, the total mor- tality during 16-20 years of follow-up was 6% less in MRFIT and 7% less in Whitehall; lung cancer mortality was 17% more in MRFIT and 11% less in Whitehall. No differences in total and lung cancer mortality were ob-
served in the first 5 years of follow-up in LHS. A sys-tematic review of nine RCTs shows that multifactorial interventions, including smoking cessation, resulted in a reduction of only 3% in total m~r ta l i ty .~ So the RCTs have not definitively confirmed the value of smoking cessation, but they are limited by the fact that they were not able to sustain a large difference in smoking cessa- tion between intervention and control groups.
We provide additional insight into this issue in two ways. First, we analyze the conventional observational data on the benefits of cessation among a large cohort of Californians, making use of repeated measurements of smoking status and extended follow-up not previously analyzed. Second, we evaluate the "natural experiment" of long-term smoking cessation that has occurred among this cohort. Here, the smokers as a whole can be con- sidered as an intervention group that has undergone extensive, sustained cessation and the never smokers as a whole can be considered as a control group that has never smoked. The smoking-related death rates of both groups would be expected to converge as a consequence of smoking cessation.
Although a "natural experiment" does not involve randomization of subjects and is not nearly as rigorous as an RCT, inferences about etiologic relations derived from such situations are stronger than inferences derived solely from an observational study.9 The study of British physicians is a prime example of this approach,1° as is our somewhat similar study of California physicians." The British study involved 34,440 physicians who substan- tially reduced their cigarette smoking from 1951 to 1971 and whose lung cancer death rate declined relative to the general population rate and converged toward that
502 Enstrom and Heath Epidemiology September 1999, Vol. 10 No. 5
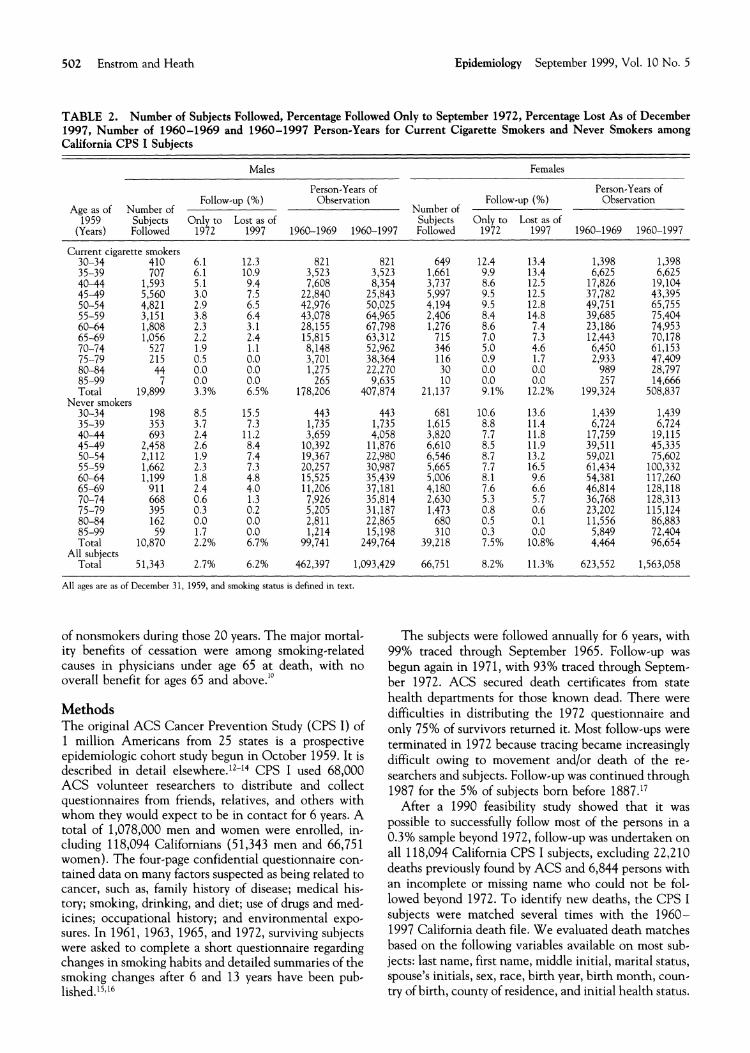
TABLE 2. Number of Subjects Followed, Percentage Followed Only to September 1972, Percentage Lost As of December 1997, Number of 1960-1969 and 1960-1997 Person-Years for Current Cigarette Smokers and Never Smokers among California CPS I Subjects
Males Females
Person-Years of Person-Years of Follow-up (%) Observation Follow-up (%) Observation
Age as of Number of Number of 1959 Subjects Only to Lost as of Subjects Only to Lost as of
(Years) Followed 1972 1997 1960-1969 1960-1997 Followed 1972 1997 1960-1969 1960-1997
Current cigaret :te smokers 30-34 35-39 40-44 4549 50-54 55-59 6044 65-69 70-74 75-79 80-84 85-99 Total
Never smokers 30-34 35-39 40-44 45-49
Total All subjects
Total
All ages are as of December 31, 1959, and smoking status is defined m text
of nonsmokers during those 20 years. The major mortal- ity benefits of cessation were among smoking-related causes in physicians under age 65 at death, with no overall benefit for ages 65 and above.''
Methods The original ACS Cancer Prevention Study (CPS I) of 1 million Americans from 25 states is a prospective epidemiologic cohort study begun in October 1959. It is described in detail el~ewhere. '~- '~ CPS I used 68,000 ACS volunteer researchers to distribute and collect questionnaires from friends, relatives, and others with whom they would expect to be in contact for 6 years. A total of 1,078,000 men and women were enrolled, in- cluding 118,094 Californians (5 1,343 men and 66,75 1 women). The four-page confidential questionnaire con- tained data on many factors suspected as being related to cancer, such as, family history of disease; medical his- tory; smoking, drinking, and diet; use of drugs and med- icines; occupational history; and environmental expo- sures. In 1961, 1963, 1965, and 1972, surviving subjects were asked to complete a short questionnaire regarding changes in smoking habits and detailed summaries of the smoking changes after 6 and 13 years have been pub- l i ~ h e d . ' ~ . ' ~
The subjects were followed annually for 6 years, with 99% traced through September 1965. Follow-up was begun again in 1971, with 93% traced through Septem- ber 1972. ACS secured death certificates from state health departments for those known dead. There were difficulties in distributing the 1972 questionnaire and only 75% of survivors returned it. Most follow-ups were terminated in 1972 because tracing became increasingly difficult owing to movement and/or death of the re-searchers and subjects. Follow-up was continued through 1987 for the 5% of subjects born before 1887.17
After a 1990 feasibility study showed that it was possible to successfully follow most of the persons in a 0.3% sample beyond 1972, follow-up was undertaken on all 118,094 California CPS I subjects, excluding 22,210 deaths previously found by ACS and 6,844 persons with an incomplete or missing name who could not be fol- lowed beyond 1972. To identify new deaths, the CPS I subjects were matched several times with the 1960-1997 California death file. We evaluated death matches based on the following variables available on most sub- jects: last name, first name, middle initial, marital status, spouse's initials, sex, race, birth year, birth month, coun- try of birth, county of residence, and initial health status.
Epidemiology September 1999, Vol. 10 No. 5 SMOKING CESSATION AND MORTALITY TRENDS 503
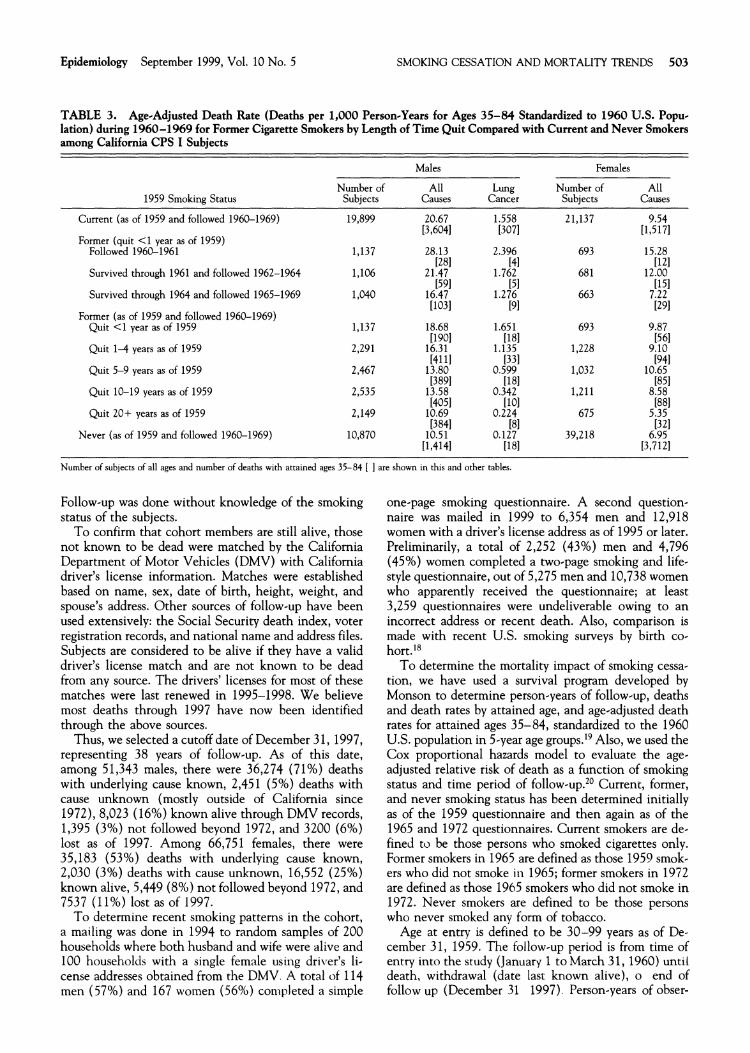
TABLE 3. Age-Adjusted Death Rate (Deaths per 1,000 Person-Years for Ages 35-84 Standardized to 1960 U.S. Popu- lation) during 1960-1969 for Former Cigarette Smokers by Length of Time Quit Compared with Current and Never Smokers among California CPS I Subjects
1959 Smoking Status
Current (as of 1959 and followed 1960-1969)
Former (quit <1 year as of 1959) Followed 1960-1961
Survived through 1961 and followed 1962-1964
Survived through 1964 and followed 1965-1969
Former (as of 1959 and followed 1960-1969) Quit <1 year as of 1959
Quit 1-4 years as of 1959
Quit 5-9 years as of 1959
Quit 10-19 years as of 1959
Quit 20+ years as of 1959
Never (as of 1959 and followed 1960-1969)
Males Females
Number of Subjects
All Causes
Lung Cancer
Number of Subjects
All Causes
Number of subjects of all ages and number of deaths with attamed ages 35-84 [ ] are shown in this and other tables.
Follow-up was done without knowledge of the smoking status of the subjects.
To confirm that cohort members are still alive, those not known to be dead were matched by the California Department of Motor Vehicles (DMV) with Califomia driver's license information. Matches were established based on name, sex, date of birth, height, weight, and spouse's address. Other sources of follow-up have been used extensively: the Social Security death index, voter registration records, and national name and address files. Subjects are considered to be alive if they have a valid driver's license match and are not known to be dead from any source. The drivers' licenses for most of these matches were last renewed in 1995-1998. We believe most deaths through 1997 have now been identified through the above sources.
Thus, we selected a cutoff date of December 31, 1997, representing 38 years of follow-up. As of this date, among 51,343 males, there were 36,274 (71%) deaths with underlying cause known, 2,451 (5%) deaths with cause unknown (mostly outside of Califomia since 1972), 8,023 (16%) known alive through DMV records, 1,395 (3%) not followed beyond 1972, and 3200 (6%) lost as of 1997. Among 66,751 females, there were 35,183 (53%) deaths with underlying cause known, 2,030 (3%) deaths with cause unknown, 16,552 (25%) known alive, 5,449 (8%) not followed beyond 1972, and 7537 (11%) lost as of 1997.
To determine recent smoking patterns in the cohort, a mailing was done in 1994 to random samples of 200 households where both husband and wife were alive and 100 households with a single female using dri\,er's li- cense addresses obtained from the DMV. A total of 114 men (57%) and 167 women (56%) completed a simple
one-page smoking questionnaire. A second question- naire was mailed in 1999 to 6,354 men and 12,918 women with a driver's license address as of 1995 or later. Preliminarily, a total of 2,252 (43%) men and 4,796 (45%) women completed a two-page smoking and life- style questionnaire, out of 5,275 men and 10,738 women who apparently received the questionnaire; at least 3,259 questionnaires were undeliverable owing to an incorrect address or recent death. Also, comparison is made with recent U.S. smoking surveys by birth co-hort.ls
To determine the mortality impact of smoking cessa- tion, we have used a survival program developed by Monson to determine person-years of follow-up, deaths and death rates by attained age, and age-adjusted death rates for attained ages 35-84, standardized to the 1960 U.S. population in 5-year age groups.19 Also, we used the Cox proportional hazards model to evaluate the age- adjusted relative risk of death as a function of smoking status and time period of follow-up.20 Current, former, and never smoking status has been determined initially as of the 1959 questionnaire and then again as of the 1965 and 1972 questionnaires. Current smokers are de- fined to be those persons who smoked cigarettes only. Former smokers in 1965 are defined as those 1959 smok- ers who did not smoke in 1965; former smokers in 1972 are defined as those 1965 smokers who did not smoke in 1972. Never smokers are defined to be those persons who never smoked any form of tobacco.
Age at entry is defined to be 30-99 years as of De- cember 31, 1959. The follow-up period is from time of entry into the study (January 1 to March 31, 1960) until death, withdrawal (date last known alive), o end of follow up (December 31 1997). Person-years of obser-
504 Enstrom and Heath Epidemiology September 1999, Vol. 10 No. 5
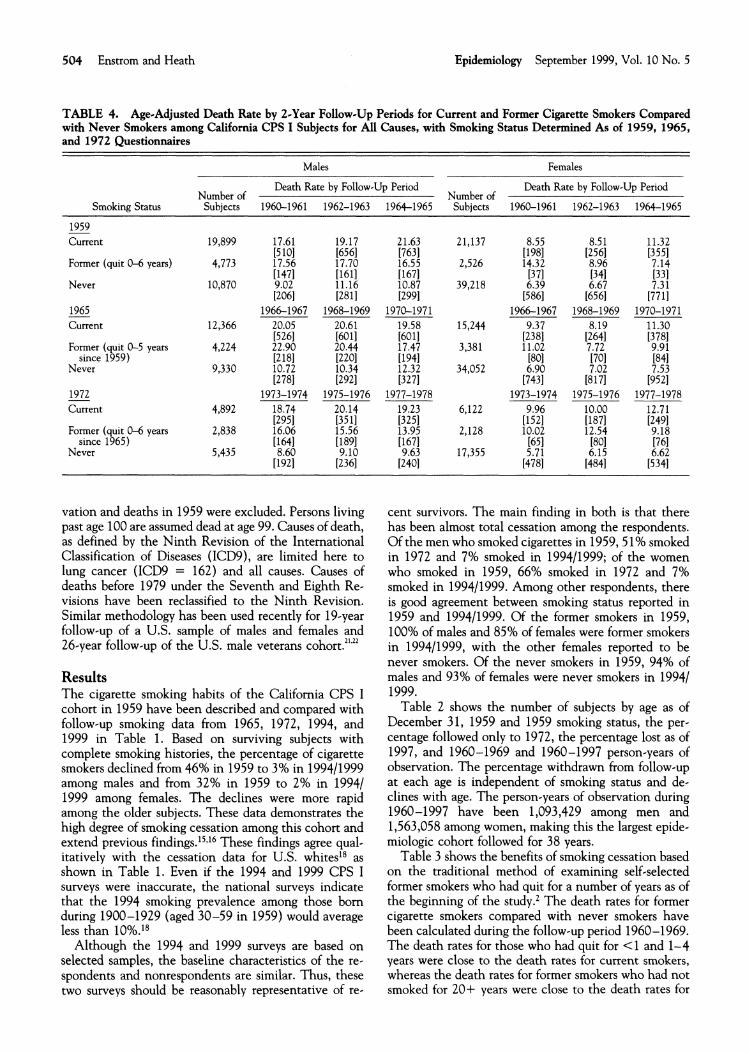
TABLE 4. Age-Adjusted Death Rate by 2-Year Follow-Up Periods for Current and Former Cigarette Smokers Compared with Never Smokers among California CPS I Subjects for All Causes, with Smoking Status Determined As of 1959, 1965, and 1972 Questionnaires
Males Females
Death Rate by Follow-Up Period Death Rate by Follow-Up Period
Smoking Status Number of
Sublects 1960-1961 1962-1963
1959 Current
Former (quit 0-6 years)
Never
1965-Current
Former (quit 0-5 years since 1959)
Never
1972-Current
Former (quit 0-6 years since 1965)
Never
vation and deaths in 1959 were excluded. Persons living past age 100 are assumed dead at age 99. Causes of death, as defined by the Ninth Revision of the International Classification of Diseases (ICD9), are limited here to lung cancer (ICD9 = 162) and all causes. Causes of deaths before 1979 under the Seventh and Eighth Re- visions have been reclassified to the Ninth Revision. Similar methodology has been used recently for 19-year follow-up of a U.S. sample of males and females and
Number of 1964-1965 Subjects 1960-1961 1962-1963 1964-1965
cent survivors. The main finding in both is that there has been almost total cessation among the respondents. Of the men who smoked cigarettes in 1959,51% smoked in 1972 and 7% smoked in 199411999; of the women who smoked in 1959, 66% smoked in 1972 and 7% smoked in 199411999. Among other respondents, there is good agreement between smoking status reported in 1959 and 199411999, Of the former smokers in 1959, 100% of males and 85% of females were former smokers
26-year follow-up of the U.S. male veterans ~ o h o r t . ~ ~ ' ~ ~ in 199411999, with the other females reported to be
Results The cigarette smoking habits of the California CPS I cohort in 1959 have been described and compared with follow-up smoking data from 1965, 1972, 1994, and 1999 in Table 1. Based on surviving subjects with complete smoking histories, the percentage of cigarette smokers declined from 46% in 1959 to 3% in 199411999 among males and from 32% in 1959 to 2% in 19941 1999 among females. The declines were more rapid among the older subjects. These data demonstrates the high degree of smoking cessation among this cohort and extend previous findings.15J6 These findings agree qual- itatively with the cessation data for U.S. whited8 as shown in Table 1. Even if the 1994 and 1999 CPS I surveys were inaccurate, the national surveys indicate that the 1994 smoking prevalence among those born during 1900-1929 (aged 30-59 in 1959) would average less than 10%.ls
Although the 1994 and 1999 surveys are based on selected samples, the baseline characteristics of the re- spondents and nonrespondents are similar. Thus, these two surveys should be reasonably representative of re-
never smokers. Of the never smokers in 1959, 94% of males and 93% of females were never smokers in 19941 1999.
Table 2 shows the number of subjects by age as of December 31, 1959 and 1959 smoking status, the per- centage followed only to 1972, the percentage lost as of 1997, and 1960-1969 and 1960-1997 person-years of observation. The percentage withdrawn from follow-up at each age is independent of smoking status and de- clines with age. The person-years of observation during 1960-1997 have been 1,093,429 among men and 1,563,058 among women, making this the largest epide- miologic cohort followed for 38 years.
Table 3 shows the benefits of smoking cessation based on the traditional method of examining self-selected former smokers who had quit for a number of years as of the beginning of the study.2 The death rates for former cigarette smokers compared with never smokers have been calculated during the follow-up period 1960-1969. The death rates for those who had quit for <1 and 1-4 years were close to the death rates for current smokers, whereas the death rates for former smokers who had not smoked for 20+ years were close to the death rates for
Epidemiology September 1999, Vol. 10 No. 5 SMOKING CESSATION AND MORTALITY TRENDS 505
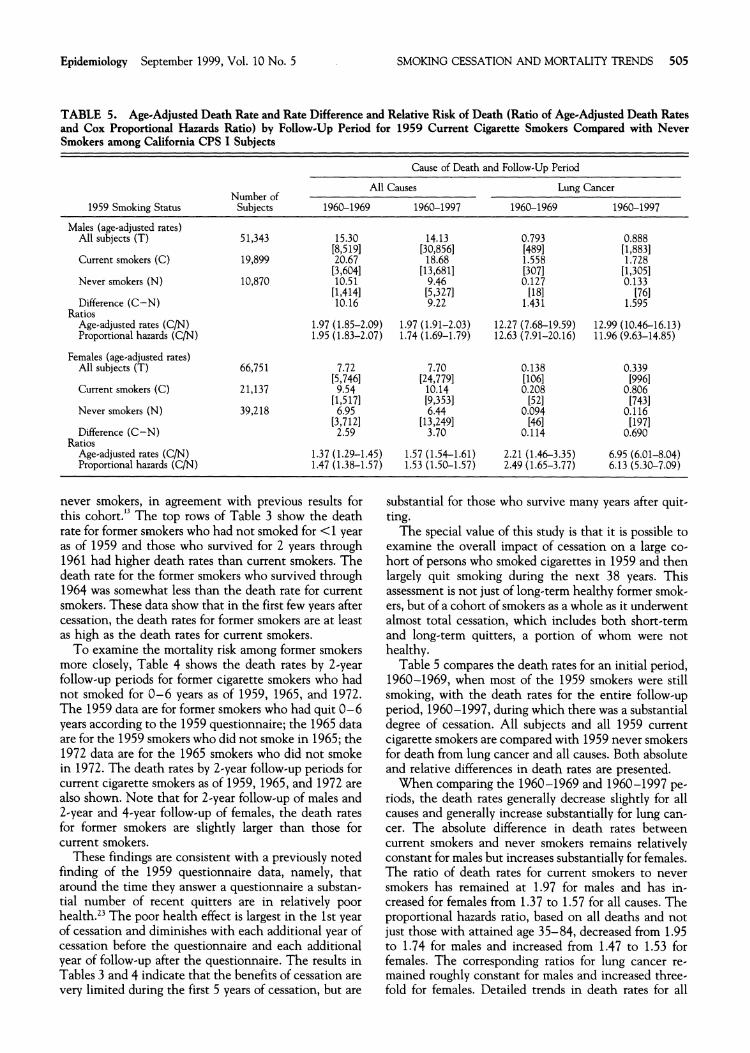
TABLE 5. Age-Adjusted Death Rate and Rate Difference and Relative Risk of Death (Ratio of Age-Adjusted Death Rates and Cox Proportional Hazards Ratio) by Follow-Up Period for 1959 Current Cigarette Smokers Compared with Never Smokers among California CPS I Subjects
1959 Smoking Status
Males (age-adjusted rates) All subiects (T), . .
Current smokers (C)
Never smokers (N)
Difference (C-N) Ratios
Age-adjusted rates (C/N) Proportional hazards (C/N)
Females (age-adjusted rates) All subjects (T)
Current smokers (C)
Never smokers (N)
Difference (C-N) Ratios
Age-adjusted rates (C/N) Proportional hazards ( C N )
Cause of Death and Follow-Up Period
All Causes Lung Cancer Number of
Subjects 1960-1969 1960-1997 1960-1969 1960-1997
5 1.343 15.30 14.13 0.793 0.888 [8,5191 [30,856] [4891 [1,8831
19,899 20.67 18.68 1.558 1.728 [3,6041 [13,681] [3071 [1,3051
10,870 10.51 9.46 0.127 0.133 [1,4141 [5,3271 [I81 [76110.16 9.22 1.431 1.595
1.97 (1.85-2.09) 1.97 (1.91-2.03) 12.27 (7.68-19.59) 12.99 (10.46-16.13) 1.95 (1.83-2.07) 1.74 (1.69-1.79) 12.63 (7.91-20.16) 11.96 (9.63-14.85)
1.37 (1.29-1.45) 1.57 (1.54-1.61) 2.21 (1.46-3.35) 6.95 (6.01-8.04) 1.47 (1.38-1.57) 1.53 (1.50-1.57) 2.49 (1.65-3.77) 6.13 (5.30-7.09)
never smokers, in agreement with previous results for this cohort." The top rows of Table 3 show the death rate for former smokers who had not smoked for <1 year as of 1959 and those who survived for 2 years through 1961 had higher death rates than current smokers. The death rate for the former smokers who survived through 1964 was somewhat less than the death rate for current smokers. These data show that in the first few years after cessation, the death rates for former smokers are at least as high as the death rates for current smokers.
To examine the mortality risk among former smokers more closely, Table 4 shows the death rates by 2-year follow-up periods for former cigarette smokers who had not smoked for 0-6 years as of 1959, 1965, and 1972. The 1959 data are for former smokers who had quit 0-6 years according to the 1959 questionnaire; the 1965 data are for the 1959 smokers who did not smoke in 1965; the 1972 data are for the 1965 smokers who did not smoke in 1972. The death rates by 2-year follow-up periods for current cigarette smokers as of 1959, 1965, and 1972 are also shown. Note that for 2-year follow-up of males and 2-year and 4-year follow-up of females, the death rates for former smokers are slightly larger than those for current smokers.
These findings are consistent with a previously noted finding of the 1959 questionnaire data, namely, that around the time they answer a questionnaire a substan- tial number of recent quitters are in relatively poor health.23 The poor health effect is largest in the 1st year of cessation and diminishes with each additional year of cessation before the questionnaire and each additional year of follow-up after the questionnaire. The results in Tables 3 and 4 indicate that the benefits of cessation are very limited during the first 5 years of cessation, but are
substantial for those who survive many years after quit- ting.
The special value of this study is that it is possible to examine the overall impact of cessation on a large co- hort of persons who smoked cigarettes in 1959 and then largely quit smoking during the next 38 years. This assessment is not just of long-term healthy former smok- ers, but of a cohort of smokers as a whole as it underwent almost total cessation, which includes both short-term and long-term quitters, a portion of whom were not healthy.
Table 5 compares the death rates for an initial period, 1960-1969, when most of the 1959 smokers were still smoking, with the death rates for the entire follow-up period, 1960-1997, during which there was a substantial degree of cessation. All subjects and all 1959 current cigarette smokers are compared with 1959 never smokers for death from lung cancer and all causes. Both absolute and relative differences in death rates are presented.
When comparing the 1960-1969 and 1960-1997 pe- riods, the death rates generally decrease slightly for all causes and generally increase substantially for lung can- cer. The absolute difference in death rates between current smokers and never smokers remains relativelv constant for males but increases substantially for females. The ratio of death rates for current smokers to never smokers has remained at 1.97 for males and has in- creased for females from 1.37 to 1.57 for all causes. The proportional hazards ratio, based on all deaths and not just those with attained age 35-84, decreased from 1.95 to 1.74 for males and increased from 1.47 to 1.53 for females. The corresponding ratios for lung cancer re- mained roughly constant for males and increased three- fold for females. Detailed trends in death rates for all
506 Enstrom and Heath Epidemiology September 1999, Vol. 10 No. 5
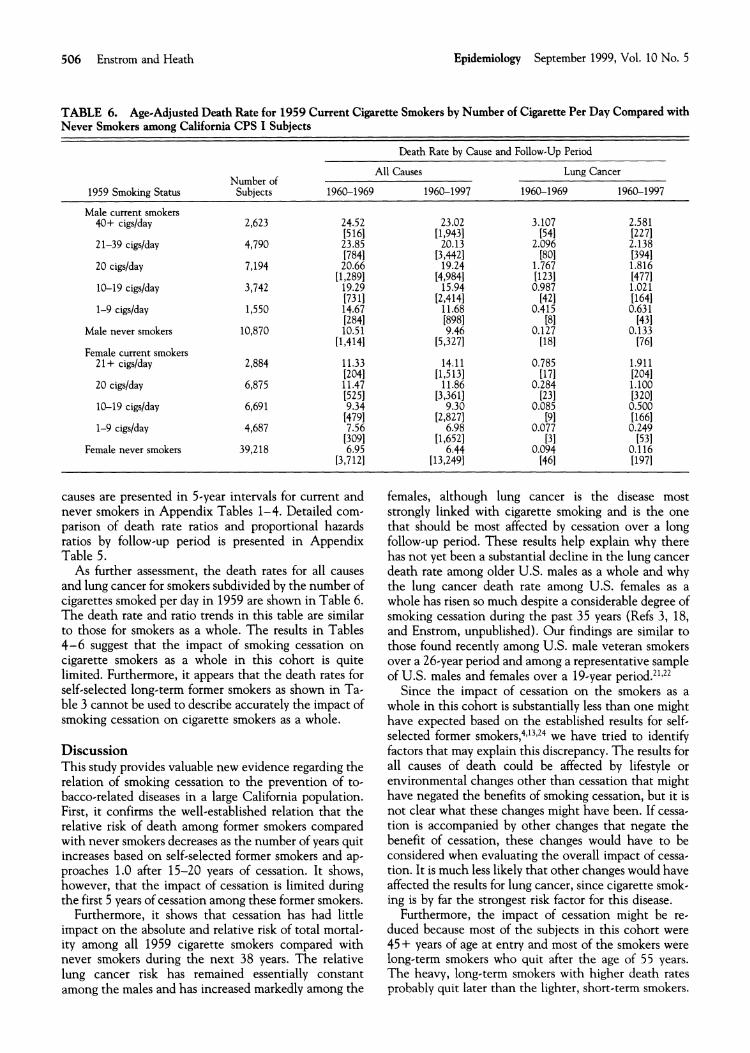
TABLE 6. Age-Adjusted Death Rate for 1959 Current Cigarette Smokers by Number of Cigarette Per Day Compared with Never Smokers among California CPS I Subjects
Death Rate by Cause and Follow-Up Period
All Causes Lung Cancer Number of
1959 Smoking Status Subjects 1960-1969 1960-1997 1960-1969 1960-1997
Male current smokers 40+ cigslday
Male never smokers 10,870 i0.5i [1,4141
Female current smokers 21+ cigslday 2,884 11.33
12041 20 cigs/day 6,875 i 1 . 4
[525110-19 cigslday 6,691 9.34
[47911-9 cigslday 4,687 7.56
[3091Female never smokers 39,218 6.95
[3,7121
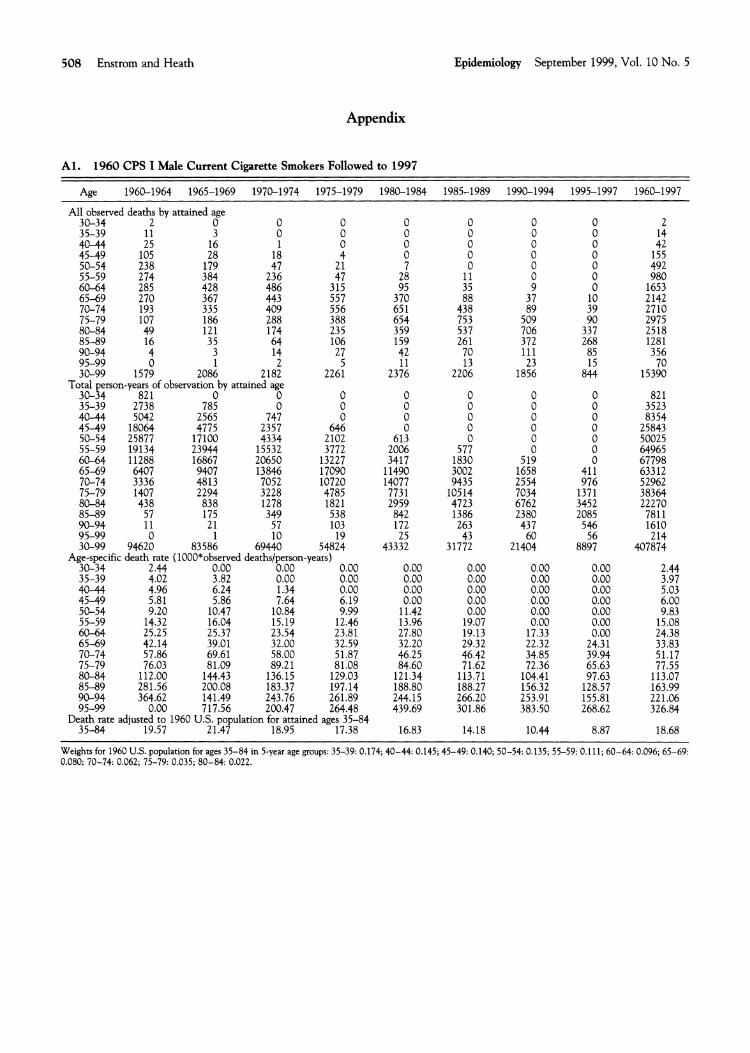
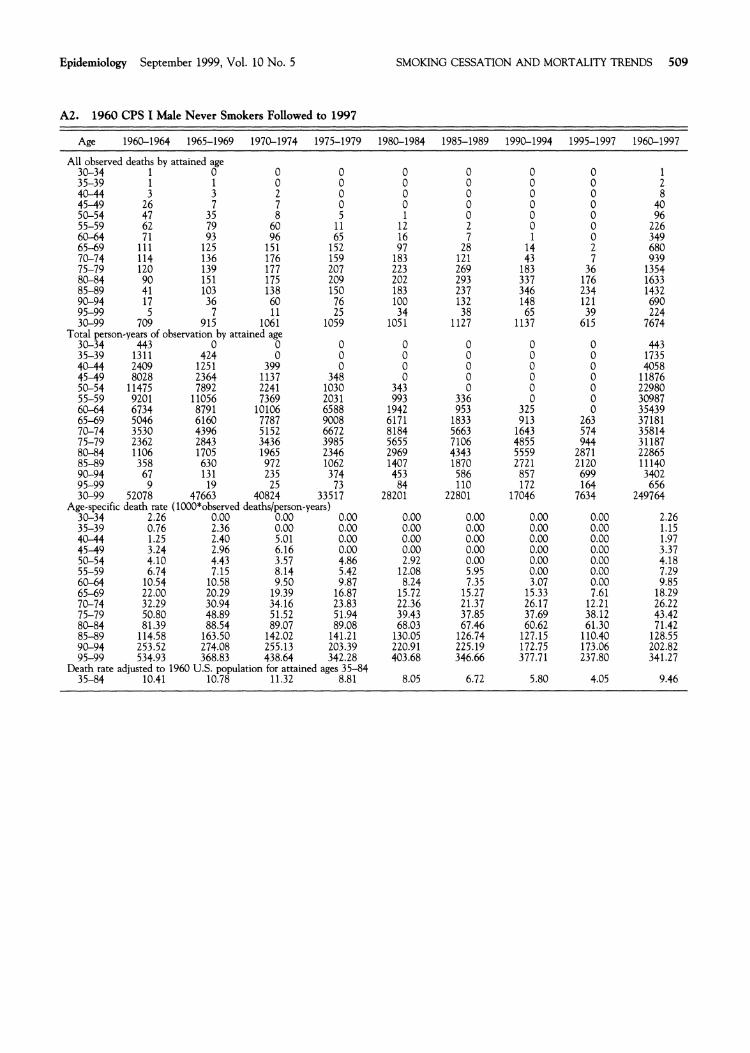
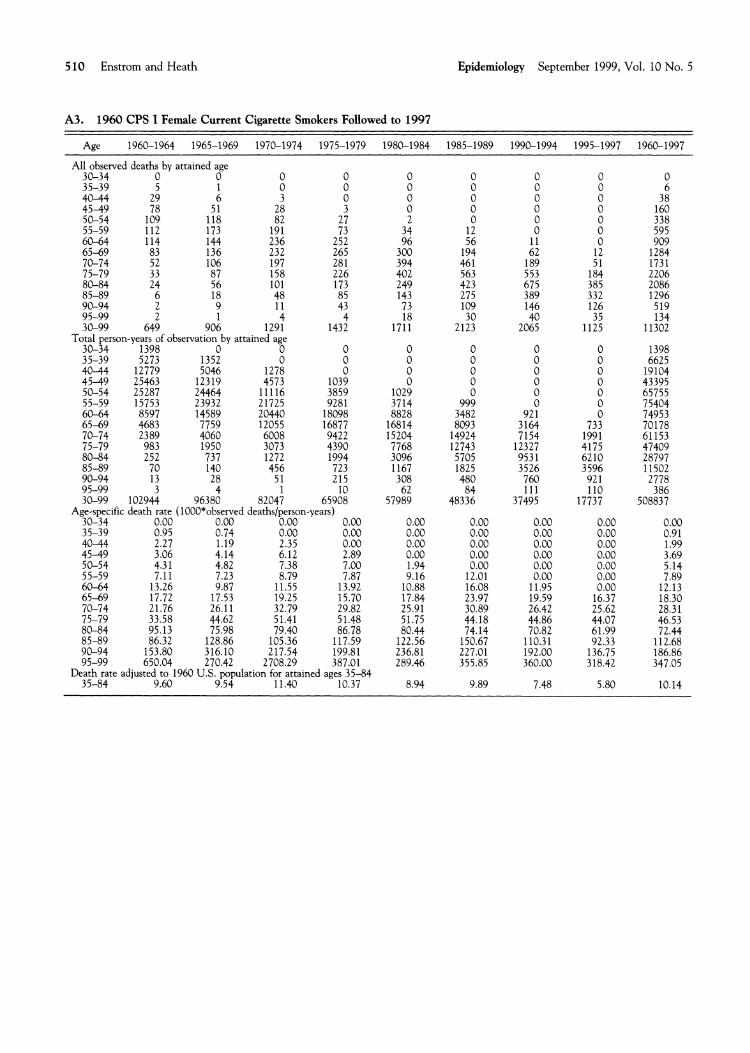
causes are presented in 5-year intervals for current and never smokers in Appendix Tables 1-4. Detailed com- parison of death rate ratios and proportional hazards ratios by follow-up period is presented in Appendix Table 5.
As further assessment, the death rates for all causes and lung cancer for smokers subdivided by the number of cigarettes smoked per day in 1959 are shown in Table 6. The death rate and ratio trends in this table are similar to those for smokers as a whole. The results in Tables 4-6 suggest that the impact of smoking cessation on cigarette smokers as a whole in this cohort is quite limited. Furthermore, it appears that the death rates for self-selected lone-term former smokers as shown in Ta-
u
ble 3 cannot be used to describe accuratelv the im~ac t of smoking cessation on cigarette smokers as a whole.
Discussion This study provides valuable new evidence regarding the relation of smoking cessation to the prevention of to- bacco-related diseases in a large California population. First, it confirms the well-established relation that the relative risk of death among former smokers compared with never smokers decreases as the number of years quit increases based on self-selected former smokers and ap- proaches 1.0 after 15-20 years of cessation. It shows, however, that the impact of cessation is limited during the first 5 years of cessation among these former smokers.
Furthermore, it shows that cessation has had little impact on the absolute and relative risk of total mortal. ity among all 1959 cigarette smokers compared with never smokers during the next 38 years. The relative lung cancer risk has remained essentially constant among the males and has increased markedly among the
females, although lung cancer is the disease most strongly linked with cigarette smoking and is the one that should be most affected by cessation over a long follow-up period. These results help explain why there has not yet been a substantial decline in the lung cancer death rate among older U.S. males as a whole and why the lung cancer death rate among U.S. females as a whole has risen so much despite a considerable degree of smoking cessation during the past 35 years (Refs 3, 18, and Enstrom, unpublished). Our findings are similar to those found recently among U.S. male veteran smokers over a 26-year period and among a representative sample of U.S. males and females over a 19-year p e r i ~ d . ~ ' , ~ ~
Since the impact of cessation on the smokers as a whole in this cohort is substantially less than one might have expected based on the established results for self- selected former smoker^,^,'^,^^ we have tried to identify factors that may explain this discrepancy. The results for all causes of death could be affected by lifestyle or environmental changes other than cessation that might have negated the benefits of smoking cessation, but it is not clear what these changes might have been. If cessa-tion is accompanied by other changes that negate the benefit of cessation, these changes would have to be considered when evaluating the overall impact of cessa- tion. It is much less likely that other changes would have affected the results for lung cancer, since cigarette smok- ing is by far the strongest risk factor for this disease.
Furthermore, the impact of cessation might be re-duced because most of the subjects in this cohort were 45+ years of age at entry and most of the smokers were long-term smokers who quit after the age of 55 years. The heavy, long-term smokers with higher death rates probably quit later than the lighter, short-term smokers.
Epidemiology September 1999, Vol. 10 No. 5
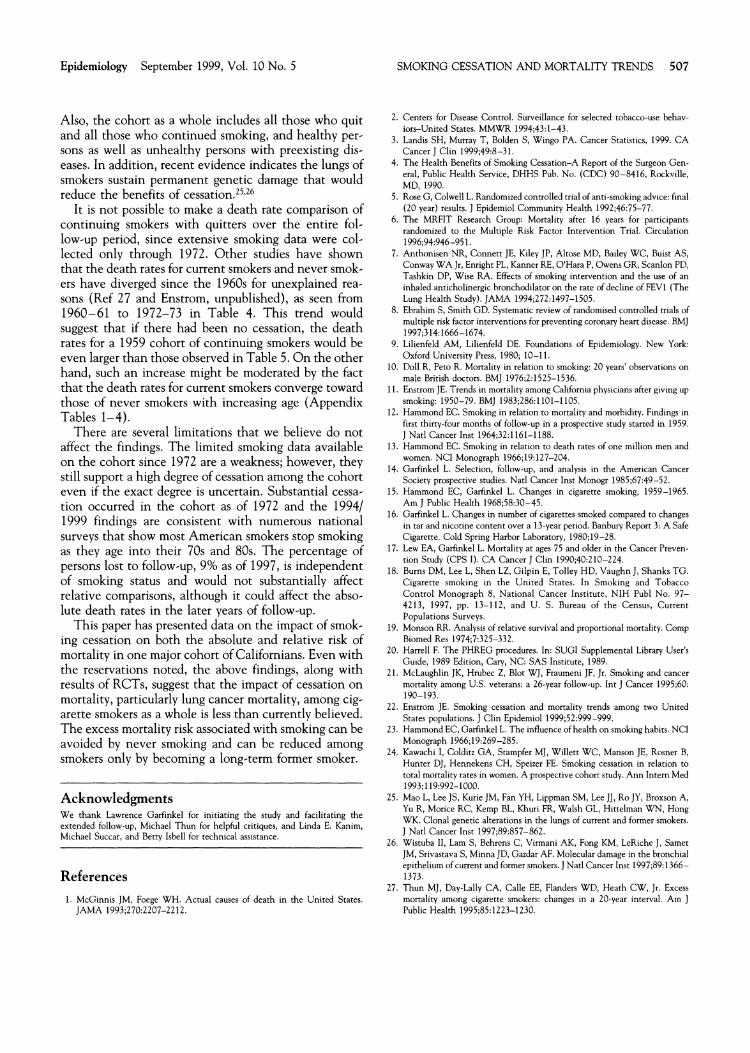
Also. the cohort as a whole includes all those who auit and all those who continued smoking, and healthy ier- sons as well as unhealthy persons with preexisting dis- eases. In addition, recent evidence indicates the lungs of smokers sustain permanent genetic damage that would reduce the benefits of c e ~ s a t i o n . ~ ~ ' ~ ~
It is not ~ossible to make a death rate com~arison of continuing smokers with auitters over the entire fol- -low-up period, since extensive smoking data were col- lected only through 1972. Other studies have shown that the death rates for current smokers and never smok- ers have diverged since the 1960s for unexplained rea- sons (Ref 27 and Enstrom, unpublished), as seen from 1960-61 to 1972-73 in Table 4. This trend would suggest that if there had been no cessation, the death rates for a 1959 cohort of continuing smokers would be even larger than those observed in Table 5. O n the other hand, such an increase mieht be moderated bv the fact that ;he death rates for current smokers converbe toward -those of never smokers with increasing age (Appendix Tables 1-4).
There are several limitations that we believe do not affect the findings. The limited smoking data available on the cohort since 1972 are a weakness; however, thev still support a high degree of cessation among the cohort even if the exact degree is uncertain. Substantial cessa- tion occurred in the cohort as of 1972 and the 19941 1999 findines are consistent with numerous national" surveys that show most American smokers stop smoking as they age into their 70s and 80s. The percentage of persons lost to follow-up, 9% as of 1997, is independent of smoking status and would not substantially affect relative comparisons, although it could affect the abso- lute death rates in the later vears of follow-UD.
This paper has presented data on the impact of smok- ing cessation on both the absolute and relative risk of mortality in one major cohort of Californians. Even with the reservations noted, the above findings, along with results of RCTs, suggest that the impact of cessation on mortality, particularly lung cancer mortality, among cig- arette smokers as a whole is less than currently believed. The excess mortality risk associated with smoking can be avoided by never smoking and can be reduced among smokers only by becoming a long-term former smoker.
Acknowledgments We thank Lawrence Garfinkel for initiating the study and facilitating the extended follow-up, Mlchael Thun for helpful critiques, and Linda E. Kanim, Mlchael Succar, and Betty lsbell for technical asststance.
References
1. McGlnnis JM, Foege WH. Actual causes of death in the Un~ted States. JAMA 1993;270:2207-2212.
SMOKING CESSATION AND MORTALITY TRENDS 507
2. Centers for Dlsease Control. Surveillance for selected tobacco-use behav- iors-United States. MMWR 1994;43:1-43.
3. Landis SH, Murray T, Bolden S, Wingo PA. Cancer Statistics, 1999. C A Cancer J Clin 1999;49:8-31.
4. The Health Benefits of Smoking Cessation-A Report of the Surgeon Gen- eral, Public Health Service, DHHS Pub. No. (CDC) 90-8416, Rockvllle, MD, 1990.
5. Rose G, Colwell L. Randomlied controlled trial of anti-smoklng advlce: final (20 year) results. ] Epidemiol Community Health 1992;46:75-77.
6. The MRFIT Research Group: Mortality after 16 years for partlapants randomized to the Multlple Risk Factor Intervention Trial. Circulation 1996;94:946-951.
7. Anthonisen NR, Connett JE, Kiley ]P, Altose MD, Ba~ley WC, Bulst AS, Conway WAJr , Enright PL, Kanner RE, O'Hara P, Owens GR, Scanlon PD, Tashk~n DP, Wise RA. Effects of smoking lnterventlon and the use of an inhaled anticholinergic bronchodilator on the rate of decllne of FEVl (The Lung Health Study). JAMA 1994;272:1497-1505.
8. Ebrahim S, Smith GD. Systematic review of random~sed controlled trlals of multiple risk factor interventions for preventing coronary heart drsease. BMJ 1997;314:1666-1674.
9. Lilienfeld AM, Lll~enfeld DE. Foundations of Epldem~ology. New York: Oxford University Press, 1980; 10-1 1.
10. Doll R, Peto R. Mortality In relation to smok~ng: 20 years' observat~ons on male British doctors. BM] 1976;2:1525-1536.
11. Enstrom JE. Trends in mortality among Califomla physicians after glvlng up smoklng: 1950-79. BMJ 1983;286:1101-1105.
12. Hammond EC. Smoklng in relation to mortal~ry and morbidity. Findlngs in f~rst thirty-four months of follow-up in a prospective study started in 1959. J Natl Cancer lnst 1964;32:1161-1188.
13. Hammond EC. Smoking in relatlon to death rates of one mllllon men and women. NCI Monograph 1966;19:127-204.
14. Gadinkel L. SelectLon, follow-up, and analysis In the American Cancer Society prospective studies. Natl Cancer Inst Monogr 1985;67:49-52.
15. Hammond EC, Garflnkel L. Changes in cigarette smoklng, 1959-1965. Am J Publlc Health 1968;58:30-45.
16. Garfinkel L. Changes In number of cigarettes smoked compared to changes in tar and nlcotlne content over a 13-year per~od. Banbury Report 3: A Safe C~garette. Cold Spr~ng Harbor Laboratory, 1980;19-28.
17. Lew EA, Garfinkel L. Mortality at ages 75 and older In the Cancer Preven- tion Study (CPS I). C A Cancer J Clln 1990;40:210-224.
18. Burns DM, Lee L, Shen LZ, G ~ l p i n E, Tolley HD, Vaughn J , Shanks TG. C~garette smok~ng In the U n ~ t e d States. In Smoking and Tobacco Control Monograph 8, National Cancer Instltute, NIH Publ No. 97- 4213, 1997, pp. 13-112, and U. S. Bureau of the Census, Current Populations Surveys.
19. Monson RR. Analysis of relative survival and proport~onal mortallty. Comp Biomed Res 1974;7:325-332.
20. Harrell F. The PHREG procedures. In: SUGI Supplemental Library User's Gulde, 1989 Edition, Caty, NC: SAS Instltute, 1989.
21. McLaughlin JK, H ~ b e c Z, Blot WJ, Fraumenl JF, Jr. Smoking and cancer mortallty among U.S. veterans: a 26-year follow-up. Int J Cancer 1995;60: 190-193.
22. Enstrom JE. Smoking cessation and mortallty trends among two United States populations. ] Clin Epidemiol 1999;52:999-999.
23. Hammond EC, Garfinkel L. The influence of health on smok~ng hah~ts. NCI Monograph 1966;19:269-285.
24. Kawachl 1, Colditz GA, Stampfer MJ, Wlllett WC, Manson JE, Rosner B, Hunter DJ, Hennekens CH, Spelzer FE. Smoking cessation In relation to total mortality rates in women. A prospective cohort study. Ann Intern Med 1993;119:992-1000.
25. Mao L, Lee JS, Kurie JM, Fan YH, Lippman SM, Lee JJ, Ro JY, Broxson A, Yu R, Morlce RC, Kemp BL, Khuri FR, Walsh GL, Hittelman WN, Hong WK. Clonal genetic alterations in the lungs of current and former smokers. J Natl Cancer Inst 1997;89:857-862.
26. W~sruha 11, Lam S, Behrens C, Virmani AK, Fong KM, LeR~che J , Samet IM. Srlvastava S. Mlnna ID, Gazdar AF. Molecular damaee In the bronch~al epithelium of current and former smokers. J Natl Cancer Inst 1997;89:1366- 1373.
27. Thun MI, Day-Lally CA, Calle EE, Flanders WD, Heath CW, Jr. Excess mortality among cigarette smokers: changes in a 20-year ~nterval. Am J Public Health 1995;85:1223-1230.
508 Enstrom and Heath Epidemiology September 1999, Vol. 10 No. 5
Appendix
Al. 1960 CPS I Male Current Cigarette Smokers Followed to 1997
Age 1960-1964 1965-1969 1970-1974 1975-1979
All obsewed deaths by attained age 30-34 2 0 0 0 35-39 11 3 0 0
Total person-years of observation by attained age 30-34 821 0 0 0 35-39 2738 785 0 0 40-44 5042 2565 747 0 45-49 18064 4775 2357 646 50-54 25877 17100 4334 2102 55-59 19134 23944 15532 3772 60-64 11288 16867 20650 13227 65-69 6407 9407 13846 17090 70-74 3336 4813 7052 10720 75-79 1407 2294 3228 4785 80-84 43 8 838 1278 1821 85-89 5 7 175 349 538 90-94 11 2 1 5 7 103 95-99 0 1 10 19 30-99 94620 83586 69440 54824
Age-specific death rate (1000*obsewed deathslperson-years) 30-34 2.44 0.00 0.00 0.00
Death rate adjusted to 1960 U.S. population for attained ages 35-84 35-84 19.57 21.47 18.95 17.38
Welghts for 1960 U.S. population for ages 35-84 in 5-year age groups: 35-39: 0.174; 40-44: 0.145; 45-49: 0.140; 50-54: 0.135; 55-59: 0.111; 60-64: 0.096; 65-69: 0.080; 70-74: 0.062; 75-79: 0.035; 80-84: 0.022.
Epidemiology September 1999, Vol. 10 No. 5 SMOKING CESSATION AND MORTALITY TRENDS 509
A2. 1960 CPS I Male Never Smokers Followed to 1997
Age 1960-1964 1965-1969 1970-1974 1975-1979 1980-1984 1985-1989 1990-1994 1995-1997 1960-1997
All observed deaths by attained age 3 0-3 4 1 0 0 0 0 0 0 0 1
30-99 709 915 1061 1059 1051 1127 1137 615 7674 Total person-years of observation by attained age
30-34 443 0 0 0 0 0 0 0 443 35-39 1311 424 0 0 0 0 0 0 1735 40-44 2409 1251 399 0 0 0 0 0 4058
90-94 67 131 235 374 453 586 857 95-99 9 19 25 73 110 172 30-99 52078 47663 40824 33517 84 22801 1704628201
Aee-s~ec~ficdeath rate (1000Lobserved deathsl~erson-vears)
75-79 50.80 48.89 51.52 5 1.94 39.43 37.85 37.69 38.12 43.42 81.39 88.54 89.07 89.08 68.03 67.46 60.62 61.30 7 1.42
80-84 114.58 163.50 142.02 141.21 130.05 126.74 127.15 110.40 128.5585-89 90-94 253.52 274.08 255.13 203.39 220.91 225.19 172.75 173.06 202.82 95-99 534.93 368.83 438.64 342.28 403.68 346.66 377.71 237.80 341.27
Death rate adjusted to 1960 U.S. population for attained ages 35-84 35-84 10.41 10.78 11.32 8.81 8.05 6.72 5.80 4.05 9.46
510 Enstrom and Heath Epidemiology September 1999, Vol. 10 No. 5
A3. 1960 CPS I Female Current Cigarette Smokers Followed to 1997
Age 1960-1964 1965-1969 1970-1974 1975-1979 1980-1984 1985-1989 1990-1994 1995-1997 1960-1997
All observed deaths by attained age 30-34 0 0 35-39 5 1
0 0
0 0
0 0
0 0
0 0
0 0
0 6
80-84 24 56 101 173 249 423 675 385 2086 85-89 6 18 48 85 143 275 389 332 1296 90-94 2 9 11 43 73 109 146 126 519 95-99 2 1 4 4 18 30 40 35 134 30-99 649 906 1291 1432 1711 2123 2065 1125 11302
Total person-years of observation by attained age 30-34 1398 0 0 0 0 0 0 0 1398 35-39 5273 1352 0 0 0 0 0 0 6625 40-44 12779 5046 1278 0 0 0 0 0 19104 45-49 25463 12319 4573 1039 0 0 0 0 43395 50-54 25287 24464 11116 3859 1029 0 0 0 65755 55-59 15753 23932 21725 9281 3714 999 0 0 75404 60-64 8597 14589 20440 18098 8828 3482 921 0 74953 65-59 4683 7759 12055 16877 16814 8093 3164 733 70178 70-74 2389 4060 6008 9422 15204 14924 7154 1991 61153 75-79 983 1950 3073 4390 7768 12743 12327 4175 47409 80-84 252 737 1272 1994 3096 5705 953 1 6210 28797 85-89 70 140 456 7 23 1167 1825 3526 3596 11502 90-94 13 28 5 1 215 308 480 760 92 1 2778 95-99 3 4 1 10 62 11 1 110 386 30-99 102944 96380 82047 65908 57989 8448336 37495 17737 508837
Age-specific death rate (1000*observed deathslperson-years) 30-34 0.00 0.00 0.00 0.00 0.00 0.00 0.00 0.00 0.00 35-39 0.95 0.74 0.00 0.00 0.00 0.00 0.00 0.00 0.91 4 0 4 4 2.27 1.19 2.35 0.00 0.00 0.00 0.00 0.00 1.99 4 5 4 9 3.06 4.14 6.12 2.89 0.00 0.00 0.00 0.00 3.69 50-54 4.3 1 4.82 7.38 7.00 1.94 0.00 0.00 0.00 5.14 55-59 7.11 7.23 8.79 7.87 9.16 12.01 0.00 0.00 7.89 60-64 13.26 9.87 11.55 13.92 10.88 16.08 11.95 0.00 12.13 65-69 17.72 17.53 19.25 15.70 17.84 23.97 19.59 16.37 18.30 70-74 21.76 26.1 1 32.79 29.82 25.91 30.89 26.42 25.62 28.31 75-79 33.58 44.62 51.41 51.48 51.75 44.18 44.86 44.07 46.53 80-84 95.13 75.98 79.40 86.78 80.44 74.14 70.82 61.99 72.44 85-89 86.32 128.86 105.36 117.59 122.56 150.67 110.31 92.33 112.68
153.80 316.10 217.54 199.81 236.81 227.01 192.00 136.75 186.86 95-9990-94 650.04 270.42 2708.29 387.01 289.46 355.85 360.00 318.42 347.05
Death rate adjusted to 1960 U.S. population for attained ages 35-84 35-84 9.60 9.54 11.40 10.37 8.94 9.89 7.48 5.80 10.14
Epidemiology September 1999, Vol. 10 No. 5 SMOKING CESSATION AND MORTALITY TRENDS 5 11
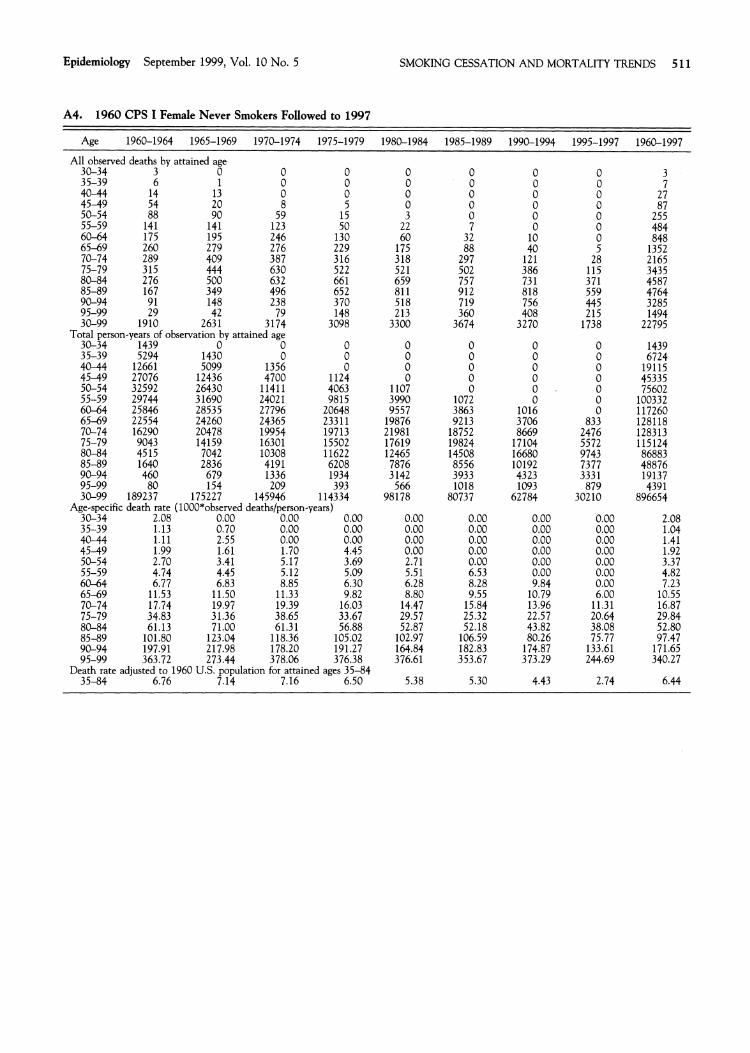
A4. 1960 CPS IFemale Never Smokers Followed to 1997
Age 1960-1964 1965-1969 1970-1974 1975-1979
All observed deaths by attained age 30-34 3 0 0 0 35-39 6 1 0 0
95-99 29 42 79 148 30-99 1910 263 1 3174 3098
Total person-years of observation by attained age 30-34 1439 0 0 0 35-39 5294 1430 0 0
4515 1640 460
80 189237 death rate ( I
2.08 1.13 1.11
Death rate adiusted to 1960 U.S.~ o ~ u l a t i o nfor attained aees 35-84
5 12 Enstrom and Heath Epidemiology September 1999, Vol. 10 No. 5
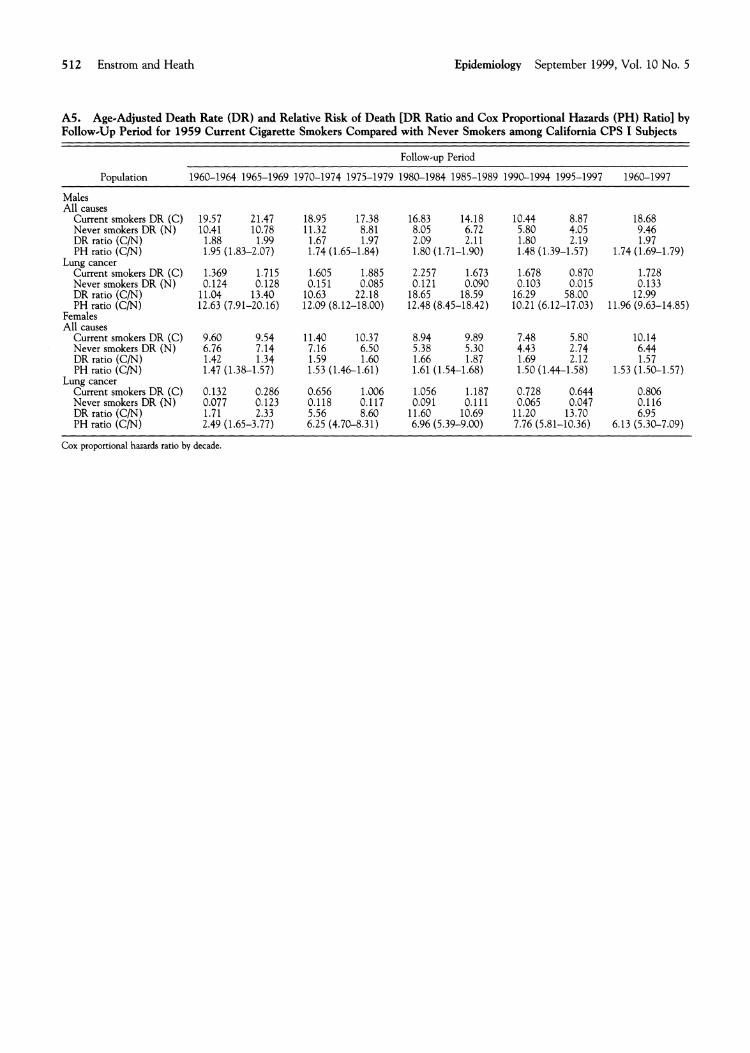
A5. AgeSAdjusted Death Rate (DR) and Relative Risk of Death [DR Ratio and Cox Proportional Hazards (PH) Ratio] by Follow-up Period for 1959 Current Cigarette Smokers Compared with Never Smokers among California CPS I Subjects
Follow-up Period
Population 1960-1964 1965-1969 1970-1974 1975-1979 1980-1984 1985-1989 1990-1994 1995-1997 1960-1997
Males All causes- - - - -~
Current smokers DR (C) 19.57 21.47 18.95 17.38 16.83 14.18 10.44 8.87 18.68 Never smokers DR (N) 10.41 10.78 11.32 8.81 8.05 6.72 5.80 4.05 9.46 DR ratio ( C N ) 1.88 1.99 1.67 1.97 2.09 2.11 1.80 2.19 1.97 PH ratlo (C/N) 1.95 (1.83-2.07) 1.74 (1.65-1.84) 1.80 (1.71-1.90) 1.48 (1.39-1.57) 1.74 (1.69-1.79)
Lung cancer Current smokers DR (C) 1.369 1.715 1.605 1.885 2.257 1.673 1.678 0.870 1.728 Never smokers DR (N) 0.124 0.128 0.151 0.085 0.121 0.090 0.103 0.015 0.133 DR ratio (CM) 11.04 13.40 10.63 22.18 18.65 18.59 16.29 58.00 12.99 PH ratio ( C N ) 12.63 (7.91-20.16) 12.09 (8.12-18.00) 12.48 (8.45-18.42) 10.21 (6.12-1 7.03) 11.96 (9.63-14.85)
Females All causes
Current smokers DR (C) 9.60 9.54 11.40 10.37 8.94 9.89 7.48 5.80 10.14 Never smokers DR (N) 6.76 7.14 7.16 6.50 5.38 5.30 4.43 2.74 6.44 DR ratio (C/N) 1.42 1.34 1.59 1.60 1.66 1.87 1.69 2.12 1.57 PH ratio (C/N) 1.47 (1.38-1.57) 1.53 (1.46-1.61) 1.61 (1.54-1.68) 1.50 (1.44-1.58) 1.53 (1.50-1.57)
Lung cancer Current smokers DR (C) 0.132 0.286 0.656 1.006 1.056 1.187 0.728 0.644 0.806 Never smokers DR (N) ' 0.077 0.123 0.1 18 0.1 17 0.091 0.1 11 0.065 0.047 0.116 DR ratio (C/N) 1.71 2.33 5.56 8.60 11.60 10.69 11.20 13.70 6.95 PH ratio (C/N) 2.49 (1.65-3.77) 6.25 (4.70-8.31) 6.96 (5.39-9.00) 7.76 (5.81-10.36) 6.13 (5.30-7.09)
Cox proportional hazards ratio by decade.