Embed Size (px)
Citation preview

Smoking Status During and After Pregnancy:
Associations with Maternal Weight Retention and Concerns about Body Image
Roxanna Belshaw
Submitted in Fulfillment of the Requirements for the
UC Berkeley Department of Statistics Honor’s Thesis
January 2003

Acknowledgments I would like to thank both of my advisors, Professor Deborah Nolan with the UC Berkeley Department of Statistics and Professor Barbara Abrams with the UC Berkeley School of Public Health. I am very grateful for the time that both of them spent working with me on this project. I would also like to thank the UC Berkeley Department of Statistics for their generosity with financial assistance for the project.
1

Contents
Précis 3 Abstract 4 Introduction 5 Logistic Regression 7 Introduction 7 Fitting the Logistic Regression Model 9 Interpretation of the Coefficients 10 Multinomial Logistic Regression 12 Methods 14 Data 14 Questionnaires and Measures 15 Predictor Variables 16 Analysis 17 Results 17 Discussion 19 References 23 Table 1 Summary of Variables Used in All Statistical Models 25 Table 2 Comparing Maternal Characteristics between the Total Eligible Sample and the Sample with Complete Data used for the Logistic Postpartum Smoking Model 27 Table 3 Comparing Outcome Variables between the Total Eligible Sample and the Sample with Complete Data used for the Logistic Postpartum Smoking Model 28 Table 4 Comparing Maternal Characteristics between the Total Eligible Sample and the Sample with Complete Data used for the m-Logit Smoking Model 30 Table 5 Comparing Outcome Variables between the Total Eligible Sample and the Sample with Complete Data used for the m-Logit Smoking Model 31 Table 6 Multiple logistic regression with postpartum smoking as the outcome 33 Table 7 Significant associations using m-Logit model, with trichotomized smoking categories as the outcome 34
2

Précis Postpartum smoking is associated with maternal weight retention, history of weight cycling, and some body image concerns. Cessation of smoking during pregnancy and postpartum is also associated with maternal weight retention, though this does not appear to be influenced by body image or a history of weight cycling.
3
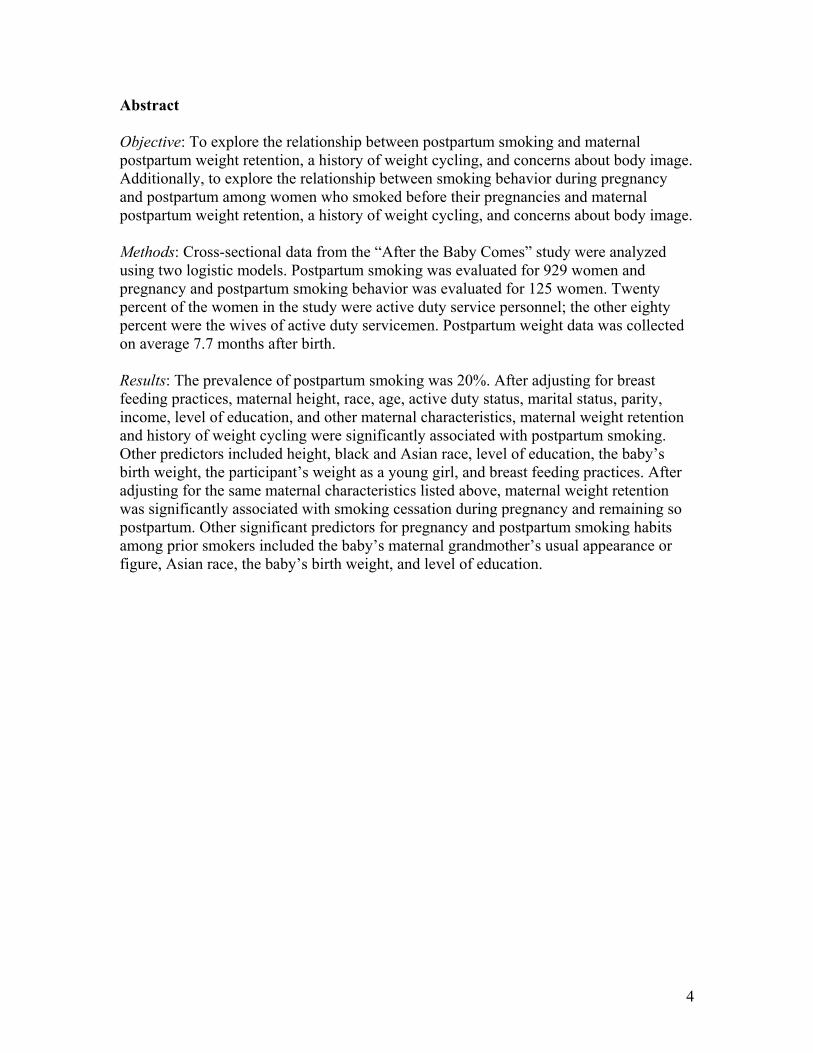
Abstract Objective: To explore the relationship between postpartum smoking and maternal postpartum weight retention, a history of weight cycling, and concerns about body image. Additionally, to explore the relationship between smoking behavior during pregnancy and postpartum among women who smoked before their pregnancies and maternal postpartum weight retention, a history of weight cycling, and concerns about body image. Methods: Cross-sectional data from the “After the Baby Comes” study were analyzed using two logistic models. Postpartum smoking was evaluated for 929 women and pregnancy and postpartum smoking behavior was evaluated for 125 women. Twenty percent of the women in the study were active duty service personnel; the other eighty percent were the wives of active duty servicemen. Postpartum weight data was collected on average 7.7 months after birth. Results: The prevalence of postpartum smoking was 20%. After adjusting for breast feeding practices, maternal height, race, age, active duty status, marital status, parity, income, level of education, and other maternal characteristics, maternal weight retention and history of weight cycling were significantly associated with postpartum smoking. Other predictors included height, black and Asian race, level of education, the baby’s birth weight, the participant’s weight as a young girl, and breast feeding practices. After adjusting for the same maternal characteristics listed above, maternal weight retention was significantly associated with smoking cessation during pregnancy and remaining so postpartum. Other significant predictors for pregnancy and postpartum smoking habits among prior smokers included the baby’s maternal grandmother’s usual appearance or figure, Asian race, the baby’s birth weight, and level of education.
4

Introduction
Maternal smoking during pregnancy is a significant issue in the field of public
health. Maternal smoking, both during and after pregnancy, has been implicated in many
childhood diseases. The effects of smoking on the baby are magnified if the mother
continues to smoke around the child during the early postpartum period.1 Many women
cease smoking during pregnancy, but at one year postpartum, relapse rates are estimated
to be between 50 and 80 percent.2 This represents a significant number of children who
are being exposed to a hazardous toxin early in their life. Many women cease or reduce
their amount of smoking during pregnancy, but the majority of these women will
relapse.3,4,5 Therefore, it is important to further our knowledge of risk factors in order to
better predict which women are at an elevated risk for postpartum smoking and relapse.
Numerous studies have identified predictors of smoking during pregnancy, but
considerably less is known about smoking during the postpartum period. Studies of
postpartum smoking have produced inconsistent findings. However, living with a partner
who smokes has been consistently shown to be a predictor of postpartum relapse.6,7,8,9,10
Additional studies show that women who smoke postpartum initiate breast feeding at
lower rates than non-smokers.3,11,12,13,14
New motherhood is a time of great personal change. Not all of these changes are
positive, with new mothers often faced with depression, stress, poor social support,
weight changes, and struggles with body image. Any of these changes could potentially
lead to postpartum smoking, though they have not been adequately studied.
The relationship between weight change and smoking is particularly complicated.
Many women smoke to maintain or lose weight.15,16,17 Therefore, a woman who smokes
5

to maintain her weight is likely to be unsatisfied with her pregnancy weight gain and
postpartum weight retention. This could potentially lead to postpartum smoking.
Additionally, women who stop smoking during pregnancy gain more weight than women
who smoke throughout their pregnancies and non-smokers.18 Pregnancy weight gain is
highly correlated with postpartum weight retention.19 Therefore, women who cease
smoking during pregnancy are at high risk for retaining weight postpartum if they remain
nonsmokers.20 This may lead to an eventual smoking relapse.
Some studies have found relationships between weight concern, or body image,
and smoking relapse.21,22 Weight cycling, defined as a repeated loss and regain of body
weight, is one measure of weight concern. Additional measures of weight or body image
concern include self-reported worry about weight, shape, and appearance and self-
reported weight perception.
This study explores the relationship between postpartum smoking during the first
year postpartum and various maternal characteristics including postpartum weight
retention, history of weight cycling, prepregnancy weight perception, and various other
measures of body image concern. Specifically, this study attempts to identify if (1)
postpartum weight retention, (2) a history of weight cycling, or (3) body image concerns
are predictive of postpartum smoking. Additionally, this study attempts to determine if
these same risk factors can predict smoking cessation during pregnancy or postpartum
relapse among women who reported smoking at the beginning of their pregnancy.
6
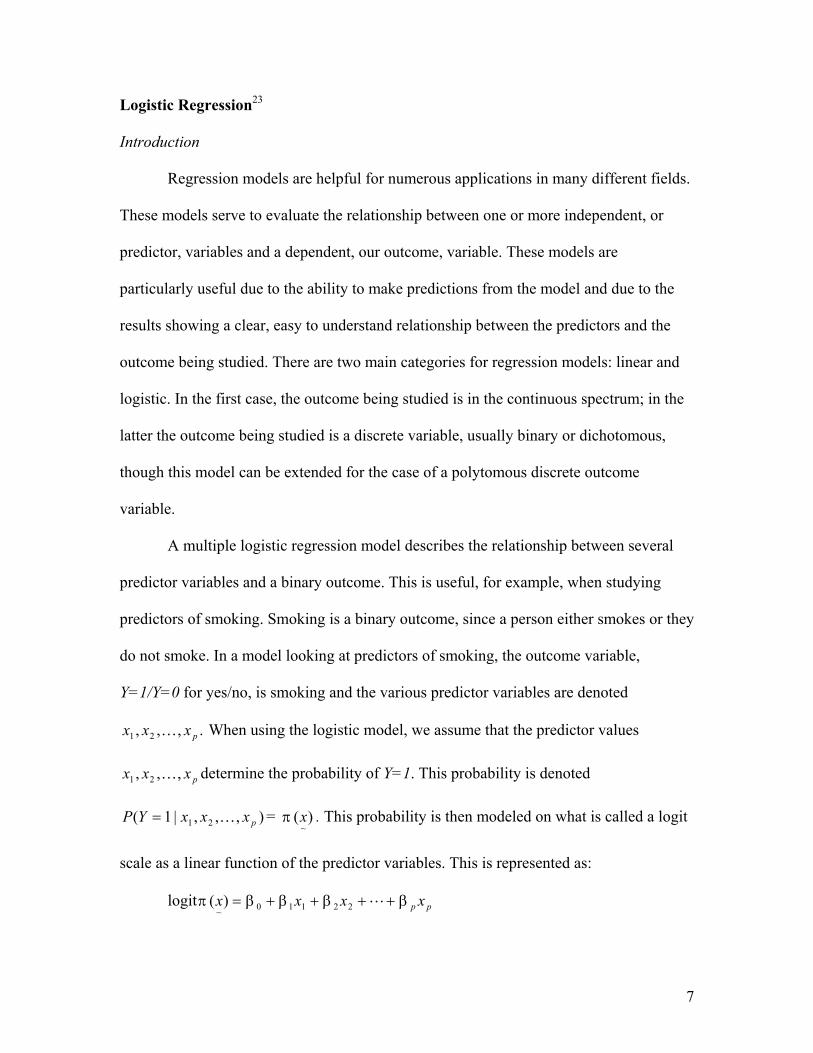
Logistic Regression23
Introduction
Regression models are helpful for numerous applications in many different fields.
These models serve to evaluate the relationship between one or more independent, or
predictor, variables and a dependent, our outcome, variable. These models are
particularly useful due to the ability to make predictions from the model and due to the
results showing a clear, easy to understand relationship between the predictors and the
outcome being studied. There are two main categories for regression models: linear and
logistic. In the first case, the outcome being studied is in the continuous spectrum; in the
latter the outcome being studied is a discrete variable, usually binary or dichotomous,
though this model can be extended for the case of a polytomous discrete outcome
variable.
A multiple logistic regression model describes the relationship between several
predictor variables and a binary outcome. This is useful, for example, when studying
predictors of smoking. Smoking is a binary outcome, since a person either smokes or they
do not smoke. In a model looking at predictors of smoking, the outcome variable,
Y=1/Y=0 for yes/no, is smoking and the various predictor variables are denoted
When using the logistic model, we assume that the predictor values
determine the probability of Y=1. This probability is denoted
= π . This probability is then modeled on what is called a logit
scale as a linear function of the predictor variables. This is represented as:
.,,, 21 pxxx K
pxxx ,,, 21 K
,|1( 1 xxYP = ),,2 pxK )(~x
logitπ + pp xxxx ββββ +++= L22110~)(
7

The logit scale is defined as logit = ln)(~x
)(1
)(
~
~
x
x
−
π. Therefore, solving for π gives: )(
~x
=)(~xπ
pp
pp
xx
xx
ee
βββ
βββ
+++
+++
+ K
K
110
110
1.
The coefficients are the unknown regression coefficients, which are being
estimated from the data. The logit transformation above is beneficial in many ways. It is
similar to a linear regression model since logit ( has linear parameters and may be
continuous. This transformation is bounded between 0 and 1 and represented by the
logistic curve as shown in Figure 1 below.
pβββ K,, 10
)~x
Figure 1: A graphical representation of the logit transformation24.
In the linear regression model, the outcome variable is expressed as the expected
value plus error, represented as , where ε is the error. In the linear
regression model, this error is assumed normally distributed with mean 0 and some
constant variance. However, this is not the case for the logistic regression model. Here,
ε+= )|( xYEy
. ε+== ),,,|1( 21 pxxxYPy K
8

Since y is a binary variable, y may only take on the values 0 and 1. If y = 1, then
=1- with probability . If y = 0, then
= - with probability 1- . Therefore, ε has
a binomial distribution with mean 0 and variance equal to:
ε
ε
),,,|1( 21 pxxxYP K=
),,,|1( 21 pxxxYP K=
),,,|1( 21 pxxxYP K=
,,,|1( 21 pxxxYP K= )
[1- ]. ),,,|1( 21 pxxxYP K= ),,,|1( 21 pxxxYP K=
Fitting the Logistic Regression Model
Fitting the logistic regression model involves using the method of maximum
likelihood. This method involves maximizing the likelihood function, which is a function
that expresses the probability of the observed data as a function of the predictor variables.
Using smoking as the outcome of interest, a smoker equals an outcome of 1 and a
nonsmoker equals an outcome of 0. As mentioned previously, the probability that Y=1
given equalsπ , and . Thus, when a
person is a smoker, their individual contribution to the likelihood function is π .
When a person is a nonsmoker, their individual contribution to the likelihood function is
1-π . Thus, an expression for any individual’s contribution to the likelihood function
is given by:
pxxx ,,, 21 K
)~i
)(~x )(1),,|0(
~21 xxxxYP p π−== K
)(~ix
(x
ii yi
yiix xxxf )](1[)()(
~~~)(
~πππ −=
The likelihood function is the product of these individual contributions and is expressed
below:
∏=
=n
iix xfl
1 ~)(
~)()(
~πβ
9

Maximizing the likelihood function gives several resulting likelihood equations:
and ∑=
=−n
iii xy
1 ~0)]([ π ∑
=
=−n
iiiij xyx
1 ~0)]([ π
for j = 1 . p,,2, K
The likelihood equations can be solved using software found in most statistical software
packages.
Interpretation of the Coefficients
The coefficients of the logistic regression model can be expressed in one of two
ways. They can be expressed as the coefficients given from the solution of the likelihood
equations or they can be expressed as odds ratios (OR).
The estimated coefficients from the solutions to the likelihood equations are
measured on the logit scale. In general, if then as increases, π also
increases. If , then the predictor variable has no effect on the outcome. If
then as increases, π decreases. However, the actually magnitude of the relative
change can not be measured directly from the coefficients since they are measured on the
logit scale. To see the magnitude of these relative changes, the coefficient needs to be
converted to the ordinary scale. For example, suppose the logistic regression model
looking only at postpartum smoking and education level is given below:
0>jβ jx )(~x
0=jβ 0<jβ
jx )(~x
logit educationeducationYP *50.013.)|1( −==
At the high school education level, the predicted probability of smoking given only a
high school education (coded as education=2) is -.87 on the logit scale. To get a better
10

understanding of this relationship, we need to convert to the ordinary scale as shown
below:
30.1
)2|1() 87.0
87.0
=+
=== −
−
eeeducationYPx( =π
From this we see that the probability of smoking postpartum given only a high school
education is approximately 30%. Of course this is a highly simplified example with no
adjustments being made for other variables.
The logistic regression model can also be looked at in terms of odds ratios. This
method has some practical applications for studies since it is an easy way to understand
the relationship between the predictors and the outcome being studied. Suppose the same
model described above estimates the odds ratio for smoking given educational
background at 0.61. This means that postpartum smokers are at 0.61 times increased odds
or, equivalently and more understandably, 1/0.61=1.64 times decreased odds of having
more years of education than postpartum nonsmokers without considering any other
variables.
Now suppose we are interested in comparing the odds of postpartum smoking
given difference ethnic groups without considering any other variables in the model.
Since in this case the predictor variable is polytomous (white, black, Asian, Hispanic, and
other), we cannot just include the race variable in the model. In this case, race needs to be
broken into dummy variables. However, these dummy variables are not linearly
independent in the logistic regression model since it also includes a constant. Therefore,
one of the race dummy variables needs to be excluded. After excluding one of these
dummy variables, all of the remaining odds ratios need to be interpreted relative to the
excluded variable. The dropped race will serve as the reference group. For example,
11

supposed we exclude the white race variable from the model and the remaining odds
ratios are 0.39 for black, 0.26 for Asian, and .59 for Hispanic. Interpretation of these odds
ratios is as follows. Postpartum smokers are at 1/0.39 = 2.56 times decreased odds of
being black than white, 3.85 times decreased odds of being Asian than white, and 1.69
times decreased odds of being Hispanic than white compared to postpartum nonsmokers.
Multinomial Logistic Regression Model
Multinomial logistic regression differs from standard logistic regression since the
outcome variable is non-binary and discrete. In this case, there are three or more
categories for which predictions need to be made. However, the methods for fitting the
model and interpreting the results are very similar to logistic regression with a binary
outcome. For example, an outcome variable with three categories will produce two
binary logistic regression equations. One category is designated as a reference category,
and the additional two categories are compared to the reference category. In other words,
the multinomial logistic regression model will compute two different binary logistic
regression equations using each of the two additional categories as the outcome of
interest for the separate equation compared to the designated reference category. In fact,
for any categorical outcome variable with k categories, the multinomial logistic
regression model will produce k-1 binary logistic regression equations.
Again, let us consider using race as a predictor variable. In this case, however, the
outcome variable will have categories: smoking during pregnancy, quitting smoking
during pregnancy and relapsing postpartum, and quitting smoking during pregnancy and
remaining a nonsmoker postpartum. Designating the pregnancy smokers as the reference
group, suppose we get the following significant associations:
12

Postpartum Relapsers Pregnancy Quitters OR OR Black 1.45 Asian 4.7 Asian 2.1 Hispanic 2.5 Interpretation of the results for this hypothetical situation is as follows. Women who
ceased smoking during their pregnancy but relapsed postpartum were at 1.45 times
increased odds for being black, 2.1 increased odds from being Asian, and 2.5 times
increased odds for being Hispanic when compared to women who smoked throughout
their pregnancy and postpartum. Women who ceased smoking during their pregnancy and
remained nonsmokers postpartum were at 4.7 times increased odds for being Asian when
compared to women who smoked throughout their entire pregnancy and postpartum.
What if we are interested in using race as a predictor of quitting smoking during
pregnancy and remaining a nonsmoker postpartum compared to women who ceased
smoking during their pregnancy but relapsed postpartum? In this case, the reference
group needs to be designated as postpartum relapsers. Suppose the following relationship
is found:
Pregnancy Quitters OR Asian 1.9
Interpretation in of these hypothetical results is as follows. Women who quit smoking
during pregnancy and do not relapse postpartum are at 1.9 times increased odds for being
Asian when compared to women who ceased smoking during pregnancy but relapsed
postpartum.
13

Methods
Data
The “After the Baby Comes” study (ABC Study) was conducted at the Balboa
Pediatrics Clinic at the Naval Medical Center in San Diego. The study was originally
designed to observe maternal weight loss during the first year postpartum, compare
differences in weight loss to maternal characteristics, and to identify risk factors for
women likely to become overweight as a result of pregnancy. All women enrolled in this
study were either active duty military personnel or wives of active duty personnel. 7,723
women received well baby care at the Balboa Pediatric Clinics between April 1997 and
December 1999, 4,321 women were screened, and 2,812 were eligible for and enrolled in
the study. Eligibility requirements for participants included having delivered an infant at
most 12 months prior to enrollment, being a fluent English speaker, having their infant
spend no more than 96 hours in the neonatal intensive care unit, not being pregnant at the
time of enrollment, and intention to continue well baby care beyond the 10-16 day visits.
Though the original outcome variables for this study were maternal prenatal and
postpartum weight change, data were collected regarding smoking practices during and
after pregnancy.
The data for this study were collected through questionnaires over a period of
approximately two years. For the analysis in this study, data from two questionnaires
were used: (1) a baseline questionnaire, filled out by the woman once at the time of
enrollment in the study, which contained the smoking data and other various maternal
characteristics and (2) the participant’s latest completed clinic questionnaire, completed
no earlier than two months and no later than 18 months postpartum, which contained the
14

postpartum weight data. Complete smoking data were available for 1728 women;
however, the study sample for prediction of postpartum smoking was limited to women
with complete data on the variables used for the analysis (n=929). Data for women who
smoked throughout their pregnancies, women who ceased smoking during their
pregnancy and did not relapse postpartum, and women who quit smoking during their
pregnancy but relapsed postpartum were available for 228 women. This sample was
further limited to women with complete data on the variables used for the analysis
(n=125).
Questionnaires and Measures
Women were classified as postpartum smokers or postpartum nonsmokers based
on whether they reported smoking at any time in the postpartum period on either the
baseline questionnaire or any of the clinic questionnaires. This was evaluated by their
answer to whether or not they smoked any cigarettes within the past thirty days.
Women were classified as pregnancy smokers, pregnancy quitters, or pregnancy
relapsers based on their answers to several smoking questions. All women in these
categories reported smoking at the beginning of their pregnancy. Women who were
classified as pregnancy smokers reported smoking during the 3rd trimester and also
reported smoking postpartum (n=49). Women who were classified as pregnancy quitters
reported no smoking by the third trimester and also did not report any postpartum
smoking on the baseline questionnaire or on any of their clinic questionnaires (n=35).
Women who were classified as pregnancy relapsers reported no smoking by the third
trimester but reported smoking postpartum (n=41).
15
This study looked at predictors of postpartum smoking regardless of smoking
habits before and during pregnancy in one model and, additionally, looked at comparative
predictors of smoking throughout pregnancy, quitting smoking during pregnancy, and
relapsing postpartum.
Predictor Variables
Time was reported in days since the birth of the infant until the latest clinic
questionnaire date in order to adjust the maternal postpartum weight for time. Maternal
age was reported in years. Parity was included in the model and ranged from 0-5. Active
duty status was self-reported (Y/N) as was whether or not the woman was married or
living with a partner. Additional definitions of maternal characteristics/predictor variables
are summarized in Table 1.
Concern about body image in terms of worry about weight, shape, appearance,
and food, prepregnancy weight perception, and weight as a young girl was evaluated
using a four-point scale. A four-point scale was also used to measure the participants’
mother’s usual figure (sculptural appearance). The woman’s desire to gain or lose weight
was assessed on a four-point scale by evaluating the difference between the woman’s
current self-reported figure and her desired figure. These figures were assessed using the
Silhouette Technique25. History of weight cycling was coded as Y/N and is defined as
losing at least ten pounds and gaining it all back at least 3 times in the woman’s lifetime.
Postpartum weight retention was calculated by subtracting the maternal postpartum
weight at the time of the latest clinic questionnaire from the reported prepregnancy
weight.
16

Analysis
Statistical analyses were conducted using STATA 7.0 statistical software.26
Individual distributions and correlations were examined for independent variables and
postpartum smoking/non-smoking and for pregnancy smoking, pregnancy quitting, and
postpartum relapsing. Multiple logistic regression was performed using postpartum
smoking as the outcome of interest. Multinomial logistic regression (m-logit) models
were used for the three categories of pregnancy smoking, pregnancy quitting, and
postpartum relapsing. This allows for direct comparison of the three groups using odds
ratios with one group designated as a reference group.
Since the variables “worry about weight/shape/weight/food” are highly correlated
they were not included in either of the regression models simultaneously. Two different
methods were used to address this. First, each variable was put into the models
separately. Results for each of the four variables were nearly identical. In the second
method, the average of the four variables was taken after converting the values to a z-
score to standardize the variance. This average was put into the model. Results were
similar to the first method; therefore, only the results of the latter method are presented
here.
Results
Tables 2, 3, 4, and 5 show that the two analyzed study populations did not differ
substantially from the two total study populations. Baseline questionnaires were
completed on average 136 days (4.5 months) postpartum. The latest clinic questionnaires
were completed on average 236 days (7.7 months) postpartum for the postpartum
smoking model and 233 days (7.7 months) postpartum for the m-logit smoker model. The
17

postpartum smoking study population was racially diverse; however, the trichotomized
smoking population was predominantly white. Both study populations had a high
proportion of women who attended at least some college, although the trichotomized
smoking population had a lower proportion of college educated women than the
postpartum smoking study population. Nearly all of the women in both populations were
married or living with a partner.
Postpartum smoking rates were estimated at 20% for the postpartum smoking
study population. In the trichotomized smoking population, 39% of smokers smoked
throughout their pregnancy, 33% of smokers ceased smoking during pregnancy but
relapsed postpartum, and 28% of smokers ceased smoking during pregnancy and
remained nonsmokers at on average 233 days postpartum. Of this population, 61% of all
smokers stopped smoking during their pregnancy, but 54% of these women returned to
smoking by, on average, 233 days postpartum.
Results of the full logistic regression model with postpartum smoking as the
outcome are shown in Table 6. After adjustment for the covariates included in the model,
postpartum weight retention, a history of weight cycling, worry about weight, weight as a
young girl, and feeding a baby only formula were significant predictors. Additionally,
increased height, black and Asian race, education, and baby’s birth weight were
significant in the model.
Results of the m-logit analysis with trichotomized smoking categories as the
outcome are shown in Table 7. Postpartum relapsers were at 1.46 times increased odds
for having an overweight mother than women who smoked throughout their pregnancy.
Pregnancy quitters were at 1.14 times increased odds for retaining more weight
18

postpartum and were at slightly increased odds for having a heavier baby at birth
compared to women who smoked throughout their pregnancy. Pregnancy quitters were
also at 38.21 times increased odds for being Asian than white and were at 2.43 times
increased odds for having more education than women who smoked throughout their
pregnancy. Pregnancy quitters were also at 1.86 times increased odds for having more
education than women who ceased smoking during pregnancy but relapsed postpartum.
Discussion
This study was conducted in a military population, though the results seem
comparable to the general population of postpartum women. Results of a study of
cigarette smoking in the military population conformed to past studies that indicate
higher smoking rates among military personnel than among civilians.27 However, this
does not seem to be generalizable to the pregnancy quit rates for the women in this study
population. A larger number of women in this study population ceased smoking during
pregnancy (61%) than the estimated 20-40% for the general population from previous
studies3,4,6. The postpartum relapse rate of 54% is within the estimated range of 50-80%
for the general population.2
The hypothesis that women who retain more weight postpartum are at higher risk
for smoking cannot be supported by this study. Women who smoked postpartum were at
1.03 times decreased odds for retaining more weight postpartum than women who did not
smoke postpartum. However, this study was cross-sectional and, therefore, causality
cannot be determined. Since some women cite smoking as a form of weight control,15,16,17
it is likely that women who smoked postpartum retained less pregnancy weight due to
19

smoking. However, women who smoked postpartum were more likely to have a history
of weight cycling and to have been overweight as a young girl. This supports the
hypothesis that women who smoke postpartum are more likely to have concerns about
body image than women who do not smoke postpartum.
Additionally, the results from the postpartum smoking model agree with certain
predictors of smoking during pregnancy. This is likely do to the high correlation between
smoking during pregnancy and postpartum smoking. These women are less like to be
black or Asian than white,28,29,30,31 are less educated,3,6,32,33 and have lower birth weight
babies.34 Results of this study also show that postpartum smokers are at 1.96 times
decreased odds for feeling formula only than breast milk only when compared to
postpartum nonsmokers. This contradicts previous studies that have found postpartum
smokers initiating breast feeding at lower rates than non-smokers.3,11,12,13,14
No differences in body image issues or weight cycling were found between
women who smoked throughout their pregnancies, women who ceased and did not
relapse, and women who quit but relapsed postpartum. However, pregnancy quitters were
more likely to retain more weight than women who smoked during and after their
pregnancies. This is likely due to the fact that women gain weight when they ceased
smoking.35
Results of prior studies of postpartum relapse have had contradicting results. The
results of this study show that women who ceased smoking during pregnancy and do not
relapse are at increased odds for being Asian than white, more educated, and are at
slightly increased odds for having a higher birth weight baby than women who smoke
throughout their pregnancy. Women who quit smoking during pregnancy and do not
20

relapse postpartum are more likely to be more educated than women who quit smoking
during pregnancy but relapse postpartum. This study found no association between
postpartum smoking relapse and maternal age36,37 or parity,37,38 as have other studies.
Previous studies have consistently shown no association between socioeconomic status
and postpartum smoking relapse. This study did not differ from previous studies in this
aspect.
Because the ABC study was designed to study postpartum weight retention, not
all information that would be relevant to postpartum smoking status was collected.
Studies of postpartum smoking have shown that living with a partner who smokes will
consistently predict relapse. These data were not available for this study. Other smoking
data that would have been of interest for this study would include the length of time a
woman smoked prior to her pregnancy and more detailed information regarding her
smoking habits immediately prior to her pregnancy.
Additionally, the m-logit model in this study was limited by its small numbers and
due to the sample being disproportionately white. Therefore, associations that exist in
some ethnic groups may not have been apparent due to the limited power of this model.
Although a significant association was found in the Asian race, the large range of the
95% confidence interval demonstrates the need for additional power to get more precise
results not only in the Asian race, but among the other ethnic groups as well.
In summary, this study shows that body image concerns and postpartum weight
retention may be linked to postpartum smoking. Additionally, increased postpartum
weight retention may be linked to quitting smoking during pregnancy and remaining a
nonsmoker postpartum. Additionally, this study consistently shows that postpartum
21

smokers as less likely to be as highly educated as postpartum nonsmokers, and that
women who quit smoking during pregnancy but do not relapse postpartum are more
likely to be more educated than women who smoke throughout their pregnancies and
women who quit smoking during their pregnancies but relapse postpartum.
22

1. DiClemente CC, Dolan-Mullen P, Windsor RA. The process of pregnancy smoking cessation: implications for interventions. Tobacco Control 2000; 9 Suppl 3 III:16-21. 2. Ockene J. Smoking among women across the life span: prevalence, interventions, and implications for cessation research. Ann Behav Med 1993;15:135-4. 3. O’Campo P, Faden RR, Brown K, Gielen AC. The impact of pregnancy on women’s prenatal and postpartum smoking behavior. Am J Prev Med. 1992;8:8-13. 4. Hickner J, Westenberg C, Dittenbir M. Effect of pregnancy on smoking behavior: A baseline study. J Fam Practice. 1984;18:241-244. 5. Stewart PJ, Dunkley GC. Smoking and health care patterns among pregnant women. CMAJ. 1985;133:989-94. 6. Severson HH, Andrews JA, Lichtenstein E, Wall M. Predictors of smoking during and after pregnancy; a survey of mothers of newborns. Preventative Medicine. 1995; 24:23-28. 7. Wakefield M, Gillies P, Graham H, Madeley R. Characteristics associated with smoking cessation during pregnancy among working class women. Addiction. 1993;88:1423-30. 8. McBride CM, Pirie PL, Curry SJ. Postpartum relapse to smoking: a prospective study. Health Education Research. 1992;7:381-390. 9. Mullen PD, Richardson MA, Quinn VP, Ershoff SH. Postpartum return to smoking: who is at risk and when. American Journal of Health Promotion. 1997;11:323-330. 10. Severson HH, Andrews JA, Lichtenstein E, Wall M, Akers L. Reducing maternal smoking and relapse: long-term evaluation of a pediatric intervention. Preventative Medicine 1997;26:120-30. 11. Edwards N, Sims-Jones N, Breithaupt K. Smoking in pregnancy and postpartum: relationship to mothers’ choices concerning infant nutrition. Canadian Journal of Nursing Research. 1998;30:83-98. 12. Eriksen W. Breastfeeding, smoking, and the presence of the child’s father in the household. Acta Paediatr. 1996;85:1272-1277. 13. Little RE, Lambert MD, Worthington-Roberts B. Drinking and smoking at 3 months postpartum by lactation history. Paediatr Perinal Epidemiol. 1990;4:290-302. 14. Clements MS, Mitchell EA, Wright SP, Esmail A, Jones DR, Ford RP. Influences of breastfeeding in southeast England. Acta Paediatr. 1997;86:51-56. 15. Brandon TH, Baker TB. The Smoking Consequences Questionnaire: The subjective expected utility of smoking in college students. Psychological Assessment. 1991;3:484-491. 16. Camp DE, Klesges RC, Reylea G. The relationship between body weight concerns and adolescent smoking. Health Psychology. 1993;12:24-32. 17. Milligan RA, Burke V, Beilin LJ, Richards J. Health-related behaviours and psycho-social characteristics of 18-year old Australians. Social Science & Medicine. 1997;45:1549-62. 18. Groff JY, Mullen PD, Mongoven M, Burau K. Prenatal weight gain patterns and infant birth weight associated with maternal smoking. Birth. 1997;24:234-239. 19. Parker JD, Abrams B. Differences in postpartum weight retention between Black and while mothers. Obstet Gynecol. 1993;81:768-774. 20. Ohlin A, Rossner S. Maternal body weight development after pregnancy. International Journal of Obesity. 1990;14:159-173.
23

21. Streater JA, Sargent RG, Ward DS. A study of factors associated with weight change in women who attempt smoking cessations. Addictive Behaviors. 1989;14:523-530. 22. Meyers AW, Klesges RC, Winders SE, Ward KD, Peterson BA, Eck LH. Are weight concerns predictive of smoking cessation? A prospective analysis. Journal of Consulting and Clinical Psychology. 1997;54:448-452. 23. Hosmer DW, Lemeshow S. Applied Logistic Regression. Wiley-Interscience Publications. 1989. New York. 24. http://www.geocities.com/eva33.geo/logistic.html. Accessed 01/13/03. 25. Stunkard AJ, Sorenson T, Schulsinger F. Use of the Danish Adoption Register for the study of obesity and thinness. Genetics of Neuro Psychiatr. 1983;115-120. 26. Stata,C., Stata 7 User Guide. 2001, College Station: Stata Press. 27. Feigelman, W. Cigarette Smoking Among Former Military Service Personnel. A Neglected Social Issue. Preventive Medicine. 1994;23:235-241. 28. King G, Barry L, Carter DL. Smoking prevalence among prenatal women: the role of socioeconomic status, race, and ethnicity. Conn Med. 1993;57:721-728. 29. Ruggiero L, de Groot M. Smoking patterns of low-income ethnoculturally diverse pregnant women: are we casting the net wide enough? Addictive Behavior. 1998;23:549-554. 30. Sergent JB, Sheahan SL, Latimer M. Demographic predictors of smoking at initiation of antenatal care. Journal of the American Academy of Nurse Practitioners. 1994;6:573-589. 31. Matthews TJ. Smoking during pregnancy, 1990-96. Nation Vital Statistics Report. 1998;47:1-12. 32. Fingerhut LA, Kleinman JC, Kendrick JS. Smoking before, during, and after pregnancy. American Journal of Public Health. 1990;80:541-544. 33. Conner SK, McIntyre L. The sociodemographic predictors of smoking cessation among pregnant women in Canada. Can J Public Health. 1999;90:352-355. 34. Mitchell EA, Thompson JM, Robinson E, Wild CJ, Becroft DM, Clark PM, Glavish N, Pattison NS, Pryor JE. Smoking, nicotine and tar and risk of small for gestational age babies. Acta Paediatr. 2002;91(3):323-8. 35. Williamson DF, Madans J, Anda RF, Kleinman JC. Smoking cessation and severity of weight gain in a national cohort. New England Journal of Medicine. 1991;324:739-745. 36. Dalaker K, Grunfeld B, Jansen A. Some social background variables among smoking and non-smoking primiparae. Scan J Soc Med. 1983;11:23-26. 37. Dodds L. Prevalence of smoking among pregnant women in Nova Scotia from 1988-1992. CMAJ. 1995;152:185-190. 38. Stockbauer JW, Land GH. Changes in characteristics of women who smoked during pregnancy: Missouri, 1978-88. Public Health Rep. 1991;106:52-58.
24

Table 1: Summary of Variables Used in all Statistical Models
Variable Name Definition
Race White Self-reported white only Black Self-reported black or any mixture of black and other/white Asian Self-reported Asian or any mixture of Asian and other/white Hispanic Self-reported Hispanic or any mixture of Hispanic and other/white Other Self-reported any race not listed above Income 1=$500/month or less 2=$501-1000/month 3=$1001-1500/month 4=$1501-2000/month 5=$2001-2500/month 6=$2501-3000/month 7=$3001-6250/month 8=More than $6250/month Education 1=Less than high school 2=High school or equivalent 3=Trade or vocational school 4=College 5=Graduate school
History of Weight Cycling Y/N; = losing and regaining 10 or more pounds intentionally 3 or more times during the woman's lifetime
Prepregnancy Weight Perception/Weight as a young girl
"(At your weight before you got pregnant with this baby/When you were a little girl), did you think you were:"
1=Underweight 2=Just about the right weight 3=A little overweight 4=Very overweight Body Image Concerns: Worry about weight, shape, food, and appearance
"During the past 7 days, how often did you worry about your (weight/shape/food/appearance)?"
1=Rarely or none of the time 2=Some of the time 3=More than half of the time but not most of the time 4=Most of all of the time Maternal Grandmother's Usual Figure "You biological mother usually looks(looked) like:" 1-9: Silhouette Technique
25

Desire to gain/lose weight
Using the Silhouette Technique (difference between current silhouette and desired silhouette); The woman:
1=Wants to gain weight (negative value) 2=Wants to stay the same weight (0) 3=Wants to lose a little weight (1,2) 4=Wants to lose a lot of weight (3,4,5,6) Breast feeding practices 1=Feed only breast milk 2=Feed mostly breast milk 3=Feed half breast milk/half formula 4=Feed mostly formula 5=Feed only formula
26
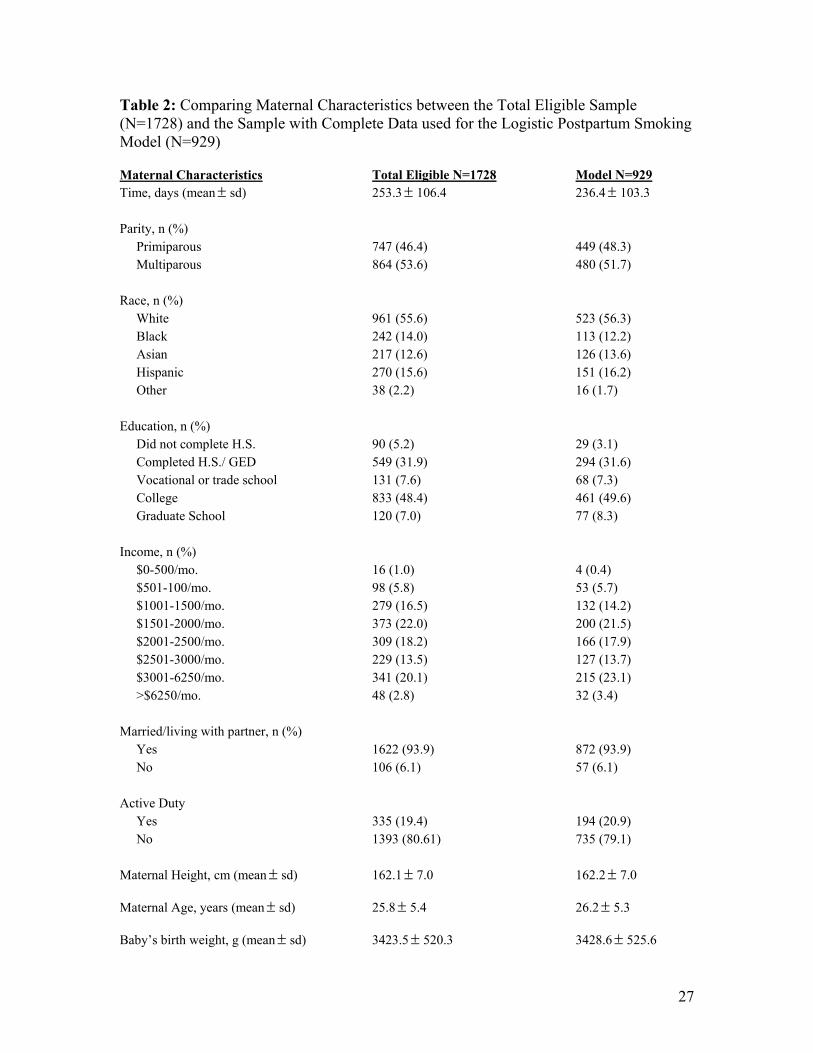
Table 2: Comparing Maternal Characteristics between the Total Eligible Sample (N=1728) and the Sample with Complete Data used for the Logistic Postpartum Smoking Model (N=929) Maternal Characteristics Total Eligible N=1728 Model N=929 Time, days (mean sd) ± 253.3 106.4 ± 236.4 103.3 ± Parity, n (%) Primiparous 747 (46.4) 449 (48.3) Multiparous 864 (53.6) 480 (51.7) Race, n (%) White 961 (55.6) 523 (56.3) Black 242 (14.0) 113 (12.2) Asian 217 (12.6) 126 (13.6) Hispanic 270 (15.6) 151 (16.2) Other 38 (2.2) 16 (1.7) Education, n (%) Did not complete H.S. 90 (5.2) 29 (3.1) Completed H.S./ GED 549 (31.9) 294 (31.6) Vocational or trade school 131 (7.6) 68 (7.3) College 833 (48.4) 461 (49.6) Graduate School 120 (7.0) 77 (8.3) Income, n (%) $0-500/mo. 16 (1.0) 4 (0.4) $501-100/mo. 98 (5.8) 53 (5.7) $1001-1500/mo. 279 (16.5) 132 (14.2) $1501-2000/mo. 373 (22.0) 200 (21.5) $2001-2500/mo. 309 (18.2) 166 (17.9) $2501-3000/mo. 229 (13.5) 127 (13.7) $3001-6250/mo. 341 (20.1) 215 (23.1) >$6250/mo. 48 (2.8) 32 (3.4) Married/living with partner, n (%) Yes 1622 (93.9) 872 (93.9) No 106 (6.1) 57 (6.1) Active Duty Yes 335 (19.4) 194 (20.9) No 1393 (80.61) 735 (79.1) Maternal Height, cm (mean sd) ± 162.1 7.0 ± 162.2 7.0 ± Maternal Age, years (mean sd) ± 25.8 5.4 ± 26.2 5.3 ± Baby’s birth weight, g (mean sd) ± 3423.5 520.3 ± 3428.6 525.6 ±
27
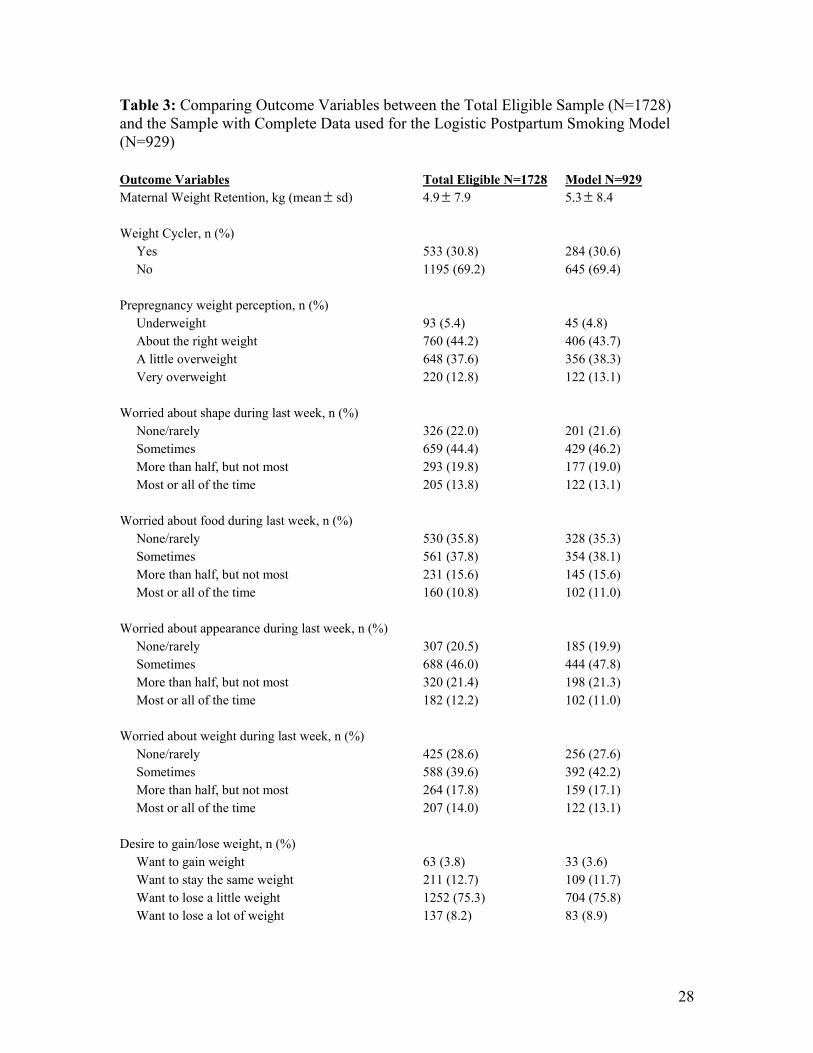
Table 3: Comparing Outcome Variables between the Total Eligible Sample (N=1728) and the Sample with Complete Data used for the Logistic Postpartum Smoking Model (N=929) Outcome Variables Total Eligible N=1728 Model N=929 Maternal Weight Retention, kg (mean sd) ± 4.9 7.9 ± 5.3 8.4 ± Weight Cycler, n (%) Yes 533 (30.8) 284 (30.6) No 1195 (69.2) 645 (69.4) Prepregnancy weight perception, n (%) Underweight 93 (5.4) 45 (4.8) About the right weight 760 (44.2) 406 (43.7) A little overweight 648 (37.6) 356 (38.3) Very overweight 220 (12.8) 122 (13.1) Worried about shape during last week, n (%) None/rarely 326 (22.0) 201 (21.6) Sometimes 659 (44.4) 429 (46.2) More than half, but not most 293 (19.8) 177 (19.0) Most or all of the time 205 (13.8) 122 (13.1) Worried about food during last week, n (%) None/rarely 530 (35.8) 328 (35.3) Sometimes 561 (37.8) 354 (38.1) More than half, but not most 231 (15.6) 145 (15.6) Most or all of the time 160 (10.8) 102 (11.0) Worried about appearance during last week, n (%) None/rarely 307 (20.5) 185 (19.9) Sometimes 688 (46.0) 444 (47.8) More than half, but not most 320 (21.4) 198 (21.3) Most or all of the time 182 (12.2) 102 (11.0) Worried about weight during last week, n (%) None/rarely 425 (28.6) 256 (27.6) Sometimes 588 (39.6) 392 (42.2) More than half, but not most 264 (17.8) 159 (17.1) Most or all of the time 207 (14.0) 122 (13.1) Desire to gain/lose weight, n (%) Want to gain weight 63 (3.8) 33 (3.6) Want to stay the same weight 211 (12.7) 109 (11.7) Want to lose a little weight 1252 (75.3) 704 (75.8) Want to lose a lot of weight 137 (8.2) 83 (8.9)
28

Weight as a little girl, n (%) Underweight 63 (3.8) 183 (19.7) Just about the right weight 211 (12.7) 620 (66.7) A little overweight 1252 (75.3) 118 (12.7) Very overweight 137 (8.2) 8 (8.6) Grandmother's usual figure Underweight 181 (11.2) 100 (10.8) Just about the right weight 1052 (65.2) 599 (64.5) A little overweight 328 (20.3) 195 (21.0) Very overweight 52 (3.2) 35 (3.8) Breastfeeding practices Breastfed only 384 (22.2) 161 (17.3) Mostly breastfed 333 (19.3) 205 (22.1) Half breast/half formula 298 (17.2) 171 (18.4) Mostly formula 170 (9.8) 93 (10.0) Formula only 543 (31.4) 229 (32.2)
29

Table 4: Comparing Maternal Characteristics between the Total Eligible Sample (N=228) and the Sample with Complete Data used for the m-Logit Smoking Model (N=125) Maternal Characteristics Total Eligible N=228 Model N=125 Clinic Time, days (mean sd) ± 241.2 104.4 ± 232.8± 100.0 Parity, n (%) Primiparous 104 (49.8) 67 (53.8) Multiparous 105 (50.2) 58 (46.4) Race, n (%) White 180 (79.0) 99 (79.2) Black 11 (4.8) 6 (4.8) Asian 16 (7.0) 9 (7.2) Hispanic 18 (7.9) 11 (8.8) Other 3 (1.3) 0 (0) Education, n (%) Did not complete H.S. 31 (13.7) 11 (8.8) Completed H.S./ GED 103 (45.4) 56 (44.8) Vocational or trade school 15 (6.6) 7 (5.6) College 76 (33.5) 49 (39.2) Graduate School 2 (0.9) 2 (1.6) Income, n (%) $0-500/mo. 2 (0.9) 0 (0) $501-100/mo. 16 (7.2) 10 (8.0) $1001-1500/mo. 39 (17.5) 18 (14.4) $1501-2000/mo. 59 (26.5) 24 (19.2) $2001-2500/mo. 46 (20.6) 29 (23.2) $2501-3000/mo. 25 (11.2) 17 (13.6) $3001-6250/mo. 35 (15.7) 26 (20.8) >$6250/mo. 1 (0.5) 1 (0.8) Married/living with partner, n (%) Yes 209 (91.7) 117 (93.6) No 19 (8.3) 8 (6.4) Active Duty Yes 42 (18.4) 31 (24.8) No 186 (81.6) 94 (75.2) Maternal Height, cm (mean sd) ± 164.1 6.3 ± 164.4± 6.5 Maternal Age, years (mean sd) ± 24.3 5.5 ± 25.2± 5.7 Baby’s birth weight, g (mean sd) ± 3358.7 534.4 ± 3400.5 571.5 ±
30

Table 5: Comparing Outcome Variables between the Total Eligible Sample (N=228) and the Sample with Complete Data used for the m-Logit Smoking Model (N=125) Outcome Variables Total Eligible N=228 Model N=125 Maternal Weight Retention, kg (mean sd) ± 6.4 7.5 ± 6.8± 7.7 Weight Cycler, n (%) Yes 97 (42.5) 58 (46.4) No 131 (57.5) 67 (53.6) Prepregnancy weight perception, n (%) Underweight 19 (8.4) 9 (7.2) About the right weight 102 (45.1) 53 (42.4) A little overweight 77 (34.1) 48 (38.4) Very overweight 28 (12.4) 15 (12.0) Worried about shape during last week, n (%) None/rarely 46 (23.6) 27 (21.6) Sometimes 70 (35.9) 44 (35.2) More than half, but not most 46 (23.6) 29 (23.2) Most or all of the time 33 (16.9) 25 (20.0) Worried about food during last week, n (%) None/rarely 73 (37.4) 44 (35.2) Sometimes 65 (33.3) 40 (32.0) More than half, but not most 31 (15.9) 21 (16.8) Most or all of the time 26 (13.3) 20 (16.0) Worried about appearance during last week, n (%) None/rarely 42 (21.1) 23 (18.4) Sometimes 83 (41.7) 50 (40.0) More than half, but not most 48 (24.1) 35 (28.0) Most or all of the time 26 (13.1) 17 (13.6) Worried about weight during last week, n (%) None/rarely 58 (29.6) 34 (27.2) Sometimes 64 (32.7) 38 (30.4) More than half, but not most 40 (20.4) 27 (21.6) Most or all of the time 34 (17.4) 26 (21.8) Desire to gain/lose weight, n (%) Want to gain weight 8 (3.7) 4 (3.2) Want to stay the same weight 25 (11.5) 11 (8.8) Want to lose a little weight 151 (69.6) 90 (72.0) Want to lose a lot of weight 33 (15.2) 20 (16.0)
31

Weight as a little girl, n (%) Underweight 34 (18.2) 24 (19.2) Just about the right weight 120 (64.2) 77 (61.6) A little overweight 29 (15.5) 22 (17.6) Very overweight 4 (2.1) 2 (1.6) Grandmother's usual figure Underweight 32 (15.0) 18 (14.4) Just about the right weight 81 (38.0) 49 (39.2) A little overweight 94 (44.1) 54 (43.2) Very overweight 6 (2.8) 4 (3.2) Breastfeeding practices Breastfed only 64 (28.1) 27 (21.6) Mostly breastfed 43 (18.9) 28 (22.4) Half breast/half formula 42 (18.4) 28 (22.2) Mostly formula 26 (11.4) 11 (8.8) Formula only 53 (23.2) 31 (24.8)
32

Table 6: Multiple logistic regression (n=934) with postpartum smoking as the outcome. Pseudo R squared 0.15 Category 0: Did not smoke postpartum (includes nonsmokers and quitters during pregnancy who did not relapse postpartum) Category 1: Smoker postpartum (includes women who smoked during and after pregnancy, women who quit during pregnancy and relapsed postpartum, and women who did not smoke during pregnancy but reported smoking postpartum) OR (95% CI) Postpartum weight retention 0.97 0.94 1.00 * History of weight cycling 1.74 1.18 2.56 ** Prepregnancy weight perception 0.79 0.59 1.05 Body image 1.11 0.89 1.39 Height 1.06 1.03 1.09 *** Black 0.51 0.27 0.95 * Asian 0.26 0.11 0.61 ** Hispanic 0.62 0.37 1.04 Other race 0.97 0.29 3.18 Age 0.96 0.92 1.01 Active duty status 1.00 0.62 1.59 Married/living with partner 0.86 0.41 1.77 Parity 1.09 0.88 1.35 Income 0.90 0.79 1.03 Education 0.68 0.57 0.81 *** Desire to gain/lose weight 1.22 0.95 1.56 Baby’s birth weight .9995 .9992 .9999 ** Weight as a young girl 1.30 1.02 1.67 * Maternal grandmother’s usual figure 1.08 0.97 1.21 Feed mostly breast milk 1.17 0.69 1.98 Feed half breast/half bottle 1.45 0.84 2.48 Feed mostly formula 0.87 0.44 1.73 Feed only formula 0.51 0.29 0.88 * Time 1.00 1.00 1.00 (reference groups: race – white; income less that $500/month; baby’s food – breastfeeding only) * p<.05; ** p<.01; *** p<.001
33

Table 7: Significant associations using m-Logit model, with trichotomized smoking categories as the outcome (n=125). Pseudo R squared 0.26 Category 0: the woman smoked throughout pregnancy Category 1: the woman quit smoking during pregnancy and relapsed postpartum Category 2: the woman quit smoking during pregnancy and did not relapse postpartum In comparison to women who smoked throughout their pregnancy: Women who quit smoking during pregnancy and relapsed postpartum were more likely to be: OR (95% CI) Mother’s usual figure 1.46 1.06 2.02 * Women who quit during pregnancy and did not relapse postpartum were more likely to be: OR (95% CI) Postpartum Weight Retention 1.14 1.03 1.27 * Asian 38.21 2.75 530.92 ** Baby’s Birth weight 1.001 1.000 1.002 * Education 2.43 1.32 4.46 ** In comparison to women who quit smoking during pregnancy but relapsed postpartum: Women who quit during pregnancy and did not relapse postpartum were more likely to be: OR (95% CI) Education 1.86 1.03 3.35 * * p<.05; ** p<.01; *** p<.001
34

![Interventions for promoting smoking cessation during pregnancy · [Intervention Review] Interventions for promoting smoking cessation during pregnancy Judith Lumley2, Catherine Chamberlain1,](https://img.pdfslide.net/doc/110x75/5f1557a404f3e23fed68e54d/interventions-for-promoting-smoking-cessation-during-pregnancy-intervention-review.jpg)

![midwifery briefing [ 2 ] - National Centre for Smoking ... · PDF fileSmoking Cessation: A briefing for midwifery staff 05 Smoking status can and does change in pregnancy. Although](https://img.pdfslide.net/doc/110x75/5a79b03d7f8b9a9b4d8c00ed/midwifery-briefing-2-national-centre-for-smoking-cessation-a-briefing.jpg)