Embed Size (px)
Citation preview
arX
iv:1
102.
1164
v1 [
astr
o-ph
.SR
] 6
Feb
201
1
Mon. Not. R. Astron. Soc. 000, 1–?? () Printed 8 February 2011 (MN LATEX style file v2.2)
SN 2008gz − most likely a normal type IIP event
Rupak Roy1 ⋆, Brijesh Kumar1, Alexander S. Moskvitin2, Stefano Benetti3,
Timur A. Fatkhullin2, Brajesh Kumar1,4, Kuntal Misra5,6, Filomena Bufano3,
Ralph Martin7, Vladimir V. Sokolov2, S. B. Pandey1,8, H. C. Chandola9, Ram Sagar1
1Aryabhatta Research Institute of Observational Sciences (ARIES), Manora Peak, Nainital, 263 129, India2Special Astrophysical Observatory, Nizhnij Arkhyz, Karachaevo-Cherkesia, 369167 Russia3Istituto Nazionale di Astrofisica, Observatorio Astronomico di Padova, Italy4Institut d’Astrophysique et de Geophysique, Universite de Liege, Allee du 6 Aout 17, Bat B5c, 4000 Liege, Belgium5Space Telescope Science Institute, 3700 San Martin Drive, Baltimore, MD 21218, USA6Inter University Center for Astronomy and Astrophysics, Post Bag 4, Ganeshkhind, Pune, 411 007, India7Perth Observatory, 337 Walnut Road, Bickley 6076, Perth, Australia8Randall Laboratory of Physics, Univ. of Michigan, 450 Church St., Ann Arbor, MI, 48109-1040, USA9Department of Physics, Kumaun University, Nainital, India
Accepted 14-Jan-2011; Received 25-Oct-2010
ABSTRACT
We present BV RI photometric and low-resolution spectroscopic investigation of atype II core-collapse supernova (SN) 2008gz, which occurred in a star forming arm andwithin a half-light radius (solar metallicity region) of a nearby spiral galaxy NGC 3672.The SN event was detected late, and a detailed investigation of its light curves andspectra spanning 200 days suggest that it is an event of type IIP similar to archetypalSNe 2004et and 1999em. However, in contrast to other events of its class, the SN 2008gzexhibits rarely observed V magnitude drop of 1.5 over the period of a month duringplateau to nebular phase. Using 0.21 mag of AV as a lower limit and a distance of 25.5Mpc, we estimate synthesized 56Ni mass of 0.05± 0.01M⊙ and a mid-plateau MV of−16.6 ± 0.2 mag. The photospheric velocity is observed to be higher than that wasobserved for SN 2004et at similar epochs, indicating explosion energy was comparableto or higher than SN 2004et. Similar trend was also seen for the expansion velocity ofH-envelopes. By comparing its properties with other well studied events as well as byusing a recent simulation of pre-SN models of Dessart, Livne & Waldman (2010), weinfer an explosion energy range of 2− 3× 1051 erg and this coupled with the observedwidth of the forbidden [O i] 6300-6364A line at 275 days after the explosion gives anupper limit for the main-sequence (non-rotating, solar metallicity) progenitor mass of17M⊙. Our narrow-band Hα observation, taken nearly 560 days after the explosionand the presence of an emission kink at zero velocity in the Doppler corrected spectraof SN indicate that the event took place in a low luminosity star forming H ii region.
Key words: supernovae: general − supernovae: individual: SN 2008gz − galaxies:individual: NGC 3672
1 INTRODUCTION
Core-collapse supernovae occur in late type galaxies andtheir locations are usually associated with the regions ofhigh stellar surface brightness or recent/ongoing star for-mation, suggesting that they represent the end stages ofmassive stars (M > 8 –10 M⊙) (Anderson & James 2009;
⋆ e-mail: [email protected], [email protected]
Hakobyan et al. 2009). Observationally, these events areclassified into H-rich type II SNe which show prominentH-lines in their optical spectra, and H-deficient type Ib/cSNe which don’t show the trace of H-lines. Ic events lackHe-lines as well. Type II SNe constitute about 70% of allthe core-collapse SNe (Cappellaro et al. 1999; Smith et al.2009) and their light curves and spectra differ significantly.In type IIP, the optical light remains constant for about100 days (called the plateau phase) and then decays expo-
2 Roy et al.
nentially. The spectra are featured due to strong P-cygniprofiles, while in type IIL SNe, a linear decline in its opticallight and strong emission lines are observed. Type IIn eventsshow narrow emission lines (Filippenko 1997; Smartt et al.2009a).
Theoretically, the explosion mechanism consists of thecollapse of the progenitor star’s Fe-core, formation of a shockwave, the ejection of stellar envelope and formation of a neu-tron star or a black hole. The shock wave generated throughthe reversal of core-collapse, breaks out the stellar surfaceof progenitor as a hot fireball flashes in X-ray and ultravi-olet continuing from a few seconds to a few days. In H-richevents, the shock-heated expanding stellar envelope coolsdown, by recombination of H and sustains the plateau phaseof IIP SNe, while the post-maxima/plateau light curves arepowered by the radioactive decay of 56Co into 56Fe. Thoughthe explosion mechanism is similar to these events, they dif-fer largely in energetics, e.g. IIP SNe are observed to forma sequence from low-luminosity, low-velocity, Ni-poor eventsto bright, high-velocity, Ni-rich objects (Hamuy 2003). Thus,a detailed investigation of individual core-collapse events isimportant for understanding the nature and environment ofprogenitors. They generally probe the star formation pro-cesses, galactic chemical evolution and constrain the stel-lar evolutionary models (Heger et al. 2003; Smartt 2009b;Habergham, Anderson & James 2010). Type IIP SNe alsoturned out to be good standardizable candles (Hamuy 2002;Poznanski et al. 2009; Olivares et al. 2010).
The SN 2008gz event was discovered on November 5.83UT, 2008 by Koichi Itagaki using a 0.6m telescope in the spi-ral galaxy NGC 3672 at an unfiltered magnitude of about16.2. On November 7.84 and 8.84 UT, an independent dis-covery of this new transient was reported by R. Martinfrom Perth Observatory as a part of “Perth AutomatedSupernova Search Program” by using 0.6m Lowell Tele-scope. The red magnitude of this new object was about15.5 (Nakano & Martin 2008). On November 11.25 UT,Benetti et al. (2008) took the first spectra of this event withthe 3.5m TNG (+ DOLORES; range 340-800 nm, resolu-tion 1.0 nm) and showed that it is a type II supernova eventand by using GELATO tool (Harutyunyan et al. 2008), theyfound that the spectrum of SN 2008gz resembles best withthat of a II-peculiar event SN 1998A, taken at 62 days afterexplosion (Pastorello et al. 2005). Assuming the recessionvelocity of the host galaxy ∼ 1862 km s−1, they found theexpansion velocity of hydrogen layer was about 6600 kms−1.An independent regular BV RI CCD photometric monitor-ing of SN 2008gz was carried out since November 10, 2008by using 1m Sampurnanand Telescope at Nainital, India.We also collected spectra in optical (0.4 − 0.9µm) with 2mIUCAA, India; 3.6m NTT, Chile; 6m BTA, Russia; 3.6mTNG, Spain.
In this work, we present results of optical photometricand low-resolution spectroscopic investigation of SN 2008gz.We adopt time of explosion to be August 20.0, 2009 or JD2454694.0 having uncertainty of a few days (see §2.2 for de-tails). Hence the time of post/pre-explosion are rounded offto nearest day and they are referred with + and − signsrespectively. Basic properties of SN 2008gz and its hostgalaxy NGC 3672 are given in Table 1. The paper is or-ganized as follows. §2 and §3 present the photometric andspectroscopic observations and a brief description of light
Table 1. Properties of the host galaxy NGC 3672 and SN 2008gz.
Parameters Value Ref.a
NGC 3672:
Type SAc 1RA (J2000) α = 11h25m2.s48 1DEC (J2000) δ = −0947′43.′′0 1Abs. Magnitude MB = −20.59 mag 1
Distance D = 25.5 ± 2.4 Mpc §6Scale 1′′ ∼ 123 pc, 1′ ∼ 7.4 kpcDistance modulus µ = 32.03± 0.21
Apparent radius r25 = 1.′4 (∼ 10.4 kpc) 1Inclination angle Θinc = 56.2 1Position angle Θmaj = 6.5 1Heliocentric Velocity czhelio = 1864 ± 19 km s−1 1
SN 2008gz:
RA (J2000) α = 11h25m3.s24 2DEC (J2000) δ = −0947′51.′′0 2
Location 13′′ E, 7′′ S 2Deprojected radius rSN = 23.′′37 (∼ 2.81 kpc) §8.2
Explosion epoch (UT) 20.0 August 2008 §2.2(JD 2454694.0)
Discovery date (UT) 5.83 November 2008 2
a (1) HyperLEDA - http://leda.univ-lyon1.fr; (2)Nakano & Martin (2008)
curves and spectra. In §4 we study evolution of some impor-tant line profiles, where as in §5, the velocity of the photo-sphere and the H-ejecta is estimated by using SYNOW code(Branch, Baron & Jeffery 2001; Branch et al. 2002; Baron2005) that describes spectroscopic observations. Distance,extinction and the evolution of colour and bolometric lumi-nosity are studied in §6 and §7 respectively. The amount ofsynthesized 56Ni mass, environment and energetics of theprogenitor are estimated and discussed in §8. We also madea comparative study of this event with other type IIP SNein §9. At last a summary is presented in §10.
2 BROAD BAND PHOTOMETRY
2.1 BV RI data
Initial pre-SN images (– 403d) of the host galaxy NGC 3672at V RI bands were obtained from Perth Observatory, as apart of supernova search program for another type Ia SN2007bm, which occured in the same galaxy. Images weretaken with 512 × 512 CCD camera mounted on a 0.6m Low-ell Telescope, covering around 5 × 5 square arcmin on thesky. The FWHM seeing was about 2.′′5.
SN 2008gz was observed at different epochs from differ-ent observatories around the world. The major part of moni-toring was carried out in Johnson BV and Cousins RI bandsfrom 1m Sampurnanand Telescope (ST)1 at the Aryab-
1 We used a 2048 × 2048 CCD camera having a square pixelof 24µm mounted at the f/13 Cassegrain focus of the telescope.
Supernova 2008gz 3
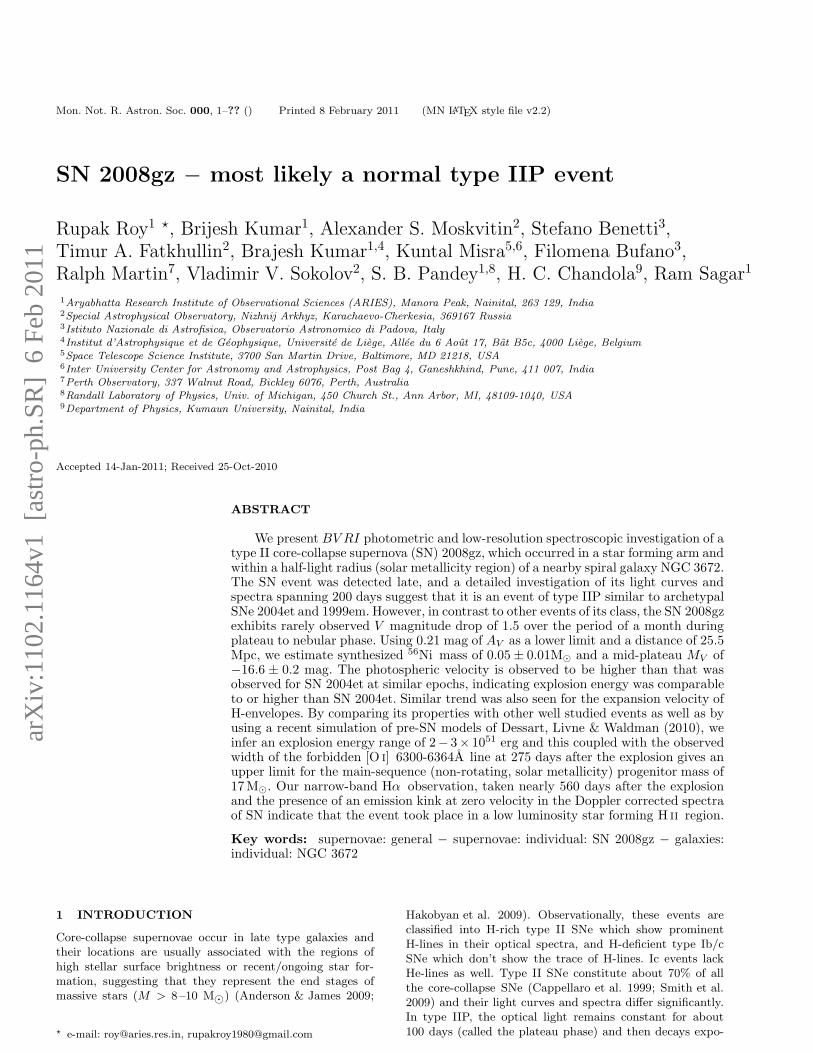
Figure 1. SN 2008gz in NGC 3672. V band image from 1 m ST,India. Area of about 8 × 8 arcmin is shown, with location of SNmarked with a cross and reference standard stars marked with
circles.
hatta Research Institute of Observational Sciences (ARIES),Nainital, India. SN 2008gz was observed during 10 Novem-ber 2008 (+87d) to 17 May 2009 (+275d). We could notdetect SN in the observations of 19 November (+462d) inB, of 13 February 2010 (+547d) in V RI and of 14 February2010 (+548d) in BV RI. In addition to 1m ST, observationsof SN 2008gz at BV RI bands were also obtained on 21, 22,24 and 25 March 2009, with IFOSC mounted on 2m IGO,IUCAA, India and on 17 May 2009 with EFOSC2 mountedon 3.6m NTT, ESO, Chile. The journal of observations isgiven in Table 22.
Photometric observations included acquisition of sev-eral exposures with exposure time varying from 100 to 300 sin different filters. Several bias and twilight flat frames wereobtained for the CCD images. Bias subtraction, flat fielding,cosmic ray removal, alignment and determination of meanFWHM and ellipticity in all the object frames were done us-ing the standard tasks available in the data reduction soft-wares IRAF 3 and DAOPHOT4 (Stetson 1987, 1992). TheFWHM seeing at V band varied from 2′′ to 4′′, with a me-
Plate scale of the CCD chip is 0.38 arcsec per pixel, and the entirechip covers a field of 13 × 13 square arcmin on the sky. Thegain and readout noise of the CCD camera are 10 e− per analog-to-digital unit and 5.3 e− respectively. All the observations werecarried out in the binning mode of 2×2 pixel.2 Table 2 is only available in electronic form.3 IRAF stands for Image Reduction and Analysis Facility dis-tributed by the National Optical Astronomy Observatories whichis operated by the Association of Universities for research in As-tronomy, Inc. under co-operative agreement with the NationalScience Foundation.4 DAOPHOT stands for Dominion Astrophysical ObservatoryPhotometry.
dian value of around 2.′′5. About 10% of the images takenat large zenith distance had highly elongated PSF (ellip-ticity > 0.2). For final photometry, we co-added the indi-vidual frames to increase the signal-to-noise ratio. The pre-processing steps for images taken from other than 1m STwere also performed in similar fashion.
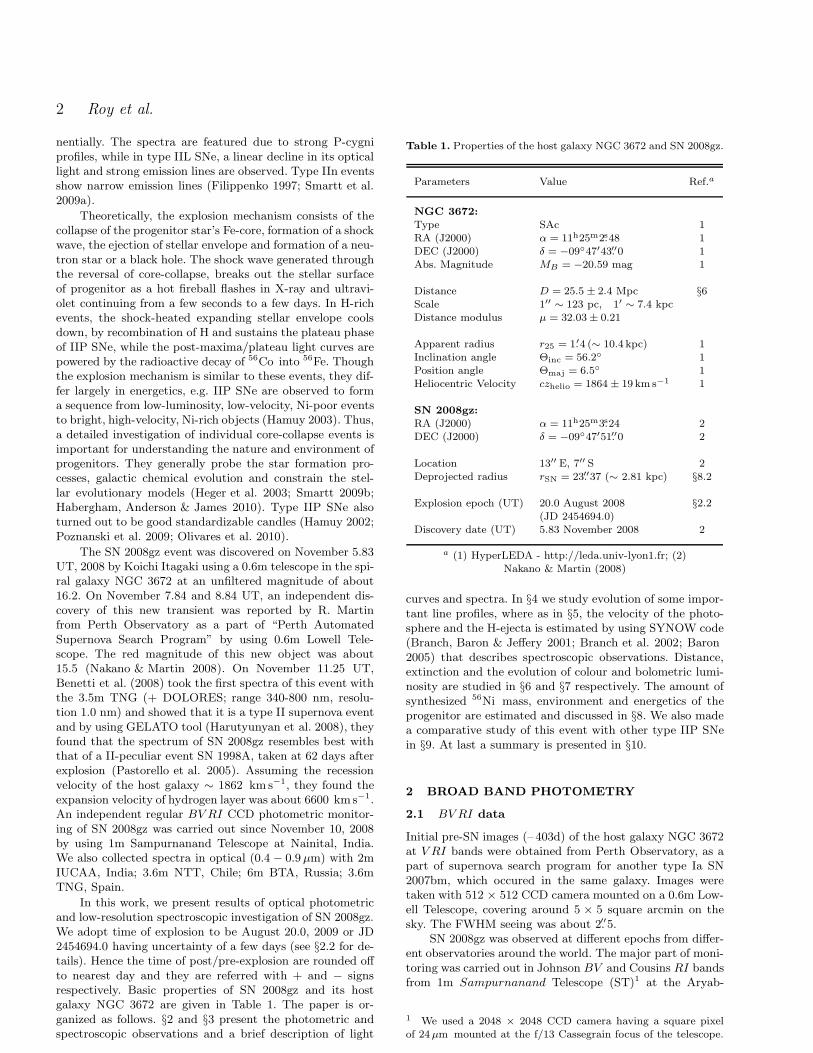
Fig. 1 shows the location of SN 2008gz in the galaxyNGC 3672. The SN flux is expected to have substantial con-tribution from the host galaxy background, due to its prox-imity to the galaxy centre, its location in a spiral arm anda high inclination angle (56.2; Table 1) of the galaxy. Atearly phases, SN flux dominates the total flux, thus with aPSF-fitting method we were able to remove the galaxy con-tribution. At later epochs (e.g. end of plateau in case of typeIIP events), galaxy flux may brighten the SN light curvesby 0.5 to 1 mag depending on its location in the galaxy(Pastorello et al. 2005). We used ISIS5 (Alard & Lupton1998) to get galaxy template subtracted flux of supernova.As a template we used the BV RI images taken on 14 Febru-ary 2010 (+548d) from 1m ST, India in good seeing con-ditions. We note that the galaxy subtraction using pre-SN(–403d) V RI images taken from Perth Observatory, gave noSN contribution above noise level in our images recorded on19 November 2009, 13 and 14 February 2010. In order toverify ISIS results, we also performed the galaxy templatesubtraction scheme independently using self-written scriptsemploying IRAF tasks which included alignment, PSF andintensity matching of the galaxy template and SN images,and subtraction of template from SN images. Fig. 2 showsimages with and without template subtraction. PSF-fittingmethod was applied on the subtracted images. Our magni-tude was found to be consistent with the ISIS ones having atypical scatter of ∼0.1 mag in BV RI ; this scatter is of theorder of 0.05 mag in plateau phase (see Fig. 36).
In order to calibrate instrumental magnitudes of SN2008gz, we observed Landolt (2009) standard fields SA92and PG0231 in BV RI with 1m ST on 15 November 2008under good night conditions (transparent sky, FWHM see-ing in V ∼ 2′′). The data reduction of SN and Landoltfields were done using profile fitting technique and the in-strumental magnitudes were converted into standard systemfollowing least-square linear regression procedures outlinedin Stetson (1992). We used mean values of atmospheric ex-tinction coefficients of the site viz. 0.28, 0.17, 0.11 and 0.07mag per unit airmass for the B, V , R and I bands respec-tively (Kumar et al. 2000). A set of 13 stars having a colourrange of −0.33 ≤ (B−V ) ≤ 1.45 and brightness range of12.77 ≤ V ≤ 16.11 were used to derive the following zeropoints and colour coefficients:
b = B + (5.37± 0.02) + (0.01 ± 0.02)(B − V )
v = V + (4.89± 0.01) + (−0.02± 0.02)(B − V )
r = R + (4.72 ± 0.01) + (0.02± 0.02)(V −R)
i = I + (5.17± 0.02) + (0.02 ± 0.02)(V − I)
Here B, V , R, I are the standard magnitudes and b, v, r,i are corresponding instrumental magnitudes corrected for
5 http://www2.iap.fr/users/alard/package.html6 Figure 3 is only available in electronic form.
4 Roy et al.
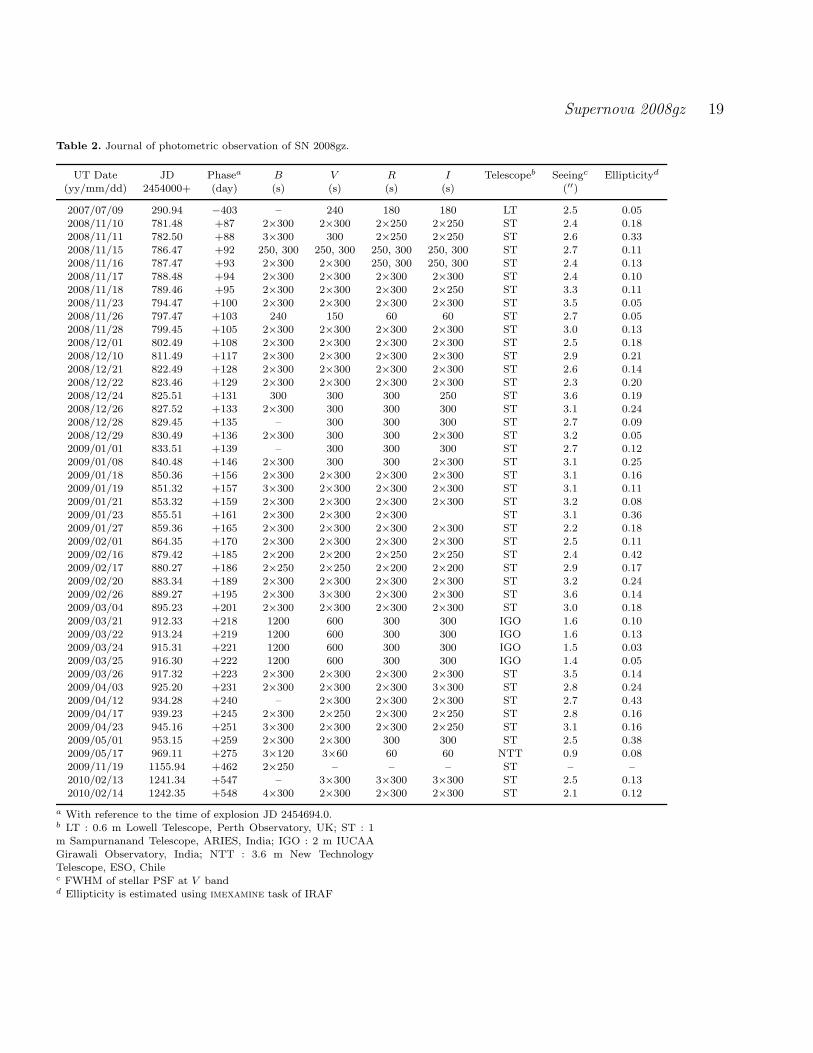
Table 2. Journal of photometric observation of SN 2008gz. The full table is available online. Please see the supporting informationsection for detail.
UT Date JD Phase B V R I Telescope Seeing Ellipticity(yy/mm/dd) 2454000+ (day) (s) (s) (s) (s) (′′)
2007/07/09 290.94 −403 – 240 180 180 LT 2.5 0.052008/11/10 781.48 +87 2×300 2×300 2×250 2×250 ST 2.4 0.18
− − − − − − − − − −
Figure 2. Template subtraction for SN 2008gz. V-band image from 10 December 2008 (+ 117 d) with SN is shown in leftmost panel,the template frame from 14 February 2010 (+ 548 d) without SN is shown in middle, while the rightmost panel shows the templatesubtracted image. All the images are around 3× 4.5 arcmin. North is up and East is to left.
time and aperture. A typical scatter in the photometric so-lutions to the Landolt standard stars is found to be ∼ 0.03mag for BVRI . Table 3 lists the calibrated magnitudes fora set of ten stable secondary standards in the SN field, whilecalibrated BVRImagnitudes of SN 2008gz are presented inTable 4. For SN, we quote ISIS derived errors (1σ uncer-tainty), which is consistent with the RMS scatter in themagnitude of standard stars determined from night-to-nightrepeatability over entire period (∼ 215d) of SN monitoring.Large errors in 2m IGO and 3.6m NTT data arises due tomismatch in the PSF and pixel scale.
2.2 Optical light curve
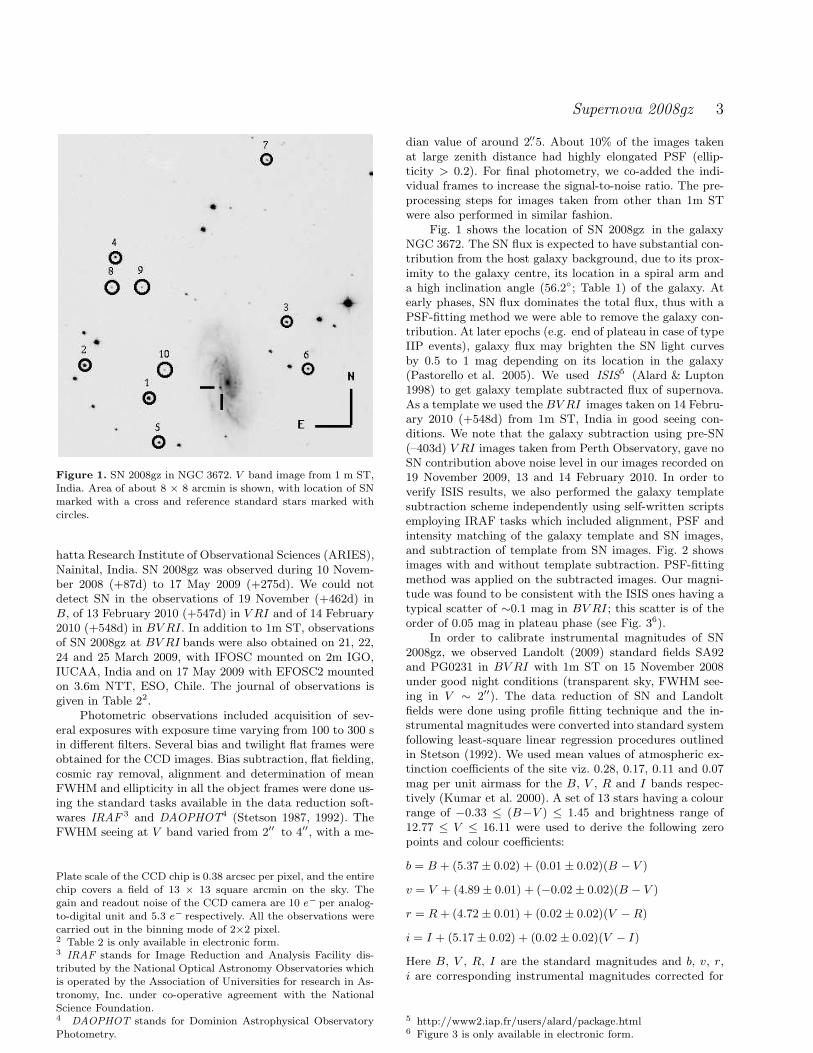
Fig. 4 shows BV RI light curves of SN 2008gz rangingfrom +87d to +275d since the time of explosion. Wealso present the light curves of other well studied nearby(D < 12Mpc) type IIP SNe viz. 2004et (Sahu et al. 2006;Misra et al. 2007), 1999em (Elmhamdi et al. 2003a) and1999gi (Leonard et al. 2002), scaled in time and magnitudeto match the transition between plateau to nebular phases.It is seen that SN 2008gz was detected close to the end ofits plateau phase and its light curve resembles well withthe above three template IIP events and hence we coulddetermine (and adopt) the time of inflection (plateau tonebular), ti of 115 ± 5 d, by adjusting the template lightcurves to get the best match to SN 2008gz data points.This derived plateau duration is typical for type II P events(Elmhamdi et al. 2003b) and it is also consistent with thefact that SN 2008gz was not visible around three monthsbefore the discovery date (November 5.83, 2008) at the levelof unfiltered magnitude of 19.0 (Nakano & Martin 2008).
Figure 4. Light curve in BV RI magnitudes of SN 2008gz. Thelight curves are shifted for clarity, while for other SNe, they arescaled in magnitude and time to match with SN 2008gz.
Further, similarities between bolometric tail luminosity ofSN 2008gz (see §7) with that of SN 2004et and SN 1999emindicates that probably explosion happened about 82 daysbefore the discovery date. Analysis of first spectrum of SN2008gz (see §3.2) also revealed few similarities between the
Supernova 2008gz 5
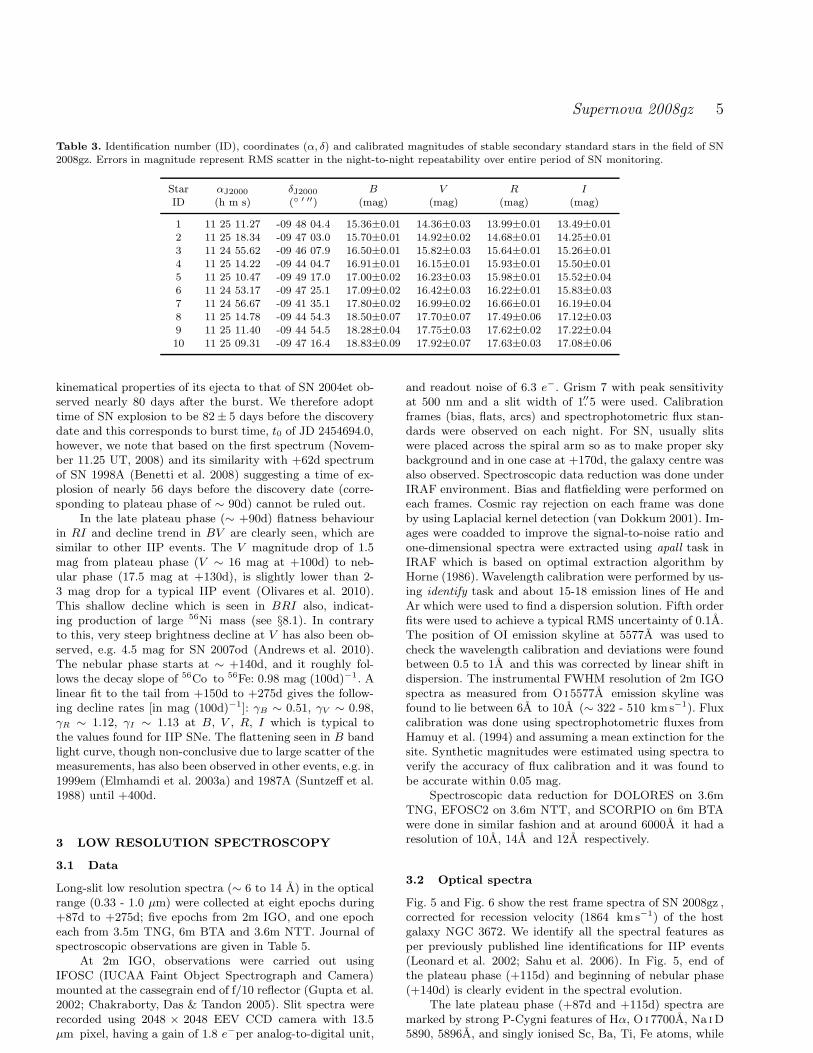
Table 3. Identification number (ID), coordinates (α, δ) and calibrated magnitudes of stable secondary standard stars in the field of SN2008gz. Errors in magnitude represent RMS scatter in the night-to-night repeatability over entire period of SN monitoring.
Star αJ2000 δJ2000 B V R I
ID (h m s) ( ′ ′′) (mag) (mag) (mag) (mag)
1 11 25 11.27 -09 48 04.4 15.36±0.01 14.36±0.03 13.99±0.01 13.49±0.012 11 25 18.34 -09 47 03.0 15.70±0.01 14.92±0.02 14.68±0.01 14.25±0.013 11 24 55.62 -09 46 07.9 16.50±0.01 15.82±0.03 15.64±0.01 15.26±0.014 11 25 14.22 -09 44 04.7 16.91±0.01 16.15±0.01 15.93±0.01 15.50±0.015 11 25 10.47 -09 49 17.0 17.00±0.02 16.23±0.03 15.98±0.01 15.52±0.046 11 24 53.17 -09 47 25.1 17.09±0.02 16.42±0.03 16.22±0.01 15.83±0.037 11 24 56.67 -09 41 35.1 17.80±0.02 16.99±0.02 16.66±0.01 16.19±0.048 11 25 14.78 -09 44 54.3 18.50±0.07 17.70±0.07 17.49±0.06 17.12±0.039 11 25 11.40 -09 44 54.5 18.28±0.04 17.75±0.03 17.62±0.02 17.22±0.0410 11 25 09.31 -09 47 16.4 18.83±0.09 17.92±0.07 17.63±0.03 17.08±0.06
kinematical properties of its ejecta to that of SN 2004et ob-served nearly 80 days after the burst. We therefore adopttime of SN explosion to be 82± 5 days before the discoverydate and this corresponds to burst time, t0 of JD 2454694.0,however, we note that based on the first spectrum (Novem-ber 11.25 UT, 2008) and its similarity with +62d spectrumof SN 1998A (Benetti et al. 2008) suggesting a time of ex-plosion of nearly 56 days before the discovery date (corre-sponding to plateau phase of ∼ 90d) cannot be ruled out.
In the late plateau phase (∼ +90d) flatness behaviourin RI and decline trend in BV are clearly seen, which aresimilar to other IIP events. The V magnitude drop of 1.5mag from plateau phase (V ∼ 16 mag at +100d) to neb-ular phase (17.5 mag at +130d), is slightly lower than 2-3 mag drop for a typical IIP event (Olivares et al. 2010).This shallow decline which is seen in BRI also, indicat-ing production of large 56Ni mass (see §8.1). In contraryto this, very steep brightness decline at V has also been ob-served, e.g. 4.5 mag for SN 2007od (Andrews et al. 2010).The nebular phase starts at ∼ +140d, and it roughly fol-lows the decay slope of 56Co to 56Fe: 0.98 mag (100d)−1. Alinear fit to the tail from +150d to +275d gives the follow-ing decline rates [in mag (100d)−1]: γB ∼ 0.51, γV ∼ 0.98,γR ∼ 1.12, γI ∼ 1.13 at B, V , R, I which is typical tothe values found for IIP SNe. The flattening seen in B bandlight curve, though non-conclusive due to large scatter of themeasurements, has also been observed in other events, e.g. in1999em (Elmhamdi et al. 2003a) and 1987A (Suntzeff et al.1988) until +400d.
3 LOW RESOLUTION SPECTROSCOPY
3.1 Data
Long-slit low resolution spectra (∼ 6 to 14 A) in the opticalrange (0.33 - 1.0 µm) were collected at eight epochs during+87d to +275d; five epochs from 2m IGO, and one epocheach from 3.5m TNG, 6m BTA and 3.6m NTT. Journal ofspectroscopic observations are given in Table 5.
At 2m IGO, observations were carried out usingIFOSC (IUCAA Faint Object Spectrograph and Camera)mounted at the cassegrain end of f/10 reflector (Gupta et al.2002; Chakraborty, Das & Tandon 2005). Slit spectra wererecorded using 2048 × 2048 EEV CCD camera with 13.5µm pixel, having a gain of 1.8 e−per analog-to-digital unit,
and readout noise of 6.3 e−. Grism 7 with peak sensitivityat 500 nm and a slit width of 1.′′5 were used. Calibrationframes (bias, flats, arcs) and spectrophotometric flux stan-dards were observed on each night. For SN, usually slitswere placed across the spiral arm so as to make proper skybackground and in one case at +170d, the galaxy centre wasalso observed. Spectroscopic data reduction was done underIRAF environment. Bias and flatfielding were performed oneach frames. Cosmic ray rejection on each frame was doneby using Laplacial kernel detection (van Dokkum 2001). Im-ages were coadded to improve the signal-to-noise ratio andone-dimensional spectra were extracted using apall task inIRAF which is based on optimal extraction algorithm byHorne (1986). Wavelength calibration were performed by us-ing identify task and about 15-18 emission lines of He andAr which were used to find a dispersion solution. Fifth orderfits were used to achieve a typical RMS uncertainty of 0.1A.The position of OI emission skyline at 5577A was used tocheck the wavelength calibration and deviations were foundbetween 0.5 to 1A and this was corrected by linear shift indispersion. The instrumental FWHM resolution of 2m IGOspectra as measured from O i 5577A emission skyline wasfound to lie between 6A to 10A (∼ 322 - 510 kms−1). Fluxcalibration was done using spectrophotometric fluxes fromHamuy et al. (1994) and assuming a mean extinction for thesite. Synthetic magnitudes were estimated using spectra toverify the accuracy of flux calibration and it was found tobe accurate within 0.05 mag.
Spectroscopic data reduction for DOLORES on 3.6mTNG, EFOSC2 on 3.6m NTT, and SCORPIO on 6m BTAwere done in similar fashion and at around 6000A it had aresolution of 10A, 14A and 12A respectively.
3.2 Optical spectra
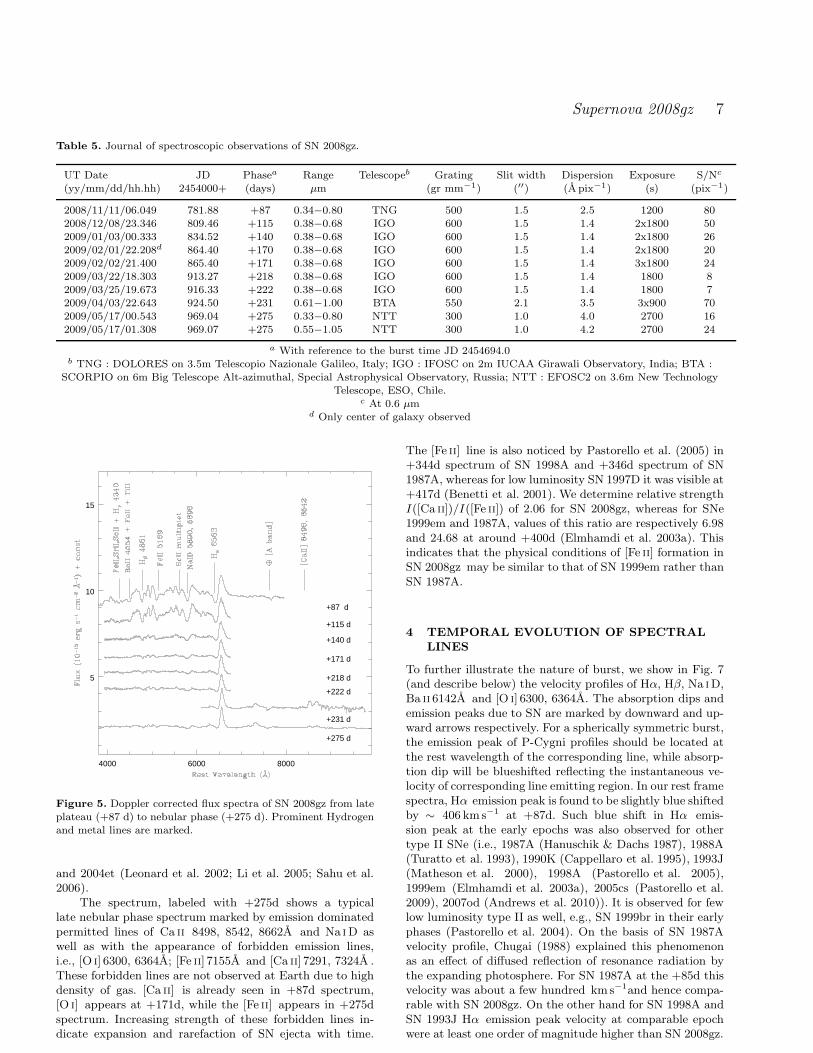
Fig. 5 and Fig. 6 show the rest frame spectra of SN 2008gz ,corrected for recession velocity (1864 kms−1) of the hostgalaxy NGC 3672. We identify all the spectral features asper previously published line identifications for IIP events(Leonard et al. 2002; Sahu et al. 2006). In Fig. 5, end ofthe plateau phase (+115d) and beginning of nebular phase(+140d) is clearly evident in the spectral evolution.
The late plateau phase (+87d and +115d) spectra aremarked by strong P-Cygni features of Hα, O i 7700A, Na iD5890, 5896A, and singly ionised Sc, Ba, Ti, Fe atoms, while
6 Roy et al.
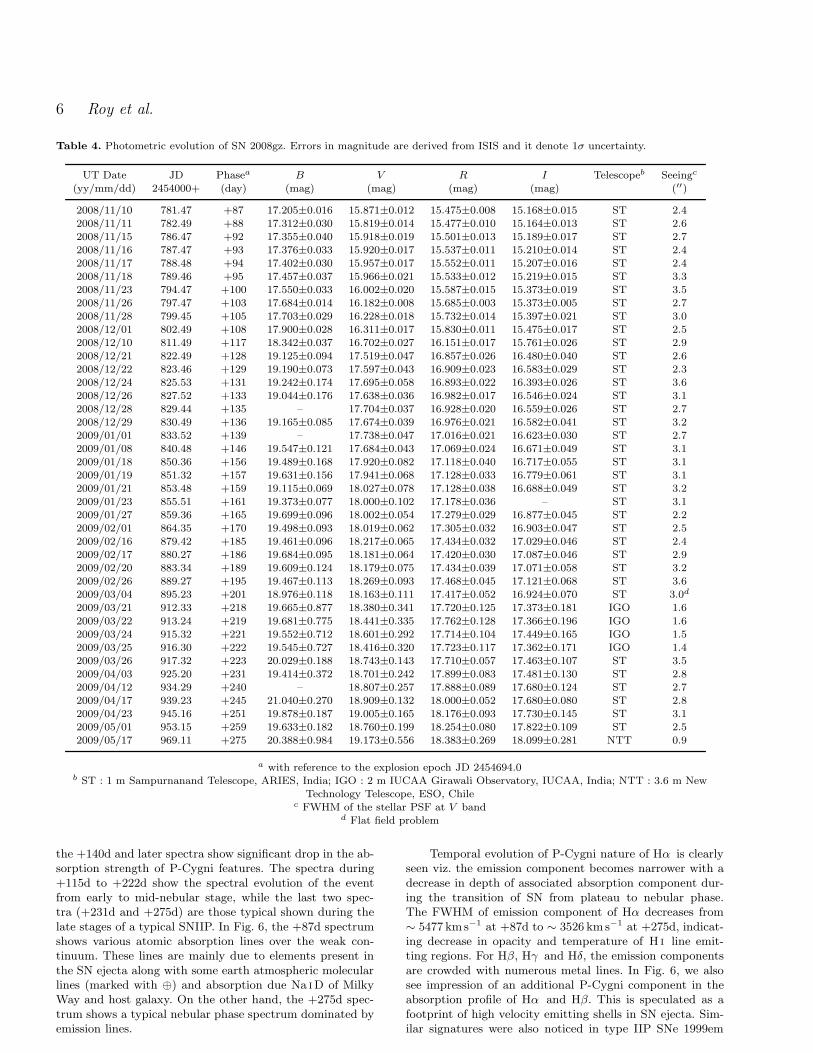
Table 4. Photometric evolution of SN 2008gz. Errors in magnitude are derived from ISIS and it denote 1σ uncertainty.
UT Date JD Phasea B V R I Telescopeb Seeingc
(yy/mm/dd) 2454000+ (day) (mag) (mag) (mag) (mag) (′′)
2008/11/10 781.47 +87 17.205±0.016 15.871±0.012 15.475±0.008 15.168±0.015 ST 2.42008/11/11 782.49 +88 17.312±0.030 15.819±0.014 15.477±0.010 15.164±0.013 ST 2.62008/11/15 786.47 +92 17.355±0.040 15.918±0.019 15.501±0.013 15.189±0.017 ST 2.72008/11/16 787.47 +93 17.376±0.033 15.920±0.017 15.537±0.011 15.210±0.014 ST 2.42008/11/17 788.48 +94 17.402±0.030 15.957±0.017 15.552±0.011 15.207±0.016 ST 2.42008/11/18 789.46 +95 17.457±0.037 15.966±0.021 15.533±0.012 15.219±0.015 ST 3.32008/11/23 794.47 +100 17.550±0.033 16.002±0.020 15.587±0.015 15.373±0.019 ST 3.52008/11/26 797.47 +103 17.684±0.014 16.182±0.008 15.685±0.003 15.373±0.005 ST 2.72008/11/28 799.45 +105 17.703±0.029 16.228±0.018 15.732±0.014 15.397±0.021 ST 3.02008/12/01 802.49 +108 17.900±0.028 16.311±0.017 15.830±0.011 15.475±0.017 ST 2.52008/12/10 811.49 +117 18.342±0.037 16.702±0.027 16.151±0.017 15.761±0.026 ST 2.92008/12/21 822.49 +128 19.125±0.094 17.519±0.047 16.857±0.026 16.480±0.040 ST 2.62008/12/22 823.46 +129 19.190±0.073 17.597±0.043 16.909±0.023 16.583±0.029 ST 2.32008/12/24 825.53 +131 19.242±0.174 17.695±0.058 16.893±0.022 16.393±0.026 ST 3.62008/12/26 827.52 +133 19.044±0.176 17.638±0.036 16.982±0.017 16.546±0.024 ST 3.12008/12/28 829.44 +135 – 17.704±0.037 16.928±0.020 16.559±0.026 ST 2.72008/12/29 830.49 +136 19.165±0.085 17.674±0.039 16.976±0.021 16.582±0.041 ST 3.22009/01/01 833.52 +139 – 17.738±0.047 17.016±0.021 16.623±0.030 ST 2.72009/01/08 840.48 +146 19.547±0.121 17.684±0.043 17.069±0.024 16.671±0.049 ST 3.12009/01/18 850.36 +156 19.489±0.168 17.920±0.082 17.118±0.040 16.717±0.055 ST 3.12009/01/19 851.32 +157 19.631±0.156 17.941±0.068 17.128±0.033 16.779±0.061 ST 3.12009/01/21 853.48 +159 19.115±0.069 18.027±0.078 17.128±0.038 16.688±0.049 ST 3.22009/01/23 855.51 +161 19.373±0.077 18.000±0.102 17.178±0.036 – ST 3.12009/01/27 859.36 +165 19.699±0.096 18.002±0.054 17.279±0.029 16.877±0.045 ST 2.22009/02/01 864.35 +170 19.498±0.093 18.019±0.062 17.305±0.032 16.903±0.047 ST 2.52009/02/16 879.42 +185 19.461±0.096 18.217±0.065 17.434±0.032 17.029±0.046 ST 2.42009/02/17 880.27 +186 19.684±0.095 18.181±0.064 17.420±0.030 17.087±0.046 ST 2.92009/02/20 883.34 +189 19.609±0.124 18.179±0.075 17.434±0.039 17.071±0.058 ST 3.22009/02/26 889.27 +195 19.467±0.113 18.269±0.093 17.468±0.045 17.121±0.068 ST 3.62009/03/04 895.23 +201 18.976±0.118 18.163±0.111 17.417±0.052 16.924±0.070 ST 3.0d
2009/03/21 912.33 +218 19.665±0.877 18.380±0.341 17.720±0.125 17.373±0.181 IGO 1.6
2009/03/22 913.24 +219 19.681±0.775 18.441±0.335 17.762±0.128 17.366±0.196 IGO 1.62009/03/24 915.32 +221 19.552±0.712 18.601±0.292 17.714±0.104 17.449±0.165 IGO 1.52009/03/25 916.30 +222 19.545±0.727 18.416±0.320 17.723±0.117 17.362±0.171 IGO 1.42009/03/26 917.32 +223 20.029±0.188 18.743±0.143 17.710±0.057 17.463±0.107 ST 3.52009/04/03 925.20 +231 19.414±0.372 18.701±0.242 17.899±0.083 17.481±0.130 ST 2.82009/04/12 934.29 +240 – 18.807±0.257 17.888±0.089 17.680±0.124 ST 2.72009/04/17 939.23 +245 21.040±0.270 18.909±0.132 18.000±0.052 17.680±0.080 ST 2.82009/04/23 945.16 +251 19.878±0.187 19.005±0.165 18.176±0.093 17.730±0.145 ST 3.12009/05/01 953.15 +259 19.633±0.182 18.760±0.199 18.254±0.080 17.822±0.109 ST 2.52009/05/17 969.11 +275 20.388±0.984 19.173±0.556 18.383±0.269 18.099±0.281 NTT 0.9
a with reference to the explosion epoch JD 2454694.0b ST : 1 m Sampurnanand Telescope, ARIES, India; IGO : 2 m IUCAA Girawali Observatory, IUCAA, India; NTT : 3.6 m New
Technology Telescope, ESO, Chilec FWHM of the stellar PSF at V band
d Flat field problem
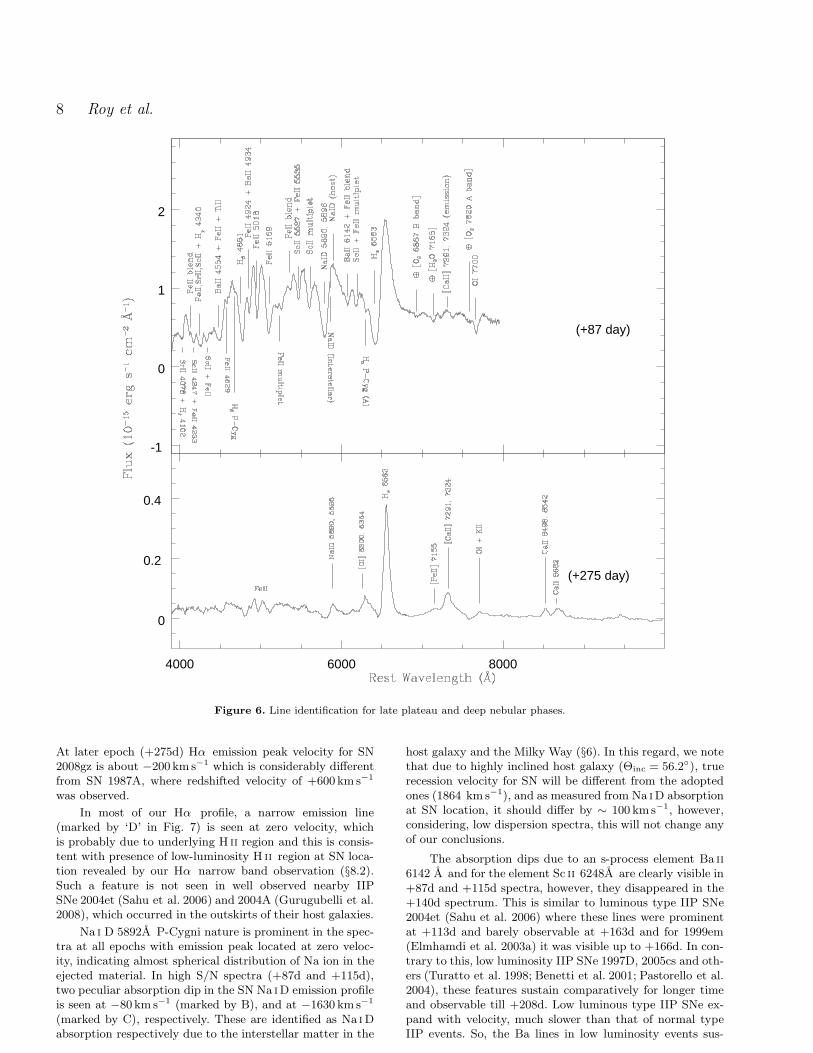
the +140d and later spectra show significant drop in the ab-sorption strength of P-Cygni features. The spectra during+115d to +222d show the spectral evolution of the eventfrom early to mid-nebular stage, while the last two spec-tra (+231d and +275d) are those typical shown during thelate stages of a typical SNIIP. In Fig. 6, the +87d spectrumshows various atomic absorption lines over the weak con-tinuum. These lines are mainly due to elements present inthe SN ejecta along with some earth atmospheric molecularlines (marked with ⊕) and absorption due Na iD of MilkyWay and host galaxy. On the other hand, the +275d spec-trum shows a typical nebular phase spectrum dominated byemission lines.
Temporal evolution of P-Cygni nature of Hα is clearlyseen viz. the emission component becomes narrower with adecrease in depth of associated absorption component dur-ing the transition of SN from plateau to nebular phase.The FWHM of emission component of Hα decreases from∼ 5477 kms−1 at +87d to ∼ 3526 kms−1 at +275d, indicat-ing decrease in opacity and temperature of H i line emit-ting regions. For Hβ, Hγ and Hδ, the emission componentsare crowded with numerous metal lines. In Fig. 6, we alsosee impression of an additional P-Cygni component in theabsorption profile of Hα and Hβ. This is speculated as afootprint of high velocity emitting shells in SN ejecta. Sim-ilar signatures were also noticed in type IIP SNe 1999em
Supernova 2008gz 7
Table 5. Journal of spectroscopic observations of SN 2008gz.
UT Date JD Phasea Range Telescopeb Grating Slit width Dispersion Exposure S/Nc
(yy/mm/dd/hh.hh) 2454000+ (days) µm (gr mm−1) (′′) (A pix−1) (s) (pix−1)
2008/11/11/06.049 781.88 +87 0.34−0.80 TNG 500 1.5 2.5 1200 802008/12/08/23.346 809.46 +115 0.38−0.68 IGO 600 1.5 1.4 2x1800 502009/01/03/00.333 834.52 +140 0.38−0.68 IGO 600 1.5 1.4 2x1800 262009/02/01/22.208d 864.40 +170 0.38−0.68 IGO 600 1.5 1.4 2x1800 202009/02/02/21.400 865.40 +171 0.38−0.68 IGO 600 1.5 1.4 3x1800 242009/03/22/18.303 913.27 +218 0.38−0.68 IGO 600 1.5 1.4 1800 82009/03/25/19.673 916.33 +222 0.38−0.68 IGO 600 1.5 1.4 1800 72009/04/03/22.643 924.50 +231 0.61−1.00 BTA 550 2.1 3.5 3x900 702009/05/17/00.543 969.04 +275 0.33−0.80 NTT 300 1.0 4.0 2700 162009/05/17/01.308 969.07 +275 0.55−1.05 NTT 300 1.0 4.2 2700 24
a With reference to the burst time JD 2454694.0b TNG : DOLORES on 3.5m Telescopio Nazionale Galileo, Italy; IGO : IFOSC on 2m IUCAA Girawali Observatory, India; BTA :
SCORPIO on 6m Big Telescope Alt-azimuthal, Special Astrophysical Observatory, Russia; NTT : EFOSC2 on 3.6m New TechnologyTelescope, ESO, Chile.
c At 0.6 µmd Only center of galaxy observed
4000 6000 8000
5
10
15
+87 d
+115 d
+140 d
+171 d
+218 d
+222 d
+231 d
+275 d
Figure 5. Doppler corrected flux spectra of SN 2008gz from lateplateau (+87 d) to nebular phase (+275 d). Prominent Hydrogenand metal lines are marked.
and 2004et (Leonard et al. 2002; Li et al. 2005; Sahu et al.2006).
The spectrum, labeled with +275d shows a typicallate nebular phase spectrum marked by emission dominatedpermitted lines of Ca ii 8498, 8542, 8662A and Na iD aswell as with the appearance of forbidden emission lines,i.e., [O i] 6300, 6364A; [Fe ii] 7155A and [Ca ii] 7291, 7324A .These forbidden lines are not observed at Earth due to highdensity of gas. [Ca ii] is already seen in +87d spectrum,[O i] appears at +171d, while the [Fe ii] appears in +275dspectrum. Increasing strength of these forbidden lines in-dicate expansion and rarefaction of SN ejecta with time.
The [Fe ii] line is also noticed by Pastorello et al. (2005) in+344d spectrum of SN 1998A and +346d spectrum of SN1987A, whereas for low luminosity SN 1997D it was visible at+417d (Benetti et al. 2001). We determine relative strengthI([Ca ii])/I([Fe ii]) of 2.06 for SN 2008gz, whereas for SNe1999em and 1987A, values of this ratio are respectively 6.98and 24.68 at around +400d (Elmhamdi et al. 2003a). Thisindicates that the physical conditions of [Fe ii] formation inSN 2008gz may be similar to that of SN 1999em rather thanSN 1987A.
4 TEMPORAL EVOLUTION OF SPECTRAL
LINES
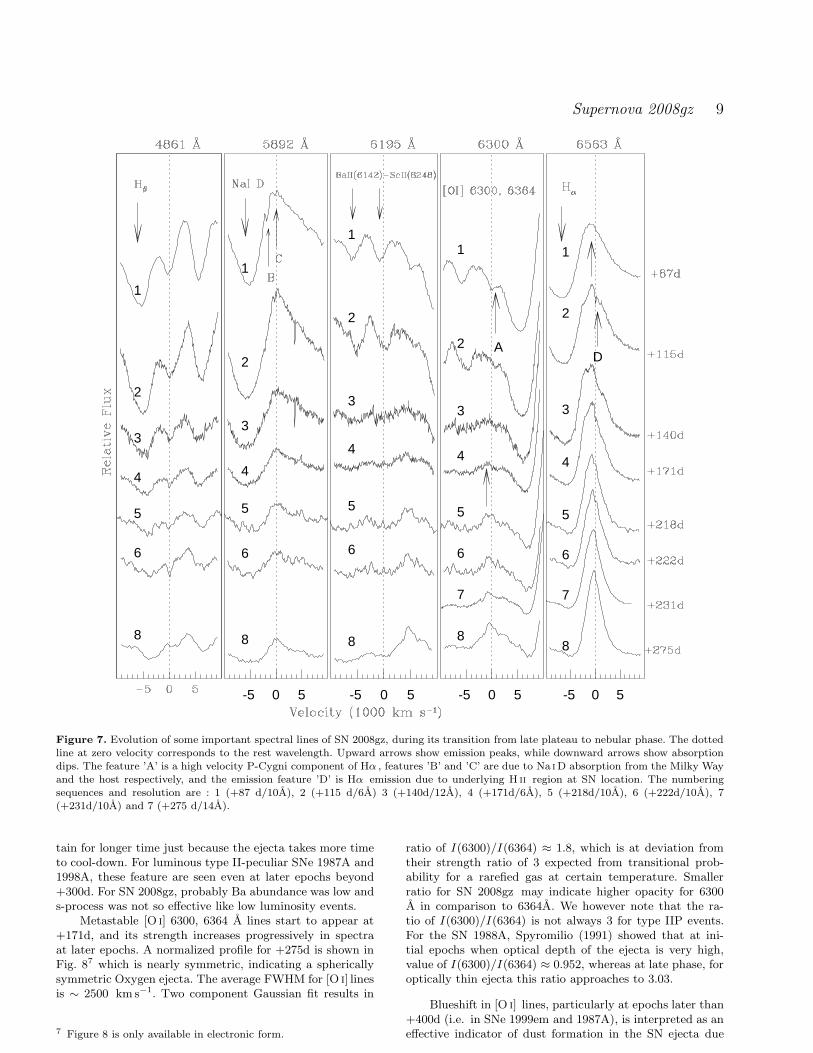
To further illustrate the nature of burst, we show in Fig. 7(and describe below) the velocity profiles of Hα, Hβ, Na iD,Ba ii 6142A and [O i] 6300, 6364A. The absorption dips andemission peaks due to SN are marked by downward and up-ward arrows respectively. For a spherically symmetric burst,the emission peak of P-Cygni profiles should be located atthe rest wavelength of the corresponding line, while absorp-tion dip will be blueshifted reflecting the instantaneous ve-locity of corresponding line emitting region. In our rest framespectra, Hα emission peak is found to be slightly blue shiftedby ∼ 406 kms−1 at +87d. Such blue shift in Hα emis-sion peak at the early epochs was also observed for othertype II SNe (i.e., 1987A (Hanuschik & Dachs 1987), 1988A(Turatto et al. 1993), 1990K (Cappellaro et al. 1995), 1993J(Matheson et al. 2000), 1998A (Pastorello et al. 2005),1999em (Elmhamdi et al. 2003a), 2005cs (Pastorello et al.2009), 2007od (Andrews et al. 2010)). It is observed for fewlow luminosity type II as well, e.g., SN 1999br in their earlyphases (Pastorello et al. 2004). On the basis of SN 1987Avelocity profile, Chugai (1988) explained this phenomenonas an effect of diffused reflection of resonance radiation bythe expanding photosphere. For SN 1987A at the +85d thisvelocity was about a few hundred kms−1and hence compa-rable with SN 2008gz. On the other hand for SN 1998A andSN 1993J Hα emission peak velocity at comparable epochwere at least one order of magnitude higher than SN 2008gz.
8 Roy et al.
4000 6000 8000
0
0.2
0.4
(+275 day)
-1
0
1
2
(+87 day)
Figure 6. Line identification for late plateau and deep nebular phases.
At later epoch (+275d) Hα emission peak velocity for SN2008gz is about −200 km s−1 which is considerably differentfrom SN 1987A, where redshifted velocity of +600 km s−1
was observed.
In most of our Hα profile, a narrow emission line(marked by ‘D’ in Fig. 7) is seen at zero velocity, whichis probably due to underlying H ii region and this is consis-tent with presence of low-luminosity H ii region at SN loca-tion revealed by our Hα narrow band observation (§8.2).Such a feature is not seen in well observed nearby IIPSNe 2004et (Sahu et al. 2006) and 2004A (Gurugubelli et al.2008), which occurred in the outskirts of their host galaxies.
Na i D 5892A P-Cygni nature is prominent in the spec-tra at all epochs with emission peak located at zero veloc-ity, indicating almost spherical distribution of Na ion in theejected material. In high S/N spectra (+87d and +115d),two peculiar absorption dip in the SN Na iD emission profileis seen at −80 km s−1 (marked by B), and at −1630 km s−1
(marked by C), respectively. These are identified as Na iDabsorption respectively due to the interstellar matter in the
host galaxy and the Milky Way (§6). In this regard, we notethat due to highly inclined host galaxy (Θinc = 56.2), truerecession velocity for SN will be different from the adoptedones (1864 km s−1), and as measured from Na iD absorptionat SN location, it should differ by ∼ 100 kms−1, however,considering, low dispersion spectra, this will not change anyof our conclusions.
The absorption dips due to an s-process element Ba ii6142 A and for the element Sc ii 6248A are clearly visible in+87d and +115d spectra, however, they disappeared in the+140d spectrum. This is similar to luminous type IIP SNe2004et (Sahu et al. 2006) where these lines were prominentat +113d and barely observable at +163d and for 1999em(Elmhamdi et al. 2003a) it was visible up to +166d. In con-trary to this, low luminosity IIP SNe 1997D, 2005cs and oth-ers (Turatto et al. 1998; Benetti et al. 2001; Pastorello et al.2004), these features sustain comparatively for longer timeand observable till +208d. Low luminous type IIP SNe ex-pand with velocity, much slower than that of normal typeIIP events. So, the Ba lines in low luminosity events sus-
Supernova 2008gz 9
1
2
3
4
5
6
8
-5 0 5
1
2
3
4
5
6
8
-5 0 5
1
2
3
4
5
6
8
-5 0 5
A
1
2
3
4
5
6
7
8
-5 0 5
D
1
2
3
4
5
6
7
8
Figure 7. Evolution of some important spectral lines of SN 2008gz, during its transition from late plateau to nebular phase. The dottedline at zero velocity corresponds to the rest wavelength. Upward arrows show emission peaks, while downward arrows show absorptiondips. The feature ’A’ is a high velocity P-Cygni component of Hα , features ’B’ and ’C’ are due to Na iD absorption from the Milky Wayand the host respectively, and the emission feature ’D’ is Hα emission due to underlying H ii region at SN location. The numberingsequences and resolution are : 1 (+87 d/10A), 2 (+115 d/6A) 3 (+140d/12A), 4 (+171d/6A), 5 (+218d/10A), 6 (+222d/10A), 7(+231d/10A) and 7 (+275 d/14A).
tain for longer time just because the ejecta takes more timeto cool-down. For luminous type II-peculiar SNe 1987A and1998A, these feature are seen even at later epochs beyond+300d. For SN 2008gz, probably Ba abundance was low ands-process was not so effective like low luminosity events.
Metastable [O i] 6300, 6364 A lines start to appear at+171d, and its strength increases progressively in spectraat later epochs. A normalized profile for +275d is shown inFig. 87 which is nearly symmetric, indicating a sphericallysymmetric Oxygen ejecta. The average FWHM for [O i] linesis ∼ 2500 km s−1. Two component Gaussian fit results in
7 Figure 8 is only available in electronic form.
ratio of I(6300)/I(6364) ≈ 1.8, which is at deviation fromtheir strength ratio of 3 expected from transitional prob-ability for a rarefied gas at certain temperature. Smallerratio for SN 2008gz may indicate higher opacity for 6300A in comparison to 6364A. We however note that the ra-tio of I(6300)/I(6364) is not always 3 for type IIP events.For the SN 1988A, Spyromilio (1991) showed that at ini-tial epochs when optical depth of the ejecta is very high,value of I(6300)/I(6364) ≈ 0.952, whereas at late phase, foroptically thin ejecta this ratio approaches to 3.03.
Blueshift in [O i] lines, particularly at epochs later than+400d (i.e. in SNe 1999em and 1987A), is interpreted as aneffective indicator of dust formation in the SN ejecta due
10 Roy et al.
to excessive extinction of redshifted wings of emission linesthan the blueshifted ones (Lucy et al. 1991; Danziger et al.1991). Between +300-400d, the observed blueshift in oxy-gen may be due to contamination from the Fe ii mutli-plet at 6250A. The reason of the blue-shift of the oxy-gen line at early epochs (<∼ 200 day) is still not clearand several hypothesis have been done. In a recent workTaubenberger et al. (2009) described this as a result of resid-ual opacity that remains in the inner ejecta. This seems to bethe most likely explanation for observed blue-shift of oxygenline. Dust formation at an early epoch ∼ +300d is also re-ported for SN 2004et. For SN 2008gz we estimate a blueshiftof ∼ 250 kms−1, in [O i] components at epoch of +275d (seeFig. 5 and 8), however due to absence of any other evidence,this is not enough to claim dust formation in the SN 2008gzejecta.
5 PHOTOSPHERIC AND H-ENVELOPE
VELOCITIES OF EJECTA
We used multi-parametric resonance scattering codeSYNOW (Branch, Baron & Jeffery 2001; Branch et al.2002; Baron 2005) for modelling the spectra of SN2008gzto iterpret spectral features and estimate velocities of lay-ers at different epochs. The algorithm works on the as-sumptions of spherical symmetry; homologous expansion oflayers (v ∼ r); sharp photosphere producing a black-bodyspectrum and associated at early stages with a shock wave.In photospheric phase, the spectral lines are formed by theshell above the thick photosphere, but in nebular phase allvisible regions are optically thin (Branch, Baron & Jeffery2001). Each of these two phases of SN evolution can be ex-plained with individual approximations and the modellingof observed spectra needed in different synthetic codes.
Our main aim in modeling the spectral features is toestimate the velocities of the layers and that of pseudo-photosphere. It was also noted in Branch, Baron and Jeery(2001) there is no sharp division between the photosphereand the nebular phases. We note the presence of absorptioncomponents in Iron and Hydrogen lines at the latest spectra,which can be explained as a result of the decreasing reso-nance scattering mechanism. Although the resonance scat-tering codes like SYNOW are not used for describing latetime spectra (see for ex. Elmhamdi et al., 2006), we use it todescribe only the absorption parts of line profiles. It is notour intention to fit the emission part of the line profiles be-cause this procedure needs to make use of other assumptionsand other codes.
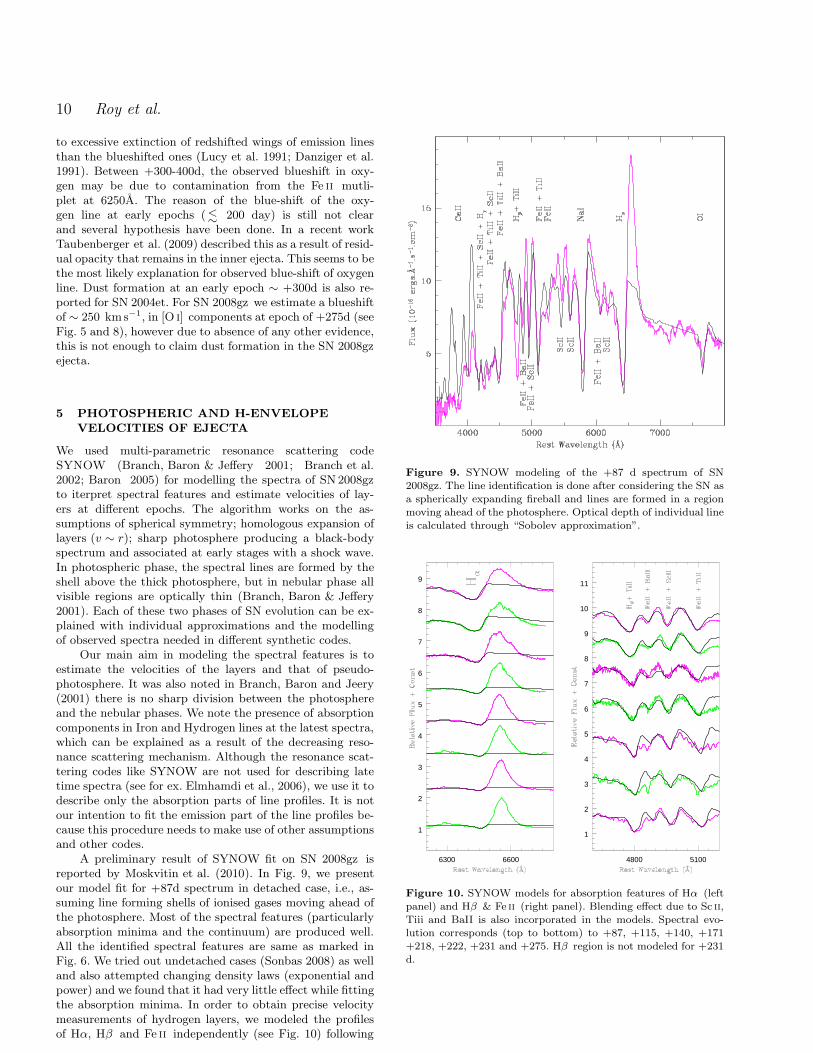
A preliminary result of SYNOW fit on SN 2008gz isreported by Moskvitin et al. (2010). In Fig. 9, we presentour model fit for +87d spectrum in detached case, i.e., as-suming line forming shells of ionised gases moving ahead ofthe photosphere. Most of the spectral features (particularlyabsorption minima and the continuum) are produced well.All the identified spectral features are same as marked inFig. 6. We tried out undetached cases (Sonbas 2008) as welland also attempted changing density laws (exponential andpower) and we found that it had very little effect while fittingthe absorption minima. In order to obtain precise velocitymeasurements of hydrogen layers, we modeled the profilesof Hα, Hβ and Fe ii independently (see Fig. 10) following
Figure 9. SYNOW modeling of the +87 d spectrum of SN2008gz. The line identification is done after considering the SN asa spherically expanding fireball and lines are formed in a regionmoving ahead of the photosphere. Optical depth of individual lineis calculated through “Sobolev approximation”.
6300 6600
1
2
3
4
5
6
7
8
9
4800 5100
1
2
3
4
5
6
7
8
9
10
11
Figure 10. SYNOW models for absorption features of Hα (leftpanel) and Hβ & Fe ii (right panel). Blending effect due to Sc ii,Tiii and BaII is also incorporated in the models. Spectral evo-lution corresponds (top to bottom) to +87, +115, +140, +171+218, +222, +231 and +275. Hβ region is not modeled for +231d.
Supernova 2008gz 11
Table 6. Velocities of photosphere, Hα and Hβ for different epochs of SN 2008gz evolution. All the parameters are derived fromSYNOW modelling.
UT Date Phase vph = v(Fe ii) ve(Fe ii) v(Hα) ve(Hα) v(Hβ) ve(Hβ)(yy/mm/dd/) (days) km s−1 km s−1 kms−1 km s−1 km s−1 km s−1
2008/11/11 +87 4200± 400 1000± 400 5500 ± 200 2100 ± 300 4300 ± 300 1300 ± 100
2008/12/08 +115 3200± 400 1500± 500 4700 ± 300 1500 ± 200 3800 ± 600 900+300−100
2009/01/03 +140 4000± 400 2500 ± 1100 5300 ± 400 1300 ± 300 4000 ± 400 1000 ± 2002009/02/02 +171 3500± 300 1600± 800 5100 ± 200 1300 ± 200 3500 ± 300 1000 ± 200
2009/03/22 +218 3100± 500 1700± 900 4800 ± 400 1500 ± 500 3700 ± 300 1600+400−800
2009/03/25 +222 3100± 700 1200± 800 4900+700−300
1100+300−500
3100 ± 700 2000 ± 1000
2009/04/03 +231 < 5400 — 4800+600−200 1600+200
−600 — —
2009/05/17 +275 2000+200−100 1500± 500 3800 ± 200 600± 200 2000 ± 100 600+600
−200
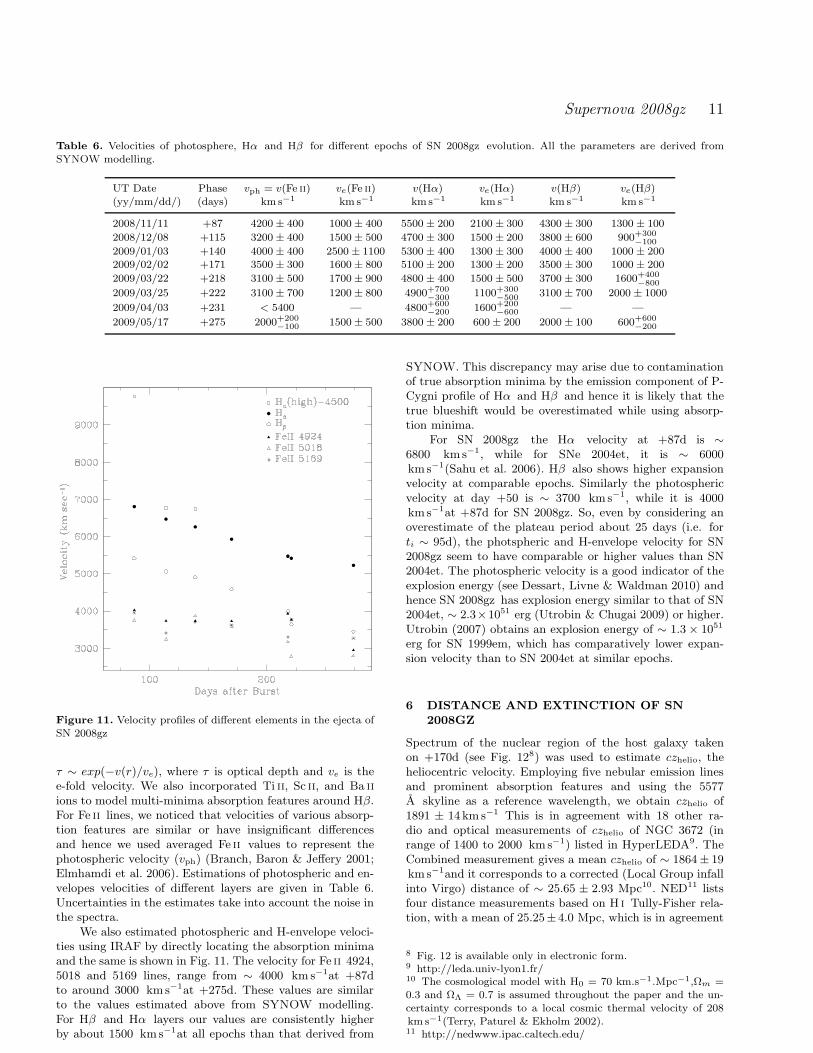
Figure 11. Velocity profiles of different elements in the ejecta ofSN 2008gz
τ ∼ exp(−v(r)/ve), where τ is optical depth and ve is thee-fold velocity. We also incorporated Ti ii, Sc ii, and Ba iiions to model multi-minima absorption features around Hβ.For Fe ii lines, we noticed that velocities of various absorp-tion features are similar or have insignificant differencesand hence we used averaged Fe ii values to represent thephotospheric velocity (vph) (Branch, Baron & Jeffery 2001;Elmhamdi et al. 2006). Estimations of photospheric and en-velopes velocities of different layers are given in Table 6.Uncertainties in the estimates take into account the noise inthe spectra.
We also estimated photospheric and H-envelope veloci-ties using IRAF by directly locating the absorption minimaand the same is shown in Fig. 11. The velocity for Fe ii 4924,5018 and 5169 lines, range from ∼ 4000 km s−1at +87dto around 3000 kms−1at +275d. These values are similarto the values estimated above from SYNOW modelling.For Hβ and Hα layers our values are consistently higherby about 1500 kms−1at all epochs than that derived from
SYNOW. This discrepancy may arise due to contaminationof true absorption minima by the emission component of P-Cygni profile of Hα and Hβ and hence it is likely that thetrue blueshift would be overestimated while using absorp-tion minima.
For SN 2008gz the Hα velocity at +87d is ∼
6800 kms−1, while for SNe 2004et, it is ∼ 6000kms−1(Sahu et al. 2006). Hβ also shows higher expansionvelocity at comparable epochs. Similarly the photosphericvelocity at day +50 is ∼ 3700 kms−1, while it is 4000kms−1at +87d for SN 2008gz. So, even by considering anoverestimate of the plateau period about 25 days (i.e. forti ∼ 95d), the photspheric and H-envelope velocity for SN2008gz seem to have comparable or higher values than SN2004et. The photospheric velocity is a good indicator of theexplosion energy (see Dessart, Livne & Waldman 2010) andhence SN 2008gz has explosion energy similar to that of SN2004et, ∼ 2.3×1051 erg (Utrobin & Chugai 2009) or higher.Utrobin (2007) obtains an explosion energy of ∼ 1.3× 1051
erg for SN 1999em, which has comparatively lower expan-sion velocity than to SN 2004et at similar epochs.
6 DISTANCE AND EXTINCTION OF SN
2008GZ
Spectrum of the nuclear region of the host galaxy takenon +170d (see Fig. 128) was used to estimate czhelio, theheliocentric velocity. Employing five nebular emission linesand prominent absorption features and using the 5577A skyline as a reference wavelength, we obtain czhelio of1891 ± 14 km s−1 This is in agreement with 18 other ra-dio and optical measurements of czhelio of NGC 3672 (inrange of 1400 to 2000 kms−1) listed in HyperLEDA9. TheCombined measurement gives a mean czhelio of ∼ 1864± 19kms−1and it corresponds to a corrected (Local Group infallinto Virgo) distance of ∼ 25.65 ± 2.93 Mpc10. NED11 listsfour distance measurements based on H i Tully-Fisher rela-tion, with a mean of 25.25± 4.0 Mpc, which is in agreement
8 Fig. 12 is available only in electronic form.9 http://leda.univ-lyon1.fr/10 The cosmological model with H0 = 70 km.s−1.Mpc−1,Ωm =0.3 and ΩΛ = 0.7 is assumed throughout the paper and the un-certainty corresponds to a local cosmic thermal velocity of 208km s−1(Terry, Paturel & Ekholm 2002).11 http://nedwww.ipac.caltech.edu/
12 Roy et al.
5800 6000
9
10
+87 d
+115 d
Nuclear spectra
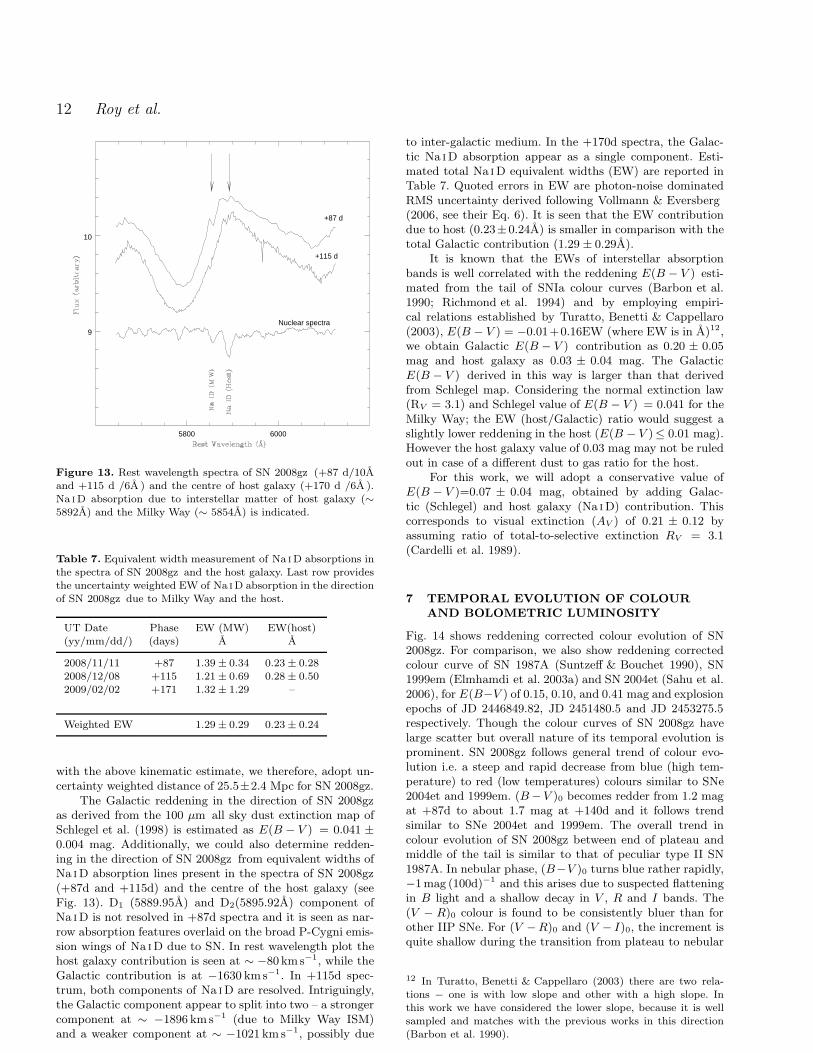
Figure 13. Rest wavelength spectra of SN 2008gz (+87 d/10Aand +115 d /6A ) and the centre of host galaxy (+170 d /6A ).Na iD absorption due to interstellar matter of host galaxy (∼5892A) and the Milky Way (∼ 5854A) is indicated.
Table 7. Equivalent width measurement of Na iD absorptions inthe spectra of SN 2008gz and the host galaxy. Last row providesthe uncertainty weighted EW of Na iD absorption in the directionof SN 2008gz due to Milky Way and the host.
UT Date Phase EW (MW) EW(host)(yy/mm/dd/) (days) A A
2008/11/11 +87 1.39± 0.34 0.23± 0.282008/12/08 +115 1.21± 0.69 0.28± 0.502009/02/02 +171 1.32± 1.29 –
Weighted EW 1.29± 0.29 0.23± 0.24
with the above kinematic estimate, we therefore, adopt un-certainty weighted distance of 25.5±2.4 Mpc for SN 2008gz.
The Galactic reddening in the direction of SN 2008gzas derived from the 100 µm all sky dust extinction map ofSchlegel et al. (1998) is estimated as E(B − V ) = 0.041 ±
0.004 mag. Additionally, we could also determine redden-ing in the direction of SN 2008gz from equivalent widths ofNa iD absorption lines present in the spectra of SN 2008gz(+87d and +115d) and the centre of the host galaxy (seeFig. 13). D1 (5889.95A) and D2(5895.92A) component ofNa iD is not resolved in +87d spectra and it is seen as nar-row absorption features overlaid on the broad P-Cygni emis-sion wings of Na iD due to SN. In rest wavelength plot thehost galaxy contribution is seen at ∼ −80 kms−1, while theGalactic contribution is at −1630 kms−1. In +115d spec-trum, both components of Na iD are resolved. Intriguingly,the Galactic component appear to split into two – a strongercomponent at ∼ −1896 kms−1 (due to Milky Way ISM)and a weaker component at ∼ −1021 km s−1, possibly due
to inter-galactic medium. In the +170d spectra, the Galac-tic Na iD absorption appear as a single component. Esti-mated total Na iD equivalent widths (EW) are reported inTable 7. Quoted errors in EW are photon-noise dominatedRMS uncertainty derived following Vollmann & Eversberg(2006, see their Eq. 6). It is seen that the EW contributiondue to host (0.23±0.24A) is smaller in comparison with thetotal Galactic contribution (1.29 ± 0.29A).
It is known that the EWs of interstellar absorptionbands is well correlated with the reddening E(B − V ) esti-mated from the tail of SNIa colour curves (Barbon et al.1990; Richmond et al. 1994) and by employing empiri-cal relations established by Turatto, Benetti & Cappellaro(2003), E(B − V ) = −0.01+0.16EW (where EW is in A)12,we obtain Galactic E(B − V ) contribution as 0.20 ± 0.05mag and host galaxy as 0.03 ± 0.04 mag. The GalacticE(B − V ) derived in this way is larger than that derivedfrom Schlegel map. Considering the normal extinction law(RV = 3.1) and Schlegel value of E(B − V ) = 0.041 for theMilky Way; the EW (host/Galactic) ratio would suggest aslightly lower reddening in the host (E(B − V )≤ 0.01 mag).However the host galaxy value of 0.03 mag may not be ruledout in case of a different dust to gas ratio for the host.
For this work, we will adopt a conservative value ofE(B − V )=0.07 ± 0.04 mag, obtained by adding Galac-tic (Schlegel) and host galaxy (Na iD) contribution. Thiscorresponds to visual extinction (AV ) of 0.21 ± 0.12 byassuming ratio of total-to-selective extinction RV = 3.1(Cardelli et al. 1989).
7 TEMPORAL EVOLUTION OF COLOUR
AND BOLOMETRIC LUMINOSITY
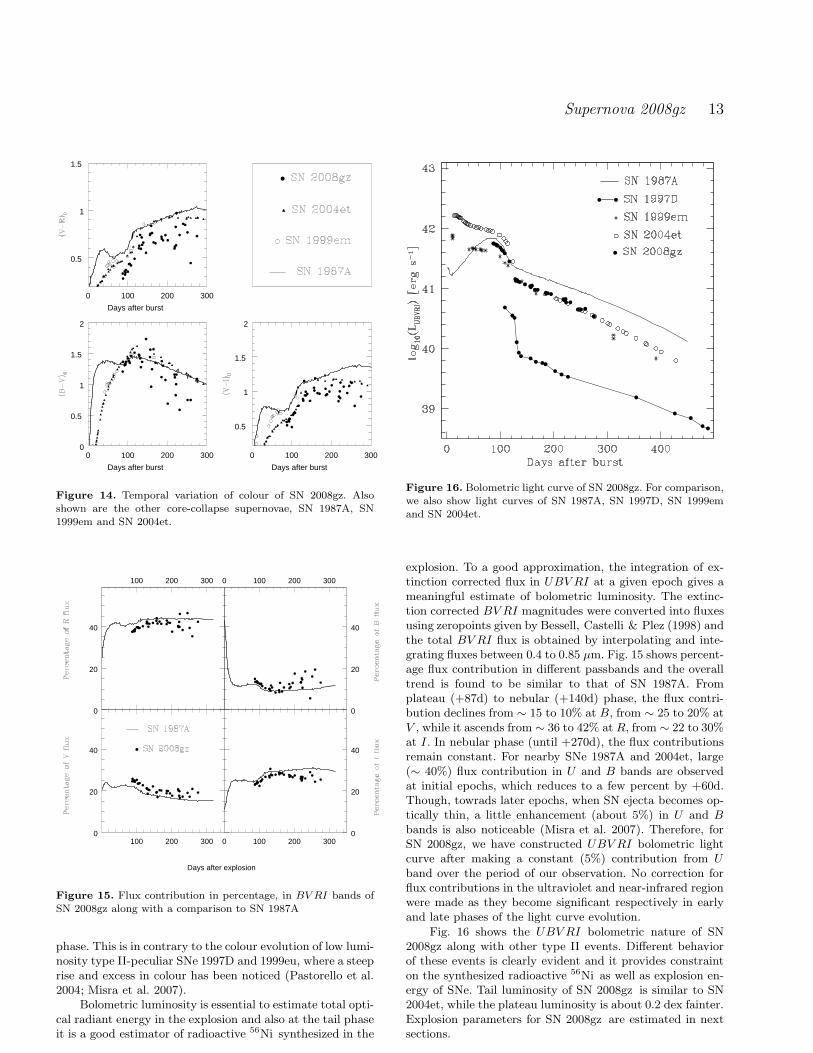
Fig. 14 shows reddening corrected colour evolution of SN2008gz. For comparison, we also show reddening correctedcolour curve of SN 1987A (Suntzeff & Bouchet 1990), SN1999em (Elmhamdi et al. 2003a) and SN 2004et (Sahu et al.2006), for E(B−V ) of 0.15, 0.10, and 0.41 mag and explosionepochs of JD 2446849.82, JD 2451480.5 and JD 2453275.5respectively. Though the colour curves of SN 2008gz havelarge scatter but overall nature of its temporal evolution isprominent. SN 2008gz follows general trend of colour evo-lution i.e. a steep and rapid decrease from blue (high tem-perature) to red (low temperatures) colours similar to SNe2004et and 1999em. (B−V )0 becomes redder from 1.2 magat +87d to about 1.7 mag at +140d and it follows trendsimilar to SNe 2004et and 1999em. The overall trend incolour evolution of SN 2008gz between end of plateau andmiddle of the tail is similar to that of peculiar type II SN1987A. In nebular phase, (B−V )0 turns blue rather rapidly,−1mag (100d)−1 and this arises due to suspected flatteningin B light and a shallow decay in V , R and I bands. The(V − R)0 colour is found to be consistently bluer than forother IIP SNe. For (V −R)0 and (V − I)0, the increment isquite shallow during the transition from plateau to nebular
12 In Turatto, Benetti & Cappellaro (2003) there are two rela-tions − one is with low slope and other with a high slope. Inthis work we have considered the lower slope, because it is wellsampled and matches with the previous works in this direction(Barbon et al. 1990).
Supernova 2008gz 13
0 100 200 3000
0.5
1
1.5
2
Days after burst
0 100 200 300
0.5
1
1.5
Days after burst
0 100 200 300
0.5
1
1.5
2
Days after burst
Figure 14. Temporal variation of colour of SN 2008gz. Alsoshown are the other core-collapse supernovae, SN 1987A, SN1999em and SN 2004et.
100 200 3000
20
40
100 200 300
0
20
40
0 100 200 3000
20
40
0 100 200 300
0
20
40
Days after explosion
Figure 15. Flux contribution in percentage, in BV RI bands ofSN 2008gz along with a comparison to SN 1987A
phase. This is in contrary to the colour evolution of low lumi-nosity type II-peculiar SNe 1997D and 1999eu, where a steeprise and excess in colour has been noticed (Pastorello et al.2004; Misra et al. 2007).
Bolometric luminosity is essential to estimate total opti-cal radiant energy in the explosion and also at the tail phaseit is a good estimator of radioactive 56Ni synthesized in the
Figure 16. Bolometric light curve of SN 2008gz. For comparison,we also show light curves of SN 1987A, SN 1997D, SN 1999emand SN 2004et.
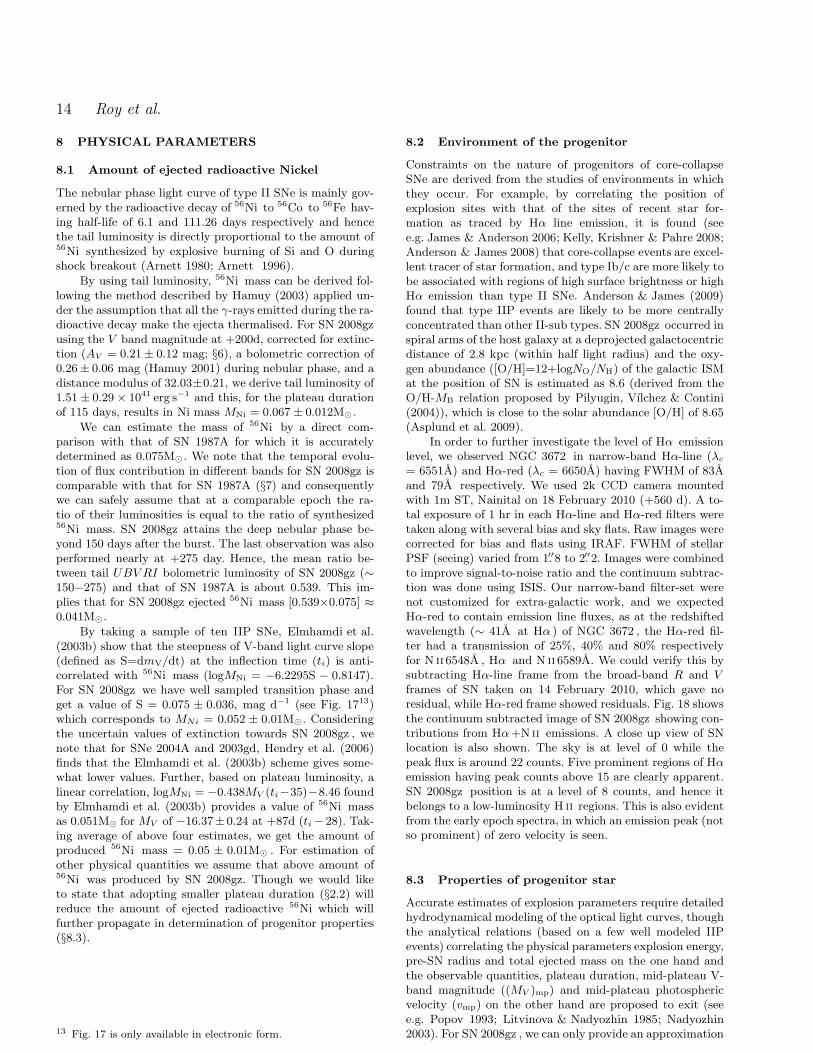
explosion. To a good approximation, the integration of ex-tinction corrected flux in UBV RI at a given epoch gives ameaningful estimate of bolometric luminosity. The extinc-tion corrected BV RI magnitudes were converted into fluxesusing zeropoints given by Bessell, Castelli & Plez (1998) andthe total BV RI flux is obtained by interpolating and inte-grating fluxes between 0.4 to 0.85 µm. Fig. 15 shows percent-age flux contribution in different passbands and the overalltrend is found to be similar to that of SN 1987A. Fromplateau (+87d) to nebular (+140d) phase, the flux contri-bution declines from ∼ 15 to 10% at B, from ∼ 25 to 20% atV , while it ascends from ∼ 36 to 42% at R, from ∼ 22 to 30%at I . In nebular phase (until +270d), the flux contributionsremain constant. For nearby SNe 1987A and 2004et, large(∼ 40%) flux contribution in U and B bands are observedat initial epochs, which reduces to a few percent by +60d.Though, towrads later epochs, when SN ejecta becomes op-tically thin, a little enhancement (about 5%) in U and Bbands is also noticeable (Misra et al. 2007). Therefore, forSN 2008gz, we have constructed UBV RI bolometric lightcurve after making a constant (5%) contribution from Uband over the period of our observation. No correction forflux contributions in the ultraviolet and near-infrared regionwere made as they become significant respectively in earlyand late phases of the light curve evolution.
Fig. 16 shows the UBV RI bolometric nature of SN2008gz along with other type II events. Different behaviorof these events is clearly evident and it provides constrainton the synthesized radioactive 56Ni as well as explosion en-ergy of SNe. Tail luminosity of SN 2008gz is similar to SN2004et, while the plateau luminosity is about 0.2 dex fainter.Explosion parameters for SN 2008gz are estimated in nextsections.
14 Roy et al.
8 PHYSICAL PARAMETERS
8.1 Amount of ejected radioactive Nickel
The nebular phase light curve of type II SNe is mainly gov-erned by the radioactive decay of 56Ni to 56Co to 56Fe hav-ing half-life of 6.1 and 111.26 days respectively and hencethe tail luminosity is directly proportional to the amount of56Ni synthesized by explosive burning of Si and O duringshock breakout (Arnett 1980; Arnett 1996).
By using tail luminosity, 56Ni mass can be derived fol-lowing the method described by Hamuy (2003) applied un-der the assumption that all the γ-rays emitted during the ra-dioactive decay make the ejecta thermalised. For SN 2008gzusing the V band magnitude at +200d, corrected for extinc-tion (AV = 0.21± 0.12 mag; §6), a bolometric correction of0.26± 0.06 mag (Hamuy 2001) during nebular phase, and adistance modulus of 32.03±0.21, we derive tail luminosity of1.51± 0.29× 1041 erg s−1 and this, for the plateau durationof 115 days, results in Ni mass MNi = 0.067 ± 0.012M⊙ .
We can estimate the mass of 56Ni by a direct com-parison with that of SN 1987A for which it is accuratelydetermined as 0.075M⊙ . We note that the temporal evolu-tion of flux contribution in different bands for SN 2008gz iscomparable with that for SN 1987A (§7) and consequentlywe can safely assume that at a comparable epoch the ra-tio of their luminosities is equal to the ratio of synthesized56Ni mass. SN 2008gz attains the deep nebular phase be-yond 150 days after the burst. The last observation was alsoperformed nearly at +275 day. Hence, the mean ratio be-tween tail UBV RI bolometric luminosity of SN 2008gz (∼150−275) and that of SN 1987A is about 0.539. This im-plies that for SN 2008gz ejected 56Ni mass [0.539×0.075] ≈0.041M⊙.
By taking a sample of ten IIP SNe, Elmhamdi et al.(2003b) show that the steepness of V-band light curve slope(defined as S=dmV/dt) at the inflection time (ti) is anti-correlated with 56Ni mass (logMNi = −6.2295S − 0.8147).For SN 2008gz we have well sampled transition phase andget a value of S = 0.075 ± 0.036, mag d−1 (see Fig. 1713)which corresponds to MNi = 0.052 ± 0.01M⊙. Consideringthe uncertain values of extinction towards SN 2008gz , wenote that for SNe 2004A and 2003gd, Hendry et al. (2006)finds that the Elmhamdi et al. (2003b) scheme gives some-what lower values. Further, based on plateau luminosity, alinear correlation, logMNi = −0.438MV (ti−35)−8.46 foundby Elmhamdi et al. (2003b) provides a value of 56Ni massas 0.051M⊙ for MV of −16.37± 0.24 at +87d (ti − 28). Tak-ing average of above four estimates, we get the amount ofproduced 56Ni mass = 0.05 ± 0.01M⊙ . For estimation ofother physical quantities we assume that above amount of56Ni was produced by SN 2008gz. Though we would liketo state that adopting smaller plateau duration (§2.2) willreduce the amount of ejected radioactive 56Ni which willfurther propagate in determination of progenitor properties(§8.3).
13 Fig. 17 is only available in electronic form.
8.2 Environment of the progenitor
Constraints on the nature of progenitors of core-collapseSNe are derived from the studies of environments in whichthey occur. For example, by correlating the position ofexplosion sites with that of the sites of recent star for-mation as traced by Hα line emission, it is found (seee.g. James & Anderson 2006; Kelly, Krishner & Pahre 2008;Anderson & James 2008) that core-collapse events are excel-lent tracer of star formation, and type Ib/c are more likely tobe associated with regions of high surface brightness or highHα emission than type II SNe. Anderson & James (2009)found that type IIP events are likely to be more centrallyconcentrated than other II-sub types. SN 2008gz occurred inspiral arms of the host galaxy at a deprojected galactocentricdistance of 2.8 kpc (within half light radius) and the oxy-gen abundance ([O/H]=12+logNO/NH) of the galactic ISMat the position of SN is estimated as 8.6 (derived from theO/H-MB relation proposed by Pilyugin, Vılchez & Contini(2004)), which is close to the solar abundance [O/H] of 8.65(Asplund et al. 2009).
In order to further investigate the level of Hα emissionlevel, we observed NGC 3672 in narrow-band Hα-line (λc
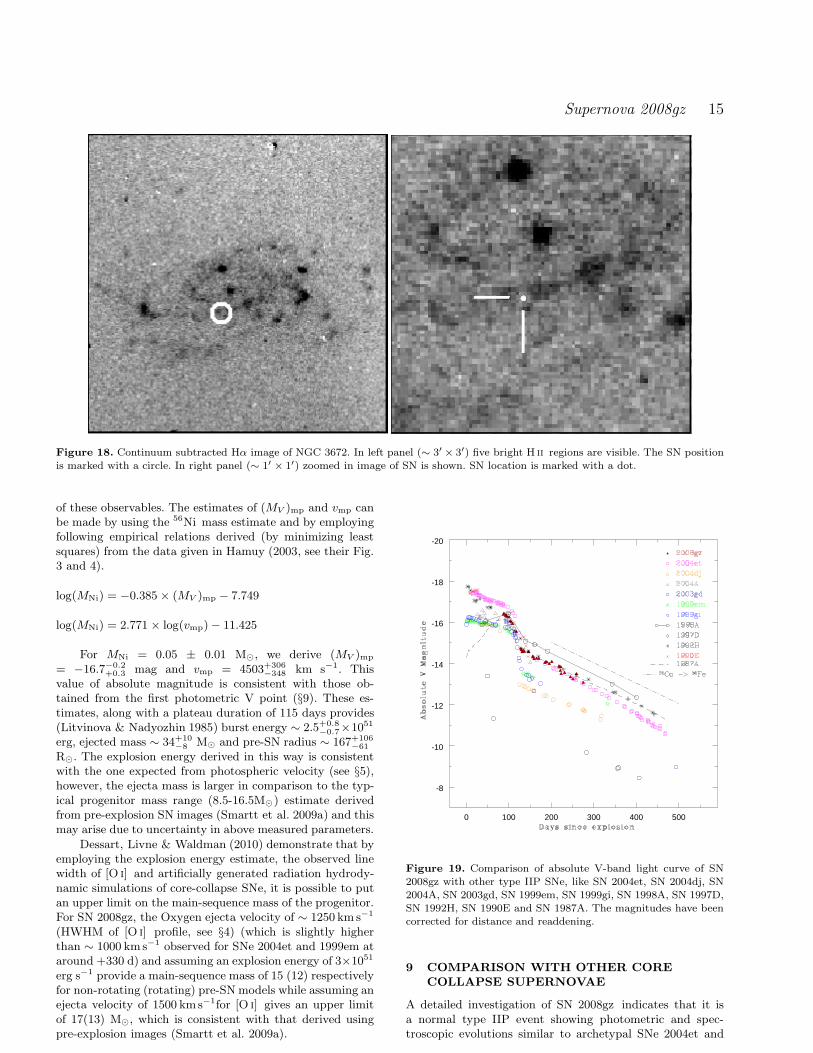
= 6551A) and Hα-red (λc = 6650A) having FWHM of 83Aand 79A respectively. We used 2k CCD camera mountedwith 1m ST, Nainital on 18 February 2010 (+560 d). A to-tal exposure of 1 hr in each Hα-line and Hα-red filters weretaken along with several bias and sky flats. Raw images werecorrected for bias and flats using IRAF. FWHM of stellarPSF (seeing) varied from 1.′′8 to 2.′′2. Images were combinedto improve signal-to-noise ratio and the continuum subtrac-tion was done using ISIS. Our narrow-band filter-set werenot customized for extra-galactic work, and we expectedHα-red to contain emission line fluxes, as at the redshiftedwavelength (∼ 41A at Hα ) of NGC 3672 , the Hα-red fil-ter had a transmission of 25%, 40% and 80% respectivelyfor N ii6548A , Hα and N ii6589A. We could verify this bysubtracting Hα-line frame from the broad-band R and Vframes of SN taken on 14 February 2010, which gave noresidual, while Hα-red frame showed residuals. Fig. 18 showsthe continuum subtracted image of SN 2008gz showing con-tributions from Hα+N ii emissions. A close up view of SNlocation is also shown. The sky is at level of 0 while thepeak flux is around 22 counts. Five prominent regions of Hαemission having peak counts above 15 are clearly apparent.SN 2008gz position is at a level of 8 counts, and hence itbelongs to a low-luminosity H ii regions. This is also evidentfrom the early epoch spectra, in which an emission peak (notso prominent) of zero velocity is seen.
8.3 Properties of progenitor star
Accurate estimates of explosion parameters require detailedhydrodynamical modeling of the optical light curves, thoughthe analytical relations (based on a few well modeled IIPevents) correlating the physical parameters explosion energy,pre-SN radius and total ejected mass on the one hand andthe observable quantities, plateau duration, mid-plateau V-band magnitude ((MV )mp) and mid-plateau photosphericvelocity (vmp) on the other hand are proposed to exit (seee.g. Popov 1993; Litvinova & Nadyozhin 1985; Nadyozhin2003). For SN 2008gz , we can only provide an approximation
Supernova 2008gz 15
Figure 18. Continuum subtracted Hα image of NGC 3672. In left panel (∼ 3′ × 3′) five bright H ii regions are visible. The SN positionis marked with a circle. In right panel (∼ 1′ × 1′) zoomed in image of SN is shown. SN location is marked with a dot.
of these observables. The estimates of (MV )mp and vmp canbe made by using the 56Ni mass estimate and by employingfollowing empirical relations derived (by minimizing leastsquares) from the data given in Hamuy (2003, see their Fig.3 and 4).
log(MNi) = −0.385× (MV )mp − 7.749
log(MNi) = 2.771 × log(vmp)− 11.425
For MNi = 0.05 ± 0.01 M⊙, we derive (MV )mp
= −16.7−0.2+0.3 mag and vmp = 4503+306
−348 km s−1. Thisvalue of absolute magnitude is consistent with those ob-tained from the first photometric V point (§9). These es-timates, along with a plateau duration of 115 days provides(Litvinova & Nadyozhin 1985) burst energy ∼ 2.5+0.8
−0.7×1051
erg, ejected mass ∼ 34+10−8 M⊙ and pre-SN radius ∼ 167+106
−61
R⊙. The explosion energy derived in this way is consistentwith the one expected from photospheric velocity (see §5),however, the ejecta mass is larger in comparison to the typ-ical progenitor mass range (8.5-16.5M⊙) estimate derivedfrom pre-explosion SN images (Smartt et al. 2009a) and thismay arise due to uncertainty in above measured parameters.
Dessart, Livne & Waldman (2010) demonstrate that byemploying the explosion energy estimate, the observed linewidth of [O i] and artificially generated radiation hydrody-namic simulations of core-collapse SNe, it is possible to putan upper limit on the main-sequence mass of the progenitor.For SN 2008gz, the Oxygen ejecta velocity of ∼ 1250 km s−1
(HWHM of [O i] profile, see §4) (which is slightly higherthan ∼ 1000 kms−1 observed for SNe 2004et and 1999em ataround +330 d) and assuming an explosion energy of 3×1051
erg s−1 provide a main-sequence mass of 15 (12) respectivelyfor non-rotating (rotating) pre-SNmodels while assuming anejecta velocity of 1500 kms−1for [O i] gives an upper limitof 17(13) M⊙, which is consistent with that derived usingpre-explosion images (Smartt et al. 2009a).
0 100 200 300 400 500
-8
-10
-12
-14
-16
-18
-20
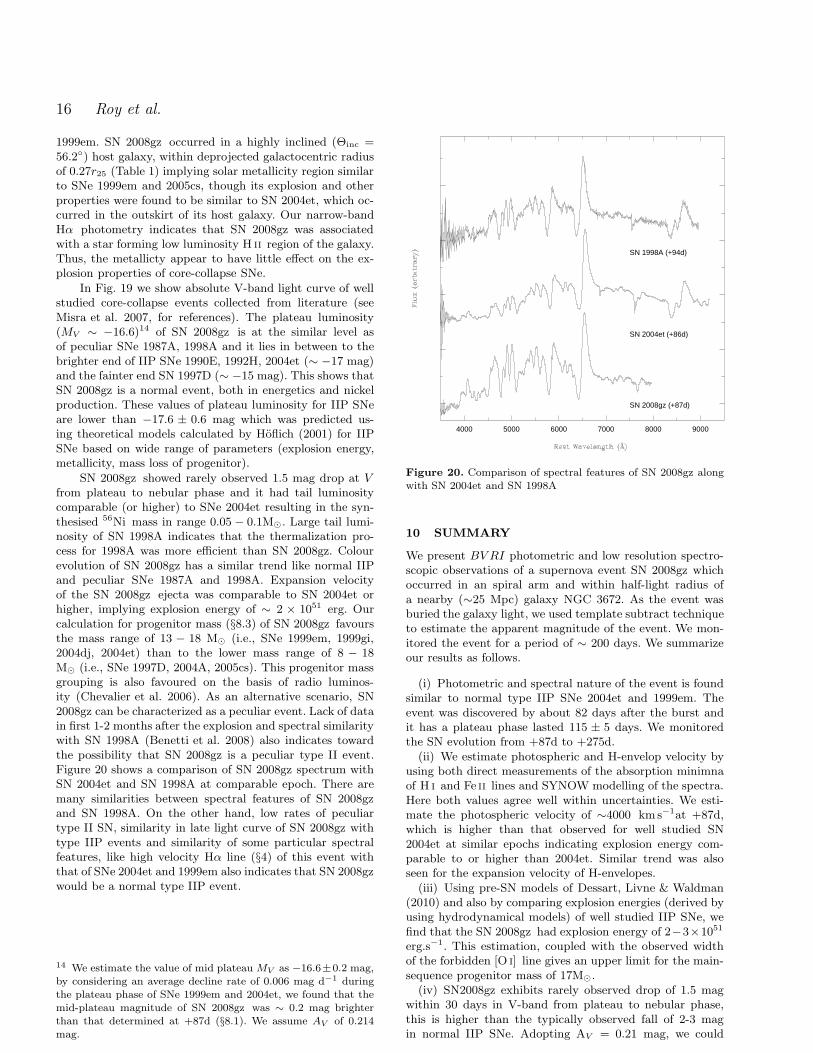
Figure 19. Comparison of absolute V-band light curve of SN2008gz with other type IIP SNe, like SN 2004et, SN 2004dj, SN2004A, SN 2003gd, SN 1999em, SN 1999gi, SN 1998A, SN 1997D,SN 1992H, SN 1990E and SN 1987A. The magnitudes have beencorrected for distance and readdening.
9 COMPARISON WITH OTHER CORE
COLLAPSE SUPERNOVAE
A detailed investigation of SN 2008gz indicates that it isa normal type IIP event showing photometric and spec-troscopic evolutions similar to archetypal SNe 2004et and
16 Roy et al.
1999em. SN 2008gz occurred in a highly inclined (Θinc =56.2) host galaxy, within deprojected galactocentric radiusof 0.27r25 (Table 1) implying solar metallicity region similarto SNe 1999em and 2005cs, though its explosion and otherproperties were found to be similar to SN 2004et, which oc-curred in the outskirt of its host galaxy. Our narrow-bandHα photometry indicates that SN 2008gz was associatedwith a star forming low luminosity H ii region of the galaxy.Thus, the metallicty appear to have little effect on the ex-plosion properties of core-collapse SNe.
In Fig. 19 we show absolute V-band light curve of wellstudied core-collapse events collected from literature (seeMisra et al. 2007, for references). The plateau luminosity(MV ∼ −16.6)14 of SN 2008gz is at the similar level asof peculiar SNe 1987A, 1998A and it lies in between to thebrighter end of IIP SNe 1990E, 1992H, 2004et (∼ −17 mag)and the fainter end SN 1997D (∼ −15 mag). This shows thatSN 2008gz is a normal event, both in energetics and nickelproduction. These values of plateau luminosity for IIP SNeare lower than −17.6 ± 0.6 mag which was predicted us-ing theoretical models calculated by Hoflich (2001) for IIPSNe based on wide range of parameters (explosion energy,metallicity, mass loss of progenitor).
SN 2008gz showed rarely observed 1.5 mag drop at Vfrom plateau to nebular phase and it had tail luminositycomparable (or higher) to SNe 2004et resulting in the syn-thesised 56Ni mass in range 0.05 − 0.1M⊙. Large tail lumi-nosity of SN 1998A indicates that the thermalization pro-cess for 1998A was more efficient than SN 2008gz. Colourevolution of SN 2008gz has a similar trend like normal IIPand peculiar SNe 1987A and 1998A. Expansion velocityof the SN 2008gz ejecta was comparable to SN 2004et orhigher, implying explosion energy of ∼ 2 × 1051 erg. Ourcalculation for progenitor mass (§8.3) of SN 2008gz favoursthe mass range of 13 − 18 M⊙ (i.e., SNe 1999em, 1999gi,2004dj, 2004et) than to the lower mass range of 8 − 18M⊙ (i.e., SNe 1997D, 2004A, 2005cs). This progenitor massgrouping is also favoured on the basis of radio luminos-ity (Chevalier et al. 2006). As an alternative scenario, SN2008gz can be characterized as a peculiar event. Lack of datain first 1-2 months after the explosion and spectral similaritywith SN 1998A (Benetti et al. 2008) also indicates towardthe possibility that SN 2008gz is a peculiar type II event.Figure 20 shows a comparison of SN 2008gz spectrum withSN 2004et and SN 1998A at comparable epoch. There aremany similarities between spectral features of SN 2008gzand SN 1998A. On the other hand, low rates of peculiartype II SN, similarity in late light curve of SN 2008gz withtype IIP events and similarity of some particular spectralfeatures, like high velocity Hα line (§4) of this event withthat of SNe 2004et and 1999em also indicates that SN 2008gzwould be a normal type IIP event.
14 We estimate the value of mid plateau MV as −16.6±0.2 mag,by considering an average decline rate of 0.006 mag d−1 duringthe plateau phase of SNe 1999em and 2004et, we found that themid-plateau magnitude of SN 2008gz was ∼ 0.2 mag brighterthan that determined at +87d (§8.1). We assume AV of 0.214mag.
4000 5000 6000 7000 8000 9000
SN 2008gz (+87d)
SN 2004et (+86d)
SN 1998A (+94d)
Figure 20. Comparison of spectral features of SN 2008gz alongwith SN 2004et and SN 1998A
10 SUMMARY
We present BVRI photometric and low resolution spectro-scopic observations of a supernova event SN 2008gz whichoccurred in an spiral arm and within half-light radius ofa nearby (∼25 Mpc) galaxy NGC 3672. As the event wasburied the galaxy light, we used template subtract techniqueto estimate the apparent magnitude of the event. We mon-itored the event for a period of ∼ 200 days. We summarizeour results as follows.
(i) Photometric and spectral nature of the event is foundsimilar to normal type IIP SNe 2004et and 1999em. Theevent was discovered by about 82 days after the burst andit has a plateau phase lasted 115 ± 5 days. We monitoredthe SN evolution from +87d to +275d.
(ii) We estimate photospheric and H-envelop velocity byusing both direct measurements of the absorption minimnaof H i and Fe ii lines and SYNOW modelling of the spectra.Here both values agree well within uncertainties. We esti-mate the photospheric velocity of ∼4000 kms−1at +87d,which is higher than that observed for well studied SN2004et at similar epochs indicating explosion energy com-parable to or higher than 2004et. Similar trend was alsoseen for the expansion velocity of H-envelopes.
(iii) Using pre-SN models of Dessart, Livne & Waldman(2010) and also by comparing explosion energies (derived byusing hydrodynamical models) of well studied IIP SNe, wefind that the SN 2008gz had explosion energy of 2−3×1051
erg.s−1. This estimation, coupled with the observed widthof the forbidden [O i] line gives an upper limit for the main-sequence progenitor mass of 17M⊙.
(iv) SN2008gz exhibits rarely observed drop of 1.5 magwithin 30 days in V-band from plateau to nebular phase,this is higher than the typically observed fall of 2-3 magin normal IIP SNe. Adopting AV = 0.21 mag, we could
Supernova 2008gz 17
estimate mass of 56Ni synthesized during the explosion as0.05 ± 0.01M⊙.
(v) Our Hα observation taken about 560 days after theexplosion indicates that the event took place in a low lumi-nosity star forming arms, very close to a H ii region. Theemission kink of this H ii region is also seen in Hα line nearzero velocity of the Doppler corrected spectra of SN.
ACKNOWLEDGMENTS
We are thankful to the reviewer Stefano Valenti for his valu-able comments, which have enriched the manuscript. Wethank all the observers at Aryabhatta Research Institute ofObservational Sciences (ARIES) who provided their valu-able time and support for the observations of this event.We are thankful to the observing staffs of 2-m IGO, 3.6-mTNG, 3.6-m NTT and 6-m BTA for their kind cooperationin observation of SN 2008GZ. We also express our thanks tothe observing staffs of Perth observatory for their kind sup-port for this research work. This work was supported by thegrant RNP 2.1.1.3483 of the Federal Agency of Educationof Russia. Timur A. Fatkhullin and Alexander S. Moskvitinwere supported by the grant of the President of the RussianFederation (MK-405.2010.2). This work is partially basedon observations made with the Italian Telescopio NazionaleGalileo (TNG) operated on the island of La Palma by theFundacin Galileo Galilei of the INAF (Istituto Nazionale diAstrofisica) at the Spanish Observatorio del Roque de losMuchachos of the Instituto de Astrofisica de Canarias. It isalso partially based on observations collected at the Euro-pean Southern Observatory, Chile under the program 083.D-0970(A). Stefano Benetti and Milena F Bufano are partiallysupported by the PRIN-INAF 2009 with the project “Su-pernovae Variety and Nucleosynthesis Yields” This researchhas made use of data obtained through the High Energy As-trophysics Science Archive Research Center Online Service,provided by the NASA/Goddard Space Flight Center. Weare indebted to the Indo-Russian (DST-RFBR) project No.RUSP-836 (RFBR-08-02:91314) for the completion of thisresearch work.
REFERENCES
Alard C., Lupton R.H., 1998, ApJ, 503, 325Anderson J.P., James P.A., 2008, MNRAS, 390, 1527Anderson J.P., James P.A., 2009, MNRAS, 399, 559Andrews J.E. et al., 2010, ApJ, 715, 541Arnett W.D., 1980, ApJ, 237, 541Arnett W.D., 1996, Supernovae and Nucleosynthesis.Princeton University Press, Princeton, New Jersey, USA
Asplund M., Grevesse N, Sauval A.J., Scott, P., 2009,ARA&A47, 481
Barbon R., Benetti S., Rosino L., Cappellaro E., TurattoM., 1990, A&A, 237, 79
Baron E., et al., 2005, ASPC 342, 351Benetti S. et al., 2001, MNRAS, 322, 361Benetti S., Boschin W., Harutyunyan H., 2008, Cent. Bur.Electron. Telegrams, 1568, 1
Bessell M.S., Castelli F., Plez B., 1998, A&A, 333, 231
Branch D., Baron E., Jeffery, D.J., 2001, in Supernovaeand Gamma-Ray Bursters, edited by K. Weiler., LectureNotes in Physics 598, 47 (arXiv:astro-ph/0111573)
Branch D. et al., 2002, ApJ, 566, 1005Cappellaro E., Danziger I.J., della Valle M., Gouiffes C.,Turatto M., 1995, A&A, 293, 723
Cappellaro E., Evans R., Turatto M., 1999, A&A, 351, 459Cardelli J.A., Clayton G.C., Mathis J.S., 1989, ApJ, 345,245
Chakraborty P., Das H.K., Tandon S.N., 2005, Bull. As-tron. Soc. India, 33, 1-23
Chevalier R.A., Fransson C., Nymark T.K., 2006, ApJ, 641,1029
Chugai N., 1988, Sov. Astron. Lett., 14, 334Chugai N., 1991, Sov. Astron., 35, 171Danziger I.J., Lucy L.B., Bouchet P., Gouiffes G., 1991, inWoosely S. E., eds, Supernovae, New York, Springer, p.69
Dessart L., Livne E., Waldman R., MNRAS, in press(arXiv:astro-ph/1006.2268)
Elmhamdi A. et al., 2003, MNRAS, 338, 939Elmhamdi A., Chugai N.N., Danziger. I.J., 2003, A&A,404, 1077
Elmhamdi A., et al., 2006, A&A, 450, 305Filippenko A.V., 1997, ARA&A, 35, 309Fisher A., 2000, Ph D thesis, University of OklahomaGezari S., Dessart L., Basa S., 2008, ApJ, 683, L131Gupta R. et al., 2002, Bull. Astron. Soc. India, 30, 785Gurugubelli U.K., Sahu D.K., Anupama G.C., Chakrad-hari N.K., 2008, Bull. Astron. Soc. India, 36, 79
Habergham, S.M., Anderson, J.P., James P.A., 2010, ApJ,717, 342
Hakobyan A.A., Mamon G.A., Petrosian A.R., Kunth D.,Turatto M., 2009, A&A, 508, 1259
Hamuy M., 2001, PhD thesis, University of ArizonaHamuy M., Pinto P. A., 2002, ApJ, 566, 63Hamuy M., 2003, ApJ, 582, 905Hamuy M., Suntzeff N.B., Heathcote S.R., Walker A.R.,Gigoux P., Phillips M. M., 1994, PASP106, 566
Hanuschik R.W., Dachs J., 1987, A&A, 182, L29Heger A, Fryer C.L., Woosley S.E. et al., 2003, ApJ, 591,288
Hendry M.A. et al., 2006, MNRAS, 369, 1303Hoflich P., 1988, PASP, 7, 434Hoflich P., Straniero O., Limongi M., Dominguez I., ChieffiA., 2001, Rev. Mexicana Astron. Astrofis., 10, 157
Horne K., 1986, PASP, 98, 609Harutyunyan A.H., Pfahler P., Pastorello A. et al., 2008,A&A, 488, 383
James P.A., Anderson J.P., 2006, A&A, 453, 57Kelly P.L., Krishner R.P., Pahre P., 2008, ApJ, 687, 1201Kumar B., Sagar R., Rautela B.S., Srivastava J.B., Srivas-tava R.K., 2000, Bull. Astron. Soc. India, 28,675
Landolt A.R., 2009, AJ, 137, 4186Leonard D.C., Filippenko A.V., Gates E.L., 2002, PASP,114, 35
Li W., Van Dyk S.D., Filippenko, A.V., Cuillandre J.-C,2005, PASP, 117, 121
Litvinova I.Y., Nadyozhin D.K., 1985, Sov. Astron., 11,145L
Lucy L.B., Danziger I.J., Gouiffes G., Bouchet P., 1991, inWoosely S.E., eds, Supernovae, New York, Springer, p.82
18 Roy et al.
Matheson T., Filippenko A.V., Barth A.J. et al., 2000, AJ,120, 1487
Misra K., Dave P., Poonam C., Bhattacharya D. et al.,2007, MNRAS, 381, 280
Moskvitin A.S., Fatkhullin T.A., Sokolov V.V., Ko-marova V.N., Drake A.J., Roy R., Tsvetkov, D. Yu.,2010, Astrophysical Bulletin, 65, 230−237 (arXiv:astro-ph/1008.0773),
Nadyozhin D.K., 2003, MNRAS, 346, 97Nakano S., Martin R., 2008, Cent. Bur. Electron. Tele-grams, 1566, 1
Olivares E.F. et al., 2010, ApJ, 715, 833OPastorello A., Zampieri L., Turatto, M. et al., 2004, MN-RAS, 347, 74
Pastorello A. et al. 2005, MNRAS, 360, 950Pastorello A., Valenti S., Zampieri L. et al., 2009, MNRAS,394, 2266
Pilyugin L.S., Vılchez J.M., Contini T., 2004, A&A, 425,849
Poznanski D. et al., 2009, ApJ, 694, 1067Popov D.V., 1993, ApJ, 414, 712Richmond M. W., Treffers R. R., Filippenko A. V., PaikY., Leibundgut B., Schulman E., Cox C. V., 1994, AJ,107, 1022
Sahu D.K., Anupama G.C., Srividya S., Muneer S., 2006,MNRAS, 372, 1315
Schlegel D.J., Finkbeiner D.P., Davis M., 1998, ApJ, 500,525
Smartt S.J., Eldridge, J.J., Crockett R.M. & Maund J.R.,2009a, MNRAS, 395, 1409
Smartt S.J., 2009b, ARA&A, 47, 63Smith N., Weidong Li., Filippenko A.V. & Chornock R.,2009, (arXiv:astro-ph/1006.3899)
Spyromilio J., 1991, MNRAS, 253, 25Sonbas E., et al., 2008, Astrophysical Bulletin, 63, 228Stetson P.B., 1987, PASP, 99, 191Stetson P.B., 1992, J. R. Astron. Soc. Canada, 86,71Suntzeff N.B., Hamuy M., Martin G., Gomez A., GonzalezR., 1988, AJ, 97, 1864
Suntzeff N.B., Bouchet P., 1990, AJ, 99, 650Taubenberger S., Valenti S., Benetti S., et al., 2009, MN-RAS, 397, 677
Terry J.N., Paturel G., Ekholm T., 2002, A&A, 393, 57Turatto M., Cappellaro E., Benetti S., Danziger I.J., 1993,MNRAS, 265, 471
Turatto M., Mazzali P.A., Young T.R. et al., 1998, ApJ,498, L129
Turatto M., Benetti S., Cappellaro E., 2003, From Twilightto Highlight : The Physics of Supernovae, 200
Utrobin V.P., 2007, A&A, 461,233Utrobin V.P., Chugai N.N., 2009, A&A, 506, 829van Dokkum P.G., 2001, PASP, 113, 1420Vollmann K., Eversberg T., 2006, Astron. Nachr., 327, No.9, 862
Supernova 2008gz 19
Table 2. Journal of photometric observation of SN 2008gz.
UT Date JD Phasea B V R I Telescopeb Seeingc Ellipticityd
(yy/mm/dd) 2454000+ (day) (s) (s) (s) (s) (′′)
2007/07/09 290.94 −403 – 240 180 180 LT 2.5 0.052008/11/10 781.48 +87 2×300 2×300 2×250 2×250 ST 2.4 0.182008/11/11 782.50 +88 3×300 300 2×250 2×250 ST 2.6 0.332008/11/15 786.47 +92 250, 300 250, 300 250, 300 250, 300 ST 2.7 0.112008/11/16 787.47 +93 2×300 2×300 250, 300 250, 300 ST 2.4 0.132008/11/17 788.48 +94 2×300 2×300 2×300 2×300 ST 2.4 0.102008/11/18 789.46 +95 2×300 2×300 2×300 2×250 ST 3.3 0.112008/11/23 794.47 +100 2×300 2×300 2×300 2×300 ST 3.5 0.052008/11/26 797.47 +103 240 150 60 60 ST 2.7 0.052008/11/28 799.45 +105 2×300 2×300 2×300 2×300 ST 3.0 0.132008/12/01 802.49 +108 2×300 2×300 2×300 2×300 ST 2.5 0.182008/12/10 811.49 +117 2×300 2×300 2×300 2×300 ST 2.9 0.212008/12/21 822.49 +128 2×300 2×300 2×300 2×300 ST 2.6 0.142008/12/22 823.46 +129 2×300 2×300 2×300 2×300 ST 2.3 0.202008/12/24 825.51 +131 300 300 300 250 ST 3.6 0.192008/12/26 827.52 +133 2×300 300 300 300 ST 3.1 0.242008/12/28 829.45 +135 – 300 300 300 ST 2.7 0.092008/12/29 830.49 +136 2×300 300 300 2×300 ST 3.2 0.052009/01/01 833.51 +139 – 300 300 300 ST 2.7 0.122009/01/08 840.48 +146 2×300 300 300 2×300 ST 3.1 0.252009/01/18 850.36 +156 2×300 2×300 2×300 2×300 ST 3.1 0.162009/01/19 851.32 +157 3×300 2×300 2×300 2×300 ST 3.1 0.112009/01/21 853.32 +159 2×300 2×300 2×300 2×300 ST 3.2 0.082009/01/23 855.51 +161 2×300 2×300 2×300 ST 3.1 0.362009/01/27 859.36 +165 2×300 2×300 2×300 2×300 ST 2.2 0.182009/02/01 864.35 +170 2×300 2×300 2×300 2×300 ST 2.5 0.112009/02/16 879.42 +185 2×200 2×200 2×250 2×250 ST 2.4 0.422009/02/17 880.27 +186 2×250 2×250 2×200 2×200 ST 2.9 0.172009/02/20 883.34 +189 2×300 2×300 2×300 2×300 ST 3.2 0.242009/02/26 889.27 +195 2×300 3×300 2×300 2×300 ST 3.6 0.142009/03/04 895.23 +201 2×300 2×300 2×300 2×300 ST 3.0 0.18
2009/03/21 912.33 +218 1200 600 300 300 IGO 1.6 0.102009/03/22 913.24 +219 1200 600 300 300 IGO 1.6 0.132009/03/24 915.31 +221 1200 600 300 300 IGO 1.5 0.032009/03/25 916.30 +222 1200 600 300 300 IGO 1.4 0.052009/03/26 917.32 +223 2×300 2×300 2×300 2×300 ST 3.5 0.142009/04/03 925.20 +231 2×300 2×300 2×300 3×300 ST 2.8 0.242009/04/12 934.28 +240 – 2×300 2×300 2×300 ST 2.7 0.432009/04/17 939.23 +245 2×300 2×250 2×300 2×250 ST 2.8 0.162009/04/23 945.16 +251 3×300 2×300 2×300 2×250 ST 3.1 0.162009/05/01 953.15 +259 2×300 2×300 300 300 ST 2.5 0.382009/05/17 969.11 +275 3×120 3×60 60 60 NTT 0.9 0.082009/11/19 1155.94 +462 2×250 – – – ST – –2010/02/13 1241.34 +547 – 3×300 3×300 3×300 ST 2.5 0.132010/02/14 1242.35 +548 4×300 2×300 2×300 2×300 ST 2.1 0.12
a With reference to the time of explosion JD 2454694.0.b LT : 0.6 m Lowell Telescope, Perth Observatory, UK; ST : 1m Sampurnanand Telescope, ARIES, India; IGO : 2 m IUCAAGirawali Observatory, India; NTT : 3.6 m New TechnologyTelescope, ESO, Chilec FWHM of stellar PSF at V bandd Ellipticity is estimated using imexamine task of IRAF
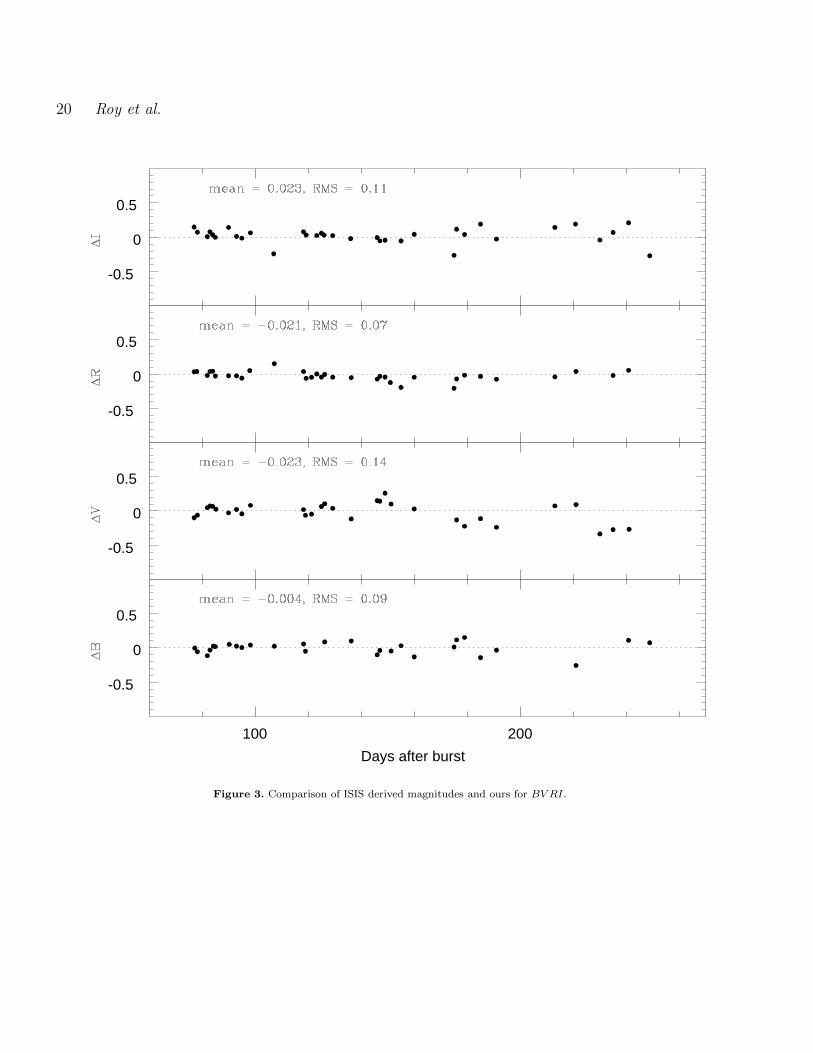
20 Roy et al.
100 200
-0.5
0
0.5
Days after burst
-0.5
0
0.5
-0.5
0
0.5
-0.5
0
0.5
Figure 3. Comparison of ISIS derived magnitudes and ours for BV RI.
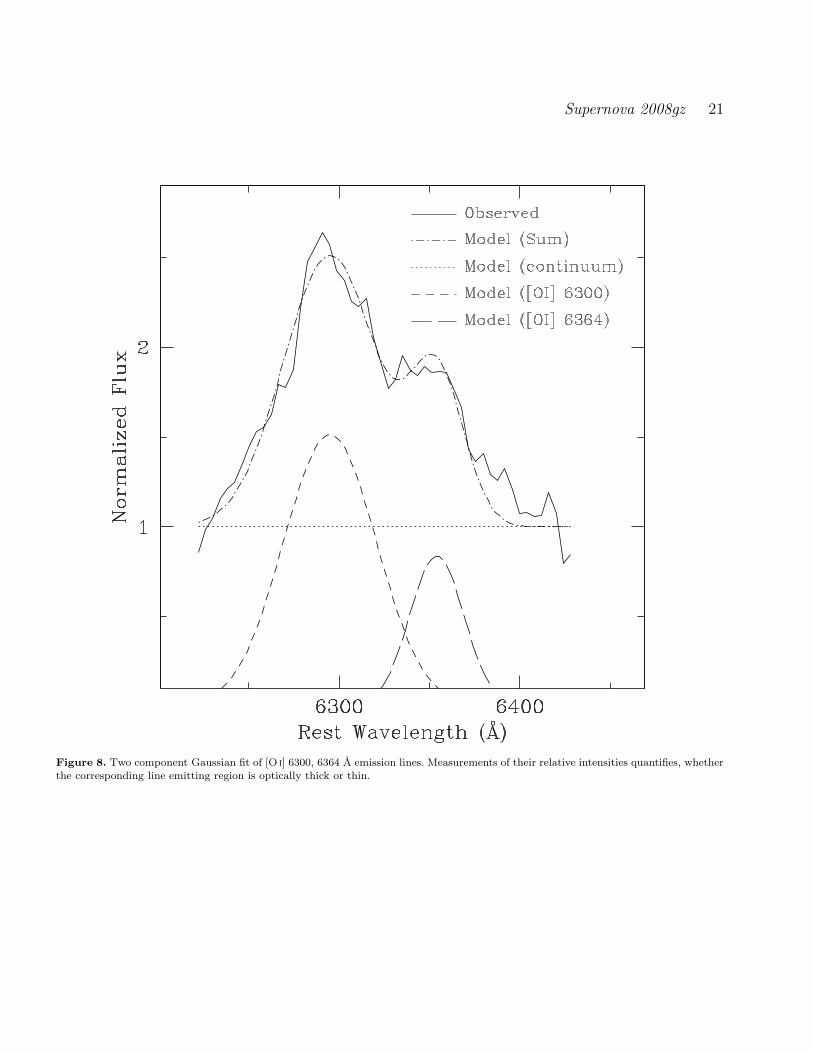
Supernova 2008gz 21
Figure 8. Two component Gaussian fit of [O i] 6300, 6364 A emission lines. Measurements of their relative intensities quantifies, whetherthe corresponding line emitting region is optically thick or thin.
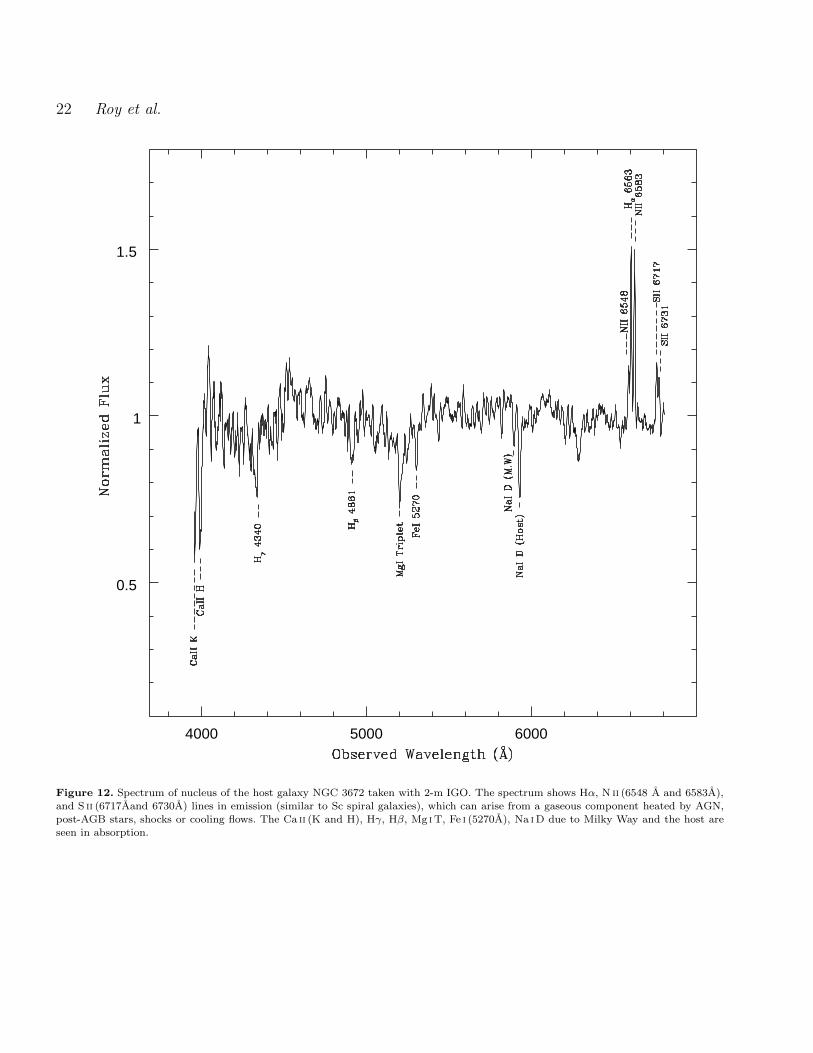
22 Roy et al.
4000 5000 6000
0.5
1
1.5
Figure 12. Spectrum of nucleus of the host galaxy NGC 3672 taken with 2-m IGO. The spectrum shows Hα, N ii (6548 A and 6583A),and S ii (6717Aand 6730A) lines in emission (similar to Sc spiral galaxies), which can arise from a gaseous component heated by AGN,post-AGB stars, shocks or cooling flows. The Ca ii (K and H), Hγ, Hβ, Mg iT, Fe i (5270A), Na iD due to Milky Way and the host areseen in absorption.
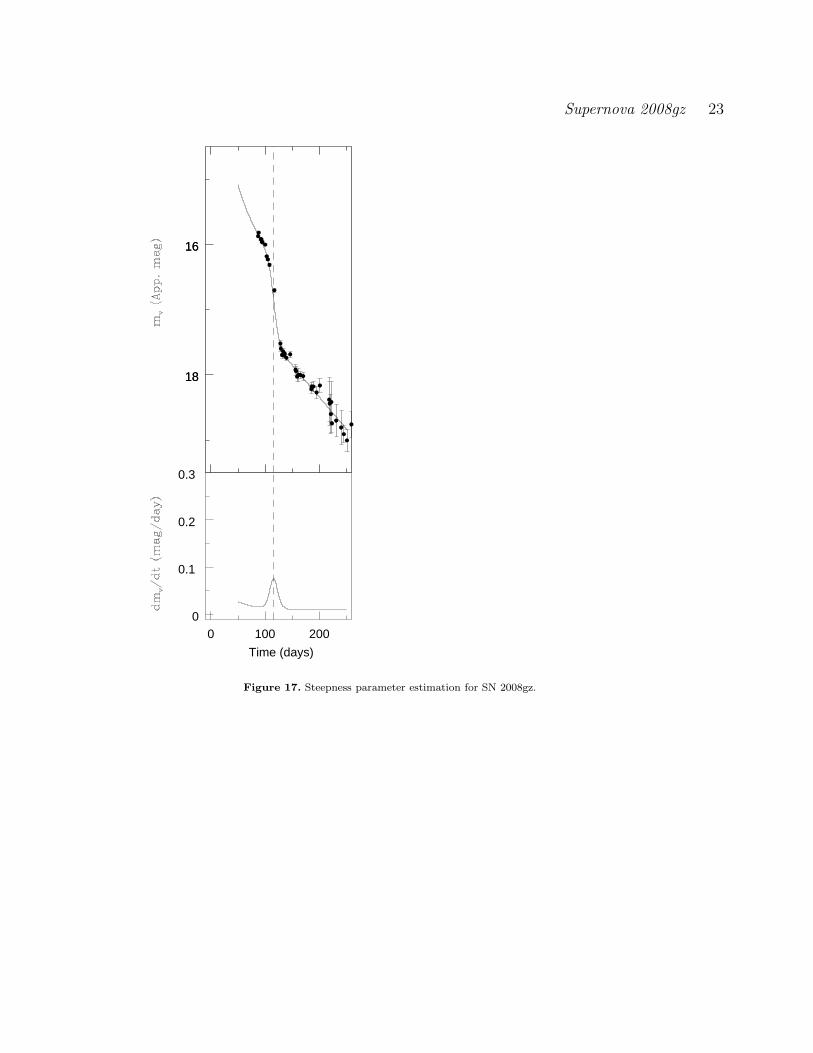
Supernova 2008gz 23
0 100 2000
0.1
0.2
0.3
18
16
18
16
Time (days)
Figure 17. Steepness parameter estimation for SN 2008gz.


![PANKAJ KUMAR arXiv:1009.1202v2 [astro-ph.SR] 6 Oct 2010 · PANKAJ KUMAR1 Aryabhatta Research Institute of Observational Sciences (ARIES), Nainital-263129, India pkumar@aries.res.in](https://img.pdfslide.net/doc/110x75/5f07087f7e708231d41af6cb/pankaj-kumar-arxiv10091202v2-astro-phsr-6-oct-2010-pankaj-kumar1-aryabhatta.jpg)


![Pankaj Kumar arXiv:0912.1261v1 [astro-ph.SR] 7 Dec 2009 · Pankaj Kumar Aryabhatta Research Institute of Observational Sciences (ARIES), Manora Peak, Nainital-263 129, India pkumar@aries.res.in](https://img.pdfslide.net/doc/110x75/5f07087d7e708231d41af6be/pankaj-kumar-arxiv09121261v1-astro-phsr-7-dec-2009-pankaj-kumar-aryabhatta.jpg)