Embed Size (px)
Citation preview
Snap Bean Western Oregon
A.L. Heinrich, D.M. Sullivan, and E. Peachey
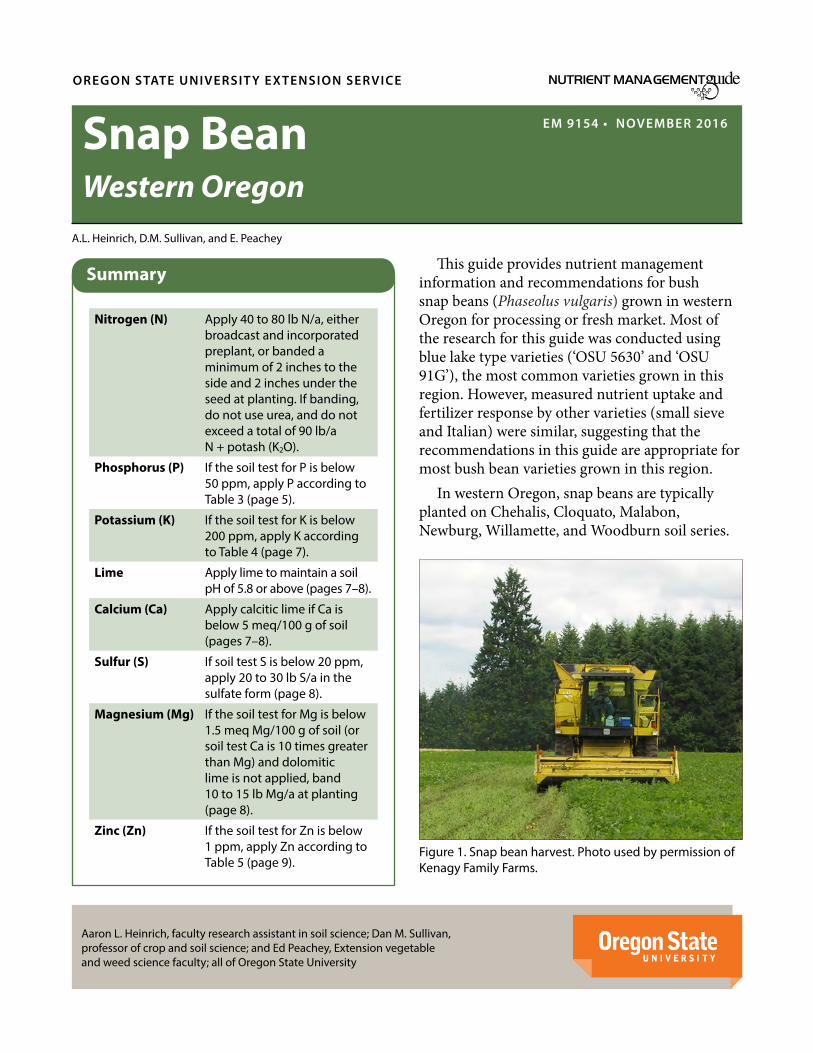
This guide provides nutrient management information and recommendations for bush snap beans (Phaseolus vulgaris) grown in western Oregon for processing or fresh market. Most of the research for this guide was conducted using blue lake type varieties (‘OSU 5630’ and ‘OSU 91G’), the most common varieties grown in this region. However, measured nutrient uptake and fertilizer response by other varieties (small sieve and Italian) were similar, suggesting that the recommendations in this guide are appropriate for most bush bean varieties grown in this region.
In western Oregon, snap beans are typically planted on Chehalis, Cloquato, Malabon, Newburg, Willamette, and Woodburn soil series.
OREGON STATE UNIVERSIT Y EXTENSION SERVICE
Aaron L. Heinrich, faculty research assistant in soil science; Dan M. Sullivan, professor of crop and soil science; and Ed Peachey, Extension vegetable and weed science faculty; all of Oregon State University
Figure 1. Snap bean harvest. Photo used by permission of Kenagy Family Farms.
EM 9154 • NOVEMBER 2016
NUTRIENT MANAGEMENT
Nitrogen (N) Apply 40 to 80 lb N/a, either broadcast and incorporated preplant, or banded a minimum of 2 inches to the side and 2 inches under the seed at planting. If banding, do not use urea, and do not exceed a total of 90 lb/a N + potash (K2O).
Phosphorus (P) If the soil test for P is below 50 ppm, apply P according to Table 3 (page 5).
Potassium (K) If the soil test for K is below 200 ppm, apply K according to Table 4 (page 7).
Lime Apply lime to maintain a soil pH of 5.8 or above (pages 7–8).
Calcium (Ca) Apply calcitic lime if Ca is below 5 meq/100 g of soil (pages 7–8).
Sulfur (S) If soil test S is below 20 ppm, apply 20 to 30 lb S/a in the sulfate form (page 8).
Magnesium (Mg) If the soil test for Mg is below 1.5 meq Mg/100 g of soil (or soil test Ca is 10 times greater than Mg) and dolomitic lime is not applied, band 10 to 15 lb Mg/a at planting (page 8).
Zinc (Zn) If the soil test for Zn is below 1 ppm, apply Zn according to Table 5 (page 9).
Summary
2
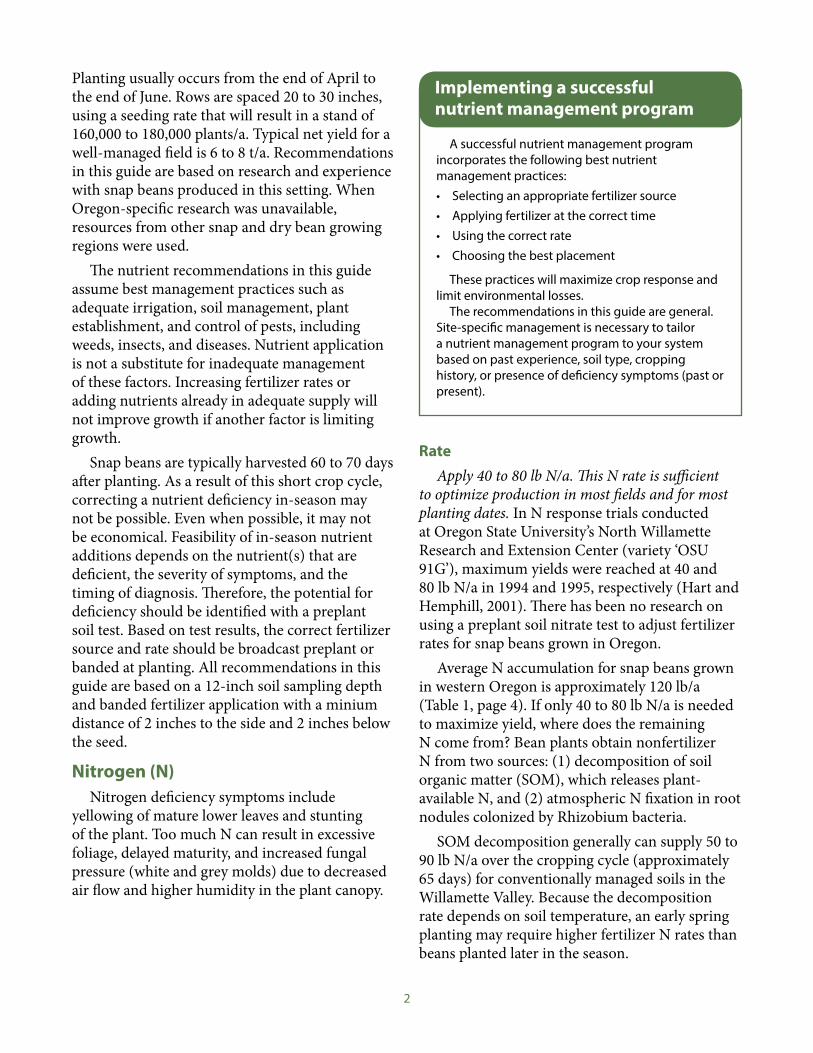
Planting usually occurs from the end of April to the end of June. Rows are spaced 20 to 30 inches, using a seeding rate that will result in a stand of 160,000 to 180,000 plants/a. Typical net yield for a well-managed field is 6 to 8 t/a. Recommendations in this guide are based on research and experience with snap beans produced in this setting. When Oregon-specific research was unavailable, resources from other snap and dry bean growing regions were used.
The nutrient recommendations in this guide assume best management practices such as adequate irrigation, soil management, plant establishment, and control of pests, including weeds, insects, and diseases. Nutrient application is not a substitute for inadequate management of these factors. Increasing fertilizer rates or adding nutrients already in adequate supply will not improve growth if another factor is limiting growth.
Snap beans are typically harvested 60 to 70 days after planting. As a result of this short crop cycle, correcting a nutrient deficiency in-season may not be possible. Even when possible, it may not be economical. Feasibility of in-season nutrient additions depends on the nutrient(s) that are deficient, the severity of symptoms, and the timing of diagnosis. Therefore, the potential for deficiency should be identified with a preplant soil test. Based on test results, the correct fertilizer source and rate should be broadcast preplant or banded at planting. All recommendations in this guide are based on a 12-inch soil sampling depth and banded fertilizer application with a minium distance of 2 inches to the side and 2 inches below the seed.
Nitrogen (N)Nitrogen deficiency symptoms include
yellowing of mature lower leaves and stunting of the plant. Too much N can result in excessive foliage, delayed maturity, and increased fungal pressure (white and grey molds) due to decreased air flow and higher humidity in the plant canopy.
A successful nutrient management program incorporates the following best nutrient management practices: • Selecting an appropriate fertilizer source• Applying fertilizer at the correct time• Using the correct rate• Choosing the best placement
These practices will maximize crop response and limit environmental losses.
The recommendations in this guide are general. Site-specific management is necessary to tailor a nutrient management program to your system based on past experience, soil type, cropping history, or presence of deficiency symptoms (past or present).
Implementing a successful nutrient management program
RateApply 40 to 80 lb N/a. This N rate is sufficient
to optimize production in most fields and for most planting dates. In N response trials conducted at Oregon State University’s North Willamette Research and Extension Center (variety ‘OSU 91G’), maximum yields were reached at 40 and 80 lb N/a in 1994 and 1995, respectively (Hart and Hemphill, 2001). There has been no research on using a preplant soil nitrate test to adjust fertilizer rates for snap beans grown in Oregon.
Average N accumulation for snap beans grown in western Oregon is approximately 120 lb/a (Table 1, page 4). If only 40 to 80 lb N/a is needed to maximize yield, where does the remaining N come from? Bean plants obtain nonfertilizer N from two sources: (1) decomposition of soil organic matter (SOM), which releases plant-available N, and (2) atmospheric N fixation in root nodules colonized by Rhizobium bacteria.
SOM decomposition generally can supply 50 to 90 lb N/a over the cropping cycle (approximately 65 days) for conventionally managed soils in the Willamette Valley. Because the decomposition rate depends on soil temperature, an early spring planting may require higher fertilizer N rates than beans planted later in the season.
3
A portion of total N accumulation is also supplied by atmospheric N fixation. As a legume, snap beans are capable of forming a symbiotic relationship with Rhizobium bacteria that convert inert atmospheric N2 gas into a form that plants can use. Nitrogen fixation occurs in root nodules populated by the bacteria Rhizobia phaseoli. In fields with a history of snap bean production, N-fixing bacteria should be present, and inoculation is unnecessary.
Although snap beans can compensate for low soil N availability by increasing nodulation, they are inefficient N fixers, and nodulation cannot supply the plant’s entire N need. To optimize plant growth and yield, N fertilization is required.
Timing and placementDuring the first half of the crop cycle
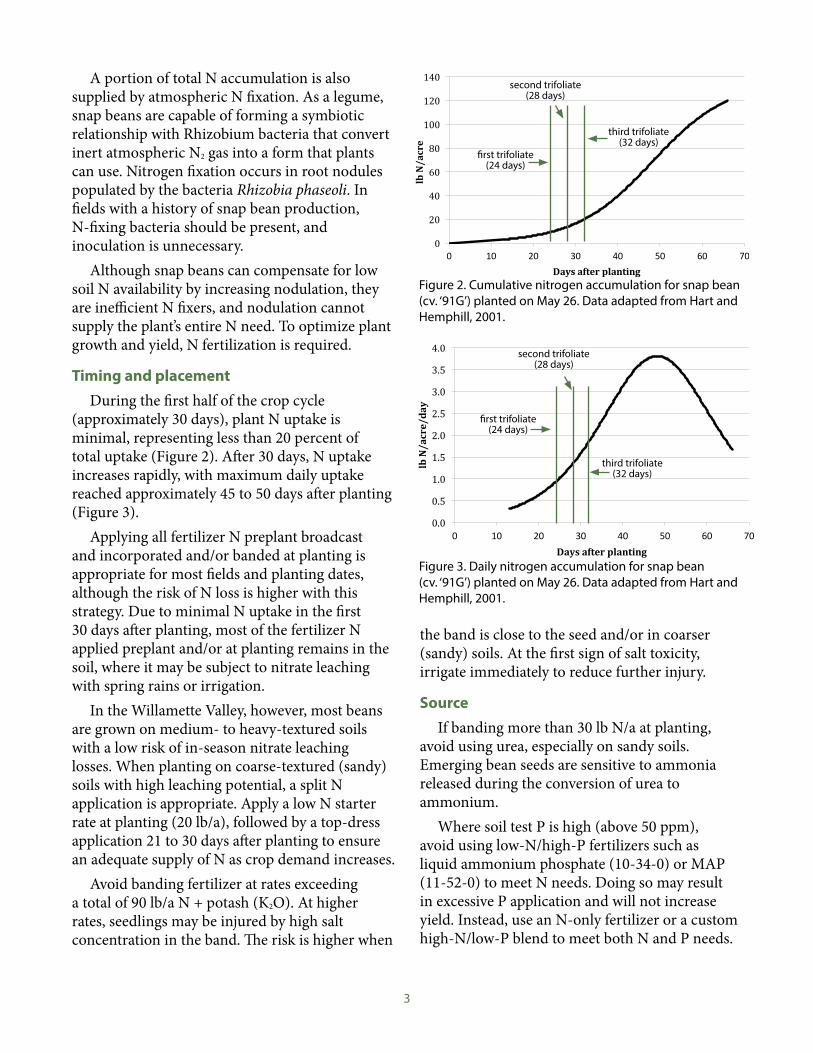
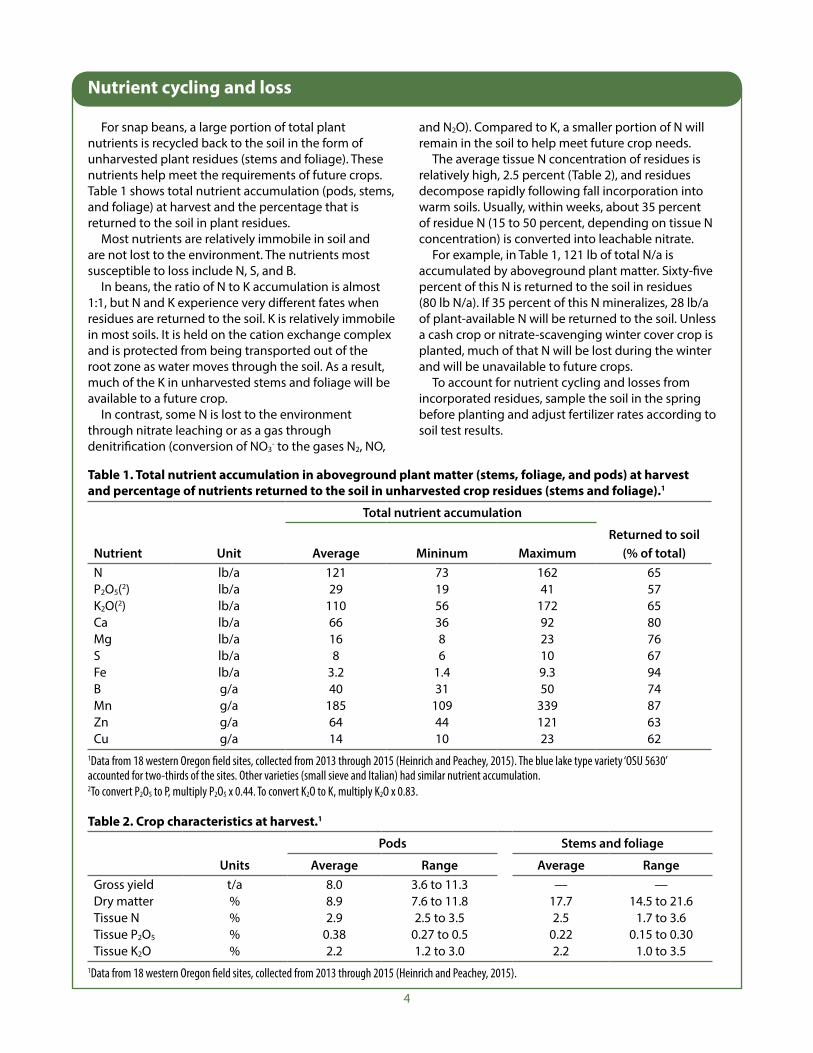
(approximately 30 days), plant N uptake is minimal, representing less than 20 percent of total uptake (Figure 2). After 30 days, N uptake increases rapidly, with maximum daily uptake reached approximately 45 to 50 days after planting (Figure 3).
Applying all fertilizer N preplant broadcast and incorporated and/or banded at planting is appropriate for most fields and planting dates, although the risk of N loss is higher with this strategy. Due to minimal N uptake in the first 30 days after planting, most of the fertilizer N applied preplant and/or at planting remains in the soil, where it may be subject to nitrate leaching with spring rains or irrigation.
In the Willamette Valley, however, most beans are grown on medium- to heavy-textured soils with a low risk of in-season nitrate leaching losses. When planting on coarse-textured (sandy) soils with high leaching potential, a split N application is appropriate. Apply a low N starter rate at planting (20 lb/a), followed by a top-dress application 21 to 30 days after planting to ensure an adequate supply of N as crop demand increases.
Avoid banding fertilizer at rates exceeding a total of 90 lb/a N + potash (K2O). At higher rates, seedlings may be injured by high salt concentration in the band. The risk is higher when
3
A portion of total N accumulation is also supplied by atmospheric N fixation. As a legume, snap beans are capable of forming a symbiotic relationship with Rhizobium bacteria that convert inert atmospheric N2 gas into a form that plants can use. Nitrogen fixation occurs in root nodules populated by the bacteria Rhizobia phaseoli. In fields with a history of snap bean production, N-fixing bacteria should be present, and inoculation is unnecessary.
Although snap beans can compensate for low soil N availability by increasing nodulation, they are inefficient N fixers, and nodulation cannot entirely support the plant’s N demand. To optimize plant growth and yield, N fertilization is required.
Timing and Placement During the first half of the crop cycle (approximately 30 days), plant N uptake is minimal, representing less than 20 percent of total uptake (Figure 2). After 30 days, N uptake increases rapidly, with maximum daily uptake reached approximately 45 to 50 days after planting (Figure 3).
Figure 2. Cumulative nitrogen accumulation for snap bean (cv. ‘91G’) planted on May 26. Data adapted from Hart and Hemphill, 2001. (growth stages to put on graph: 1st
trifoliate 24 d (8 lb N), 2nd trifoliate 28 d (15 lb N), and 3rd trifoliate 32 d (18 lb N).
0
20
40
60
80
100
120
140
0 10 20 30 40 50 60 70
lbN/acre
Daysafterplanting
first trifoliate (24 days)
third trifoliate (32 days)
second trifoliate (28 days)
3
A portion of total N accumulation is also supplied by atmospheric N fixation. As a legume, snap beans are capable of forming a symbiotic relationship with Rhizobium bacteria that convert inert atmospheric N2 gas into a form that plants can use. Nitrogen fixation occurs in root nodules populated by the bacteria Rhizobia phaseoli. In fields with a history of snap bean production, N-fixing bacteria should be present, and inoculation is unnecessary.
Although snap beans can compensate for low soil N availability by increasing nodulation, they are inefficient N fixers, and nodulation cannot entirely support the plant’s N demand. To optimize plant growth and yield, N fertilization is required.
Timing and Placement During the first half of the crop cycle (approximately 30 days), plant N uptake is minimal, representing less than 20 percent of total uptake (Figure 2). After 30 days, N uptake increases rapidly, with maximum daily uptake reached approximately 45 to 50 days after planting (Figure 3).
Figure 2. Cumulative nitrogen accumulation for snap bean (cv. ‘91G’) planted on May 26. Data adapted from Hart and Hemphill, 2001. (growth stages to put on graph: 1st
trifoliate 24 d (8 lb N), 2nd trifoliate 28 d (15 lb N), and 3rd trifoliate 32 d (18 lb N).
Figure 3. Daily nitrogen accumulation for snap bean (cv. ‘91G’) planted on May 26. Data adapted from Hart and Hemphill, 2001. (growth stages to put on graph: 1st trifoliate 24 d (8 lb N), 2nd trifoliate 28 d (15 lb N), and 3rd trifoliate 32 d (18 lb N).
Applying all fertilizer N preplant broadcast and incorporated and/or banded at planting is appropriate for most fields and planting dates, although the risk of N loss is higher with this strategy. Due to minimal N uptake in the first 30 days after planting, most of the
0.0
0.5
1.0
1.5
2.0
2.5
3.0
3.5
4.0
0 10 20 30 40 50 60 70
lbN/acre/day
Daysafterplanting
first trifoliate (24 days)
second trifoliate (28 days)
third trifoliate (32 days)
the band is close to the seed and/or in coarser (sandy) soils. At the first sign of salt toxicity, irrigate immediately to reduce further injury.
SourceIf banding more than 30 lb N/a at planting,
avoid using urea, especially on sandy soils. Emerging bean seeds are sensitive to ammonia released during the conversion of urea to ammonium.
Where soil test P is high (above 50 ppm), avoid using low-N/high-P fertilizers such as liquid ammonium phosphate (10-34-0) or MAP (11-52-0) to meet N needs. Doing so may result in excessive P application and will not increase yield. Instead, use an N-only fertilizer or a custom high-N/low-P blend to meet both N and P needs.
Figure 3. Daily nitrogen accumulation for snap bean (cv. ‘91G’) planted on May 26. Data adapted from Hart and Hemphill, 2001.
Figure 2. Cumulative nitrogen accumulation for snap bean (cv. ‘91G’) planted on May 26. Data adapted from Hart and Hemphill, 2001.
4
For snap beans, a large portion of total plant nutrients is recycled back to the soil in the form of unharvested plant residues (stems and foliage). These nutrients help meet the requirements of future crops. Table 1 shows total nutrient accumulation (pods, stems, and foliage) at harvest and the percentage that is returned to the soil in plant residues.
Most nutrients are relatively immobile in soil and are not lost to the environment. The nutrients most susceptible to loss include N, S, and B.
In beans, the ratio of N to K accumulation is almost 1:1, but N and K experience very different fates when residues are returned to the soil. K is relatively immobile in most soils. It is held on the cation exchange complex and is protected from being transported out of the root zone as water moves through the soil. As a result, much of the K in unharvested stems and foliage will be available to a future crop.
In contrast, some N is lost to the environment through nitrate leaching or as a gas through denitrification (conversion of NO3
- to the gases N2, NO,
and N2O). Compared to K, a smaller portion of N will remain in the soil to help meet future crop needs.
The average tissue N concentration of residues is relatively high, 2.5 percent (Table 2), and residues decompose rapidly following fall incorporation into warm soils. Usually, within weeks, about 35 percent of residue N (15 to 50 percent, depending on tissue N concentration) is converted into leachable nitrate.
For example, in Table 1, 121 lb of total N/a is accumulated by aboveground plant matter. Sixty-five percent of this N is returned to the soil in residues (80 lb N/a). If 35 percent of this N mineralizes, 28 lb/a of plant-available N will be returned to the soil. Unless a cash crop or nitrate-scavenging winter cover crop is planted, much of that N will be lost during the winter and will be unavailable to future crops.
To account for nutrient cycling and losses from incorporated residues, sample the soil in the spring before planting and adjust fertilizer rates according to soil test results.
Nutrient cycling and loss
Table 2. Crop characteristics at harvest.1
Pods Stems and foliage
Units Average Range Average RangeGross yield t/a 8.0 3.6 to 11.3 — —Dry matter % 8.9 7.6 to 11.8 17.7 14.5 to 21.6Tissue N % 2.9 2.5 to 3.5 2.5 1.7 to 3.6Tissue P2O5 % 0.38 0.27 to 0.5 0.22 0.15 to 0.30Tissue K2O % 2.2 1.2 to 3.0 2.2 1.0 to 3.5
1Data from 18 western Oregon field sites, collected from 2013 through 2015 (Heinrich and Peachey, 2015).
Table 1. Total nutrient accumulation in aboveground plant matter (stems, foliage, and pods) at harvest and percentage of nutrients returned to the soil in unharvested crop residues (stems and foliage).1
Total nutrient accumulation
Nutrient Unit Average Mininum MaximumReturned to soil
(% of total)N lb/a 121 73 162 65P2O5(2) lb/a 29 19 41 57K2O(2) lb/a 110 56 172 65Ca lb/a 66 36 92 80Mg lb/a 16 8 23 76S lb/a 8 6 10 67Fe lb/a 3.2 1.4 9.3 94B g/a 40 31 50 74Mn g/a 185 109 339 87Zn g/a 64 44 121 63Cu g/a 14 10 23 62
1Data from 18 western Oregon field sites, collected from 2013 through 2015 (Heinrich and Peachey, 2015). The blue lake type variety ‘OSU 5630’ accounted for two-thirds of the sites. Other varieties (small sieve and Italian) had similar nutrient accumulation. 2To convert P2O5 to P, multiply P2O5 x 0.44. To convert K2O to K, multiply K2O x 0.83.
5
Phosphorus (P)Low P affects plants primarily through reduced
leaf area development rather than through reduced photosynthetic capacity of developed leaves (Lynch et al., 1991). Phosphorus deficiency can result in delayed pod maturity and reduced yield.
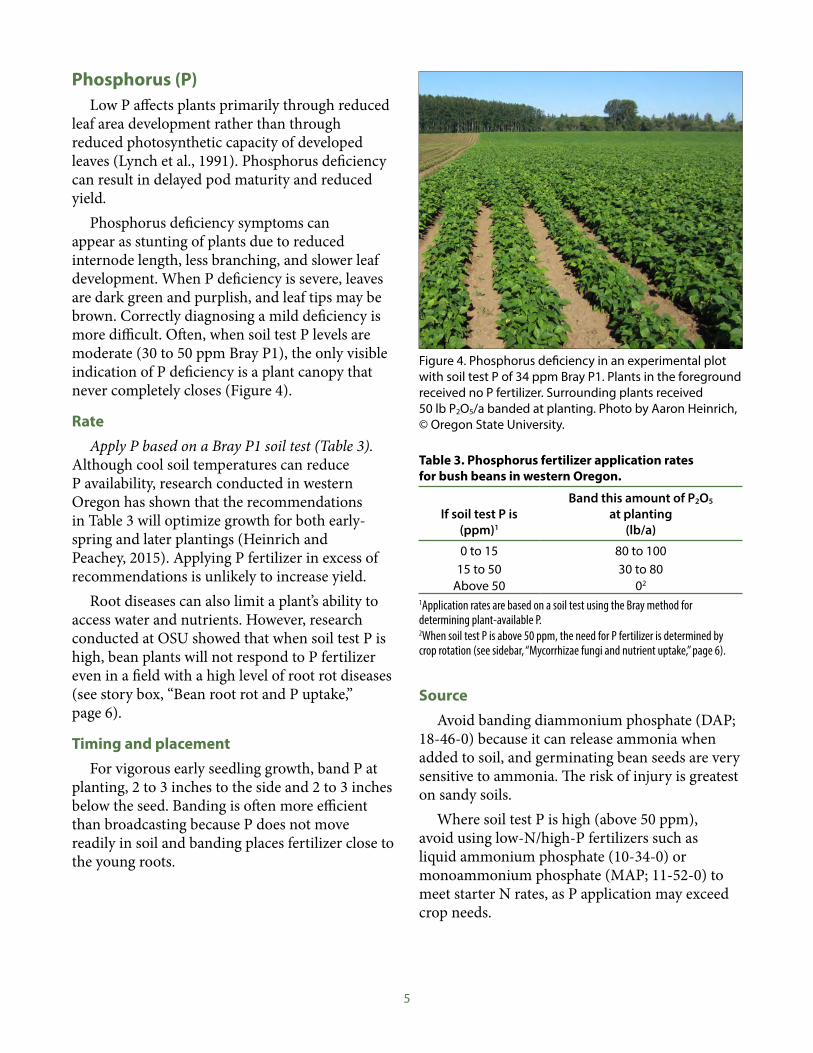
Phosphorus deficiency symptoms can appear as stunting of plants due to reduced internode length, less branching, and slower leaf development. When P deficiency is severe, leaves are dark green and purplish, and leaf tips may be brown. Correctly diagnosing a mild deficiency is more difficult. Often, when soil test P levels are moderate (30 to 50 ppm Bray P1), the only visible indication of P deficiency is a plant canopy that never completely closes (Figure 4).
RateApply P based on a Bray P1 soil test (Table 3).
Although cool soil temperatures can reduce P availability, research conducted in western Oregon has shown that the recommendations in Table 3 will optimize growth for both early-spring and later plantings (Heinrich and Peachey, 2015). Applying P fertilizer in excess of recommendations is unlikely to increase yield.
Root diseases can also limit a plant’s ability to access water and nutrients. However, research conducted at OSU showed that when soil test P is high, bean plants will not respond to P fertilizer even in a field with a high level of root rot diseases (see story box, “Bean root rot and P uptake,” page 6).
Timing and placementFor vigorous early seedling growth, band P at
planting, 2 to 3 inches to the side and 2 to 3 inches below the seed. Banding is often more efficient than broadcasting because P does not move readily in soil and banding places fertilizer close to the young roots.
Table 3. Phosphorus fertilizer application rates for bush beans in western Oregon.
If soil test P is (ppm)1
Band this amount of P2O5 at planting
(lb/a)
0 to 15 80 to 10015 to 50 30 to 80
Above 50 02
1Application rates are based on a soil test using the Bray method for determining plant-available P.2When soil test P is above 50 ppm, the need for P fertilizer is determined by crop rotation (see sidebar, “Mycorrhizae fungi and nutrient uptake,” page 6).
Figure 4. Phosphorus deficiency in an experimental plot with soil test P of 34 ppm Bray P1. Plants in the foreground received no P fertilizer. Surrounding plants received 50 lb P2O5/a banded at planting. Photo by Aaron Heinrich, © Oregon State University.
SourceAvoid banding diammonium phosphate (DAP;
18-46-0) because it can release ammonia when added to soil, and germinating bean seeds are very sensitive to ammonia. The risk of injury is greatest on sandy soils.
Where soil test P is high (above 50 ppm), avoid using low-N/high-P fertilizers such as liquid ammonium phosphate (10-34-0) or monoammonium phosphate (MAP; 11-52-0) to meet starter N rates, as P application may exceed crop needs.
6
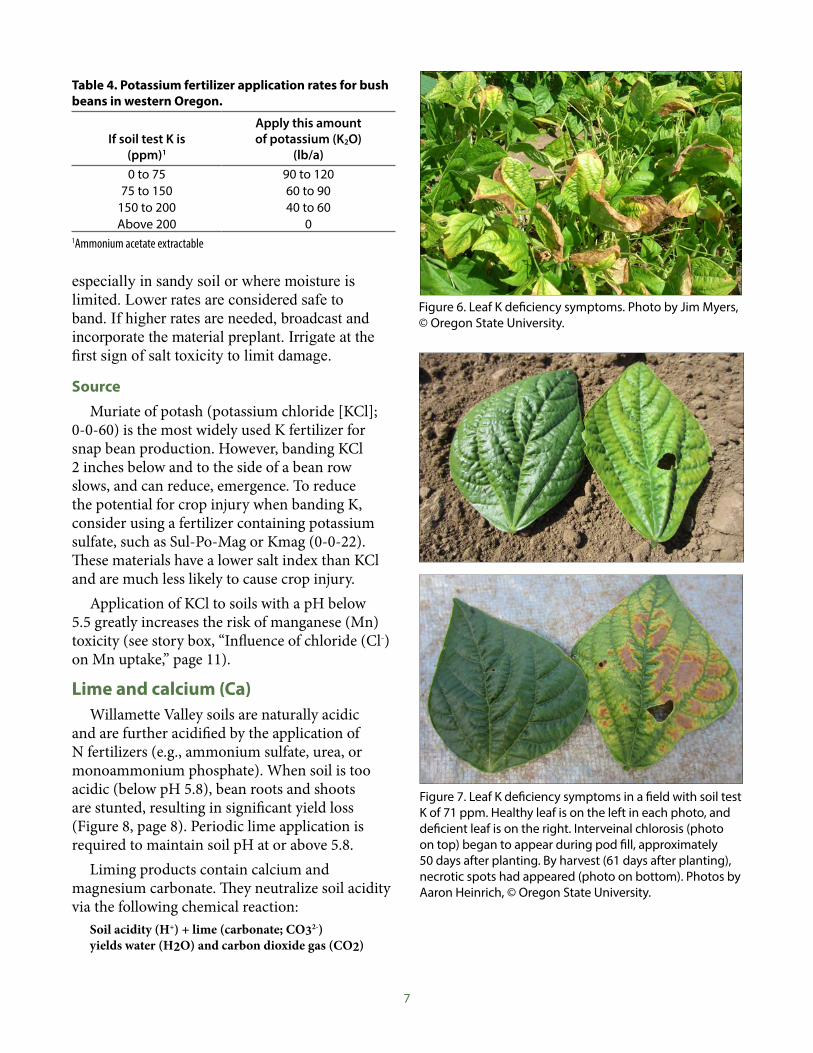
Potassium (K)Signs of K deficiency may include white, yellow,
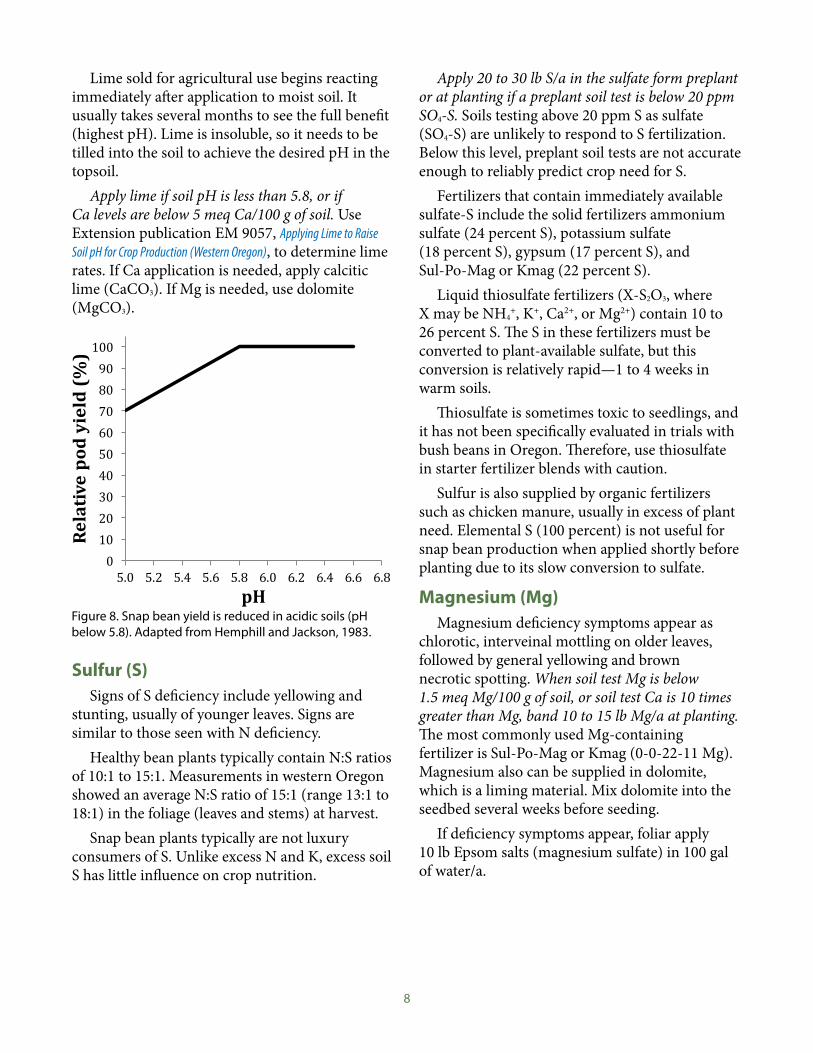
or brown streaks or spots, typically on the outer edges of older leaves (Figure 6, page 7). Where soil test K levels are moderate, plants may exhibit no deficiency symptoms or reduction in growth until after pod set. Once pods start to develop, K is moved from foliage to pods, possibly resulting in leaf deficiency symptoms (Figure 7, page 7).
Rate, timing, and placementApply K based on an ammonium acetate soil test
(Table 4, page 7). Snap beans have a low tolerance to soluble
salts. If applying more than 90 lb/a N + potash (K2O), or more than 60 lb K2O, do not band fertilizer at planting. Above these amounts, the risk of salt damage and yield loss increases,
Roots of many plants, including snap beans, form a symbiotic association with vesicular-arbuscular mycorrhizae (VAM) fungi. Roots colonized by VAM fungi can access a greater volume of soil than uncolonized roots. This association aids the plant in extracting nutrients and water from the soil. Although VAM fungi can enhance uptake of most nutrients, improved plant growth is most often associated with increased P or zinc (Zn) uptake.
Crop rotation can have a large influence on VAM colonization. Research in Idaho compared dry beans planted following a non-VAM host crop, fallow, and a VAM host crop. Zinc uptake was lower in beans planted following a non-VAM host crop or fallow, compared to beans following a VAM host crop, regardless of Zn fertilization rates (Leggett and Westerman, 1986; Hamilton et al., 1993). These studies attributed lower Zn uptake to lower VAM fungal populations in the fallow and non-VAM host crop soils.
Crops that do not form VAM associations include those in the beet family (e.g., table beets, spinach, and Swiss chard) and brassica family (e.g., canola, mustard, cabbage, and broccoli). When planting snap beans following fallow or a non-VAM host crop, Zn and P fertilization may be necessary even when the soil test value indicates a low probability of response to fertilizer.
Mycorrhizae fungi and nutrient uptake
Bean root rot and P uptakeThe pathogens responsible for bean root
rot (Fusarium solani, Pythium species, and Rhizoctonia solani) impair root function and cause root death, resulting in a poorly developed root system that limits the plant’s access to nutrients and water. In fields with a history of snap bean production, root rot can significantly reduce yields, especially with rotations of 3 years or fewer.
QuestionWhen a high level of root rot is anticipated, do
snap bean plants require additional P fertilizer beyond the recommendations given in Table 3?
MethodPlots in a field with high soil test P (100 ppm)
and 3 consecutive years of bean production were fumigated with chloropicrin. Beans (‘OSU 5630’) were planted 3 weeks later on May 30, 2014. At planting, P fertilizer was banded at rates of 0, 15, 30, and 60 lb P2O5/a. At harvest (63 days after planting), aboveground crop biomass and pod yield were measured.
ResultsIn response to reduced disease pressure, plants
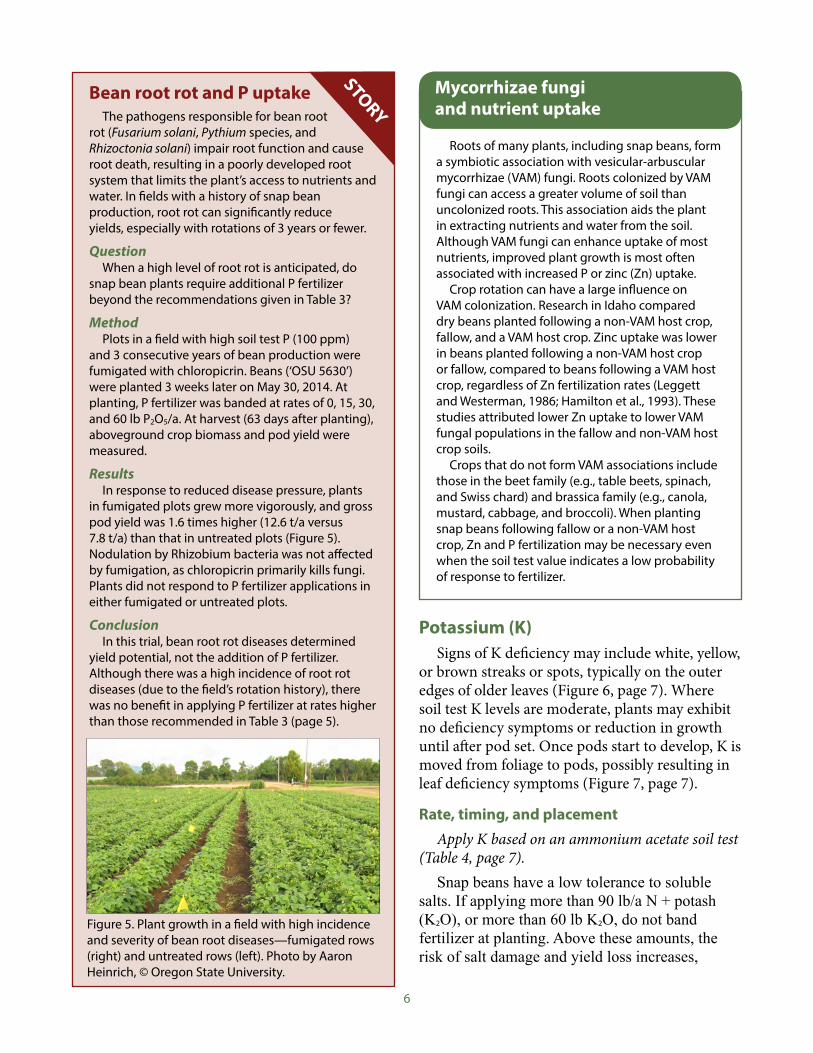
in fumigated plots grew more vigorously, and gross pod yield was 1.6 times higher (12.6 t/a versus 7.8 t/a) than that in untreated plots (Figure 5). Nodulation by Rhizobium bacteria was not affected by fumigation, as chloropicrin primarily kills fungi. Plants did not respond to P fertilizer applications in either fumigated or untreated plots.
ConclusionIn this trial, bean root rot diseases determined
yield potential, not the addition of P fertilizer. Although there was a high incidence of root rot diseases (due to the field’s rotation history), there was no benefit in applying P fertilizer at rates higher than those recommended in Table 3 (page 5).
STORY
Figure 5. Plant growth in a field with high incidence and severity of bean root diseases—fumigated rows (right) and untreated rows (left). Photo by Aaron Heinrich, © Oregon State University.
7
especially in sandy soil or where moisture is limited. Lower rates are considered safe to band. If higher rates are needed, broadcast and incorporate the material preplant. Irrigate at the first sign of salt toxicity to limit damage.
SourceMuriate of potash (potassium chloride [KCl];
0-0-60) is the most widely used K fertilizer for snap bean production. However, banding KCl 2 inches below and to the side of a bean row slows, and can reduce, emergence. To reduce the potential for crop injury when banding K, consider using a fertilizer containing potassium sulfate, such as Sul-Po-Mag or Kmag (0-0-22). These materials have a lower salt index than KCl and are much less likely to cause crop injury.
Application of KCl to soils with a pH below 5.5 greatly increases the risk of manganese (Mn) toxicity (see story box, “Influence of chloride (Cl-) on Mn uptake,” page 11).
Lime and calcium (Ca)Willamette Valley soils are naturally acidic
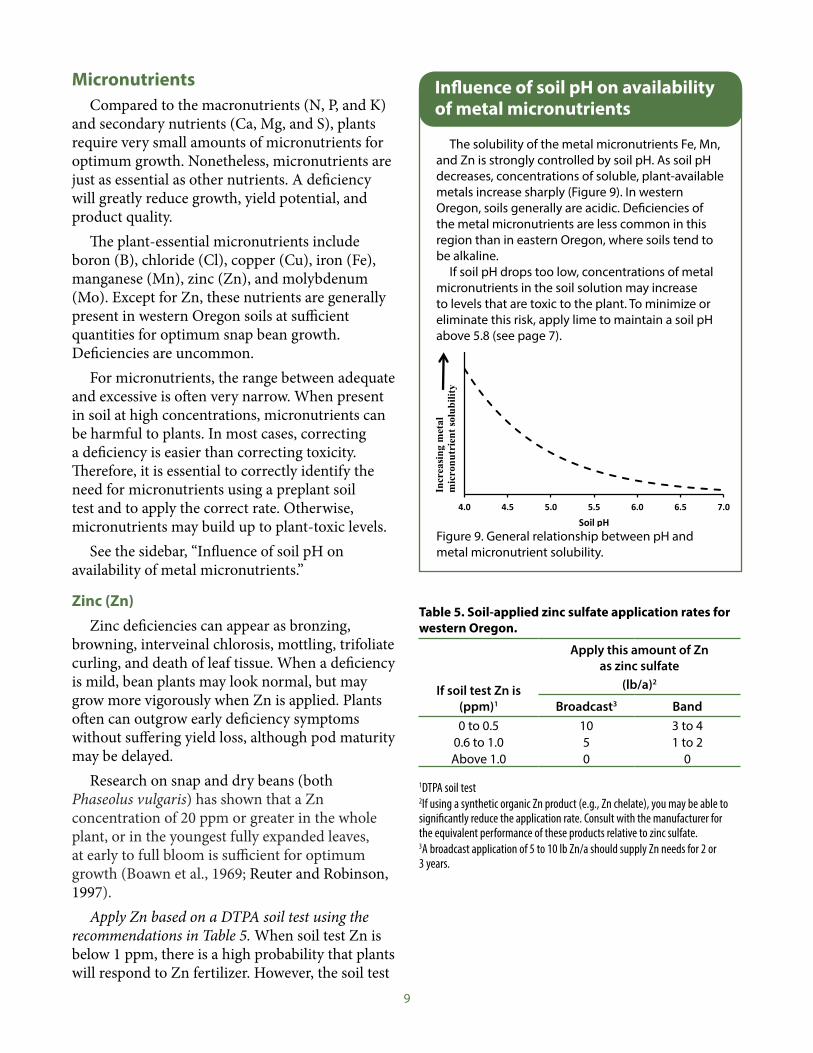
and are further acidified by the application of N fertilizers (e.g., ammonium sulfate, urea, or monoammonium phosphate). When soil is too acidic (below pH 5.8), bean roots and shoots are stunted, resulting in significant yield loss (Figure 8, page 8). Periodic lime application is required to maintain soil pH at or above 5.8.
Liming products contain calcium and magnesium carbonate. They neutralize soil acidity via the following chemical reaction: Soil acidity (H+) + lime (carbonate; CO32-)
yields water (H2O) and carbon dioxide gas (CO2)
Table 4. Potassium fertilizer application rates for bush beans in western Oregon.
If soil test K is (ppm)1
Apply this amount of potassium (K2O)
(lb/a)0 to 75 90 to 120
75 to 150 60 to 90150 to 200 40 to 60Above 200 0
1Ammonium acetate extractable
Figure 7. Leaf K deficiency symptoms in a field with soil test K of 71 ppm. Healthy leaf is on the left in each photo, and deficient leaf is on the right. Interveinal chlorosis (photo on top) began to appear during pod fill, approximately 50 days after planting. By harvest (61 days after planting), necrotic spots had appeared (photo on bottom). Photos by Aaron Heinrich, © Oregon State University.
Figure 6. Leaf K deficiency symptoms. Photo by Jim Myers, © Oregon State University.
8
Lime sold for agricultural use begins reacting immediately after application to moist soil. It usually takes several months to see the full benefit (highest pH). Lime is insoluble, so it needs to be tilled into the soil to achieve the desired pH in the topsoil.
Apply lime if soil pH is less than 5.8, or if Ca levels are below 5 meq Ca/100 g of soil. Use Extension publication EM 9057, Applying Lime to Raise Soil pH for Crop Production (Western Oregon), to determine lime rates. If Ca application is needed, apply calcitic lime (CaCO3). If Mg is needed, use dolomite (MgCO3).
7
Figure 7. Snap bean yield is reduced in acidic soils (pH below 5.8). Adapted from Hemphill and Jackson, 1983.
Lime is calcium carbonate. It neutralizes soil acidity via the following chemical reaction: Soilacidity(H+)+lime(carbonate;CO3
2-)yieldswater(H2O)andcarbondioxidegas(CO2)
Lime sold for agricultural use begins reacting immediately after application to moist soil. It usually takes several months to see the full benefit (highest pH). Lime is insoluble, so it needs to be tilled into the soil to achieve the desired pH in the topsoil.
Apply lime if the soil pH is less than 5.8, or if Ca levels are below 5 meq Ca/100 g of soil. Use Extension publication EM 9057, Applying Lime to Raise Soil pH for Crop Production (Western Oregon), to determine lime rates. If Ca application is needed, apply calcitic lime (CaCO3). If Mg is needed (see page X), use dolomite (MgCO3).
Sulfur (S) Signs of S deficiency include yellowing and stunting, usually of younger leaves. Signs are similar to those seen with N deficiency.
Healthy bean plants typically contain N:S ratios of 10:1 to 15:1. Measurements in western Oregon showed an average N:S ratio of 15:1 (range 13:1 to 18:1) in the foliage (leaves and stems) at harvest.
Snap bean plants typically are not luxury consumers of S. Unlike excess N and K, excess soil S has little influence on crop nutrition.
Apply 20 to 30 lb S/a in the sulfate form preplant or at planting if a preplant soil test is below 20 ppm SO4-S. Soils testing above 20 ppm S as sulfate (SO4-S) are unlikely to respond to S fertilization. Below this level, preplant soil tests are not accurate enough to reliably predict crop need for S.
0102030405060708090100
5.0 5.2 5.4 5.6 5.8 6.0 6.2 6.4 6.6 6.8
Relativepodyield(%
)
pH
Apply 20 to 30 lb S/a in the sulfate form preplant or at planting if a preplant soil test is below 20 ppm SO4-S. Soils testing above 20 ppm S as sulfate (SO4-S) are unlikely to respond to S fertilization. Below this level, preplant soil tests are not accurate enough to reliably predict crop need for S.
Fertilizers that contain immediately available sulfate-S include the solid fertilizers ammonium sulfate (24 percent S), potassium sulfate (18 percent S), gypsum (17 percent S), and Sul-Po-Mag or Kmag (22 percent S).
Liquid thiosulfate fertilizers (X-S2O3, where X may be NH4
+, K+, Ca2+, or Mg2+) contain 10 to 26 percent S. The S in these fertilizers must be converted to plant-available sulfate, but this conversion is relatively rapid—1 to 4 weeks in warm soils.
Thiosulfate is sometimes toxic to seedlings, and it has not been specifically evaluated in trials with bush beans in Oregon. Therefore, use thiosulfate in starter fertilizer blends with caution.
Sulfur is also supplied by organic fertilizers such as chicken manure, usually in excess of plant need. Elemental S (100 percent) is not useful for snap bean production when applied shortly before planting due to its slow conversion to sulfate.
Magnesium (Mg)Magnesium deficiency symptoms appear as
chlorotic, interveinal mottling on older leaves, followed by general yellowing and brown necrotic spotting. When soil test Mg is below 1.5 meq Mg/100 g of soil, or soil test Ca is 10 times greater than Mg, band 10 to 15 lb Mg/a at planting. The most commonly used Mg-containing fertilizer is Sul-Po-Mag or Kmag (0-0-22-11 Mg). Magnesium also can be supplied in dolomite, which is a liming material. Mix dolomite into the seedbed several weeks before seeding.
If deficiency symptoms appear, foliar apply 10 lb Epsom salts (magnesium sulfate) in 100 gal of water/a.
Figure 8. Snap bean yield is reduced in acidic soils (pH below 5.8). Adapted from Hemphill and Jackson, 1983.
Sulfur (S) Signs of S deficiency include yellowing and
stunting, usually of younger leaves. Signs are similar to those seen with N deficiency.
Healthy bean plants typically contain N:S ratios of 10:1 to 15:1. Measurements in western Oregon showed an average N:S ratio of 15:1 (range 13:1 to 18:1) in the foliage (leaves and stems) at harvest.
Snap bean plants typically are not luxury consumers of S. Unlike excess N and K, excess soil S has little influence on crop nutrition.
9
MicronutrientsCompared to the macronutrients (N, P, and K)
and secondary nutrients (Ca, Mg, and S), plants require very small amounts of micronutrients for optimum growth. Nonetheless, micronutrients are just as essential as other nutrients. A deficiency will greatly reduce growth, yield potential, and product quality.
The plant-essential micronutrients include boron (B), chloride (Cl), copper (Cu), iron (Fe), manganese (Mn), zinc (Zn), and molybdenum (Mo). Except for Zn, these nutrients are generally present in western Oregon soils at sufficient quantities for optimum snap bean growth. Deficiencies are uncommon.
For micronutrients, the range between adequate and excessive is often very narrow. When present in soil at high concentrations, micronutrients can be harmful to plants. In most cases, correcting a deficiency is easier than correcting toxicity. Therefore, it is essential to correctly identify the need for micronutrients using a preplant soil test and to apply the correct rate. Otherwise, micronutrients may build up to plant-toxic levels.
See the sidebar, “Influence of soil pH on availability of metal micronutrients.”
Zinc (Zn)Zinc deficiencies can appear as bronzing,
browning, interveinal chlorosis, mottling, trifoliate curling, and death of leaf tissue. When a deficiency is mild, bean plants may look normal, but may grow more vigorously when Zn is applied. Plants often can outgrow early deficiency symptoms without suffering yield loss, although pod maturity may be delayed.
Research on snap and dry beans (both Phaseolus vulgaris) has shown that a Zn concentration of 20 ppm or greater in the whole plant, or in the youngest fully expanded leaves, at early to full bloom is sufficient for optimum growth (Boawn et al., 1969; Reuter and Robinson, 1997).
Apply Zn based on a DTPA soil test using the recommendations in Table 5. When soil test Zn is below 1 ppm, there is a high probability that plants will respond to Zn fertilizer. However, the soil test
The solubility of the metal micronutrients Fe, Mn, and Zn is strongly controlled by soil pH. As soil pH decreases, concentrations of soluble, plant-available metals increase sharply (Figure 9). In western Oregon, soils generally are acidic. Deficiencies of the metal micronutrients are less common in this region than in eastern Oregon, where soils tend to be alkaline.
If soil pH drops too low, concentrations of metal micronutrients in the soil solution may increase to levels that are toxic to the plant. To minimize or eliminate this risk, apply lime to maintain a soil pH above 5.8 (see page 7).
Figure 8. General relationship between pH and metal micronutrient solubility .
Sidebar: Foliar applications Foliar fertilization can be used to complement a soil-based fertility program, or as an
emergency in-season treatment to correct a micronutrient deficiency. It should not be used as the primary method of applying micronutrients. Plants are more effective at taking up nutrients through the roots than through the leaves, so preplant soil applications are generally more effective than foliar applications. Due to the relatively high cost of foliar-applied materials, soil application is also less expensive.
For foliar treatment to be effective, the deficiency must be diagnosed and fertilizer applied within 6 weeks of planting. Nutrients applied later will have little or no benefit. Effective transport of the nutrient into the plant is enhanced by adding a spreader sticker or surfactant to the fertilizer solution to maximize adhesion to the leaves. Depending on severity of the deficiency, multiple applications may be necessary.
Although foliar fertilization may eliminate visible deficiency symptoms, yield may not be affected.
No research has been conducted at OSU on the efficacy of foliar applications on snap beans.
4.0 4.5 5.0 5.5 6.0 6.5 7.0
SoilpH
Incr
easi
ng m
etal
m
icro
nutr
ient
solu
bilit
y
Influence of soil pH on availability of metal micronutrients
Table 5. Soil-applied zinc sulfate application rates for western Oregon.
If soil test Zn is (ppm)1
Apply this amount of Zn as zinc sulfate
(lb/a)2
Broadcast3 Band0 to 0.5 10 3 to 4
0.6 to 1.0 5 1 to 2Above 1.0 0 0
1DTPA soil test2If using a synthetic organic Zn product (e.g., Zn chelate), you may be able to significantly reduce the application rate. Consult with the manufacturer for the equivalent performance of these products relative to zinc sulfate.3A broadcast application of 5 to 10 lb Zn/a should supply Zn needs for 2 or 3 years.
Figure 9. General relationship between pH and metal micronutrient solubility.
10
DTPA value alone is not always a clear indication of the need for Zn fertilization, especially when the soil test value is at or near 1 ppm (see sidebar, “Mycorrhizae fungi and nutrient uptake,” page 6).
Zinc can be applied as an inorganic mineral compound (e.g., zinc sulfate), synthetic organic (e.g., chelates), or in natural organic materials (e.g., composts and manures). Synthetic organic Zn sources are considered superior to inorganic mineral compounds and can be applied at lower rates. However, due to their higher cost, they are generally used only for foliar applications.
Zinc in manures and compost is as effective at ameliorating Zn deficiencies as are inorganic or synthetic organic sources. Fields receiving regular applications of manures and compost usually have Zn concentrations well in excess of 1 ppm, and Zn application is not required.
Preplant soil application of Zn (broadcast and incorporated) or banding at planting is preferable to foliar applications. Compared to foliar-applied Zn, soil-applied Zn is more economical and easier to apply, and it provides Zn to roots throughout the season. To prevent plant injury, limit any single Zn foliar application to 1 lb Zn/a as zinc sulfate or 0.15 lb Zn/a as Zn chelate in 20 gal of water.
Boron (B)Beans are more susceptible to B toxicity than
to B deficiencies. In western Oregon, experiments in grower fields have shown no response to B applications.
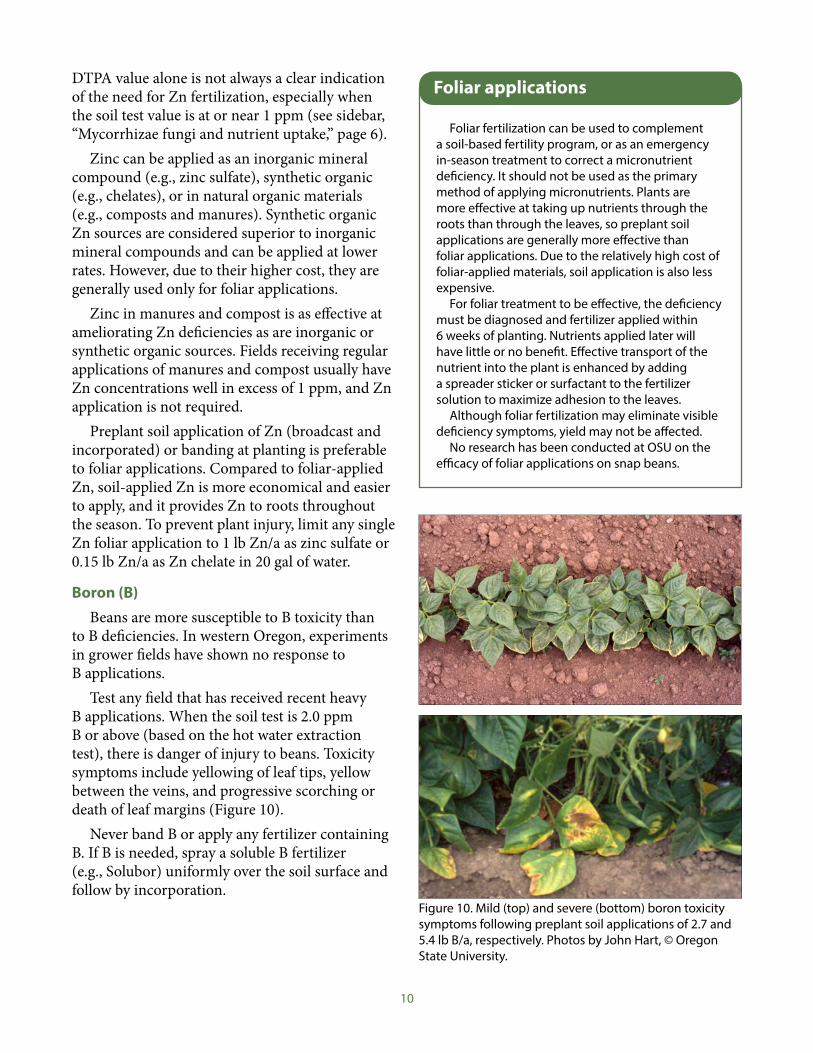
Test any field that has received recent heavy B applications. When the soil test is 2.0 ppm B or above (based on the hot water extraction test), there is danger of injury to beans. Toxicity symptoms include yellowing of leaf tips, yellow between the veins, and progressive scorching or death of leaf margins (Figure 10).
Never band B or apply any fertilizer containing B. If B is needed, spray a soluble B fertilizer (e.g., Solubor) uniformly over the soil surface and follow by incorporation.
Foliar fertilization can be used to complement a soil-based fertility program, or as an emergency in-season treatment to correct a micronutrient deficiency. It should not be used as the primary method of applying micronutrients. Plants are more effective at taking up nutrients through the roots than through the leaves, so preplant soil applications are generally more effective than foliar applications. Due to the relatively high cost of foliar-applied materials, soil application is also less expensive.
For foliar treatment to be effective, the deficiency must be diagnosed and fertilizer applied within 6 weeks of planting. Nutrients applied later will have little or no benefit. Effective transport of the nutrient into the plant is enhanced by adding a spreader sticker or surfactant to the fertilizer solution to maximize adhesion to the leaves.
Although foliar fertilization may eliminate visible deficiency symptoms, yield may not be affected.
No research has been conducted at OSU on the efficacy of foliar applications on snap beans.
Foliar applications
Figure 10. Mild (top) and severe (bottom) boron toxicity symptoms following preplant soil applications of 2.7 and 5.4 lb B/a, respectively. Photos by John Hart, © Oregon State University.
11
Manganese (Mn)Beans are sensitive to high levels of Mn in the
soil solution. In western Oregon, where soils are naturally acidic, Mn toxicity is more common in snap beans than is Mn deficiency. Manganese toxicity symptoms include chlorosis of newly emerged seedlings, chlorosis of leaf margins and interveinal chlorosis on primary leaves, cupping and crinkling of leaves, dark brown spots as leaves mature, and leaf death. Research in Oregon suggests that a concentration of approximately 600 ppm or greater in mature trifoliate leaves is the threshold for Mn toxicity (Jackson et al., 1966), although concentrations above 300 ppm are considered high (Reuter and Robinson, 1997).
To reduce the risk of Mn toxicity, maintain soil pH above 5.8. Applying KCl fertilizer to low-pH soils can increase the risk of Mn toxicity (see story box, “Influence of chloride (Cl-) on Mn uptake”).
AcknowledgmentsWe appreciate the support and collaboration
of the following farms and companies: NORPAC Foods, Pearmine Farms, Kenagy Family Farm, Cook Family Farms, E.A. Chambers Farm, Coleman Family Farms, Hendricks Farm, and Trident Agricultural Products, Inc.
Grants from the Agricultural Research Foundation and the Oregon Processed Vegetable Commission helped fund portions of the research presented in this publication.
For more informationEstimating Plant-available Nitrogen Release from Cover
Crops (PNW 636). November 2012. https://catalog.extension.oregonstate.edu/pnw636
Applying Lime to Raise Soil pH for Crop Production (Western Oregon) (EM 9057). May 2013. https://catalog.extension.oregonstate.edu/em9057
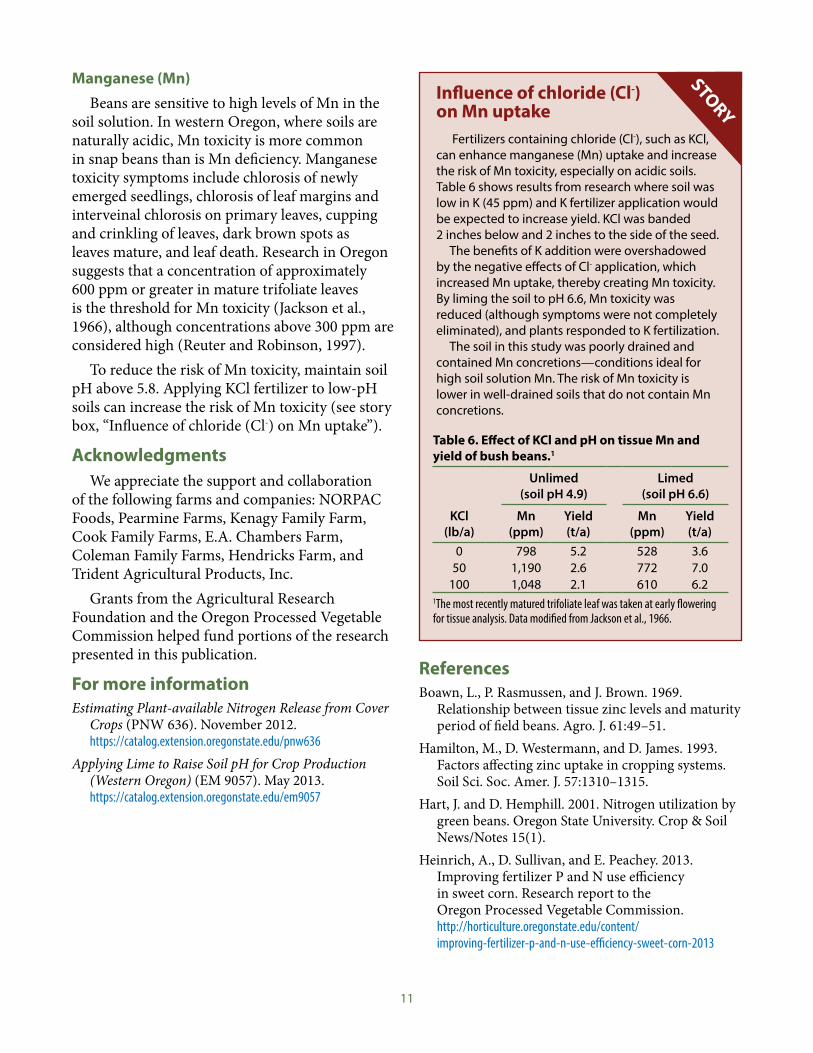
Influence of chloride (Cl-) on Mn uptake
Fertilizers containing chloride (Cl-), such as KCl, can enhance manganese (Mn) uptake and increase the risk of Mn toxicity, especially on acidic soils. Table 6 shows results from research where soil was low in K (45 ppm) and K fertilizer application would be expected to increase yield. KCl was banded 2 inches below and 2 inches to the side of the seed.
The benefits of K addition were overshadowed by the negative effects of Cl- application, which increased Mn uptake, thereby creating Mn toxicity. By liming the soil to pH 6.6, Mn toxicity was reduced (although symptoms were not completely eliminated), and plants responded to K fertilization.
The soil in this study was poorly drained and contained Mn concretions—conditions ideal for high soil solution Mn. The risk of Mn toxicity is lower in well-drained soils that do not contain Mn concretions.
ReferencesBoawn, L., P. Rasmussen, and J. Brown. 1969.
Relationship between tissue zinc levels and maturity period of field beans. Agro. J. 61:49–51.
Hamilton, M., D. Westermann, and D. James. 1993. Factors affecting zinc uptake in cropping systems. Soil Sci. Soc. Amer. J. 57:1310–1315.
Hart, J. and D. Hemphill. 2001. Nitrogen utilization by green beans. Oregon State University. Crop & Soil News/Notes 15(1).
Heinrich, A., D. Sullivan, and E. Peachey. 2013. Improving fertilizer P and N use efficiency in sweet corn. Research report to the Oregon Processed Vegetable Commission. http://horticulture.oregonstate.edu/content/improving-fertilizer-p-and-n-use-efficiency-sweet-corn-2013
STORY
Table 6. Effect of KCl and pH on tissue Mn and yield of bush beans.1
Unlimed (soil pH 4.9)
Limed (soil pH 6.6)
KCl (lb/a)
Mn (ppm)
Yield (t/a)
Mn (ppm)
Yield (t/a)
0 798 5.2 528 3.650 1,190 2.6 772 7.0
100 1,048 2.1 610 6.21The most recently matured trifoliate leaf was taken at early flowering for tissue analysis. Data modified from Jackson et al., 1966.
12
Heinrich, A. and E. Peachey. 2015. Fine-tuning P fertilizer rates for snap beans. Research report to the Oregon Processed Vegetable Commission. http://horticulture.oregonstate.edu/content/fine-tuning-p-fertilizer-rates-snap-beans-2015
Hemphill, D. and T. Jackson. 1982. Effect of soil acidity and nitrogen on yield and elemental concentration of bush bean, carrot, and lettuce. J. Amer. Soc. Hort. Sci. 107:740–744.
Jackson, T., D. Westermann, and D. Moore. 1966. The effect of chloride and lime on the manganese uptake by bush beans and sweet corn. Soil Sci. Soc. Am. Proc. 30:70–73.
© 2016 Oregon State University. Extension work is a cooperative program of Oregon State University, the U.S. Department of Agriculture, and Oregon counties. Oregon State University Extension Service offers educational programs, activities, and materials without discrimination on the basis of race, color, national origin, religion, sex, gender identity (including gender expression), sexual orientation, disability, age, marital status, familial/parental status, income derived from a public assistance program, political beliefs, genetic information, veteran’s status, reprisal or retaliation for prior civil rights activity. (Not all prohibited bases apply to all programs.) Oregon State University Extension Service is an AA/EOE/Veterans/Disabled.
Published November 2016.
Leggett, G. and D. Westermann. 1986. Effect of corn, sugarbeets, and fallow on zinc availability to subsequent crops. Soil Sci. Soc. Am. J. 50:963–968.
Lynch, J., A. Lauchli, and E. Epstein. 1991. Vegetative growth of the common bean in response to phosphorus nutrition. Crop Sci. 31:380–387.
Reuter, D. and J. Robinson. 1997. Plant Analysis—An Interpretive Manual, 2nd ed. CSIRO Publishing, Collingwood, Australia.