Embed Size (px)
Citation preview

MARINE ECOLOGY PROGRESS SERIESMar Ecol Prog Ser
Vol. 262: 253–265, 2003 Published November 7
INTRODUCTION
The home-range parameters of animals interest biol-ogists for 2 main reasons (Schoener 1981): (1) home-range size can be related to feeding strategy, food den-sity, resource use, metabolic demands, behaviour andefficiency of movement; (2) home-range characteristics
can reflect both inter- and intraspecific interactions.Home range parameters interest conservationists andfisheries managers through their direct application tospecies management. For example, an understandingof fish home-range or behaviour is crucial to the effec-tiveness of marine reserve design (Roberts & Polunin1991, Attwood & Bennett 1994, Holland et al. 1996,
© Inter-Research 2003 · www.int-res.com*Email: [email protected]
Snapper Pagrus auratus (Sparidae) home rangedynamics: acoustic tagging studies in a marine
reserve
D. M. Parsons1, 5,*, R. C. Babcock1, 6, R. K. S. Hankin2, T. J. Willis1, 7, J. P. Aitken3, 8, R. K. O’Dor3, 9, G. D. Jackson4
1Leigh Marine Laboratory, University of Auckland, PO Box 349, Warkworth, New Zealand2School of Geography and Environmental Science, University of Auckland, Private Bag 92019, Auckland 1020, New Zealand
3Department of Biology, Dalhousie University, Halifax, Nova Scotia B3H 4R2, Canada4Institute of Antarctic and Southern Ocean Studies, University of Tasmania, GPO Box 252-77 Hobart, Tasmania 7001, Australia
Present addresses: 5Department of Marine, Earth and Atmospheric Sciences, North Carolina State University, Box 8208,Raleigh, North Carolina 27695, USA
6CSIRO Marine Research, Private Bag 5, Wembley, Western Australia 6913, Australia7Scienze Ambientali, Università di Bologna, Via Tombesi dall’Ova 55, 48100 Ravenna, Italy
8Department of Zoology, Downing Street, University of Cambridge, Cambridge CB2 3EJ, UK9Census of Marine Life, 1755 Massachusetts Avenue, NW #800, Washington, DC 20036, USA
ABSTRACT: The home-range size and location of reef-associated snapper Pagrus auratus: Sparidaewere investigated by use of a radio acoustic-positioning telemetry (RAPT) system. Tags were surgi-cally implanted in 5 snapper that were subsequently monitored every minute for a period of 5 mo,and then intermittently over another 7 mo. Site fidelity was high amongst these fish, with homeranges not exceeding 650 m in diameter or 139 600 m2 in area. Eleven other snapper received tags byfeeding and were tracked for periods of up to 2.5 d. Site fidelity was also high for these fish, with stan-dardised estimates of home-range size not differing between the 2 groups. Home ranges overlappedconsiderably, indicating that the fish were not territorial. The location of the home ranges generallyremained stable throughout the entire tracking period, although 1 fish relocated its home range by~220 m. A new method of home-range estimation was developed, which matched the level of detailprovided by the RAPT system, to directly estimate the time spent in an area. The relevance of thismethod and the residential behaviour of these fish are discussed, with reference to the generalunderstanding of animal behaviour, previous investigations into snapper movement, and the selec-tive capacity that may be imposed by marine reserves on fish behaviour.
KEY WORDS: Pagrus auratus · Snapper behaviour · Home range · Site fidelity · Residency ·Utilisation distribution · New Zealand · Marine reserve
Resale or republication not permitted without written consent of the publisher
Mar Ecol Prog Ser 262: 253–265, 2003
Zeller 1997, Allison et al. 1998, Woodroffe & Ginsberg1998, Kramer & Chapman 1999, Willis et al. 2000).Whether the reserve’s goal is to increase fish abun-dance within the reserve (i.e. to protect brood stock) orto supplement the adjacent fishery through the emi-gration of fish or larval production from the reserve,both of these goals could be fulfilled by a spatialrestriction on fishing. However, the size of the reserverelative to the mobility of the fish will influence thedegree to which reserve population recovery is under-mined by emigration to fished areas. Theoretically, aspecies with intermediate dispersal capabilities, rela-tive to reserve size, should provide a balance betweenemigration to the fishery and accumulation of broodstock (DeMartini 1993). Species with higher mobilitywould not reside within the reserve long enough toreceive significant protection, while highly residentspecies would recover the fastest but would have lowemigration rates to fished areas.
In NE New Zealand, snapper Pagrus auratus (Spari-dae) form the basis of the largest commercial and recre-ational fishery (Annala et al. 1999). Snapper are also themost abundant carnivorous fish within the inshoreareas of northern New Zealand (Paul 1976), and areimportant at economic, cultural and ecological levels.For this reason marine reserve designs in NE NewZealand should optimise the effective protection ofsnapper. A well-designed reserve would maximisesnapper biomass and therefore increase egg produc-tion (e.g. Willis et al. 2003), as well as have the potentialto benefit the fishery through emigration of adults. Ifthese goals are achieved, reserves may allow eco-system ‘recovery’ by elevating snapper abundances toa level where exertion of top–down processes couldregulate lower trophic levels, altering community struc-ture and productivity to a state reflecting the absence offishing (Babcock et al. 1999, Shears & Babcock 2002).
Despite their local importance, current knowledge ofhome-range and space-use characteristics of snapperis lacking. There is evidence suggesting that both res-ident and mobile behaviours are exhibited by snapper.For example in Shark Bay, Western Australia, taggedsnapper from within the gulfs of Shark Bay were notrecaptured more than 42 km from where they weretagged, whereas snapper from the open coast wererecaptured up to 322 km from the tagging site (Moran1987). In New Zealand similar results have been gath-ered from tagging studies. The majority of recaptureshave been within 20 km of the tagging location, butsome snapper were recaptured up to 418 km from thesite of tagging (Paul 1967, Crossland 1976, Gilbert &McKenzie 1999).
Within the Cape Rodney to Okakari Point (CROP)Marine Reserve, the site of this study, the density ofsnapper above minimum legal size is 16 times greater
than in adjacent fished areas (Willis et al. 2003). As thereserve only encompasses 5 km of coastline, the ele-vated densities alone suggest a degree of site fidelity.Berquist (1994) investigated this residency by acousti-cally tagging 2 snapper within the reserve. Both fishremained within an 800 m diameter for 2 and 5 d,respectively. Using individually coded elastomer tags,Willis et al. (2001) marked 117 snapper within theCROP Reserve. Forty-nine of these fish were resightedrepeatedly over several months, and the greatestdistance between relocations was only 500 m.
The aim of this study was to describe the movementsof ‘resident’ snapper within the CROP Marine Reserve,using a radio-acoustic positioning and telemetry (RAPT)system to accurately track individuals over periods of afew months. The positional fixes provided by the RAPTsystem were often very frequent (every minute), butprovided at irregular intervals. Due to this irregularsampling frequency, we present a new method ofestimating home ranges where time is used as thecontouring variable. Of further interest were (1) anychanges in the home-range size and location over aperiod of months; and (2) differences between thehome range parameters of snapper that were fed tagsand those that had tags surgically implanted.
MATERIALS AND METHODS
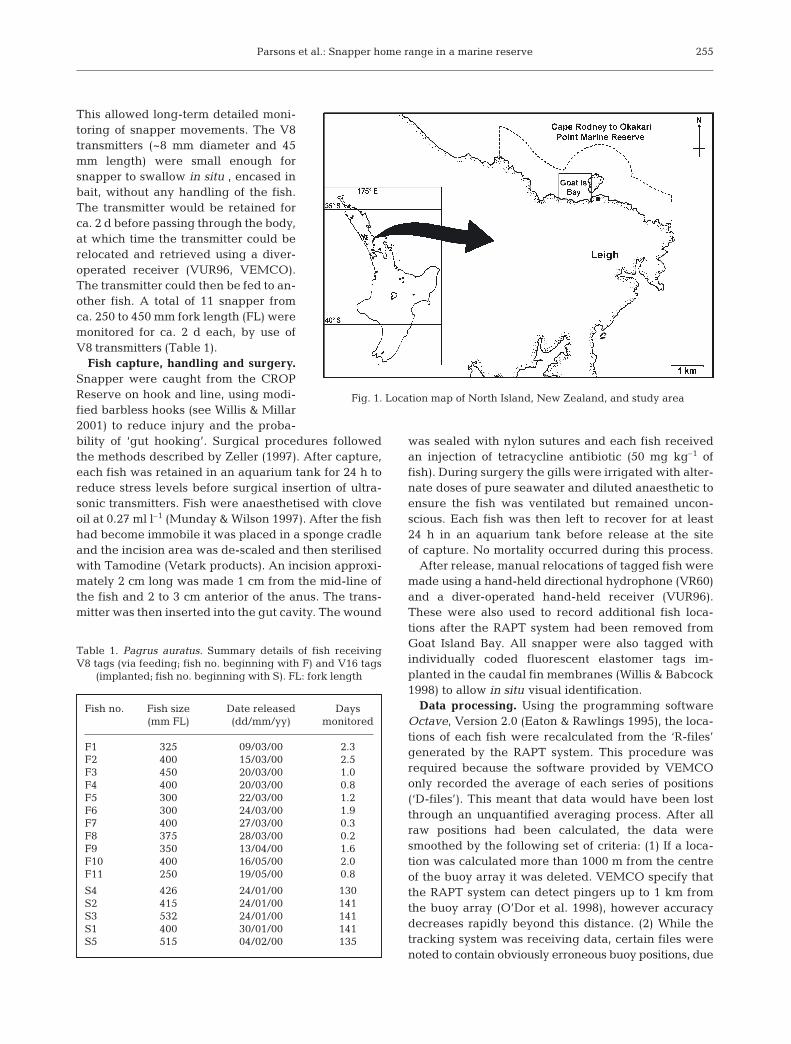
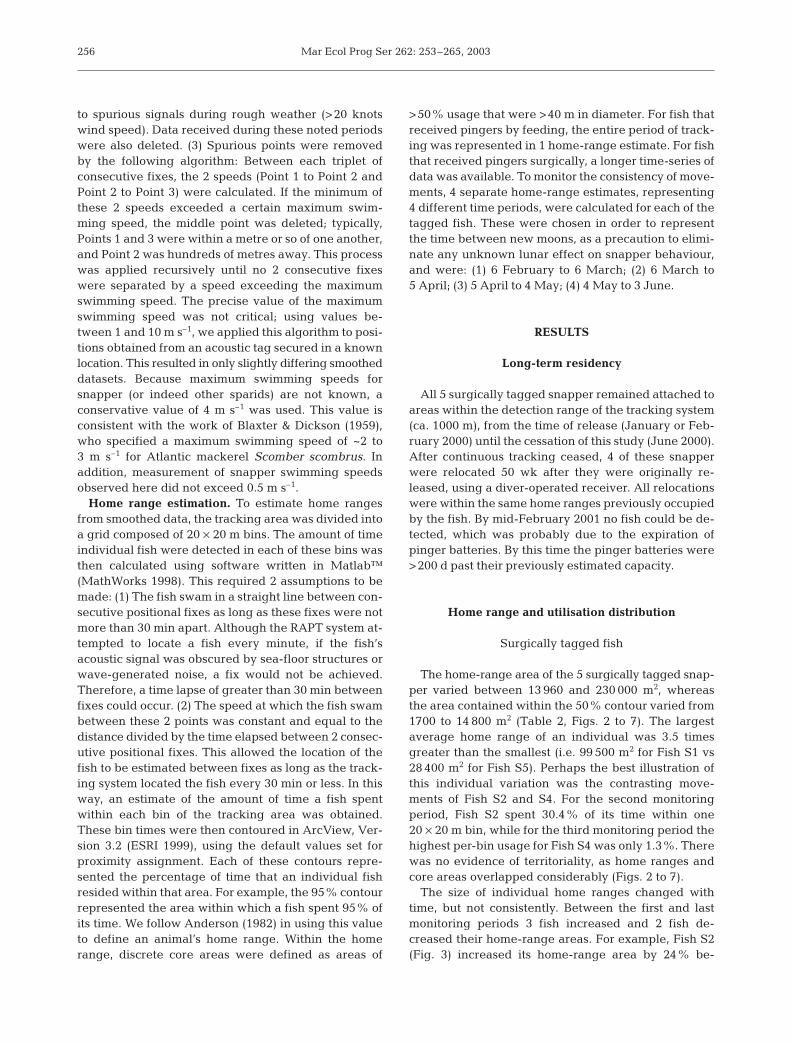
Experimental area and procedure. This study wasconducted in the CROP Marine Reserve primarily fromJanuary to June 2000, although further, less frequentobservations were made through to January 2001.During this time snapper were continuously trackedvia the use of a RAPT system (VEMCO). This systemallowed accurate positioning (±1 to 2 m) (O’Dor et al.1998) of individual fish, with a temporal resolution ofminutes. Each monitored snapper contained a trans-mitter (pinger) that broadcast on a frequency unique tothat individual. The ultrasonic signal transmitted fromeach fish was then received by 3 moored sono-buoysthat relayed data to a land-based computer by radiosignal. The computer then triangulated the position ofthe fish based on differences in arrival time of the sig-nals. The sono-buoys were placed in a triangular con-figuration, approximately 300 m apart, within GoatIsland Bay (Fig. 1). This area was chosen for its highabundance of snapper, shelter and the presence ofshallow reef-habitat.
This study used V16 and V8 transmitters, also madeby VEMCO. Five snapper (Table 1) received surgicallyimplanted V16 transmitters. These V16 transmitters,~16 mm diameter and 7.5 cm length, had a battery lifeconservatively estimated at 120 d (but were found tolast much longer in water temperatures of 16 to 20°C).
254
Parsons et al.: Snapper home range in a marine reserve
This allowed long-term detailed moni-toring of snapper movements. The V8transmitters (~8 mm diameter and 45mm length) were small enough forsnapper to swallow in situ , encased inbait, without any handling of the fish.The transmitter would be retained forca. 2 d before passing through the body,at which time the transmitter could berelocated and retrieved using a diver-operated receiver (VUR96, VEMCO).The transmitter could then be fed to an-other fish. A total of 11 snapper fromca. 250 to 450 mm fork length (FL) weremonitored for ca. 2 d each, by use ofV8 transmitters (Table 1).
Fish capture, handling and surgery.Snapper were caught from the CROPReserve on hook and line, using modi-fied barbless hooks (see Willis & Millar2001) to reduce injury and the proba-bility of ‘gut hooking’. Surgical procedures followedthe methods described by Zeller (1997). After capture,each fish was retained in an aquarium tank for 24 h toreduce stress levels before surgical insertion of ultra-sonic transmitters. Fish were anaesthetised with cloveoil at 0.27 ml l–1 (Munday & Wilson 1997). After the fishhad become immobile it was placed in a sponge cradleand the incision area was de-scaled and then sterilisedwith Tamodine (Vetark products). An incision approxi-mately 2 cm long was made 1 cm from the mid-line ofthe fish and 2 to 3 cm anterior of the anus. The trans-mitter was then inserted into the gut cavity. The wound
was sealed with nylon sutures and each fish receivedan injection of tetracycline antibiotic (50 mg kg–1 offish). During surgery the gills were irrigated with alter-nate doses of pure seawater and diluted anaesthetic toensure the fish was ventilated but remained uncon-scious. Each fish was then left to recover for at least24 h in an aquarium tank before release at the siteof capture. No mortality occurred during this process.
After release, manual relocations of tagged fish weremade using a hand-held directional hydrophone (VR60)and a diver-operated hand-held receiver (VUR96).These were also used to record additional fish loca-tions after the RAPT system had been removed fromGoat Island Bay. All snapper were also tagged withindividually coded fluorescent elastomer tags im-planted in the caudal fin membranes (Willis & Babcock1998) to allow in situ visual identification.
Data processing. Using the programming softwareOctave, Version 2.0 (Eaton & Rawlings 1995), the loca-tions of each fish were recalculated from the ‘R-files’generated by the RAPT system. This procedure wasrequired because the software provided by VEMCOonly recorded the average of each series of positions(‘D-files’). This meant that data would have been lostthrough an unquantified averaging process. After allraw positions had been calculated, the data weresmoothed by the following set of criteria: (1) If a loca-tion was calculated more than 1000 m from the centreof the buoy array it was deleted. VEMCO specify thatthe RAPT system can detect pingers up to 1 km fromthe buoy array (O’Dor et al. 1998), however accuracydecreases rapidly beyond this distance. (2) While thetracking system was receiving data, certain files werenoted to contain obviously erroneous buoy positions, due
255
Fig. 1. Location map of North Island, New Zealand, and study area
Table 1. Pagrus auratus. Summary details of fish receivingV8 tags (via feeding; fish no. beginning with F) and V16 tags
(implanted; fish no. beginning with S). FL: fork length
Fish no. Fish size Date released Days(mm FL) (dd/mm/yy) monitored
F1 325 09/03/00 2.3F2 400 15/03/00 2.5F3 450 20/03/00 1.0F4 400 20/03/00 0.8F5 300 22/03/00 1.2F6 300 24/03/00 1.9F7 400 27/03/00 0.3F8 375 28/03/00 0.2F9 350 13/04/00 1.6F10 400 16/05/00 2.0F11 250 19/05/00 0.8
S4 426 24/01/00 130S2 415 24/01/00 141S3 532 24/01/00 141S1 400 30/01/00 141S5 515 04/02/00 135
Mar Ecol Prog Ser 262: 253–265, 2003
to spurious signals during rough weather (>20 knotswind speed). Data received during these noted periodswere also deleted. (3) Spurious points were removedby the following algorithm: Between each triplet ofconsecutive fixes, the 2 speeds (Point 1 to Point 2 andPoint 2 to Point 3) were calculated. If the minimum ofthese 2 speeds exceeded a certain maximum swim-ming speed, the middle point was deleted; typically,Points 1 and 3 were within a metre or so of one another,and Point 2 was hundreds of metres away. This processwas applied recursively until no 2 consecutive fixeswere separated by a speed exceeding the maximumswimming speed. The precise value of the maximumswimming speed was not critical; using values be-tween 1 and 10 m s–1, we applied this algorithm to posi-tions obtained from an acoustic tag secured in a knownlocation. This resulted in only slightly differing smootheddatasets. Because maximum swimming speeds forsnapper (or indeed other sparids) are not known, aconservative value of 4 m s–1 was used. This value isconsistent with the work of Blaxter & Dickson (1959),who specified a maximum swimming speed of ~2 to3 m s–1 for Atlantic mackerel Scomber scombrus. Inaddition, measurement of snapper swimming speedsobserved here did not exceed 0.5 m s–1.
Home range estimation. To estimate home rangesfrom smoothed data, the tracking area was divided intoa grid composed of 20 × 20 m bins. The amount of timeindividual fish were detected in each of these bins wasthen calculated using software written in Matlab™(MathWorks 1998). This required 2 assumptions to bemade: (1) The fish swam in a straight line between con-secutive positional fixes as long as these fixes were notmore than 30 min apart. Although the RAPT system at-tempted to locate a fish every minute, if the fish’sacoustic signal was obscured by sea-floor structures orwave-generated noise, a fix would not be achieved.Therefore, a time lapse of greater than 30 min betweenfixes could occur. (2) The speed at which the fish swambetween these 2 points was constant and equal to thedistance divided by the time elapsed between 2 consec-utive positional fixes. This allowed the location of thefish to be estimated between fixes as long as the track-ing system located the fish every 30 min or less. In thisway, an estimate of the amount of time a fish spentwithin each bin of the tracking area was obtained.These bin times were then contoured in ArcView, Ver-sion 3.2 (ESRI 1999), using the default values set forproximity assignment. Each of these contours repre-sented the percentage of time that an individual fishresided within that area. For example, the 95% contourrepresented the area within which a fish spent 95% ofits time. We follow Anderson (1982) in using this valueto define an animal’s home range. Within the homerange, discrete core areas were defined as areas of
>50% usage that were >40 m in diameter. For fish thatreceived pingers by feeding, the entire period of track-ing was represented in 1 home-range estimate. For fishthat received pingers surgically, a longer time-series ofdata was available. To monitor the consistency of move-ments, 4 separate home-range estimates, representing4 different time periods, were calculated for each of thetagged fish. These were chosen in order to representthe time between new moons, as a precaution to elimi-nate any unknown lunar effect on snapper behaviour,and were: (1) 6 February to 6 March; (2) 6 March to5 April; (3) 5 April to 4 May; (4) 4 May to 3 June.
RESULTS
Long-term residency
All 5 surgically tagged snapper remained attached toareas within the detection range of the tracking system(ca. 1000 m), from the time of release (January or Feb-ruary 2000) until the cessation of this study (June 2000).After continuous tracking ceased, 4 of these snapperwere relocated 50 wk after they were originally re-leased, using a diver-operated receiver. All relocationswere within the same home ranges previously occupiedby the fish. By mid-February 2001 no fish could be de-tected, which was probably due to the expiration ofpinger batteries. By this time the pinger batteries were>200 d past their previously estimated capacity.
Home range and utilisation distribution
Surgically tagged fish
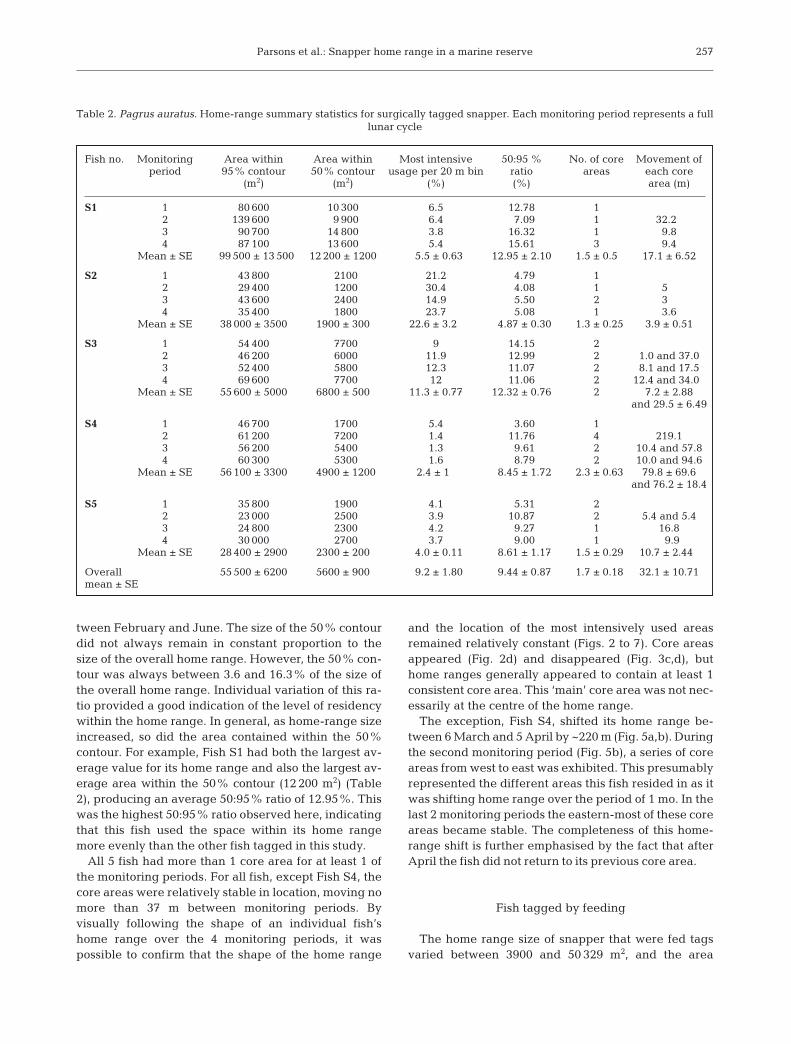
The home-range area of the 5 surgically tagged snap-per varied between 13 960 and 230 000 m2, whereasthe area contained within the 50% contour varied from1700 to 14 800 m2 (Table 2, Figs. 2 to 7). The largestaverage home range of an individual was 3.5 timesgreater than the smallest (i.e. 99 500 m2 for Fish S1 vs28 400 m2 for Fish S5). Perhaps the best illustration ofthis individual variation was the contrasting move-ments of Fish S2 and S4. For the second monitoringperiod, Fish S2 spent 30.4% of its time within one20 × 20 m bin, while for the third monitoring period thehighest per-bin usage for Fish S4 was only 1.3%. Therewas no evidence of territoriality, as home ranges andcore areas overlapped considerably (Figs. 2 to 7).
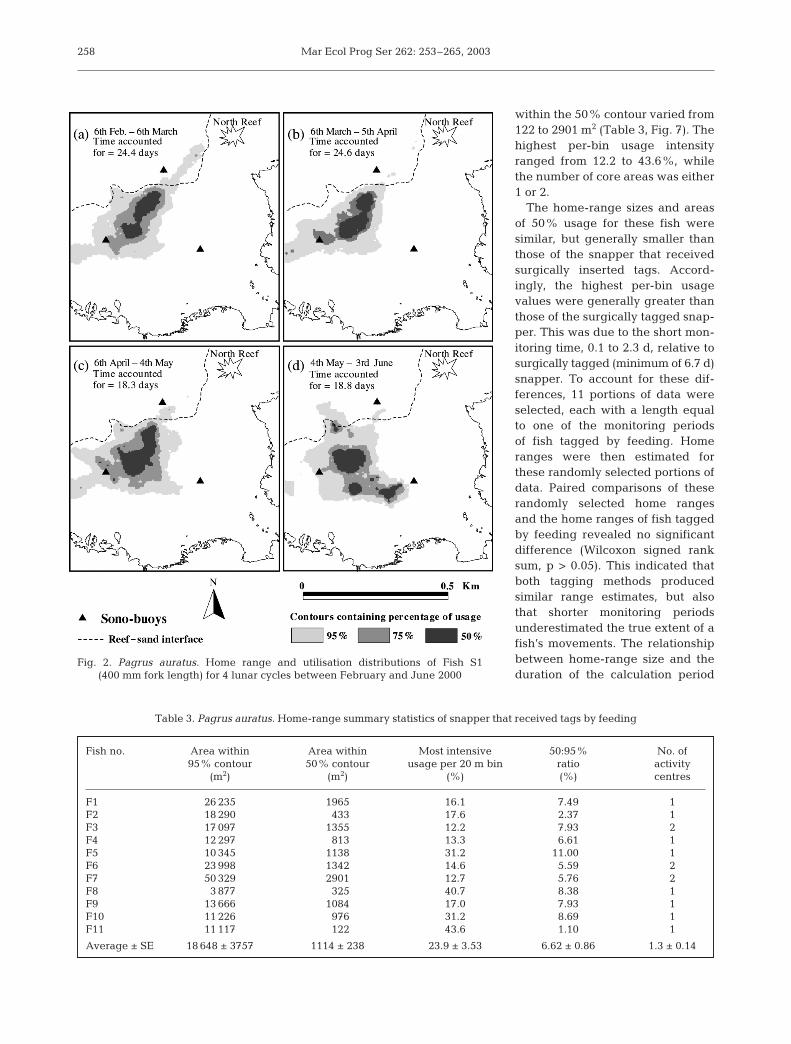
The size of individual home ranges changed withtime, but not consistently. Between the first and lastmonitoring periods 3 fish increased and 2 fish de-creased their home-range areas. For example, Fish S2(Fig. 3) increased its home-range area by 24% be-
256
Parsons et al.: Snapper home range in a marine reserve
tween February and June. The size of the 50% contourdid not always remain in constant proportion to thesize of the overall home range. However, the 50% con-tour was always between 3.6 and 16.3% of the size ofthe overall home range. Individual variation of this ra-tio provided a good indication of the level of residencywithin the home range. In general, as home-range sizeincreased, so did the area contained within the 50%contour. For example, Fish S1 had both the largest av-erage value for its home range and also the largest av-erage area within the 50% contour (12 200 m2) (Table2), producing an average 50:95% ratio of 12.95%. Thiswas the highest 50:95% ratio observed here, indicatingthat this fish used the space within its home rangemore evenly than the other fish tagged in this study.
All 5 fish had more than 1 core area for at least 1 ofthe monitoring periods. For all fish, except Fish S4, thecore areas were relatively stable in location, moving nomore than 37 m between monitoring periods. Byvisually following the shape of an individual fish’shome range over the 4 monitoring periods, it waspossible to confirm that the shape of the home range
and the location of the most intensively used areasremained relatively constant (Figs. 2 to 7). Core areasappeared (Fig. 2d) and disappeared (Fig. 3c,d), buthome ranges generally appeared to contain at least 1consistent core area. This ‘main’ core area was not nec-essarily at the centre of the home range.
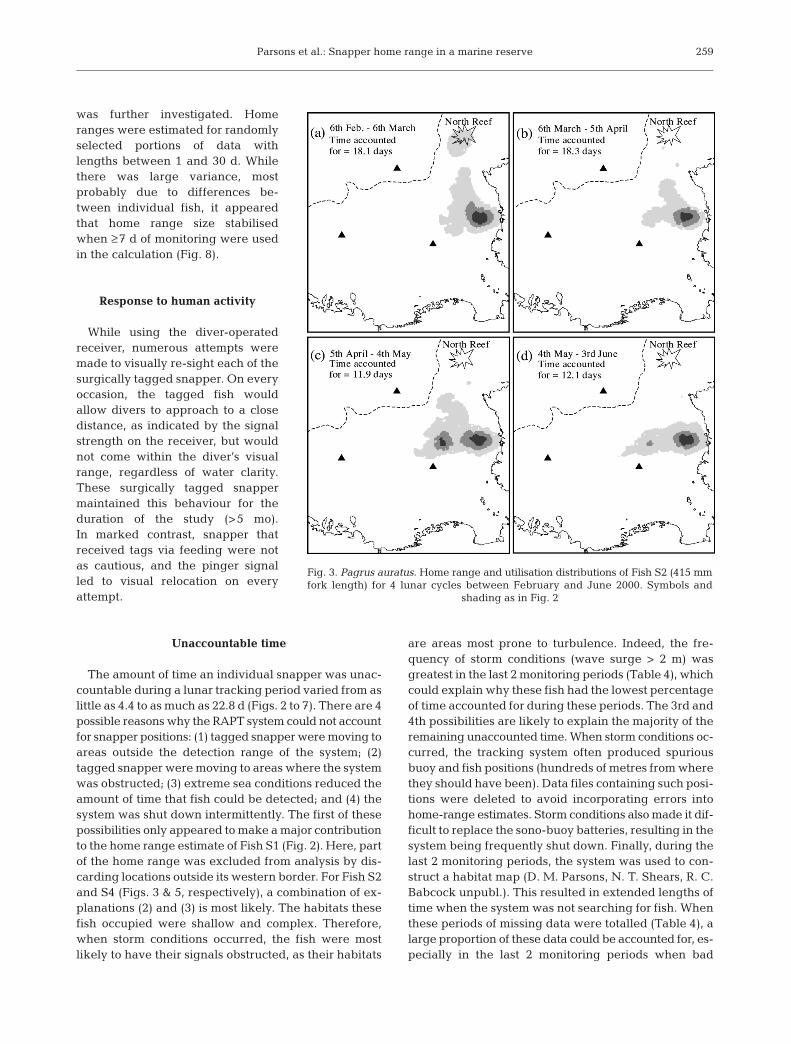
The exception, Fish S4, shifted its home range be-tween 6 March and 5 April by ~220 m (Fig. 5a,b). Duringthe second monitoring period (Fig. 5b), a series of coreareas from west to east was exhibited. This presumablyrepresented the different areas this fish resided in as itwas shifting home range over the period of 1 mo. In thelast 2 monitoring periods the eastern-most of these coreareas became stable. The completeness of this home-range shift is further emphasised by the fact that afterApril the fish did not return to its previous core area.
Fish tagged by feeding
The home range size of snapper that were fed tagsvaried between 3900 and 50 329 m2, and the area
257
Table 2. Pagrus auratus. Home-range summary statistics for surgically tagged snapper. Each monitoring period represents a full lunar cycle
Fish no. Monitoring Area within Area within Most intensive 50:95 % No. of core Movement ofperiod 95% contour 50% contour usage per 20 m bin ratio areas each core
(m2) (m2) (%) (%) area (m)
S1 1 80 600 10 300 6.5 12.78 12 139 6000 09 900 6.4 07.09 1 32.203 90 700 14 800 3.8 16.32 1 9.84 87 100 13 600 5.4 15.61 3 9.4
Mean ± SE 099 500 ± 13 500 12 200 ± 1200 005.5 ± 0.630 12.95 ± 2.10 1.5 ± 0.5 17.1 ± 6.52
S2 1 43 800 02100 21.2 04.79 12 29 400 01200 30.4 04.08 1 50.3 43 600 02400 14.9 05.50 2 30.4 35 400 01800 23.7 05.08 1 3.6
Mean ± SE 38 000 ± 3500 1900 ± 300 22.6 ± 3.20 04.87 ± 0.30 01.3 ± 0.25 3.9 ± 0.51
S3 1 54 400 07700 9 14.15 22 46 200 06000 11.9 12.99 2 1.0 and 37.03 52 400 05800 12.3 11.07 2 8.1 and 17.54 69 600 07700 12 11.06 2 12.4 and 34.00
Mean ± SE 55 600 ± 5000 6800 ± 500 011.3 ± 0.770 12.32 ± 0.76 2 7.2 ± 2.88and 29.5 ± 6.49
S4 1 46 700 01700 5.4 03.60 12 61 200 07200 1.4 11.76 4 219.13 56 200 05400 1.3 09.61 2 10.4 and 57.84 60 300 05300 1.6 08.79 2 10.0 and 94.6
Mean ± SE 56 100 ± 3300 04900 ± 1200 2.4 ± 10 08.45 ± 1.72 02.3 ± 0.63 79.8 ± 69.6and 76.2 ± 18.4
S5 1 35 800 01900 4.1 05.31 22 23 000 02500 3.9 10.87 2 5.4 and 5.43 24 800 02300 4.2 09.27 1 16.84 30 000 02700 3.7 09.00 1 09.9
Mean ± SE 28 400 ± 2900 2300 ± 200 04.0 ± 0.11 08.61 ± 1.17 01.5 ± 0.29 10.7 ± 2.440
Overall 55 500 ± 6200 5600 ± 900 09.2 ± 1.80 09.44 ± 0.87 01.7 ± 0.18 32.1 ± 10.71mean ± SE
Mar Ecol Prog Ser 262: 253–265, 2003
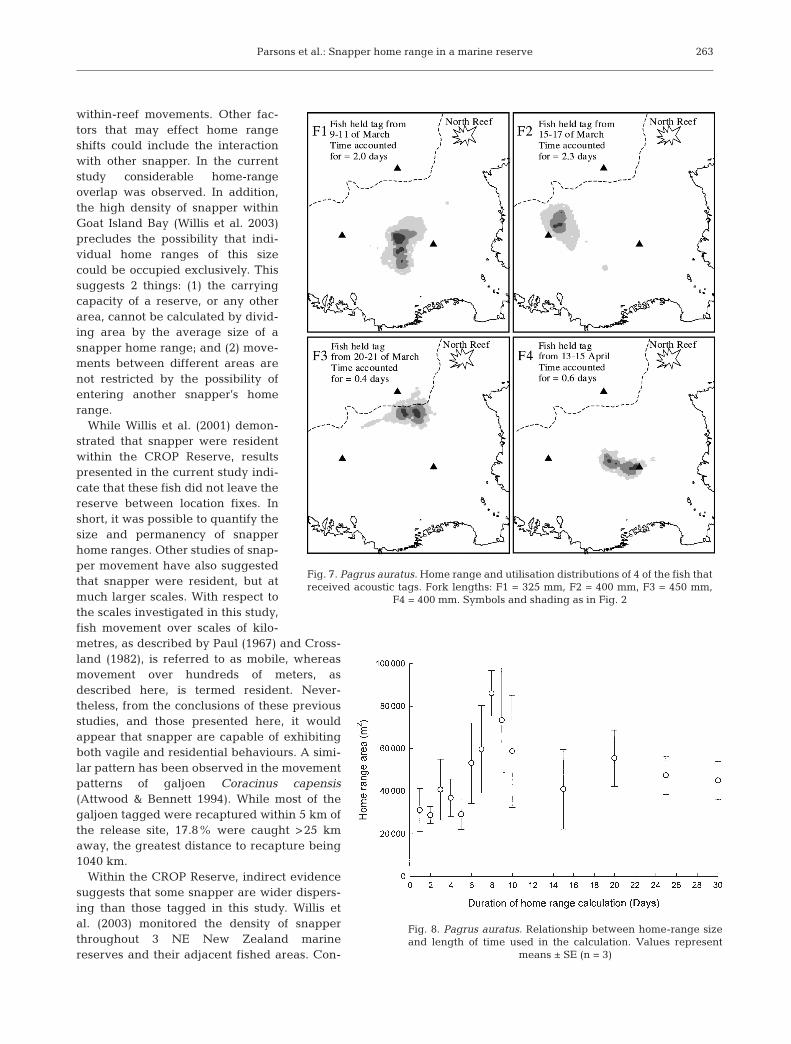
within the 50% contour varied from122 to 2901 m2 (Table 3, Fig. 7). Thehighest per-bin usage intensityranged from 12.2 to 43.6%, whilethe number of core areas was either1 or 2.
The home-range sizes and areasof 50% usage for these fish weresimilar, but generally smaller thanthose of the snapper that receivedsurgically inserted tags. Accord-ingly, the highest per-bin usagevalues were generally greater thanthose of the surgically tagged snap-per. This was due to the short mon-itoring time, 0.1 to 2.3 d, relative tosurgically tagged (minimum of 6.7 d)snapper. To account for these dif-ferences, 11 portions of data wereselected, each with a length equalto one of the monitoring periodsof fish tagged by feeding. Homeranges were then estimated forthese randomly selected portions ofdata. Paired comparisons of theserandomly selected home rangesand the home ranges of fish taggedby feeding revealed no significantdifference (Wilcoxon signed ranksum, p > 0.05). This indicated thatboth tagging methods producedsimilar range estimates, but alsothat shorter monitoring periodsunderestimated the true extent of afish’s movements. The relationshipbetween home-range size and theduration of the calculation period
258
Fig. 2. Pagrus auratus. Home range and utilisation distributions of Fish S1 (400 mm fork length) for 4 lunar cycles between February and June 2000
Table 3. Pagrus auratus. Home-range summary statistics of snapper that received tags by feeding
Fish no. Area within Area within Most intensive 50:95% No. of95% contour 50% contour usage per 20 m bin ratio activity
(m2) (m2) (%) (%) centres
F1 26 235 1965 16.1 7.49 1F2 18 290 0433 17.6 2.37 1F3 17 097 1355 12.2 7.93 2F4 12 297 0813 13.3 6.61 1F5 10 345 1138 31.2 11.000 1F6 23 998 1342 14.6 5.59 2F7 50 329 2901 12.7 5.76 2F8 03 877 0325 40.7 8.38 1F9 13 666 1084 17.0 7.93 1F10 11 226 0976 31.2 8.69 1F11 11 117 0122 43.6 1.10 1
Average ± SE 18 648 ± 3757 1114 ± 238 23.9 ± 3.53 6.62 ± 0.86 1.3 ± 0.14
Parsons et al.: Snapper home range in a marine reserve
was further investigated. Homeranges were estimated for randomlyselected portions of data withlengths between 1 and 30 d. Whilethere was large variance, mostprobably due to differences be-tween individual fish, it appearedthat home range size stabilisedwhen ≥7 d of monitoring were usedin the calculation (Fig. 8).
Response to human activity
While using the diver-operatedreceiver, numerous attempts weremade to visually re-sight each of thesurgically tagged snapper. On everyoccasion, the tagged fish wouldallow divers to approach to a closedistance, as indicated by the signalstrength on the receiver, but wouldnot come within the diver’s visualrange, regardless of water clarity.These surgically tagged snappermaintained this behaviour for theduration of the study (>5 mo).In marked contrast, snapper thatreceived tags via feeding were notas cautious, and the pinger signalled to visual relocation on everyattempt.
Unaccountable time
The amount of time an individual snapper was unac-countable during a lunar tracking period varied from aslittle as 4.4 to as much as 22.8 d (Figs. 2 to 7). There are 4possible reasons why the RAPT system could not accountfor snapper positions: (1) tagged snapper were moving toareas outside the detection range of the system; (2)tagged snapper were moving to areas where the systemwas obstructed; (3) extreme sea conditions reduced theamount of time that fish could be detected; and (4) thesystem was shut down intermittently. The first of thesepossibilities only appeared to make a major contributionto the home range estimate of Fish S1 (Fig. 2). Here, partof the home range was excluded from analysis by dis-carding locations outside its western border. For Fish S2and S4 (Figs. 3 & 5, respectively), a combination of ex-planations (2) and (3) is most likely. The habitats thesefish occupied were shallow and complex. Therefore,when storm conditions occurred, the fish were mostlikely to have their signals obstructed, as their habitats
are areas most prone to turbulence. Indeed, the fre-quency of storm conditions (wave surge > 2 m) wasgreatest in the last 2 monitoring periods (Table 4), whichcould explain why these fish had the lowest percentageof time accounted for during these periods. The 3rd and4th possibilities are likely to explain the majority of theremaining unaccounted time. When storm conditions oc-curred, the tracking system often produced spuriousbuoy and fish positions (hundreds of metres from wherethey should have been). Data files containing such posi-tions were deleted to avoid incorporating errors intohome-range estimates. Storm conditions also made it dif-ficult to replace the sono-buoy batteries, resulting in thesystem being frequently shut down. Finally, during thelast 2 monitoring periods, the system was used to con-struct a habitat map (D. M. Parsons, N. T. Shears, R. C.Babcock unpubl.). This resulted in extended lengths oftime when the system was not searching for fish. Whenthese periods of missing data were totalled (Table 4), alarge proportion of these data could be accounted for, es-pecially in the last 2 monitoring periods when bad
259
Fig. 3. Pagrus auratus. Home range and utilisation distributions of Fish S2 (415 mmfork length) for 4 lunar cycles between February and June 2000. Symbols and
shading as in Fig. 2
Mar Ecol Prog Ser 262: 253–265, 2003
weather and alternate use of the system were most fre-quent. Therefore, differences in the time accounted forwere most probably related to the complications dis-cussed above, not differences in fish behaviour. Despitethe lower amount of accountable time, home-rangeestimates from the last 2 monitoring periods were simi-lar, if not larger, than those produced from the earlierperiods of tracking (Table 2). This suggested that whensnapper could not be detected, they were still utilisingspace in a similar manner as when they could bedetected.
DISCUSSION
Home-range size
This study presents the first estimates of snapperhome range. While some previous studies have beensuccessful in obtaining repetitive locations of individ-ual snapper, the duration of sampling was either too
short (Berquist 1994) or the numberof locations too few (Willis et al. 2001)to assess snapper home-range size.The estimates of home-range sizeobtained here varied between 23 000and 139 600 m2, with correspondingmaximum diameters of 190 and620 m, respectively. These results areconsistent with those of Willis et al.(2001), where residency was demon-strated over a scale of hundreds ofmetres in a larger sample-size ofsnapper (49 resighted out of 117tagged) and a period of >3 yr. Whilethe logistics and cost of acoustictelemetry limited our sample size,the additional detail we provideshow that the 5 fish tagged in thisstudy were resident within thereserve for the 5 mo of monitoring. Inaddition, 4 of these 5 fish werelocated within the same individualhome ranges 1 yr after release. Spec-ulation may suggest that the reasonthese snapper remained residentwithin the CROP Reserve was due tothe fish feeding activities of tourists.However, the fish tagged in thisstudy spent either none, or a verysmall, proportion of their time inareas where feeding occurred. Inaddition, snapper that received tagssurgically would not allow divers tovisually locate them. While human-
derived sustenance may be important to some reserve-dwelling fish, it seems unlikely to be important here.
The home-range estimates presented here werebased on the monthly monitoring periods of 5 snapperthat received tags surgically. The decision to estimatehome ranges over a lunar month was arbitrary; how-ever, it did allow for observation of any changes inbehaviour throughout the entire tracking period
260
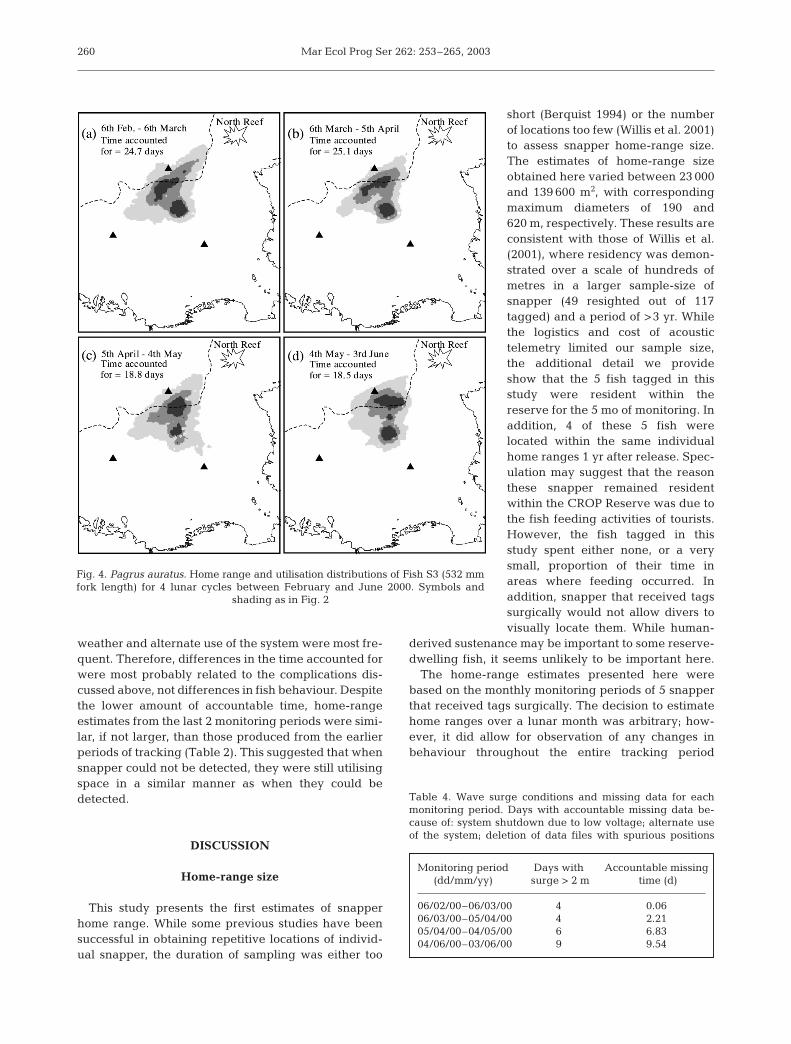
Fig. 4. Pagrus auratus. Home range and utilisation distributions of Fish S3 (532 mmfork length) for 4 lunar cycles between February and June 2000. Symbols and
shading as in Fig. 2
Table 4. Wave surge conditions and missing data for eachmonitoring period. Days with accountable missing data be-cause of: system shutdown due to low voltage; alternate useof the system; deletion of data files with spurious positions
Monitoring period Days with Accountable missing(dd/mm/yy) surge > 2 m time (d)
06/02/00–06/03/00 4 0.0606/03/00–05/04/00 4 2.2105/04/00–04/05/00 6 6.8304/06/00–03/06/00 9 9.54

Parsons et al.: Snapper home range in a marine reserve
(5 mo). This decision appeared tobe reasonable due to the individ-ual consistency of home-range size(<24% change over 4 mo), and sta-sis of home-range location through-out the entire 5 mo tracking period(<37 m movement of core areas forall fish except S4). Snapper thatreceived tags by feeding were notincluded in this estimate due to dif-ferences in the length of the moni-toring period. Because home rangeis a function of time as well asspace, the period over which homeranges are estimated must be takeninto consideration in order to makeestimates comparable (White &Garrott 1990). Further investigationof this issue revealed that the areaused by an individual snapper didnot appear to increase when ≥7 d ofmonitoring were incorporated in theestimate. Therefore, home-rangeestimates based on periods of moni-toring up to 2.3 d are not directlycomparable to home ranges esti-mated over a month, and we recom-mend that at least 7 d of monitor-ing be used in future calculationsof snapper home range. For thisreason, the monitoring of snappertagged by feeding served 2 impor-tant purposes: (1) It demonstratedthat the range of movements thatthese fish exhibited was not dissimilar to the move-ments of the surgically tagged fish. This lends confi-dence to the idea that the surgical procedure did notdrastically alter the space-use characteristics of snap-per; and (2) the 11 snapper fed acoustic tags alsoincreased the sample size of fish that expressed small-scale residency.
Utilisation distribution
The use of space within the home ranges estimatedhere was not uniform. Each snapper spent 50% of itstime within an area that was only 3.6 to 16.3% of thetotal home-range size. In general, the area withinwhich snapper spent ≥50% of their time rangedbetween 1700 and 14 800 m2, or 55 and 200 m in dia-meter. This implied that while they were observedranging over an area of up to 620 m diameter, most ofthe time they were within an area of only 200 m dia-meter. The most extreme example was Fish S4 (Fig. 5).
During the first monitoring period, this fish spent 50%of its time in an area of only 1700 m2, or 55 m diameter.
All surgically tagged fish had more than 1 core areain at least 1 of the monitoring periods, and these coreareas were not always located at the centre of the homerange. This is logical, as some areas could providebetter shelter or food than others. It remains unknownwhether these core areas are located where a fish re-sides when it is inactive (e.g. Løkkeborg et al. 2000) orwhether a disproportionate amount of foraging and/orsocial interaction are occurring at these locations. Re-gardless of which resources are being utilised, they areunlikely to be distributed uniformly. Therefore, it wasnot unexpected that fish home ranges were irregular.
With respect to other marine fish species, only 5studies have investigated the use of space within thehome range. Four of these studies used manual track-ing (Holland et al. 1993, 1996, Meyer et al. 2000,Eristhee & Oxenford 2001), while one used an auto-mated system (Cote et al. 1998). The short duration ofthese studies (<62 d), the intermittent periods of track-
261
Fig. 5. Pagrus auratus. Home range and utilisation distributions of Fish S4 (426 mmfork length) for 4 lunar cycles between February and June 2000. Symbols and
shading as in Fig. 2
Mar Ecol Prog Ser 262: 253–265, 2003
ing, and the low number of positional fixes (<1429)provided limited behavioural information below thelevel of home-range size estimation. When utilisationdistributions were calculated in this study, time wasused as the density variable, fish were continuouslytracked for periods of up to 140 d, and the maximumnumber of fixes obtained for an individual was inexcess of 475 000. Therefore, the current study pres-ents the first accurate and long-term example ofhow a marine fish species occupies space on a sub-home-range level.
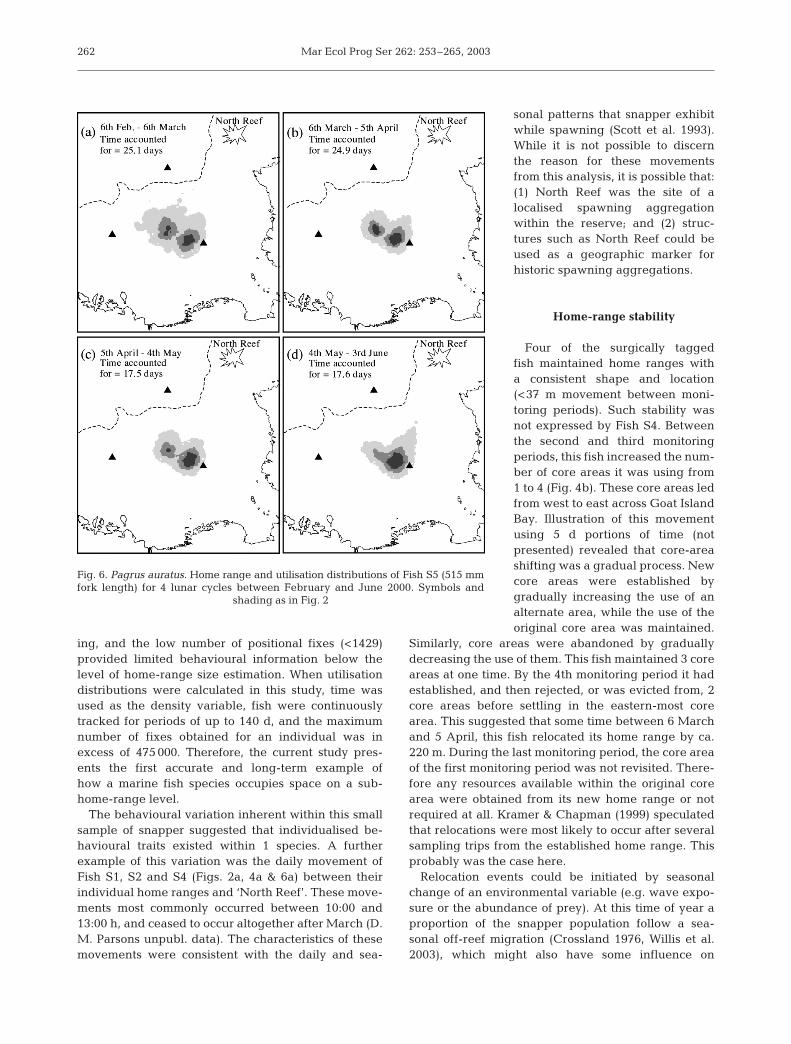
The behavioural variation inherent within this smallsample of snapper suggested that individualised be-havioural traits existed within 1 species. A furtherexample of this variation was the daily movement ofFish S1, S2 and S4 (Figs. 2a, 4a & 6a) between theirindividual home ranges and ‘North Reef’. These move-ments most commonly occurred between 10:00 and13:00 h, and ceased to occur altogether after March (D.M. Parsons unpubl. data). The characteristics of thesemovements were consistent with the daily and sea-
sonal patterns that snapper exhibitwhile spawning (Scott et al. 1993).While it is not possible to discernthe reason for these movementsfrom this analysis, it is possible that:(1) North Reef was the site of alocalised spawning aggregationwithin the reserve; and (2) struc-tures such as North Reef could beused as a geographic marker forhistoric spawning aggregations.
Home-range stability
Four of the surgically taggedfish maintained home ranges witha consistent shape and location(<37 m movement between moni-toring periods). Such stability wasnot expressed by Fish S4. Betweenthe second and third monitoringperiods, this fish increased the num-ber of core areas it was using from1 to 4 (Fig. 4b). These core areas ledfrom west to east across Goat IslandBay. Illustration of this movementusing 5 d portions of time (notpresented) revealed that core-areashifting was a gradual process. Newcore areas were established bygradually increasing the use of analternate area, while the use of theoriginal core area was maintained.
Similarly, core areas were abandoned by graduallydecreasing the use of them. This fish maintained 3 coreareas at one time. By the 4th monitoring period it hadestablished, and then rejected, or was evicted from, 2core areas before settling in the eastern-most corearea. This suggested that some time between 6 Marchand 5 April, this fish relocated its home range by ca.220 m. During the last monitoring period, the core areaof the first monitoring period was not revisited. There-fore any resources available within the original corearea were obtained from its new home range or notrequired at all. Kramer & Chapman (1999) speculatedthat relocations were most likely to occur after severalsampling trips from the established home range. Thisprobably was the case here.
Relocation events could be initiated by seasonalchange of an environmental variable (e.g. wave expo-sure or the abundance of prey). At this time of year aproportion of the snapper population follow a sea-sonal off-reef migration (Crossland 1976, Willis et al.2003), which might also have some influence on
262
Fig. 6. Pagrus auratus. Home range and utilisation distributions of Fish S5 (515 mmfork length) for 4 lunar cycles between February and June 2000. Symbols and
shading as in Fig. 2
Parsons et al.: Snapper home range in a marine reserve
within-reef movements. Other fac-tors that may effect home rangeshifts could include the interactionwith other snapper. In the currentstudy considerable home-rangeoverlap was observed. In addition,the high density of snapper withinGoat Island Bay (Willis et al. 2003)precludes the possibility that indi-vidual home ranges of this sizecould be occupied exclusively. Thissuggests 2 things: (1) the carryingcapacity of a reserve, or any otherarea, cannot be calculated by divid-ing area by the average size of asnapper home range; and (2) move-ments between different areas arenot restricted by the possibility ofentering another snapper’s homerange.
While Willis et al. (2001) demon-strated that snapper were residentwithin the CROP Reserve, resultspresented in the current study indi-cate that these fish did not leave thereserve between location fixes. Inshort, it was possible to quantify thesize and permanency of snapperhome ranges. Other studies of snap-per movement have also suggestedthat snapper were resident, but atmuch larger scales. With respect tothe scales investigated in this study,fish movement over scales of kilo-metres, as described by Paul (1967) and Cross-land (1982), is referred to as mobile, whereasmovement over hundreds of meters, asdescribed here, is termed resident. Never-theless, from the conclusions of these previousstudies, and those presented here, it wouldappear that snapper are capable of exhibitingboth vagile and residential behaviours. A simi-lar pattern has been observed in the movementpatterns of galjoen Coracinus capensis(Attwood & Bennett 1994). While most of thegaljoen tagged were recaptured within 5 km ofthe release site, 17.8% were caught >25 kmaway, the greatest distance to recapture being1040 km.
Within the CROP Reserve, indirect evidencesuggests that some snapper are wider dispers-ing than those tagged in this study. Willis etal. (2003) monitored the density of snapperthroughout 3 NE New Zealand marinereserves and their adjacent fished areas. Con-
263
Fig. 7. Pagrus auratus. Home range and utilisation distributions of 4 of the fish thatreceived acoustic tags. Fork lengths: F1 = 325 mm, F2 = 400 mm, F3 = 450 mm,
F4 = 400 mm. Symbols and shading as in Fig. 2
Fig. 8. Pagrus auratus. Relationship between home-range sizeand length of time used in the calculation. Values represent
means ± SE (n = 3)
Mar Ecol Prog Ser 262: 253–265, 2003
sistent seasonal fluctuations of snapper abundance,both inside and outside reserves, suggested that partof the inshore snapper population was not residentand left coastal areas sometime between April andOctober. The fact that similar fluctuations existedoutside of reserves indicates that this pattern is prob-ably not restricted to marine reserves.
If fisheries select for different traits through in-creased mortality (e.g. size: Hilborn & Walters 1992;sex ratio: McGovern et al. 1998; growth rate: Conover& Munch 2002; genetic heterozygosity: Hauser et al.2002), then marine reserves may change this selectionregime and exert their own selective pressure throughdecreased mortality. The observation that all snappertagged in this study resided in areas 2 orders of magni-tude smaller than previously documented (Paul 1967,Crossland 1982) may be due to the behavioural selec-tions caused by such a reserve. The explanation is asfollows: Within the snapper population a continuum ofmobility behaviour exists. Within reserves, the fishwith the highest tendency to exhibit residential behav-iour are favoured. This is due to the small size of estab-lished reserves (<9 km2) and the heavy fishing pres-sure on their boundaries (T. J. Willis pers. obs.). Anysnapper of higher mobility would therefore spend atleast some time outside of the reserve, increasing thechance of capture. If all snapper were uniformly asmobile as described by Paul (1967) and Crossland(1982), then it is likely that snapper abundances wouldnot have responded as positively to protection withinreserves of the current size (Willis et al. 2003). Thoseestimates reflect the average mobility of a populationwhose behavioural distribution may have been alteredby exploitation, whereas the estimates presented inthis study represent individual estimates from a popu-lation with behavioural traits that may have beenaffected by a lack of exploitation. This scenario illus-trates 2 important points: (1) within a species, assump-tions about homogeneous behaviour cannot always bemade (Willis et al. 2001), and management decisions,rather than being based on such assumptions, arelikely to have unexpected and possibly unfavourableconsequences; and (2) a marine reserve’s potential toreplenish adjacent fisheries will be dependent on thereproductive and growth potential of the individualsit selects for.
Acknowledgements. We thank the Department of Conserva-tion and the Vice Chancellors Committee of the University ofAuckland for providing funding and financial assistance. Aloan of equipment was gratefully received from G. Russ ofJames Cook University (VUR 96). We would also like to thankG. Allen for developing the home range model, D. Webberfor assistance with position calculation, N. Tolimieri and 3reviewers for comments on the manuscript, and D. Feary andnumerous other voluntary field assistants.
LITERATURE CITED
Allison GW, Lubchenco J, Carr MH (1998) Marine reservesare necessary but not sufficient for marine conservation.Ecol Appl 8(Suppl):79–92
Anderson DJ (1982) The home range: a new nonparametricestimation technique. Ecology 63:103–112
Annala JH, Sullivan KJ, O’Brien CJ (1999) Report from theFishery Assesment Plenary, April 1999: stock assesmentsand yield estimates (unpublished report held in NIWAlibrary, Wellington, NZ)
Attwood CG, Bennett BA (1994) Variation in dispersal ofgaljoen (Coracinus capensis) (Teleostei: Coracinidae) froma marine reserve. Can J Fish Aquat Sci 51:1247–1257
Babcock RC, Kelly S, Shears NT, Walker JW, Willis TJ (1999)Changes in community structure in temperate marinereserves. Mar Ecol Prog Ser 189:125–134
Berquist RM (1994) Patterns of activity and movement in NewZealand snapper, Pagrus auratus. MSc thesis, Universityof Auckland
Blaxter JHS, Dickson W (1959) Observations of swimmingspeeds of fish. J Cons Int Explor Mer 24:472–479
Conover DO, Munch SB (2002) Sustaining fisheries yieldsover evolutionary time scales. Science 297:94–96
Cote D, Scruton DA, Niezgoda GH, McKinley RS, Rowsell DF,Lindstrom RT, Ollerhead LMN, Whitt CJ (1998) A codedacoustic telemetry system for high precision monitoringof fish location and movement—application to the study ofnearshore nursery habitat of juvenile Atlantic cod (Gadusmorhua). Mar Technol Soc J 32:54–62
Crossland J (1976) Snapper tagging in North-East NewZealand, 1974: analysis of methods, return rates, andmovements. NZ J Mar Freshw Res 10:675–686
Crossland J (1982) Movements of tagged snapper in theHauraki Gulf. NZ Fish Res Div Occasional Publ No 35,MAF, Wellington
DeMartini EE (1993) Modelling the potential of fishery reservesfor managing Pacific coral reef fishes. Fish Bull 91:414–427
Eaton JW, Rawlings JB (1995) OCTAVE-A high level inter-active language for numerical computations. Cache News40:11–18
Eristhree N, Oxenford HA (2001) Home range size and use ofBermuda chub Kyphosus sectatrix (L.) in two marinereserves in the Soufriere Marine Management Area,St Lucia, West Indies. J Fish Biol 59:129–151
ESRI (Environmental Systems Research Institute) (1999) Get-ting to know ArcView GIS: the geographic informationsystem (GIS) for everyone. ESRI, Redlands, CA. Prentice-Hall, Upper Saddle River, NJ
Gilbert DJ, McKenzie JR (1999) Sources of bias in biomassestimates from tagging programmes in the SNA 1 snapper(Pagrus auratus) stock. NZ Fish Assess Res Doc 99/16,MoF, Wellington, NZ
Hauser L, Adcock GJ, Smith PJ, Ramirez JHB, Carvalho GR(2002) Loss of microsatellite diversity and low effectivepopulation size in an overexploited population of NewZealand snapper (Pagrus auratus). Proc Natl Acad SciUSA 99:11742–11747
Hilborn R, Walters CJ (1992) Quantitative fisheries stockassessment: choice, dynamics and uncertainty. Chapman& Hall, New York
Holland KN, Peterson JD, Lowe CG, Wetherbee BM (1993)Movements, distribution and growth rates of the whitegoatfish Mulloides flavolineatus in a fisheries conserva-tion zone. Bull Mar Sci 52:982–992
Holland KN, Lowe CG, Wetherbee M (1996) Movements anddispersal patterns of blue trevally (Caranx melampygus)
264
Parsons et al.: Snapper home range in a marine reserve
in a fisheries conservation zone. Fish Res 25:279–292Kramer DL, Chapman MR (1999) Implications of fish home
range size and relocation for marine reserve function.Environ Biol Fish 55:65–79
Løkkeborg S, Skajaa K, Ferno A (2000) Food-search strategyin ling (Molva molva L.): crepuscular activity and use ofspace. J Exp Mar Biol Ecol 247:195–208
MathWorks (1998) MATLAB: the language of technical com-puting: computation, visualization, programming. Natick,MA
McGovern JC, Wyanski DM, Pashuk O, Manooch III CS,Sederberry GR (1998) Changes in the sex ratio and size atmaturity of gag, Mycteroperca microlepis, from theAtlantic coast of the southeastern United States during1976–1995. Fish Bull 96:797–807
Meyer CG, Holland KN, Wetherbee BM, Lowe CG (2000)Movement patterns, habitat utilization, home range sizeand site fidelity of whitesaddle goatfish, Parupeneusporphyreus, in a marine reserve. Environ Biol Fish 59:235–242
Moran WA (1987) Tagging confirms separate stocks ofsnapper in Shark Bay region. Fins 20:3–8
Munday PL, Wilson SK (1997) Comparative efficacy of cloveoil and other chemicals in anaesthetization of Pomacen-trus amboinensis, a coral reef fish. J Fish Biol 51:931–938
O’Dor RK, Andrade Y, Webber DM, Sauer WHH, Roberts MJ,Smale MJ, Voegeli FM (1998) Applications and perfor-mance of radio-acoustic positioning and telemetry (RAPT)systems. Hydrobiologia 372:1–8
Paul LJ (1967) An evaluation of tagging experiments on theNew Zealand snapper, Chrysophrys auratus (Forster),during the period 1952 to 1963. NZ J Mar Freshw Res 1:455–463
Paul LJ (1976) A study on age, growth, and population struc-ture of the snapper, Chrysophrys auratus (Forster), in theHauraki Gulf, New Zealand. Fisheries Research Division.Fish Res Bull No. 13, MAF, Wellington, NZ
Roberts CM, Polunin NVC (1991) Are marine reserves effectivein management of reef fisheries? Rev Fish Biol Fish 1:65–91
Schoener TM (1981) An empirically based estimate of homerange. Theor Pop Biol 20:281–325
Scott SG, Zeldis JR, Pankhurst NW (1993) Evidence of dailyspawning in natural populations of the New Zealandsnapper Pagrus auratus (Sparidae). Environ Biol Fish 36:149–156
Shears NT, Babcock RC (2002) Marine reserves demonstratetop-down control of community structure on temperatereefs. Oecologia 132:131–142
White GC, Garrot RA (1990) Analysis of wildlife radio-tracking data. Academic Press, San Diego
Willis TJ, Babcock RC (1998) Retention and in situ detect-ability of visible implant fluorescent elastomer (VIFE) tagsin Pagrus auratus (Sparidae). NZ J Mar Freshw Res 32:247–254
Willis TJ, Millar RB (2001) Modified hooks reduce incidentalmortality of snapper (Pagrus auratus) in the New Zealandcommercial longline fishery. ICES J Mar Sci 58:830–841
Willis TJ, Millar RB, Babcock RC (2000) Detection of spatialvariability in relative density of fishes: comparison ofvisual census, angling, and baited underwater video. MarEcol Prog Ser 198:249–260
Willis TJ, Parsons DM, Babcock RC (2001) Evidence for long-term site fidelity of snapper (Pagrus auratus) within amarine reserve. NZ J Mar Freshw Res 35:581–590
Willis TJ, Millar RB, Babcock RC (2003) Protection ofexploited fishes in temperate regions: high density andbiomass of snapper Pagrus auratus (Sparidae) in northernNew Zealand marine reserves. J Appl Ecol 40:214–227
Woodroffe R, Ginsberg JR (1998) Edge effects and the extinc-tion of populations inside protected areas. Science 280:2126–2128
Zeller DC (1997) Home range and activity patterns of thecoral trout Plectropomus leopardus (Serranidae). Mar EcolProg Ser 154:65–77
265
Editorial responsibility: Otto Kinne (Editor), Oldendorf/Luhe, Germany
Submitted: January 29, 2003; Accepted: July 22, 2003Proofs received from author(s): October 27, 2003