Embed Size (px)
Citation preview
SNL ANNUAL REPORT 2015
SUPPLY NETWORK LIMITED ABN 12 OO3 135 680
The financial statements were authorised for issue by the directors on 19 August 2015. The directors have the power to amend and reissue the financial statements.
CONTENTS
01Corporate Information
40Directors’ Declaration
14Statement of Profit or Loss and Other Comprehensive Income
18Notes to the Financial Statements
02Chairman’s and Managing Director’s Report
15Balance Sheet
41Independent Auditor’s Report
07Directors’ Report
16Statement of Changes in Equity
13Auditor’s Independence Declaration
17Statement of Cash Flows
44Consolidated Financial Summary
43ASX Additional Information
Supply Network Limited Annual Report 2015 1
CORPORATE INFORMATION
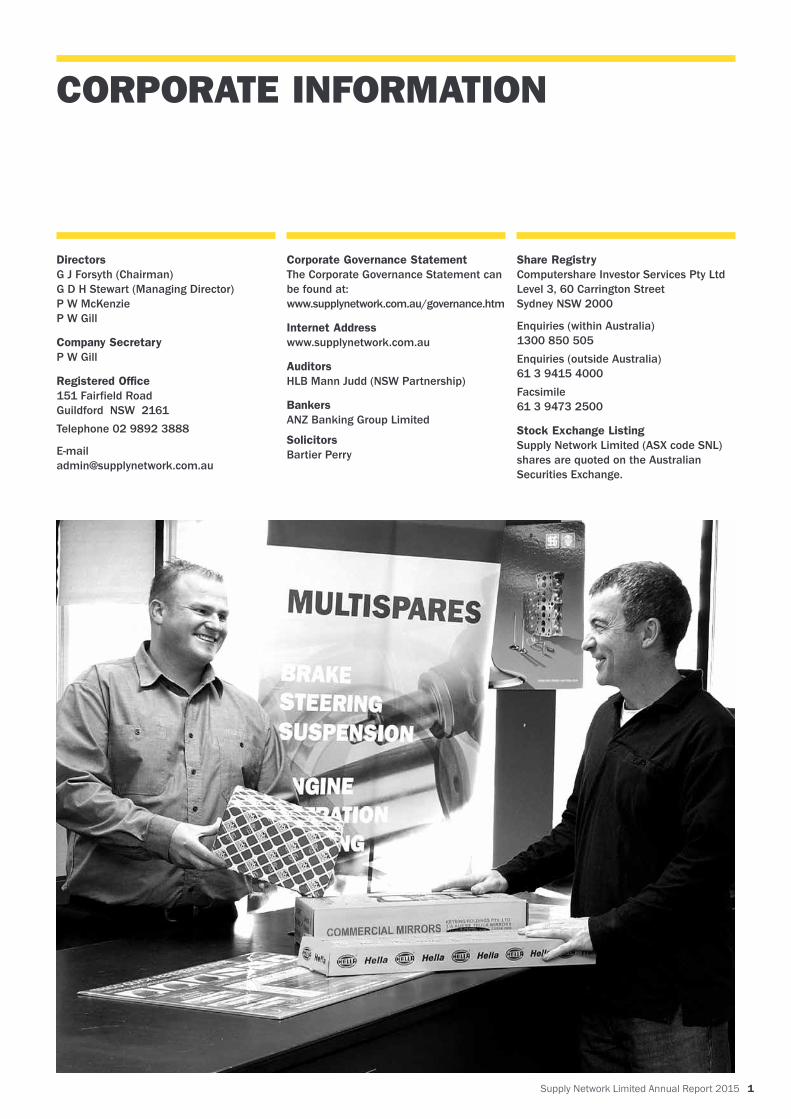
DirectorsG J Forsyth (Chairman)G D H Stewart (Managing Director)P W McKenzieP W Gill
Company SecretaryP W Gill
Registered Office151 Fairfield Road Guildford NSW 2161Telephone 02 9892 3888
E-mail [email protected]
Corporate Governance Statement The Corporate Governance Statement can be found at: www.supplynetwork.com.au/governance.htm
Internet Addresswww.supplynetwork.com.au
AuditorsHLB Mann Judd (NSW Partnership)
BankersANZ Banking Group Limited
SolicitorsBartier Perry
Share RegistryComputershare Investor Services Pty Ltd Level 3, 60 Carrington Street Sydney NSW 2000
Enquiries (within Australia) 1300 850 505Enquiries (outside Australia) 61 3 9415 4000Facsimile 61 3 9473 2500
Stock Exchange ListingSupply Network Limited (ASX code SNL) shares are quoted on the Australian Securities Exchange.
2 Supply Network Limited Annual Report 2015
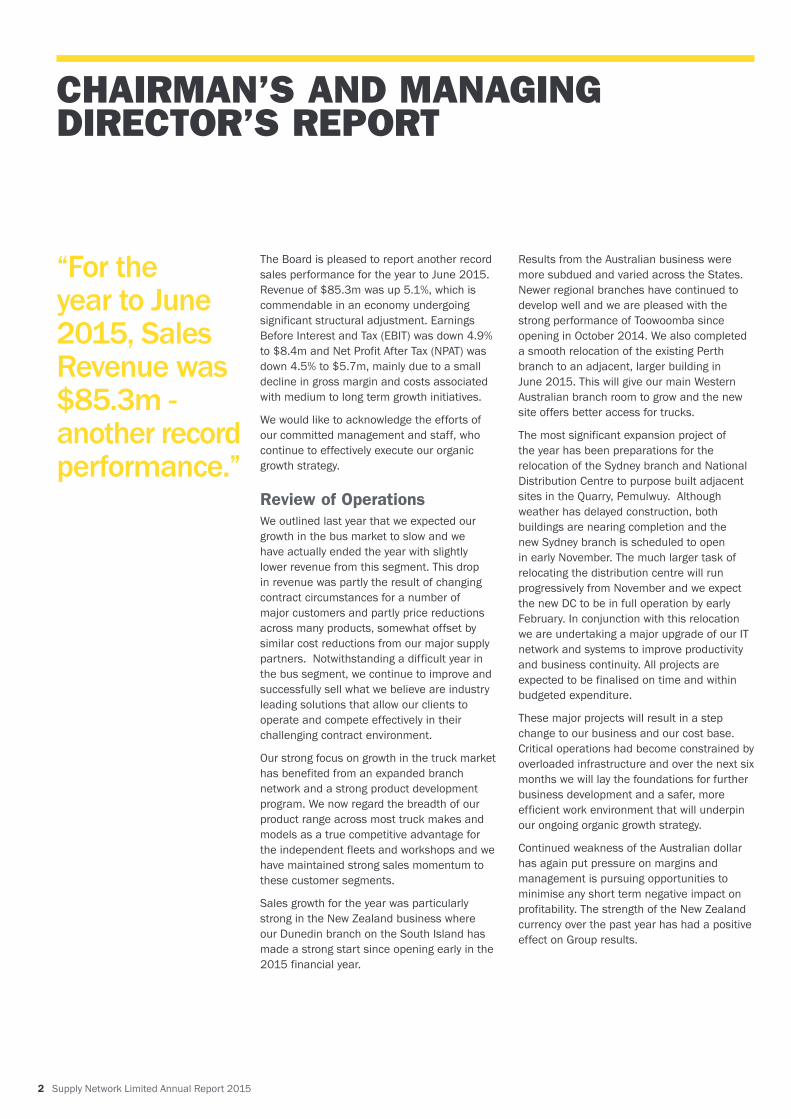
The Board is pleased to report another record sales performance for the year to June 2015. Revenue of $85.3m was up 5.1%, which is commendable in an economy undergoing significant structural adjustment. Earnings Before Interest and Tax (EBIT) was down 4.9% to $8.4m and Net Profit After Tax (NPAT) was down 4.5% to $5.7m, mainly due to a small decline in gross margin and costs associated with medium to long term growth initiatives.
We would like to acknowledge the efforts of our committed management and staff, who continue to effectively execute our organic growth strategy.
Review of OperationsWe outlined last year that we expected our growth in the bus market to slow and we have actually ended the year with slightly lower revenue from this segment. This drop in revenue was partly the result of changing contract circumstances for a number of major customers and partly price reductions across many products, somewhat offset by similar cost reductions from our major supply partners. Notwithstanding a difficult year in the bus segment, we continue to improve and successfully sell what we believe are industry leading solutions that allow our clients to operate and compete effectively in their challenging contract environment.
Our strong focus on growth in the truck market has benefited from an expanded branch network and a strong product development program. We now regard the breadth of our product range across most truck makes and models as a true competitive advantage for the independent fleets and workshops and we have maintained strong sales momentum to these customer segments.
Sales growth for the year was particularly strong in the New Zealand business where our Dunedin branch on the South Island has made a strong start since opening early in the 2015 financial year.
Results from the Australian business were more subdued and varied across the States. Newer regional branches have continued to develop well and we are pleased with the strong performance of Toowoomba since opening in October 2014. We also completed a smooth relocation of the existing Perth branch to an adjacent, larger building in June 2015. This will give our main Western Australian branch room to grow and the new site offers better access for trucks.
The most significant expansion project of the year has been preparations for the relocation of the Sydney branch and National Distribution Centre to purpose built adjacent sites in the Quarry, Pemulwuy. Although weather has delayed construction, both buildings are nearing completion and the new Sydney branch is scheduled to open in early November. The much larger task of relocating the distribution centre will run progressively from November and we expect the new DC to be in full operation by early February. In conjunction with this relocation we are undertaking a major upgrade of our IT network and systems to improve productivity and business continuity. All projects are expected to be finalised on time and within budgeted expenditure.
These major projects will result in a step change to our business and our cost base. Critical operations had become constrained by overloaded infrastructure and over the next six months we will lay the foundations for further business development and a safer, more efficient work environment that will underpin our ongoing organic growth strategy.
Continued weakness of the Australian dollar has again put pressure on margins and management is pursuing opportunities to minimise any short term negative impact on profitability. The strength of the New Zealand currency over the past year has had a positive effect on Group results.
CHAIRMAN’S AND MANAGING DIRECTOR’S REPORT
“For the year to June 2015, Sales Revenue was $85.3m - another record performance.”
Supply Network Limited Annual Report 2015 3
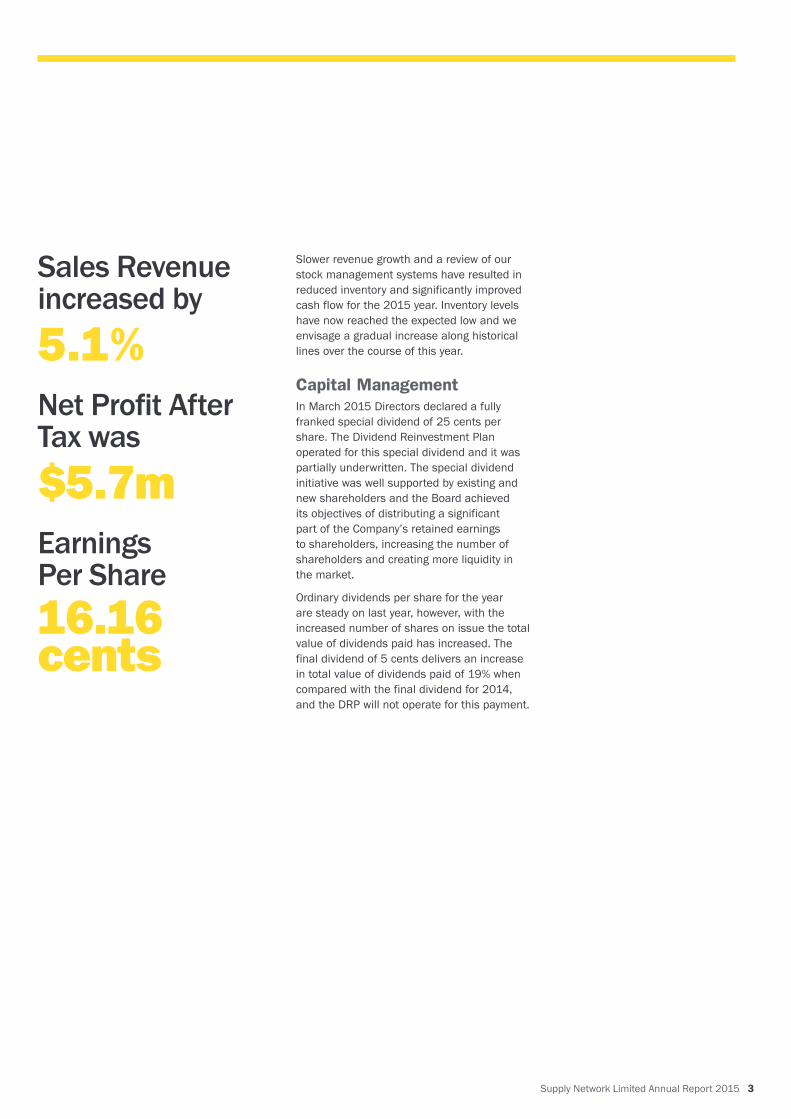
Sales Revenue increased by
5.1%Net Profit After Tax was
$5.7mEarnings Per Share16.16 cents
Slower revenue growth and a review of our stock management systems have resulted in reduced inventory and significantly improved cash flow for the 2015 year. Inventory levels have now reached the expected low and we envisage a gradual increase along historical lines over the course of this year.
Capital ManagementIn March 2015 Directors declared a fully franked special dividend of 25 cents per share. The Dividend Reinvestment Plan operated for this special dividend and it was partially underwritten. The special dividend initiative was well supported by existing and new shareholders and the Board achieved its objectives of distributing a significant part of the Company’s retained earnings to shareholders, increasing the number of shareholders and creating more liquidity in the market.
Ordinary dividends per share for the year are steady on last year, however, with the increased number of shares on issue the total value of dividends paid has increased. The final dividend of 5 cents delivers an increase in total value of dividends paid of 19% when compared with the final dividend for 2014, and the DRP will not operate for this payment.

4 Supply Network Limited Annual Report 2015
CHAIRMAN’S AND MANAGING DIRECTOR’S REPORTCONTINUED
The FutureAlthough the results for 2015 are below the target rate in our current 3-Year Plan, the Board is confident the goals we have set remain achievable over a 3-4 year time frame.
The main focus for the first half of 2016 is a seamless relocation of the Sydney operations to their new sites and extensive planning has been undertaken to minimise business disruption.
Our recent sales focus in target niche segments of the truck market has been successful and we continue to see new opportunities in the bus market.
We also remain committed to broadening our product range and strengthening our branch network, with new locations under consideration in both Australia and New Zealand.
In the year ahead our market is expected to remain challenging but we are focused on achieving steady growth and revenue of around $90m. During the 2016 financial year we will incur one-off costs of around $0.5m as a direct consequence of the relocations in Sydney. We will also incur around $0.9m of the expected ongoing $1.3m increase in annual operating costs as a consequence of the relocations in Sydney and Perth. These cost increases will be offset progressively by continued growth in revenue and underlying profitability and we anticipate full year EBIT of around $7.5m.
In the 2-3 years following the Sydney relocations we expect to restore EBIT margin to our target level of 10% on a higher revenue base, having established the opportunity to continue organic growth over the next decade and pursue other development projects for the Group.
Subject to any material changes in circumstances, Directors expect to maintain ordinary dividends over the next 12 months at the same rate as over the past year.
“We continue to see new opportunities in the truck and bus markets.”
Supply Network Limited Annual Report 2015 5
8.50
7.50
4.00
4.00
*
2011 2012 2013 2014 2015 2011 2012 2013 2014 2015 2011 2012 2013 2014 2015
2011 2012 2013 2014 2015 2011 2012 2013 2014 20152011 2012 2013 2014 2015
$50,
568
$60,
856
$67,
748
$81,
236
$85,
393
$3,8
17
$6,0
05
$6,7
18
$8,8
32
$8,3
95
$2,5
09
$3,9
58
$4,5
48
$6,0
00
$5,7
30
18.9
%
26.1
%
26.2
%
29.6
%
23.5
%
7.82
11.5
8
13.3
0
17.5
5
16.1
6
6.00
9.00
25.0
0*
*Special dividend
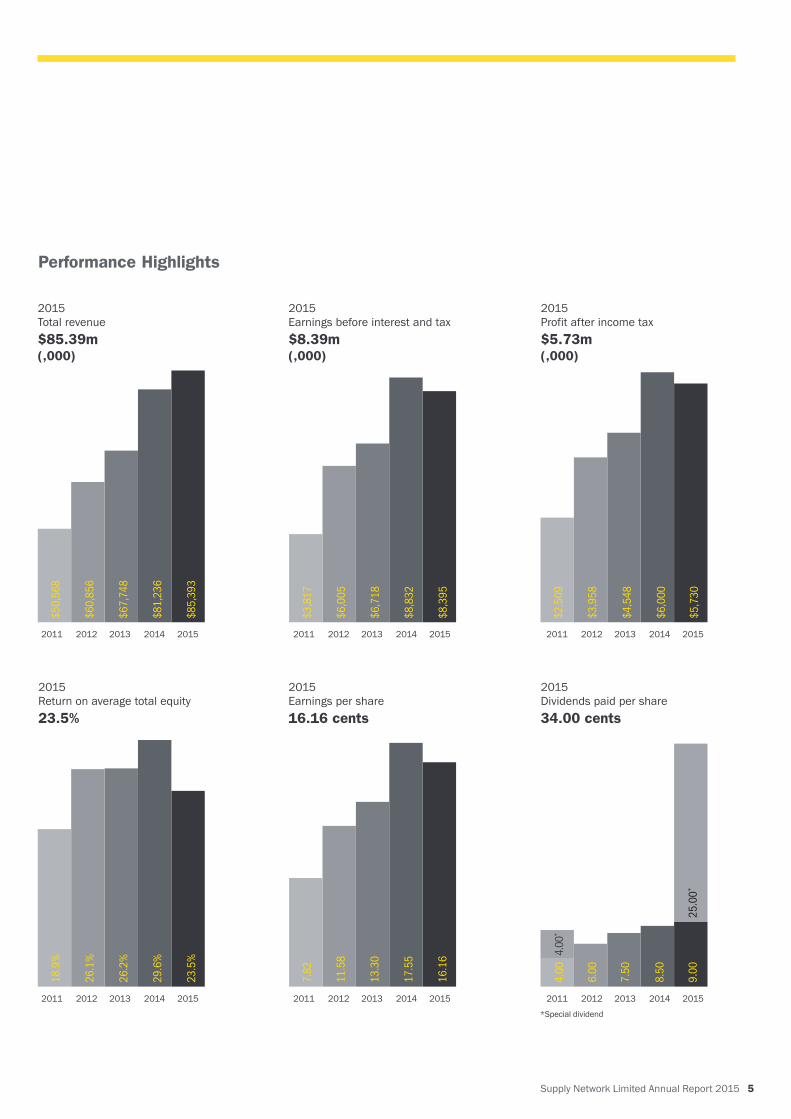
2015 Total revenue $85.39m(,000)
2015 Return on average total equity23.5%
2015 Earnings before interest and tax$8.39m(,000)
2015 Earnings per share16.16 cents
2015 Profit after income tax$5.73m(,000)
2015 Dividends paid per share34.00 cents
Performance Highlights

6 Supply Network Limited Annual Report 2015
OUR BUSINESS
Who we are:Supply Network Limited is a listed company operating trading entities in Australia and New Zealand under the Multispares brand. Each trading entity has its own management team and its own operating focus within a broad market definition of replacement parts for road transport equipment.
In simple terms we sell truck and bus parts. In practice we sell a range of services including parts interpreting, procurement, supply management and problem solving. Through the skill we apply to these services we add considerable value to a growing range of products.
Our business principles:The Australia-New Zealand market for trucks and buses is among the most diverse and most competitive in the world. Vast distances, sophisticated operators and an open economy drive significant diversity in vehicle makes and models and present many challenges for replacement part suppliers. Our business has evolved around these unique characteristics of our local markets.
First and foremost we operate at the “quality” end of the aftermarket. The cost of product failure in our markets is high so we have built our reputation around long-term relationships, reliable products and lowering fleet operating costs. We often tell our customers, “there is nothing that we sell that we couldn’t buy for less, but we don’t compromise quality.”
The diversity of vehicle makes and models and the concentration of certain vehicles for particular tasks sets up considerable difference in the demand for replacement parts from one region to another. In order to deal with the complexities of regional market demand we have developed a decentralised management structure with a strong regional focus. We actively build depth in our branch network to improve local decision-making and strengthen support for local requirements.
The breadth of our product range, significant regional differences and a strong regional structure does add to our operating cost. However we are an organisation with substantial scale, which allows us to buy products well and many of our operational and administrative activities are highly efficient. This keeps us competitive while our branch network keeps service levels strong.
Organisational culture:Our Code of Conduct states:
We value initiative and independent thought but work in teams for a team result.
We show respect for other stakeholders including staff, suppliers and customers.
We obey the law and through good business aim to make a positive contribution to local communities.
In many ways this Code embodies our organisational culture. In a business with thousands of daily transactions, dealing with thousands of different products, we rely on our staff to operate professionally, to interpret requirements and serve customers. They can’t do this alone and in every location our success depends on the strength of the local team.
In the background we build organisational strength to support decision making and to streamline as many transactions as possible. Our staff thrive on the challenges that come from local empowerment but also appreciate the strong business and social ethics that bind us together.
Our organisational culture is a strong factor in our ability to compete and to grow in this industry and has laid a strong platform for growth in the years ahead.
Return on average total equity
23.5%Dividends paid per share34 cents
Supply Network Limited Annual Report 2015 7
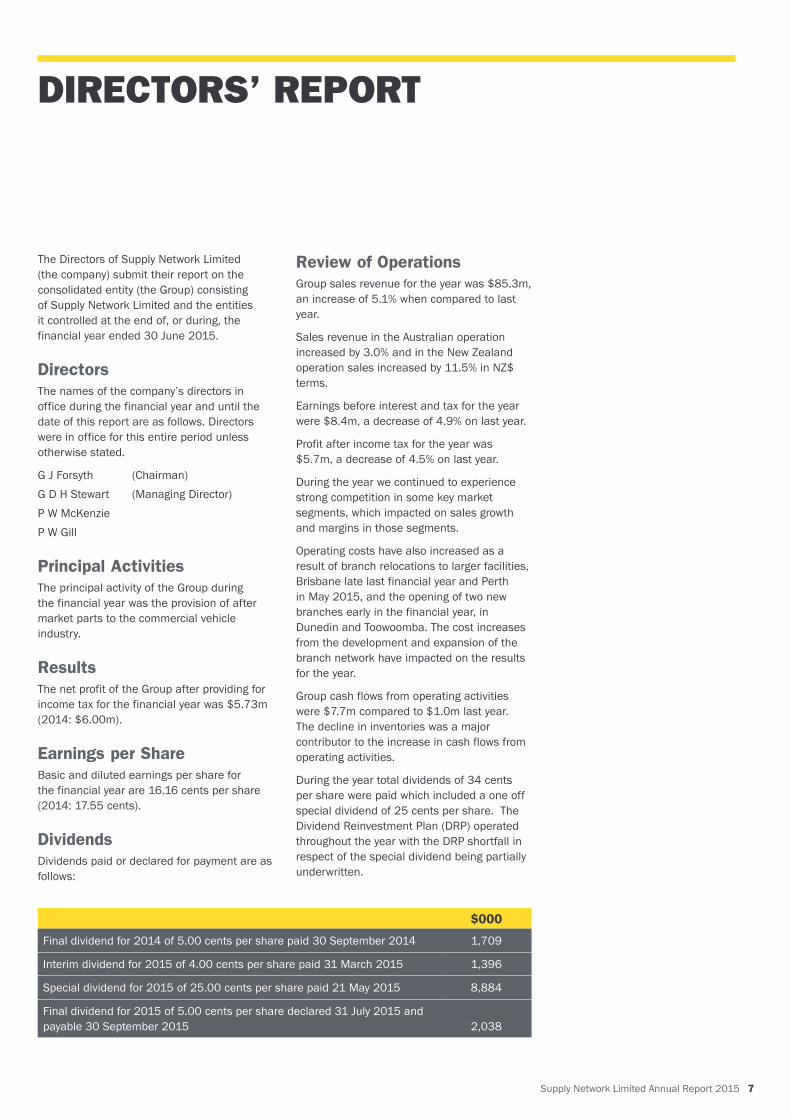
The Directors of Supply Network Limited (the company) submit their report on the consolidated entity (the Group) consisting of Supply Network Limited and the entities it controlled at the end of, or during, the financial year ended 30 June 2015.
DirectorsThe names of the company’s directors in office during the financial year and until the date of this report are as follows. Directors were in office for this entire period unless otherwise stated.
G J Forsyth (Chairman)G D H Stewart (Managing Director)P W McKenzieP W Gill
Principal ActivitiesThe principal activity of the Group during the financial year was the provision of after market parts to the commercial vehicle industry.
ResultsThe net profit of the Group after providing for income tax for the financial year was $5.73m (2014: $6.00m).
Earnings per ShareBasic and diluted earnings per share for the financial year are 16.16 cents per share (2014: 17.55 cents).
DividendsDividends paid or declared for payment are as follows:
$000
Final dividend for 2014 of 5.00 cents per share paid 30 September 2014 1,709
Interim dividend for 2015 of 4.00 cents per share paid 31 March 2015 1,396
Special dividend for 2015 of 25.00 cents per share paid 21 May 2015 8,884
Final dividend for 2015 of 5.00 cents per share declared 31 July 2015 and payable 30 September 2015
2,038
Review of OperationsGroup sales revenue for the year was $85.3m, an increase of 5.1% when compared to last year.
Sales revenue in the Australian operation increased by 3.0% and in the New Zealand operation sales increased by 11.5% in NZ$ terms.
Earnings before interest and tax for the year were $8.4m, a decrease of 4.9% on last year.
Profit after income tax for the year was $5.7m, a decrease of 4.5% on last year.
During the year we continued to experience strong competition in some key market segments, which impacted on sales growth and margins in those segments.
Operating costs have also increased as a result of branch relocations to larger facilities, Brisbane late last financial year and Perth in May 2015, and the opening of two new branches early in the financial year, in Dunedin and Toowoomba. The cost increases from the development and expansion of the branch network have impacted on the results for the year.
Group cash flows from operating activities were $7.7m compared to $1.0m last year. The decline in inventories was a major contributor to the increase in cash flows from operating activities.
During the year total dividends of 34 cents per share were paid which included a one off special dividend of 25 cents per share. The Dividend Reinvestment Plan (DRP) operated throughout the year with the DRP shortfall in respect of the special dividend being partially underwritten.
DIRECTORS’ REPORT

8 Supply Network Limited Annual Report 2015
The operation of the DRP resulted in the issue of a further 6.57m shares and an increase in contributed equity of $11.4m.
Net assets of the group are $26.8m (June 2014: $22.1m) and net tangible asset backing is 65.7 cents per share (June 2014: 64.6 cents).
There were no significant additional long term borrowings during the year and gearing has declined to 14.7% (June 2014: 18.8%).
The Directors have declared a fully franked final dividend of 5.0 cents per share payable on 30 September 2015 to shareholders registered on 11 September 2015. The Dividend Reinvestment Plan will not operate in respect of the final dividend.
Further information on Review of Operations is detailed in the Chairman’s and Managing Director’s Report.
Significant Changes in the State of AffairsThere were no significant changes in the state of affairs of the Group during the financial year not otherwise disclosed in this report or the consolidated financial statements.
Significant Events after Balance DateNo other matter or circumstance has arisen since the end of the financial year which is not otherwise dealt with in this report or in the consolidated financial statements that has significantly affected or may significantly affect the operations of the Group, the result of those operations or the state of affairs of the Group in subsequent financial years.
Likely Developments and Expected ResultsThe Directors forecast sales revenue growth for the Group of at least 5% in 2015/16. Management plans for the year focus on organic growth opportunities in the existing business units. Continued expansion of the product range and branch network are the primary considerations in our three year outlook.
Share Options - Unissued sharesAs at the date of this report, there were no unissued ordinary shares under options. No options for shares were issued during the year.
Information on DirectorsGregory James Forsyth - Chairman
Appointed Chairman of the Board on 17 March 2010. Non-executive Director since 25 January 2006. Chairman of the Audit Committee and a member of the Remuneration Committee. He has over 29 years experience in financial markets specialising in Australian listed equities.
Peter William McKenzie
Appointed to the Board on 1 July 2006 as Non-executive Director. Chairman of the Remuneration Committee and a member of the Audit Committee. He holds a Masters Degree in Business Administration, has over 19 years experience in the transport industry, is the Chief Executive of a family owned bus business and operates a consultancy practice providing advice to clients primarily in the transport industry.
Geoffrey David Huston Stewart - Managing Director
Appointed Chief Executive Officer in November 1999 and Managing Director in November 2000. He has a Bachelor of Engineering (Mechanical) from the University of Sydney, an MBA from Macquarie University and over 26 years experience in the road transport industry.
Peter William Gill
Appointed to the Board on 1 May 2008 as Finance Director. He has been the Senior Finance Executive and Company Secretary since April 1995. He is a Chartered Accountant with a Bachelor of Business degree and has over 35 years experience in accounting and finance in both professional and commercial fields.
“The Directors forecast sales revenue growth for the Group of at least 5% in 2015/16.”
DIRECTORS’ REPORTCONTINUED
Supply Network Limited Annual Report 2015 9
Directors’ InterestsAt the date of this report the interest of each director in the shares of the company are:
(a) G J Forsyth holds 41,200 ordinary shares of the company and is deemed to have a relevant interest in shares held by Odalisque Pty Ltd (626,635 shares).
(b) P W McKenzie is deemed to have a relevant interest in shares held by PW & LJ McKenzie Superannuation Fund, a substantial shareholder (4,473,359 shares).
(c) G D H Stewart is deemed to have a relevant interest in shares held by Boboco Pty Limited (955,947) and D G Stewart (440,886 shares).
(d) P W Gill holds 178,460 ordinary shares of the company and is deemed to have a relevant interest in shares held by Viewbar Pty Limited (420,025 shares).
Indemnification of DirectorsDuring the financial year the company paid an insurance premium insuring the directors and officers of the company and any related body corporate against a liability incurred as such a director or officer, to the extent permitted by the Corporations Act 2001. The company has not otherwise, during or since the financial year, indemnified or agreed to indemnify an officer of the company or any related body corporate against a liability incurred as such an officer. The contract of insurance prohibits the disclosure of the amount of the premium.
Company SecretaryPeter William Gill has been the Company Secretary and Senior Finance Executive of Supply Network Limited for over 20 years and is a Chartered Accountant.
Environmental Regulation and PerformanceThe Group’s operations are not regulated by any significant environmental regulation under a law of the Commonwealth or of a State or Territory.
Remuneration ReportThe report outlines the remuneration arrangements in place for Directors and Executives of the Supply Network Limited Group.
The information provided in this Remuneration Report has been audited as required by section 308 (3C) of the Corporations Act 2001.
Remuneration Committee
The Remuneration Committee is responsible for making recommendations to the Board on remuneration policies and packages applicable to the directors and senior executives of the Group.
The broad remuneration policy is to ensure the remuneration package of directors and senior executives properly reflects the person’s duties and responsibilities and that remuneration is competitive in attracting, retaining and motivating people.
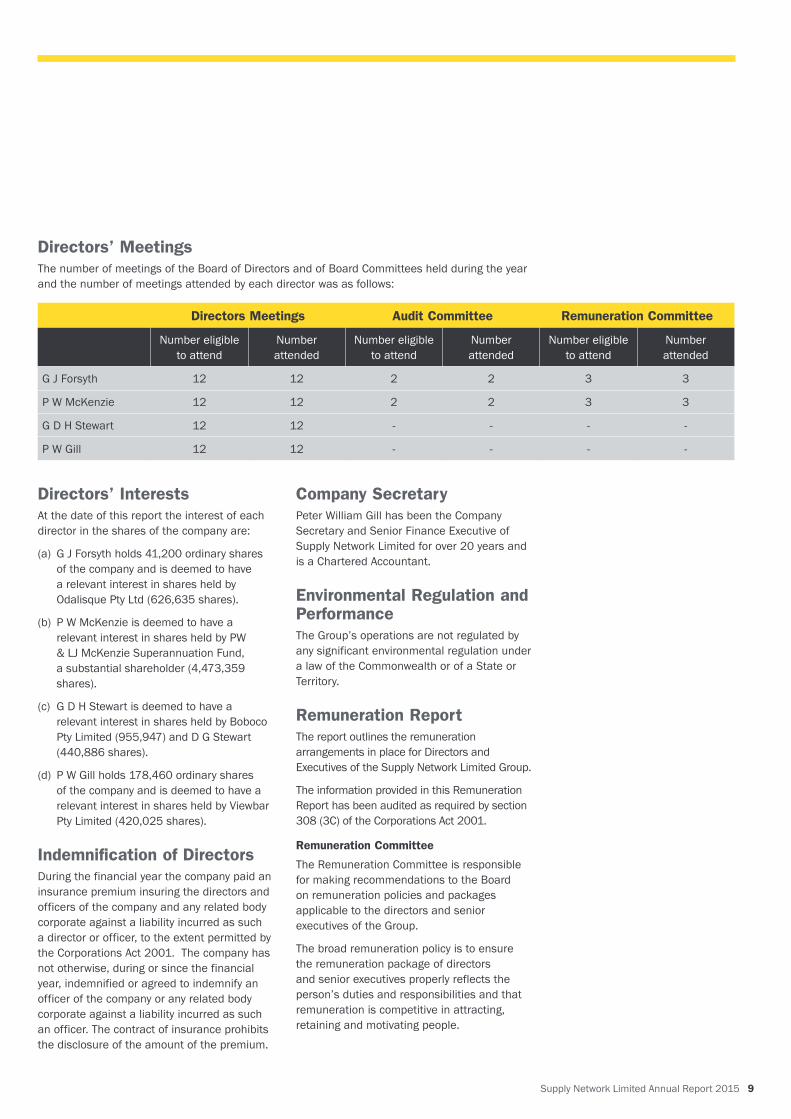
Directors’ MeetingsThe number of meetings of the Board of Directors and of Board Committees held during the year and the number of meetings attended by each director was as follows:
Directors Meetings Audit Committee Remuneration Committee
Number eligible to attend
Number attended
Number eligible to attend
Number attended
Number eligible to attend
Number attended
G J Forsyth 12 12 2 2 3 3
P W McKenzie 12 12 2 2 3 3
G D H Stewart 12 12 - - - -
P W Gill 12 12 - - - -
10 Supply Network Limited Annual Report 2015
“Earnings before interest and tax for the year were $8.4m.”
The Remuneration Committee assesses the appropriateness of the amount of remuneration of directors and senior executives on an annual basis by reference to relevant employment market survey data.
Non-executive director compensation
The Board seeks to set aggregate compensation at a level which would enable the company to attract and retain suitably qualified directors at a cost which is acceptable to shareholders.
Non-executive Directors receive an annual fee for being a director of the company with no provision for retirement benefits. These fees are determined by reference to industry standards taking into account the company’s relative size. No additional payments are made for serving on Board Committees and no performance related compensation or equity incentives are offered.
The present maximum aggregate sum for non-executive directors is $200,000. This amount was approved by shareholders at the 2002 Annual General Meeting.
The compensation of non-executive directors for the period ending 30 June 2015 is detailed in Table 1 on page 11.
Executive director and senior executives compensation
The company aims to reward its executives (Managing Director and Finance Director) with a level of compensation commensurate with their position and responsibilities within the company, to link reward with performance of the company and to ensure total compensation is competitive by market standards.
Compensation consists of the following two elements:
- fixed compensation and- variable compensation – short-term
incentiveThe Board has not used equity-based compensation for executives during the financial year and has no plans to introduce it.
Fixed Compensation
The level of fixed compensation is set to provide a level of compensation that is both appropriate to the position and competitive in the market place. Executives’ fixed compensation is reviewed annually by the Remuneration Committee using relevant employment market survey data as a guide.
Executives are given the scope to tailor their fixed compensation package in a variety of forms including salary, non-monetary benefits and superannuation.
Variable Compensation - Short Term Incentive
The objective of the short-term incentive is to link the group’s performance and operational targets with the compensation of the executives. The short-term incentive is cash based and provides senior executives with the opportunity to earn incentives based on a percentage of fixed annual compensation.
The short-term incentive payable to executives is determined by the Board having regard to the performance of the company and the executive for the relevant year based on qualitative and/or quantitative factors including total shareholder return, return on average equity, return on investment and other business objectives. These factors were chosen as they focused on shareholder wealth and sustainable growth.
The cost of these incentives is deducted from the financial results before determining the performance rewards.
On an annual basis after completion of the audit of the group results the short-term incentives are approved by the Remuneration Committee.
Relationship between Remuneration Policies and Group Performance
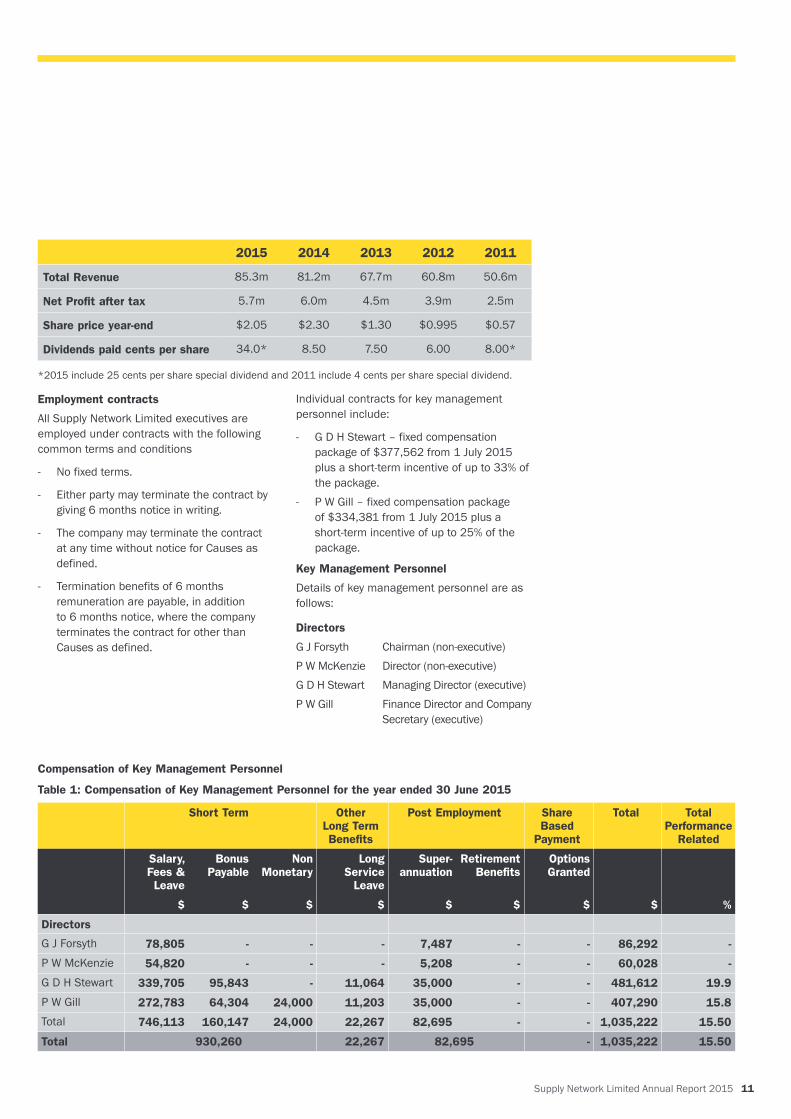
The table at the top of page 11 set out summary information about the Group’s earnings and movements in shareholder wealth for the five years to 30 June 2015. The Board is of the opinion that these results can be attributed, in part, to the remuneration policies and is satisfied with the overall trend in shareholder wealth over the past five years.
DIRECTORS’ REPORTCONTINUED
Supply Network Limited Annual Report 2015 11
2015 2014 2013 2012 2011
Total Revenue 85.3m 81.2m 67.7m 60.8m 50.6m
Net Profit after tax 5.7m 6.0m 4.5m 3.9m 2.5m
Share price year-end $2.05 $2.30 $1.30 $0.995 $0.57
Dividends paid cents per share 34.0* 8.50 7.50 6.00 8.00*
*2015 include 25 cents per share special dividend and 2011 include 4 cents per share special dividend.
Employment contracts
All Supply Network Limited executives are employed under contracts with the following common terms and conditions
- No fixed terms.
- Either party may terminate the contract by giving 6 months notice in writing.
- The company may terminate the contract at any time without notice for Causes as defined.
- Termination benefits of 6 months remuneration are payable, in addition to 6 months notice, where the company terminates the contract for other than Causes as defined.
Individual contracts for key management personnel include:
- G D H Stewart – fixed compensation package of $377,562 from 1 July 2015 plus a short-term incentive of up to 33% of the package.
- P W Gill – fixed compensation package of $334,381 from 1 July 2015 plus a short-term incentive of up to 25% of the package.
Key Management Personnel
Details of key management personnel are as follows:
Directors
G J Forsyth Chairman (non-executive) P W McKenzie Director (non-executive) G D H Stewart Managing Director (executive)P W Gill Finance Director and Company Secretary (executive)
Compensation of Key Management Personnel
Table 1: Compensation of Key Management Personnel for the year ended 30 June 2015
Short Term Other Long Term Benefits
Post Employment Share Based
Payment
Total Total Performance
Related
Salary, Fees & Leave
Bonus Payable
Non Monetary
Long Service
Leave
Super-annuation
Retirement Benefits
Options Granted
$ $ $ $ $ $ $ $ %
Directors
G J Forsyth 78,805 - - - 7,487 - - 86,292 -
P W McKenzie 54,820 - - - 5,208 - - 60,028 -
G D H Stewart 339,705 95,843 - 11,064 35,000 - - 481,612 19.9
P W Gill 272,783 64,304 24,000 11,203 35,000 - - 407,290 15.8
Total 746,113 160,147 24,000 22,267 82,695 - - 1,035,222 15.50
Total 930,260 22,267 82,695 - 1,035,222 15.50
12 Supply Network Limited Annual Report 2015
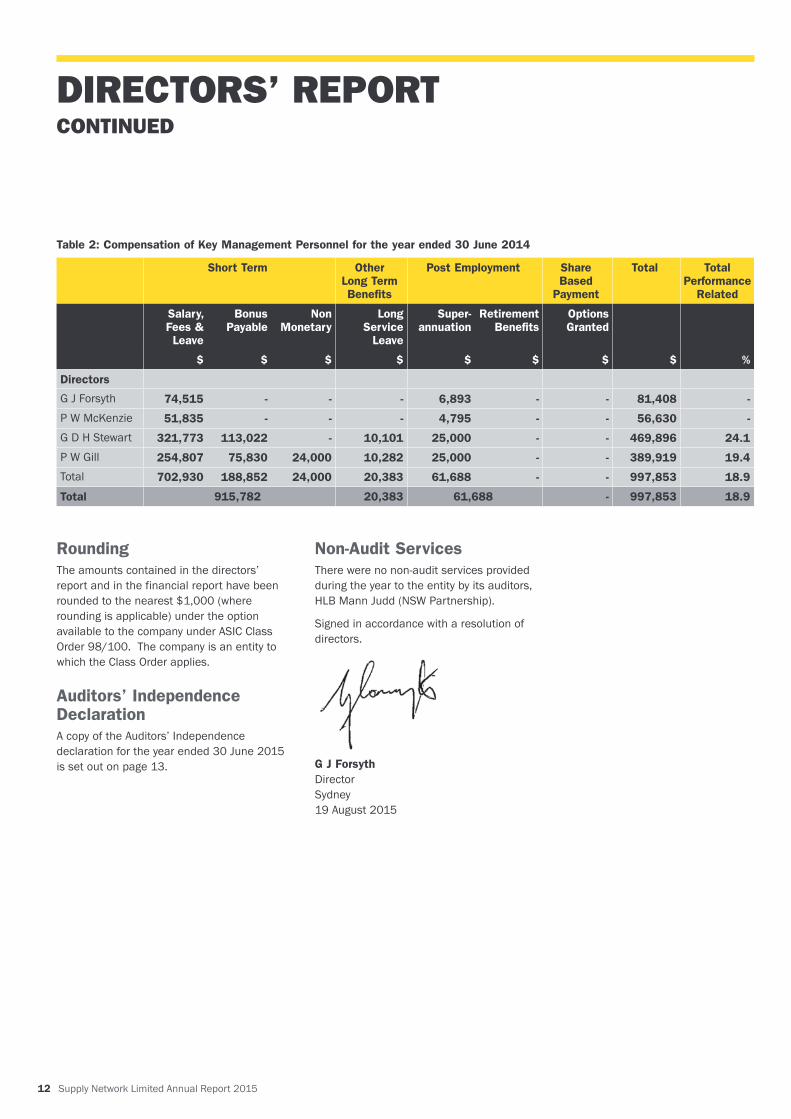
Table 2: Compensation of Key Management Personnel for the year ended 30 June 2014
Short Term Other Long Term Benefits
Post Employment Share Based
Payment
Total Total Performance
Related
Salary, Fees & Leave
Bonus Payable
Non Monetary
Long Service
Leave
Super-annuation
Retirement Benefits
Options Granted
$ $ $ $ $ $ $ $ %
Directors
G J Forsyth 74,515 - - - 6,893 - - 81,408 -
P W McKenzie 51,835 - - - 4,795 - - 56,630 -
G D H Stewart 321,773 113,022 - 10,101 25,000 - - 469,896 24.1
P W Gill 254,807 75,830 24,000 10,282 25,000 - - 389,919 19.4
Total 702,930 188,852 24,000 20,383 61,688 - - 997,853 18.9
Total 915,782 20,383 61,688 - 997,853 18.9
RoundingThe amounts contained in the directors’ report and in the financial report have been rounded to the nearest $1,000 (where rounding is applicable) under the option available to the company under ASIC Class Order 98/100. The company is an entity to which the Class Order applies.
Auditors’ Independence DeclarationA copy of the Auditors’ Independence declaration for the year ended 30 June 2015 is set out on page 13.
Non-Audit ServicesThere were no non-audit services provided during the year to the entity by its auditors, HLB Mann Judd (NSW Partnership).
Signed in accordance with a resolution of directors.
G J Forsyth Director Sydney 19 August 2015
DIRECTORS’ REPORTCONTINUED
Supply Network Limited Annual Report 2015 13
Auditor’s Independence Declaration To the Directors of Supply Network Limited
As lead auditor for the audit of the consolidated financial report of Supply Network Limited for the year ended 30 June 2015 I declare that, to the best of my knowledge and belief, there have been no contraventions of:
(a) the auditor independence requirements of the Corporations Act 2001 in relation to the audit; and
(b) any applicable code of professional conduct in relation to the audit.
This declaration is in relation to Supply Network Limited and the entities it controlled during the year.
Sydney, NSW S Grivas 19 August 2015 Partner
14 Supply Network Limited Annual Report 2015
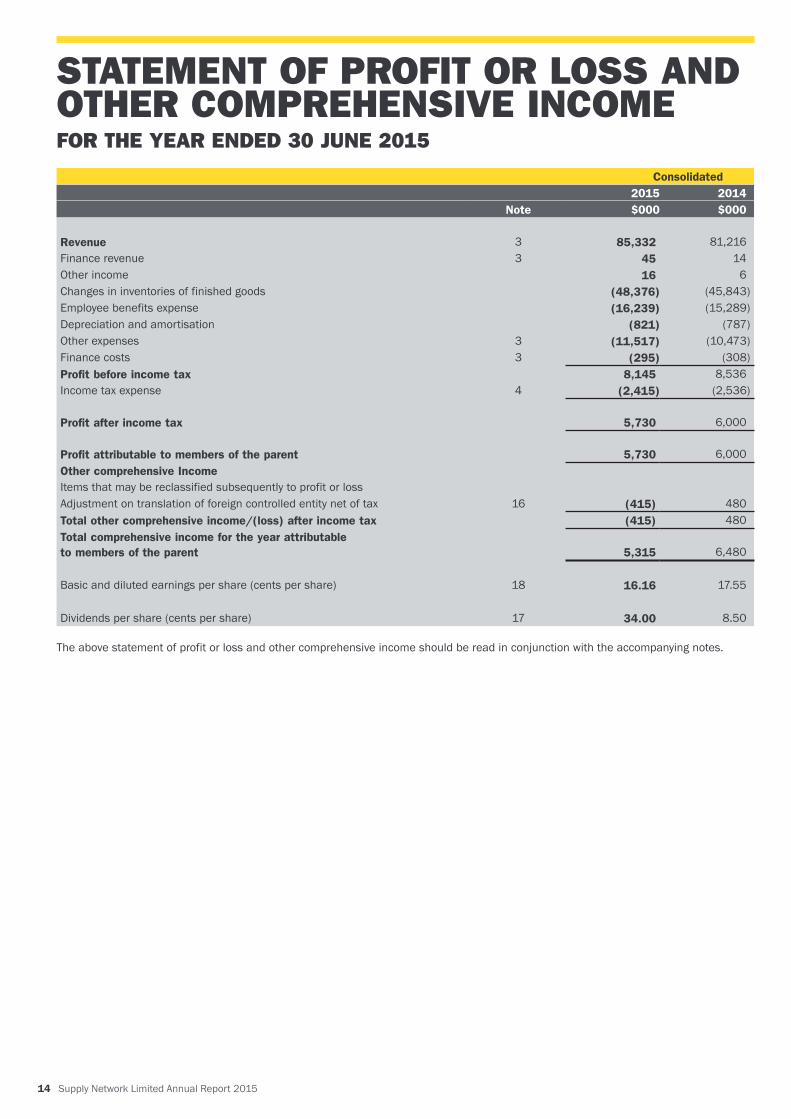
Consolidated2015 2014
Note $000 $000
Revenue 3 85,332 81,216Finance revenue 3 45 14Other income 16 6Changes in inventories of finished goods (48,376) (45,843)Employee benefits expense (16,239) (15,289)Depreciation and amortisation (821) (787)Other expenses 3 (11,517) (10,473)Finance costs 3 (295) (308)Profit before income tax 8,145 8,536Income tax expense 4 (2,415) (2,536)
Profit after income tax
5,730
6,000
Profit attributable to members of the parent
5,730
6,000Other comprehensive IncomeItems that may be reclassified subsequently to profit or lossAdjustment on translation of foreign controlled entity net of tax 16 (415) 480Total other comprehensive income/(loss) after income tax (415) 480Total comprehensive income for the year attributable to members of the parent
5,315
6,480
Basic and diluted earnings per share (cents per share) 18 16.16 17.55
Dividends per share (cents per share) 17 34.00 8.50
The above statement of profit or loss and other comprehensive income should be read in conjunction with the accompanying notes.
STATEMENT OF PROFIT OR LOSS AND OTHER COMPREHENSIVE INCOMEFOR THE YEAR ENDED 30 JUNE 2015
Supply Network Limited Annual Report 2015 15
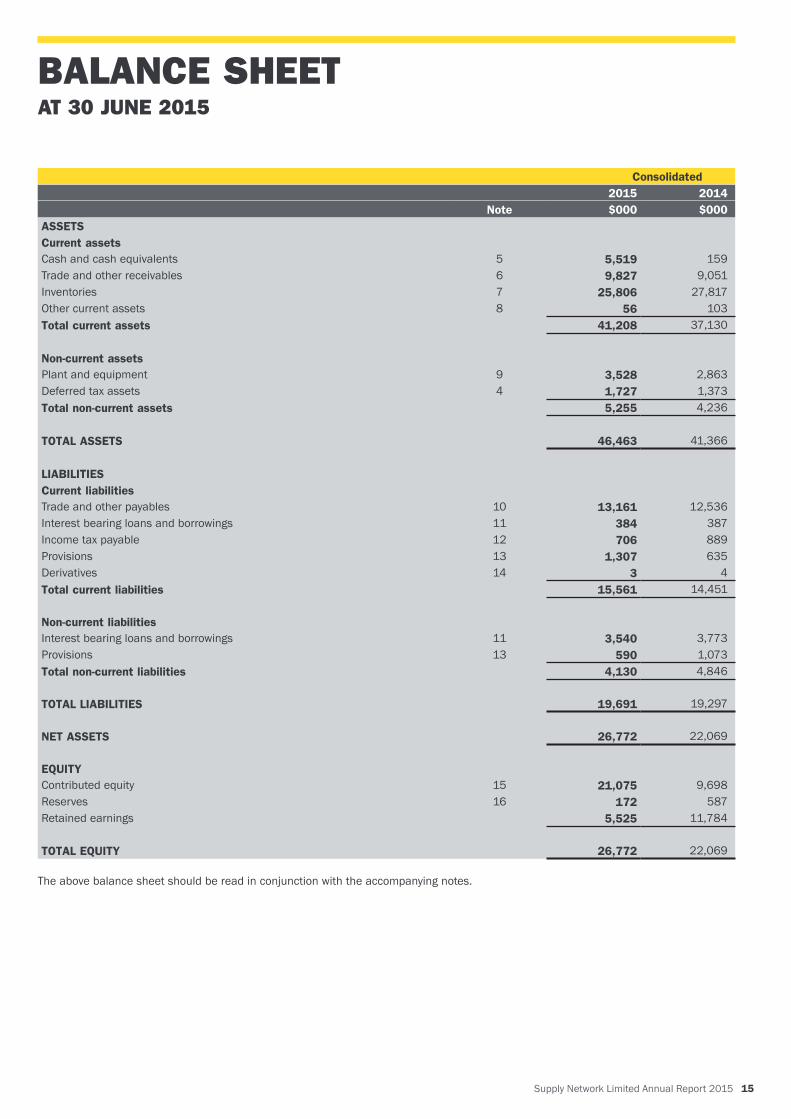
Consolidated2015 2014
Note $000 $000ASSETSCurrent assetsCash and cash equivalents 5 5,519 159Trade and other receivables 6 9,827 9,051Inventories 7 25,806 27,817Other current assets 8 56 103Total current assets 41,208 37,130
Non-current assetsPlant and equipment 9 3,528 2,863Deferred tax assets 4 1,727 1,373Total non-current assets 5,255 4,236
TOTAL ASSETS 46,463 41,366
LIABILITIESCurrent liabilitiesTrade and other payables 10 13,161 12,536Interest bearing loans and borrowings 11 384 387Income tax payable 12 706 889Provisions 13 1,307 635Derivatives 14 3 4Total current liabilities 15,561 14,451
Non-current liabilitiesInterest bearing loans and borrowings 11 3,540 3,773Provisions 13 590 1,073Total non-current liabilities 4,130 4,846
TOTAL LIABILITIES 19,691 19,297
NET ASSETS 26,772 22,069
EQUITYContributed equity 15 21,075 9,698Reserves 16 172 587Retained earnings 5,525 11,784
TOTAL EQUITY 26,772 22,069
The above balance sheet should be read in conjunction with the accompanying notes.
BALANCE SHEETAT 30 JUNE 2015
16 Supply Network Limited Annual Report 2015
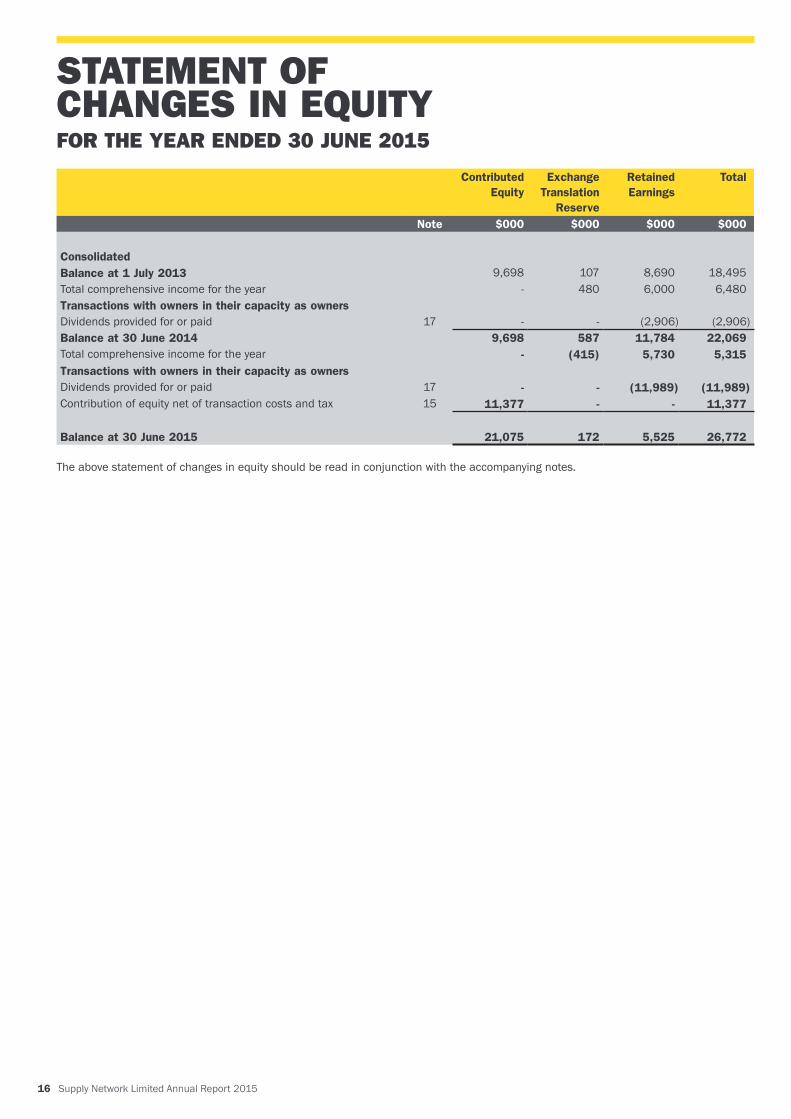
Contributed Equity
Exchange Translation
Reserve
Retained Earnings
Total
Note $000 $000 $000 $000
ConsolidatedBalance at 1 July 2013 9,698 107 8,690 18,495Total comprehensive income for the year - 480 6,000 6,480Transactions with owners in their capacity as ownersDividends provided for or paid 17 - - (2,906) (2,906)Balance at 30 June 2014 9,698 587 11,784 22,069Total comprehensive income for the year - (415) 5,730 5,315Transactions with owners in their capacity as ownersDividends provided for or paid 17 - - (11,989) (11,989)Contribution of equity net of transaction costs and tax 15 11,377 - - 11,377
Balance at 30 June 2015 21,075 172 5,525 26,772
The above statement of changes in equity should be read in conjunction with the accompanying notes.
STATEMENT OF CHANGES IN EQUITYFOR THE YEAR ENDED 30 JUNE 2015
Supply Network Limited Annual Report 2015 17
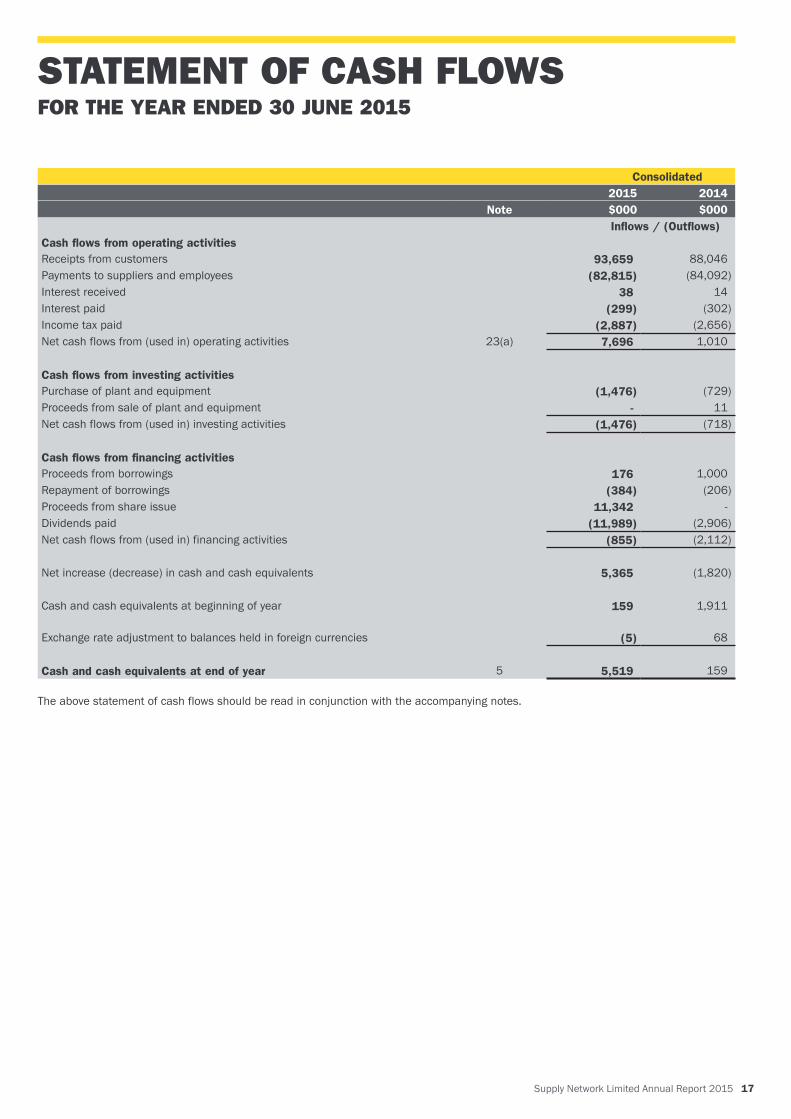
Consolidated2015 2014
Note $000 $000Inflows / (Outflows)
Cash flows from operating activitiesReceipts from customers 93,659 88,046Payments to suppliers and employees (82,815) (84,092)Interest received 38 14Interest paid (299) (302)Income tax paid (2,887) (2,656)Net cash flows from (used in) operating activities 23(a) 7,696 1,010
Cash flows from investing activitiesPurchase of plant and equipment (1,476) (729)Proceeds from sale of plant and equipment - 11Net cash flows from (used in) investing activities (1,476) (718)
Cash flows from financing activitiesProceeds from borrowings 176 1,000Repayment of borrowings (384) (206)Proceeds from share issue 11,342 -Dividends paid (11,989) (2,906)Net cash flows from (used in) financing activities (855) (2,112)
Net increase (decrease) in cash and cash equivalents 5,365 (1,820)
Cash and cash equivalents at beginning of year 159 1,911
Exchange rate adjustment to balances held in foreign currencies
(5)
68
Cash and cash equivalents at end of year 5 5,519 159
The above statement of cash flows should be read in conjunction with the accompanying notes.
STATEMENT OF CASH FLOWSFOR THE YEAR ENDED 30 JUNE 2015
18 Supply Network Limited Annual Report 2015
1. Corporate information
The consolidated financial statements of Supply Network Limited (the company) for the year ended 30 June 2015 were authorised for issue in accordance with a resolution of the directors on 19 August 2015.
Supply Network Limited is a company limited by shares, incorporated and domiciled in Australia, and whose shares are publicly traded on the Australian Securities Exchange.
The nature of the operations and principal activities of the Group are described in the Directors’ report.
2. Summary of significant accounting policies
(a) Basis of accounting
These general-purpose financial statements have been prepared in accordance with the requirements of the Corporations Act 2001 and Australian Accounting Standards. These financial statements have also been prepared on a historical cost basis, except for selected financial assets and liabilities, which have been measured at fair value. The Group is a for profit entity for financial reporting purposes under Australian Accounting Standards.
The financial statements are presented in Australian dollars and all values are rounded to the nearest thousand dollars ($’000) unless otherwise stated, under the option available to the company under ASIC Class Order 98/100. The company is an entity to which the class order applies.
(b) Statement of compliance
The consolidated financial statements of Supply Network Limited also comply with International Financial Reporting Standards (IFRS) as issued by the International Accounting Standards Board (IASB).
(c) Basis of consolidation
The consolidated financial statements comprise the financial statements of Supply Network Limited and the subsidiaries it controlled at the end of or during the financial year (the Group).
The financial statements of the subsidiaries are prepared for the same reporting period as the parent company, using consistent accounting policies.
In preparing the consolidated financial statements, all inter-company balances and transactions, income and expenses and profits and losses resulting from intra-group transactions have been eliminated in full.
Subsidiaries are fully consolidated from the date on which control is transferred to the Group and cease to be consolidated from the date on which control is transferred out of the Group.
(d) Significant accounting judgements, estimates and assumptions
(i) Significant accounting judgementsIn the process of applying the Group’s accounting policies, management has not made any significant judgements, apart from those involving estimates.
(ii) Significant accounting estimates and assumptionsThe carrying amounts of certain assets and liabilities are often determined based on estimates and assumptions of future events.
The key estimates and assumptions that have a significant risk of causing a material adjustment to the carrying amounts of certain assets and liabilities within the next annual reporting period are:
Impairment of assetsThe Group determines whether the carrying value of assets is impaired at least on an annual basis, where indicators exist. This requires an estimation of the recoverable amount of the cash generating units to which the assets are allocated.
Long service leave provisionThe liability for long service leave is recognised and measured at the present value of the estimated future cash flows to be made in respect of all employees at balance date. In determining the present value of the liability, attrition rates and pay increases through inflation have been taken into account.
Obsolete inventory provisionProvision is made for anticipated obsolete and redundant inventories. This requires an estimation to be made based on expected sales volumes and current inventory levels.
Make good provisionProvision is made for the anticipated costs of future restoration of leased premises. The provision includes future cost estimates to restore the premises to their original condition at the end of the lease terms. The future cost estimates are discounted to their present value.
(e) Foreign currency transactions
Both the functional and presentation currency of Supply Network Limited and its Australian subsidiaries are Australian dollars ($). Each entity in the Group determines its own functional currency and items included in the financial statements of each entity are measured using that functional currency.
Transactions in foreign currencies are initially recorded in the functional currency by applying the exchange rates ruling at the date of the transaction. Monetary assets and liabilities denominated in foreign currencies are retranslated at the rate of exchange ruling at the balance date. These differences are included in other comprehensive income.
Subsidiary CompanyThe functional currency of the foreign operation, Multispares N.Z. Limited, is New Zealand dollars (NZ$).
As at the reporting date the assets and liabilities of the foreign subsidiary are translated into the presentation currency of Supply Network Limited at the exchange rate ruling at the balance sheet date and its profit or loss is translated at the weighted average exchange rate for the year.
Non-monetary items that are measured in terms of historical cost in a foreign currency are translated using the exchange rates at the date of the initial transaction.
Non-monetary items that are measured at fair value in a foreign currency are translated using the exchange rates at the date when the fair value was determined.
The exchange differences arising on the translation are taken directly to a separate component of equity.
NOTES TO THE FINANCIAL STATEMENTSFOR THE YEAR ENDED 30 JUNE 2015
Supply Network Limited Annual Report 2015 19
On disposal of a foreign entity, the deferred cumulative amount recognised in equity relating to that particular foreign operation is recognised in profit or loss.
(f) Cash and cash equivalents
Cash and short-term deposits in the Balance Sheet comprise cash at bank and in hand and short term deposits with an original maturity of three months or less.
For the purpose of the Statement of Cash Flows, cash and cash equivalents consists of cash and cash equivalents as defined above, net of outstanding bank overdrafts.
(g) Trade and other receivables
Trade receivables, which generally have 30 day terms, are recognised and carried at original invoice amount less an allowance for any uncollectible amounts.
An allowance for impairment is made when there is objective evidence that the Group will not be able to collect the debts. Bad debts are written-off when identified.
(h) Inventories
Inventories including finished goods and stocks in transit are valued at the lower of cost and net realisable value.
Cost incurred in bringing each product to its present location and condition is accounted for as follows:
Finished Goods – weighted average cost into store.
Net realisable value is the estimated selling price in the ordinary course of business, less estimated costs necessary to make the sale.
Obsolete and redundant inventories are provided for as appropriate.
(i) Leases
The determination of whether an arrangement is or contains a lease is based on the substance of an arrangement and requires an assessment of whether the fulfilment of the arrangement is dependent on the use of a specific asset or assets and the arrangement conveys a right to use the asset.
Group as a lesseeFinance leases, which transfer to the Group substantially all the risks and benefits incidental to ownership of the leased item, are capitalised at the inception of the lease at the fair value of the leased property or, if lower, at the present value of the minimum lease payments. Lease payments are apportioned between the finance charges and reduction of the lease liability so as to achieve a constant rate of interest on the remaining balance of the liability. Finance charges are recognised as an expense in profit or loss.
Capitalised leased assets are depreciated over the shorter of the estimated useful life of the asset and the lease term if there is no reasonable certainty that the Group will obtain ownership by the end of the lease term.
There were no finance leases during the year.
Operating lease payments are recognised as an expense in profit or loss on a straight-line basis over the lease term. Lease incentives are recognised in profit or loss as an integral part of the total lease expense.
(j) Plant and equipment
Plant and equipment is stated at cost less accumulated depreciation and any accumulated impairment losses.
Depreciation is calculated on a straight line over the estimated useful life of the asset as follows:
Plant and equipment 2-10 years
The assets’ residual values, useful lives and amortisation methods are reviewed and if appropriate revised at each financial year-end.
An item of plant and equipment is derecognised upon disposal or when no further future economic benefits are expected from its use or disposal.
Any gain or loss arising on derecognition of the asset (calculated as the difference between the net disposal proceeds and the carrying amount of the asset) is included in profit or loss in the year the asset was derecognised.
Capital works in progress are stated at cost and not depreciated until assets are in use.
(k) Derivative financial instruments
The Group uses derivative financial instruments such as foreign currency contracts to hedge its risks associated with foreign currency fluctuations. Such derivative financial instruments are stated at market value. None of the forward exchange contracts qualify for hedge accounting and all gains or losses arising from changes in the fair value are charged directly in profit or loss.
The fair value of forward exchange contracts is calculated by reference to current exchange rates for contracts with similar maturity profiles.
(l) Trade and other payables
Trade payables and other payables are carried at amortised cost and represent liabilities for goods and services provided to the Group prior to the end of the financial year that are unpaid and arise when the Group becomes obliged to make future payments in respect of the purchase of these goods and services. The amounts are unsecured, non-interest bearing and are usually paid within 30-60 days of recognition.
(m) Provisions
Provisions are recognised when the Group has a present obligation (legal or constructive) as a result of a past event, it is probable that an outflow of resources embodying economic benefits will be required to settle the obligation and a reliable estimate can be made of the amount of the obligation.
When the Group expects some or all of a provision to be reimbursed, for example under an insurance contract, the reimbursement is recognised as a separate asset but only when the reimbursement is virtually certain. The expense relating to any provision is included in profit or loss net of any reimbursement.
20 Supply Network Limited Annual Report 2015
NOTES TO THE FINANCIAL STATEMENTSFOR THE YEAR ENDED 30 JUNE 2015 (CONTINUED)2. Summary of significant accounting policies (continued)
(m) Provisions (continued)
Provisions are measured at present value of management’s best estimate of the expenditure required to settle the present obligation at the balance sheet date.
If the effect of the time value of money is material, provisions are discounted using a current pre-tax rate that reflects the risks specific to the liability.
When discounting is used, the increase in the provision due to the passage of time is recognised in finance costs.
(n) Employee leave benefits
(i) Wages, salaries, annual leave and sick leaveLiabilities for wages and salaries, including non-monetary benefits, annual leave and accumulating sick leave expected to be settled within 12 months of the reporting date are recognised in other payables in respect of employees’ services up to the reporting date. They are measured at the amounts expected to be paid when the liabilities are settled. Liabilities for non-accumulating sick leave are recognised when the leave is taken and are measured at the rates paid or payable.
(ii) Long service leaveThe liability for long service leave is recognised in the provision for employee benefits and measured as the present value of expected future payments to be made in respect of services provided by employees up to the reporting date. Consideration is given to expected future wage and salary levels, experience of employee departures, and periods of service. Expected future payments are discounted using market yields at the reporting date on national government bonds with terms to maturity and currencies that match, as closely as possible, the estimated future cash outflows.
(o) Post-employment benefitsContributions are made to employee superannuation funds and are charged against profit or loss when incurred (refer note 22).
(p) Contributed equityOrdinary shares are classified as equity. Incremental costs directly attributable to the issue of new shares are shown in equity as a deduction, net of tax, from the proceeds.
(q) Interest bearing liabilitiesAll loans and borrowings are initially recognised at the fair value of the consideration received less directly attributable transaction costs.
After initial recognition, interest-bearing loans and borrowings are subsequently measured at amortised cost using the effective interest method.
Borrowings are classified as current liabilities unless the Group has an unconditional right to defer settlement of the liability for at least 12 months after the balance sheet date.
(r) Impairment of assetsThe Group assesses at each reporting date whether there is an indication that an asset may be impaired. If any such indication exists, or when annual impairment testing for an asset is required,
the Group makes an estimate of the asset’s recoverable amount. An asset’s recoverable amount is the higher of its fair value less costs to sell and its value in use and is determined for an individual asset, unless the asset does not generate cash inflows that are largely independent of those from other assets or groups of assets and the asset’s value in use cannot be estimated to be close to its fair value. When the carrying amount of an asset or cash-generating unit exceeds its recoverable amount, the asset or cash-generating unit is considered impaired and is written down to its recoverable amount.
In assessing value in use, the estimated future cash flows are discounted to their present value using a pre-tax discount rate that reflects current market assessments of the time value of money and the risks specific to the asset. Impairment losses relating to continuing operations are recognised in those expense categories consistent with the function of the impaired asset unless the asset is carried at revalued amount (in which case the impairment loss is treated as a revaluation decrease).
An assessment is also made at each reporting date as to whether there is any indication that previously recognised impairment losses may no longer exist or may have decreased. If such indication exists, the recoverable amount is estimated. A previously recognised impairment loss is reversed only if there has been a change in the estimates used to determine the asset’s recoverable amount since the last impairment loss was recognised. If that is the case the carrying amount of the asset is increased to its recoverable amount. That increased amount cannot exceed the carrying amount that would have been determined, net of depreciation, had no impairment loss been recognised for the asset in prior years. Such reversal is recognised in profit or loss unless the asset is carried at revalued amount, in which case the reversal is treated as a revaluation increase. After such a reversal the depreciation charge is adjusted in future periods to allocate the asset’s revised carrying amount, less any residual value, on a systematic basis over its remaining useful life.
(s) Revenue recognition
Revenue is recognised to the extent that it is probable that the economic benefits will flow to the Group and the revenue can be reliably measured. The following specific recognition criteria must also be met before revenue is recognised:
(i) Sale of goods
Revenue is recognised when the significant risks and rewards of ownership of the goods have passed to the buyer and the costs incurred or to be incurred in respect of the transaction can be measured reliably. Risks and rewards of ownership are considered passed to the buyer at the time of delivery of the goods to the customer.
(ii) Interest incomeRevenue is recognised as interest accrues using the effective interest method. This is a method of calculating the amortised cost of a financial asset and allocating the interest income over the relevant period using the effective interest rate, which is the rate that exactly discounts estimated future cash receipts through the expected life of the financial asset to the net carrying amount of the financial asset.
Supply Network Limited Annual Report 2015 21
(t) Borrowing costs
Borrowing costs are recognised as an expense in the period in which they are incurred.
(u) Income tax
Current tax assets and liabilities for the current and prior periods are measured at the amount expected to be recovered from or paid to the taxation authorities. The tax rates and tax laws used to compute the amount are those that are enacted or substantively enacted at balance sheet date.
Deferred income tax is provided on all temporary differences at the balance date between the tax bases of assets and liabilities and their carrying amounts for financial reporting purposes.
Deferred income tax liabilities are recognised for all temporary differences except:
• when the deferred income tax liability arises from the initial recognition of goodwill or of an asset or liability in a transaction that is not a business combination and that, at the time of the transaction, affects neither the accounting profit nor taxable profit or loss; or
• when the taxable temporary difference is associated with investments in subsidiaries, associates or interests in joint ventures, and the timing of the reversal of the temporary difference can be controlled and it is probable that the temporary difference will not reverse in the foreseeable future.
Deferred income tax assets are recognised for all deductible temporary differences, carry-forward of unused tax assets and unused losses, to the extent that it is probable that taxable profit will be available against which the deductible temporary differences and the carry-forward of unused tax credits and unused tax losses can be utilised, except:
• when the deferred income tax asset relating to the deductible temporary difference arises from the initial recognition of an asset or liability in a transaction that is not a business combination and, at the time of the transaction, affects neither the accounting profit nor taxable profit or loss; or
• when the deductible temporary difference is associated with investments in subsidiaries, associates or interests in joint ventures, in which case a deferred tax asset is only recognised to the extent that it is probable that the temporary difference will reverse in the foreseeable future and taxable profit will be available against which the temporary difference can be utilised.
The carrying amount of deferred income tax assets is reviewed at each balance sheet date and reduced to the extent that it is no longer probable that sufficient taxable profit will be available to allow all or part of the deferred income tax asset to be utilised.
Deferred income tax assets and liabilities are measured at the tax rates that are expected to apply to the year when the asset is realised or the liability is settled, based on tax rates (and tax laws) that have been enacted at the balance sheet date.
Income tax relating to items recognised directly in equity is recognised in equity and not in profit or loss.
Deferred tax assets and deferred tax liabilities are offset only if a legally enforceable right exists to set off current tax liabilities and the deferred tax assets and liabilities relate to the same taxable
entity and the same taxation authority.
The tax consolidated current tax expense and other deferred tax assets are required to be allocated to the members of the tax-consolidated group. The Group uses a group allocation method for this purpose where the allocated current tax payable, current tax loss, deferred tax assets and other tax credits for each member of the tax consolidated group is determined as if the company is a stand-alone taxpayer but modified as necessary to recognise membership of a tax consolidated group. Recognition of amounts allocated to members of the tax-consolidated group has regard to the tax consolidated group’s future tax profits.
(v) Other taxes
Revenues, expenses and assets are recognised net of the amount of GST except:
• when the GST incurred on a purchase of goods and services is not recoverable from the taxation authority, in which case the GST is recognised as part of the cost of acquisition of the asset or as part of the expense item as applicable; and receivables and payables, which are stated with the amount of GST included.
The net amount of GST recoverable from, or payable to, the taxation authority is included as part of receivables or payables in the balance sheet.
Cash flows are included in the statement of cash flows on a gross basis and the GST component of cash flows arising from investing and financing activities, which is recoverable from, or payable to, the taxation authority, are classified as operating cash flows.
Commitments and contingencies are disclosed net of the amount of GST recoverable from, or payable to, the taxation authority.
(w) Earnings per share
Basic earnings per share is calculated as net profit attributable to members of the parent, adjusted to exclude any costs of servicing equity (other than dividends) divided by the weighted average number of ordinary shares, adjusted for any bonus element.
Diluted earnings per share is calculated as net profit attributable to members of the parent, adjusted for:
• cost of servicing equity (other than dividends)• the after tax effect of dividends and interest associated with
dilutive potential ordinary shares that have been recognised as expenses; and
• other non-discretionary changes in revenues or expenses during the period that would result from the dilution of potential ordinary shares;
divided by the weighted average number of ordinary shares and dilutive potential ordinary shares, adjusted for any bonus element.
(x) New Accounting standards and interpretations
Certain new accounting standards and interpretations have been published that are not mandatory for the 30 June 2015 reporting period. The Group’s assessment of the impact of these new standards and interpretations is they will result in no significant changes to the amounts recognised or matters disclosed in the Group’s financial statements. AASB 15 Revenue from Contracts with Customers is not operative until 1st January 2018, and the potential impacts have not yet been determined.
22 Supply Network Limited Annual Report 2015
Consolidated2015 2014$000 $000
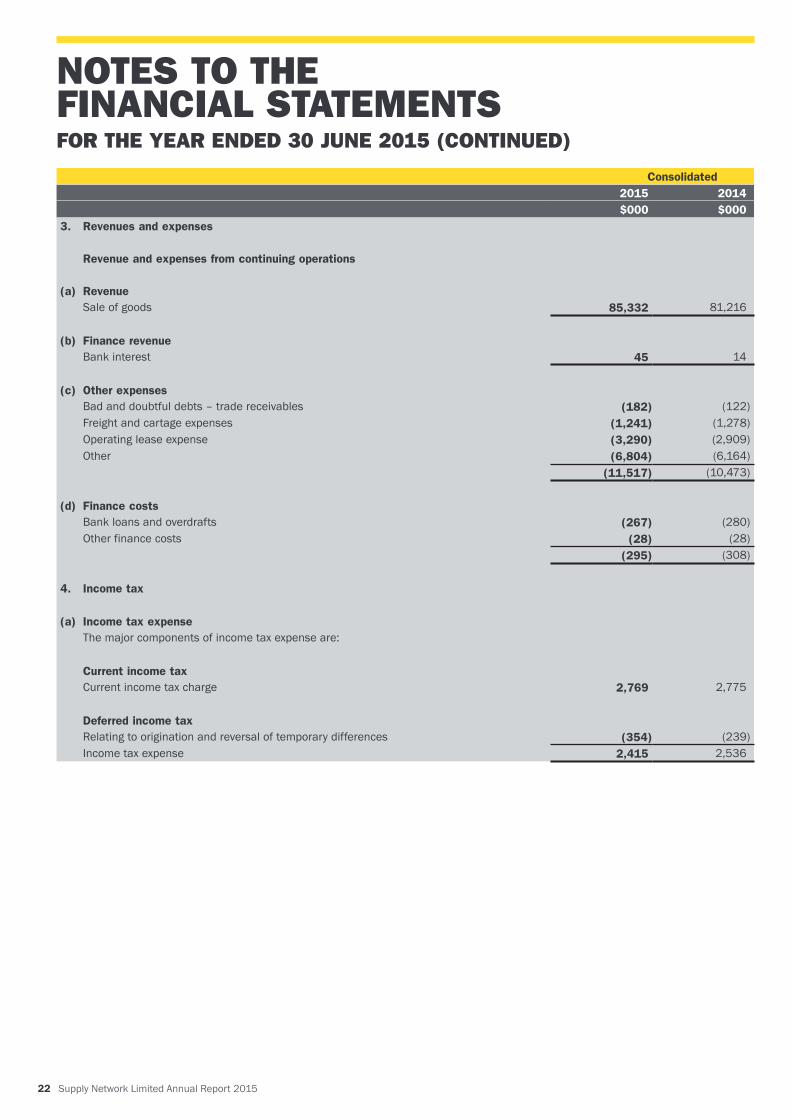
3. Revenues and expenses
Revenue and expenses from continuing operations
(a) RevenueSale of goods 85,332 81,216
(b) Finance revenueBank interest 45 14
(c) Other expensesBad and doubtful debts – trade receivables (182) (122)Freight and cartage expenses (1,241) (1,278)Operating lease expense (3,290) (2,909)Other (6,804) (6,164)
(11,517) (10,473)
(d) Finance costsBank loans and overdrafts (267) (280)Other finance costs (28) (28)
(295) (308)
4. Income tax
(a) Income tax expenseThe major components of income tax expense are:
Current income taxCurrent income tax charge 2,769 2,775
Deferred income taxRelating to origination and reversal of temporary differences (354) (239)Income tax expense 2,415 2,536
NOTES TO THE FINANCIAL STATEMENTSFOR THE YEAR ENDED 30 JUNE 2015 (CONTINUED)
Supply Network Limited Annual Report 2015 23
Consolidated2015 2014$000 $000
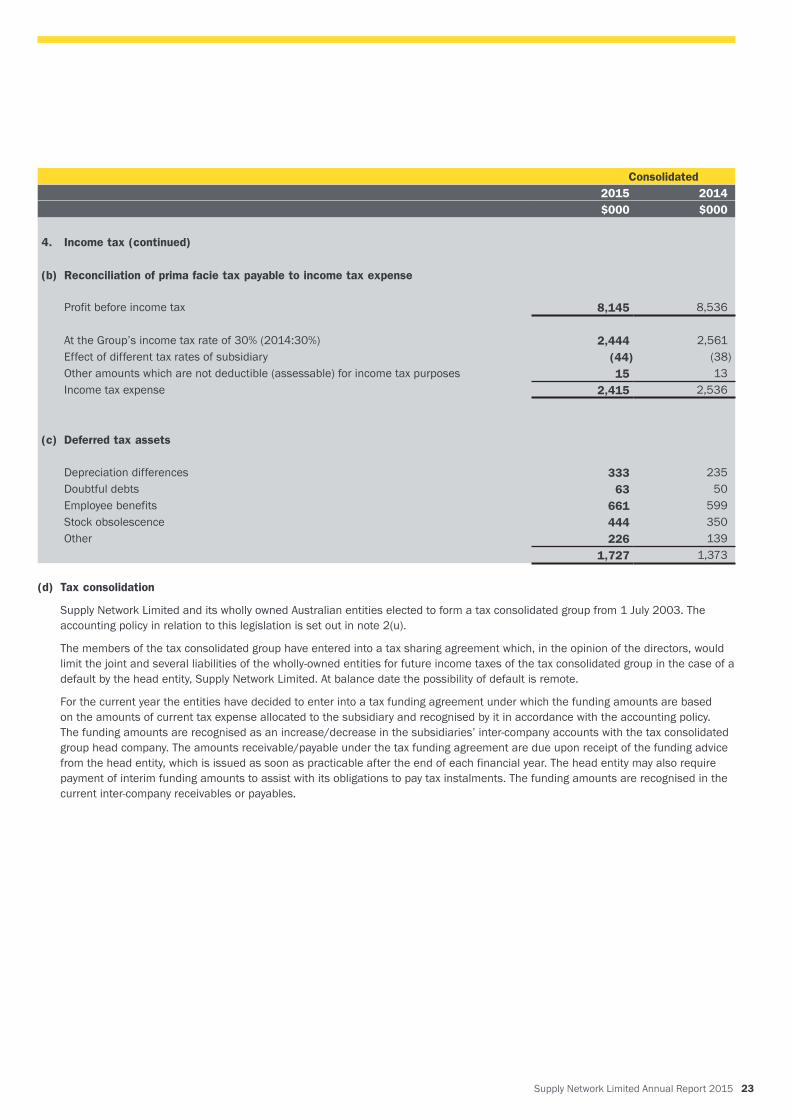
4. Income tax (continued)
(b) Reconciliation of prima facie tax payable to income tax expense
Profit before income tax 8,145 8,536
At the Group’s income tax rate of 30% (2014:30%) 2,444 2,561Effect of different tax rates of subsidiary (44) (38)Other amounts which are not deductible (assessable) for income tax purposes 15 13Income tax expense 2,415 2,536
(c) Deferred tax assets
Depreciation differences 333 235Doubtful debts 63 50Employee benefits 661 599Stock obsolescence 444 350Other 226 139
1,727 1,373
(d) Tax consolidation
Supply Network Limited and its wholly owned Australian entities elected to form a tax consolidated group from 1 July 2003. The accounting policy in relation to this legislation is set out in note 2(u).
The members of the tax consolidated group have entered into a tax sharing agreement which, in the opinion of the directors, would limit the joint and several liabilities of the wholly-owned entities for future income taxes of the tax consolidated group in the case of a default by the head entity, Supply Network Limited. At balance date the possibility of default is remote.
For the current year the entities have decided to enter into a tax funding agreement under which the funding amounts are based on the amounts of current tax expense allocated to the subsidiary and recognised by it in accordance with the accounting policy. The funding amounts are recognised as an increase/decrease in the subsidiaries’ inter-company accounts with the tax consolidated group head company. The amounts receivable/payable under the tax funding agreement are due upon receipt of the funding advice from the head entity, which is issued as soon as practicable after the end of each financial year. The head entity may also require payment of interim funding amounts to assist with its obligations to pay tax instalments. The funding amounts are recognised in the current inter-company receivables or payables.
24 Supply Network Limited Annual Report 2015
Consolidated2015 2014$000 $000
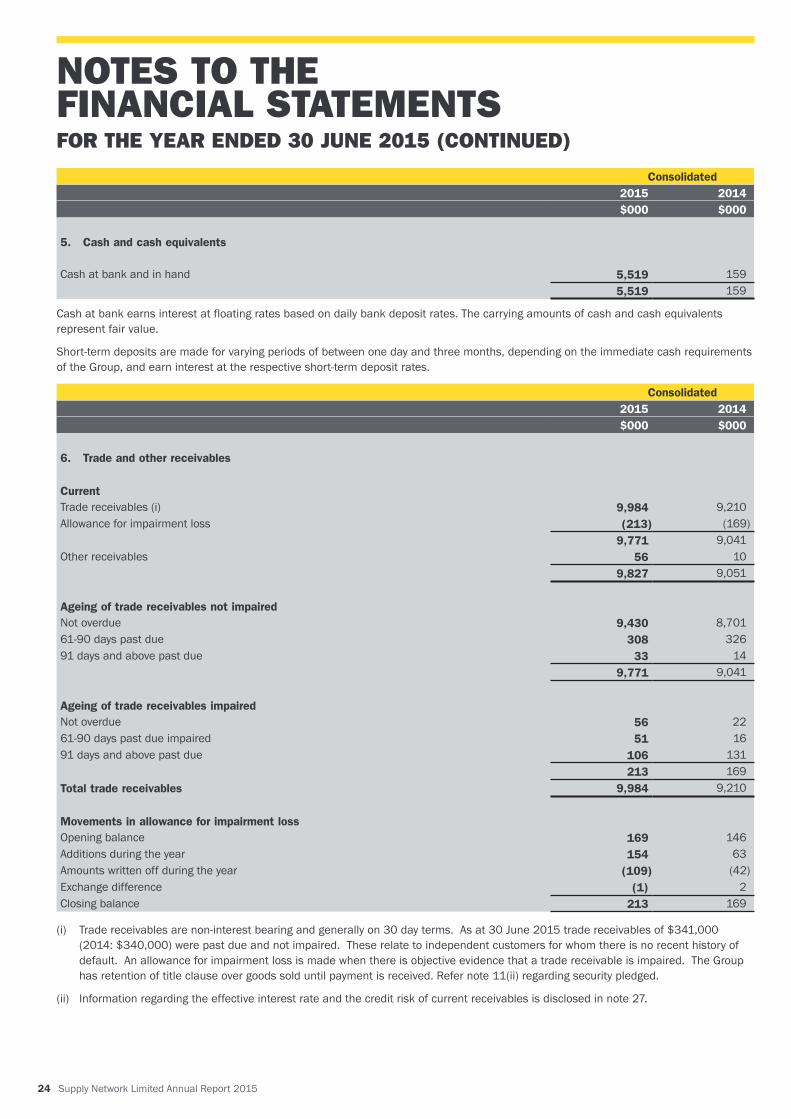
5. Cash and cash equivalents
Cash at bank and in hand 5,519 1595,519 159
Cash at bank earns interest at floating rates based on daily bank deposit rates. The carrying amounts of cash and cash equivalents represent fair value.
Short-term deposits are made for varying periods of between one day and three months, depending on the immediate cash requirements of the Group, and earn interest at the respective short-term deposit rates.
Consolidated2015 2014$000 $000
6. Trade and other receivables
CurrentTrade receivables (i) 9,984 9,210Allowance for impairment loss (213) (169)
9,771 9,041Other receivables 56 10
9,827 9,051
Ageing of trade receivables not impairedNot overdue 9,430 8,70161-90 days past due 308 32691 days and above past due 33 14
9,771 9,041
Ageing of trade receivables impairedNot overdue 56 2261-90 days past due impaired 51 1691 days and above past due 106 131
213 169Total trade receivables 9,984 9,210
Movements in allowance for impairment lossOpening balance 169 146Additions during the year 154 63Amounts written off during the year (109) (42)Exchange difference (1) 2Closing balance 213 169
(i) Trade receivables are non-interest bearing and generally on 30 day terms. As at 30 June 2015 trade receivables of $341,000 (2014: $340,000) were past due and not impaired. These relate to independent customers for whom there is no recent history of default. An allowance for impairment loss is made when there is objective evidence that a trade receivable is impaired. The Group has retention of title clause over goods sold until payment is received. Refer note 11(ii) regarding security pledged.
(ii) Information regarding the effective interest rate and the credit risk of current receivables is disclosed in note 27.
NOTES TO THE FINANCIAL STATEMENTSFOR THE YEAR ENDED 30 JUNE 2015 (CONTINUED)
Supply Network Limited Annual Report 2015 25
Consolidated2015 2014$000 $000
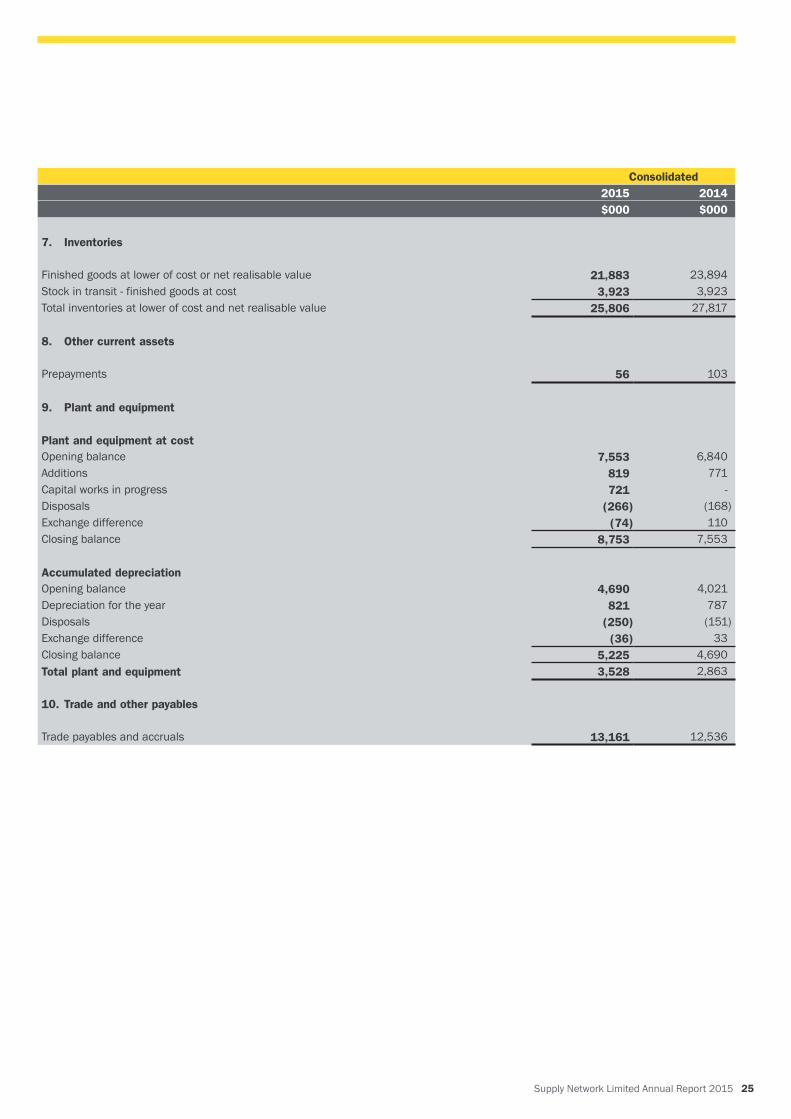
7. Inventories
Finished goods at lower of cost or net realisable value 21,883 23,894Stock in transit - finished goods at cost 3,923 3,923Total inventories at lower of cost and net realisable value 25,806 27,817
8. Other current assets
Prepayments 56 103
9. Plant and equipment
Plant and equipment at costOpening balance 7,553 6,840Additions 819 771Capital works in progress 721 -Disposals (266) (168)Exchange difference (74) 110Closing balance 8,753 7,553
Accumulated depreciationOpening balance 4,690 4,021Depreciation for the year 821 787Disposals (250) (151)Exchange difference (36) 33Closing balance 5,225 4,690Total plant and equipment 3,528 2,863
10. Trade and other payables
Trade payables and accruals 13,161 12,536
26 Supply Network Limited Annual Report 2015
Consolidated2015 2014$000 $000
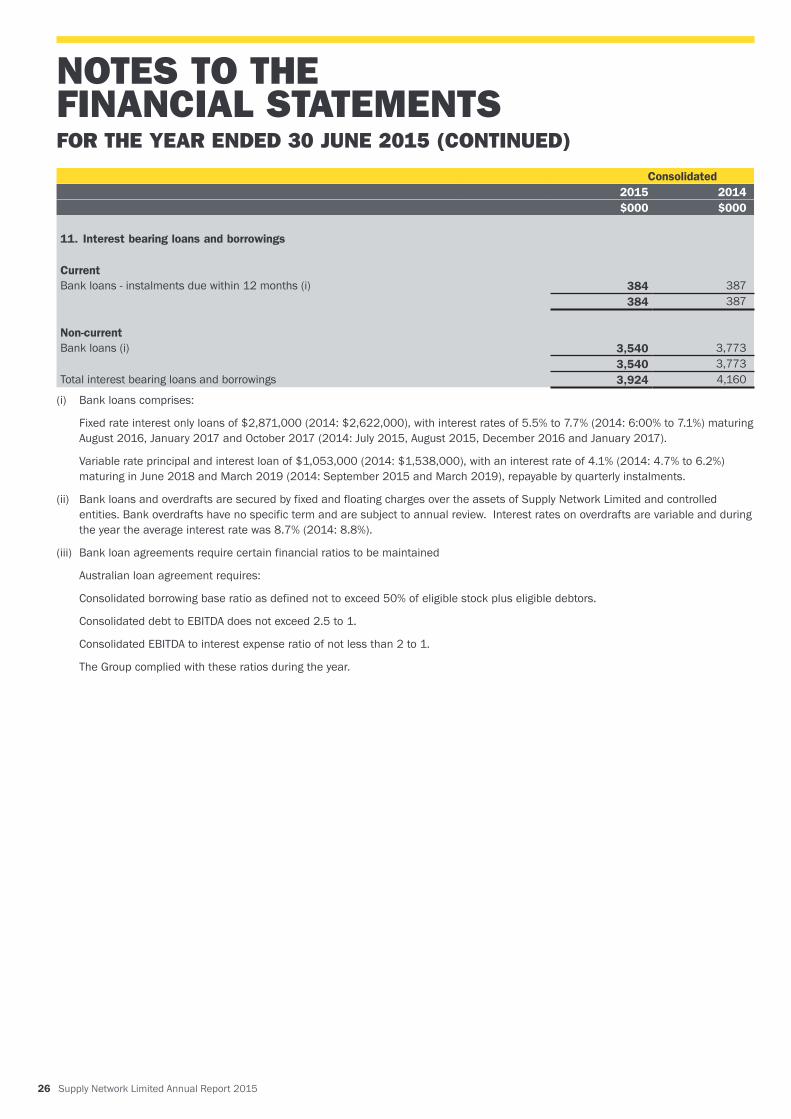
11. Interest bearing loans and borrowings
Current Bank loans - instalments due within 12 months (i) 384 387
384 387
Non-currentBank loans (i) 3,540 3,773
3,540 3,773Total interest bearing loans and borrowings 3,924 4,160
(i) Bank loans comprises:
Fixed rate interest only loans of $2,871,000 (2014: $2,622,000), with interest rates of 5.5% to 7.7% (2014: 6:00% to 7.1%) maturing August 2016, January 2017 and October 2017 (2014: July 2015, August 2015, December 2016 and January 2017).
Variable rate principal and interest loan of $1,053,000 (2014: $1,538,000), with an interest rate of 4.1% (2014: 4.7% to 6.2%) maturing in June 2018 and March 2019 (2014: September 2015 and March 2019), repayable by quarterly instalments.
(ii) Bank loans and overdrafts are secured by fixed and floating charges over the assets of Supply Network Limited and controlled entities. Bank overdrafts have no specific term and are subject to annual review. Interest rates on overdrafts are variable and during the year the average interest rate was 8.7% (2014: 8.8%).
(iii) Bank loan agreements require certain financial ratios to be maintained
Australian loan agreement requires:
Consolidated borrowing base ratio as defined not to exceed 50% of eligible stock plus eligible debtors.
Consolidated debt to EBITDA does not exceed 2.5 to 1.
Consolidated EBITDA to interest expense ratio of not less than 2 to 1.
The Group complied with these ratios during the year.
NOTES TO THE FINANCIAL STATEMENTSFOR THE YEAR ENDED 30 JUNE 2015 (CONTINUED)
Supply Network Limited Annual Report 2015 27
Consolidated2015 2014$000 $000
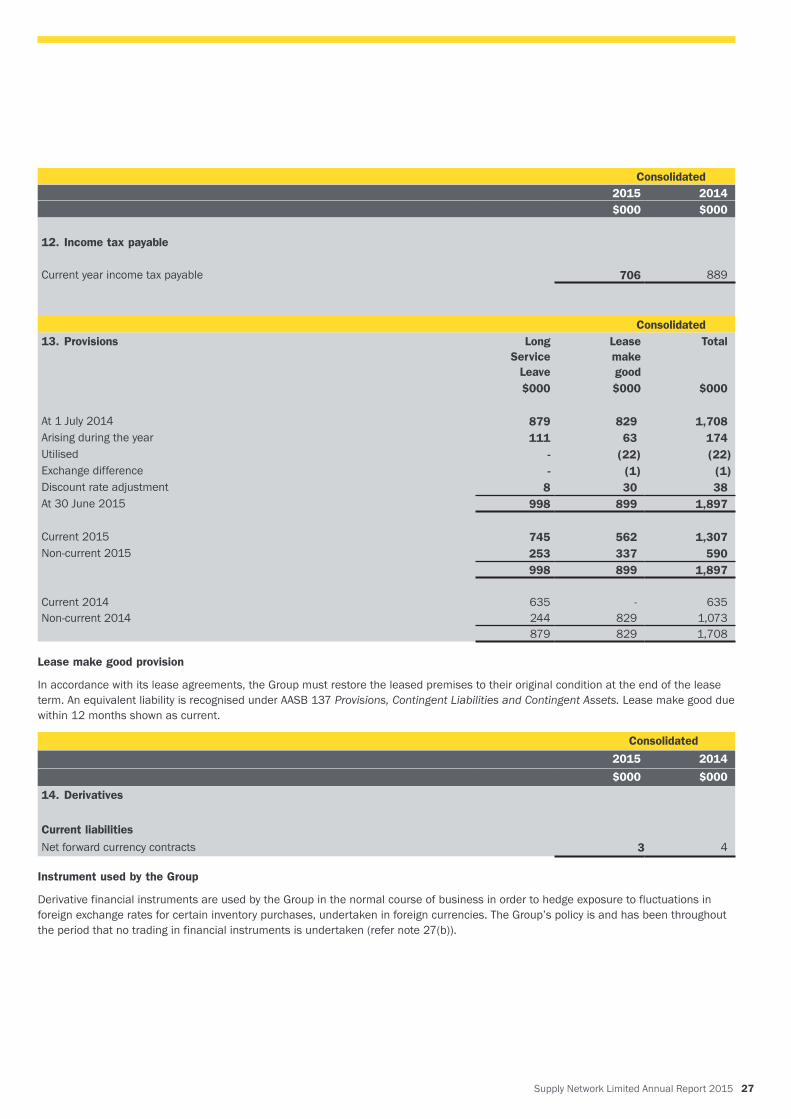
12. Income tax payable
Current year income tax payable 706 889
Consolidated13. Provisions Long
Service Leave
Lease make good
Total
$000 $000 $000
At 1 July 2014 879 829 1,708Arising during the year 111 63 174Utilised - (22) (22)Exchange difference - (1) (1)Discount rate adjustment 8 30 38At 30 June 2015 998 899 1,897
Current 2015 745 562 1,307Non-current 2015 253 337 590
998 899 1,897
Current 2014 635 - 635Non-current 2014 244 829 1,073
879 829 1,708
Lease make good provision
In accordance with its lease agreements, the Group must restore the leased premises to their original condition at the end of the lease term. An equivalent liability is recognised under AASB 137 Provisions, Contingent Liabilities and Contingent Assets. Lease make good due within 12 months shown as current.
Consolidated
2015 2014
$000 $000
14. Derivatives
Current liabilitiesNet forward currency contracts 3 4
Instrument used by the Group
Derivative financial instruments are used by the Group in the normal course of business in order to hedge exposure to fluctuations in foreign exchange rates for certain inventory purchases, undertaken in foreign currencies. The Group’s policy is and has been throughout the period that no trading in financial instruments is undertaken (refer note 27(b)).
28 Supply Network Limited Annual Report 2015
Consolidated2015 2014$000 $000
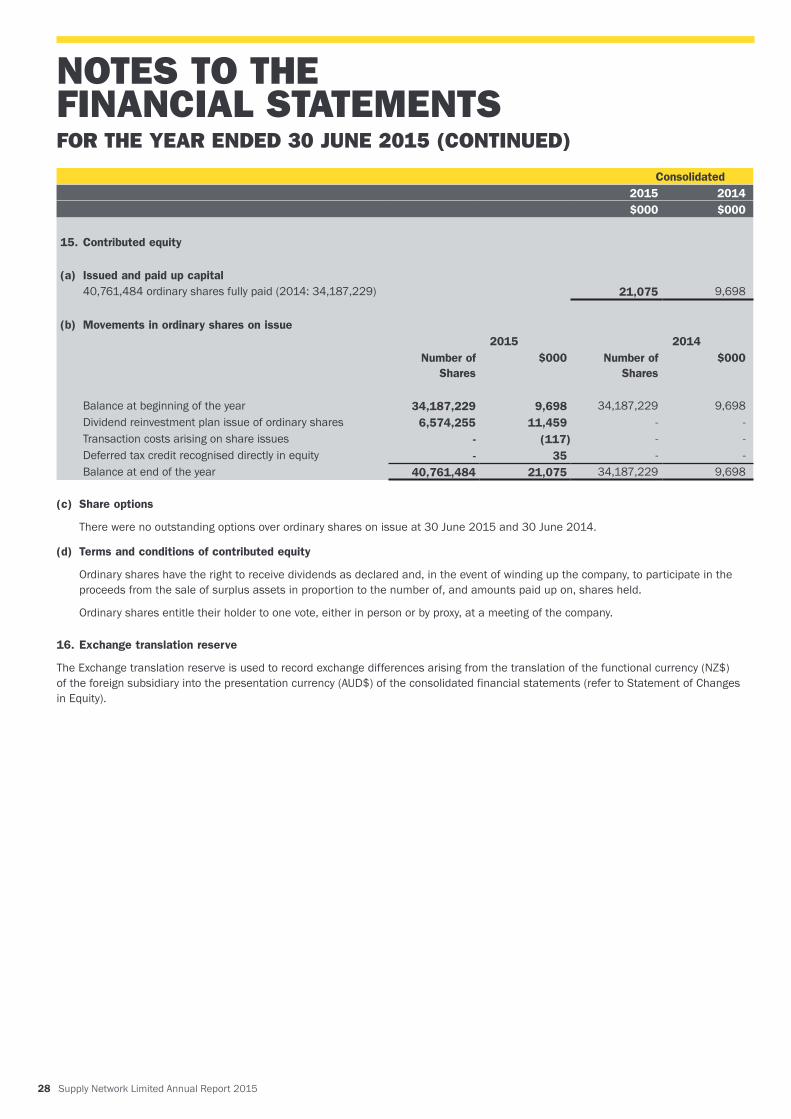
15. Contributed equity
(a) Issued and paid up capital40,761,484 ordinary shares fully paid (2014: 34,187,229) 21,075 9,698
(b) Movements in ordinary shares on issue2015 2014
Number of Shares
$000 Number of Shares
$000
Balance at beginning of the year 34,187,229 9,698 34,187,229 9,698Dividend reinvestment plan issue of ordinary shares 6,574,255 11,459 - -Transaction costs arising on share issues - (117) - -Deferred tax credit recognised directly in equity - 35 - -Balance at end of the year 40,761,484 21,075 34,187,229 9,698
(c) Share options
There were no outstanding options over ordinary shares on issue at 30 June 2015 and 30 June 2014.
(d) Terms and conditions of contributed equity
Ordinary shares have the right to receive dividends as declared and, in the event of winding up the company, to participate in the proceeds from the sale of surplus assets in proportion to the number of, and amounts paid up on, shares held.
Ordinary shares entitle their holder to one vote, either in person or by proxy, at a meeting of the company.
16. Exchange translation reserve
The Exchange translation reserve is used to record exchange differences arising from the translation of the functional currency (NZ$) of the foreign subsidiary into the presentation currency (AUD$) of the consolidated financial statements (refer to Statement of Changes in Equity).
NOTES TO THE FINANCIAL STATEMENTSFOR THE YEAR ENDED 30 JUNE 2015 (CONTINUED)
Supply Network Limited Annual Report 2015 29
Consolidated2015 2014$000 $000
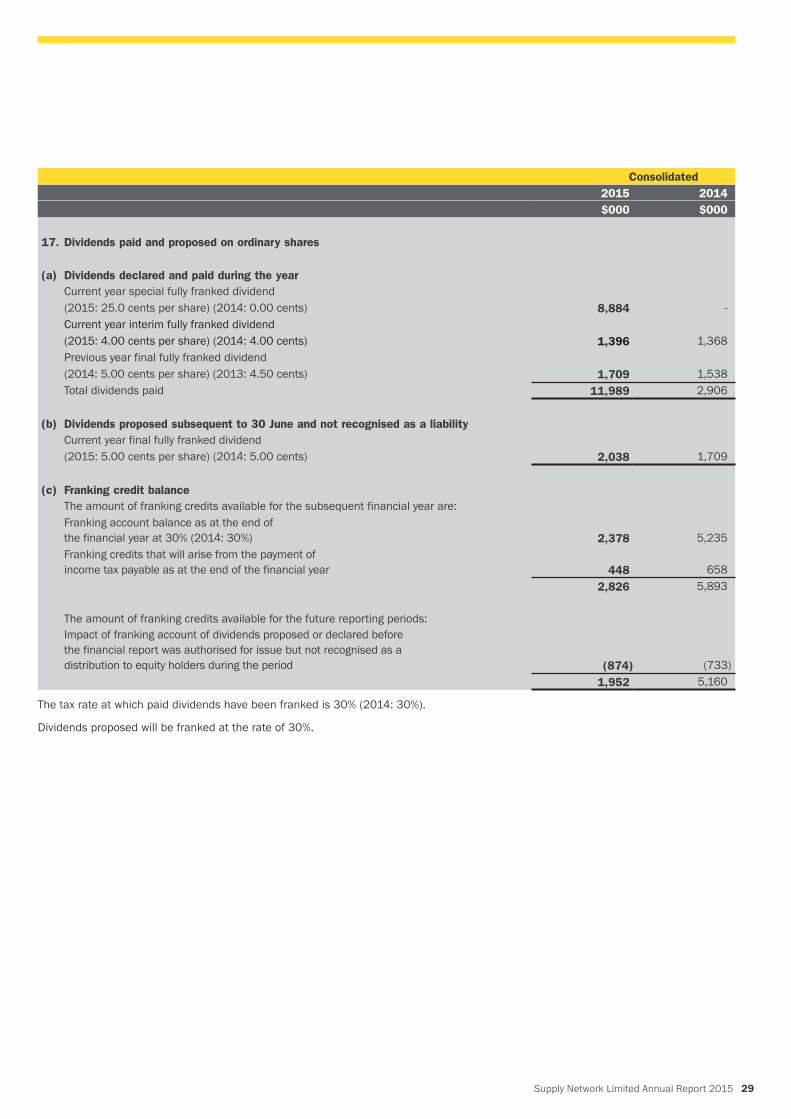
17. Dividends paid and proposed on ordinary shares
(a) Dividends declared and paid during the yearCurrent year special fully franked dividend(2015: 25.0 cents per share) (2014: 0.00 cents) 8,884 -Current year interim fully franked dividend (2015: 4.00 cents per share) (2014: 4.00 cents) 1,396 1,368Previous year final fully franked dividend (2014: 5.00 cents per share) (2013: 4.50 cents) 1,709 1,538Total dividends paid 11,989 2,906
(b) Dividends proposed subsequent to 30 June and not recognised as a liabilityCurrent year final fully franked dividend(2015: 5.00 cents per share) (2014: 5.00 cents) 2,038 1,709
(c) Franking credit balanceThe amount of franking credits available for the subsequent financial year are:Franking account balance as at the end of the financial year at 30% (2014: 30%)
2,378
5,235
Franking credits that will arise from the payment of income tax payable as at the end of the financial year
448
658
2,826 5,893
The amount of franking credits available for the future reporting periods:Impact of franking account of dividends proposed or declared before the financial report was authorised for issue but not recognised as a distribution to equity holders during the period
(874)
(733)1,952 5,160
The tax rate at which paid dividends have been franked is 30% (2014: 30%).
Dividends proposed will be franked at the rate of 30%.
30 Supply Network Limited Annual Report 2015
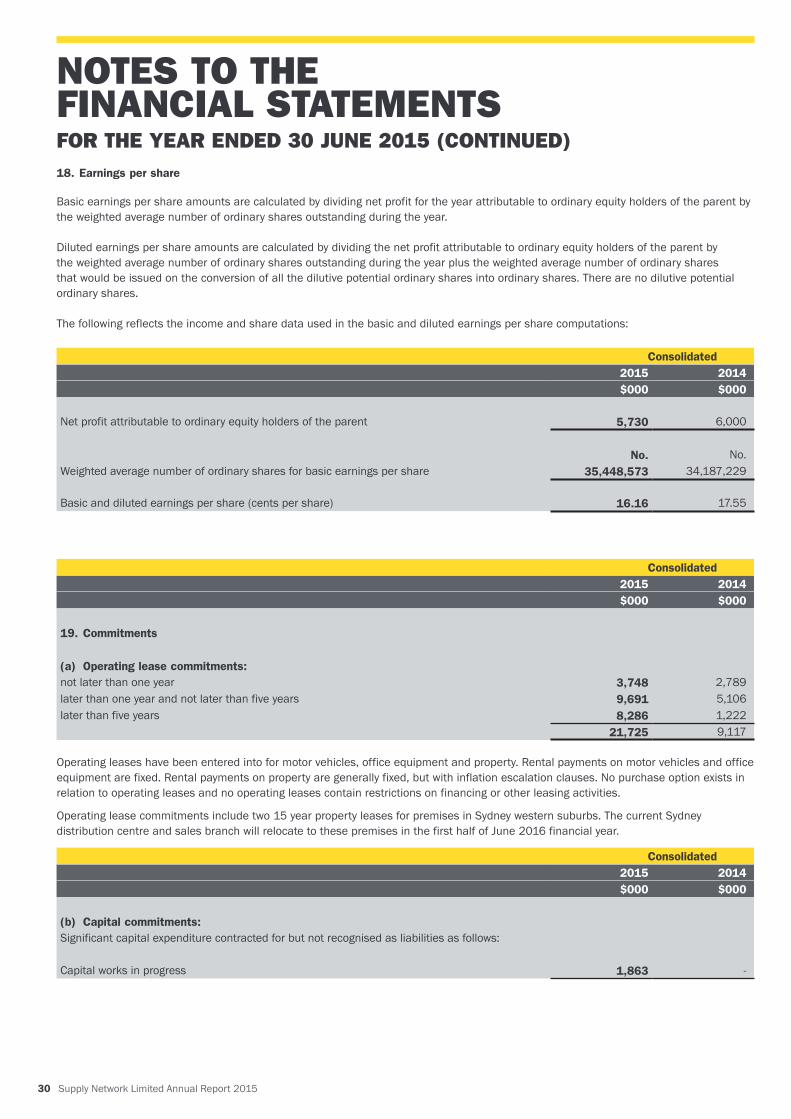
18. Earnings per share
Basic earnings per share amounts are calculated by dividing net profit for the year attributable to ordinary equity holders of the parent by the weighted average number of ordinary shares outstanding during the year.
Diluted earnings per share amounts are calculated by dividing the net profit attributable to ordinary equity holders of the parent by the weighted average number of ordinary shares outstanding during the year plus the weighted average number of ordinary shares that would be issued on the conversion of all the dilutive potential ordinary shares into ordinary shares. There are no dilutive potential ordinary shares.
The following reflects the income and share data used in the basic and diluted earnings per share computations:
Consolidated2015 2014$000 $000
Net profit attributable to ordinary equity holders of the parent 5,730 6,000
No. No.Weighted average number of ordinary shares for basic earnings per share 35,448,573 34,187,229 Basic and diluted earnings per share (cents per share)
16.16
17.55
Consolidated2015 2014$000 $000
19. Commitments
(a) Operating lease commitments:not later than one year 3,748 2,789later than one year and not later than five years 9,691 5,106later than five years 8,286 1,222
21,725 9,117
Operating leases have been entered into for motor vehicles, office equipment and property. Rental payments on motor vehicles and office equipment are fixed. Rental payments on property are generally fixed, but with inflation escalation clauses. No purchase option exists in relation to operating leases and no operating leases contain restrictions on financing or other leasing activities.
Operating lease commitments include two 15 year property leases for premises in Sydney western suburbs. The current Sydney distribution centre and sales branch will relocate to these premises in the first half of June 2016 financial year.
Consolidated2015 2014$000 $000
(b) Capital commitments:Significant capital expenditure contracted for but not recognised as liabilities as follows:
Capital works in progress 1,863 -
NOTES TO THE FINANCIAL STATEMENTSFOR THE YEAR ENDED 30 JUNE 2015 (CONTINUED)

Supply Network Limited Annual Report 2015 31
Consolidated2015 2014
$ $
20. Auditor’s compensation
Amounts received or due and receivable by HLB Mann Judd (NSW Partnership) for:An audit and review of a financial report of the consolidated group 66,200 64,900Review of remuneration contracts - 1,500
Amounts received or due and receivable by HLB Mann Judd Limited Auckland for:An audit of the financial report of a subsidiary 16,550 15,800
82,750 82,200
21. Key management personnel
(a) Compensation of key management personnel
Details of key management personnel are as follows:
Directors
G J Forsyth Chairman (non-executive) P W McKenzie Director (non-executive) G D H Stewart Managing Director (executive)P W Gill Finance Director and Company Secretary (executive)
The remuneration paid or payable to key management personnel of the Group was as follows:
Consolidated2015 2014
$ $Short-term 930,260 915,782Post-employment 82,695 61,688Other long term benefits 22,267 20,383
1,035,222 997,853
(b) Shares issued on exercise of compensation options
There were no shares issued as compensation or on exercise of compensation options during the years ended 30 June 2015 and 30 June 2014.
(c) Option holdings of key management personnel
There were no options held by key management personnel at 30 June 2015 or 30 June 2014.
32 Supply Network Limited Annual Report 2015
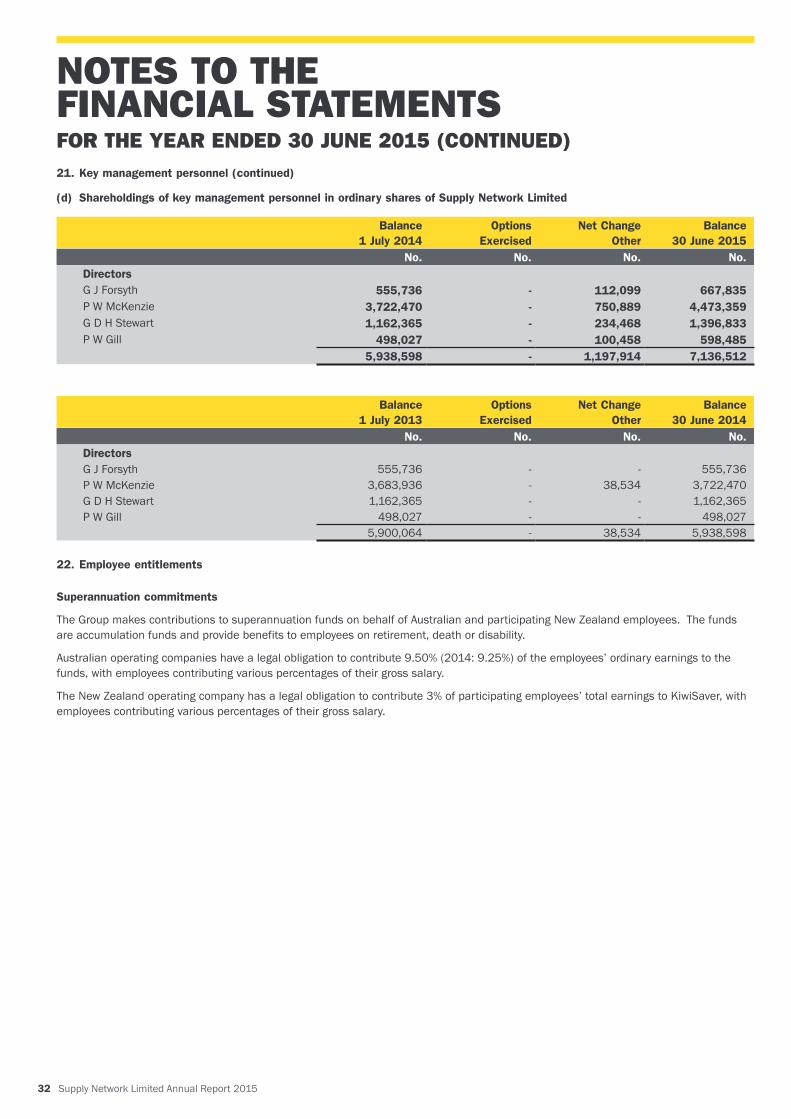
21. Key management personnel (continued)
(d) Shareholdings of key management personnel in ordinary shares of Supply Network Limited
Balance 1 July 2014
Options Exercised
Net Change Other
Balance 30 June 2015
No. No. No. No.DirectorsG J Forsyth 555,736 - 112,099 667,835P W McKenzie 3,722,470 - 750,889 4,473,359G D H Stewart 1,162,365 - 234,468 1,396,833P W Gill 498,027 - 100,458 598,485
5,938,598 - 1,197,914 7,136,512
Balance 1 July 2013
Options Exercised
Net Change Other
Balance 30 June 2014
No. No. No. No.DirectorsG J Forsyth 555,736 - - 555,736P W McKenzie 3,683,936 - 38,534 3,722,470G D H Stewart 1,162,365 - - 1,162,365P W Gill 498,027 - - 498,027
5,900,064 - 38,534 5,938,598
22. Employee entitlements
Superannuation commitments
The Group makes contributions to superannuation funds on behalf of Australian and participating New Zealand employees. The funds are accumulation funds and provide benefits to employees on retirement, death or disability.
Australian operating companies have a legal obligation to contribute 9.50% (2014: 9.25%) of the employees’ ordinary earnings to the funds, with employees contributing various percentages of their gross salary.
The New Zealand operating company has a legal obligation to contribute 3% of participating employees’ total earnings to KiwiSaver, with employees contributing various percentages of their gross salary.
NOTES TO THE FINANCIAL STATEMENTSFOR THE YEAR ENDED 30 JUNE 2015 (CONTINUED)
Supply Network Limited Annual Report 2015 33
Consolidated2015 2014$000 $000
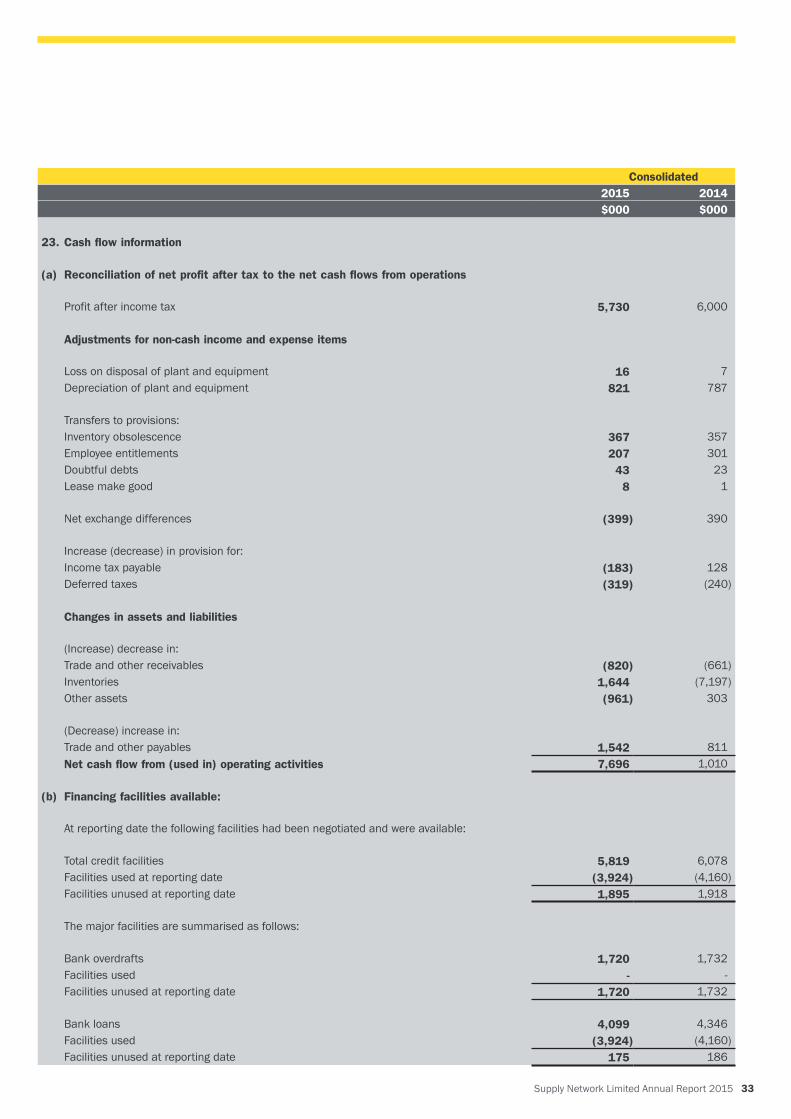
23. Cash flow information
(a) Reconciliation of net profit after tax to the net cash flows from operations
Profit after income tax 5,730 6,000
Adjustments for non-cash income and expense items
Loss on disposal of plant and equipment 16 7Depreciation of plant and equipment 821 787
Transfers to provisions:Inventory obsolescence 367 357Employee entitlements 207 301Doubtful debts 43 23Lease make good 8 1
Net exchange differences (399) 390
Increase (decrease) in provision for:Income tax payable (183) 128Deferred taxes (319) (240)
Changes in assets and liabilities
(Increase) decrease in:Trade and other receivables (820) (661)Inventories 1,644 (7,197)Other assets (961) 303
(Decrease) increase in:Trade and other payables 1,542 811Net cash flow from (used in) operating activities 7,696 1,010
(b) Financing facilities available:
At reporting date the following facilities had been negotiated and were available:
Total credit facilities 5,819 6,078Facilities used at reporting date (3,924) (4,160)Facilities unused at reporting date 1,895 1,918
The major facilities are summarised as follows:
Bank overdrafts 1,720 1,732Facilities used - -Facilities unused at reporting date 1,720 1,732
Bank loans 4,099 4,346Facilities used (3,924) (4,160)Facilities unused at reporting date 175 186
34 Supply Network Limited Annual Report 2015
NOTES TO THE FINANCIAL STATEMENTSFOR THE YEAR ENDED 30 JUNE 2015 (CONTINUED)
2015 2014$000 $000
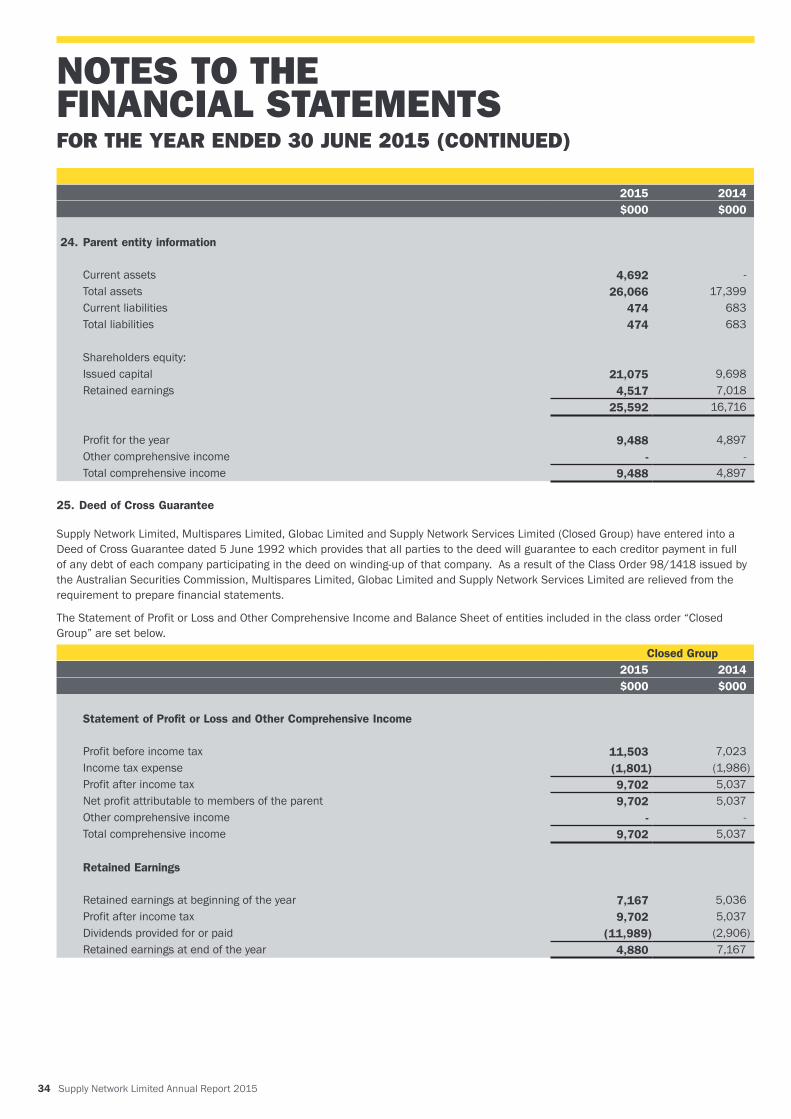
24. Parent entity information
Current assets 4,692 -Total assets 26,066 17,399Current liabilities 474 683Total liabilities 474 683
Shareholders equity:Issued capital 21,075 9,698Retained earnings 4,517 7,018
25,592 16,716
Profit for the year 9,488 4,897Other comprehensive income - -Total comprehensive income 9,488 4,897
25. Deed of Cross Guarantee
Supply Network Limited, Multispares Limited, Globac Limited and Supply Network Services Limited (Closed Group) have entered into a Deed of Cross Guarantee dated 5 June 1992 which provides that all parties to the deed will guarantee to each creditor payment in full of any debt of each company participating in the deed on winding-up of that company. As a result of the Class Order 98/1418 issued by the Australian Securities Commission, Multispares Limited, Globac Limited and Supply Network Services Limited are relieved from the requirement to prepare financial statements.
The Statement of Profit or Loss and Other Comprehensive Income and Balance Sheet of entities included in the class order “Closed Group” are set below.
Closed Group2015 2014$000 $000
Statement of Profit or Loss and Other Comprehensive Income
Profit before income tax 11,503 7,023Income tax expense (1,801) (1,986)Profit after income tax 9,702 5,037Net profit attributable to members of the parent 9,702 5,037Other comprehensive income - -Total comprehensive income 9,702 5,037
Retained Earnings
Retained earnings at beginning of the year 7,167 5,036Profit after income tax 9,702 5,037Dividends provided for or paid (11,989) (2,906)Retained earnings at end of the year 4,880 7,167
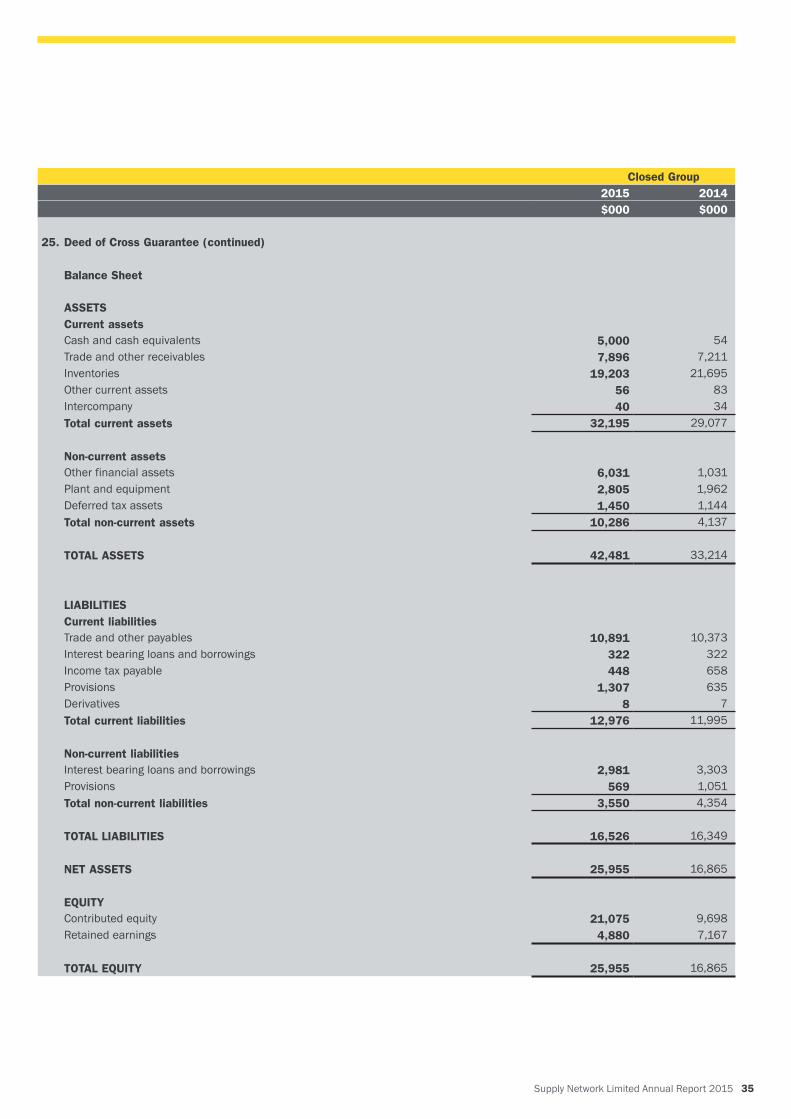
Supply Network Limited Annual Report 2015 35
Closed Group2015 2014$000 $000
25. Deed of Cross Guarantee (continued)
Balance Sheet
ASSETSCurrent assetsCash and cash equivalents 5,000 54Trade and other receivables 7,896 7,211Inventories 19,203 21,695Other current assets 56 83Intercompany 40 34Total current assets 32,195 29,077
Non-current assetsOther financial assets 6,031 1,031Plant and equipment 2,805 1,962Deferred tax assets 1,450 1,144Total non-current assets 10,286 4,137
TOTAL ASSETS 42,481 33,214
LIABILITIESCurrent liabilities Trade and other payables 10,891 10,373Interest bearing loans and borrowings 322 322Income tax payable 448 658Provisions 1,307 635Derivatives 8 7Total current liabilities 12,976 11,995
Non-current liabilities Interest bearing loans and borrowings 2,981 3,303Provisions 569 1,051Total non-current liabilities 3,550 4,354
TOTAL LIABILITIES 16,526 16,349
NET ASSETS 25,955 16,865
EQUITYContributed equity 21,075 9,698Retained earnings 4,880 7,167
TOTAL EQUITY 25,955 16,865
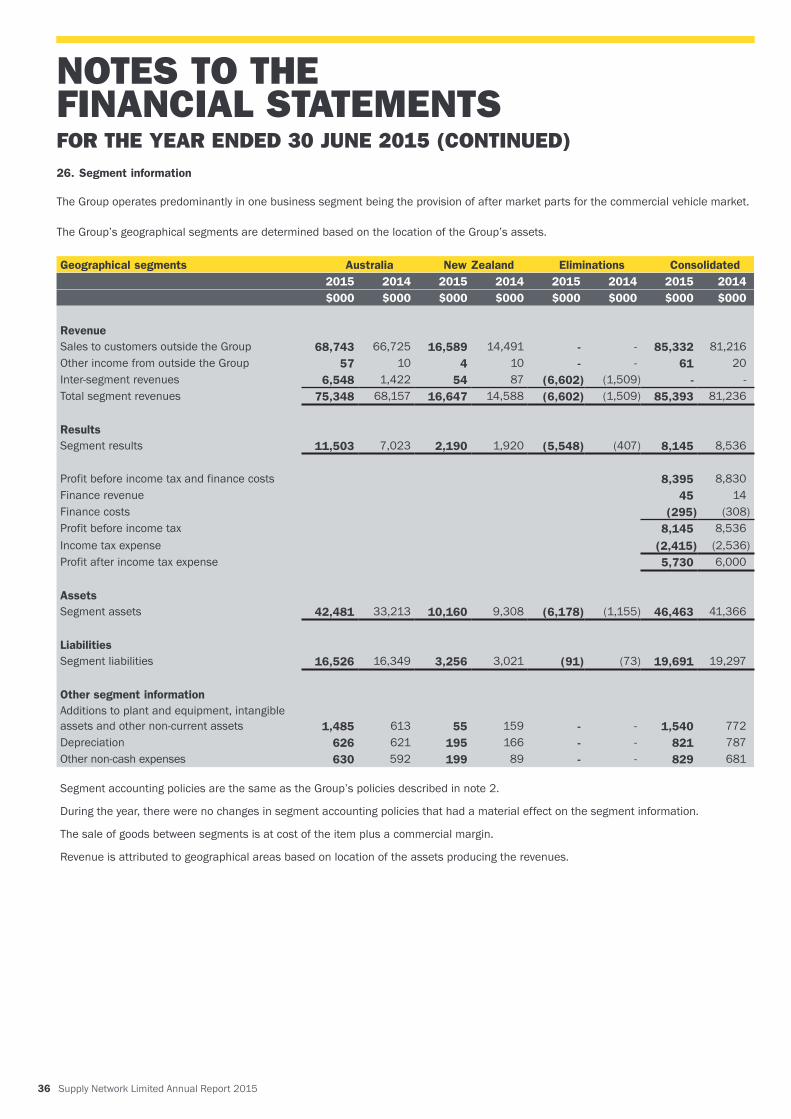
36 Supply Network Limited Annual Report 2015
26. Segment information
The Group operates predominantly in one business segment being the provision of after market parts for the commercial vehicle market.
The Group’s geographical segments are determined based on the location of the Group’s assets.
Geographical segments Australia New Zealand Eliminations Consolidated2015 2014 2015 2014 2015 2014 2015 2014$000 $000 $000 $000 $000 $000 $000 $000
RevenueSales to customers outside the Group 68,743 66,725 16,589 14,491 - - 85,332 81,216Other income from outside the Group 57 10 4 10 - - 61 20Inter-segment revenues 6,548 1,422 54 87 (6,602) (1,509) - -Total segment revenues 75,348 68,157 16,647 14,588 (6,602) (1,509) 85,393 81,236
ResultsSegment results 11,503 7,023 2,190 1,920 (5,548) (407) 8,145 8,536
Profit before income tax and finance costs 8,395 8,830Finance revenue 45 14Finance costs (295) (308)Profit before income tax 8,145 8,536Income tax expense (2,415) (2,536)Profit after income tax expense 5,730 6,000
AssetsSegment assets 42,481 33,213 10,160 9,308 (6,178) (1,155) 46,463 41,366
LiabilitiesSegment liabilities 16,526 16,349 3,256 3,021 (91) (73) 19,691 19,297
Other segment informationAdditions to plant and equipment, intangible assets and other non-current assets
1,485
613
55
159
-
-
1,540
772
Depreciation 626 621 195 166 - - 821 787Other non-cash expenses 630 592 199 89 - - 829 681
Segment accounting policies are the same as the Group’s policies described in note 2.
During the year, there were no changes in segment accounting policies that had a material effect on the segment information.
The sale of goods between segments is at cost of the item plus a commercial margin.
Revenue is attributed to geographical areas based on location of the assets producing the revenues.
NOTES TO THE FINANCIAL STATEMENTSFOR THE YEAR ENDED 30 JUNE 2015 (CONTINUED)

Supply Network Limited Annual Report 2015 37
27. Key economic risks
Financial risk management
The Group’s principal financial instruments, other than derivatives, comprise cash, bank loans and bank overdrafts. The main purpose of these financial instruments is to finance the Group’s operations.
The Group has various other financial assets and liabilities such as trade receivables and trade payables, which arise directly from its operations. The Group also enters into derivative transactions, principally forward currency contracts, the purpose of which is to manage the currency risk arising from the Group’s operations. It is, and has been throughout the period under review, the Group’s policy that no trading in financial instruments shall be undertaken. The main risks arising from the Group’s operations are interest rate risk, foreign currency risk, credit risk and liquidity risk. The Group also has to manage its capital. The Board reviews and agrees policies for managing each of these risks and they are summarised below.
(a) Interest rate risk
The Group is exposed to interest rate risk through financial assets and liabilities. The Group’s main interest rate risk arises from long-term borrowings (refer note 11).
The following table summarises interest rate risk for the Group together with effective interest rates as at balance date.
Financial instruments - Contractual Maturities
Floating interest rate (i)
Fixed interest rate maturing Non-interest bearing
Total Weighted average interest rate1 year or
less1 to 5 years
Over 5 years Floating Fixed
$000 $000 $000 $000 $000 $000 % %Consolidated30 June 2015Financial assetsCash 5,519 - - - - 5,519 2.3 -Trade receivables - - - - 9,984 9,984 - -Forward currency contracts - - - - 1,698 1,698 - -Other receivables - - - - 56 56 - -
5,519 - - - 11,738 17,257
Financial liabilitiesTrade and other payables - - - - 13,161 13,161 - -Bank loans and overdrafts 1,053 384 2,487 - - 3,924 5.3 6.5Forward currency contracts - - - - 1,701 1,701 - -
1,053 384 2,487 - 14,862 18,786
Consolidated30 June 2014Financial assetsCash 159 - - - - 159 - -Receivables - - - - 9,210 9,210 - -Forward currency contracts - - - - 691 691 - -Other debtors - - - - 10 10 - -
159 - - - 9,911 10,070
Financial liabilitiesPayables - - - - 12,536 12,536 - -Bank loans and overdrafts 1,375 387 2,398 - - 4,160 5.2 6.6Forward currency contracts - - - - 695 695 - -
1,375 387 2,398 - 13,231 17,391
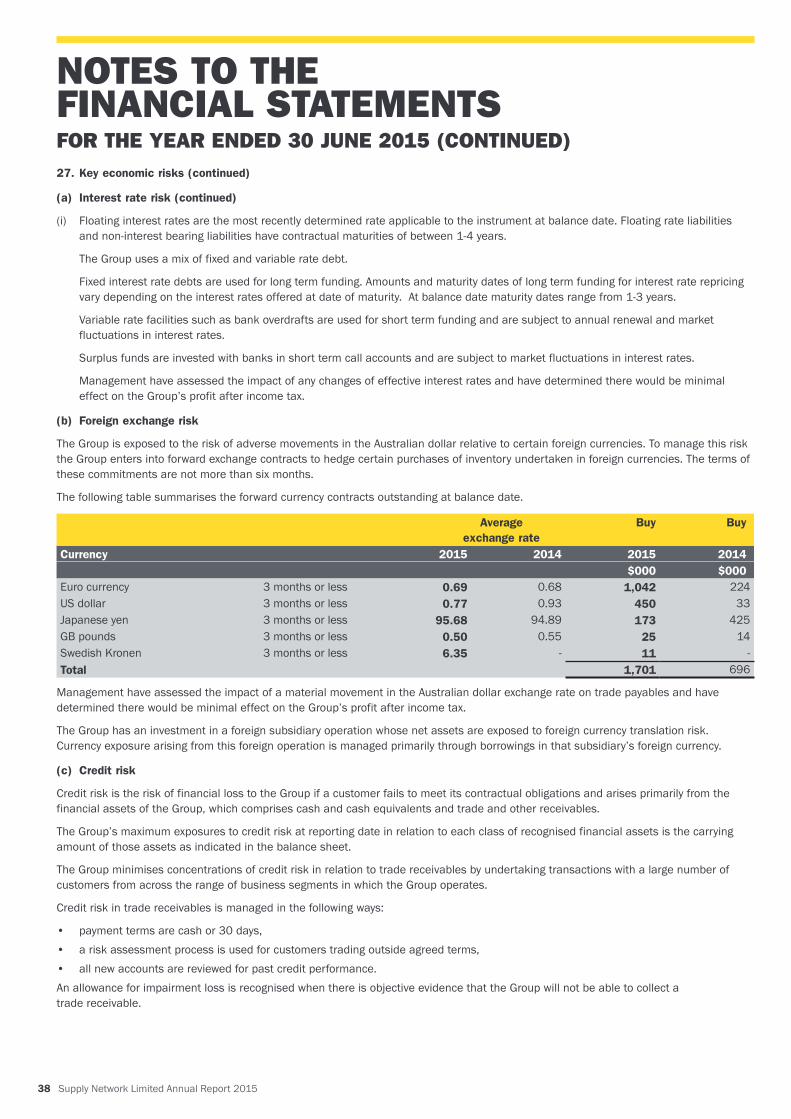
38 Supply Network Limited Annual Report 2015
NOTES TO THE FINANCIAL STATEMENTSFOR THE YEAR ENDED 30 JUNE 2015 (CONTINUED)27. Key economic risks (continued)
(a) Interest rate risk (continued)
(i) Floating interest rates are the most recently determined rate applicable to the instrument at balance date. Floating rate liabilities and non-interest bearing liabilities have contractual maturities of between 1-4 years.
The Group uses a mix of fixed and variable rate debt.
Fixed interest rate debts are used for long term funding. Amounts and maturity dates of long term funding for interest rate repricing vary depending on the interest rates offered at date of maturity. At balance date maturity dates range from 1-3 years.
Variable rate facilities such as bank overdrafts are used for short term funding and are subject to annual renewal and market fluctuations in interest rates.
Surplus funds are invested with banks in short term call accounts and are subject to market fluctuations in interest rates.
Management have assessed the impact of any changes of effective interest rates and have determined there would be minimal effect on the Group’s profit after income tax.
(b) Foreign exchange risk
The Group is exposed to the risk of adverse movements in the Australian dollar relative to certain foreign currencies. To manage this risk the Group enters into forward exchange contracts to hedge certain purchases of inventory undertaken in foreign currencies. The terms of these commitments are not more than six months.
The following table summarises the forward currency contracts outstanding at balance date.
Average exchange rate
Buy Buy
Currency 2015 2014 2015 2014$000 $000
Euro currency 3 months or less 0.69 0.68 1,042 224US dollar 3 months or less 0.77 0.93 450 33Japanese yen 3 months or less 95.68 94.89 173 425GB pounds 3 months or less 0.50 0.55 25 14Swedish Kronen 3 months or less 6.35 - 11 -Total 1,701 696
Management have assessed the impact of a material movement in the Australian dollar exchange rate on trade payables and have determined there would be minimal effect on the Group’s profit after income tax.
The Group has an investment in a foreign subsidiary operation whose net assets are exposed to foreign currency translation risk. Currency exposure arising from this foreign operation is managed primarily through borrowings in that subsidiary’s foreign currency.
(c) Credit risk
Credit risk is the risk of financial loss to the Group if a customer fails to meet its contractual obligations and arises primarily from the financial assets of the Group, which comprises cash and cash equivalents and trade and other receivables.
The Group’s maximum exposures to credit risk at reporting date in relation to each class of recognised financial assets is the carrying amount of those assets as indicated in the balance sheet.
The Group minimises concentrations of credit risk in relation to trade receivables by undertaking transactions with a large number of customers from across the range of business segments in which the Group operates.
Credit risk in trade receivables is managed in the following ways:
• payment terms are cash or 30 days,• a risk assessment process is used for customers trading outside agreed terms,• all new accounts are reviewed for past credit performance.An allowance for impairment loss is recognised when there is objective evidence that the Group will not be able to collect a trade receivable.

Supply Network Limited Annual Report 2015 39
27. Key economic risks (continued)
(d) Liquidity risk
Liquidity risk is the risk that the Group will not be able to meet its financial obligations as and when they fall due. Liquidity is managed to ensure, as far as possible, that sufficient funds are available to meet liabilities when they fall due without incurring unacceptable losses or risking damage to the Group’s reputation.
The Group manages liquidity risk by maintaining adequate banking facilities and borrowing facilities by continuously monitoring forecasts and actual cash flows and matching maturity profiles of financial assets and liabilities. See note 23(b) for additional undrawn facilities to the Group has available to further reduce liquidity risk.
(e) Capital risk management
The Group manages its capital to ensure that entities in the Group will be able to continue as a going concern while maximising the return to stakeholders through the optimisation of the debt and equity balance.
The capital structure of the Group consists of debt, which comprises the borrowings detailed in note 11, cash and cash equivalents and equity attributable to equity holders of the parent, comprising issued capital (note 15), reserves (note 16) and retained earnings.
The Board reviews the capital structure on a regular basis. As part of this review the cost of capital and the risks associated with each class of capital is considered. The Group balances its overall capital structure through the payment of dividends, operation of dividend reinvestment plan, new share issues, share buy-backs and additional borrowings.
Consolidated2015 2014$000 $000
28. Related party transactions
(a) Transactions between related parties are on normal commercial terms and conditions no more favourable than those available to other parties unless otherwise stated.
Transactions with related parties:Key management personnel of the groupSales to related parties 301 270Amounts owed by related parties 73 46
(b) Mr P W McKenzie is Chief Executive officer of a family owned bus business that the group sells goods to on normal commercial terms and conditions.
(c) The names of each person holding the position of Director of Supply Network Limited during the last two financial years were G J Forsyth, P W McKenzie, G D H Stewart and P W Gill.
(d) Investments in controlled entities
Country of Incorporation
Multispares N.Z. Limited New ZealandMultispares Limited AustraliaGlobac Limited AustraliaSupply Network Services Ltd Australia
The controlled entities were 100% owned for the years ended 30 June 2015 and 30 June 2014.

40 Supply Network Limited Annual Report 2015
In accordance with a resolution of the directors of Supply Network Limited, I state that:
1. In the directors’ opinion:
(a) the financial statements and notes set out on pages 14 to 39 are in accordance with the Corporations Act 2001, including:
(i) giving a true and fair view of the consolidated entity’s financial position as at 30 June 2015 and of its performance for the financial year ended on that date; and
(ii) complying with Australian Accounting Standards and the Corporations Regulations 2001; and
(b) there are reasonable grounds to believe that the company will be able to pay its debts as and when they become due and payable.
(c) at the date of this declaration, there are reasonable grounds to believe that the members of the closed group identified in note 25 will be able to meet any obligation or liabilities to which they are, or may become, subject by virtue of the deed of cross guarantee described in note 25.
2. The directors have been given the declarations by the chief executive officer and chief financial officer for the year ended 30 June 2015 required by section 295A of the Corporations Act 2001.
3. The notes to the financial statements include a statement of compliance with International Financial Reporting Standards.
This declaration is made in accordance with a resolution of the directors.
On behalf of the Board
G J ForsythDirectorSydney19 August 2015
DIRECTORS’ DECLARATION
Supply Network Limited Annual Report 2015 41
To the members of Supply Network Limited
Report on the Financial Report
We have audited the accompanying financial report of Supply Network Limited (“the company”), which comprises the consolidated balance sheet as at 30 June 2015, the consolidated statement of profit or loss and other comprehensive income, the consolidated statement of changes in equity and the consolidated statement of cash flows for the year then ended, notes comprising a summary of significant accounting policies and other explanatory information, and the directors’ declaration, for the consolidated entity. The consolidated entity comprises the company and the entities it controlled at the year’s end or from time to time during the financial year.
Directors’ Responsibility for the Financial Report
The directors of the company are responsible for the preparation of the financial report that gives a true and fair view in accordance with Australian Accounting Standards and the Corporations Act 2001 and for such internal control as the directors determine is necessary to enable the preparation of the financial report that gives a true and fair view and is free from material misstatement, whether due to fraud or error.
In Note 2(b), the directors also state, in accordance with Accounting Standard AASB 101: Presentation of Financial Statements, that the consolidated financial statements comply with International Financial Reporting Standards.
Auditor’s Responsibility
Our responsibility is to express an opinion on the financial report based on our audit. We conducted our audit in accordance with Australian Auditing Standards. Those standards require that we comply with relevant ethical requirements relating to audit engagements and plan and perform the audit to obtain reasonable assurance about whether the financial report is free from material misstatement.
An audit involves performing procedures to obtain audit evidence about the amounts and disclosures in the financial report. The procedures selected depend on the auditor’s judgement, including the assessment of the risks of material misstatement of the financial report, whether due to fraud or error. In making those risk assessments, the auditor considers internal control relevant to the company’s preparation of the financial report that gives a true and fair view in order to design audit procedures that are appropriate in the circumstances, but not for the purpose of expressing an opinion on the effectiveness of the company’s and its controlled entities’ internal control. An audit also includes evaluating the appropriateness of accounting policies used and the reasonableness of accounting estimates made by the directors, as well as evaluating the overall presentation of the financial report.
Our audit did not involve an analysis of the prudence of business decisions made by directors or management.
We believe that the audit evidence we have obtained is sufficient and appropriate to provide a basis for our audit opinion.
INDEPENDENT AUDITOR’S REPORT

42 Supply Network Limited Annual Report 2015
Independence
In conducting our audit, we have complied with the independence requirements of the Corporations Act 2001.
Opinion
In our opinion:
(a) the financial report of Supply Network Limited is in accordance with the Corporations Act 2001, including: (i) giving a true and fair view of the consolidated entity’s financial position as at 30 June 2015 and its performance for the year
ended on that date; and (ii) complying with Australian Accounting Standards and the Corporations Regulations 2001; and
(b) the financial statements also comply with International Financial Reporting Standards as disclosed in Note 2(b).
Report on the Remuneration Report
We have audited the Remuneration Report included in pages 9 to 12 of the directors’ report for the year ended 30 June 2015. The directors of the company are responsible for the preparation and presentation of the Remuneration Report in accordance with section 300A of the Corporations Act 2001. Our responsibility is to express an opinion on the Remuneration Report, based on our audit conducted in accordance with Australian Auditing Standards.
Opinion
In our opinion, the Remuneration Report of Supply Network Limited for the year ended 30 June 2015 complies with section 300A of the Corporations Act 2001.
Matters relating to the electronic presentation of the audited financial report and remuneration report
This auditor’s report relates to the financial report and remuneration report of Supply Network Limited for the financial year ended 30 June 2015 published in the annual report and included on the company’s website. The company’s directors are responsible for the integrity of the company’s website. We have not been engaged to report on the integrity of this website. The auditor’s report refers only to the financial report and remuneration report identified above. It does not provide an opinion on any other information which may have been hyperlinked to/from the financial report and remuneration report. If users of the financial report and remuneration report are concerned with the inherent risks arising from publication on a website, they are advised to refer to the hard copy of the audited financial report and remuneration report to confirm the information contained in this website version of the financial report and remuneration report
HLB MANN JUDD S GrivasChartered Accountants Partner
Sydney, NSW19 August 2015
INDEPENDENT AUDITOR’S REPORT(CONTINUED)
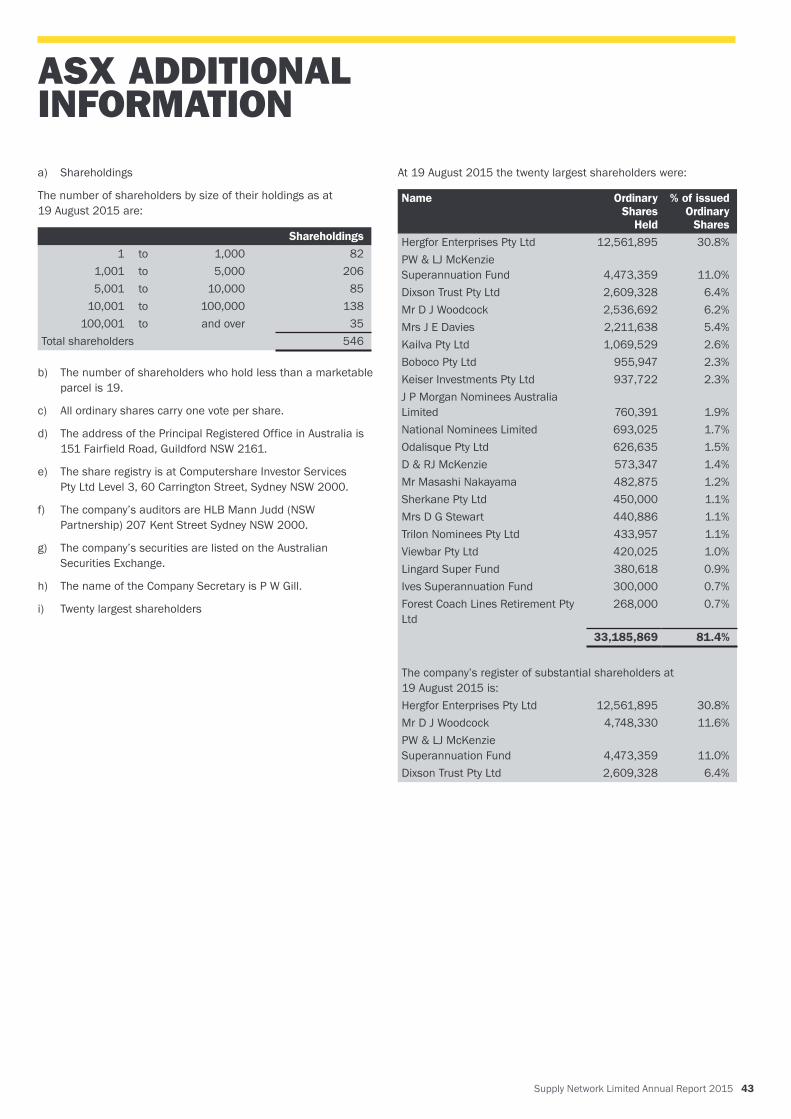
Supply Network Limited Annual Report 2015 43
a) Shareholdings
The number of shareholders by size of their holdings as at 19 August 2015 are:
Shareholdings1 to 1,000 82
1,001 to 5,000 2065,001 to 10,000 85
10,001 to 100,000 138100,001 to and over 35
Total shareholders 546
b) The number of shareholders who hold less than a marketable parcel is 19.
c) All ordinary shares carry one vote per share.
d) The address of the Principal Registered Office in Australia is 151 Fairfield Road, Guildford NSW 2161.
e) The share registry is at Computershare Investor Services Pty Ltd Level 3, 60 Carrington Street, Sydney NSW 2000.
f) The company’s auditors are HLB Mann Judd (NSW Partnership) 207 Kent Street Sydney NSW 2000.
g) The company’s securities are listed on the Australian Securities Exchange.
h) The name of the Company Secretary is P W Gill.
i) Twenty largest shareholders
At 19 August 2015 the twenty largest shareholders were:
Name Ordinary Shares
Held
% of issued Ordinary
SharesHergfor Enterprises Pty Ltd 12,561,895 30.8%PW & LJ McKenzie Superannuation Fund
4,473,359
11.0%
Dixson Trust Pty Ltd 2,609,328 6.4%Mr D J Woodcock 2,536,692 6.2%Mrs J E Davies 2,211,638 5.4%Kailva Pty Ltd 1,069,529 2.6%Boboco Pty Ltd 955,947 2.3%Keiser Investments Pty Ltd 937,722 2.3%J P Morgan Nominees Australia Limited
760,391
1.9%
National Nominees Limited 693,025 1.7%Odalisque Pty Ltd 626,635 1.5%D & RJ McKenzie 573,347 1.4%Mr Masashi Nakayama 482,875 1.2%Sherkane Pty Ltd 450,000 1.1%Mrs D G Stewart 440,886 1.1%Trilon Nominees Pty Ltd 433,957 1.1%Viewbar Pty Ltd 420,025 1.0%Lingard Super Fund 380,618 0.9%Ives Superannuation Fund 300,000 0.7%Forest Coach Lines Retirement Pty Ltd
268,000 0.7%
33,185,869 81.4%
The company’s register of substantial shareholders at 19 August 2015 is:Hergfor Enterprises Pty Ltd 12,561,895 30.8%Mr D J Woodcock 4,748,330 11.6%PW & LJ McKenzie Superannuation Fund
4,473,359
11.0%
Dixson Trust Pty Ltd 2,609,328 6.4%
ASX ADDITIONAL INFORMATION
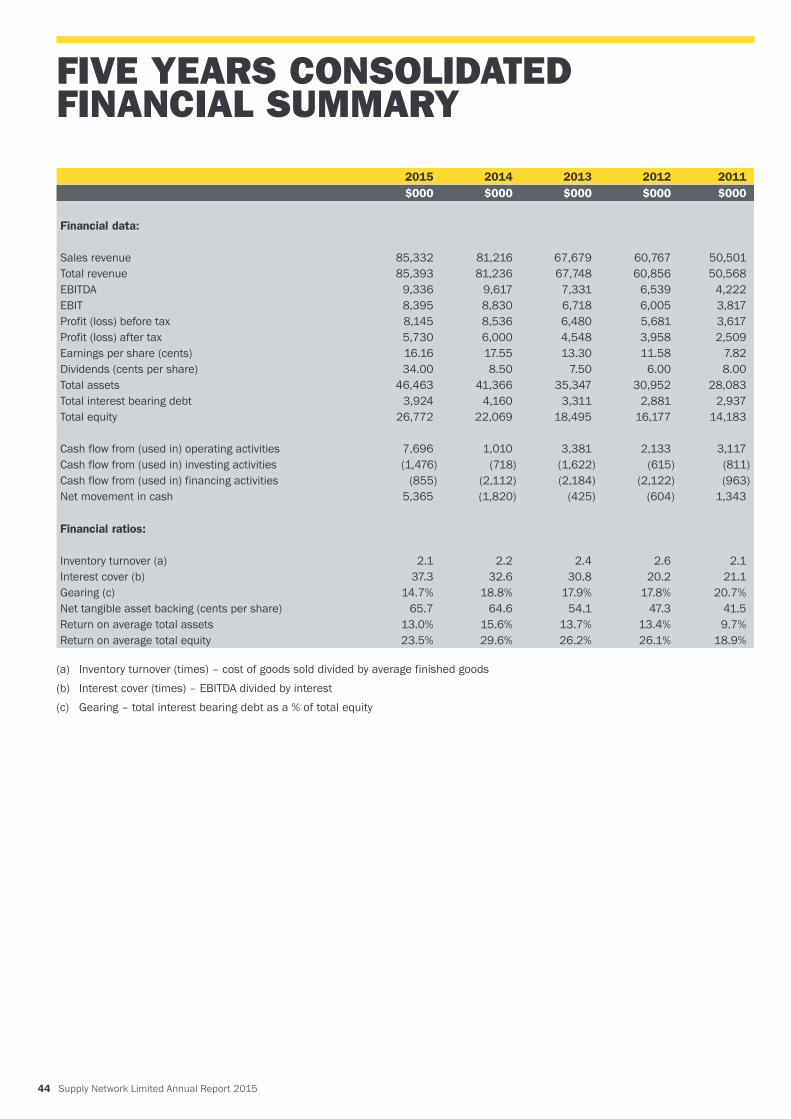
2015 2014 2013 2012 2011$000 $000 $000 $000 $000
Financial data:
Sales revenue 85,332 81,216 67,679 60,767 50,501Total revenue 85,393 81,236 67,748 60,856 50,568EBITDA 9,336 9,617 7,331 6,539 4,222EBIT 8,395 8,830 6,718 6,005 3,817Profit (loss) before tax 8,145 8,536 6,480 5,681 3,617Profit (loss) after tax 5,730 6,000 4,548 3,958 2,509Earnings per share (cents) 16.16 17.55 13.30 11.58 7.82Dividends (cents per share) 34.00 8.50 7.50 6.00 8.00Total assets 46,463 41,366 35,347 30,952 28,083Total interest bearing debt 3,924 4,160 3,311 2,881 2,937Total equity 26,772 22,069 18,495 16,177 14,183
Cash flow from (used in) operating activities 7,696 1,010 3,381 2,133 3,117Cash flow from (used in) investing activities (1,476) (718) (1,622) (615) (811)Cash flow from (used in) financing activities (855) (2,112) (2,184) (2,122) (963)Net movement in cash 5,365 (1,820) (425) (604) 1,343
Financial ratios:
Inventory turnover (a) 2.1 2.2 2.4 2.6 2.1Interest cover (b) 37.3 32.6 30.8 20.2 21.1Gearing (c) 14.7% 18.8% 17.9% 17.8% 20.7%Net tangible asset backing (cents per share) 65.7 64.6 54.1 47.3 41.5Return on average total assets 13.0% 15.6% 13.7% 13.4% 9.7%Return on average total equity 23.5% 29.6% 26.2% 26.1% 18.9%
(a) Inventory turnover (times) – cost of goods sold divided by average finished goods(b) Interest cover (times) – EBITDA divided by interest(c) Gearing – total interest bearing debt as a % of total equity
FIVE YEARS CONSOLIDATED FINANCIAL SUMMARY
44 Supply Network Limited Annual Report 2015
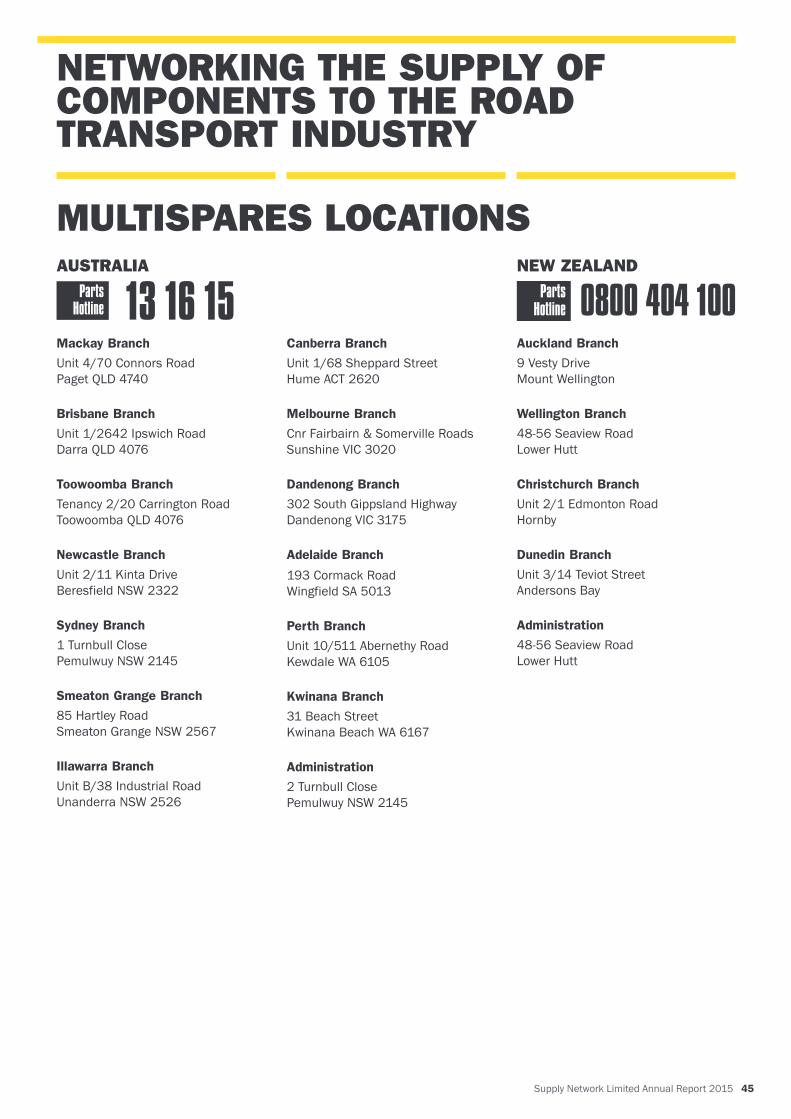
Supply Network Limited Annual Report 2015 45
Mackay Branch
Unit 4/70 Connors Road Paget QLD 4740
Brisbane Branch
Unit 1/2642 Ipswich RoadDarra QLD 4076
Toowoomba Branch
Tenancy 2/20 Carrington RoadToowoomba QLD 4076
Newcastle Branch
Unit 2/11 Kinta DriveBeresfield NSW 2322
Sydney Branch
1 Turnbull ClosePemulwuy NSW 2145
Smeaton Grange Branch
85 Hartley RoadSmeaton Grange NSW 2567
Illawarra Branch
Unit B/38 Industrial Road Unanderra NSW 2526
NETWORKING THE SUPPLY OF COMPONENTS TO THE ROAD TRANSPORT INDUSTRY
Canberra Branch
Unit 1/68 Sheppard StreetHume ACT 2620
Melbourne Branch
Cnr Fairbairn & Somerville RoadsSunshine VIC 3020
Dandenong Branch
302 South Gippsland Highway Dandenong VIC 3175
Adelaide Branch
193 Cormack RoadWingfield SA 5013
Perth Branch
Unit 10/511 Abernethy Road Kewdale WA 6105
Kwinana Branch
31 Beach StreetKwinana Beach WA 6167
Administration
2 Turnbull ClosePemulwuy NSW 2145
Auckland Branch
9 Vesty DriveMount Wellington
Wellington Branch
48-56 Seaview RoadLower Hutt
Christchurch Branch
Unit 2/1 Edmonton RoadHornby
Dunedin Branch
Unit 3/14 Teviot StreetAndersons Bay
Administration
48-56 Seaview RoadLower Hutt
MULTISPARES LOCATIONSAUSTRALIA NEW ZEALAND
TRUCK& BUSPARTS
SUPPLY NETWORK LIMITED 151 Fairfield Road Guildford NSW 2161 PO Box 460 Fairfield NSW 2165Telephone 02 9892 3888 Facsimile 02 9892 2399 www.supplynetwork.com.au