Embed Size (px)
Citation preview
International Snow Science Workshop, Davos 2009, Proceedings
202
International Snow Science Workshop Davos 2009
Snowpack depth modelling and water availability from LIDAR measurements in eastern Pyrenees
Ignacio MORENO BAÑOS1,*, Antoni RUIZ GARCÍA2, Jordi MARTURIÀ I ALAVEDRA1, Pere OLLER I FIGUERAS1, Jordi PIÑA IGLESIAS1, Carles GARCIA SELLÉS1 , Pere MARTÍNEZ I FIGUERAS1, Julià
TALAYA LÓPEZ2
1 Institut Geològic de Catalunya, C/ Balmes, 209-211. E08006-Barcelona. 2 Institut Cartogràfic de Catalunya, Parc de Montjuïc - 08038 Barcelona.
ABSTRACT:
In order to evaluate water reserves in mountain watersheds the Institut Geològic de Catalunya (IGC) jointly with Institut Cartogràfic de Catalunya (ICC) have begun a project to model snowpack depth distribution at the study site of Vall de Núria (38 Km2 basin located in eastern Pyrenees). Re-mote sensing airborne LIDAR (Light Detection and Ranging) survey and field work validations were performed to make this calculation. Modelling snowpack distribution is a complex task because of its spatial variability. Despite being a recently developed technique, LIDAR has become a useful method in snow sciences because it has the advantage to offer dense point data and to cover wide areas with little economic and field work effort. The new methodology presented combines LIDAR data with field work, the use of Geographical Information Systems (GIS) and the stepwise regression tree (SRT), as extrapolation technique has allowed us to map snowpack depth distribution with high spatial resolu-tion. Extrapolation is necessary because raw LIDAR data is only obtained from part of the study area in order to make the technique as affordable as possible. Promising results show low differences of total snow volume calculated from modeled snowpack distribution and total snow volume from LIDAR data only differ 1.4%.
KEYWORDS: snowpack depth, stepwise regression tree, LIDAR, GIS, Pyrenees
1 INTRODUCTION
Mediterranean climate is characterized by a high precipitation variability. As a result of this variability the Iberian Peninsula, and Catalonia as part of it, are affected by frequent and serious droughts that alter the availability of water supply. Hydric resources are not only concerned by natural fluctuations, but social pressure must also be taken into consideration. Catalonia’s internal fluvial basins (those, whose responsibili-ty is the local Government) occupy 52% of total Catalonia’s surface but houses the 92% of the total population (Sangrà, 2008) which increases hydric stress. As a consequence of particulari-ties mentioned above it is necessary to quantify hydric resources stored as snow.
High snowpack variability (Elder, 1995) and sparse snow depth data make it difficult to mod-el snow cover. For this reason remote sensing is
essential when modelling wide areas. The use of airborne LIDAR (Light Detection
and Ranging) to model snow depth has the ad-vantage of covering large areas with high reso-lution at a relatively low economic cost. The ap-plication of LIDAR to model snow depth is poss-ible due to the high accuracy it provides, vertical error of 15 cm in ideal conditions, as several studies have shown (Hopkinson, 2001; Fass-nacht, 2005; Deems, 2006)
The present study, Use of LIDAR to eva-luate water reserves stored as snow in mountain watershed, is carried out by Institut Geològic de Catalunya (IGC) jointly with Institut Cartogràfic de Catalunya (ICC). The project is composed of several stages with the final aim being to model water availability in mountain watersheds. First of all, snow depth volume was modeled and the results of this first stage are presented here.
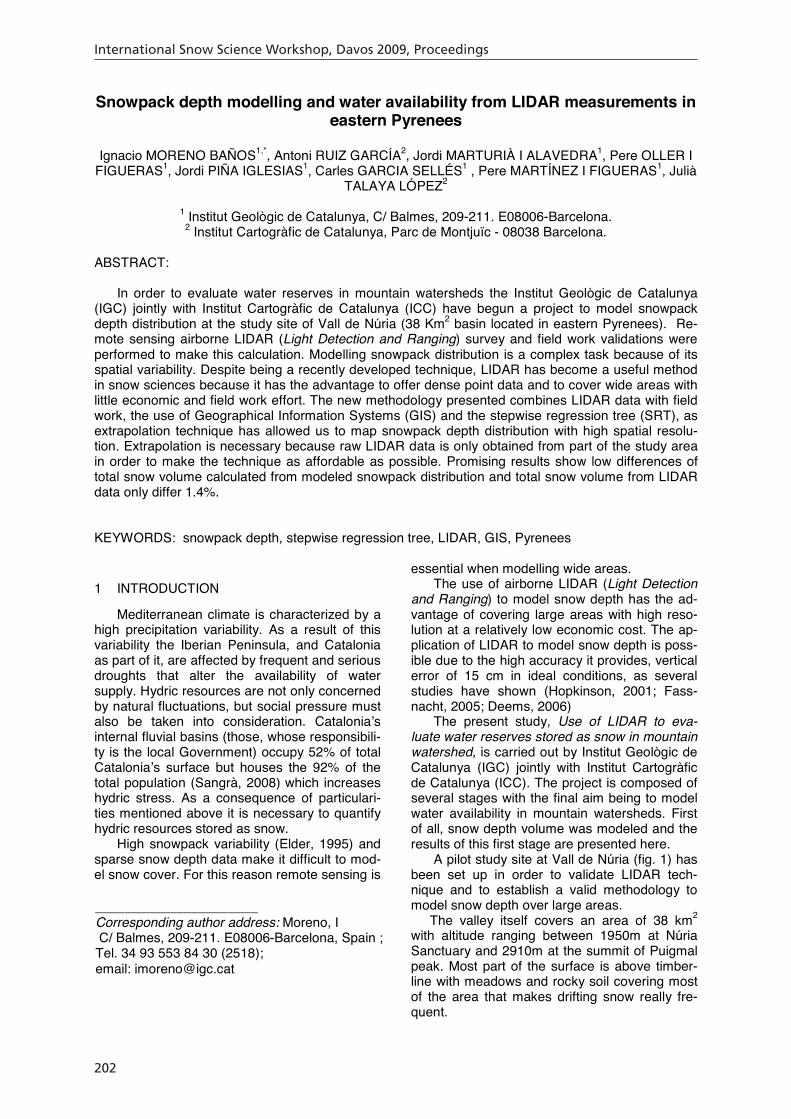
A pilot study site at Vall de Núria (fig. 1) has been set up in order to validate LIDAR tech-nique and to establish a valid methodology to model snow depth over large areas.
The valley itself covers an area of 38 km2
with altitude ranging between 1950m at Núria Sanctuary and 2910m at the summit of Puigmal peak. Most part of the surface is above timber-line with meadows and rocky soil covering most of the area that makes drifting snow really fre-quent.
______________________ Corresponding author address: Moreno, I C/ Balmes, 209-211. E08006-Barcelona, Spain ; Tel. 34 93 553 84 30 (2518); email: [email protected]
International Snow Science Workshop, Davos 2009, Proceedings
203
International
2 DATA AND METHODS
As pointed out before, two LIDAR flights were necessary to obtain snow depthLIDAR flight with snow coverture9-3-2004. Covering the same area, out snow was done on 9-8-2006. laser utilized was Optech ALTM3025.
Once flights were concludedprocessed with specialized TerraScanto generate two high resolutionDigital Elevation Models (DEM). Afterwards, subtraction of both models wassnow depth and distribution.
In order to validate snow depth from LIDAR data (more than 1 point mtained), a simultaneous field work collect ground observations of snow depth. To achieve this purpose two teams equipped with submetric GPS systems were formedbuted throughout different creeksof transport (backcountry skis) and time necesary to get an accurate GPS position (exceeding 30 minutes per measure) only 19 were acquired. This sparse data made to validate snow depth LIDAR datamethods were used in the validation processsuch as field work photography.
Once LIDAR snow depth data was processed and validated, modellingout through extrapolation. In reality aNúria extrapolation was not necessary because LIDAR data was available from Nevertheless, to increase project efficiency on large areas it was required to get LIDAR data only from a small part of the study area, tha LIDAR strip (fig 2). Then, extrapolation
International Snow Science Workshop Davos 2009
before, two LIDAR flights were necessary to obtain snow depth data.
coverture was done on overing the same area, a flight with-
2006. On both flights ALTM3025.
concluded, raw data was TerraScan® software
high resolution, 1m cell size, DEM). Afterwards,
done to obtain
In order to validate snow depth calculated (more than 1 point m2 is ob-
imultaneous field work was made to collect ground observations of snow depth. To
two teams equipped with formed and distri-
creeks. Due to means ) and time neces-
position (exceeding only 19 data points
This sparse data made it difficult LIDAR data, so indirect
validation process,
depth data was modelling was carried
In reality at Vall de not necessary because
from the whole area. ject efficiency on
to get LIDAR data only from a small part of the study area, that is,
. Then, extrapolation was
necessary to obtain snow depth data from research area.
Geographical Information Systems and geostatistics were employeddepth. ArcGIS 9.3® GIS softwarecalculate topographical variables thatthe distribution of snow depth (Marchand 2005, López-Moreno, 2006; among otpect, altitude, curvature, distance to main rangeand solar radiation. Despite DEM resol1m working resolution was estacell size in order to optimize cosources.
Figure 2. Snow depth data extrapolation from one strip LIDAR data.
In addition to these independent variables other important factors must be taken into acount when modelling snow depth. As pointed by Molotch (2005) wind is one of these impotant factors. Therefore upwind index(2002), was added to independent variables. Upwind index measures exposure of cell in a DEM depending on prevailing wind direction.
Figure 1. Vall de Núria location map.
necessary to obtain snow depth data from whole
Geographical Information Systems (GIS) employed to model snow
GIS software was used to calculate topographical variables that determine the distribution of snow depth (Marchand 2005,
among others): slope, as-, distance to main range
Despite DEM resolution was 1m working resolution was established at 5m cell size in order to optimize computer re-
Snow depth data extrapolation from
In addition to these independent variables other important factors must be taken into ac-
snow depth. As pointed by Molotch (2005) wind is one of these impor-
upwind index, Winstral added to independent variables.
exposure of cell in a DEM depending on prevailing wind direction.
International Snow Science Workshop, Davos 2009, Proceedings
204
International Snow Science Workshop Davos 2009
(1)
This index was calculated with the expression shown(1).
Upwind index expression calculation. Where ELEV is the altitude of interest cell, A the azi-muth of the search direction, (xi, yi) coordinates of the cell of interest and (xv, yv) the coordinates of the cells found in the same direction of pre-vailing wind.
Method utilized for extrapolation was step-wise regression tree (SRT) proposed and im-plemented by Loh (2002) in algorithm GUIDE as an evolution of the classical regression tree(Breiman, 1984).
Through GUIDE algorithm (it can be ac-cessed on the internet: http://www.stat.wisc.edu/~loh/guide.html) a tree classification was made. In the model, inde-pendent variables were used to explain the de-pendent variable, snow depth. At each final tree node, a stepwise regression was calculated. The regression at each final node ensures a small and homogeneous sample size which im-plies a better accuracy on prediction and cartog-raphy (Huang, 2003).
Regression tree modelling has the advan-tage to take into consideration no-linearity of dependent variable (De’ath 2000 & Huang 2003).
GUIDE algorithm with regression at each fi-nal node jointly with LIDAR technology and the methodology here presented made it possible to overcome some of the problems pointed out by López-Moreno (2006) about regression trees. The result was a cartography representing the snow depth distribution accurately over the re-search area (see fig. 6).
3 RESULTS AND DISCUSSION
3.1 LIDAR snow depth model.
Validation of original snow depth model re-sult of subtraction of DEMs was necessary due to errors produced by different factors as slope or vegetation (Deems, 2006; Hopkinson, 2001). Validation methods applied were:
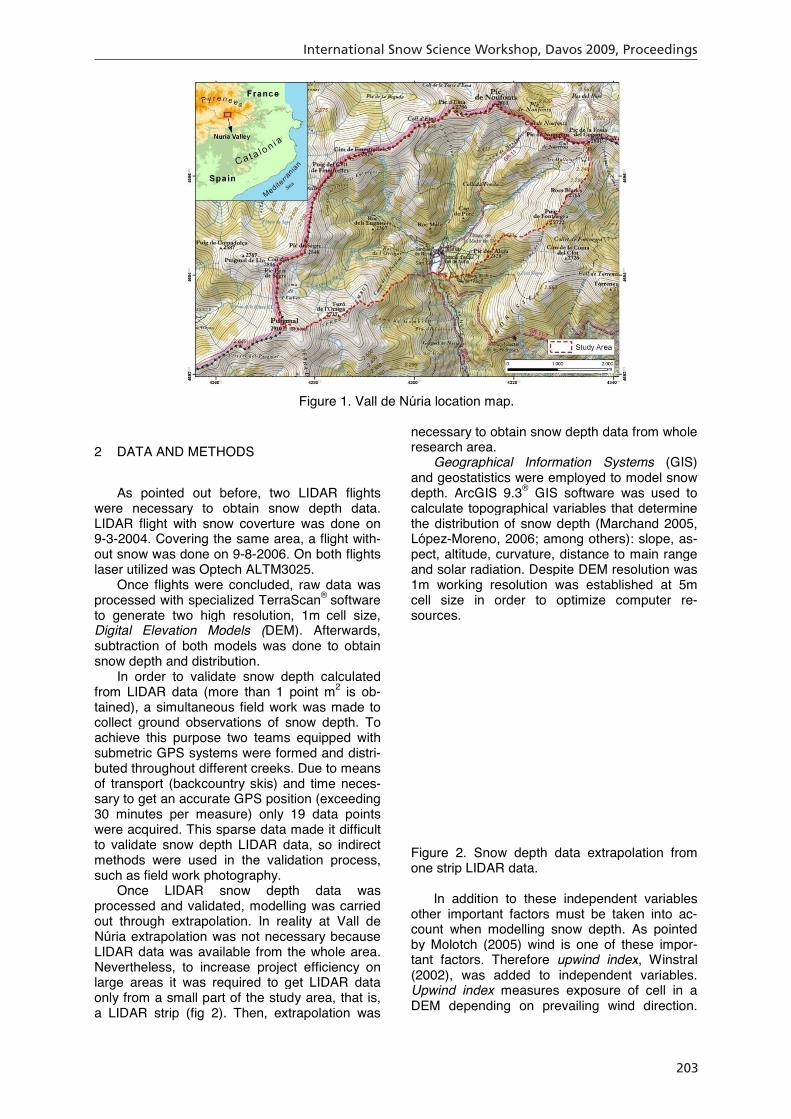
1. Creation of control areas where snow depth is equal to 0 identified by field photogra-phy (fig 3).
2. Identification of snow accumulation areas on the map and its characterization with snow profiles.
Figure 3. Location of control areas digitalized with known snow depth.
As result of validation process Root Mean square Error (RMSE) for the entire control areas was calculated: 0.33m. If difference is made be-tween different control areas (table 1) it is con-firmed that slope and vegetation cover have an important role as error sources.
Control areas RMSE (m) Finestrelles ski slope 0.351
Núria Sanctuary 0.103
Table 1. RMSE calculated for different control areas.
As shown in map (fig. 3) the surface near Finestrelles ski slope is a rocky area partially covered by shrubs with an average slope of 38º. On the other hand, the area situated near Núria Sanctuary is nearly flat (average slope: 2.5º) and covered by meadows. Consequently, RMSE in Finestrelles ski slope is higher, 0.351m, than in Núria Sanctuary, 0.103m. It is demonstrated how slope and soil cover play an important role in quality of LIDAR data, as demonstrated by Hopkinson (2001) and Deems (2006).
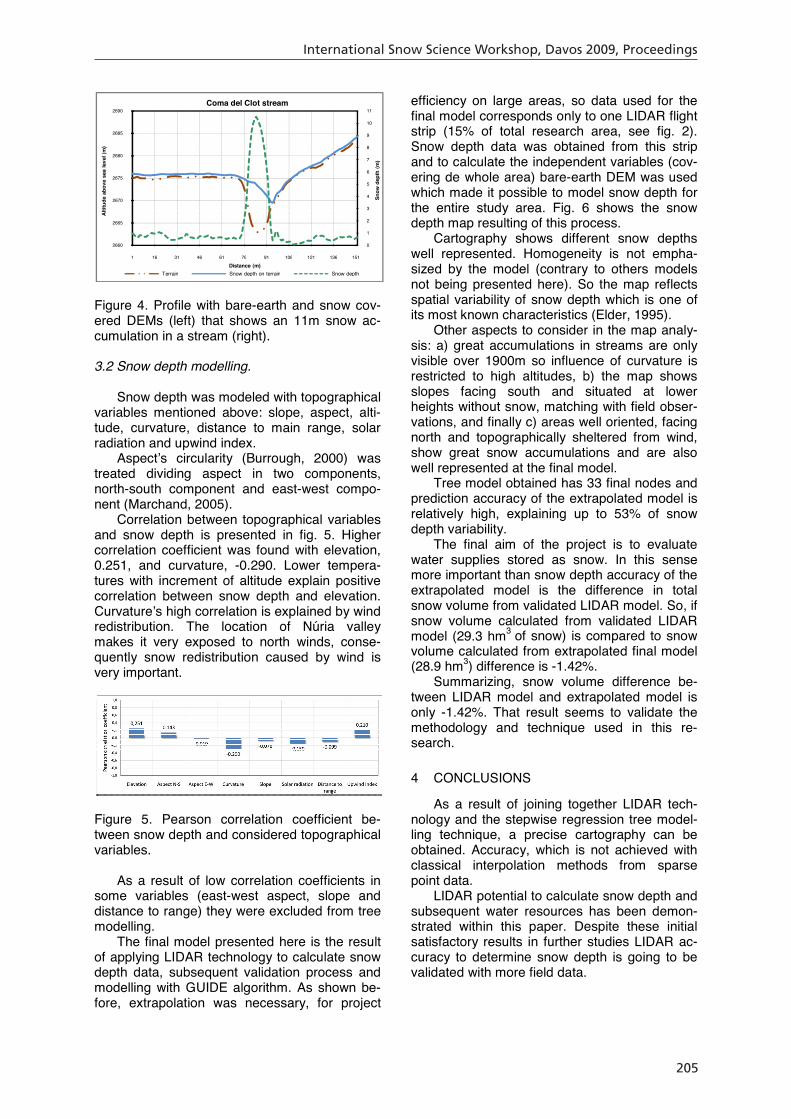
Validation also included the analysis of to-pographical profiles in areas of extreme high snow accumulation. In total, twelve profiles were obtained from original DEMs (one of them shown in fig 4.). These profiles show evidence that snow depth accumulation up to 11 meters is valid in very specific topographical conditions (deep streams and wind sheltered areas). So in validation process all values higher than 11m were considered erroneous and subsequently eliminated.
International Snow Science Workshop, Davos 2009, Proceedings
205
International Snow Science Workshop Davos 2009
Figure 4. Profile with bare-earth and snow cov-ered DEMs (left) that shows an 11m snow ac-cumulation in a stream (right).
3.2 Snow depth modelling.
Snow depth was modeled with topographical variables mentioned above: slope, aspect, alti-tude, curvature, distance to main range, solar radiation and upwind index.
Aspect’s circularity (Burrough, 2000) was treated dividing aspect in two components, north-south component and east-west compo-nent (Marchand, 2005).
Correlation between topographical variables and snow depth is presented in fig. 5. Higher correlation coefficient was found with elevation, 0.251, and curvature, -0.290. Lower tempera-tures with increment of altitude explain positive correlation between snow depth and elevation. Curvature’s high correlation is explained by wind redistribution. The location of Núria valley makes it very exposed to north winds, conse-quently snow redistribution caused by wind is very important.
Figure 5. Pearson correlation coefficient be-tween snow depth and considered topographical variables.
As a result of low correlation coefficients in some variables (east-west aspect, slope and distance to range) they were excluded from tree modelling.
The final model presented here is the result of applying LIDAR technology to calculate snow depth data, subsequent validation process and modelling with GUIDE algorithm. As shown be-fore, extrapolation was necessary, for project
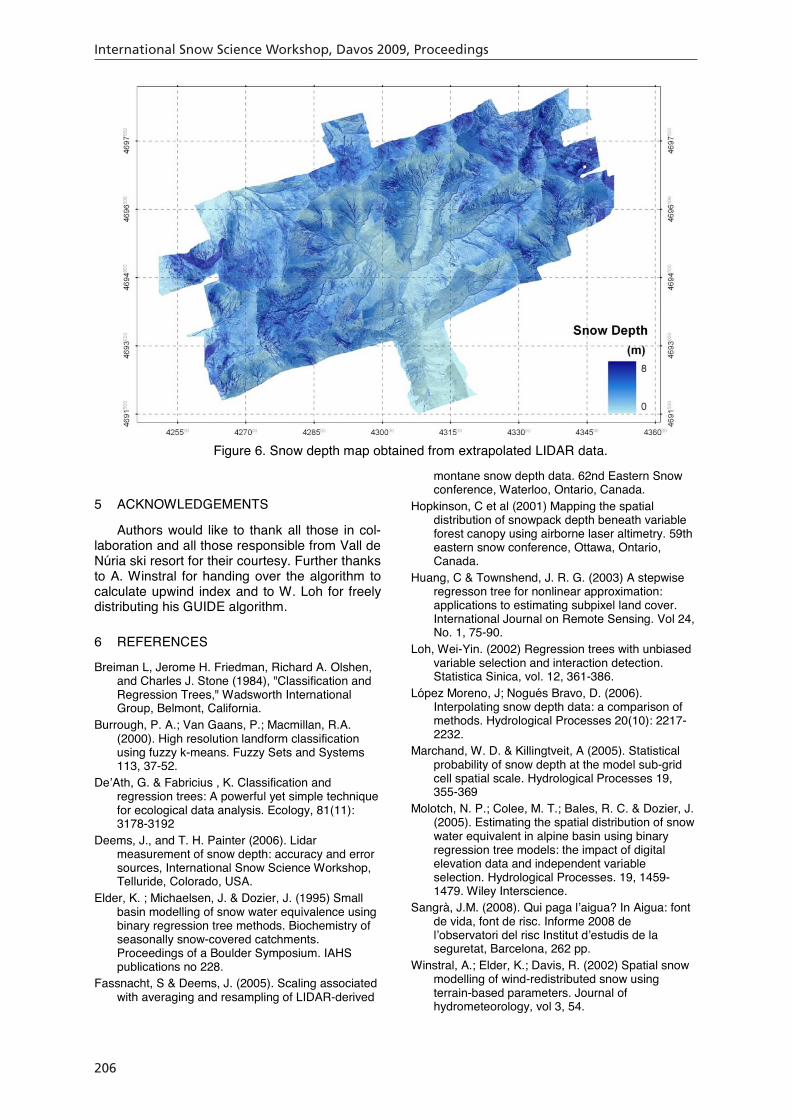
efficiency on large areas, so data used for the final model corresponds only to one LIDAR flight strip (15% of total research area, see fig. 2). Snow depth data was obtained from this strip and to calculate the independent variables (cov-ering de whole area) bare-earth DEM was used which made it possible to model snow depth for the entire study area. Fig. 6 shows the snow depth map resulting of this process.
Cartography shows different snow depths well represented. Homogeneity is not empha-sized by the model (contrary to others models not being presented here). So the map reflects spatial variability of snow depth which is one of its most known characteristics (Elder, 1995).
Other aspects to consider in the map analy-sis: a) great accumulations in streams are only visible over 1900m so influence of curvature is restricted to high altitudes, b) the map shows slopes facing south and situated at lower heights without snow, matching with field obser-vations, and finally c) areas well oriented, facing north and topographically sheltered from wind, show great snow accumulations and are also well represented at the final model.
Tree model obtained has 33 final nodes and prediction accuracy of the extrapolated model is relatively high, explaining up to 53% of snow depth variability.
The final aim of the project is to evaluate water supplies stored as snow. In this sense more important than snow depth accuracy of the extrapolated model is the difference in total snow volume from validated LIDAR model. So, if snow volume calculated from validated LIDAR model (29.3 hm3 of snow) is compared to snow volume calculated from extrapolated final model (28.9 hm3) difference is -1.42%.
Summarizing, snow volume difference be-tween LIDAR model and extrapolated model is only -1.42%. That result seems to validate the methodology and technique used in this re-search.
4 CONCLUSIONS
As a result of joining together LIDAR tech-nology and the stepwise regression tree model-ling technique, a precise cartography can be obtained. Accuracy, which is not achieved with classical interpolation methods from sparse point data.
LIDAR potential to calculate snow depth and subsequent water resources has been demon-strated within this paper. Despite these initial satisfactory results in further studies LIDAR ac-curacy to determine snow depth is going to be validated with more field data.
0
1
2
3
4
5
6
7
8
9
10
11
2660
2665
2670
2675
2680
2685
2690
1 16 31 46 61 76 91 106 121 136 151
Snow
dep
th (m
)
Altit
ude
abov
e se
a le
vel (
m)
Distance (m)
Coma del Clot stream
Terrain Snow depth on terrain Snow depth
International Snow Science Workshop, Davos 2009, Proceedings
206
International Snow Science Workshop Davos 2009
Figure 6. Snow depth map obtained from extrapolated LIDAR data.
5 ACKNOWLEDGEMENTS
Authors would like to thank all those in col-laboration and all those responsible from Vall de Núria ski resort for their courtesy. Further thanks to A. Winstral for handing over the algorithm to calculate upwind index and to W. Loh for freely distributing his GUIDE algorithm.
6 REFERENCES
Breiman L, Jerome H. Friedman, Richard A. Olshen, and Charles J. Stone (1984), "Classification and Regression Trees," Wadsworth International Group, Belmont, California.
Burrough, P. A.; Van Gaans, P.; Macmillan, R.A. (2000). High resolution landform classification using fuzzy k-means. Fuzzy Sets and Systems 113, 37-52.
De’Ath, G. & Fabricius , K. Classification and regression trees: A powerful yet simple technique for ecological data analysis. Ecology, 81(11): 3178-3192
Deems, J., and T. H. Painter (2006). Lidar measurement of snow depth: accuracy and error sources, International Snow Science Workshop, Telluride, Colorado, USA.
Elder, K. ; Michaelsen, J. & Dozier, J. (1995) Small basin modelling of snow water equivalence using binary regression tree methods. Biochemistry of seasonally snow-covered catchments. Proceedings of a Boulder Symposium. IAHS publications no 228.
Fassnacht, S & Deems, J. (2005). Scaling associated with averaging and resampling of LIDAR-derived
montane snow depth data. 62nd Eastern Snow conference, Waterloo, Ontario, Canada.
Hopkinson, C et al (2001) Mapping the spatial distribution of snowpack depth beneath variable forest canopy using airborne laser altimetry. 59th eastern snow conference, Ottawa, Ontario, Canada.
Huang, C & Townshend, J. R. G. (2003) A stepwise regresson tree for nonlinear approximation: applications to estimating subpixel land cover. International Journal on Remote Sensing. Vol 24, No. 1, 75-90.
Loh, Wei-Yin. (2002) Regression trees with unbiased variable selection and interaction detection. Statistica Sinica, vol. 12, 361-386.
López Moreno, J; Nogués Bravo, D. (2006). Interpolating snow depth data: a comparison of methods. Hydrological Processes 20(10): 2217-2232.
Marchand, W. D. & Killingtveit, A (2005). Statistical probability of snow depth at the model sub-grid cell spatial scale. Hydrological Processes 19, 355-369
Molotch, N. P.; Colee, M. T.; Bales, R. C. & Dozier, J. (2005). Estimating the spatial distribution of snow water equivalent in alpine basin using binary regression tree models: the impact of digital elevation data and independent variable selection. Hydrological Processes. 19, 1459-1479. Wiley Interscience.
Sangrà, J.M. (2008). Qui paga l’aigua? In Aigua: font de vida, font de risc. Informe 2008 de l’observatori del risc Institut d’estudis de la seguretat, Barcelona, 262 pp.
Winstral, A.; Elder, K.; Davis, R. (2002) Spatial snow modelling of wind-redistributed snow using terrain-based parameters. Journal of hydrometeorology, vol 3, 54.