Embed Size (px)
Citation preview

1
SNR
Skunkworks
Trick or treatment?Evaluating the quality of structured
risk management decisions
Joe ArvaiThe Ohio State University
Decision Research
2
SNR
Skunkworks
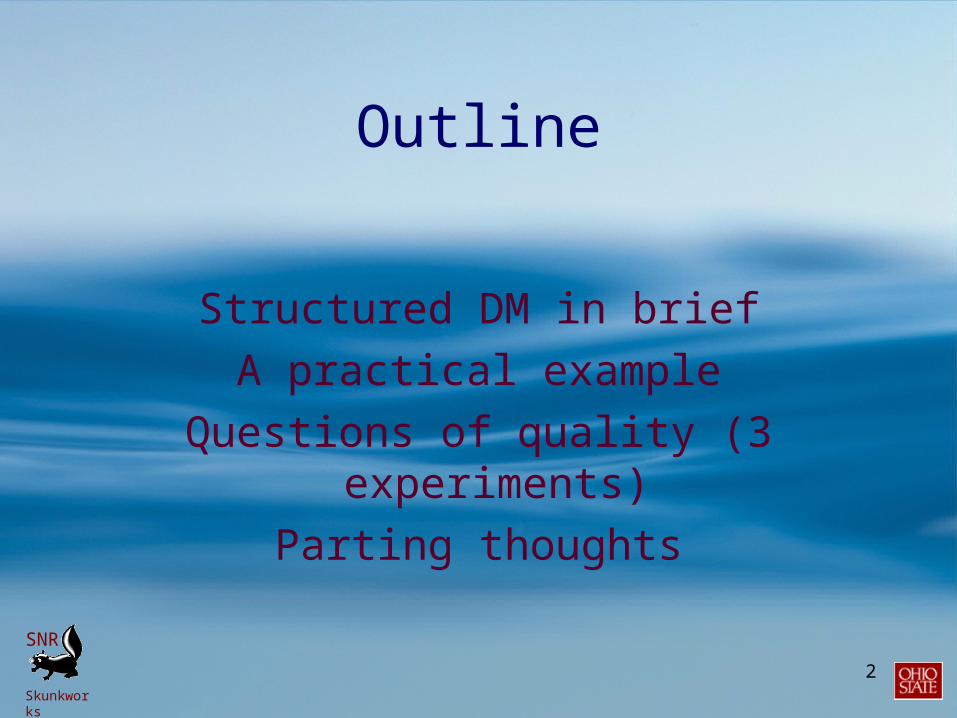
Outline
Structured DM in briefA practical example
Questions of quality (3 experiments)Parting thoughts
3
SNR
Skunkworks
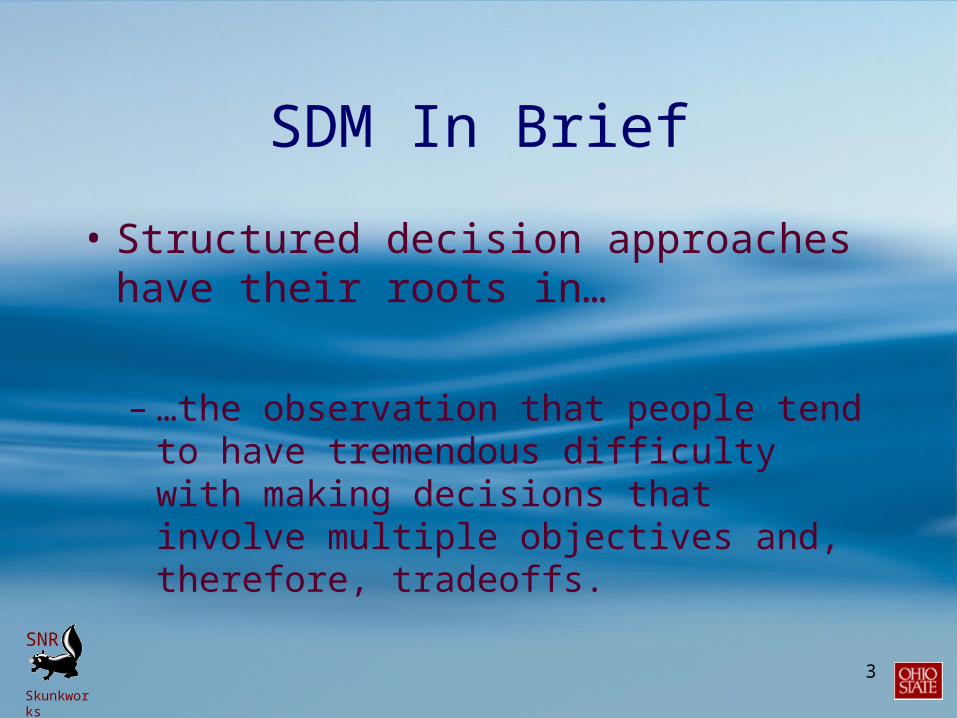
SDM In Brief
• Structured decision approaches have their roots in…
– …the observation that people tend to have tremendous difficulty with making decisions that involve multiple objectives and, therefore, tradeoffs.
4
SNR
Skunkworks
SDM In Brief
• Structured decision approaches have their roots in…
– …studies of the constructive nature of preferences in response to available cues.
5
SNR
Skunkworks
SDM In Brief
• Structured decision approaches are designed based on…
– …“value focused thinking.”
6
SNR
Skunkworks
SDM In Brief
• Structured decision approaches are designed based on…
– …the literature dealing with normative decision making, specifically the steps required for a complete analysis of a given decision
7
SNR
Skunkworks
SDM In Brief
• Structured decision approaches are designed based on…
– …methods for decreasing the cognitive burden associated with complex choices.
8
SNR
Skunkworks
The Case of Water Use Planningin British Columbia
• Work with B.C. Hydro on a comprehensive, stakeholder-based development of revised operating plans at all major hydroelectric facilities.
• In response to increasing, competing demands on provincial water resources
9
SNR
Skunkworks
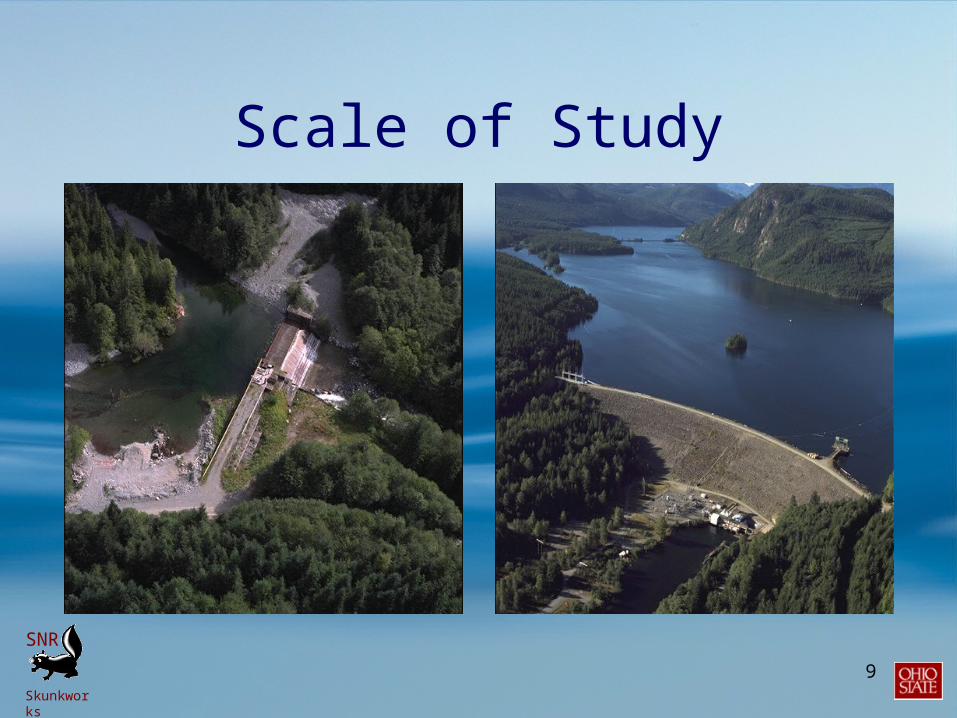
Scale of Study
10
SNR
Skunkworks
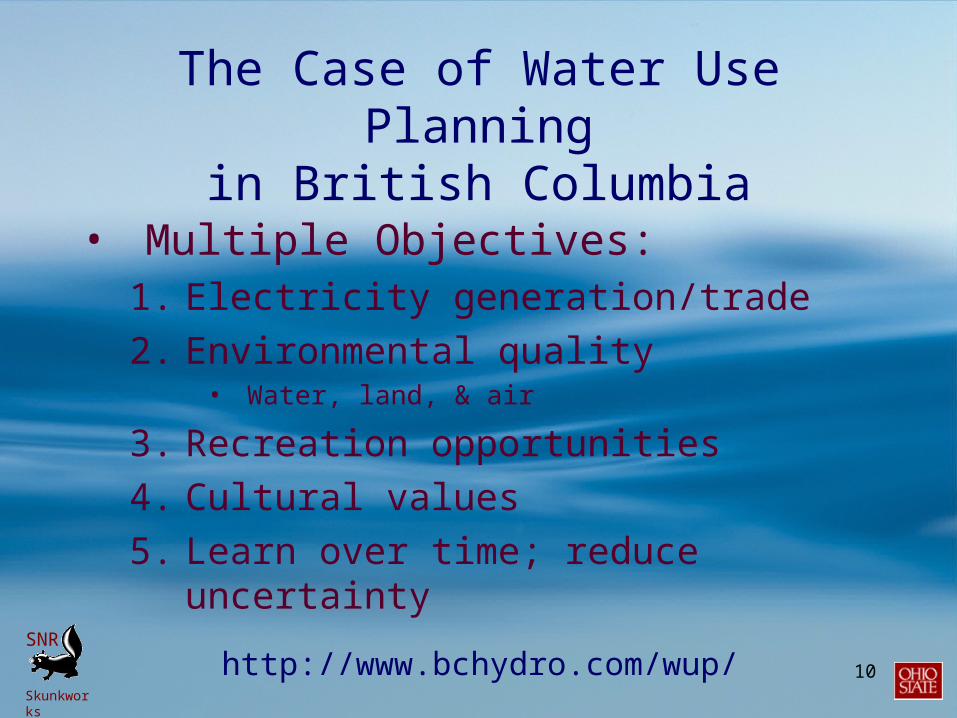
The Case of Water Use Planningin British Columbia
• Multiple Objectives:1. Electricity generation/trade2. Environmental quality
• Water, land, & air
3. Recreation opportunities4. Cultural values 5. Learn over time; reduce uncertainty
http://www.bchydro.com/wup/
11
SNR
Skunkworks
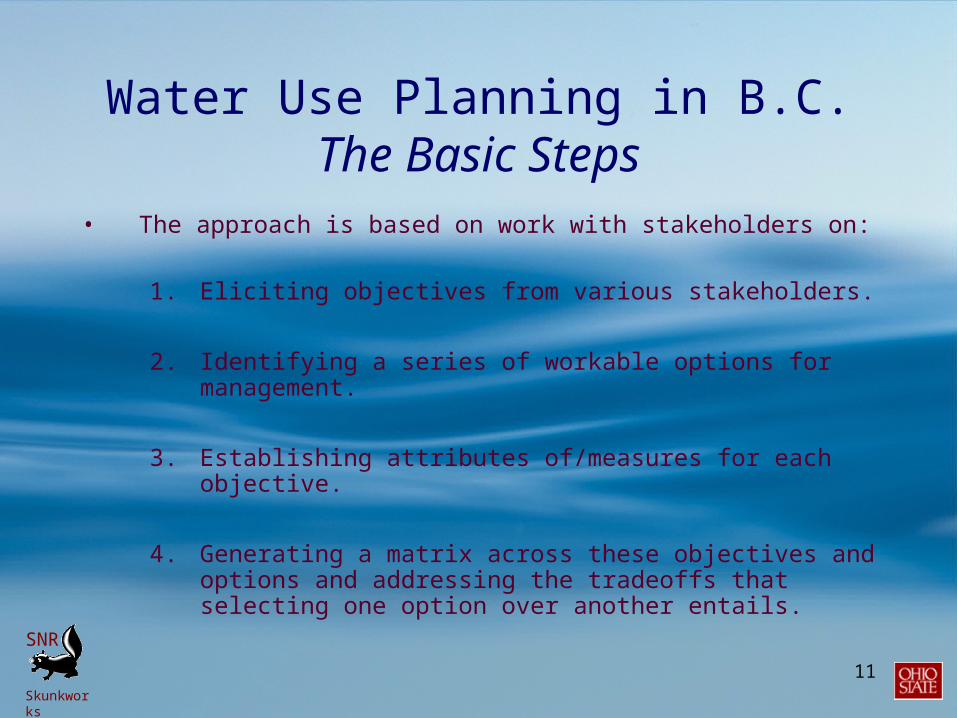
Water Use Planning in B.C.The Basic Steps
• The approach is based on work with stakeholders on:
1. Eliciting objectives from various stakeholders.
2. Identifying a series of workable options for management.
3. Establishing attributes of/measures for each objective.
4. Generating a matrix across these objectives and options and addressing the tradeoffs that selecting one option over another entails.
12
SNR
Skunkworks
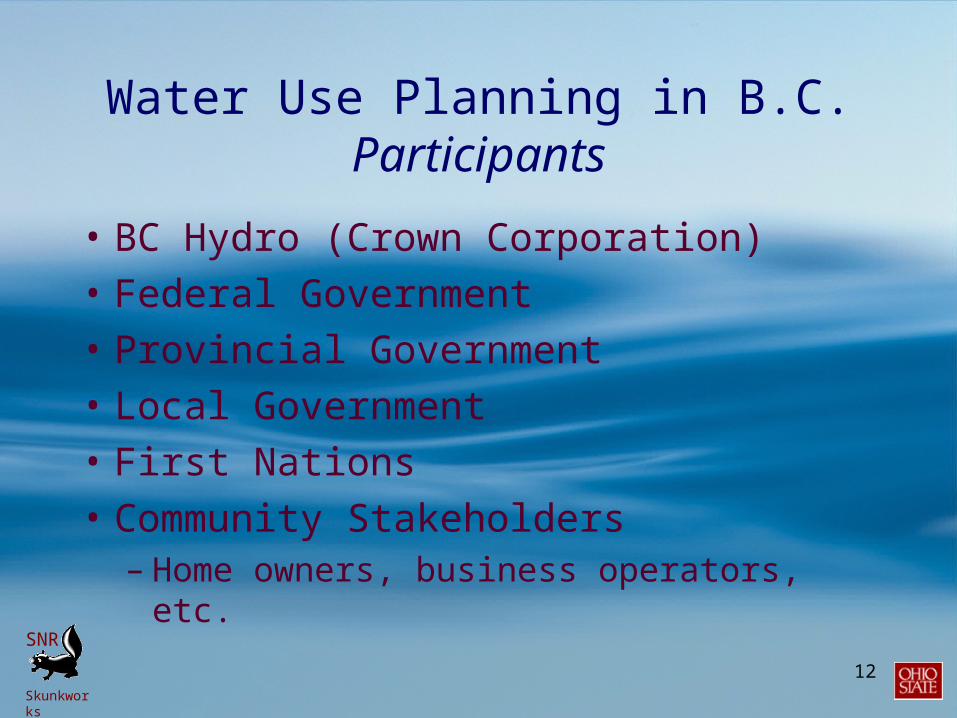
Water Use Planning in B.C.Participants
• BC Hydro (Crown Corporation)• Federal Government• Provincial Government• Local Government• First Nations• Community Stakeholders
– Home owners, business operators, etc.
13
SNR
Skunkworks
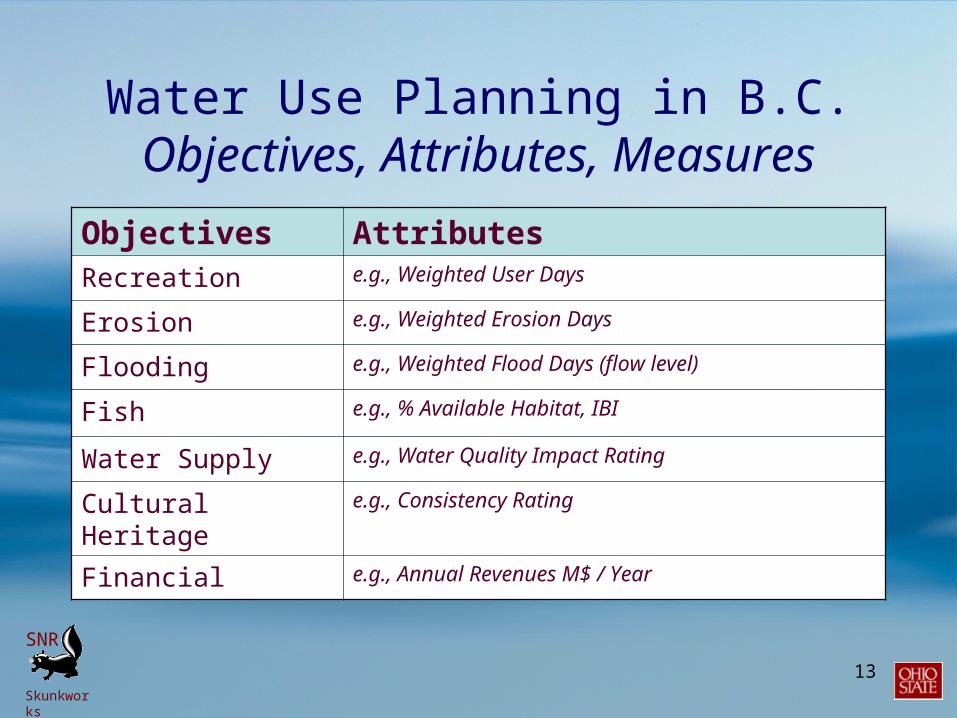
Water Use Planning in B.C.Objectives, Attributes, Measures
Objectives AttributesRecreation e.g., Weighted User Days
Erosion e.g., Weighted Erosion Days
Flooding e.g., Weighted Flood Days (flow level)
Fish e.g., % Available Habitat, IBI
Water Supply e.g., Water Quality Impact Rating
Cultural Heritage e.g., Consistency Rating
Financial e.g., Annual Revenues M$ / Year
14
SNR
Skunkworks
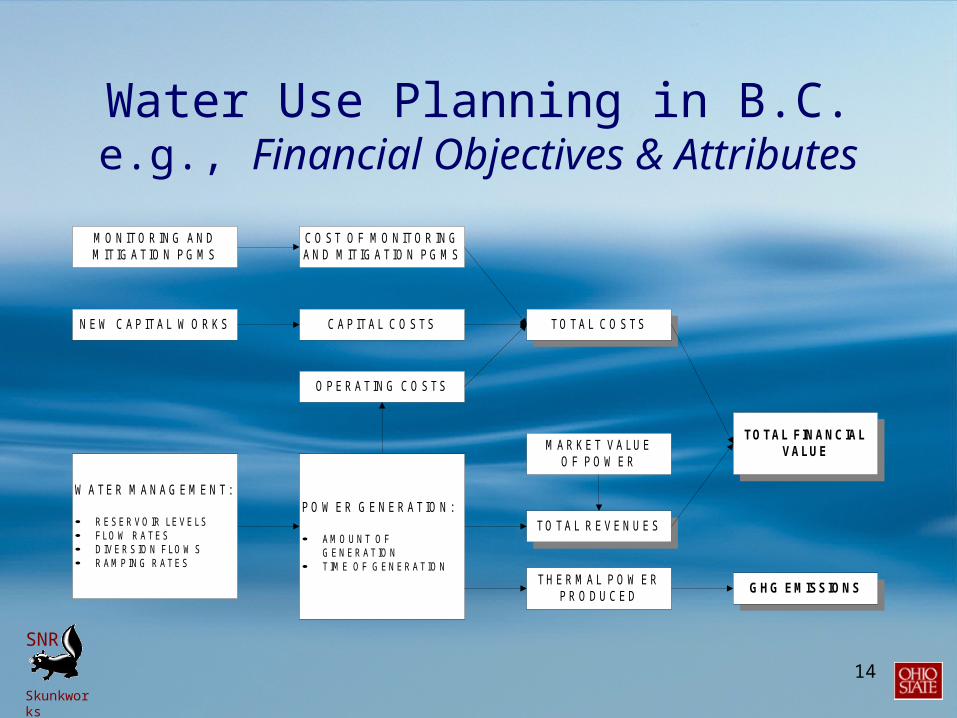
Water Use Planning in B.C.e.g., Financial Objectives &
Attributes
M A R K E T V A LU EO F P O W E R
TOTAL FINANCIALVALUE
C O S T O F M O N ITO R IN GA N D M IT IG A T IO N P G M S
M O N ITO R IN G A N DM IT IG A T IO N P G M S
TH E R M A L P O W E RP R O D U C E D
GHG EMISSIONS
N E W C A P ITA L W O R K S C A P ITA L C O S TS TO TA L C O S TS
TO TA L R E V E N U E S
O P E R A TIN G C O S TS
W A TE R M A N A G E M E N T:
R ESER VO IR LEVELS FLO W R AT ES D IVER SIO N FLO W S R AM PIN G R AT ES
P O W E R G E N E R A TIO N :
AM O U N T O FG EN ER AT IO N
T IM E O F G EN ER AT IO N
15
SNR
Skunkworks
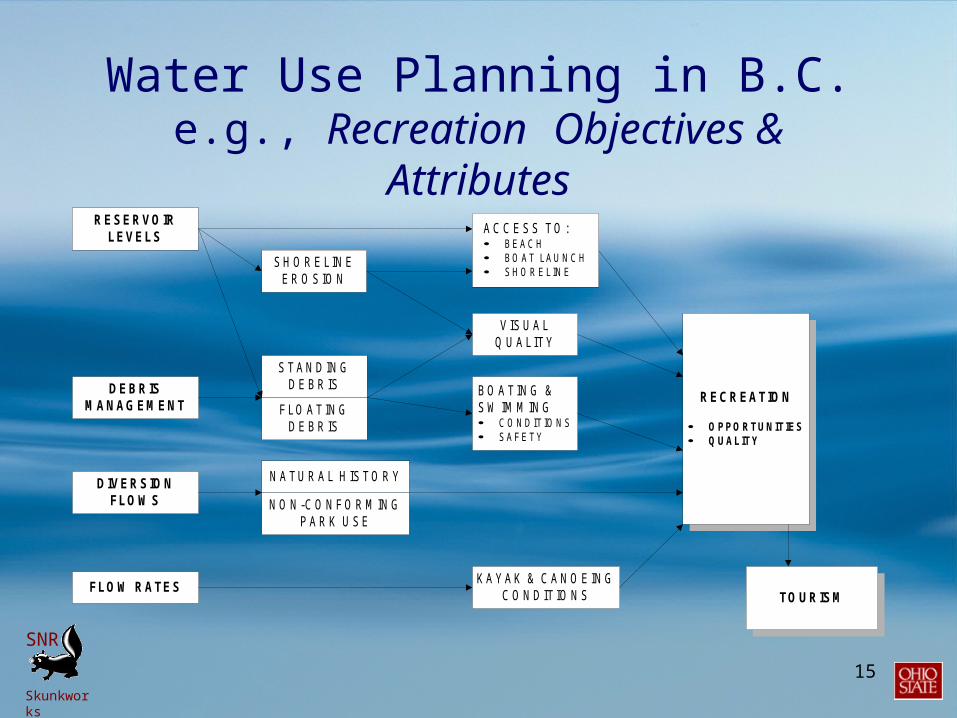
Water Use Planning in B.C.e.g., Recreation Objectives &
AttributesRESERVOIR
LEVELS
FLO A TIN GD E B R IS
RECREATION
OPPORTUNITIES QUALITY
DEBRISMANAGEMENT
V IS U A LQ U A LITY
B O A TIN G &S W IM M IN G C O N D IT IO N S SAFET Y
DIVERSIONFLOW S
TOURISMFLOW RATES
K A YA K & C A N O E IN GC O N D IT IO N S
A C C E S S TO : BEAC H BO AT LAU N C H SH O R ELIN E
S TA N D IN GD E B R IS
S H O R E LIN EE R O S IO N
N O N -C O N FO R M IN GP A R K U S E
N A TU R A L H IS TO R Y
16
SNR
Skunkworks
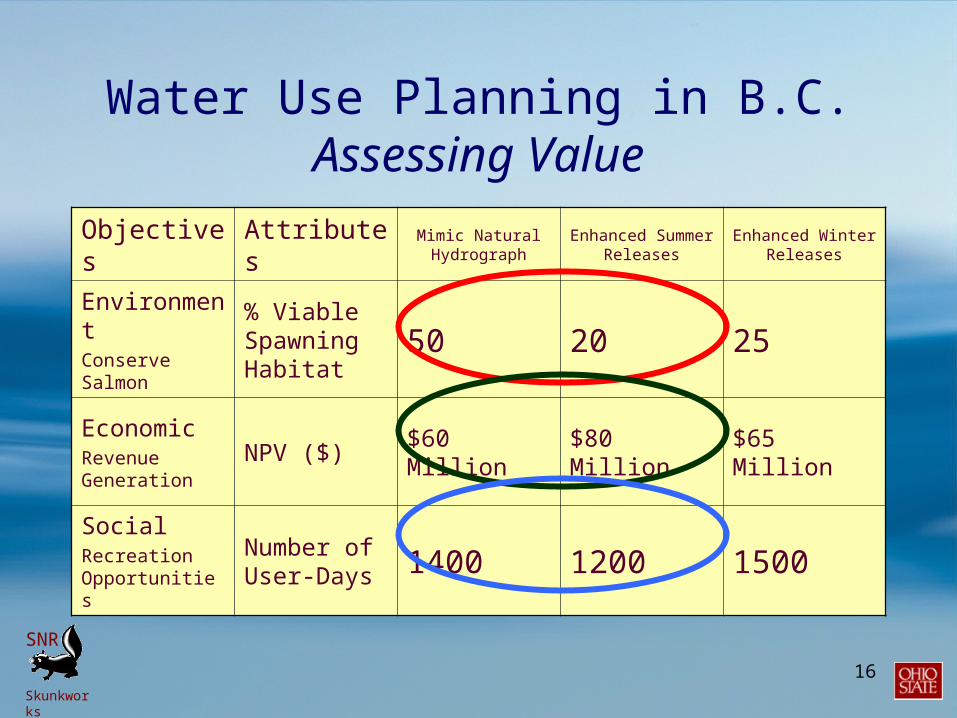
Water Use Planning in B.C.Assessing Value
Objectives Attributes Mimic Natural Hydrograph
Enhanced Summer Releases
Enhanced Winter Releases
EnvironmentConserve Salmon
% Viable Spawning Habitat
50 20 25
EconomicRevenue Generation
NPV ($) $60 Million $80 Million $65 Million
SocialRecreation Opportunities
Number of User-Days 1400 1200 1500
17
SNR
Skunkworks
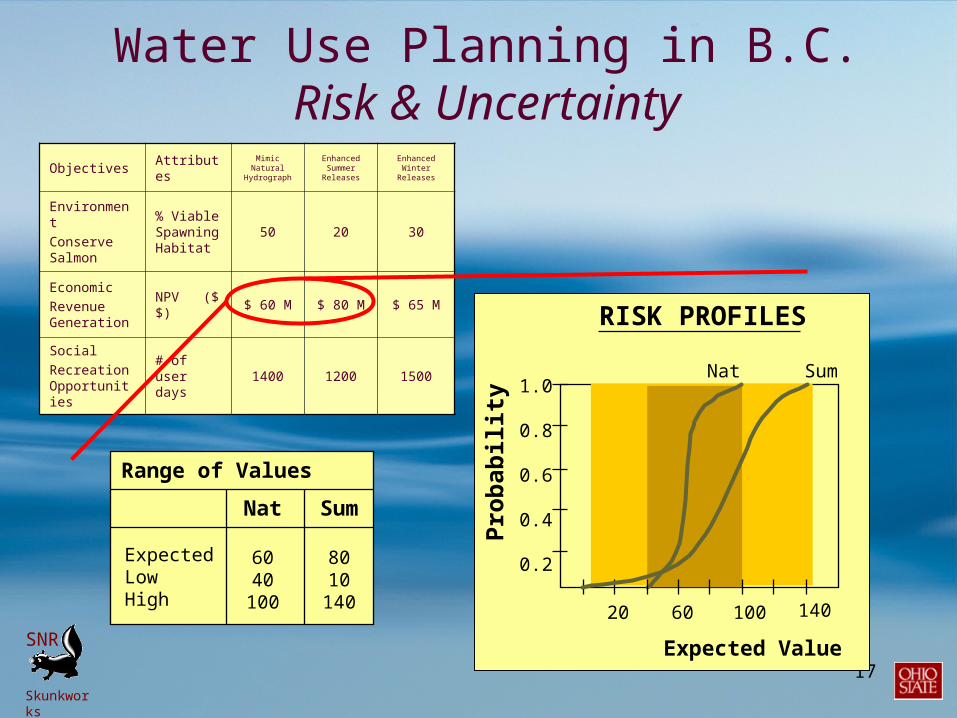
Objectives AttributesMimic
Natural Hydrograph
Enhanced Summer Releases
Enhanced Winter
Releases
EnvironmentConserve Salmon
% Viable Spawning Habitat
50 20 30
EconomicRevenue Generation
NPV ($$)
$ 60 M $ 80 M $ 65 M
SocialRecreation Opportunities
# of user days
1400 1200 1500
Range of Values
Nat
6040
100
ExpectedLowHigh
Sum
8010140
RISK PROFILES
1.0
0.8
0.6
0.4
0.2
20 60 100 140
Pro
bab
ilit
y
Expected Value
Nat Sum
Water Use Planning in B.C.Risk & Uncertainty
18
SNR
Skunkworks
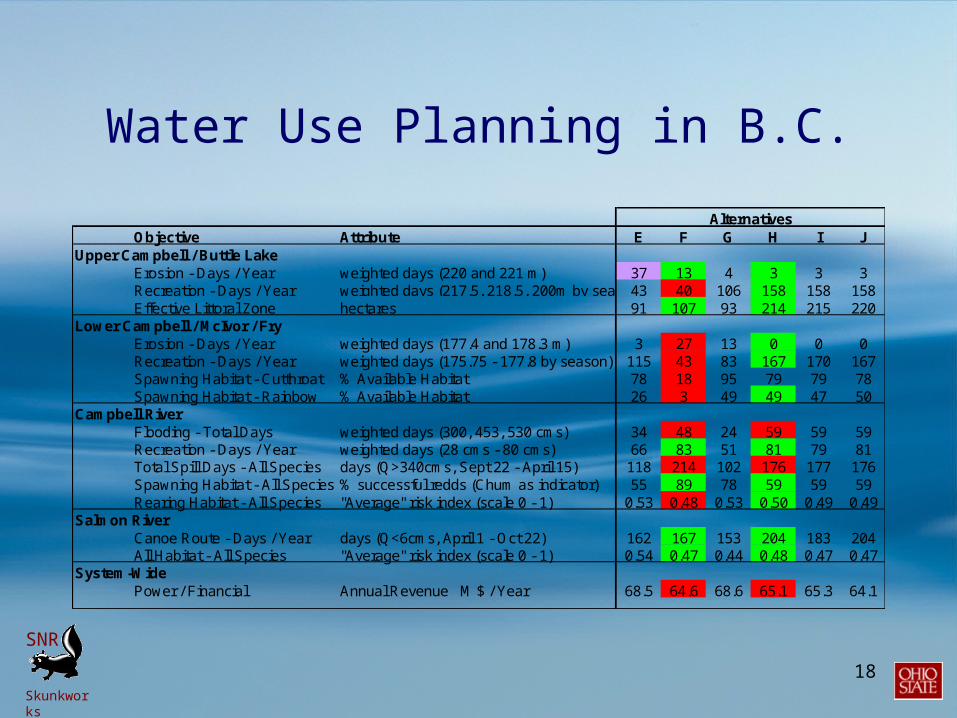
Water Use Planning in B.C.
AlternativesObjective Attribute E F G H I J
Upper Campbell / Buttle LakeErosion - Days / Year weighted days (220 and 221 m) 37 13 4 3 3 3Recreation - Days / Year weighted days (217.5, 218.5, 200m by season)43 40 106 158 158 158Effective Littoral Zone hectares 91 107 93 214 215 220
Lower Campbell / McIvor / FryErosion - Days / Year weighted days (177.4 and 178.3 m) 3 27 13 0 0 0Recreation - Days / Year weighted days (175.75 - 177.8 by season) 115 43 83 167 170 167Spawning Habitat - Cutthroat % Available Habitat 78 18 95 79 79 78Spawning Habitat - Rainbow % Available Habitat 26 3 49 49 47 50
Campbell RiverFlooding - Total Days weighted days (300, 453, 530 cms) 34 48 24 59 59 59Recreation - Days / Year weighted days (28 cms - 80 cms) 66 83 51 81 79 81Total Spill Days - All Species days (Q>340cms, Sept 22 - April 15) 118 214 102 176 177 176Spawning Habitat - All Species % successful redds (Chum as indicator) 55 89 78 59 59 59Rearing Habitat - All Species "Average" risk index (scale 0 - 1) 0.53 0.48 0.53 0.50 0.49 0.49
Salmon RiverCanoe Route - Days / Year days (Q<6cms, April 1 - Oct 22) 162 167 153 204 183 204All Habitat - All Species "Average" risk index (scale 0 - 1) 0.54 0.47 0.44 0.48 0.47 0.47
System-WidePower / Financial Annual Revenue M $ / Year 68.5 64.6 68.6 65.1 65.3 64.1
19
SNR
Skunkworks
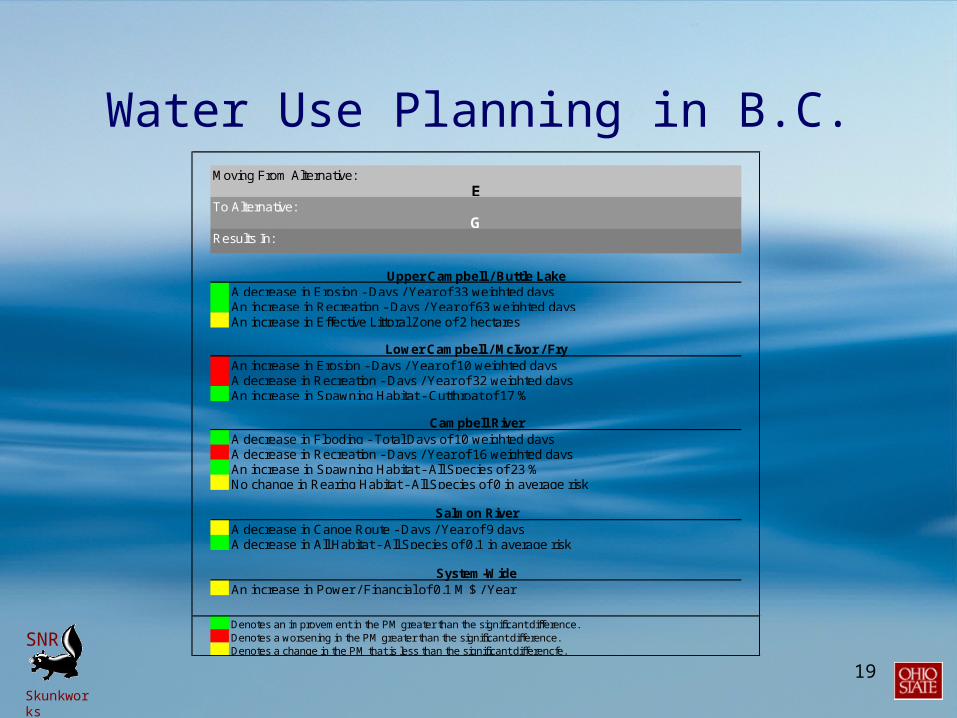
Moving From Alternative:E
To Alternative:G
Results In:
Upper Campbell / Buttle LakeG A decrease in Erosion - Days / Year of 33 weighted daysG An increase in Recreation - Days / Year of 63 weighted daysY An increase in Effective Littoral Zone of 2 hectares
Lower Campbell / McIvor / FryR An increase in Erosion - Days / Year of 10 weighted daysR A decrease in Recreation - Days / Year of 32 weighted daysG An increase in Spawning Habitat - Cutthroat of 17 %
Campbell RiverG A decrease in Flooding - Total Days of 10 weighted daysR A decrease in Recreation - Days / Year of 16 weighted daysG An increase in Spawning Habitat - All Species of 23 %Y No change in Rearing Habitat - All Species of 0 in average risk
Salmon RiverY A decrease in Canoe Route - Days / Year of 9 daysG A decrease in All Habitat - All Species of 0.1 in average risk
System-WideY An increase in Power / Financial of 0.1 M $ / Year
Denotes an improvement in the PM greater than the significant difference.Denotes a worsening in the PM greater than the significant difference.Denotes a change in the PM that is less than the significant differencfe.
Water Use Planning in B.C.
20
SNR
Skunkworks
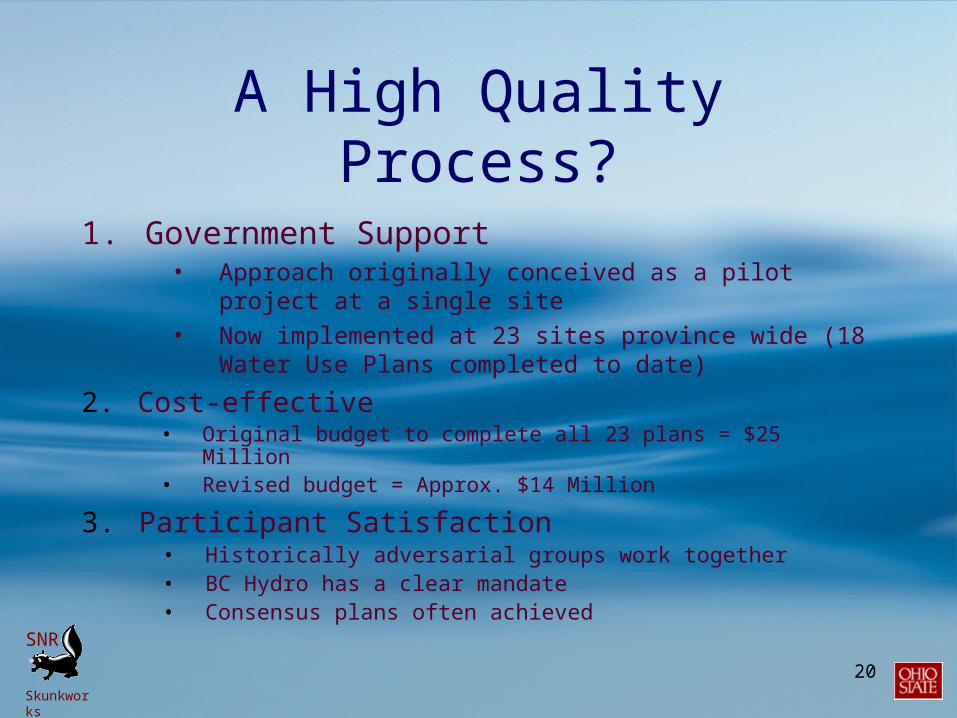
A High Quality Process?
1. Government Support• Approach originally conceived as a pilot project at a
single site• Now implemented at 23 sites province wide (18 Water
Use Plans completed to date)
2. Cost-effective• Original budget to complete all 23 plans = $25 Million• Revised budget = Approx. $14 Million
3. Participant Satisfaction• Historically adversarial groups work together• BC Hydro has a clear mandate• Consensus plans often achieved

21
SNR
Skunkworks
• Designed to compare two approaches for involving stakeholders in water use planning in B.C…– …small groups (7-10)– …both conditions provided with the
same information– …“Structured” vs. “Unstructured”
process
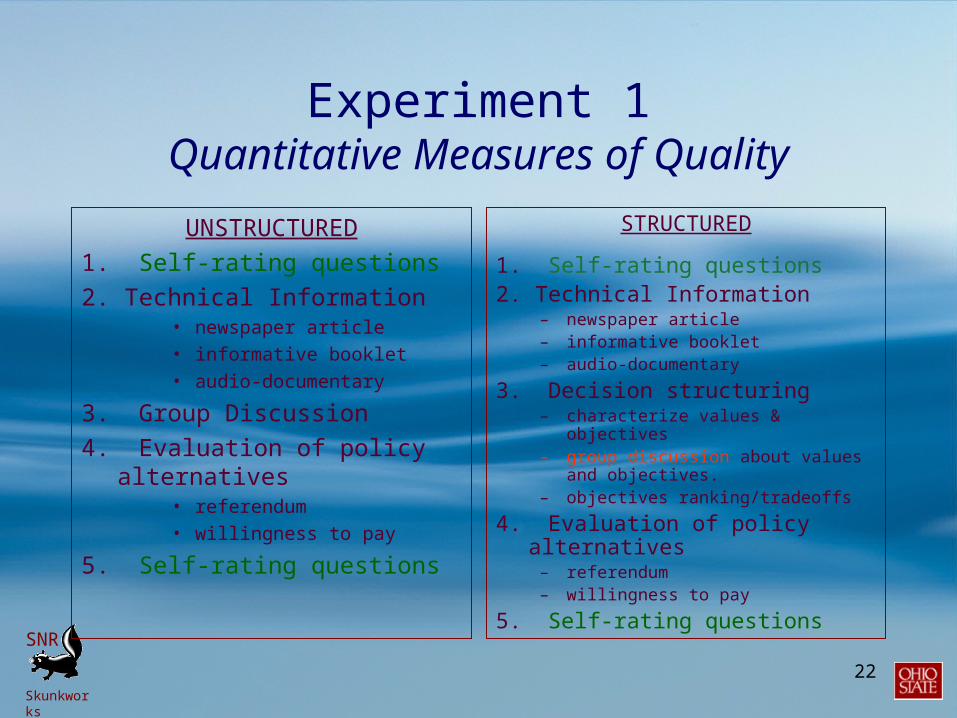
Experiment 1Quantitative Measures of Quality
22
SNR
Skunkworks
UNSTRUCTURED1. Self-rating questions2. Technical Information
• newspaper article• informative booklet• audio-documentary
3. Group Discussion4. Evaluation of policy
alternatives• referendum• willingness to pay
5. Self-rating questions
STRUCTURED
1. Self-rating questions2. Technical Information
– newspaper article– informative booklet– audio-documentary
3. Decision structuring– characterize values & objectives– group discussion about values
and objectives.– objectives ranking/tradeoffs
4. Evaluation of policy alternatives
– referendum– willingness to pay
5. Self-rating questions
Experiment 1Quantitative Measures of Quality
23
SNR
Skunkworks
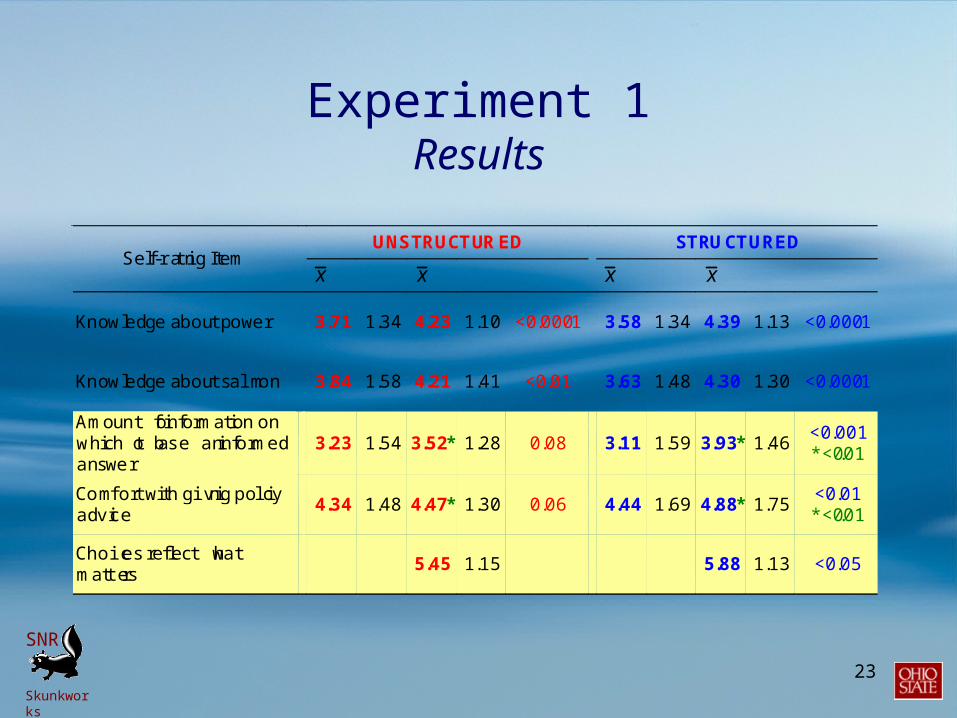
UNSTRUCTURED STRUCTUREDSelf-rating Item
x Start sStart
x End sEnd p
x Start sStart
x End sEnd p
Knowledge about power 3.71 1.34 4.23 1.10 <0.0001 3.58 1.34 4.39 1.13 <0.0001
Knowledge about salmon 3.84 1.58 4.21 1.41 <0.01 3.63 1.48 4.30 1.30 <0.0001
Amount of information onwhich to base an informedanswer
3.23 1.54 3.52* 1.28 0.08 3.11 1.59 3.93* 1.46<0.001*<0.01
Comfort with giving policyadvice
4.34 1.48 4.47* 1.30 0.06 4.44 1.69 4.88* 1.75<0.01*<0.01
Choices reflect whatmatters
5.45 1.15 5.88 1.13 <0.05
Experiment 1Results

24
SNR
Skunkworks
0
0.1
0.2
0.3
0.4
0.5
Costs TechnicalIssues
SocialIssues
CulturalIssues
UnstructuredStructured
F
Experiment 1Results
25
SNR
Skunkworks
• Based on participants’ self-ratings and an analysis of deliberation periods, we conclude that the the structured approach leads to higher quality decisions.
• Arvai, J. L., R. Gregory, and T. McDaniels. 2001. Testing a structured decision approach: Value-focused thinking for deliberative risk communication. Risk Analysis, 21: 1065-1076.
Experiment 1Conclusions

26
SNR
Skunkworks
• Decision structuring to alleviate embedding in environmental valuation
– …when a good is assigned a higher value on its own vs. when it’s part of a more inclusive set.
• e.g., 5:1 differences in WTP for a single vs. a set of disaster preparedness services
Experiment 2Analyzing Choices
27
SNR
Skunkworks
• Providing much-needed structure may help to overcome the embedding problem by helping decision makers to think about the components of a valuation problem.
Experiment 2Analyzing Choices
28
SNR
Skunkworks
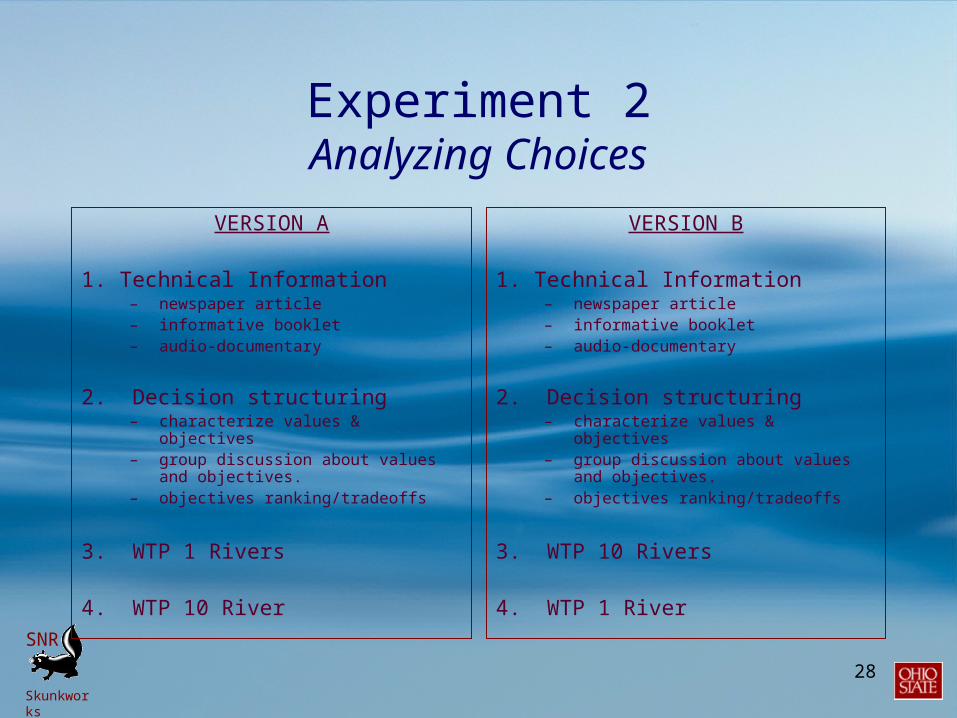
VERSION A
1. Technical Information– newspaper article– informative booklet– audio-documentary
2. Decision structuring– characterize values & objectives– group discussion about values and
objectives.– objectives ranking/tradeoffs
3. WTP 1 Rivers
4. WTP 10 River
VERSION B
1. Technical Information– newspaper article– informative booklet– audio-documentary
2. Decision structuring– characterize values & objectives– group discussion about values and
objectives.– objectives ranking/tradeoffs
3. WTP 10 Rivers
4. WTP 1 River
Experiment 2Analyzing Choices
29
SNR
Skunkworks
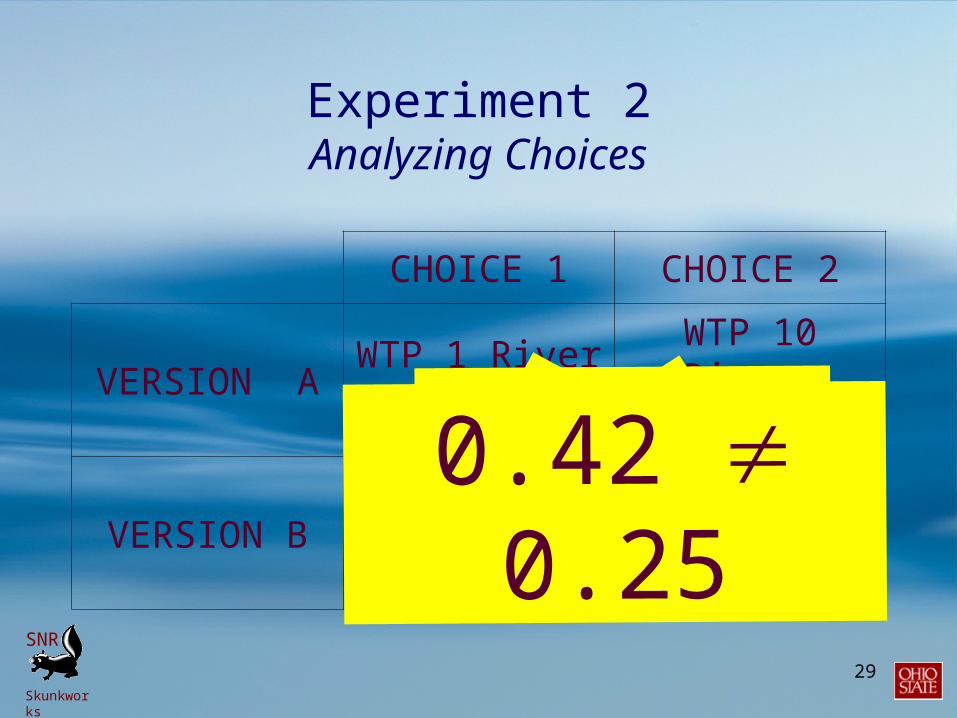
Experiment 2Analyzing Choices
CHOICE 1 CHOICE 2
VERSION AWTP 1 River
W
WTP 10 Rivers
X
VERSION BWTP 10 Rivers
Z
WTP 1 RiverY
W > YZ<XNo Embedding
W/X = Y/Z0.42 0.25

30
SNR
Skunkworks
• Based on participants’ mean WTP judgments, embedding was not alleviated (according to the ratio standard).
• McDaniels, T., R. Gregory, J. L. Arvai, and R. Chuenpagdee. 2003. Decision structuring as a means of alleviating embedding in environmental valuation. Ecological Economics, 44: 33-46.
Experiment 2Conclusions
31
SNR
Skunkworks
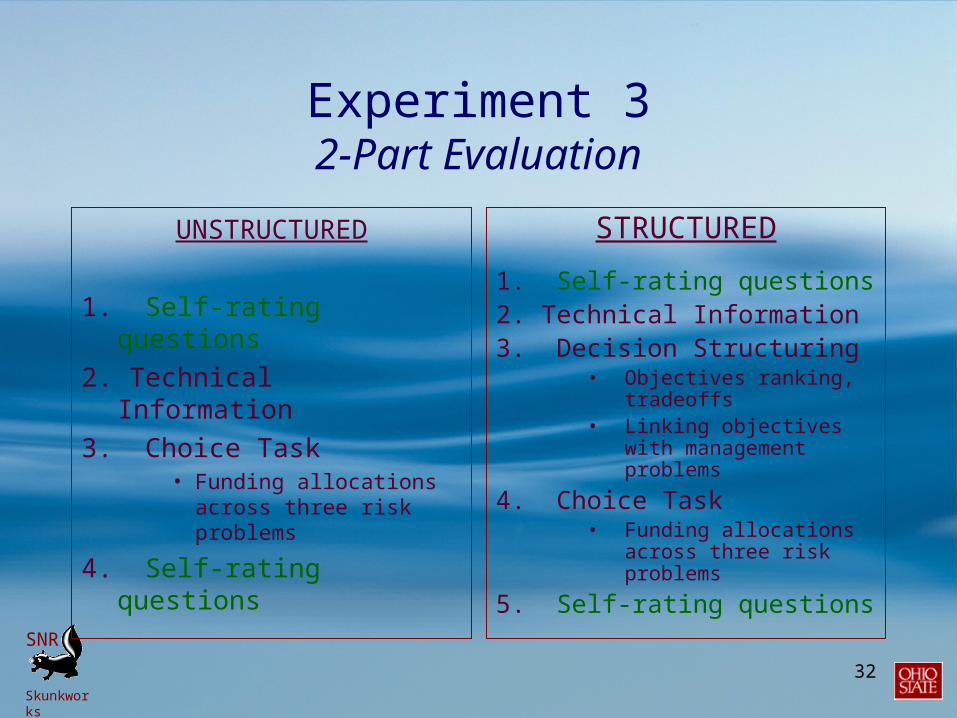
• An experiment that would measure both self-ratings of quality and subjects’ choices…
Experiment 32-Part Evaluation
32
SNR
Skunkworks
UNSTRUCTURED
1. Self-rating questions2. Technical Information3. Choice Task
• Funding allocations across three risk problems
4. Self-rating questions
STRUCTURED
1. Self-rating questions2. Technical Information3. Decision Structuring
• Objectives ranking, tradeoffs
• Linking objectives with management problems
4. Choice Task• Funding allocations
across three risk problems
5. Self-rating questions
Experiment 32-Part Evaluation
33
SNR
Skunkworks
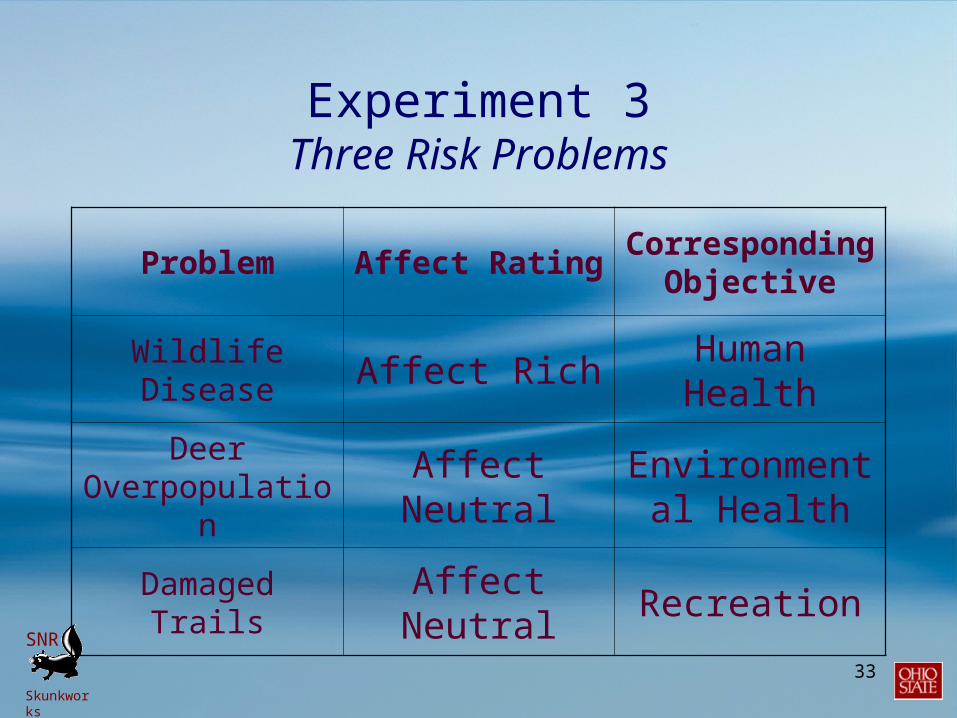
Problem Affect RatingCorresponding Objective
Wildlife Disease Affect Rich
Human Health
Deer Overpopulation
Affect Neutral
Environmental Health
Damaged TrailsAffect
NeutralRecreation
Experiment 3Three Risk Problems
34
SNR
Skunkworks
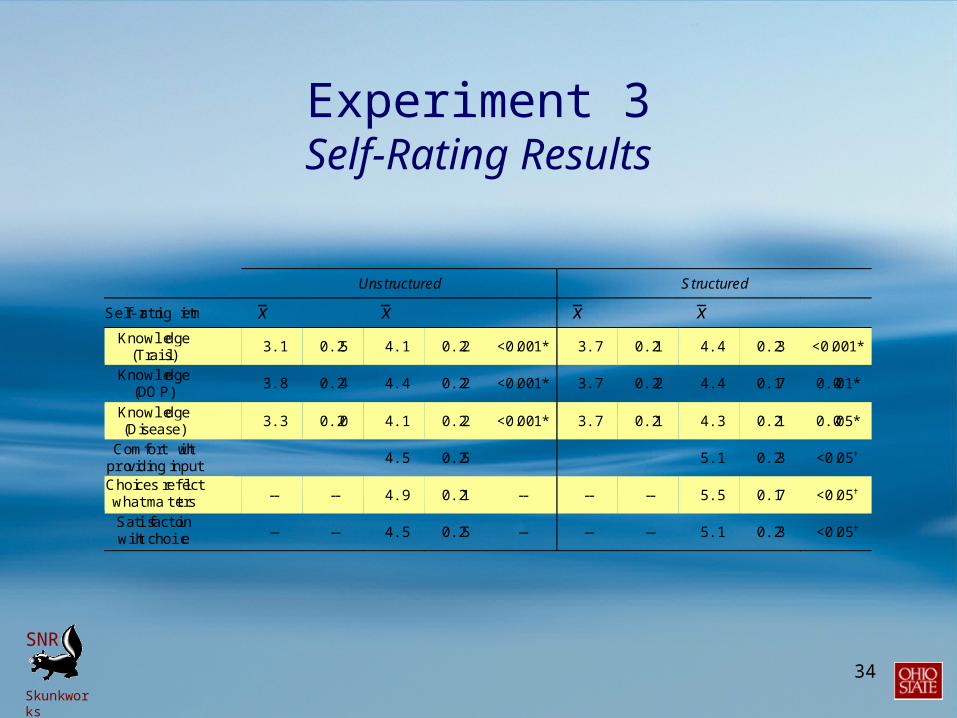
Unstructured Structured
Self-rating item
x Start SEStart
x End SEEnd p
x Start SEStart
x End SEEnd p
Knowledge(Trails)
3.1 0.25 4.1 0.22 <0.001* 3.7 0.21 4.4 0.23 <0.001*
Knowledge(DOP)
3.8 0.24 4.4 0.22 <0.001* 3.7 0.22 4.4 0.17 0.001*
Knowledge(Disease)
3.3 0.20 4.1 0.22 <0.001* 3.7 0.21 4.3 0.21 0.005*
Comfort withproviding input
4.5 0.25 5.1 0.23 <0.05
Choices reflectwhat matters -- -- 4.9 0.21 -- -- -- 5.5 0.17 <0.05
Satisfactionwith choice -- -- 4.5 0.25 -- -- -- 5.1 0.23 <0.05
Experiment 3Self-Rating Results

35
SNR
Skunkworks
OBJECTIVE RANK
Environmental Health 1
Human Health 2Recreation 3
Experiment 3Ranked Objectives
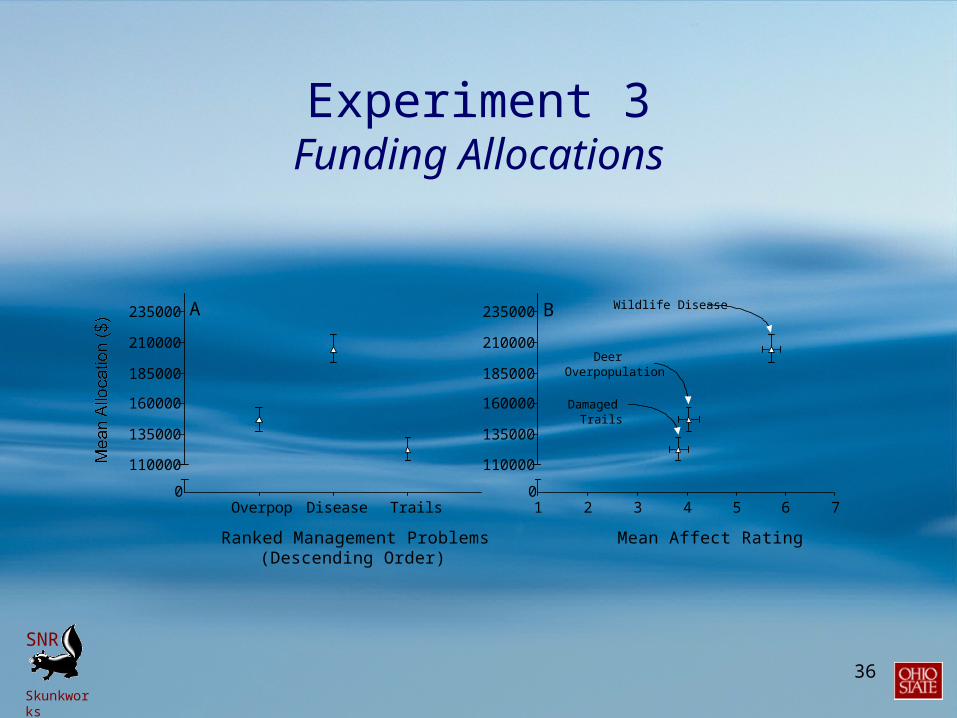
1=Overpopulation
2=Disease
3=Trails
36
SNR
Skunkworks
Overpop Disease Trails0
110000
135000
160000
185000
210000
235000 A
Ranked Management Problems(Descending Order)
1 2 3 4 5 6 70
110000
135000
160000
185000
210000
235000 B Wildlife Disease
DeerOverpopulation
DamagedTrails
Mean Affect Rating
Experiment 3Funding Allocations
37
SNR
Skunkworks
• Appears to be a disconnect between self-ratings of quality and actual funding choices
• Wilson, R.S. and J. L. Arvai. 2004. Evaluating the quality of structured risk management decisions. In Review.
Experiment 3Conclusions
38
SNR
Skunkworks
Parting Thoughts
• Level of facilitation, time for deliberation, increased attention to tradeoffs, etc. all seem to be critical.
39
SNR
Skunkworks
Parting Thoughts
• Anecdotal observations or evaluations based on self-reports alone are likely insufficient for evaluating the quality of structured decision approaches.
40
SNR
Skunkworks
Parting Thoughts
• Affective responses to stimuli exert powerful influences on risk judgments
41
SNR
Skunkworks
Parting Thoughts
• Not suggesting that the outcomes of all structured decision making approaches are suspect.
42
SNR
Skunkworks
Thanks
Tim McDanielsRobin Gregory
Ying ChuenpagdeeRobyn WilsonLouie RiversDan Ohlsen
SSHRCNSF
OARDCEPI