Embed Size (px)
Citation preview

CPIS 2007
So-Yeon Choi, MD., PhD.Department of Cardiology
Ajou University School of MedicineSuwon, Korea

CPIS 2007
Subsurface tomogramSurface imaging onlySubsurface
tomogramImages blood flowOther
Near-IR lightVisible lightUltrasoundX-rayType of radiation
0.140.80.7n/aProbe size (mm)
10-2010-5080-120100-200Resolution(µm)
OCTAngioscopyIVUSAngiography
The ideal coronary imaging technology would be capable of identifying not only vessel narrowing but also the characteristics of plaque hidden in the vessel walls.
Coronary Artery Imaging

CPIS 2007
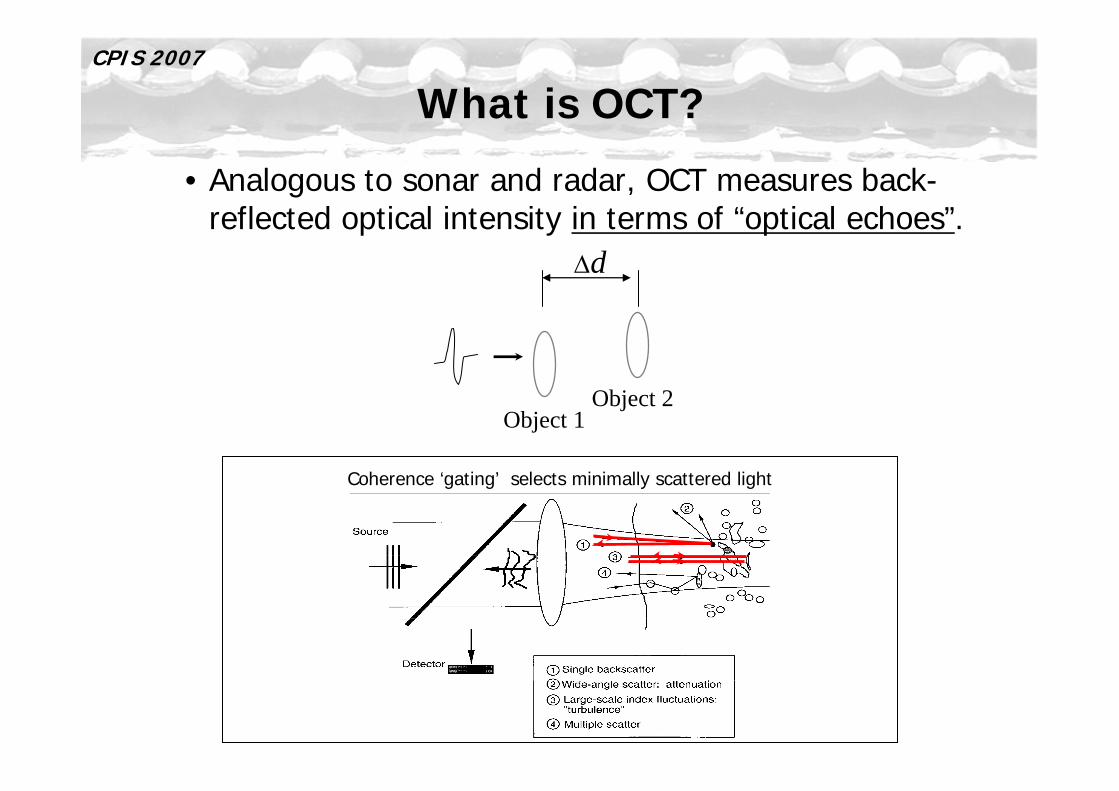
What is OCT?
• Optical Coherence Tomography (OCT) is a high-resolution imaging technology that employs near-infrared light (1.3 µM) to probe micrometer-scale structures inside biological tissues.
Near-infrared light0.77-3µm, biologically safeProperty of particle and wave
– Goes straightly– Reflection, refraction, interference, diffraction– Doppler effect
CPIS 2007
Coherence ‘gating’ selects minimally scattered light
What is OCT?
• Analogous to sonar and radar, OCT measures back-reflected optical intensity in terms of “optical echoes”.
∆d
Object 1Object 2

CPIS 2007
Interferometer splits broadband light from source into reference and sample beams.
A fraction of the light backscattered from the artery into the interferometer, where it mixes with a reference beam.
When the back-reflected optical intensity of the two arms is measured and compared, the optical properties of the tissue can be deduced.
Interferometer Schematic
OCT System: Interferometry
Source
Reference
Sample
Detector
Beam Splitter
To generation of OCT image, the key basic mechanism is interferometry.

CPIS 2007
Brief History of Development of OCT
• 1990-91 : Invention of OCT by Fujimoto (USA), Tanno (Japan)• 1996 : Exploratory in vitro studies by Brezinski et al in MIT and
MGH• 1996-99 : Validated the superior resolution compared to IVUS by
Weissman: In vivo imaging in animal (rabbit) by Fujimoto
• 2000 : First published clinical studies by Jang, Bouma, Tearney, Park et al. US, Korea
• 2002- : Commercialization phase: Clinical trials began by Grube, Serruys, William, Suzuki
• 2003 : CE-approved on Oct• 2006- : KFDA approved on Nov
: FDA and MHLW will approved

CPIS 2007
• Optical wavelength :1300 nm• Image acquisition rate :4-8 images /
sec• Catheter:3.0 F• Intermittent saline injection(8-10cc)• Resolution: Axial 10 μm, Transverse
25 μm• Data storage :Digital
OCT Imaging Systems
MGH OCT system LightLab system
• Optical wavelength :1280-1350 nm• Image acquisition rate : 15 images /
sec• Catheter:4.0 F, Image wire: 1.4F• Balloon occlusion with continuous
saline injection 0.5 ml/s • Resolution: Radial 15μm• Data storage :Digital

CPIS 2007
Comparison of IVUS and OCT
Dynamic range
Resolution
Frame rate
Size of imaging core40 - 60 dB 90 - 100 dB
100 - 150 mm(axial)(lateral) 150 - 300 mm
10 - 20 mm25 - 40 mm
30 frames/s 15 frames/s
0.8 mm 0.4 mm
Scan area 10 - 15 mm 7.0 mm
IVUS OCT
4 - 8 mmMax. depth of penetration 1 – 1.5 mm
Requires blood clearing
Blood clearingnot required

CPIS 2007
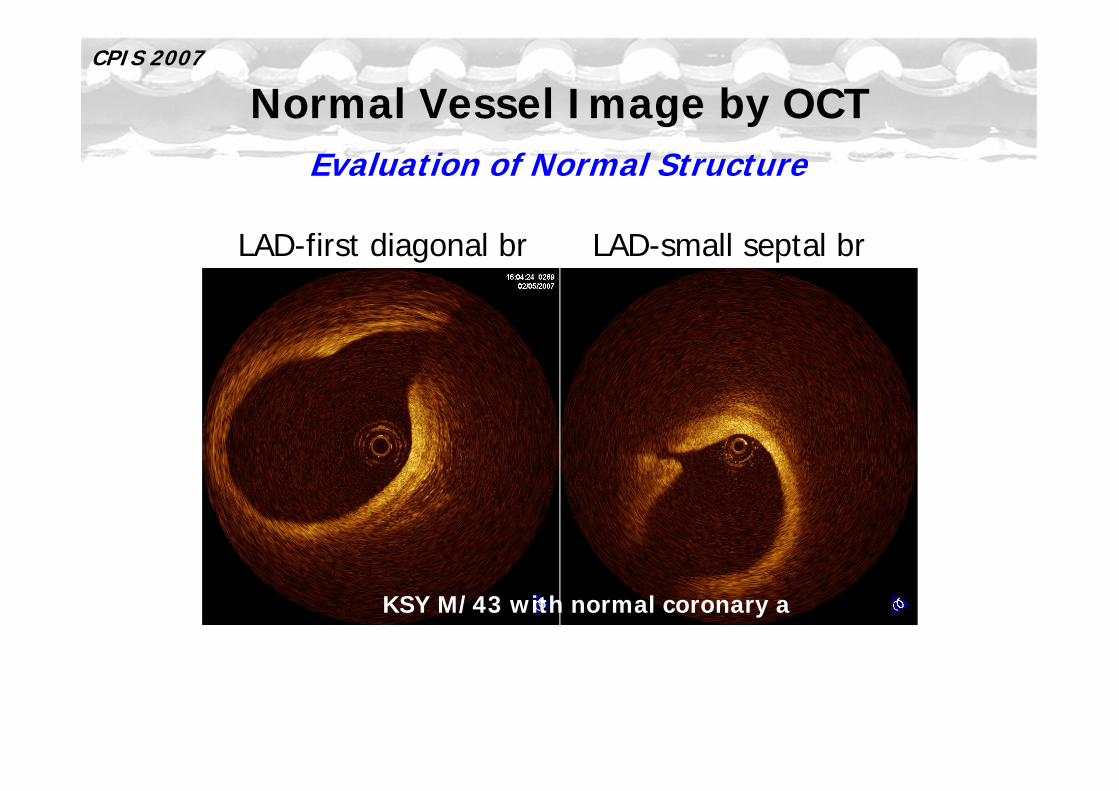
Normal Vessel Image by OCT
KSY M/43 with normal coronary a
Evaluation of Normal Structure
Comparison with IVUS
CPIS 2007
LAD-first diagonal br LAD-small septal br
Normal Vessel Image by OCTEvaluation of Normal Structure
KSY M/43 with normal coronary a

CPIS 2007
Plaque Characterization by OCT
Fibrous Lipid-rich Calcified
HomogenousSignal-rich
EcholucentDiffuse border
EcholucentSharp border
Presented by IK Jang in 2002 TCT
Ex Vivo Study

CPIS 2007
Plaque Characterization by OCT
0.970.810.940.92Lipid pool
0.950.10.10.95Calcific
0.960.880.970.87Fibrous
Negative predictive
value
Positive predictive
valueSpecificitySensitivity
H Yabushita, IK Jang, et al. Circulation. 2002;106:1640-45
Ex Vivo Study
Accuracy Statistics: Interobserver k=0.88, Intraobserver k=0.91

CPIS 2007
Thick-capped FibroatheromaHigh lipid content
Fibrotic intima
Histology courtesy of E. Mont and R. Virmani
Rim ofcalcium
Fibro-fattyplaque
Fibrous cap
Calcified Lesion
High lipid content
Thin fibrous capwith Ca beneath
Thin-capped Fibroatheroma
High lipidcontent
Fibro-fattyplaque
Mixed-composition PlaquePrevious Ruptures
Plaque Characterization by OCTEx Vivo Study

CPIS 2007
CalcifiedLipid-richFibrous• High reflectivity• Homogenous• Finely textured
• Low reflectivity• Homogenous• Diffuse margins
• Low reflectivity• Inhomogeneous• Sharp margins• Isolated, strongreflections in darkbackground
Plaque Characterization by OCTIn Vivo Experience
KSY M/43 SA LSJ F/62 UA CSW M/67 SA
CPIS 2007
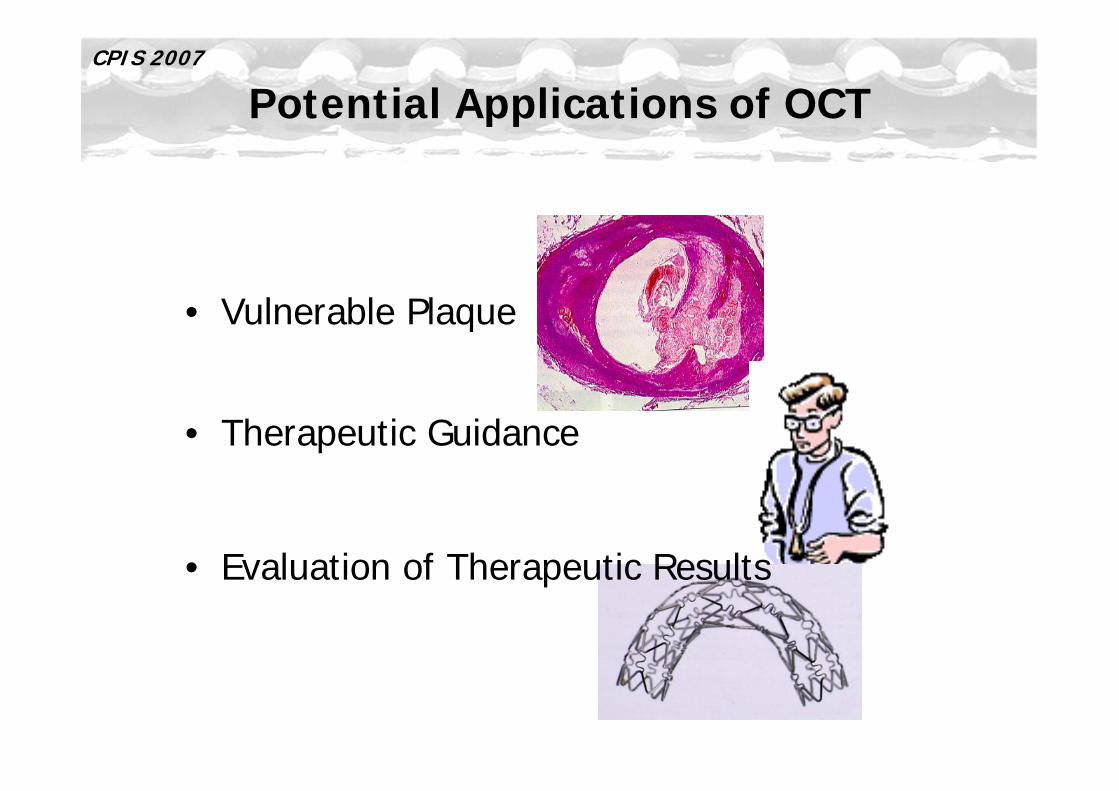
• Vulnerable Plaque
Potential Applications of OCT
• Therapeutic Guidance
• Evaluation of Therapeutic Results

CPIS 2007
Characteristics of Vulnerable Plaque
The most common type of vulnerable plaque characterized by thin fibrous cap, extensive macrophage infiltration, paucity of smooth muscle cells,
and large lipid core, without significant luminal narrowing.

CPIS 2007
Criteria for Defining Vulnerable Plaque
Major criteria• Active inflammation (monocyte/macrophage
and T-cell infiltration)
• Thin cap with large lipid core
• Endothelial denudation with superficial platelet aggregation
• Fissured plaque
• Stenosis 90%
Minor criteria• Superficial calcified nodule
• Glistening yellow
• Intraplaque hemorrhage
• Endothelial dysfunction
• Outward (positive) remodeling
Based on the autopsy study
Circulation. 2003;108:1664-1672
OCT

CPIS 2007
0% 10%
GJ Tearney, et al. Circulation 2003;107:113-9Briain D. MacNeill, et al. J Am Coll Cardiol 2004;44:972–9
Detection of VP in OCTMacrophage Accumulation
There was a high degree of positive correlation between OCT and histological measurements of fibrous MQ density r=0.84, p<0.0001.
OCT Image MQ Density

CPIS 2007
119 lipid rich plaques in 49 patients49 AMI; 46 ACS; 24 SAP
Detection of VP in OCTMacrophage Accumulation
The increases in both multi-focal and focal macrophage densities are highly correlated with symptom severity.
Briain D. MacNeill, et al. J Am Coll Cardiol 2004;44:972–9
Lipid-rich plaque was defined by lipid occupying 2 quadrants of the CSA

CPIS 2007
Thin-cap fibroatheroma was more frequently observed in patients with AMI
or ACS than SAP.
57 patients: 20 AMI, 20 ACS, 17 SAP
20
50
72
0
20
40
60
80
Thin-cap Fibroatheroma
CAS
ACS
AMI
IK Jang, et al. Circulation. 2005;111:1551-5
Detection of VP in OCTThin Fibrous Cap
Thin-cap fibroatheroma was defined by lipid-rich plaque with cap thickness 65 µm

CPIS 2007Detection of VP in OCT
Thrombus
Thrombus
Presented by Dr. Suzuki. Toyohashi Heart Center
OCT may allow us not only to estimate plaque morphology but also to distinguish thrombus from the plaque.

CPIS 2007
Intimal Tear
IK Jang, et al. Circulation. 2005;111:1551-5
Plaque rupture
Detection of VP in OCTSuperficial lesion of Plaque
PJK M/43 UA
In Ajou Hosp.

CPIS 2007
Imaging Modalities for Detection of VP

CPIS 2007
Preinterventional lesion assessmentAssessment of severity and clinical impactDetect Vulnerable Plaque
During interventionDevice sizingDecision of strategies for the lesionUnderstanding mechanism of interventionDecision of ending of predecureRecognition of complications
Serial follow-upUnderstanding for atherosclerosisMechanisms, prevention and Tx of restenosisAssessment for long-term complication
IVUS OCT
☺
☺☺☺
☺☺☺
☺
☺☺☺☺☺
☺☺☺
OCT and PCIAs a Tool for PCI

CPIS 2007
• Lesion assessment• Device sizing• Decision of strategies for the
lesion• Understanding mechanism of
intervention• Decision of ending of
predecure• Recognition of complications• F/U
Grey Scale Image for 2D and L-mode
OCT as a Tool for PCI

CPIS 2007
Presented by SuzukiToyohashi Heart Center, Japan
After Cutting Balloon After DCA
LJ. Diaz-Sandoval, IK Jang et al. Cath Cardio Interv. 2005:65:492-6
OCT as a Tool for PCIUnderstanding PCI Mechanism

CPIS 2007
Well-apposed stent Protrusion of thrombuswithin stent
Stent with irregularstrut distribution
LJ. Diaz-Sandoval, IK Jang et al. Cath Cardio Interv. 2005:65:492-6
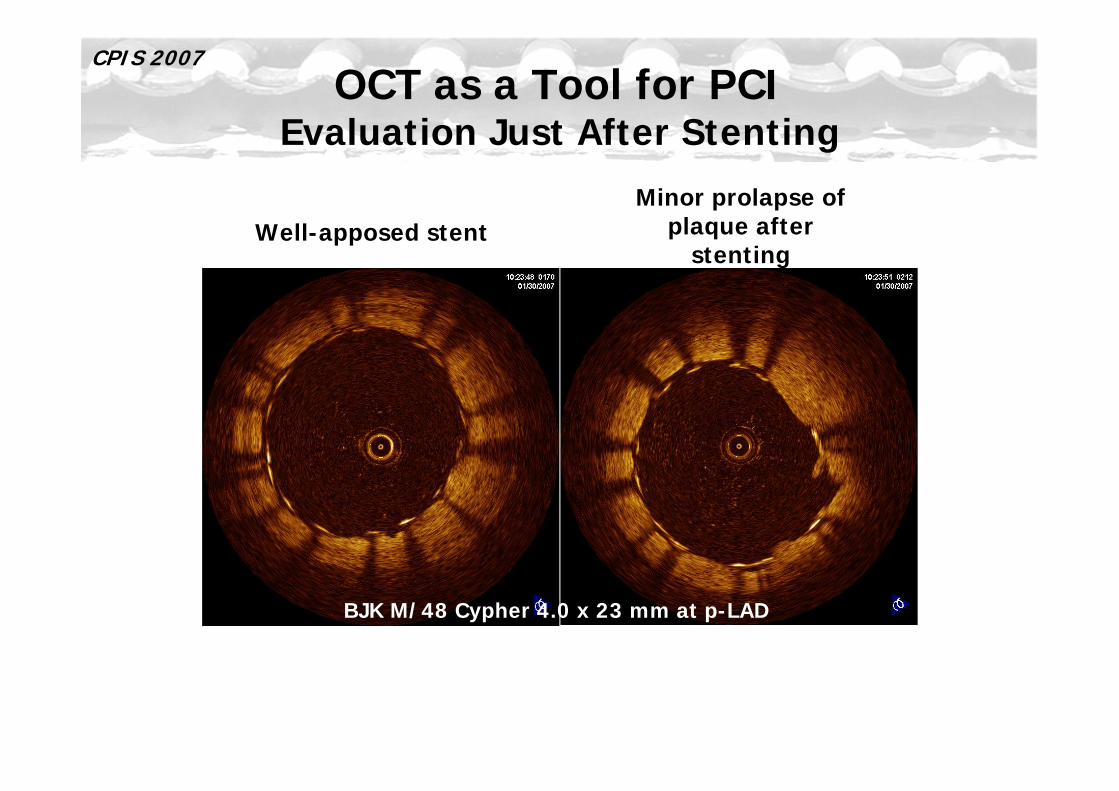
OCT as a Tool for PCIEvaluation Just After Stenting
CPIS 2007
Well-apposed stentMinor prolapse of
plaque after stenting
BJK M/48 Cypher 4.0 x 23 mm at p-LAD
OCT as a Tool for PCIEvaluation Just After Stenting

CPIS 2007Optical Coherence Tomography Findings at 5-Year
Follow-Up After Coronary Stent Implantation
E. Regar, PW. Serruys et al. Circulation. 2005;112:e345-6

CPIS 2007
Taxus I 19 month F/U (RCA)
By U.Gerckens, E. Grube, Herzzentrum Siegburg, Germany
~0.06mm
~0.45mm
BMS 19 month F/U (LAD)
Imaging of StentComparison DES vs BMS

CPIS 2007Imaging of Stent
F/U after Crushing with DESs in Bifurcation
KKN F/61: 1yr f/u for crushing with two Cypher stents at LAD-D1
AABB
CC
DD EE
BB
CC
AA
DD
EE

CPIS 2007
Limitation of OCT
1. OCT imaging is attenuated by blood and needs to create blood free zone.
2. Penetration through the arterial wall is in the range of 2–3 mm. The entire plaque cannot be imaged and only superficial anatomic information is obtained.
3. OCT has no functional (physiologic) information like other intraluminal imaging.
Approaches to overcome this limitation are saline flushes, balloon occlusion, and index matching.
Fluid loading and transient ischemia or balloon injury are other problems.

CPIS 2007
ElastographyPlaque stiffnessMechanical
DopplerFlow disturbancesCFR, FFR
Physiological
SpectroscopyPolarization
Lipid, collagen, proteoglycans, calcium
Biochemical composition
Backscatter/ Gray Scale
Lesion sizeLesion shape% stenosisCap thickness
Morphological
Toward complete lesion characterization with OCT
Currently Evolving OCT
The design of delivery catheters with improved blood-clearing efficiency continues to evolve. New platform modality and combine with other modality are also promising.

CPIS 2007
Take Home Massages
• OCT could be conducted safely in cath Lab.
• OCT has a high resolution, it could assess the tissue characterization more accurately than IVUS. OCT has a potential benefit to identify vulnerable plaques.
• OCT also provides superficial information of the vessel during and after PCI.
• OCT has major limitations in need of blood clear zone and low penetrating depth.
• Evolving OCT image moves closer to becoming a powerful diagnostic tool that will provide new insights into the etiology and treatment of coronary artery disease.


![ACS AMI [PLA Composites]](https://img.pdfslide.net/doc/110x75/58793f351a28ab23468b5d4d/acs-ami-pla-composites.jpg)