Embed Size (px)
Citation preview

Case Study: Quantifying Healthcare Industry Adverse
Disruptors
By: Alexander Dewhirst, Chuwen Li, Samual Pfeffer, Cheng Shi
Advisor: Russell Lyons
Indiana University
Department of Mathematics
April 2016
1
Content
I.Executive Summary 2
II.Purpose and Background 3
III.Data 4
1. Lead Exposure
2. Cost of Treatment
3. Financial Report
IV.Methods, Analysis and Models 7
1. Lead Exposure
2. Cost of Treatment
3. Financial Report
V.Conclusion 10
VI.Appendix 11
VII.Reference 18

2
I.Executive Summary
Our goal, as actuary consultants hired to quantify healthcare industry disrupters, is to obtain
reliable projections of expected benefit costs and minimizing losses within a five-year time
horizon. To successfully minimize losses, we consider short and long term procedures resulting
from long term lead exposure. Our disruptors cover three of the major categories, outpatient
services, pharmaceuticals, and physician services: The disruptors include blood tests and post
therapy check-ups, appointments with primary physicians due to observed symptoms of lead
poisoning, and medication prescribed due to lead poisoning. Our paper focuses specifically on
increasing levels of lead exposure among children in Flint, Michigan and our medications target
the use of chelation therapy, a medication which is regarded as unsafe for children. Currently, there
are no treatments for children which have fewer side effects and are less harmful. Our analysis of
increasing observed claim costs resulting from increased lead exposure provide accurate models
and statistical methods, an explicit definition of our disruptors and analyze the effect each has on
their respective medical services.
The Flint Michigan water crisis is a lead contamination crisis that occurred due to a change
in the water source where there was failure to apply corrosion inhibitors. The original water source,
from the Detroit Water and Sewerage Department water, at Lake Huron was changed to the Flint
River water source creating a health emergency. Corrosion of the pipes, caused by corrosive water,
elevated the lead content supplied to the residents of Flint. Our statistical models determine trends
linked with lead exposure among the residents of Flint, controlled by trends of the general
population of the United States. First, there are strong trends of increased lead exposure and the
source of water in Flint. Children are much more susceptible to the negative health effects in
comparison to adults, in part by the development of the central nervous system, which is the where
the strongest impact from lead exposure occurs. Socioeconomic class and residence location were
significantly correlated with increased blood lead levels as well. The data did not, however, show
a significant relationship between kidney transplant percentages and increased lead exposure. Then
we develop several extensions to our basic models to provide more accurate information to
alleviate future error when such an event occurs.
Our analyses provided a few suggestions for a five year outlook of the insurance company.
We suggest to adjust insurance benefits related to the MIChild and Healthy Kids Medicaid plans,
in order to decrease the risk of unpredictable costs associated with chelation therapy. This would
also provide a cost minimizing method after analyzing the impact of the Flint water crisis. The
plan adjustment we find to be the most effective, is to have a ceiling on the number of chelation
therapy medications under universal coverage. Then provide another insurance plan, as a result of
the crisis in Flint, which would allow for further therapy at a higher cost. Long term lead exposure
in children leads to suspended or disrupted development of the central nervous system, thus leading
to increased health risks and higher healthcare costs.
We also suggest that the company determines strategies to better manage their assets in
order to decrease variation in the value of the company and increase their coverage capabilities.
This would provide more incentive to stockholders to invest further into the company.

3
II. Purpose and Background
This topic, the correlation between lead exposure rates among children and an atypical utilization
of medications associated with chelation therapy was chosen due to the increase in younger
patients in the recent crisis in Flint, Michigan. The events that transpired in Flint have adversely
affected our thoughts on health coverage and ways in which benefits should be given to the
residents, introduced new concepts of consideration to health care providers, and raised awareness
to the short and long term effects of lead exposure. The crisis raises many new questions in the
health industry because of increased costs and a high level of variability. Also, the responsibility
of the state government and the efforts put in place to eliminate the source of lead and to fix the
pipes is controversial since the costs are too high to maintain budget. Consequently, there have
been increased hospital and insurance costs caused by the unexpected crisis and we wish to
determine a cost minimizing strategy to care for patients of lead exposure as well as plan for similar
future events. Cost minimizing strategies are strongly dependent on how much the insurance
company or government will manage the costs involved.
Lead exposure has numerous harmful effects, ranging from less critical to more chronic,
threatening emergencies. The use of lead in gasoline between the 1920s and 1980s became
problematic during the later years when researchers discovered connections of health effects due
to lead. Since then, lead exposure across the United States has drastically reduced. During the
1970s and into the 1980s awareness regarding the negative health effects associated with lead
began to spread globally, resulting in an 80% decline in gasoline lead levels and leading to a
reformation of lead limit regulation to just 1.1 grams per leaded gallon (Newell & Rogers, 3-4).
Research on the effects of lead correlating to a range of variables and demographics created
more questions than answers. However, studies found consistent trends in blood lead levels
following the decline in the use of leaded gasoline. Average blood lead levels (BLLs) steadily
decreased from 16 micrograms per deciliter (µg/dL) in 1976 to 10 µg/dL in 1980 (Figure 1).
Studies also concluded that children were adversely affected in comparison to adults and due to
concern, more studies on children were performed. As early as 1979, a conclusive study found that
verbal IQ scores were directly correlated with lead levels. In Figure 2, a study found that verbal
IQ scores among children with high tooth lead levels displayed lower results in comparison to
children with low tooth lead levels. Such studies continued, determining trends among different
variables related to demographics, specifically IQ scores and socioeconomic class among children
(Figure 3, Figure 4). Consistency among lead exposure and health effects gave rise to further
questions, such as the intensity of health effects among different populations and lead treatments
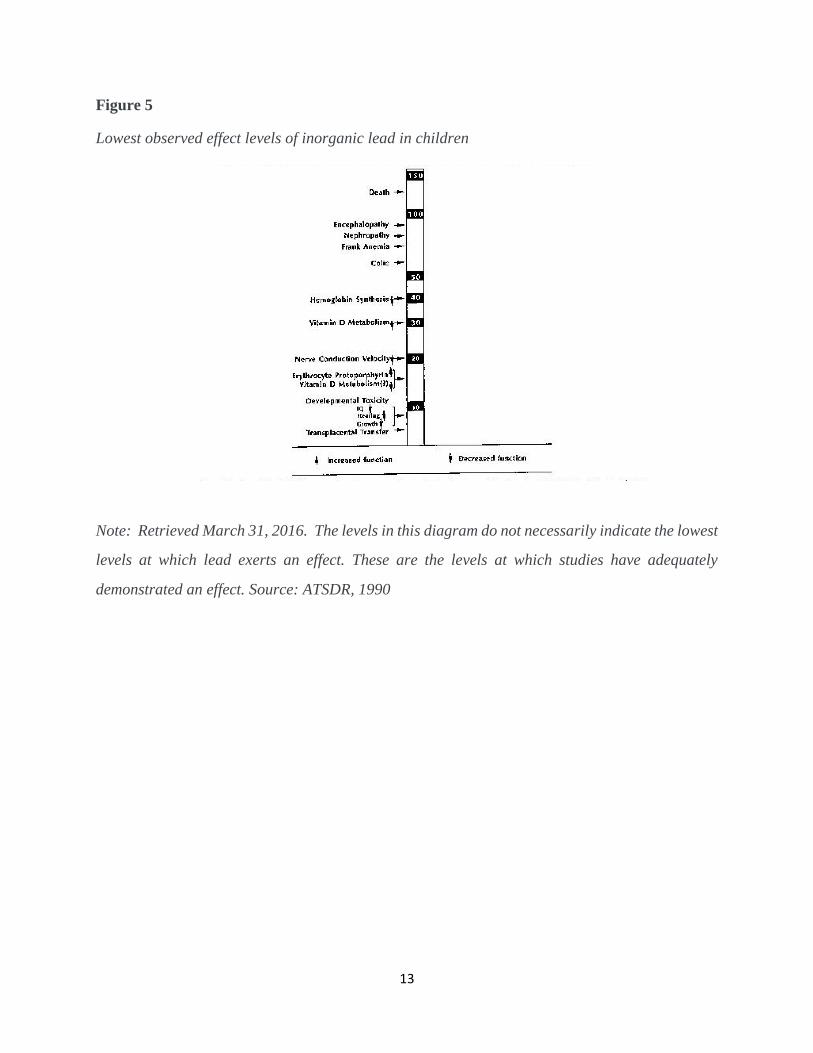
in relation to source of lead exposure and demographics. An informative resource (Figure 5)
displays the lowest observed effects of inorganic lead in children. As low as 10 µg/dL BLL,
children are affected by a decrease in IQ, hearing, and growth. Between 10 - 130 µg/dL there are
numerous consequences to the well-being of children, until finally resulting in death (Figure 5).
More recent findings [7, p. 795] show staggering trends in lead exposure in children. As
early as the third trimester of pregnancy, mothers with increased lead concentrations may present
complications in the central nervous system of the child. Also, the development of the central
nervous system in the third term is also vastly different than that of a fetus with little to no lead
exposure. As noted, brain development is staggered as early as during pregnancy and further lead
exposure creates more complications throughout childhood (Schnaas, Rothenberg, Flores,
Martinez, Hernandez, Osoria, Velasco & Perroni, 795). Also, the demographics in relation to lead

4
exposure display more trends, non-Hispanic blacks consistently showed increased levels of lead
exposure throughout the United States. These increased BLLs are a result of low socioeconomic
status, a significant risk factor for multiple reasons. Primarily, it is the result of living in homes
built before 1946, since such homes contain lead paint and piping. A similar trend was examined
in 1973, when homes built subsequent, again, have reduced BLLs since lead paint stopped being
used.
III. Data
Our methods of analysis are divided into three parts: the distribution of lead exposure among
children including demography and percentage, cost of lead exposure treatment and trend analysis
of the financial report. We select data from different organizations, government to research lab.
All the data will be distributed into the above three parts of our analysis.
1 Lead Exposure
Lead exposure distribution data comes from an academic article of the lead exposure study
reviewed and approved by Hurley Medical Center institutional review board. The study includes
all Children who are under 5 years old and had a BLL test through the Hurley Medical Center’s
laboratory. Hurley Medical center originally collected data from Epic electronic medical record
system after approved by the Hurley Medical Center institutional review board and subject to the
Health Insurance Portability and Accountability Act waiver (Hanna-Attisha, 2016, P284). The
database includes blood lead level, the medical record number, birth date, phlebotomy data, full
address, gender and race per patient (Hanna-Attisha, 2016, P284). The time period from the data
before the Flint water crisis was from January 1, 2013 to September 15, 2013 and after was January
1, 2015 to September 15, 2015. The total number of observations is 3,675, which consists of 1,473
children (pre-time children 736, post-time children 737) living within the city of Flint and 2,202
children (pre-time children 1210, post-time children 992) living outside. Hurley Medical center
performed data analysis relying on the given data set. The analysis and results will be discussed in
the Methods, Analysis and Models section.
In contemplation of providing visual results, we also select data from Michigan Department
of Health and Human Services. The database contains percentages of Children under 6 with
elevated blood lead levels in state of Michigan, specifically Genesee county and the city of Flint
from 1998 to 2016. Percentages of children under 6 with elevated blood lead levels in Flint are
categorized into above 5 µg/dL and above 10 µg/dL. In the Methods, Analysis and Models section,
we will illustrate the line chart constructed.
The essential focus of the Hurley Medical Center paper is lead exposure of children
associated with drinking tap water in Flint. As we introduced in the background of the Executive
Summary section, our core analysis addresses to Flint Michigan water crisis. According to media
reports, the direct influence of the Flint, Michigan water crisis is poisoned drinking water
consisting of a excessive levels of lead (CNN, April 04, 2016). As opposed to other sources,

5
excessive levels of lead has detrimental effects to children and pregnant mothers (Hanna-Attisha,
2016, P284). Our study is to evaluate the effects of Flint, Michigan water crisis on healthcare and
financial reports of the company for children below 6 years old. Hence, Hurley Medical Center
paper contributes favorable conditions to benefit our analysis. In addition, we also selected data
from Michigan Department of Health and Human Services. The data is collected annually by the
government and presents more reliable data for our analysis.
In favor of gathering appropriate data to determine the distribution of lead exposure of
children below 6 years old in Flint, Michigan, we start to search key word in government database.
Even though government database include abundant data of children lead exposure, all data are
scattered, and some of the data are even uncompleted. As a consulting team, it is paramount for us
to perform analysis and present the efficient solutions to the CEO. Therefore, we adjust our
concentration on mature data rather than row data. We search key word through academia website
and finally select data from Hurley Medical center. The database is cleaned and error-free with
official approval from the academia and government. However, Hurley Medical center database
only contains data of year 2013 and year 2015. The lack of updated data will weaken our prediction
of a 5-year period starting in 2014. Our team additionally select data from Michigan Department
of Health and Human Service. Compared with other government database, our chosen database is
more organized.
Thus, two databases of lead exposure are prepared and ready for modeling and analysis.
We will provide discussion of our methods and analysis of modeling in the section IV.
2 Cost of Treatment
The costs incurred by a health insurance company begins when the insured health care recipient
begins the diagnosis process. In order to properly understand a child’s degree of lead exposure a
blood lead analysis must be conducted by a qualified healthcare professional. According to data
supplied by Fair Health Consumer the baseline cost a blood test specifically looking for blood lead
composition is $29.99. Based on the results of the blood test the doctor will determine if Chelation
Therapy is a necessary treatment. If the doctor sees Chelation Therapy to be a practical form of
treatment than two more expenses will have to be incurred by the health insurance company. The
primary expense associated with Chelation Therapy is the Chelation solution. Fortunately,
Chelation therapy is a relatively inexpensive outpatient procedure. For most cases in Flint, EDTA
will be the only necessary solution administered for any chelation process due to the fact that there
has not been any document cases of a child diagnosed with a blood lead level of 75 micrograms
per deciliter or greater. According to the CDC only cases involving blood level of 75 microgram
per deciliter or greater should receive a combination of EDTA and BAl solution. Therefore, we
will only focus on the cost of Chelation Therapy that includes EDTA. The cost of treatments
consisting of only EDTA based solutions cost anywhere from $75 to $125 dollars per treatment.
However, for the calculations in our financial report we will be using the average of the two
estimates. The number of treatments varies based on the initial blood lead level and the individual’s
response to treatment. The frequency of treatment however must be kept within 5 to 7 days apart.
To determine the quality of the child’s response to Chelation, a urine analysis must be conducted
after each treatment to detect potential lead contained in the urine. The cost of each urine analysis
quoted from hospitals within Flint, Michigan are priced at $15.00. Furthermore, from the urine

6
analysis results the doctor is better able to evaluate the amount of treatments a child will need in
order to decrease their blood lead level to a safe state. Finally, after treatment is complete a child
must undergo a follow up examination that consists of a blood lead test. In sum, an insurance
company is responsible for two fixed costs which consists of blood lead tests and two variable
costs which consist of the varying number of EDTA infusions and urine analysis.
3 Financial Report
Financial report data comes from Aetna, which is an American insurance management company.
Aetna posts their financial report every year containing company’s activities and financial
performance. We extract data including the consolidated balance sheet (Figure 6) and the
consolidated income statement (Figure 7) from 2010 to 2014. The consolidated balance sheet
presents the assets and liabilities of a parent company and all its subsidiaries, with no distinctions
on which items belong to which companies. To provide a larger background picture to benefit our
analysis, a consolidated income statement which combines revenue, expenses, and income of the
parent companies and their respective subsidiaries of the entire corporation is used. We do not
consider money owed between companies that are a part of the consolidated income statement.
Values in the statement are in the thousands.
In 2014, Department of Insurance and Financial Services in the State of Michigan
published an authorized insurance company list. The listed companies are authorized by the
Department of Insurance and Financial Services to write Major Medical Health insurance in
Michigan. Our target company search database to support our analysis and provide a financial
report is from this list. Figure 8 lists top 10 health insurance and managed health care companies
in the United States. Aetna and Humana are the two companies appearing on both the authorized
insurance company list and the top 10 insurance company list. These two lists provide sufficient
support that Aetna and Humana are more adapted and more authorized in Michigan. Aetna is more
familiar to us because Indiana University provides Aetna health insurance to international students.
Hence, we select Aetna to be our exemplar for our financial report. Since the assessment of Aetna
includes numerous transactions, we have large amounts of data to predict the future costs and
decrease overall loss.
Compared with financial reports of non-insurance companies, Aetna provides its finance
report in a different form. For example, non-insurance companies do not have health care costs
payable and reinsurance recoverables in their respective consolidated balance sheet. However,
health care costs payable and reinsurance recoverables are essential entries for Aetna in their
consolidated balance sheet. Therefore, it requires us to understand the difference of financial
reports between non-insurance companies and insurance companies so that we are able to make
more precise analyses and predictions.
The financial report of Aetna has some disadvantages. For example, the trend of net income
is highly unstable and may affect our analysis and prediction as a result. We will explain the effects
of an unstable trend later on. Before making a prediction, we must perform several reasonable
adjustments to the financial reports. For example, the variation of net income through each year is
very unpredictable, so we estimate the variation of net income to better our future analysis.
The database of financial report is prepared and ready for modeling and analysis. We will
provide a discussion of our methods and analyses of modeling in section IV.
7
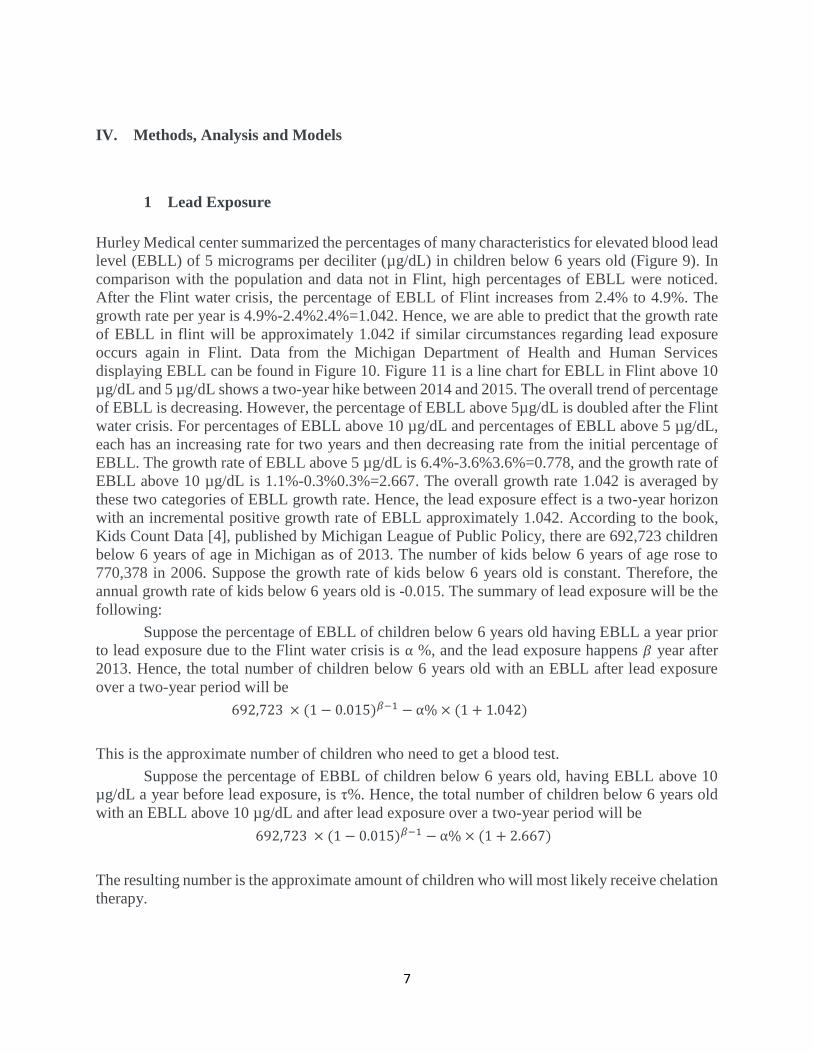
IV. Methods, Analysis and Models
1 Lead Exposure
Hurley Medical center summarized the percentages of many characteristics for elevated blood lead
level (EBLL) of 5 micrograms per deciliter (µg/dL) in children below 6 years old (Figure 9). In
comparison with the population and data not in Flint, high percentages of EBLL were noticed.
After the Flint water crisis, the percentage of EBLL of Flint increases from 2.4% to 4.9%. The
growth rate per year is 4.9%-2.4%2.4%=1.042. Hence, we are able to predict that the growth rate
of EBLL in flint will be approximately 1.042 if similar circumstances regarding lead exposure
occurs again in Flint. Data from the Michigan Department of Health and Human Services
displaying EBLL can be found in Figure 10. Figure 11 is a line chart for EBLL in Flint above 10
µg/dL and 5 µg/dL shows a two-year hike between 2014 and 2015. The overall trend of percentage
of EBLL is decreasing. However, the percentage of EBLL above 5µg/dL is doubled after the Flint
water crisis. For percentages of EBLL above 10 µg/dL and percentages of EBLL above 5 µg/dL,
each has an increasing rate for two years and then decreasing rate from the initial percentage of
EBLL. The growth rate of EBLL above 5 µg/dL is 6.4%-3.6%3.6%=0.778, and the growth rate of
EBLL above 10 µg/dL is 1.1%-0.3%0.3%=2.667. The overall growth rate 1.042 is averaged by
these two categories of EBLL growth rate. Hence, the lead exposure effect is a two-year horizon
with an incremental positive growth rate of EBLL approximately 1.042. According to the book,
Kids Count Data [4], published by Michigan League of Public Policy, there are 692,723 children
below 6 years of age in Michigan as of 2013. The number of kids below 6 years of age rose to
770,378 in 2006. Suppose the growth rate of kids below 6 years old is constant. Therefore, the
annual growth rate of kids below 6 years old is -0.015. The summary of lead exposure will be the
following:
Suppose the percentage of EBLL of children below 6 years old having EBLL a year prior
to lead exposure due to the Flint water crisis is α %, and the lead exposure happens 𝛽 year after
2013. Hence, the total number of children below 6 years old with an EBLL after lead exposure
over a two-year period will be
692,723 × (1 − 0.015)𝛽−1 − α% × (1 + 1.042)
This is the approximate number of children who need to get a blood test.
Suppose the percentage of EBBL of children below 6 years old, having EBLL above 10
µg/dL a year before lead exposure, is τ%. Hence, the total number of children below 6 years old
with an EBLL above 10 µg/dL and after lead exposure over a two-year period will be
692,723 × (1 − 0.015)𝛽−1 − α% × (1 + 2.667)
The resulting number is the approximate amount of children who will most likely receive chelation
therapy.

8
2 Cost of Treatment
Demographically, the portion of Flint’s population that is below the poverty line is 42.8%.
According to a study conducted by Dr. Mona Hannah-Attisha, areas with high poverty ratings also
experienced the greatest increase in documented lead poisoning cases. Displayed within two
charts, Dr. Mona Hannah-Attisha shows a connection between poverty and areas of varying water
lead levels as well as a connection between rate of increase in reported lead poisoning cases and
water lead levels. Based on the transitivity of these two connections it is clear that the areas that
experienced the most document lead poisoning cases were also areas where socioeconomic classes
were at Flint’s lowest levels. Dr. Mona Hannah-Attisha’s method was executed by giving areas
with low water lead levels, high water lead levels, and areas outside of Flint a socioeconomic
disadvantage score. From there she was able to document a connection between poverty and
reported lead poisoning cases. Our assumption based on these charts is grounds, we believe, for
the total cost to be incurred to the insurance company per lead poisoning case. This is due to two
major government sponsored health insurance programs in Michigan. MICHILD and Healthy kids
are health insurance programs for children 19 years and younger that grant full coverage without
co-pays for qualifying families. Qualification depends primarily on income. Therefore, many of
the kids who are documented having lead poisoning are subject to low income families and are
likely covered by either of these government sponsored plans. So, within our financial report are
figures are implications of low income children having complete coverage.
3 Financial Report
Our financial report analyses are to predict the costs of chelation therapy to the insurance company
over the next five years. First, we assume the costs of blood test for lead poisoning in inpatient
services and chelation therapy in 2018 and 2019 are insignificant. Second, we also assume the net
income growth rate fluctuates within a 95 percent confidence interval. Third, to calculate our
projections, we used averages from the previous five years for prediction in our analyses. The cash
and equivalents and the short term debt rows in our data to balance the total asset to equal the total
liabilities and stockholders’ equity. Lastly, we assume that the population of patients due to lead
poisoning remain in Flint. Our assumptions allow us to analyze the costs of the next five years and
how the disrupter effects the financial report by narrowing the insignificant, or irrelevant, factors.
These factors are whether people move to and from Flint, the obscurity in data involving the
success rate of chelation therapy, and the insurance company strategies involved with the Flint
water crisis.
We must first calculate the net income growth rates based on the data of past five years
from 2010-2014. To calculate the net income growth rate we use the formula, Next Year Net Income−Previous Year Net Income
Previous Year Net Income × 100% and the previous net income growth rates are
as follows:

9
Each net income growth rates is positive, with the exception of 2012, and this indicates
that the insurance company net income is increasing overall. The mean of the growth rate is 4.53%,
and the standard deviation of growth rate is 14.38%. The 95% confidence interval is (-23.640%,
32.709%). Thus, we are able to estimate the next five year net income growth rate by using the
confidence interval:
The confidence interval is really wide, therefore our prediction of new income growth rate is less
accurate.
The historical operating ratios are calculated by each entry divided by the net income in
each year and provide the percentage of each entry with respect to net income. The average
historical operating ratio for each entry and use the average historical operating ratio are used to
predict the operating ratios for next five years. In order to predict the net income for the next five
years using the actual 2014 date and the predicted net income growth rate, the data suggests that:
All other entries are predicted by the predicted net income and forecasting operating ratios.
The predicted liquidity measurement ratios (i.e. current ratios) and leverage ratios (i.e. debt to
equity ratios):
The formula of the current ratio is Current Assets
Current Liabilities. The formula of debt to equity ratio is
Total Liabilities
Shareholders′ Equity. The predicted current ratio increases every year, so we are able to conclude the
company has strong ability to pay off its short-term debt. The predicted debt to equity ratio
decreases every year, so we can conclude that the company is less risky to file for bankruptcy.
The total Flint population is 99,000. Based on the population demographic of 2012, the
population of children below 6 years old is approximately 7740, the number of children who need
to take blood test of lead poisoning. The population of children who need to receive chelation
therapy is approximately 200, found using the increment of the percentage of children with an
EBLL (3, P4). The cost of a blood test from lead poisoning is $29.99, and the cost for chelation
therapy is $2000 per month. The total cost of a blood test in Flint is $29.99×7740=$232122.6, and
the annual total cost of chelation therapy is $2000×12200=$4800000. Hence, the total cost is
$4800000+$232122.6=5032123 for 2015 and 2016. The success rate of chelation therapy is 0.89.

10
We assume only 200× (1-0.89) = 22 children will receive chelation therapy in 2017, and no child
needs to get a blood test. The overall costs of lead exposure for the insurance company in the next
5 years are:
The net income increases each year and the costs incurred from lead exposure decreases over time.
V. Conclusion
In our research, we are able to come to a few conclusions. The data we analyzed provided
significant insight into the financial impact this insurance agency would incur following the lead
exposure and water crisis in Flint, Michigan. From our lead exposure analysis, we conclude that
an increasingly large portion of people move from Flint, however the percentage of children with
EBLL increases. This suggests that there more cases of lead poisoning that may be undiagnosed,
which causes long-term health care impacts that would require further investigation. The insurance
agency may consider an increased budget associated with more long-term health care implications
caused by lead exposure. Such implications may be further use of chelation therapy and the costs
of chelation therapy would likely be higher due to a lack of intellectual development in children.
The insurance company would likely be required to maintain a larger amount of consistent costs.
We suggest adjusting benefits associated with chelation therapy from their MIChild and Healthy
Kids Medicaid insurance plans, as it is an inconsistent, unreliable treatment compared to other
therapies. The variable cost of the number of treatments a child receives should either have a
ceiling with an explicit number treatments a child can receive while also being covered by
insurance. We consider the possibility of pairing the previous insurance plan with a ceiling on the
number of treatments paired with another plan if higher risk patients require further medical
attention. These higher risk patients are more likely to have long term health effects, in which the
paired insurance plan would help to pay off. These costs are from the medical services associated
with long term health effects due to lead exposure, since this plan would cost more.
Based on our calculations within our financial report, we discovered an issue with the insurance
company's liquidity ratio. The liquidity ratio is between 1.5 and 2.0 and indicates the company has
short-term financial strength. However, from a long-term perspective, the insurance company is
unfortunately not using its current assets sufficiently and managing its capital very well. If the
company does not account for the increase in lead poisoning related treatments, then the insurance
company will face financial struggles down the road. Currently, very little capital is reserved for
claims related to lead poisoning treatments. In order to reduce company volatility, capital must be
allocate money more properly to account for the expected increase in lead poisoning treatments.
According to our distributions mentioned earlier, the insurance company can find justification
when determining how much money should be moved to cover lead tests, Chelation Therapy, and
urine analysis. Without an increase in such areas, the company will continue to leverage long term
costs with short term capital thereby exacerbating its already fragile financial state.

11
VI. Appendix
Figure 1
Change in blood levels in relation to a decline in use of leaded gasoline, 1976-1980
Note: Retrieved March 31, 2016.
Source: Annest JL, 1998
Figure 2
Cumulative frequency distribution of verbal IQ scores in children with high and low tooth lead
levels
Note: Retrieved March 31, 2016.
Source: Needleman et al., 1979

12
Figure 3
Blood lead levels and IQ scores of children, from cross-sectional and retrospective cohort studies
Note: Data from prospective studies are not included. Retrieved March 31, 2016.
Figure 4
Relationship between children’s blood lead levels and housing age and condition, Cincinnati
Note: Number of children at 18 months of age indicated in parentheses. Retrieved March 31, 2016.
Source: Clark et al., 1985.
13
Figure 5
Lowest observed effect levels of inorganic lead in children
Note: Retrieved March 31, 2016. The levels in this diagram do not necessarily indicate the lowest
levels at which lead exerts an effect. These are the levels at which studies have adequately
demonstrated an effect. Source: ATSDR, 1990

14
Figure 6

15
Figure 7
Figure 8

16
Figure 9
Figure 10

17
Figure 11

18
VII. Reference
[1] Annual Financial Reports. (n.d.). Retrieved
from http://investor.aetna.com/phoenix.zhtml?c=110617&p=irol-reportsannual
[2] Flint lead poisoning: Living with uncertainty long-term. (n.d.). Retrieved April 04, 2016, from
http://www.cnn.com/2016/03/04/health/flint-lead-exposure-long-term-pain/
[3]Hanna-Attisha, M., Lachance, J., Sadler, R. C., & Schnepp, A. C. (2016). Elevated Blood Lead
Levels in Children Associated With the Flint Drinking Water Crisis: A Spatial Analysis of Risk
and Public Health Response. Am J Public Health American Journal of Public Health, 106(2), 283-
290.
[4] KIDS COUNT IN MICHIGAN DATA PROFILE 2016 (Rep.). (2016). MI: Michigan League of
Public Policy.
[5]Newell, R. G., & Rogers, K. (2003). The U.S. Experience with the Phasedown of Lead in
Gasoline (Rep.). Resources for the Future.
[6] Preventing Lead Poisoning in Young Children: Figures. (1991). [Figure 1, Figure 2, Figure 3,
Figure 4, Figure 5]. Retrieved March 31, 2016, from
http://www.cdc.gov/nceh/lead/publications/books/plpyc/figures.htm#Fig
[7] Raw data: Lead poisoning of kids in Flint. (n.d.). Retrieved April 04, 2016, from
http://www.motherjones.com/kevin-drum/2016/01/raw-data-lead-poisoning-kids-flint
[8] Schnaas, L., Rothenberg, S. J., Flores, M., Martinez, S., Hernandez, C., Osorio, E., . . . Perroni,
E. (2005). Reduced Intellectual Development in Children with Prenatal Lead Exposure. Environ
Health Perspect Environmental Health Perspectives, 114(5), 791-797.
[9] Snyder, R., & McPharlin, P. M. (2014). Authorized Major Medical Companies (Rep.). Lansing,
MI: Department of Insurance and Financial Services.
doi:https://www.michigan.gov/documents/lara/Major_Medical_359547_7.pdf
[10] Top 10 Insurance Companies By The Metrics | Investopedia. (2014). Retrieved April 08,
2016, from http://www.investopedia.com/articles/active-trading/111314/top-10-insurance-
companies-metrics.asp