Embed Size (px)
Citation preview

The following is intended to outline our general
product direction. It is intended for information
purposes only, and may not be incorporated into any
contract. It is not a commitment to deliver any
material, code, or functionality, and should not be
relied upon in making purchasing decisions.
The development, release, and timing of any
features or functionality described for Oracle’s
products remains at the sole discretion of Oracle.
S317749 – Tuning Your SOA Infrastructure for Performance and
Scalability
Shumin Zhao Deepak Arora Vikas Anand
SOA Performance Engineer A-Team Sr. Principal Product Manager
JavaOne and Oracle Develop
Latin America 2010
December 7–9, 2010
JavaOne and Oracle Develop
Beijing 2010
December 13–16, 2010
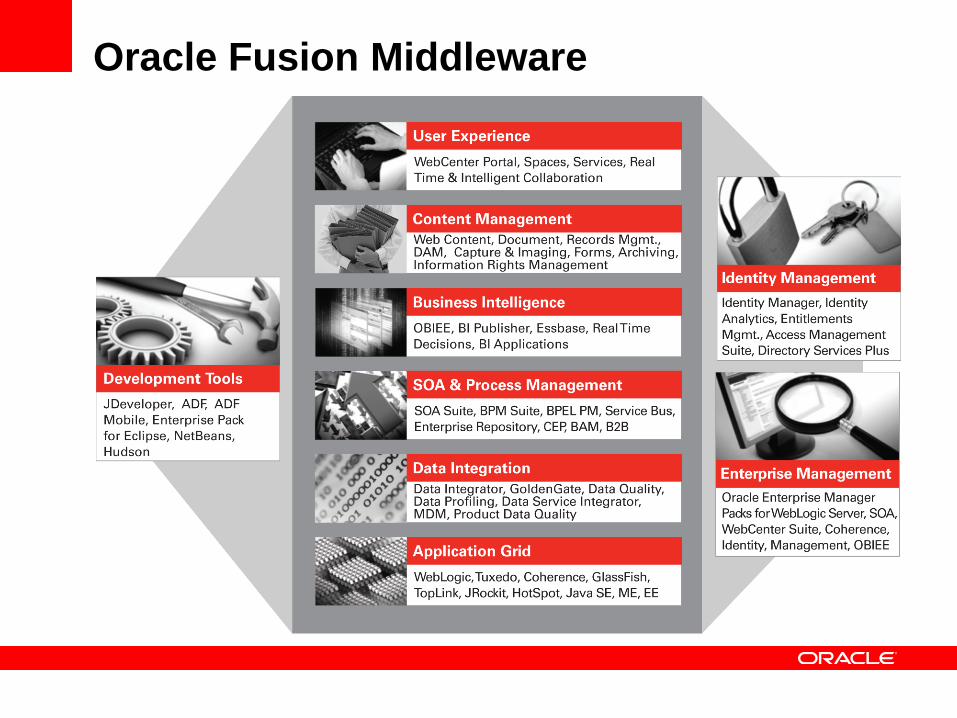
Oracle Fusion Middleware
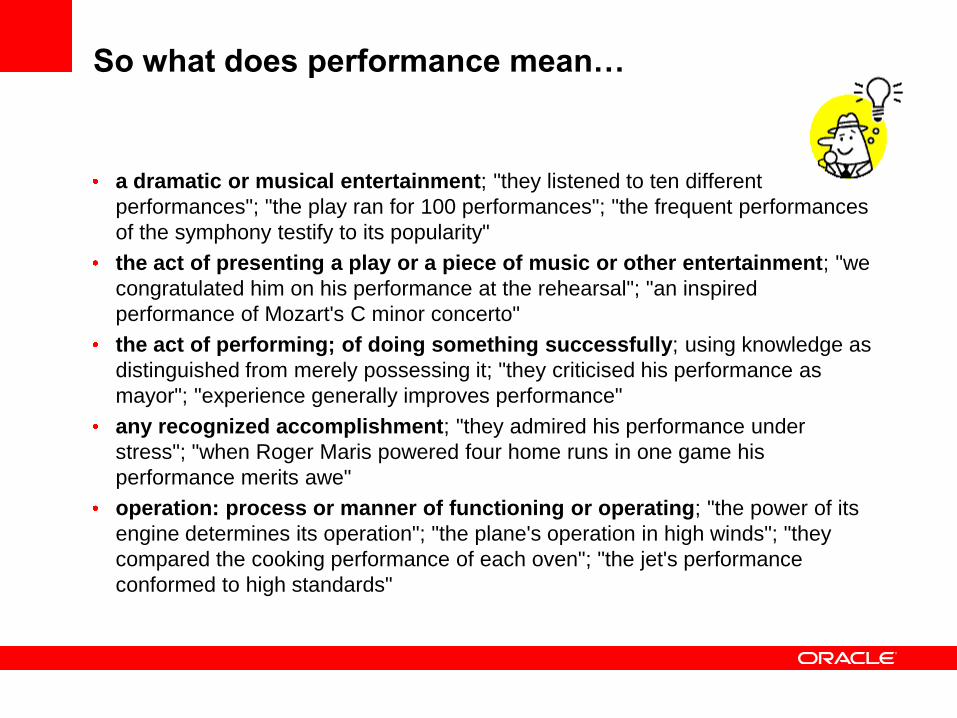
So what does performance mean…
a dramatic or musical entertainment; "they listened to ten different
performances"; "the play ran for 100 performances"; "the frequent performances
of the symphony testify to its popularity"
the act of presenting a play or a piece of music or other entertainment; "we
congratulated him on his performance at the rehearsal"; "an inspired
performance of Mozart's C minor concerto"
the act of performing; of doing something successfully; using knowledge as
distinguished from merely possessing it; "they criticised his performance as
mayor"; "experience generally improves performance"
any recognized accomplishment; "they admired his performance under
stress"; "when Roger Maris powered four home runs in one game his
performance merits awe"
operation: process or manner of functioning or operating; "the power of its
engine determines its operation"; "the plane's operation in high winds"; "they
compared the cooking performance of each oven"; "the jet's performance
conformed to high standards"
Performance – SOA Context
Reliable -
End to end transactionality i.e. no order or message loss
Recovery of messages – as and when required
Automated transaction recovery and rollback capabilities
A “view” of the transaction
Scalable -:
Vertical vs horizontal scale out – H/W, OS, JDK
Sizing – DB, AQ, MQ, Messaging infrastructure, Middleware
Throughput -:
Transactions-per-second (TPS)
End to end transaction time
Messages completed in a given time frame
Throughput vs Response Time

Technology..!!!
Copyright ©2008 Oracle Corporation. All rights reserved.
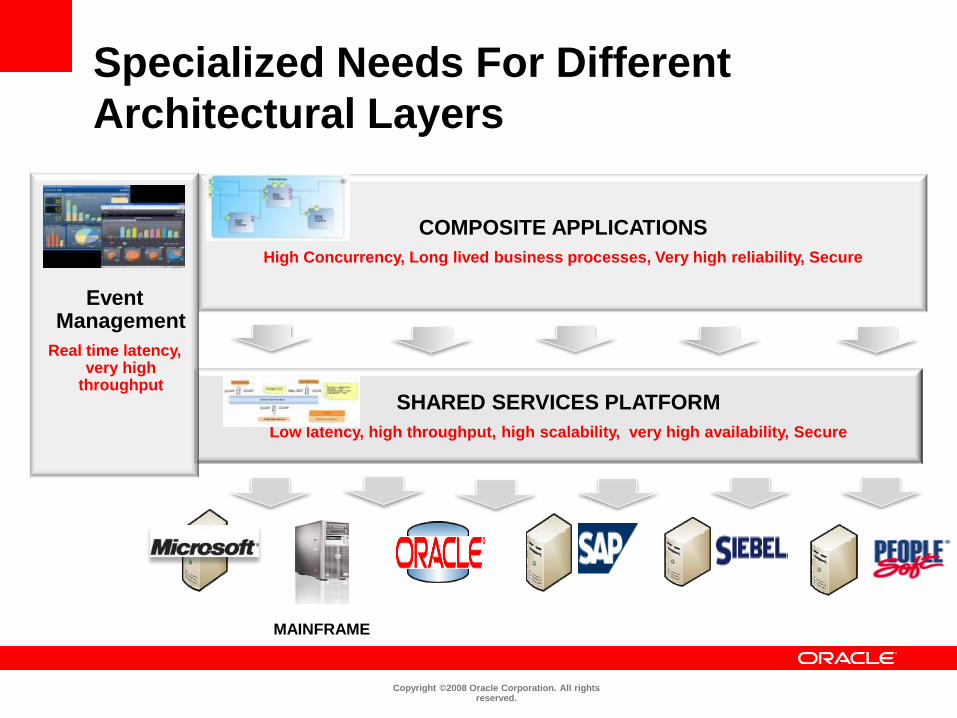
SHARED SERVICES PLATFORM
Low latency, high throughput, high scalability, very high availability, Secure
COMPOSITE APPLICATIONS
High Concurrency, Long lived business processes, Very high reliability, Secure
Specialized Needs For Different
Architectural Layers
MAINFRAME
Event Management
Real time latency, very high
throughput
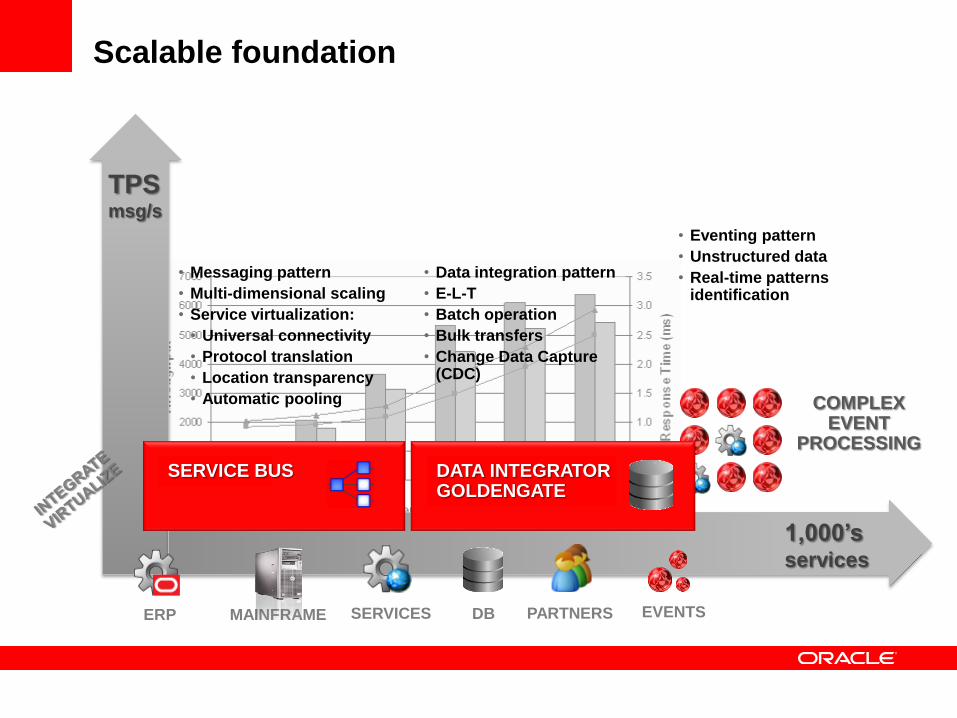
TPSmsg/s
1,000’sservices
Scalable foundation
ERP MAINFRAME SERVICES EVENTSPARTNERSDB
SERVICE BUS
• Messaging pattern
• Multi-dimensional scaling
• Service virtualization:
• Universal connectivity
• Protocol translation
• Location transparency
• Automatic pooling COMPLEXEVENT
PROCESSING
• Eventing pattern
• Unstructured data
• Real-time patterns identification
DATA INTEGRATORGOLDENGATE
• Data integration pattern
• E-L-T
• Batch operation
• Bulk transfers
• Change Data Capture (CDC)
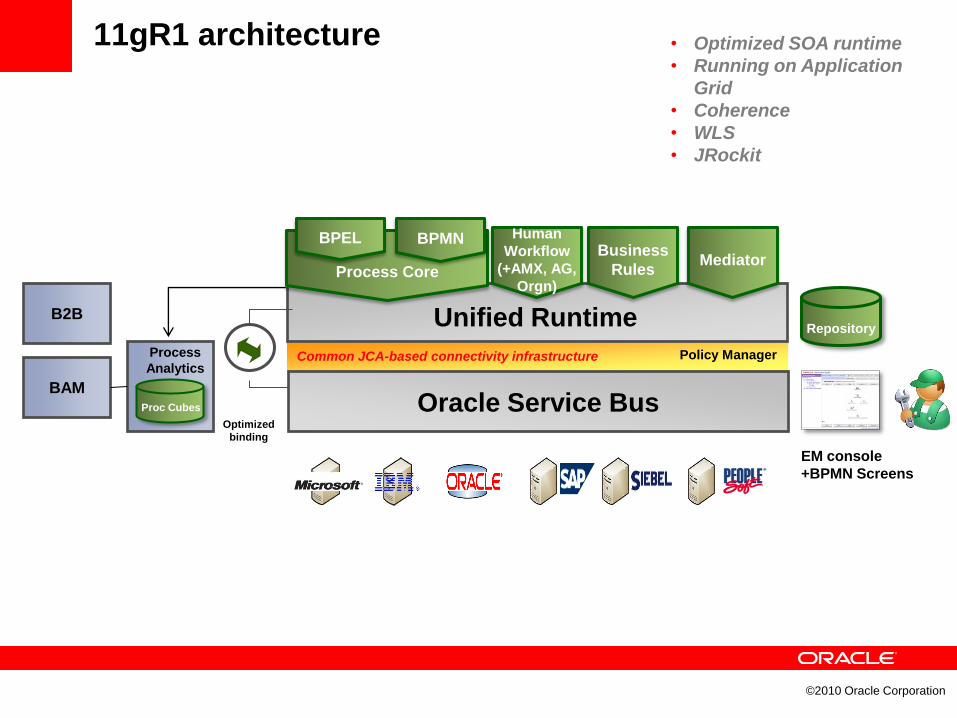
11gR1 architecture
Unified Runtime
Policy Manager
Optimized
binding
Human
Workflow
(+AMX, AG,
Orgn)
Business
Rules
Oracle Service Bus
Common JCA-based connectivity infrastructure
Repository
EM console
+BPMN Screens
BAM
B2B
Mediator
Process
Analytics
Proc Cubes
Process Core
BPEL BPMN
©2010 Oracle Corporation
• Optimized SOA runtime
• Running on Application
Grid
• Coherence
• WLS
• JRockit
Extreme Performance & ScalabilityHigher Performance/Availability, Faster Deployment, & Lower TCO
Easy Maintenance, Patching and Scaling out
using WLS’ modularized architecture for install/config/hosting
(with clear separation of binary/domains config/hardware)
Performance, Availability & Scalability
Predictable Performance, Scale on Demand, 5 9’s Availability
Automated failover across physical boxes using WLS’ whole server migration
Coherence for caching & clustering
GridLink for RAC
High-performance Messaging & Service Virtualization
OSB is the industry’s most scalable service bus
Highly scalable in-process JMS provider
Unit of Order, Unit of Work, JMS Clustering
Advanced management capabilities
Sophisticated scripting administration leveraging WLST and ANT.
Lock & Edit capability console
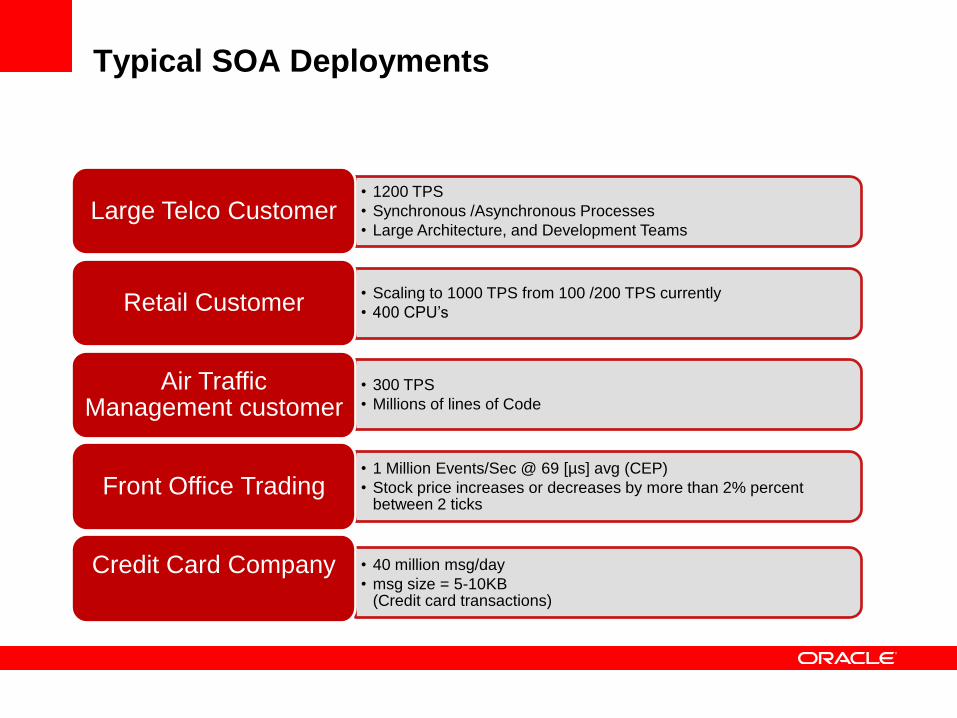
Typical SOA Deployments
• 1200 TPS
• Synchronous /Asynchronous Processes
• Large Architecture, and Development TeamsLarge Telco Customer
• Scaling to 1000 TPS from 100 /200 TPS currently
• 400 CPU’sRetail Customer
• 300 TPS
• Millions of lines of Code
Air Traffic Management customer
• 1 Million Events/Sec @ 69 [µs] avg (CEP)
• Stock price increases or decreases by more than 2% percent between 2 ticks
Front Office Trading
• 40 million msg/day
• msg size = 5-10KB(Credit card transactions)
Credit Card Company
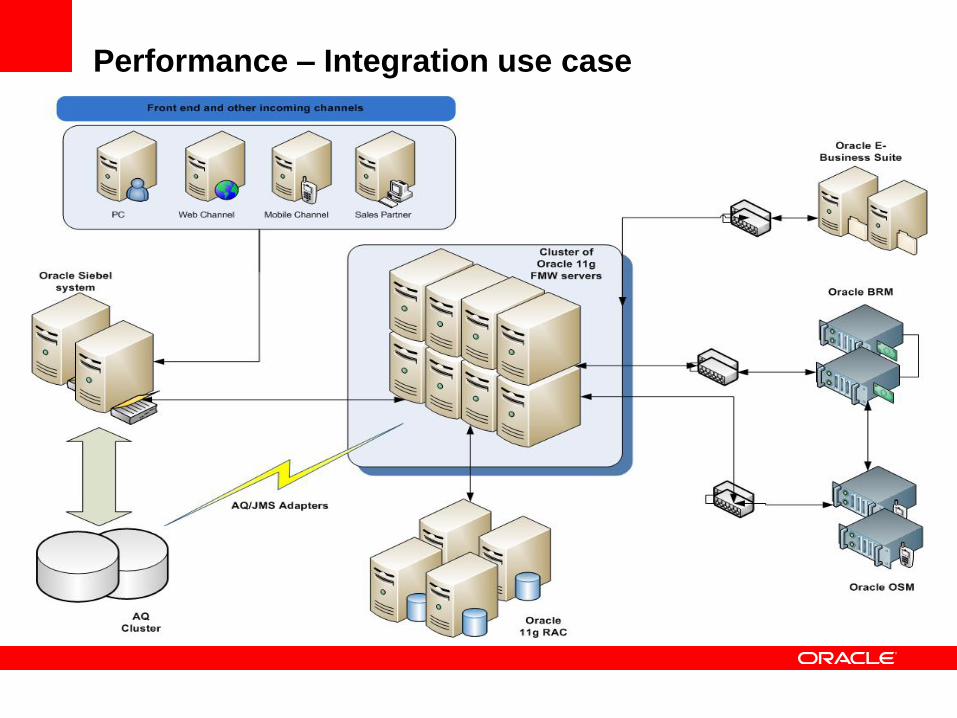
Performance – Integration use case

Design it Right !!!
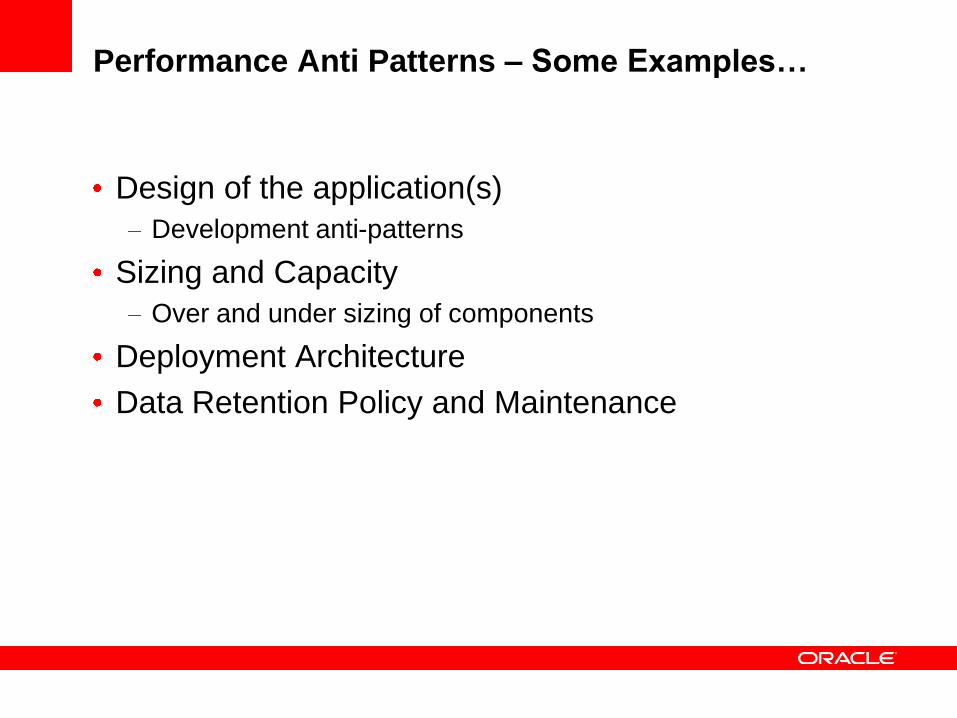
Performance Anti Patterns – Some Examples…
Design of the application(s)
Development anti-patterns
Sizing and Capacity
Over and under sizing of components
Deployment Architecture
Data Retention Policy and Maintenance
Anti-Pattern – Design of Applications
Usage of synchronous processes to call asynchronous
processes and waits for a response
May lighten the load on the server but adds a transaction
abstraction that needs to be handled
No “view of the transaction” – need a mechanism to provide
location of the ongoing transaction (tracking)
No server session affinity during callbacks in a cluster
environment
Timeout issues, hanging threads and thread deadlocks
CPU, Garbage Collection and server threads usage will be
high
Exception and error handling may require customizations
Scalability may be an issue which can only be resolved with a
design change
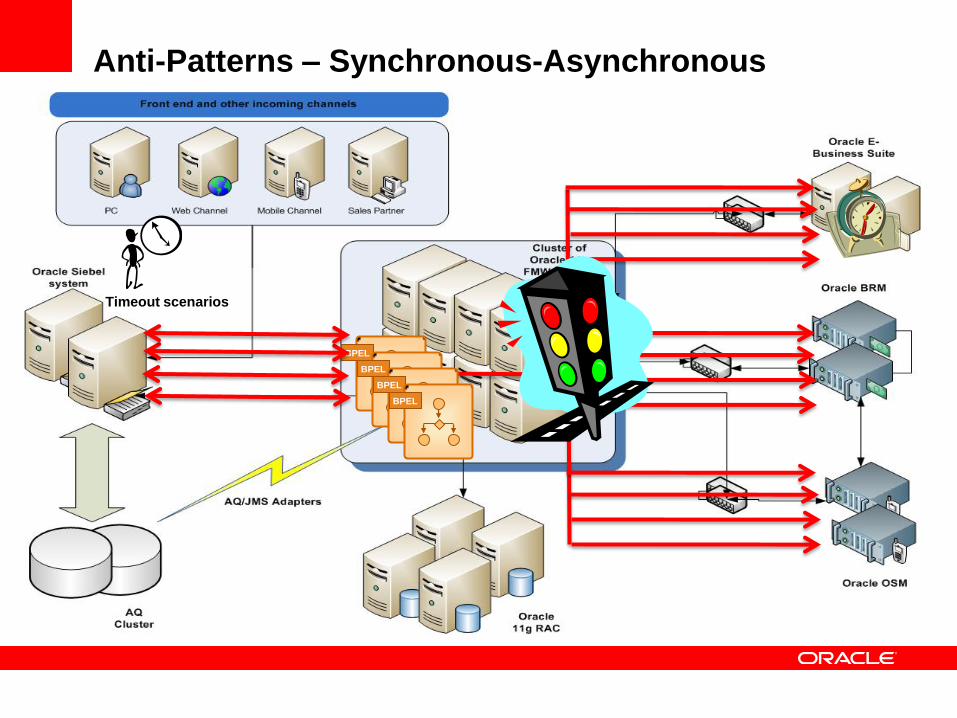
Anti-Patterns – Synchronous-Asynchronous
BPEL
BPEL
BPEL
BPEL
Timeout scenarios
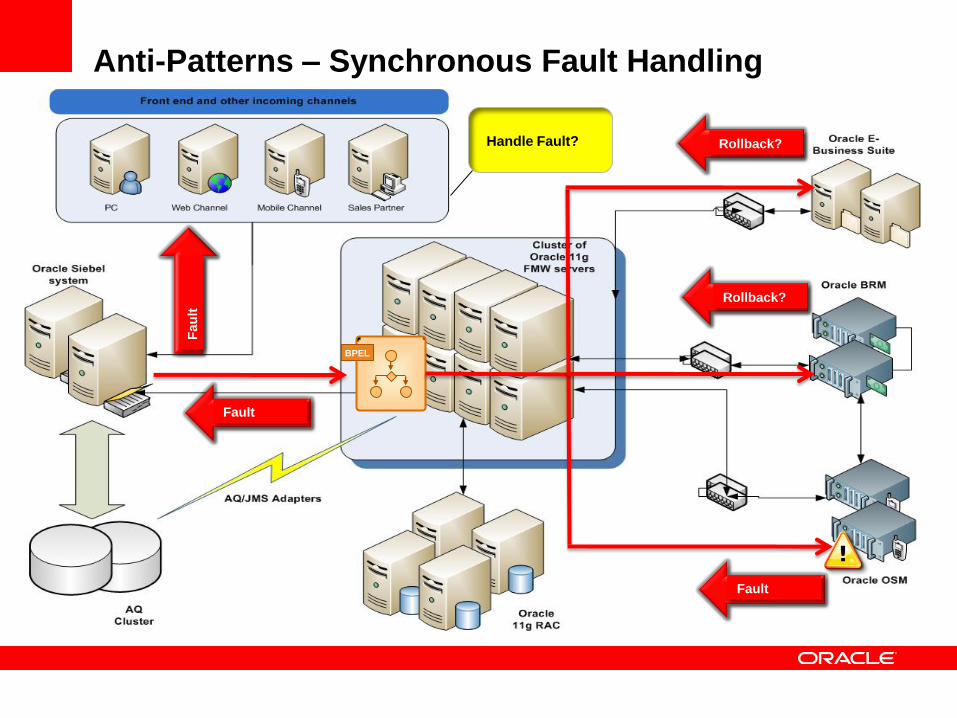
Anti-Patterns – Synchronous Fault Handling
BPEL
Fault
Rollback?
Rollback?
Fault
Fau
lt
Handle Fault?
Anti-Patterns – Design of Applications
Usage of extensive loops
Using very big loops to
conduct iterative
processing – does not
scale with large numbers
Can lead to big JVM object
heaps and potential GC
bottlenecks
Abuse of FlowN (Batch/event
paradigm)
Very large number of FlowN –
slows down server, large
number of threads
How to deal with long running
BPEL processes
Anti-Patterns – Design of Applications
Over usage of asynchronous processes
(Mediator/BPEL)
Adds dehydration overhead
Developers are not aware of transactional boundaries
which can quickly complicate the message lifecycle
Over usage of callbacks (chatty system) in a single
BPEL process
Every callback is a dehydration point which will cause DB
activity
Having too many callback activities can quickly impact
performance
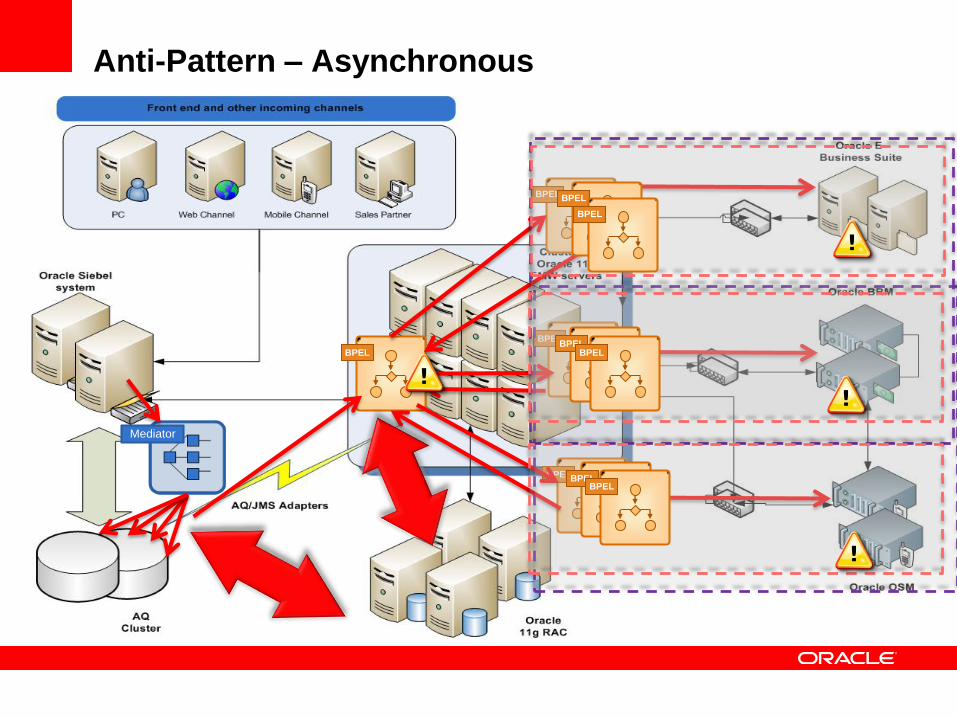
Anti-Pattern – Asynchronous
<PUT picture here>
BPEL
Mediator
BPEL
BPEL
BPELBPEL
BPEL
BPEL
BPEL
BPEL
BPEL
Anti-Patterns – Sizing and Capacity
Over sizing some components while not adding
capacity for other components
Most notably adding more FMW servers while not adding any
more DB capacity
Not sizing the dehydration DB correctly, or not able to add
disk at the right time (real performance issue)
Transaction systems not able to sustain load of incoming
requests – leads to “lost messages”, system down scenarios,
overall system slow down
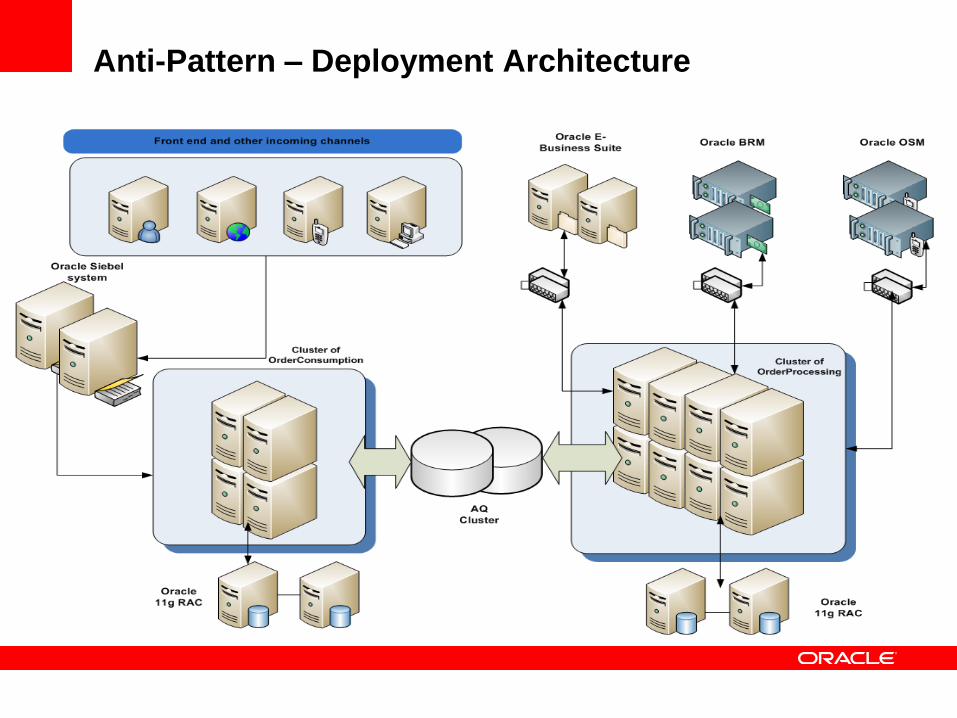
Anti-Patterns – Deployment Architecture
Trying to overextend a cluster’s capability
One set of processes consume more resources which impact
other set of processes for e.g. OrderConsumption processes
vs OrderProcessing processes
OrderProcessing takes much longer however
OrderConsumption takes away CPU processing power
impacting overall performance
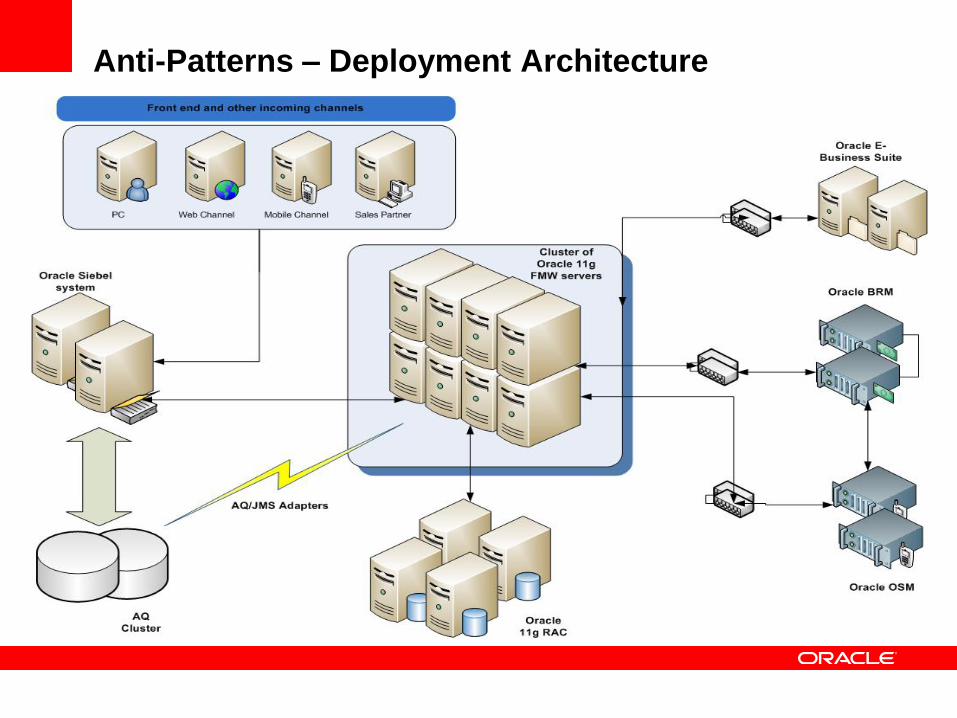
Anti-Patterns – Deployment Architecture
<PUT picture here>
Anti-Pattern – Deployment Architecture

Hmm.. how much Data
do I really need…!!!
Purging and DB retention policies
DB purging not being optimized
Has one of the biggest impacts on a SOA business
application
Impacts performance of runtime SQL queries
Impacts asynchronous routing rules and asynchronous BPEL
processes
Slows down console access when querying for auditing data
Very large overhead when purging data – longer cycles
required, defragmentation of DB, maintenance window
If retention periods are long, larger disk space is required –
BLOB column tables grow taking up bigger chunk of the DB
Anti-Patterns - Transactions<PUT picture here>
BPEL
Mediator
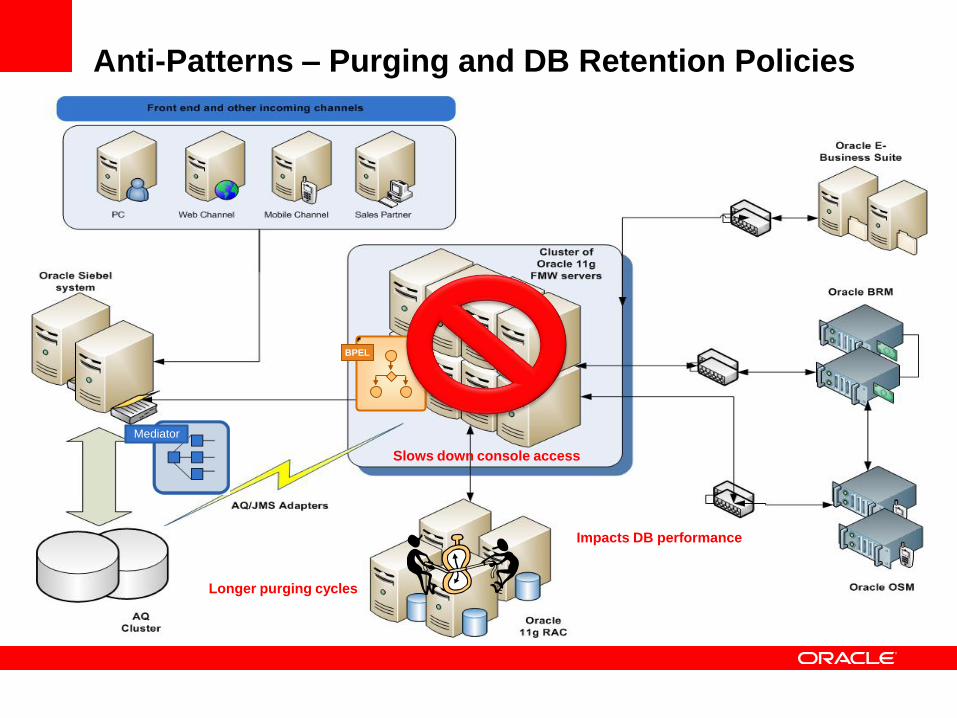
Anti-Patterns – Purging and DB Retention Policies
Impacts DB performance
Slows down console access
Longer purging cycles
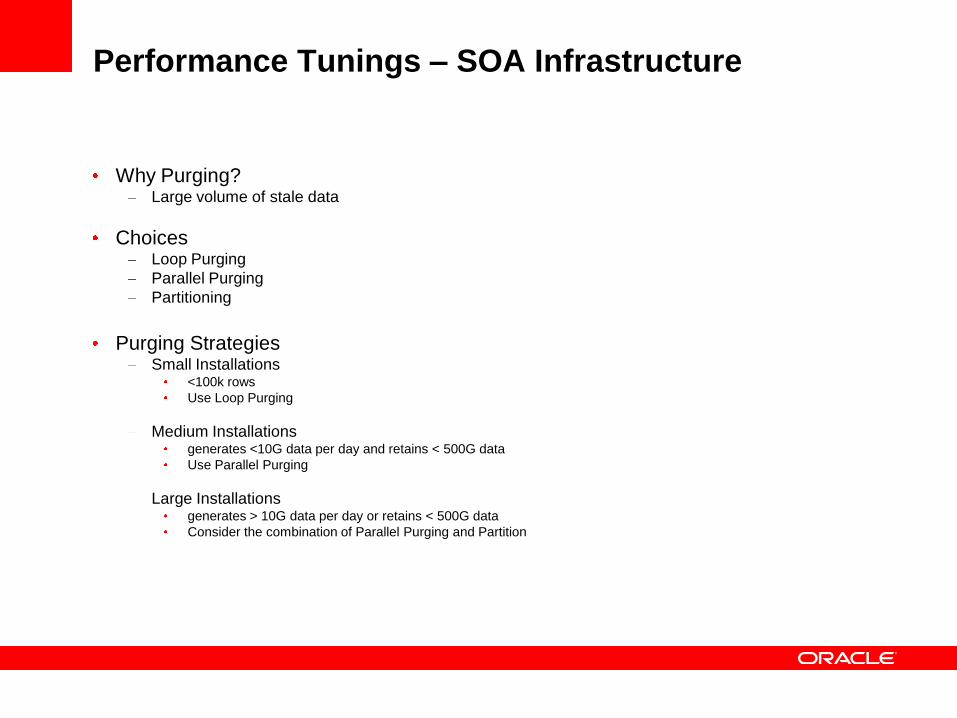
Performance Tunings – SOA Infrastructure
Why Purging?Large volume of stale data
ChoicesLoop Purging
Parallel Purging
Partitioning
Purging StrategiesSmall Installations
<100k rows
Use Loop Purging
Medium Installations generates <10G data per day and retains < 500G data
Use Parallel Purging
Large Installations generates > 10G data per day or retains < 500G data
Consider the combination of Parallel Purging and Partition

Perfect …Now lets Tune
it for performance…
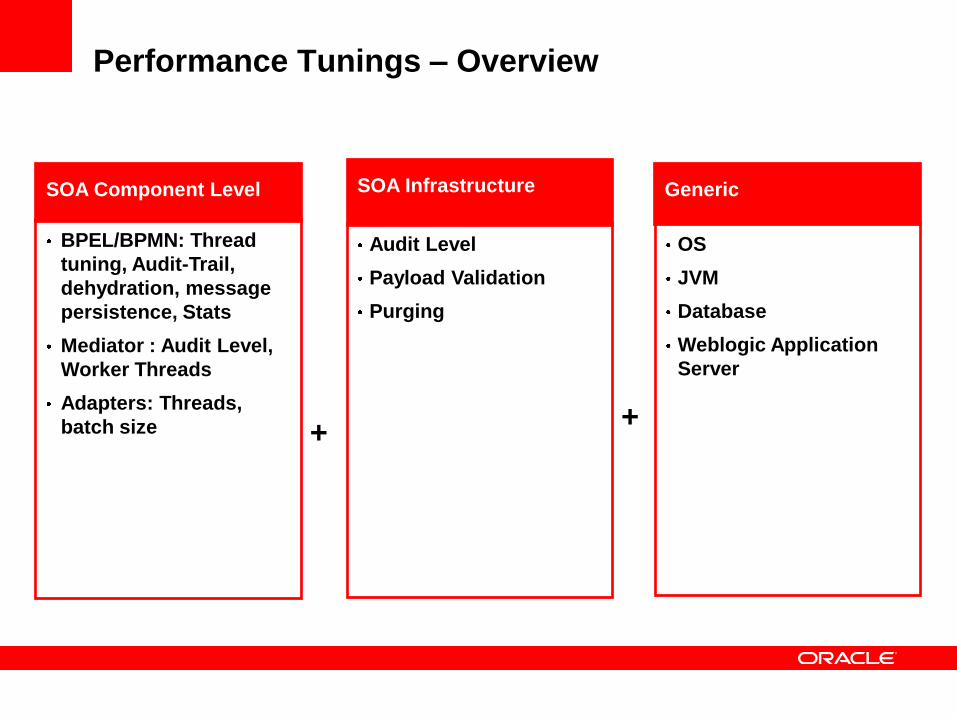
Performance Tunings – Overview
BPEL/BPMN: Thread
tuning, Audit-Trail,
dehydration, message
persistence, Stats
Mediator : Audit Level,
Worker Threads
Adapters: Threads,
batch size
SOA Component Level
OS
JVM
Database
Weblogic Application
Server
Generic
Audit Level
Payload Validation
Purging
SOA Infrastructure
++
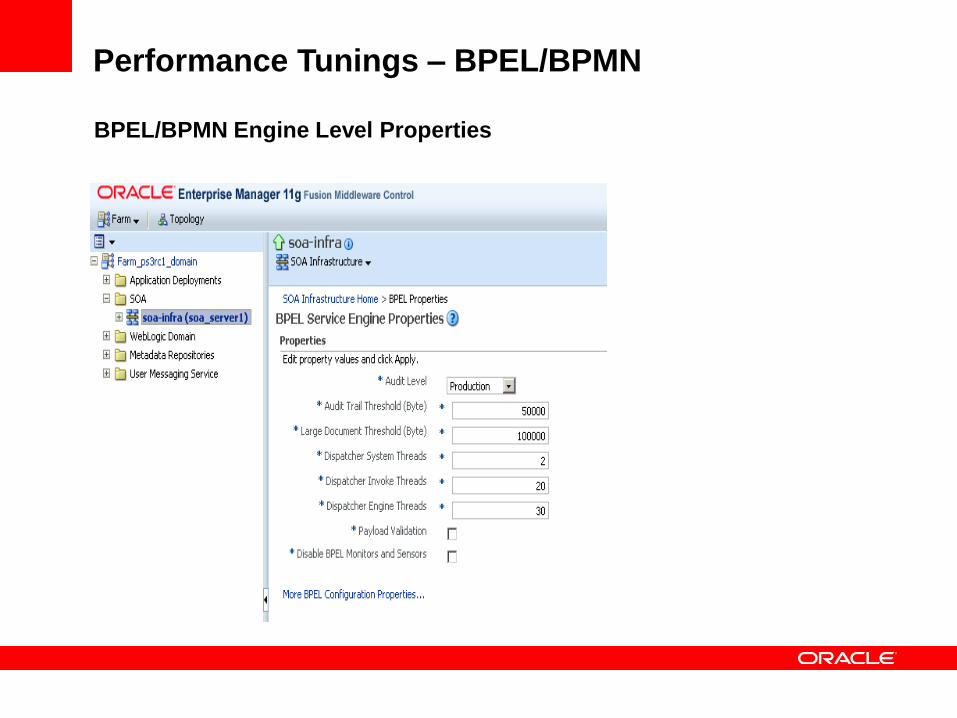
Performance Tunings – BPEL/BPMN
BPEL/BPMN Engine Level Properties
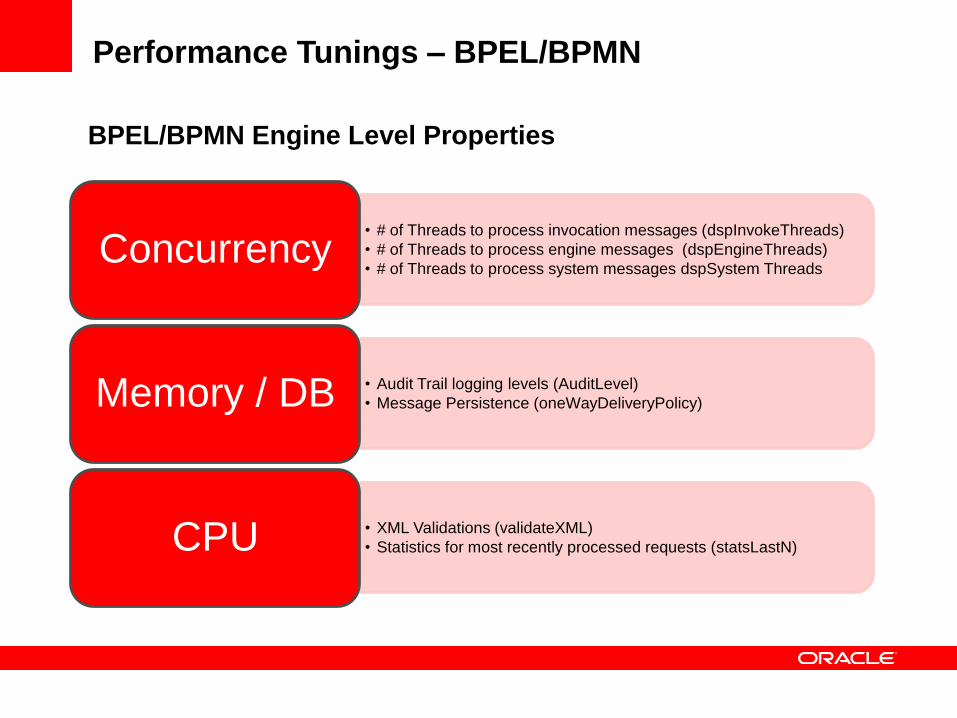
Performance Tunings – BPEL/BPMN
BPEL/BPMN Engine Level Properties
• # of Threads to process invocation messages (dspInvokeThreads)
• # of Threads to process engine messages (dspEngineThreads)
• # of Threads to process system messages dspSystem ThreadsConcurrency
• Audit Trail logging levels (AuditLevel)
• Message Persistence (oneWayDeliveryPolicy)Memory / DB
• XML Validations (validateXML)
• Statistics for most recently processed requests (statsLastN)CPU
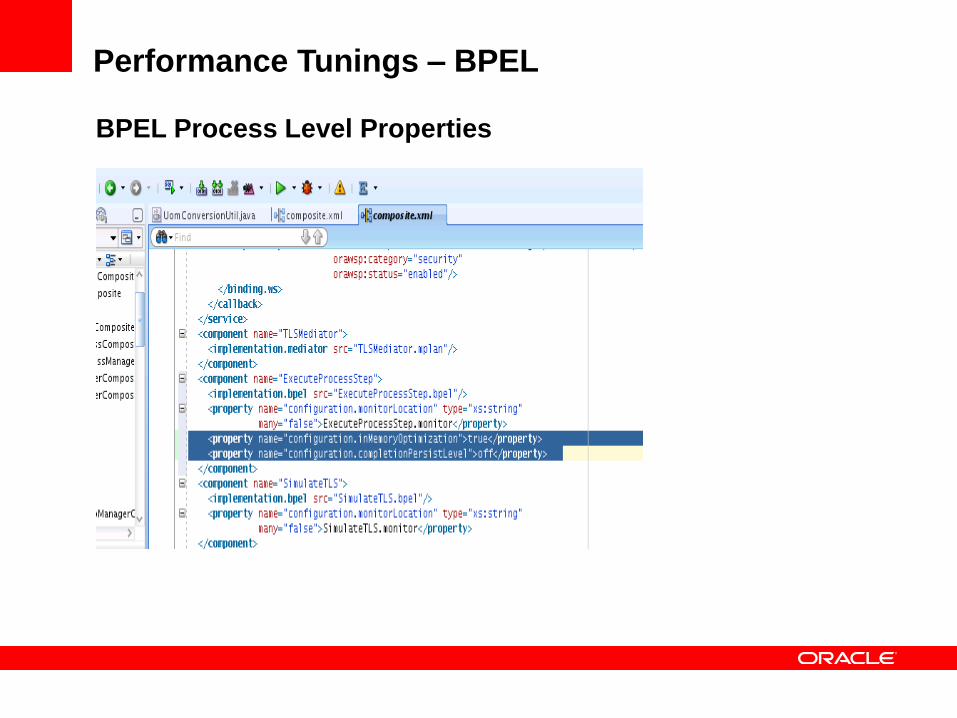
Performance Tunings – BPEL
BPEL Process Level Properties
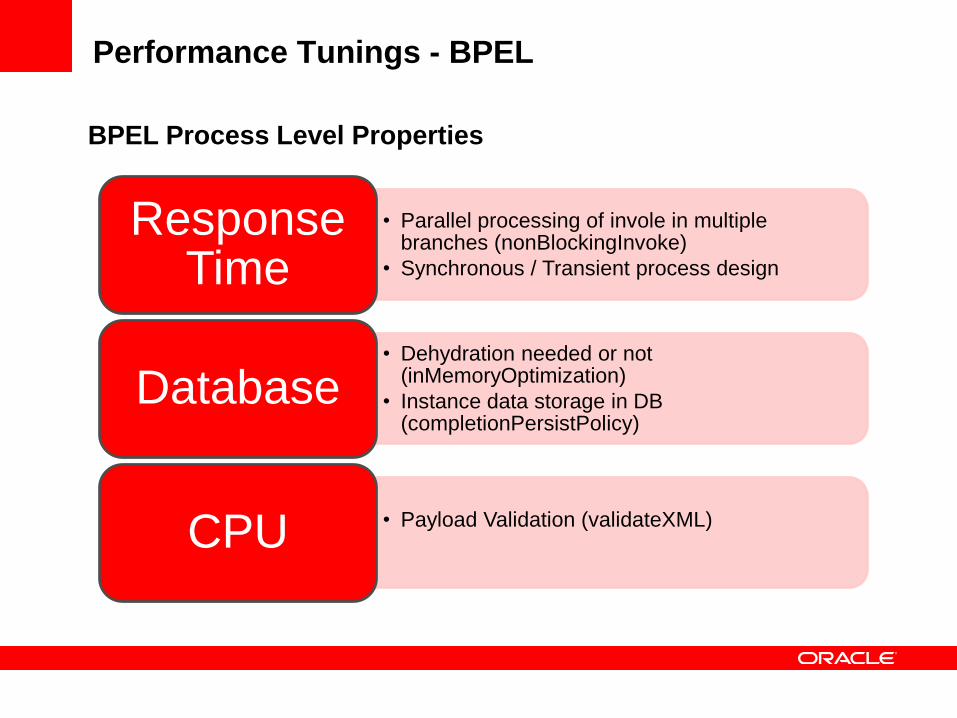
Performance Tunings - BPEL
BPEL Process Level Properties
• Parallel processing of invole in multiple branches (nonBlockingInvoke)
• Synchronous / Transient process design
Response Time
• Dehydration needed or not (inMemoryOptimization)
• Instance data storage in DB (completionPersistPolicy)
Database
• Payload Validation (validateXML)CPU
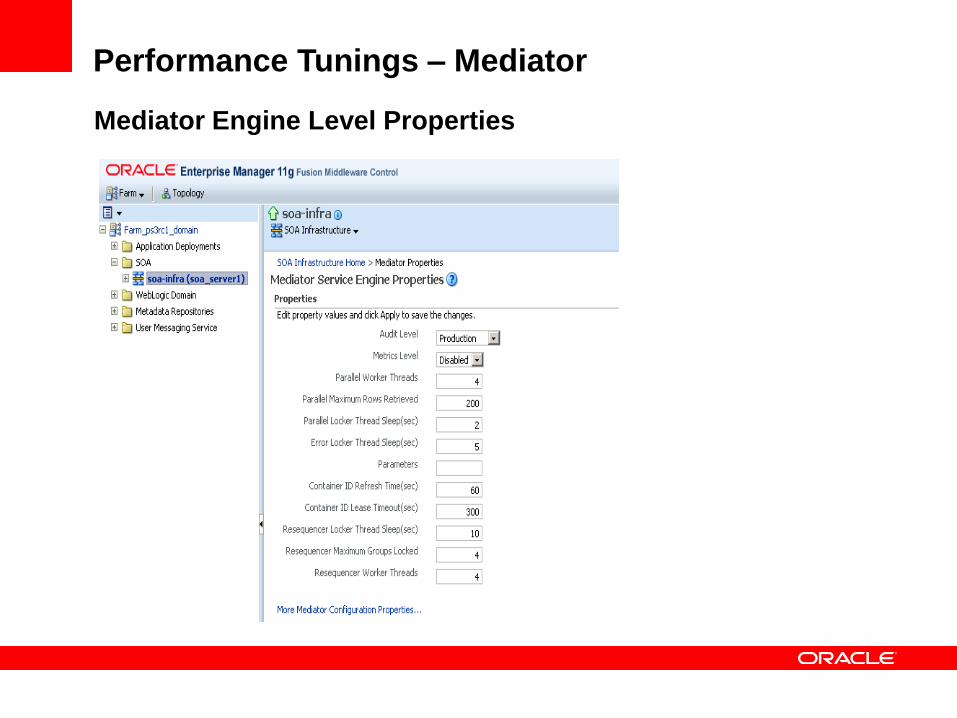
Performance Tunings – Mediator
Mediator Engine Level Properties
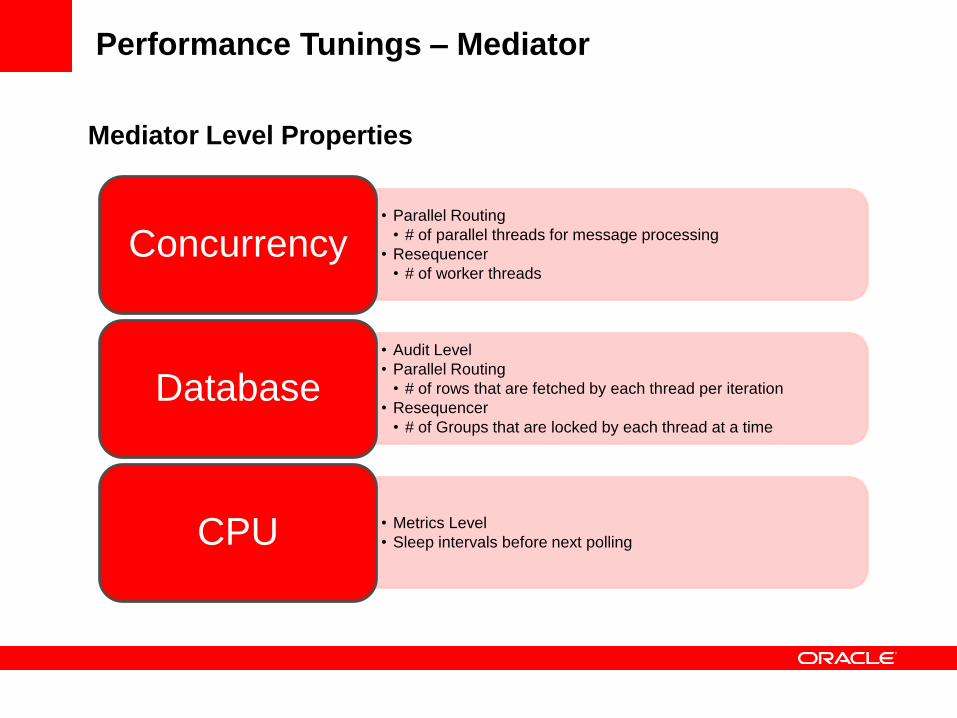
Performance Tunings – Mediator
Mediator Level Properties
• Parallel Routing
• # of parallel threads for message processing
• Resequencer
• # of worker threads
Concurrency
• Audit Level
• Parallel Routing
• # of rows that are fetched by each thread per iteration
• Resequencer
• # of Groups that are locked by each thread at a time
Database
• Metrics Level
• Sleep intervals before next pollingCPU
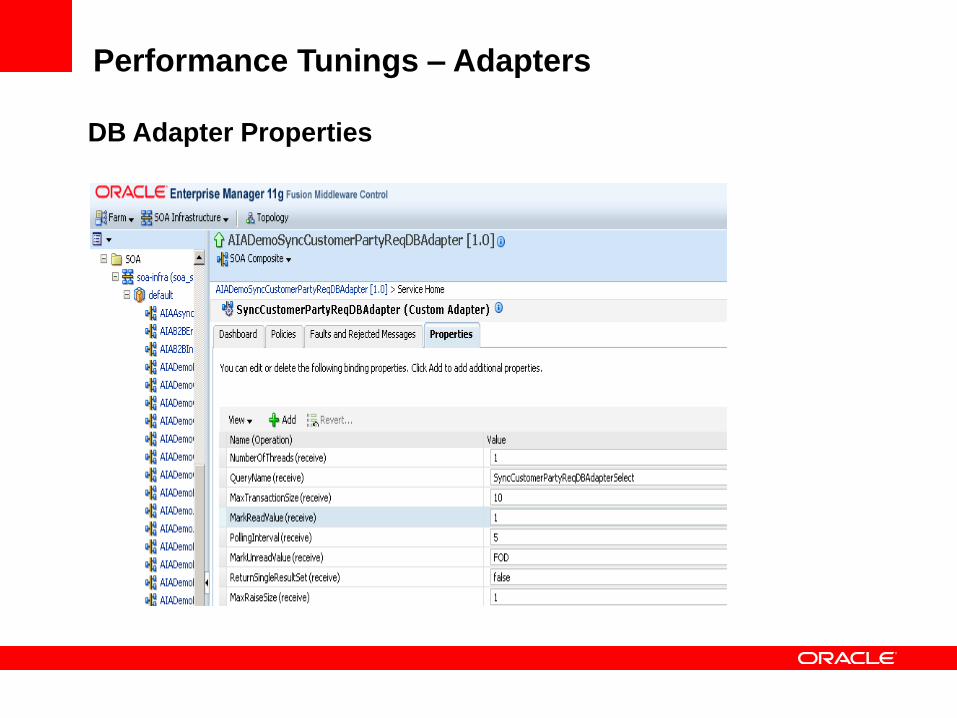
Performance Tunings – Adapters
DB Adapter Properties
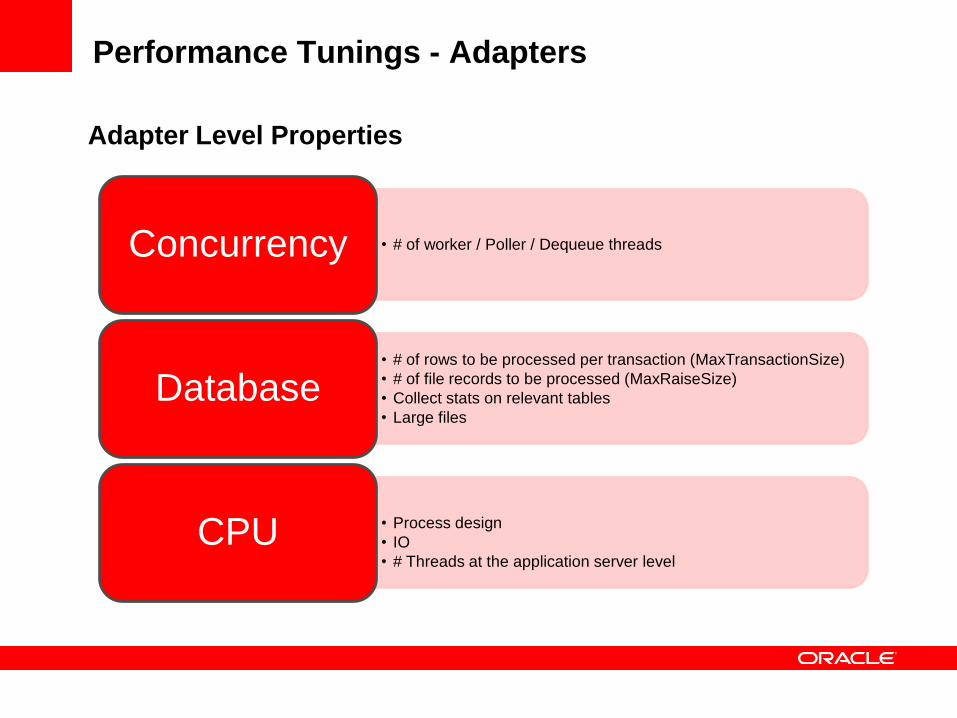
Performance Tunings - Adapters
• # of worker / Poller / Dequeue threadsConcurrency
• # of rows to be processed per transaction (MaxTransactionSize)
• # of file records to be processed (MaxRaiseSize)
• Collect stats on relevant tables
• Large files
Database
• Process design
• IO
• # Threads at the application server level
CPU
Adapter Level Properties
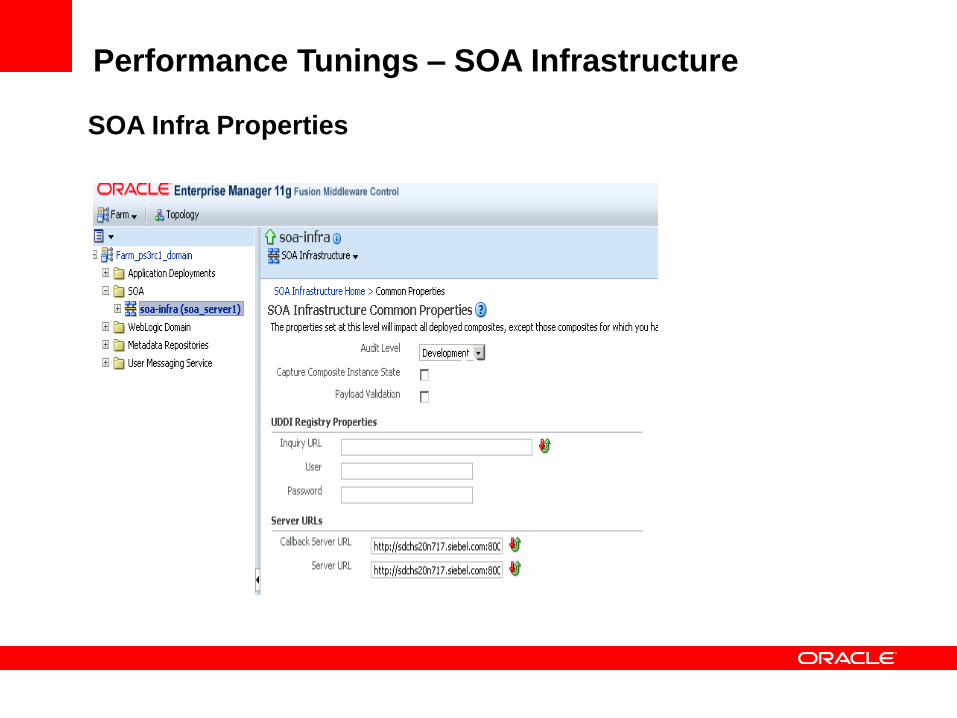
Performance Tunings – SOA Infrastructure
SOA Infra Properties
CA
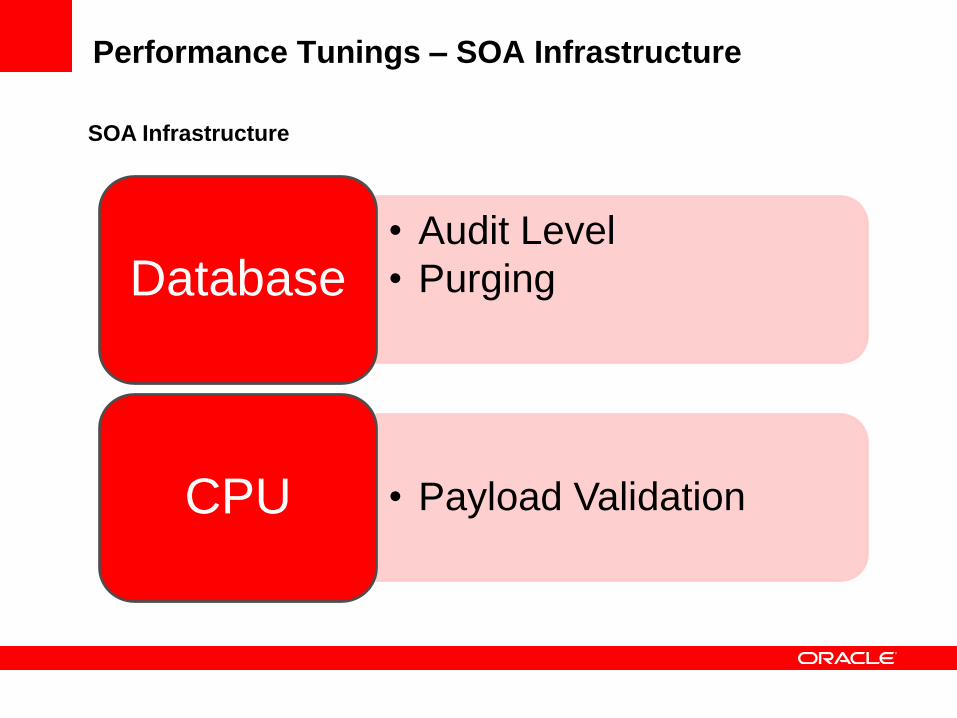
Performance Tunings – SOA Infrastructure
• Audit Level
• PurgingDatabase
• Payload ValidationCPU
SOA Infrastructure
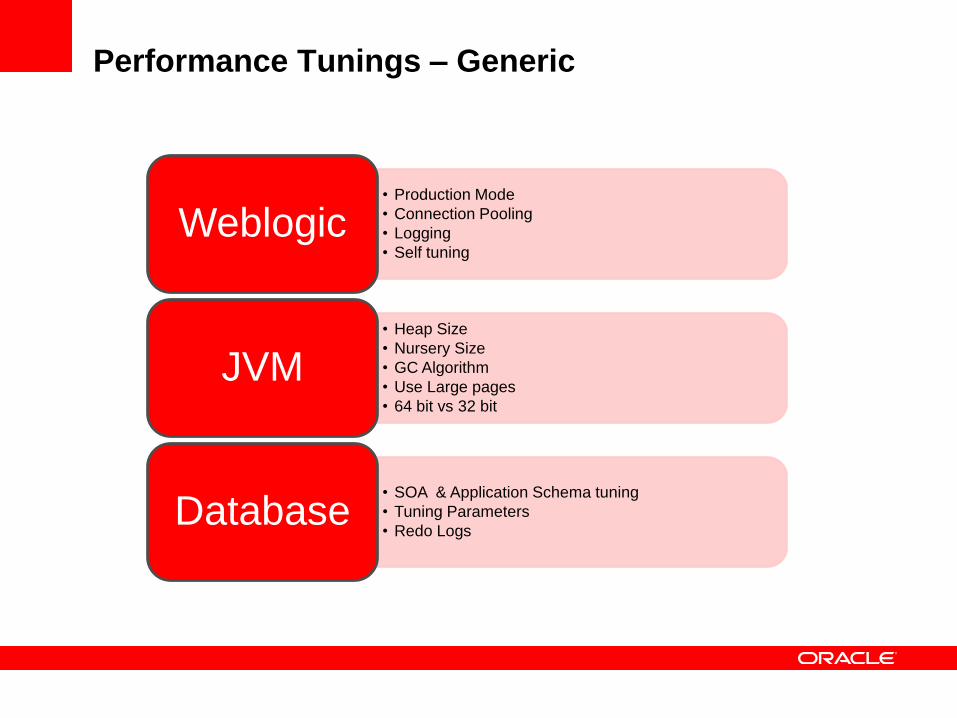
Performance Tunings – Generic
• Production Mode
• Connection Pooling
• Logging
• Self tuning
Weblogic
• Heap Size
• Nursery Size
• GC Algorithm
• Use Large pages
• 64 bit vs 32 bit
JVM
• SOA & Application Schema tuning
• Tuning Parameters
• Redo LogsDatabase
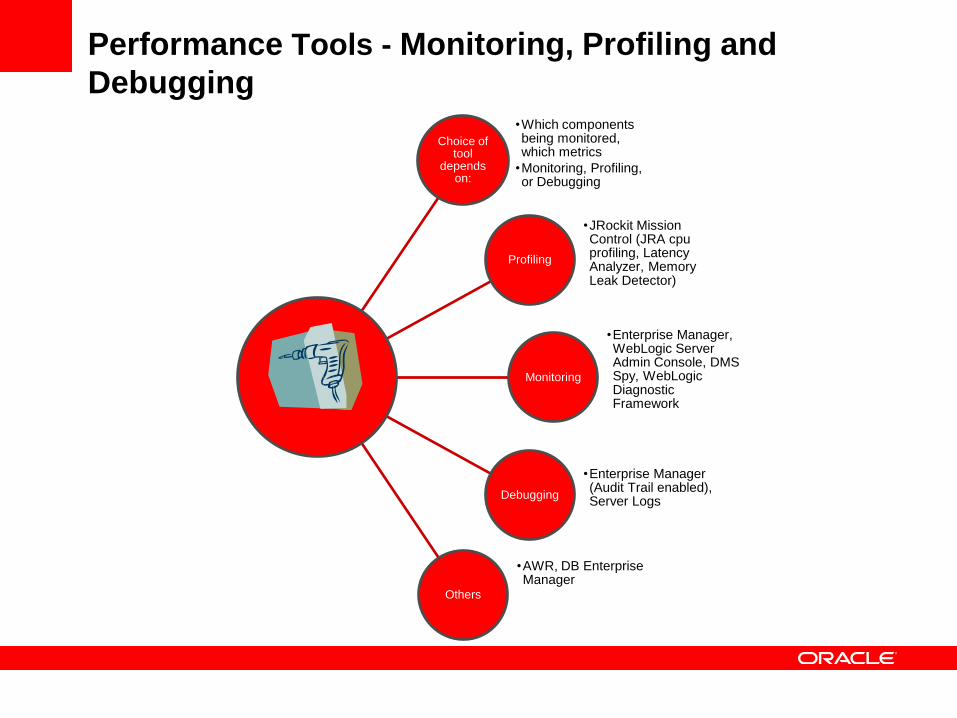
Performance Tools - Monitoring, Profiling and
Debugging
Choice of tool
depends on:
•Which components being monitored, which metrics
•Monitoring, Profiling, or Debugging
Profiling
•JRockit Mission Control (JRA cpuprofiling, Latency Analyzer, Memory Leak Detector)
Monitoring
•Enterprise Manager, WebLogic Server Admin Console, DMS Spy, WebLogicDiagnostic Framework
Debugging
•Enterprise Manager (Audit Trail enabled), Server Logs
Others
•AWR, DB Enterprise Manager
Summary..
Understand the requirements and the Use Cases
Choose the right Technology
Size it !!!
Define the right design Patterns
Deploy the right way !!!
Leverage the Knobs to Tune
And Thank You For attending our session…
For More Information
search.oracle.com
or
oracle.com