Embed Size (px)
Citation preview

Social and Economic Impacts of Hurricane/Post Tropical Cyclone Sandy on the Commercial and Recreational Fishing Industries: New York and New Jersey One Year Later
Lisa L. Colburn, Patricia M. Clay, Tarsila Seara, Changhua Weng, and Angela Silva
U.S. Department of Commerce National Oceanic and Atmosspheric Administration National Marine Fisheries Service
NOAA Technical Memorandum NMFS-F/SPO-157 August 2015


Social and Economic Impacts of Hurricane/Post Tropical Cyclone Sandy on the Commercial and Recreational Fishing Industries: New York and New Jersey One Year Later
Lisa L. Colburn, Patricia M. Clay, Tarsila Seara, Changhua Weng, and Angela Silva
NOAA Technical Memorandum NMFS-F/SPO-157 August 2015
U.S. Department of Commerce Penny S. Pritzker, Secretary
National Oceanic and Atmospheric Administration Kathryn D. Sullivan, Administrator
National Marine Fisheries Service Eileen Sobeck, Assistant Administrator for Fisheries

ii
Recommended citation:
Colburn, L. L., P. M. Clay, T. Seara, C. Weng, and A. Silva. 2015. Social and Economic Impacts of Hurricane/Post Tropical Cyclone Sandy on the Commercial and Recreational Fishing Industries: New York and New Jersey One Year Later. U.S. Dept. of Commer., NOAA. NOAA Technical Memorandum NMFS-F/SPO-157, 68 p.
Copies of this report may be obtained from:
Lisa L. Colburn National Oceanic and Atmospheric Administration NEFSC/Narragansett Lab 28 Tarzwell Dr. Narragansett, RI 02882
Or online at: http://spo.nmfs.noaa.gov/tm/

iii
Table of Contents
List of Figures .............................................................................................................................................. iv
List of Tables ............................................................................................................................................... iv
Acknowledgements ...................................................................................................................................... vi
Abstract ....................................................................................................................................................... vii
Executive Summary ................................................................................................................................... viii
Introduction ................................................................................................................................................... 1
Background ................................................................................................................................................... 2
a. New York and New Jersey Fishing Industries and Coastal Communities ............................................... 2i. Importance of Fishing and Seafood Industries to the State Economies ............................................... 3
ii. Community Dependence on Commercial and Recreational Fishing ..................................................... 3
iii. Commercial Fisheries Landings Data Analyses .......................................................................................... 5
iv. Recreational Fisheries Angler Activity Analyses ........................................................................................ 9
Research methods ....................................................................................................................................... 11
a. Survey Design ............................................................................................................................................................ 11b. Sampling Frame and Target Sample ................................................................................................................... 11c. Implementation .......................................................................................................................................................... 13
Survey Results ............................................................................................................................................ 14
a. Characteristics of the Sample ................................................................................................................................ 14i. Commercial and For-Hire Fishermen............................................................................................................ 14
ii. Fishing-Related Businesses .............................................................................................................................. 19
b. Impacts from Sandy ................................................................................................................................................. 19i. Economic impacts ............................................................................................................................................... 20
ii. Social Impacts ....................................................................................................................................................... 27
Summary ..................................................................................................................................................... 29
a. Impacts of Sandy ....................................................................................................................................................... 30i. Economic Impacts ............................................................................................................................................... 30
ii. Social Impacts ....................................................................................................................................................... 31
Conclusions ................................................................................................................................................. 32
Appendix A ................................................................................................................................................ 36
Appendix B ................................................................................................................................................ 38
Appendix C ................................................................................................................................................ 62
Appendix D ................................................................................................................................................ 64

iv
Appendix E ................................................................................................................................................ 65
Appendix F................................................................................................................................................. 66
List of Figures
Figure 1. Commercial Fisheries Dependence in New York and New Jersey (map a – Commercial Engagement; map b – Commercial Reliance)....................................................................................... 4
Figure 2. Recreational Fisheries Dependence in New York and New Jersey (map a – Recreational Engagement; map b – Recreational Reliance) ...................................................................................... 5
Figure 3. Graph comparing weight in pounds landed in the state of New York between the pre-storm five-year average and the post-storm year .................................................................................................... 6
Figure 4. Graph comparing weight in pounds landed in the state of New Jersey between the pre-storm five-year average and the post-storm year ............................................................................................ 7
Figure 5. New York - Top five species showing a change in pounds landed between the pre-storm five-year average and post-storm actual landed pounds ............................................................................... 8
Figure 6. New Jersey - Top five species showing a change in pounds landed between the pre-storm five-year average and post-storm actual landed pounds ............................................................................... 9
Figure 7. Pre- and post-storm changes in recreational angler activity in New York .................................. 10
Figure 8. Pre- and post-storm changes in recreational angler activity in New Jersey ................................ 10
Figure 9. Geographic distribution of survey results at the community level .............................................. 14
Figure 10. Frequency of primary species targeted by commercial fishermen ............................................ 17
Figure 11. Frequency of primary species targeted by for-hire fishermen ................................................... 17
Figure 12. Frequency of permit types among commercial fishermen......................................................... 18
Figure 13. Frequency of permit types among for-hire fishermen ............................................................... 18
List of Tables
Table 1. Fishing Industry Economic Impacts in New York and New Jersey (commercial numbers are without imports) (data from NMFS 2014) ............................................................................................ 3
Table 2. The Variables used in Fishing Dependence Indices (Source: Jepson and Colburn 2013: Table 3) 4
Table 3. Frequencies of potential frame of participants (universe) and target sample size for each sector total and by state ................................................................................................................................. 12
Table 4. Frequency of fishermen interviewed by fishing sector ................................................................. 15
Table 5. Primary vessel length for commercial and for-hire fishermen combined ..................................... 15
Table 6. Distribution of primary gear types for commercial and for-hire fishermen .................................. 16
Table 7. Distribution of surveyed fishing-related businesses by sector ...................................................... 19

v
Table 8. Fishermen responses on average total costs for physical damages/losses .................................... 20
Table 9. Responses from fishermen interviewed regarding occurrence of changes in revenue associated with Sandy and percentage of revenue loss (the two instances of income gain are not included)...... 21
Table 10. Vessel size categories comparisons for mean values of physical damages/losses and percentage revenue loss......................................................................................................................................... 22
Table 11. Fishing-related business sector responses on average total costs for physical damages/losses .. 23
Table 12. Responses from fishing-related businesses interviewed regarding changes in revenue associated with Sandy and percentage of revenue loss (the few instances of income gain are not included)...... 24
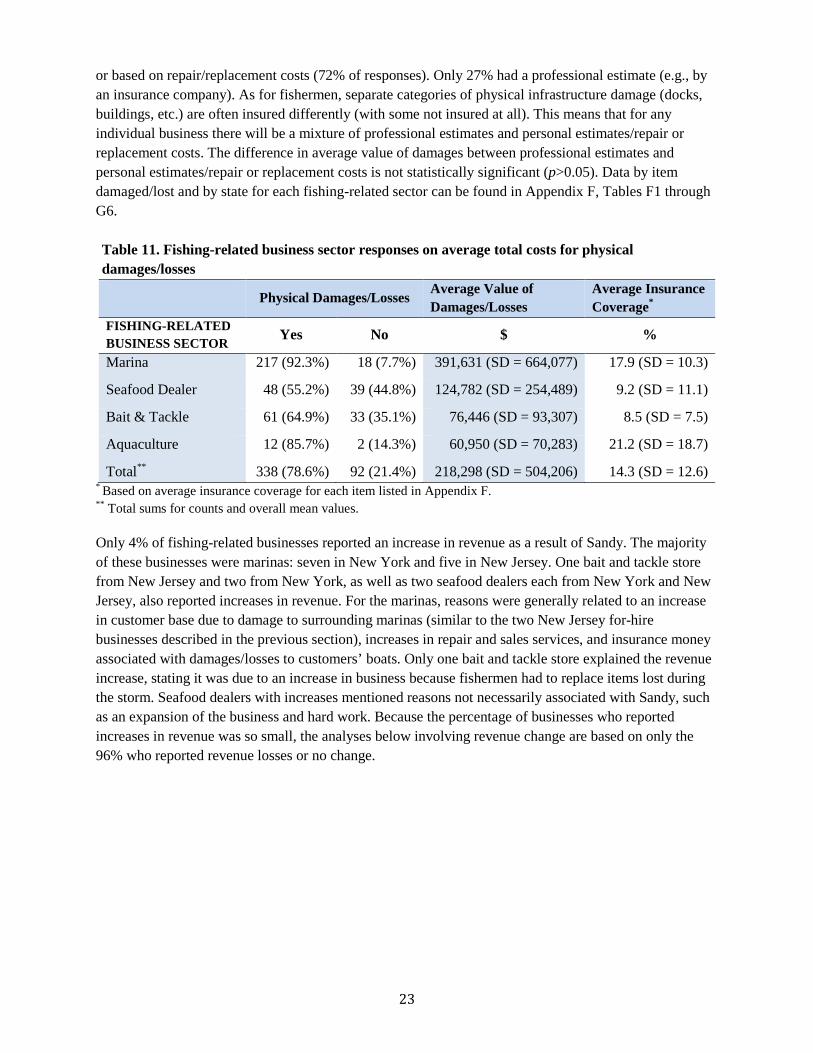
Table 13. Estimation of total value of physical damages/losses for all sectors in New York .................... 25
Table 14 Estimation of total value of physical damages/losses for all sectors in New Jersey .................... 26
Table 15. Frequency of yes/no responses and average percentage revenue loss reported for the entire sample for all sectors in New York..................................................................................................... 27
Table 16. Frequency of yes/no responses and average percentage revenue loss reported for the entire sample for all sectors in New Jersey ................................................................................................... 27
Table A1. Species common and scientific names for commercial fisheries landings data analyses .......... 36
Table D1. Results of the telephone survey dialing effort. .......................................................................... 64
Table E1. Distribution of primary target species. ...................................................................................... 65
Table F1. Mean of estimated value per item and average percentage insured for damages/losses to Commercial fishing. ............................................................................................................................ 66
Table F2. Mean of estimated value per item and average percentage insured for damages/losses to For-Hire fishing. ........................................................................................................................................ 66
Table F3. Mean of estimated value per item and average percentage insured for damages/losses to Marinas. .............................................................................................................................................. 67
Table F4. Mean of estimated value per item and average percentage insured associated with physical damages/losses to Seafood Dealers. .................................................................................................... 67
Table F5. Mean of estimated value per item and average percentage insured for physical damages/losses to Bait & Tackle Stores. ...................................................................................................................... 68
Table F6. Mean of estimated value per item and average percentage insured for physical damages/losses to Aquaculture Facilities. .................................................................................................................... 68

vi
Acknowledgements
This project could not have been completed without the generous assistance of numerous people and institutions. We thank, first of all, the many fishing community members who took the time to take our survey and even call us to be sure they were filling it out correctly. We also thank Matthew McPherson, Michael Simpkins, Russell Brown and others for their helpful reviews. In addition we acknowledge the ongoing support of Rita Curtis of the NMFS Office of Science and Technology. Without these individuals and institutions, this project would not have been possible.

vii
Abstract
This report discusses impacts of Hurricane/Post Tropical Cyclone Sandy on fishing and fishing-related businesses in New York and New Jersey one year after landfall. It describes major factors leading to different levels of impact on different sectors and some reasons behind these different impact levels. Further examined are types of impediments to recovery, aids to recovery, and community impacts. It concludes with 1) two factors that can potentially improve response to, and lessen impacts of future natural disasters and 2) lessons learned by the researchers.

viii
Executive Summary
This report examines how the commercial and recreational fishing industries in New York and New Jersey were affected by impacts from Hurricane/Post Tropical Cyclone Sandy (hereafter, Sandy) in the 12 months after it made landfall near Brigantine, New Jersey, on October 29, 2012. Results are primarily based on a voluntary survey of 958 fishing and fishing-related businesses: commercial and for-hire (charter and party) fishing vessel owners/permit or license holders; and seafood dealers; marina, bait and tackle store, and aquaculture facility owners or managers. Also included are pre- and post-storm analyses of National Marine Fisheries Service (NMFS) commercial landings and recreational angler activity data.
While the immediate impact of the storm on fishing communities in these states was profound and previously documented by NMFS, this report provides information on longer-term impacts to communities and businesses. The devastating impacts on coastal infrastructure meant that many businesses needed time to understand the full extent of damages. After a year had passed, they were better able to assess damages and were also able to assess impacts to revenues. Impacts on crew and employee jobs were clearer. Participants could also speak to impacts on their communities. Some fishermen and other business owners will never return to their previous occupations, while many have literally picked up the pieces and re-entered the industry. They are harvesting stocks that responded to the storm in a variety of ways and rebuilding their customer bases along with their places of business. Encouragingly, nearly three-quarters of those surveyed indicated they learned something from Sandy that would help them prepare for and react to future storms.
Based on the NMFS data, a number of fish and shellfish species commonly targeted by both commercial and for-hire fishermen had immediate decreases in landings after the storm, with decreased landings for some species lasting well into the post-storm year. However, it is not clear how much these changes (especially in the early months) are due to direct impacts on fish and habitat versus decreased fishing activity due to damaged docks and vessels or un-related regulatory changes or shifts in consumer demand. Recreational data also showed decreases in trips for shore-based and private-vessel anglers, but not for for-hire anglers. The changes (generally decreases) in commercial landings and some recreational angler activity occurred at the same time that fishermen and fishing-related businesses were coping with physical damages to businesses (and often homes), revenue losses, and logistical challenges. Whether or not documented changes in commercial landings were due solely to the storm, they would have had ripple effects beyond commercial and recreational fishermen to shoreside businesses such as bait and tackle stores, seafood dealers, marinas, and aquaculture facilities. Close to half of the respondents, for instance, saw changes to their community in the year following Sandy. Many affected communities were still rebuilding, a process that was complicated by changes in zoning, ordinances, and regulations that were attributed to Sandy.
The survey found that the vast majority of participants reported impacts, but that not all fishing and fishing-related business sectors were impacted equally or had the same needs for recovery. Commercial fishermen were most concerned about stock recovery and clean-up of marine debris. For-hire fishermen and fishing-related businesses were generally most concerned about rebuilding their customer base and repairing physical damages to facilities, boats, and docks. Commercial fishermen more frequently reported physical damages/losses than did for-hire fishermen, perhaps because of their greater use of fixed gear such as pots/traps that might have remained in the water. As might be expected, larger vessels (35+ ft, in a fleet with average length of 36 ft) had larger dollar amounts of damages/losses than smaller vessels. In terms of revenue change, however, smaller vessels had statistically significantly larger

ix
proportional revenue losses (measured as a percentage of their annual revenue). About half of all fishing and fishing-related businesses reported obstacles to recovery. Among the obstacles reported, the most common was time to get assistance: (e.g., from FEMA or insurance companies). The post–Sandy difficulty in recovering was also due in part to so many damages/losses not being fully insured or insured at all.
Overall uninsured damages/losses estimates to fishing and fishing-related businesses totaled $200 million in New York and $250 million in New Jersey. Overall, percent revenue loss to these businesses in New York was 26% and 31% in New Jersey. Not only were vessel and fishing-related business owners impacted, so too were fishing crew and fishing-related business employees. For close to 20% of commercial and for-hire fishing vessel owners, crew size showed decreases that were statistically significant. For the majority of these, it had not returned to pre-storm levels after 12 months. Among the 30% of fishing-related businesses reporting a drop in number of employees, both marinas and bait and tackle stores had statistically significant decreases. Similar to fishermen and crews, the majority of these businesses were not back to their normal number of employees after 12 months. These crew and employees are likely to have been at least temporarily unemployed. For those whose previous employers had not re-hired them after 12 months, they may have been hired by others in the same industries (in New York and New Jersey or elsewhere) or found work in non-fishing or related industries. The latter possibility would likely have been especially hard for crew, based on the many studies that show fishermen’s reluctance to leave the industry even in adverse economic circumstances (Smith and Clay 2010; Pollnac et al. 2014) and their frequent difficulty in adjusting to non-fishing jobs (Pollnac and Poggie 2008; Pollnac et al. 2014).
Two important results, however, point to ways to reduce impacts from future storms to commercial and recreational fishing industries, and coastal communities more broadly. 1. The role of social bonds in community recovery emerged from responses to questions on factors
aiding recovery. Social bonds have been found elsewhere to be of key importance in both evacuation and recovery (Aldrich and Sawada 2014; AP-NORC 2014; Tompson et al. 2013; Aldrich 2011), and can be fostered as part of future disaster preparedness planning (FEMA 2013; Magsino 2009; Shellong 2007). This finding also supports a U.S. goal of building community resilience to environmental hazards from climate change (CCPR 2014:34).
2. On a personal level, close to three-quarters of respondents said they learned something from Sandythat will help them prepare for future natural disasters of a similar nature. These lessons included how to best safeguard their vessels, make their infrastructure more resistant to future damage, have appropriate supplies and equipment on hand in advance, and pay closer attention to weather reports and evacuation orders.
Finally, lessons learned by the researchers are the importance of keeping baseline data and sample frames up to date. These two factors will facilitate and improve the ability to quickly and accurately assess impacts to future disasters, as well as to conduct impact assessments for regulatory changes.


1
Introduction
This report examines how the commercial and recreational fishing industries in New York and New Jersey were affected by impacts from Hurricane/Post Tropical Cyclone Sandy (hereafter, Sandy) in the 12 months immediately following its landfall near Brigantine, New Jersey, on October 29, 2012. Commercial and recreational fishing industries are mainstays of the economic, social and cultural lives of many residents of coastal communities in New York and New Jersey. Economic impacts examined are physical damages and/or losses1 and revenue changes. Social and community impacts examined are changes in employment, impediments to and supports for recovery, and lessons learned by those impacted.
The economic impacts of Sandy in the United States have been estimated to exceed $50 billion (Neria and Shultz 2012), making the storm second only to Hurricane Katrina as the costliest natural disaster in the nation’s history. Winds of 80 mph and a landfall in northern New Jersey, along with record storm surge flooding, caused the most deaths and property damage along the New York and New Jersey coastlines (NWS 2013). Three-quarters of the 117 U.S. deaths attributed to Sandy occurred in these two states (CDC 2013). Two weeks after the storm, on November 16, 2012, the Secretary of Commerce determined that a catastrophic regional fishery disaster had occurred in these two states due to the natural disaster (NOAA 2012). The fishery disaster declaration required NOAA’s National Marine Fisheries Service (NMFS) to conduct an impact assessment within 60 days (NMFS 2013:1). The 60-day assessment (NMFS 2013) began within two weeks of Sandy’s landfall and was based on survey and interview data. The assessment found that the immediate impacts of Sandy on the fishing and related industries included structural damage to docks, marinas, buildings, and boats; lost gear and equipment; and loss of customer base due to physical damages (NMFS 2013:29-33). Some fishermen and fishing-related business owners had also lost or had severe damage to their homes.
Although the immediate social and economic impacts of Sandy on the fishing industries of New York and New Jersey were staggering, natural disasters of this magnitude can have serious long-lasting effects as well. To meet the NMFS’ obligations under National Standard 8 that support sustained participation of fishing communities and help minimize any adverse economic impacts, NMFS conducted a survey from February through March of 2014 about conditions of fishing and fishing-related businesses 12-months after the storm. This provided adequate time to fully assess the extent of the storm’s impacts. The survey gathered social and economic data critical to the Agency’s ability to understand the longer-term social and economic impacts of Hurricane Sandy on commercial and recreational fishing industries and communities. Those results form the core of this report. Respondents were able to provide information on financial impacts based on the actual replacement value and/or professional estimates. They were also able to provide information on revenue changes and discuss the process of recovery. This information was not available earlier, in part, because many people were waiting to hear from insurance companies and reconstruction had not yet begun. More details are provided in the sections below.
1 Damages can be repaired; losses must be replaced.

2
Background
The impacts of a major natural disaster are due partly to the force of the disaster itself and partly to the vulnerability of the people and places affected (Cutter et al. 2009, 2010; Manyena et al. 2013; see Clay and Olson 2008 for a fisheries-specific perspective). Locations on the coast, especially near the point of storm landfall, are highly vulnerable. Fishing businesses and other fishing infrastructure are usually on the coast or even in the water, leaving them particularly exposed to high winds and storm surges. Previous hurricanes have resulted in extensive damage to fishing vessels and onshore fishing infrastructure, as well as immediate and sometimes dramatic declines in recreational and commercial fish landings (NMFS 2007:2; Ingles 2008).
Commercial and recreational fishing industries play important roles in the local economy and the social and cultural fabric of many communities along the coasts of New York and New Jersey (see Figure 1 and Figure 2). People in fishing and fishing-related businesses can have both their homes and their entire livelihoods devastated by such storms. Fishing communities everywhere must adapt as fishery stock abundance, business conditions, and fishing rules change. Some Northeastern fishing communities struggle with this more than others. Where scarce fish and the accompanying management restrictions are driving social and economic adversity, a natural disaster compounds the downward trend. As noted by Acting Secretary of Commerce, Rebecca Blank, in her fisheries disaster declaration (NOAA 2012), “We are taking action because of the storm’s devastating impact on the people who live and work in coastal communities that were hit hard by Sandy. Many of these hardworking Americans depend on a robust fishing industry to support their families and local economies.”
a. New York and New Jersey Fishing Industries and Coastal Communities
To evaluate impacts of Sandy, it is important to understand the longstanding economic, social, and fisheries conditions in New York and New Jersey. Both states have commercial and recreational fishing industries that support vibrant fishing communities and contribute to the broader coastal and state economies (NMFS 2013:1-2). This section provides background information on the importance of commercial and recreational fishing to the two states in 2012. Indicators of fishing community dependence on commercial and recreational fishing are mapped to illustrate the geographic range and importance of these industries in both states. A comparison is then provided between average monthly commercial landings for the 5-year period prior to Sandy (November 2007 through October 2012) and the 12-month post-storm period (November 2012 to October 2013). A pre- and post-storm comparison is also made for trips by recreational anglers.

3
i. Importance of Fishing and Seafood Industries to the State Economies
Commercial and recreational fishing are important economic drivers of the New York and New Jersey state economies as can be seen in Table 1.
Table 1. Fishing Industry Economic Impacts in New York and New Jersey (commercial numbers are without imports) (data from NMFS 2014)
Sales Contributions to GSP* Jobs Contributions
to State Income New York
Commercial $144 million $70 million 3,100 $50 million
Recreational $381 million $241 million 3,000 $151 million
New Jersey Commercial $717 million $342 million 8,800 $238 million
Recreational $1.9 billion $1.1 billion 13,100 $711 million
*GSP is Gross State Product
ii. Community Dependence on Commercial and Recreational Fishing
Coastal towns and cities in New York and New Jersey depend on fisheries to different degrees. Although this report will concentrate on evaluations of overall and state-level impacts, people experience these impacts differently according to where they live. This variation by place can be shown through evaluations of community dependence on fishing. Indices of commercial and recreational fishing activity are used to compare the relative levels of fishing dependence in New York and New Jersey coastal communities (Jepson and Colburn 2013). The indices were developed using NMFS data (see Table 2). For example, an index of commercial fishing engagement is based on NMFS data for total dollar value of landings, total weight of landings in pounds, and numbers of seafood dealers and federal fishing permits. To create an index of commercial fishing reliance, the commercial fishing engagement variables were divided by the population size of a community, creating a per capita measure. Recreational fishing engagement was calculated using NMFS Marine Recreational Information Program (MRIP) data on shore-based, private vessel, and for-hire (charter and party) vessel angler activity. Recreational fishing reliance was then calculated by taking into account community population size, resulting in a per capita measure.
Communities were then given scores of high, moderate, or low for commercial and recreational fishing dependence based on the fishing engagement and reliance indices (Table 2). Figures 1 and 2 illustrate the geographic distribution and importance of both commercial and recreational fishing sectors in New York and New Jersey. Some communities have both high commercial and recreational engagement and/or reliance (e.g., Freeport, Hampton Bays/Shinnecock, and Montauk in New York and Belford, Barnegat Light, and Cape May in New Jersey). Other communities are more dependent on one fishing sector only.

4
Table 2. The Variables used in Fishing Dependence Indices (Source: Jepson and Colburn 2013: Table 3)
Fishing Dependence Indices Recreational Fishing Reliance Index Recreational Fishing Engagement Index Per capita for-hire vessel angler activity For-hire vessel angler activity Per capita private vessel angler activity Private vessel angler activity Per capita shore-based angler activity Shore-based angler activity Commercial Fishing Reliance Index Commercial Fishing Engagement Index Per capita value of landing Dollar value of commercial landings Per capita number of commercial fishing permits Number of commercial fishing permits Per capita number of dealers with landings Dealers with landings Percent of community jobs in agriculture, forestry and fishing
Pounds of commercial landings
Figure 1. Commercial Fisheries Dependence in New York and New Jersey (map a – Commercial Engagement; map b – Commercial Reliance)
a b

5
Figure 2. Recreational Fisheries Dependence in New York and New Jersey (map a –
Recreational Engagement; map b – Recreational Reliance)
iii. Commercial Fisheries Landings Data Analyses Assessments of trends in commercial landed weight in pounds and recreational angler activity can be used to evaluate impacts on fishing-dependent communities. For instance, there was a reduction in landings for some commercial species in New York and New Jersey immediately after the storm. This reduction is similar to what occurred after Hurricane Katrina and other large hurricanes in the United States (NMFS 2007:2). At this point, however, it is impossible to know whether the post-storm changes are due to the storm alone. Post-storm changes in fishing for individual species may also be due to normal annual landings variability, shifts in consumer demand, changes in fisheries regulations, long-term environmental changes or some combination of factors. Damaged fishing and shoreside infrastructure that limited access and the need to rebuild homes may also have played some role in reduced landings immediately after the storm. Species that are expected to experience the heaviest impacts from the storm surge and coastal waves of an intense storm such as Sandy are the benthic (deep water) shellfish (e.g., scallops), demersal finfish (bottomfish such as flounders, cod, and monkfish), and inshore estuarine species (e.g., crabs, lobster, croaker, and spot) (scientific names available in Appendix A). This is because the impacts of hurricanes on habitat are more severe in coastal and estuarine areas. However, severe storms can also create conditions where offshore species are displaced. Further, fishery productivity may be affected by storm impacts on recruitment and reproduction of shellfish populations. Severe storms may also influence water temperature and nutrient availability in the days to weeks after a storm, causing some nearshore finfish to move to new areas (HSS 2013; Greening et al. 2006).
a b

6
A monthly five-year pre-storm average was calculated from NMFS landings data (in pounds and value)
for November 2007 through October 2012 for 57 categories2 of species important to New York and New
Jersey (see Appendix A for full list). These monthly averages were compared to actual monthly landed
pounds/value for each of the first 12 months of the post-storm year (November 2012 through October
2013). The pattern in monthly post-storm pounds/value for all analyzed species combined differs from the
pre-storm averages in both states, but with some important differences (Figure 3 and Figure 4). The post-
storm landings were depressed from November 2012 through March 2013 (5 months after the storm) in
both states. After March 2013 the landings improved, but more strongly in New York than in New Jersey.
Pre- and post-storm analysis of the dollar value of landings followed a similar pattern to pounds landed in
each state.
Figure 3. Graph comparing weight in pounds landed in the state of New York between the
pre-storm five-year average and the post-storm year
2 Of these 57 categories, 55 are individual species, one is a combined group of silver hake/offshore hake, and one is
a grouping of various species of skates. The complete list is found in Appendix A. For those landings for which only
the year is recorded, these landings were allocated across months proportional to the percentage of total annual catch
of that species landed each month.
-
500,000
1,000,000
1,500,000
2,000,000
2,500,000
3,000,000
3,500,000
4,000,000
4,500,000
5,000,000
Nov Dec Jan Feb Mar Apr May Jun Jul Aug Sep Oct
Pre-storm Average
Post-storm Year

7
Figure 4. Graph comparing weight in pounds landed in the state of New Jersey between the
pre-storm five-year average and the post-storm year
Additional analyses identified the individual species with statistically significant differences between the
landings pre- and post-storm.3 In New York nine species were identified, seven of which decreased. The
monthly landings patterns of the five species with greatest differences in each state are presented below.
We cannot clearly attribute these changes to Sandy in all cases, as noted above. However, no matter the
cause or causes, these decreases in landings would mean less income as individuals and businesses were
recovering from the storm.
New York
Total New York post-storm landings were near five-year averages in May, June, and July and higher than
five-year averages in August to October 2013 (Figure 3). However, the higher landings in August to
October depended largely on species that had no post-storm declines (e.g., bluefish, skates, horseshoe
crabs, and Loligo squid. Three of the species with the greatest differences in landings between pre- and
post-storm had a dramatic shift in landings for the entire post-storm year (Figure 5). Atlantic surfclam
landings drastically decreased after the storm and had not reached pre-storm levels by October 2013.
Atlantic sea scallop and Atlantic mackerel landings were much lower in the spring and summer of 2013
3 The term “statistical significance” refers to the likelihood that a relationship being tested is caused by something
other than chance alone. The “p value” obtained as a result of a statistical test represents the probability that random
chance could explain the result. More precisely, the p value is the calculated probability of rejecting the null
hypothesis, i.e., rejecting the idea that there is no difference between the groups being compared, when such
hypothesis is in fact true. The smaller the p value the stronger the significance of the differences observed between
the groups being compared. Conventionally, a p value must be less than 0.05 (a probability of less than 5%) to be
considered statistically significant. P values for statistically significant relationships are usually presented as less
than 0.05, less than 0.01, and less than 0.001, meaning that the probability of rejecting the null hypothesis when such
hypothesis is true is 1 in 20, 1 in 100, and 1 in 1,000, respectively.
0
5,000,000
10,000,000
15,000,000
20,000,000
25,000,000
30,000,000
NOV DEC JAN FEB MAR APR MAY JUN JUL AUG SEP OCT
Pre-storm Average
Post-storm Year

8
than the five-year average. Sand dab flounder (windowpane flounder) and white hake had much smaller
changes in landings, but a similar pattern (Figure 5). The same five species with statistically significant
changes between the pre- and post-storm periods also showed the greatest changes in dollar value of
landed pounds.
Figure 5. New York - Top five species showing a change in pounds landed between the pre-storm
five-year average and post-storm actual landed pounds
* Note: Atlantic surfclam landings are plotted on a secondary axis (on the right) to improve
visualization (change in scale).
New Jersey
New Jersey landings overall were nearly restored to five-year averages in July by a surge in Atlantic
menhaden landings. However, landings were substantially below five-year averages in all other months
(Figure 4). Of the species having statistically significant changes in landed pounds, the five species with
the greatest difference in pounds landed after Sandy are graphed in Figure 6. Atlantic surfclam landings
were consistent through all months pre-storm, yet dropped nearly in half immediately after Sandy and
remained depressed for the whole post-storm year. Illex squid and Atlantic menhaden had peak landings
in June to September pre-storm, but never reached those levels in the post-storm year. Peak landings of
Illex squid in July and August post-storm were between one-third and one-half of the pre-storm peak.
Atlantic menhaden landings exceeded pre-storm levels in July 2013, but landings in June, August,
September and October were well below pre-storm levels. Atlantic sea scallop in New Jersey had a
pattern similar to New York with a depression of landings in February to September 2013. Atlantic
mackerel landings in the five-year pre-storm period peak in January to March but did not reach even 10%
of pre-storm levels in any month in 2013. Four of five species that showed the most dramatic changes in
dollar value of landed pounds were the same as above. The fifth was goosefish (monkfish), replacing
Atlantic menhaden. Again, we cannot clearly attribute these changes to Sandy in all cases. However, no
matter the cause or causes, these decreases in landings would mean less income as individuals and
businesses were recovering from the storm.
-
200,000
400,000
600,000
800,000
1,000,000
1,200,000
1,400,000
1,600,000
1,800,000
-
20,000
40,000
60,000
80,000
100,000
120,000
140,000
Sand DabFlounder
White Hake
AtlanticMackerel
Sea Scallop
Surfclam

9
Figure 6. New Jersey - Top five species showing a change in pounds landed between the pre-storm five-year average and post-storm actual landed pounds
* Note: Pounds of Atlantic menhaden are plotted on a secondary axis (on the right) to improvevisualization (change in scale).
iv. Recreational Fisheries Angler Activity Analyses
A bi-monthly five-year pre-storm average was calculated from NMFS Marine Recreational Information Program (MRIP) data (in number of angler trips by two-month period) for November 2007 through October 2012 for shore-based, private vessel, and for-hire vessel anglers in New York and New Jersey. These bi-monthly averages were compared to bi-monthly total numbers of angler trips for the first 6 two-month periods of the post-storm year (November 2012 through October 2013).
New York
Shore-based angler trips declined from November–December to March–April, but returned to pre-storm levels by May–June (Figure 7). Many shoreside businesses reported that even after this period customers were slow to return, believing that the shoreline had not been rebuilt (see Results, below). In the summer, activity partially rebounded but was still lower in July–August than the pre-storm average. September–October post-storm was finally close to the pre-storm average. Angler trips by private vessels in New York notably decreased between pre- and post-storm from November–December to July–August, but regained pre-storm levels by September–October 2013. Trips by for-hire (charter and party) vessels were initially similar to the five-year average in the post-storm year but then showed an increase between May and October.
0
2,000,000
4,000,000
6,000,000
8,000,000
10,000,000
12,000,000
14,000,000
16,000,000
0
500,000
1,000,000
1,500,000
2,000,000
2,500,000
3,000,000
3,500,000
4,000,000
4,500,000
5,000,000
Menhaden (lb)lb
Atlantic Mackerel
Sea Scallop
Surfclam
Illex Squid
Menhaden*
Hurricane SandyOctober 29, 2012

10
Figure 7. Pre- and post-storm changes in recreational angler activity in New York
New Jersey Shore-based fishing in New Jersey also decreased in November-December and March-April but rebounded in the summer (Figure 8). However, summer shore-based angler trips for May to October 2013 never reached the levels they had pre-storm. Private vessel angler trips also notably declined in November–December and March–April and rebounded somewhat in the summer, but to lower levels than pre-storm. Trips by for-hire vessels in New Jersey showed an increase between May and October for the post-storm year.
Figure 8. Pre- and post-storm changes in recreational angler activity in New Jersey
The above changes (generally decreases) in commercial landings and recreational angler activity occurred at the same time as commercial and for-hire fishermen were coping with physical damages to businesses and often homes, revenue changes, and logistical challenges (described below). Whether or not the landings and angler activity changes were due to the storm or other factors discussed previously, losses of income and social activity associated with the hurricane likely complicated community and industry recovery. The remainder of this report presents the results of a survey focused on understanding the condition of the fishing and fishing-related businesses in New York and New Jersey one year after the storm.

11
Research methods
A voluntary confidential survey was designed to collect information on impacts from Sandy 12 months after landfall. Information was collected on general demographics, business impacts, community recovery, individual well-being (including views on preparedness for future natural disasters), and views on climate change. The survey was presented in three different versions (Appendix B) to better address each of the three specific focus populations: commercial fishermen, recreational for-hire fishermen, and fishing-related businesses (bait and tackle stores, marinas4, seafood dealers, and aquaculture facilities). The three questionnaires were comparable, with minor changes in wording adapted to address each population appropriately. NMFS contracted with CIC Research, Inc., a survey research firm with commercial and recreational fishing industry data collection experience. NMFS pre-tested the survey nine times before formal implementation in February through March of 2014.
a. Survey Design
This research was designed to obtain information from different business sectors involved in commercial and recreational fishing and related industries that might have been affected by Sandy in the states of New York and New Jersey. The survey was organized in five defined sections: 1) general demographics, 2) business impacts, 3) community recovery, 4) individual well-being and preparedness for future natural disasters, and 5) views on climate change.
Demographic information on position held in the business and respondent’s age was requested in all surveys. Surveys directed at commercial and recreational for-hire fishermen included questions specific to the respondent’s current fishery activity such as number of vessels owned, length of principal vessel, and primary target species. This demographic information was requested to allow us to better understand the unique characteristics of the fishing industry participants in New York and New Jersey.
Business impacts covered physical damages and/or losses, revenue changes, impediments to recovery, and aids to recovery. Community recovery focused on changes to the respondent’s community since the storm, reasons for these changes, and perceptions of potential changes in the future. Preparedness for future natural disasters focused on lessons learned that may improve the response to natural disasters in the future. Select questions from these sections are covered in this report. Two additional sections on personal well-being and climate change will be discussed in future publications.
b. Sampling Frame and Target Sample
The sampling frame5 consisted of 4,926 commercial fishing, recreational for-hire fishing, and fishing-related businesses operating in New York and New Jersey.
4 Some marinas have their own bait and tackle stores. In these cases the business was grouped under marinas. 5 The contact lists were based on the best and most comprehensive available data considered appropriate for the objectives of the survey. Therefore, the sampling frame may also be considered the survey population, i.e., the universe.

12
Table 3 shows the sampling frame and target sample size by sector and state. The target sample of 1,158 interviews was calculated based on a 5% confidence interval and a 95% confidence level.6 Because there is no single source of contact information on fishing and related industry participants, the sampling frame was assembled from multiple sources including NMFS fishing permit files, state fishing license files, marine industry organizations, the internet, and key informants. The number of federally permitted commercial and for-hire vessels was drawn from NMFS permit files. Information on commercial and for-hire fishermen with state permits was drawn from state license files. To reflect pre-storm conditions, 2012 permit and license databases were used. Seafood dealers were identified from NMFS and state agency databases.7 The number of marinas and bait and tackle stores was estimated based on marine trade association membership lists and internet searches. Aquaculture facilities were identified via shellfish association membership lists and key informants. The databases were screened for duplicate individuals with multiple permit types, including any combination of commercial fishing, recreational for-hire fishing, and/or seafood dealer permits. Recognizing that it is common for fishermen to hold some combination of commercial, recreational, and/or dealer permits, these instances were evaluated on a case-by-case basis to determine to which sector the individual would be assigned for the survey. Participants could be contacted in three possible ways: mail, phone, or in-person. Participants were selected for the mail survey using a stratified (by sector) random sample approach. The sample frame for the telephone survey consisted of both non-respondents from the mail survey and others who were not selected for the mail survey but had a telephone number. A small number of in-person interviews were conducted with respondents who had not completed the survey by mail or telephone, especially if they had participated in the 60-day assessment (see Dillman 2009 on multi-mode surveys). Table 3. Frequencies of potential frame of participants (universe) and target sample size for each sector total and by state TOTAL NY NJ SECTOR Universe Target Universe Target Universe Target Fishing-Related Businesses 2,054 559 1,093 284 961 275
Commercial Fishermen 1,661 360 772 205 889 155
For-Hire Fishermen 1,211 239 281 77 930 162
Total 4,926 1,158 2,146 566 2,780 592
6 Confidence interval and confidence level are used in statistics as measures of the reliability of an estimate. A confidence interval of 5% means that the true results range between minus or plus 5% of the results obtained and a confidence level of 95% means that the results obtained are true 95% of the time. Sample sizes were calculated to achieve these standards. 7 New Jersey state dealer permits are only required for lobster, summer flounder, and sea bass caught in state waters. Because of this, the sampling frame may under-represent New Jersey state-only dealers who do not buy these species and are thus not required to hold a state license. This is in contrast to the state of New York, where anyone who buys food fish or crustacea from a harvester, operates a facility for packing and shipping, or traffics in food fish or crustacea is required to have a state license.

13
c. Implementation
Nine hundred fifty-eight commercial and for-hire fishing vessel owners/permit or license holders, seafood dealers, and owners/managers of marinas, bait and tackle stores, and aquaculture facilities completed the survey. CIC Research, Inc., mailed 2,278 pre-survey notification packages to owners/representatives of federal commercial and for-hire permitted vessels, commercial and for-hire state license holders, federal and state permitted dealers, and owners of marinas, bait and tackle stores, and aquaculture facilities. The introductory package included a cover letter describing the survey8 and a list of frequently asked questions (FAQs) with answers about the survey (Appendix C). This was followed one week later by a survey package that included an introduction letter, questionnaire, and business reply envelope. A reminder postcard9 was mailed approximately seven days later. These postcards served two purposes: 1) to thank the respondent for participating and 2) to remind those who had not yet completed the survey, but intended to do so. A toll-free number was provided in all correspondence to aid respondent efforts to complete the survey. The deliverable rate was 88.1% overall for the mail survey. Less than 4.5% of surveys mailed to commercial and for-hire fishermen were undeliverable, while non-delivery for fishing-related businesses was higher at 17.7%. While not directly comparable, a current NMFS survey of bait and tackle stores only had a non-delivery rate of 20% in New York and 23% in New Jersey. The mail survey yielded a response rate of 21%. Overall, 83% of the targeted number of respondents completed the mail survey.
The mail survey was followed by a telephone survey effort. Each of the 4,038 potential respondents was called at least once during this portion of the survey. The refusal rate for the telephone survey was less than 10%. Appendix D, Table E1 shows the dialing results for the telephone segment. At the completion of the phone survey effort, a small number of face-to-face interviews were conducted with a subset of people who had not responded to either the mail or telephone surveys. In-depth ethnographic information, useful in the interpretation of the survey results, was also collected during the in-person survey administration. The geographic distribution of survey results showed good coverage across both states. In some cases contact information for fishermen and seafood dealers, only, was for an inland community and differed from the coastal community from which they kept their boat or operated (Figure 9).
8 Copies of the cover letter will be available online at the Social Sciences Branch of the Northeast Fisheries Science Center. 9 Copies of the postcard will be available online at the Social Sciences Branch of the Northeast Fisheries Science Center.

14
Figure 9. Geographic distribution of survey results at the community level
Survey Results This section presents results from analyses of the survey data. It is divided into two major sections: Characteristics of the Sample (descriptive demographic and business data) and Impacts from Sandy (economic and social). Economic impacts covered are physical damages and/or losses and revenue changes. Social impacts covered are employment changes, factors impeding/aiding recovery, perceptions of community changes since the storm, and lessons learned. Each major section describes, in turn, fishermen (commercial and for-hire sectors) and fishing-related business sectors (marinas, bait and tackle stores, seafood dealers, and aquaculture facilities). Results are generally reported by number of responses (frequencies) and percentages, or as averages10 (arithmetic means). When appropriate, various statistical tests were conducted to assess whether certain variations between groups were meaningful (statistically significant). Any such meaningful variations are noted, along with the level of statistical significance (represented by the p value11). Where there are no meaningful differences among fishermen or among fishing-related businesses, results are usually presented as group data, though tables or figures breaking out data by sector are often provided.
a. Characteristics of the Sample
i. Commercial and For-Hire Fishermen
A total of 522 commercial and for-hire fishermen were interviewed. They were chosen based on holding state fishing licenses from New York and/or New Jersey and/or holding federal fishing permits that were linked to addresses in New York or New Jersey. Overall, the average age of fishermen interviewed was 10 Averages are reported with standard deviations. Standard deviation (SD) is used to indicate the amount of variation of the data from the mean. A low SD indicates that the distribution of a variable is very close to the mean, while a high SD indicates that the values are spread apart. 11 See fn 3.

15
55 (SD = 11.8) and their average length of fishing experience was 28 years (SD = 15.4). There were no statistically significant differences between commercial and for-hire fishermen for either age or experience (p>0.0512). Table 4 provides the frequency (N) and percent of fishermen interviewed for each fishing sector by state.
Table 4. Frequency of fishermen interviewed by fishing sector NY NJ NY&NJ
FISHERY SECTOR N % N % N % Commercial 135 69.2 157 48.0 292 55.9 For-Hire 60 30.8 170 52.0 230 44.1 Total 195 100.0 327 100.0 522 100.0
Fishing is an important source of income in New York and New Jersey, as noted in the introduction. The majority of commercial fishermen interviewed for this survey (64%) listed fishing as their primary source of income, while the majority of for-hire fishermen (76%) listed it as a secondary source of income. From a different angle, of all fishermen (commercial and for-hire) with primary sources of income other than fishing (54% of the total), about 20% were retired, with the rest being employed elsewhere (mainly in non-fishing industries). Over 90% of both commercial and for-hire fishermen owned only 1 (most common) or 2 vessels. More than half of all vessels were 35 ft or less in length (Table 5), and the average vessel length was 36 ft (SD = 18.7).
Table 5. Primary vessel length for commercial and for-hire fishermen combined NY NJ NY&NJ
VESSEL LENGTH CATEGORY N % N % N %
35 ft or less 115 59.8 202 62.3 317 61.6 36-55 ft 54 27.8 78 24.1 132 25.6 56 ft or more 24 12.4 44 13.6 66 12.8 Total 193 100.0 324 100.0 515* 100.0
*Data on vessel length was not provided by seven of the 522 respondents.
The two most commonly used gear types overall were lines (includes rod and reel, hook and line, handline, longline, and trolling) and pots/traps (for finfish, crustaceans, and mollusks13). These were distributed somewhat differently by fishing sector and by state. In both New York and New Jersey, for-hire fishermen in the sample used almost exclusively “lines” (Table 6). Among commercial fishermen, both lines and pots/traps were used most frequently. New Jersey fishermen, however, favored pots/traps, while lines were somewhat more common in New York (Table 6, Figure 10).
12 T test statistic. 13 See Table 10 and Table 11, and accompanying footnotes for individual primary target species reported.
16
Table 6. Distribution of primary gear types for commercial and for-hire fishermen
COMMERCIAL FOR-HIRE
GEAR TYPE NY NJ NY NJ
N %* N %
* N %
* N %
*
LinesA 54 33.1 17 9.3 60 100.0 164 95.3
Pots and trapsB 39 23.9 95 52.2 -- -- -- --
Stationary netsC 20 12.3 22 12.1 -- -- -- --
DredgesD 11 6.7 24 13.2 -- -- -- --
Non-stationary netsE 21 12.9 10 5.5 -- -- 1 0.6
OtherF 18 11.0 14 7.6 -- -- 7 4.1
*Percentage of responses. Some respondents provided more than one answer per survey and therefore percentages
were calculated based on the total number of responses. A Includes rod and reel, hook and line, handline, longline, and trolling.
B Includes any pots and traps designed to catch finfish, crustaceans, and mollusks.
C Includes all types of gillnet, pound, fyke nets, and weirs.
D Includes scallop, hydraulic, and crab dredges.
E Includes all types of trawlers and seine nets.
F Includes all other gear types for which frequency of overall responses were below 5%.
Groundfish is the species group most often targeted by fishermen overall (Figure 10 and Figure 11), but
especially in New York. Bass species (mostly striped bass) were important as well, especially among for-
hire fishermen in both states. Highly migratory species such as tunas, wahoo, and swordfish accounted for
over 20% of responses from for-hire fishermen in New Jersey and 8% in New York. Among commercial
fishermen, New York followed the broader pattern, most often targeting groundfish. But in New Jersey,
the most reported target species for commercial fishermen were shellfish (such as scallops, clams, and
quahogs) and crustaceans (such as lobsters and crabs). Appendix F, Table F1 shows detailed frequencies
for species targeted by commercial and for-hire fishermen interviewed in New York and New Jersey.

17
Figure 10. Frequency of primary species targeted by commercial fishermen1
Figure 11. Frequency of primary species targeted by for-hire fishermen2
1 Percentage of responses (not respondents) is reported, as some respondents provided more than one answer.
Groundfish includes fluke/summer flounder goosefish/monkfish, scup, skates, butterfish, tautog, sea
robins (Peprilus triacanthus), tilefish, silver hake/whiting, and Atlantic cod, as well as the general responses
“groundfish” and “bottomfish.” Bass includes striped bass and the general response “bass.” Highly migratory
includes tunas (Thunnini), wahoo (Acanthocybium solandri), swordfish (Xiphias gladius), sharks (Selachimorpha),
marlin (Istiophoridae), and Atlantic dolphinfish (Coryphaena hippurus). Shellfish includes scallops, clams
(Mercenaria mercenaria; Mya arenaria), conch (Strombidae), whelk (Buccinum undatum), oysters (Crassostrea
virginica), and the general response “shellfish.” Crustaceans includes American lobster (Homarus Americanus) and
crabs. Squid includes Loligo squid and the general response “squid.” Baitfish includes “minnows” and the general
response “bait fish.” Perch/White perch includes Morone americana and related species. Other includes all other
species for which total frequency of responses overall was below 5%. Note: If the scientific name for any species is
not listed here, it can be found in Appendix A. 2 See fn 14.
05
10152025303540
Per
cen
t o
f R
esp
on
ses
Commercial Fishermen's Primary Target Species
NY
NJ
05
10152025303540
Per
cen
t o
f R
esp
on
ses
For-Hire Fishermen's Primary Target Species
NY
NJ

18
Figure 12. Frequency of permit types among commercial fishermen
Figure 13. Frequency of permit types among for-hire fishermen
54.2%
54.4%
40.5%
40.3%
5.3%
5.3%
NJ
NY
License Types among Commercial Fishermen
Federal Permit State & Federal Permits State Permit
14.6%
36.8%
62.6%
61.4%
22.8%
1.8%
NJ
NY
License Types among For-Hire Fishermen
Federal Permit State & Federal Permits State Permit

19
ii. Fishing-Related Businesses
A total of 430 fishing-related businesses with facilities and/or licenses to operate in New York and New Jersey were surveyed. Table 7 provides the distribution of businesses surveyed for each sector by state. Average age of respondents from all fishing-related business sectors combined was 54 (SD = 12) and average years of experience in the business was 25.7 (SD = 15.2). Owners, CEOs, or presidents constituted 70% of respondents, followed by managers (21%), employees in non-management positions (7%), and “other” positions16 (1%).
Table 7. Distribution of surveyed fishing-related businesses by sector NY NJ NY&NJ
FISHING-RELATED BUSINESS SECTOR N % N % N %
Marinas* 94 47.0 141 62.4 235 54.6
Bait & Tackle Stores 44 21.5 50 22.1 94 21.9
Seafood Dealers 59 28.3 28 12.4 87 20.3
Aquaculture Facilities 7 3.2 7 3.1 14 3.2
Total 204 100.0 226 100.0 430 100.0 *Consists of marinas (including some that also have bait and tackle stores), yachtclubs, boat ramps (public or private), and boat yards.
Overall, the majority of respondents reported their respective fishing-related businesses as their primary source of income. Eighty percent of responses for most sectors reported their fishing-related business as primary, except for bait and tackle stores from New Jersey that were statistically significantly less likely to report this (only 66%, p<0.0517). Of the overall responses18 listing a different primary source of income (14%), the majority reported being self-employed or employed elsewhere, almost exclusively in non-fishing-related businesses.
b. Impacts from Sandy
To be classified as not impacted required negative responses to all three of the following overarching questions: 1) Did you have to stop operating at all due to Sandy? 2) Did your fishing business experience physical damages/losses19 due to Sandy? and 3) Was your revenue affected by Sandy during the 12 months following the storm? Of the 522 commercial and for-hire fishermen surveyed, 90% reported experiencing some type of impact from Hurricane Sandy. Among fishing-related businesses, 95% out of the 430 businesses surveyed reported experiencing impacts. By sector, 90% each of commercial and for-hire fishermen, 97% each of marinas and bait and tackle stores, 87% of seafood dealers, and 93% of aquaculture facilities reported being impacted.
16 All “other” positions were reported by respondents from the sector “marinas.” Positions were: Member of Board of Directors, Village Trustee, Commodore, and Director of Public Works. 17 Chi-square statistic. 18 Some respondents provided multiple responses regarding primary source of income. 19 See fn1.

20
i. Economic impacts
Fishermen and fishing-related businesses were asked for the value of various physical damages/losses to business-related property during the 12 months following the storm.20 They were also asked about percentage change in revenue due to the storm in that same time period. This section describes: 1) the average estimated value of physical damages/losses and percentage not insured and 2) the average estimated percentage change to total revenue. These values are provided first for commercial and for-hire fishermen and then for fishing-related businesses. Then statewide total values are provided for both damages/losses that were not insured and percent revenue change.
Commercial and For-Hire Fishermen
There were no statistically significant differences for value of physical damages/losses between New York and New Jersey (p<0.0521). Thus only combined New York and New Jersey results are presented.
Table 8 provides a summary of the total estimates for damages/losses from Sandy experienced by commercial and for-hire fishermen interviewed. The majority of fishermen said their value calculations were either personal estimates or based on repair/replacement costs (78% of responses). Only 17% had a professional estimate (e.g., by an insurance company). However, separate categories of physical infrastructure damage (docks, vessels, buildings, etc.) are often insured differently (with some not insured at all). This means that for any individual business there will be a mixture of professional estimates and personal estimates/repair or replacement costs. Further, the difference in average value of damages between professional estimates and personal estimates/repair or replacement costs is not statistically significant. Commercial and recreational fishermen who experienced physical damages/losses reported comparable dollar amounts (p>0.05), but statistically significantly more commercial fishermen than for-hire fishermen reported damages/losses (p<0.0122). Detailed level data, by item damaged/lost and by state for each fishing sector, can be found in Appendix F, Tables F1 through F6.
Table 8. Fishermen responses on average total costs for physical damages/losses
Physical Damages/Losses Average Value of Damages/Losses (SD)
Average Insurance Coverage* (SD)
FISHING SECTOR Yes No $ % Commercial 166 (57.2%) 124 (42.8%) 39,888 (93,040) 8.8 (6.42) For-Hire 102 (44.3%) 128 (55.7%) 29,803 (62,872) 17.8 (16.9) Total** 268 (100%) 252 (100%) 35,979 (82,675) 13.3 (12.8)
* Based on average insurance coverage for each item listed in Appendix F.** Total sums for counts and overall mean values.
20 Total value of damages/losses was calculated by summing the individual item costs listed by respondents. A very small number of respondents (less than 5%) did not provide a breakdown of costs by item, but instead gave only an estimate of the total value. For those, the total amount provided was used. 21 Mann-Whitney U statistic was used for all mean value comparisons between two independent groups involving total value of physical damages/losses and percent revenue lost. Comparisons involving multiple groups were conducted using Kruskal-Wallis one-way analysis of variance. Non-parametric tests were chosen in order to account for non-normality of data distribution and the presence of outliers. 22 Chi-square statistic.

21
Turning to revenue, the majority of all fishermen who reported revenue changes as a result of Sandy indicated a decrease. No commercial fishermen reported an increase, and only two for-hire fishermen did. These two fishermen were from New Jersey and reported revenue gains of 10% and 20%. The gains were due to an increase in business because other for-hire vessels had more damage/losses and were unable to operate. Because the percentage of fishermen who reported increases in revenue was so small, the analyses below involving revenue change are based on only the 99% who reported revenue losses or no change. The majority of fishermen in this group (72%) reported revenue losses during the 12 months following Sandy (i.e., 28% reported no change). When the 72% were compared in terms of percentage revenue lost, commercial and for-hire fishermen reported similar values (p>0.05); that is, they lost proportionally about the same amount of revenue (Table 9).
Table 9. Responses from fishermen interviewed regarding occurrence of changes in revenue associated with Sandy and percentage of revenue loss (the two instances of income gain are not included) Revenue Losses Average Percent of
Revenue Lost (SD) FISHING SECTOR Yes No % Commercial 209 (72.6%) 79 (27.4%) 45.2 (28.9) For-Hire 167 (73.2%) 61 (26.8%) 45.6 (30.1) Total* 376 (73%) 140 (27%) 45.4 (29.4)
*Total sums for counts and overall mean values.
Commercial fishermen most often reported revenue loss due to the option a decrease in the availability of fish (27%). They often reported in supplementary comments23 that the “bottom” was moved around so the usual fish migrated elsewhere. One fisherman said: “Blue crab got up and moved offshore when the storm came,” and many others noted crabs “were gone.” Other reported changes in fish patterns included: “Seasons do not coincide with past fishing seasons due to habitat changes” and “Species not seen much before like croaker are now appearing.” As noted earlier, it is not possible to directly connect these impacts to Sandy, or to the storm alone. However, decreases in landings after hurricanes have been previously documented (NMFS 2007). For-hire fishermen most often reported that revenue was affected by the option a decrease in business and/or customer base (32% of responses). One for-hire operator added: “Not a lot of our customers knew we were sailing. It was an issue into the spring.” Both commercial and for-hire fishermen also frequently reported revenue losses from having to end the fishing season early or start the following season late (24% of commercial and 28% of for-hire responses). For these fishermen, interruption of the normal fishing season was related to damages/losses to their own equipment or to other businesses that they depend on. As one commercial fisherman noted: “My fuel, bait, and ice suppliers were out of business till the next season.” In addition, some fishermen had to see to their personal recovery, including damaged or destroyed homes. Two other possible factors affecting revenue are time fishermen were unable to fish and/or unable to access critical fishing-related infrastructure. Overall, they reported being unable to fish for 94 days on average (SD = 122.6) and unable to access infrastructure for 73 days on average (SD = 100.1).
23 The comments, also referred to as quotations, used in this report were drawn from responses to open ended questions. Each comment was content analyzed and coded to identify high frequency categories of responses. Specific comments from high frequency categories were then selected for inclusion in this report to provide contextual depth for the interpretation of the statistical results.

22
Differences between commercial and for-hire fishermen were not statistically significant (p>0.0524). Specific issues included damaged docks or damaged and/or lost vessels and gear. Shellfish beds were closed due to pollution and presence of debris in the water. In some areas, built-up silt in the water blocked access to docks and required dredging. Some fishermen reported at the time of the interviews (early 2014) that they were still unable to fish or had gone out of business completely or for an indefinite period of time. One commercial fisherman permanently stopped because he “[…] lost everything: all the traps that I had, all my conch pots and crab pots.” A for-hire fisherman who “never started [fishing] again” simply said he is “no longer in business due to storm damages.” Another for-hire fisherman said: “I stopped completely, I lost my boat.” Although these responses represented a small percentage of the total fishermen interviewed (4% of commercial and 6% of for-hire), they illustrate the types of severe impacts that Sandy had on the fishing industry of New York and New Jersey. Because large and small vessels can be differently impacted, due to range and sometimes species caught, damages/losses and percent lost revenue were also analyzed by vessel size. Because there were fewer vessels in the categories “medium” and “large” (see Table 5) than in “small”, for this analysis medium and large vessels were grouped together as “large.” This created two distinct size categories: 35 ft or less and more than 35 ft . Smaller vessels reported losing a statistically significantly higher percentage of their revenue (p<0.001) (Table 10), in other words, a greater proportional impact. One small-vessel fisherman, for instance, stated: “Before the storm I fished with approximately 1,350 traps. I now fish with about 900. This decrease of about 450 in gear and losing 6 months of work was a real disaster.” Another said: “[I’m] still trying to rebuild [my] trap count to profitable level with fish pots, instead of developing further in other parts of the business. It consumes energy/time/money, leaving not enough of each for progressing forward.”
Table 10. Vessel size categories comparisons for mean values of physical damages/losses and percentage revenue loss
Average Value of Damages/Losses (SD)
Average Percent of Revenue Lost (SD)
VESSEL SIZE CATEGORY $ %
Small (<35ft) 19,817 (43,587) 50.3 (31.3) Large (>35ft) 61,102 (116,426) 37.6 (24.3)
Fishing-Related Businesses
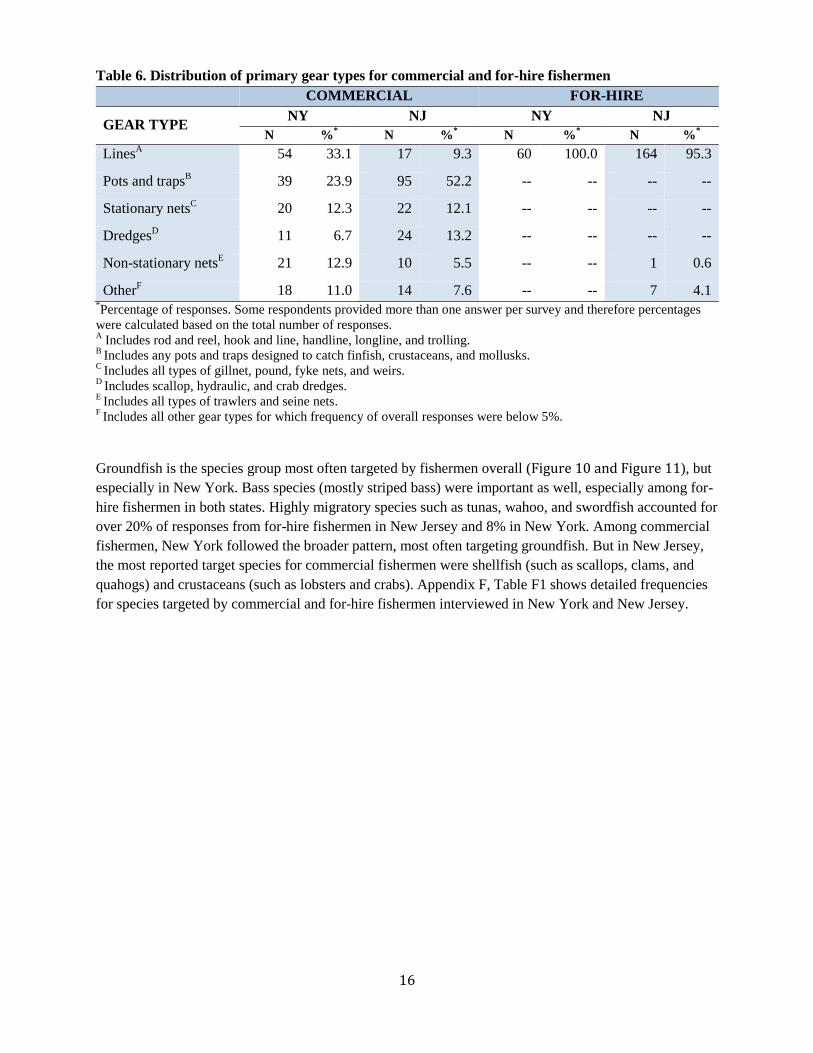
Among fishing-related sectors, the value of damages/losses was not statistically significantly different between states nor between most sectors (p>0.05). Thus, results will generally be provided for all fishing-related businesses in both New York and New Jersey combined. The majority of fishing-related businesses interviewed (79%) experienced physical damages/losses from Sandy. The same was true for each sector individually. Nonetheless, the percents by sector were sometimes statistically significantly different from one another (p<0.00125). For instance, for marinas the yes/no split is 92%/8% but for seafood dealers it is 55%/45% (Table 11). Average estimated damages/losses by sector are also found in Table 11. The majority of businesses reported that their value calculations were either personal estimates
24 T test statistic. 25 Chi-square statistic.
23
or based on repair/replacement costs (72% of responses). Only 27% had a professional estimate (e.g., by an insurance company). As for fishermen, separate categories of physical infrastructure damage (docks, buildings, etc.) are often insured differently (with some not insured at all). This means that for any individual business there will be a mixture of professional estimates and personal estimates/repair or replacement costs. The difference in average value of damages between professional estimates and personal estimates/repair or replacement costs is not statistically significant (p>0.05). Data by item damaged/lost and by state for each fishing-related sector can be found in Appendix F, Tables F1 through G6.
Table 11. Fishing-related business sector responses on average total costs for physical damages/losses
Physical Damages/Losses Average Value ofDamages/Losses
Average Insurance Coverage*
FISHING-RELATED BUSINESS SECTOR Yes No $ %
Marina 217 (92.3%) 18 (7.7%) 391,631 (SD = 664,077) 17.9 (SD = 10.3) Seafood Dealer 48 (55.2%) 39 (44.8%) 124,782 (SD = 254,489) 9.2 (SD = 11.1) Bait & Tackle 61 (64.9%) 33 (35.1%) 76,446 (SD = 93,307) 8.5 (SD = 7.5) Aquaculture 12 (85.7%) 2 (14.3%) 60,950 (SD = 70,283) 21.2 (SD = 18.7) Total** 338 (78.6%) 92 (21.4%) 218,298 (SD = 504,206) 14.3 (SD = 12.6)
* Based on average insurance coverage for each item listed in Appendix F.** Total sums for counts and overall mean values.
Only 4% of fishing-related businesses reported an increase in revenue as a result of Sandy. The majority of these businesses were marinas: seven in New York and five in New Jersey. One bait and tackle store from New Jersey and two from New York, as well as two seafood dealers each from New York and New Jersey, also reported increases in revenue. For the marinas, reasons were generally related to an increase in customer base due to damage to surrounding marinas (similar to the two New Jersey for-hire businesses described in the previous section), increases in repair and sales services, and insurance money associated with damages/losses to customers’ boats. Only one bait and tackle store explained the revenue increase, stating it was due to an increase in business because fishermen had to replace items lost during the storm. Seafood dealers with increases mentioned reasons not necessarily associated with Sandy, such as an expansion of the business and hard work. Because the percentage of businesses who reported increases in revenue was so small, the analyses below involving revenue change are based on only the 96% who reported revenue losses or no change.

24
Overall, most fishing-related businesses in this group (81%) reported revenue losses during the 12 months following Sandy (i.e., 19% reported no change). This was also true by sector (see Table 12). Businesses were compared in terms of percentage of lost revenue by sector and results showed no statistically significant differences (p>0.05). Revenue losses were essentially the same, proportionally, across all fishing-related business sectors.
Table 12. Responses from fishing-related businesses interviewed regarding changes in revenue associated with Sandy and percentage of revenue loss (the few instances of income gain are not included) Revenue Losses Average Percent of
Revenue Lost (SD) FISHING-RELATED BUSINESS SECTOR Yes No %
Bait & Tackle 81 (86.2%) 13 (13.8%) 37.1 (25.9) Seafood Dealer 65 (75.6%) 21 (24.4%) 32.5 (27.5) Marina 190 (81.2%) 44 (18.8%) 34.9 (22.2) Aquaculture 10 (71.4%) 4 (28.6%) 30.5 (24.0) Total* 346 (80.8%) 82 (19.2%) 34.9 (24.2)
*Total sums for counts and overall mean values.
Fishing-related businesses as a whole most often reported that revenue losses were caused by the options a decrease in business and/or customer base (43% of responses) and physical damages (24%). One marina owner explained: “A lot of people who lost their boats cannot afford to fix them; they are fixing houses not boats.” A bait and tackle store owner similarly reported: “Damage to docks, boats, and physical damages to homes and property kept recreational fishermen from going fishing. Some have still not recovered.” Decrease in business and/or customer base was also the most common response chosen by individual sector (about 45% of responses), except aquaculture. The decrease in customer base may be due in part to the decreases in shore-based angler and private vessel angler trips (see tables 7 and 8), as those anglers would have been customers for bait and tackle stores and, in some cases, marinas. The option physical damages (35%) was most important for aquaculture facilities. The second most common response chosen by sector was decrease in the availability of fish for bait and tackle stores and seafood dealers, physical damages for marinas, and pollution and/or presence of debris in the water for aquaculture. Overall, fishing-related businesses reported being unable to operate for an average of 62 days (SD = 86). For most businesses, inability to operate was related to damages/losses and lack of utilities such as electricity and water. Some seafood dealers reported a lack of product being delivered since fishermen were unable to fish. By sector, statistically significant differences in time closed for business were only found between seafood dealers and marinas (45 days, SD = 74.7 and 75 days, SD = 99.7, p<0.0526). Fishing-related businesses were unable to access infrastructure (docks, facilities, etc.) for 17 days on average (SD = 34.5), mainly due to flooded streets and the presence of debris, fallen trees, and sand on the streets. Differences between fishing-related business sectors for the option time unable to access
26 T test statistic.
25
infrastructure were not statistically significant (p>0.0527). In addition, some fishing-related business owners had to see to their personal recovery, including damaged or destroyed homes.
Total state damages/losses
Above, the report described results of economic impacts for the specific business owners/managers interviewed in various fishing and fishing-related businesses who experienced physical damages/losses as a consequence of Sandy. Here results are used to estimate total impacts for each state (New York and New Jersey).28 Estimated total value of physical damages/losses was calculated for each fishing and fishing-related business sector in New York and then New Jersey. For example, if average physical damages/losses in New York for sector “A” were $100 per business and 10 businesses were in that sector, the total physical damages/losses for the sector in New York would be $1,000. If the combined percent insurance coverage for all items was 15% for that sector, then the total insured damages/losses would be 15% of $1,000, or $150. The total damages/losses not insured, or the amount the sector businesses were responsible for, would be $1,000 minus $150, or $850. Total estimates to the studied populations for physical damages/losses for New York and New Jersey are presented in Tables 13 and 14.
Table 13. Estimation of total value of physical damages/losses for all sectors in New York PHYSICAL DAMAGES/LOSSES – NEW YORK
SECTOR Average Loss* Universe Total Loss
Estimate Average % Insured
Total Uninsured Loss
Commercial Fishermen $25,141 1,295 $32,558,204 9.5 $29,449,937 For-Hire Fishermen $2,482 358 $888,735 20.8 $704,085 Seafood Dealers $76,836 429 $32,962,468 5.9 $30,986,496 Bait & Tackle Stores $40,624 225 $9,140,368 10.2 $8,207,932 Marinas $312,325 534 $166,781,550 21.9 $130,115,794 Aquaculture Facilities $56,143 9 $505,286 14.6 $431,598 Total
-- 2,850 $242,836,611 -- $199,895,842 *See footnote 28 for important information on calculation of average values.
27 T test statistic. 28 Total state damages/losses estimates are calculated using the average value of physical damages/losses for the entire sample obtained from each state and not solely for those who experienced physical damages/losses and/or revenue losses as presented in tables 8, 10 and 11 for the two states combined. This was done in order to account for the portion of each state’s target population that did not experience any physical damages/losses when estimating total state losses, i.e. to avoid overestimation of values. Since the sample obtained in this study is considered a representative sample of the target population, the portion of respondents who stated that they did not experience physical damages/losses can be used as a fair representation of the portion of the target population at the state level who did not experience physical damages/losses from Sandy.

26
Table 14 Estimation of total value of physical damages/losses for all sectors in New Jersey PHYSICAL DAMAGES/LOSSES – NEW JERSEY
SECTOR Average Loss* Universe Total Loss
Estimate Average % Insured
Total Uninsured Loss
Commercial Fishermen $18,524 1,049 $19,431,812 8.1 $17,860,022 For-Hire Fishermen $16,655 985 $16,405,480 18.0 $13,448,319 Seafood Dealers $42,282 95 $4,016,837 12.5 $3,513,687 Bait & Tackle Stores $58,300 336 $19,588,860 9.7 $17,685,029 Marinas $377,842 618 $233,506,628 16.1 $195,993,671 Aquaculture Facilities $60,200 23 $1,384,600 18.7 $1,124,987 Total
-- 3,106 $294,334,219 -- $249,625,715 *See footnote 28 for important information on calculation of average values.
Total State Percent Revenue Losses Above, the report described results of revenue impacts for the specific business owners/managers interviewed in various fishing and fishing-related businesses that experienced revenue loss as a consequence of Sandy, i.e. only those whose revenue was affected by the storm. Here results from the overall sample are used to estimate total impacts for each state (New York and New Jersey).29 Estimated total value of percent revenue loss was calculated for each fishing and fishing-related business sector in New York and then New Jersey (Tables 15 and 16).
29 Total state percent revenue loss is calculated using the average percent revenue loss for the entire sample obtained from each state and not solely for those who experienced revenue losses as presented in tables 9, 10 and 12 for the two states combined. This was done in order to account for the portion of each state’s target population that did not experience any revenue loss when estimating total state percent loss, i.e. to avoid overestimation of values. Since the sample obtained in this study is considered a representative sample of the target population, the portion of respondents who stated that they did not experience revenue loss can be used as a fair representation of the portion of the target population at the state level who did not experience revenue loss from Sandy. In other words, for each state if, for example, 70% of the sample (those who responded to the survey) had revenue losses and 30% did not, then it is important to take both groups into account when calculating the average that will be used to represent revenue losses for each state as whole. This is different from looking just at the sample and the level of impact for those who did experience revenue loss, as in tables 9, 10 and 12.

27
Table 15. Frequency of yes/no responses and average percentage revenue loss reported for the entire sample for all sectors in New York
Revenue Losses Average Percent of Revenue Lost (SD)*
SECTOR Yes No % Commercial Fishermen 72% 28% 27% (30.7) For-Hire Fishermen 70% 30% 25% (29.5) Bait & Tackle 89% 11% 34% (28.6) Seafood Dealer 73% 27% 19% (26.2) Marina 77% 23% 22% (23.7) Aquaculture 86% 14% 25% (25.9) Total 75% 25% 26% (28.2)
*See footnote 29 for important information on calculation of average values.
Table 16. Frequency of yes/no responses and average percentage revenue loss reported for the entire sample for all sectors in New Jersey
Revenue Losses Average Percent of Revenue Lost (SD)*
SECTOR Yes No % Commercial Fishermen 73% 27% 32% (32.6) For-Hire Fishermen 75% 25% 35% (33.4) Bait & Tackle 84% 16% 26% (26.2) Seafood Dealer 81% 19% 27% (29.3) Marina 84% 16% 28% (24.8) Aquaculture 57% 43% 14% (22.9) Total 77% 23% 31% (30.4)
*See footnote 29 for important information on calculation of average values.
ii. Social Impacts Social impacts covered here are employment changes, factors impeding/aiding recovery, perceptions of community changes since the storm, and lessons learned. These are factors that may influence community and/or individual resilience and vulnerability in the face of natural disasters. Evaluating changes in the number of fishing vessel crew members and fishing-related business employees aids in understanding the effects of the storm on job security. Obstacles to recovery, factors contributing to recovery, and respondents’ views about community changes resulting from the storm were evaluated to better understand community recovery. Finally, had respondents learned anything from the storm that would help them prepare for future natural disasters? If so, these lessons learned might help other individuals and communities.

28
Some fishermen (17%) said their crew size changed (decreased) from an average of 4 (SD = 2.8) to an average of 2 (SD = 2.4), a statistically significant difference (p<0.00130). Of those whose crew size had changed, 86% said their crew size had not yet returned to pre-storm levels after 12 months. Among fishing-related businesses, 33% reported the number of their employees changed as a consequence of Sandy. Of those who reported that their number of employees had changed, 80% said that the number was not yet back to normal after 12 months. The same was true by sector. For those fishing-related businesses that reported a change in the number of employees, only bait and tackle stores and marinas reported changes that were statistically significant, in both cases decreases. Bait and tackle stores’ average number of employees before Sandy was 4 (SD = 4.0) and after was 3 (SD = 3.3) (p<0.001). The average number of marina employees pre-storm was 9 (SD = 15.6) and after was 8 (SD = 14.7) (p<0.001). One marina owner explained: “After clean-up I was forced to lay off my only employee until spring.” Of the bait and tackle stores that reported changes to their number of employees, 87% said that the number was not yet back to normal after 12 months. The same was true for 83% of marinas that reported changes to their number of employees as a consequence of Sandy. Most commonly, both fishermen (63%) and fishing-related businesses (39%) who reported impacts from Sandy did not report any obstacles to recovery. Among those who did report obstacles, the most commonly chosen option was time to get assistance (13% of fishermen and 21% of fishing-related business responses). Specific examples provided included bureaucratic difficulties and delays and difficulty finding material and people to do the labor because “they had too many jobs lined up.” Many people mentioned problems with FEMA. Some respondents specifically attributed assistance delays to “slow payments from insurance” or “waiting for insurance checks to start all the repairs.” Most frequently mentioned as contributing to recovery was the option family, friends, and community (22% of responses by all fishermen and 28% by fishing-related businesses), an indicator of social bonds.31 By sector, only for-hire fishermen did not choose family, friends, and community as their top answer. Although family, friends, and community were also important to for-hire fishermen (20%), their most common choice was no contributing factors to their recovery (34% of responses). One for-hire fisherman expressed this general frustration: “I’m waiting on state money. I’m maxed out on debt. I’m at the bitter end; have no more resources.” On the other hand, many fishermen and fishing-related businesses expressed a sense of community by talking in more detail about the “dedication of crew,” “faithful customers,” and “hard-working and willing-to-help people.” One seafood dealer said his recovery was due to “customer loyalty and local fishermen.” The options employees (16% of overall responses) and personal effort/work (15%) were also chosen by fishing-related businesses. One quote by a marina owner was emblematic of the majority of the responses chosen: “[t]he hard work and dedication of my employees and family.” Because all sectors (fishing and fishing-related) had almost identical answers to the question “Have there been any major changes to the community where your fishing/fishing-related business is located since Sandy?” these results are presented on an overall basis. Just over half of the respondents (58%) observed no major changes to the community where their business is located in the year following Sandy. For the remaining 42%, the most common responses were changes in zoning, ordinances, and regulations (17%),
30 Paired sample t-test statistic was used in all analyses comparing number of crew and employees before and after Sandy. 31 This is comparable to the measure friends, family, and neighbors used in Sandy studies by AP-NORC (2014) and Tompson et al. (2013) that show the importance of social bonds to preparedness and recovery.

29
rebuilding and redevelopment (15%), community still recovering/rebuilding (13%), and raising the height of homes located in floodplains (12%). A couple of comments highlight key community changes of concern to residents. According to one respondent, “Many homes in the area were damaged or destroyed. Many cannot rebuild due to building regulations changing since the storm.” Another described gentrification and population loss: “People are leaving houses abandoned, less people full-time. Some lower income individuals are gone from the area. Wealthier folks setting up vacation homes, fewer year-round residents.” A majority of all respondents (73%) said they learned something from Sandy that will help them prepare for future natural disasters of similar nature. The most frequently mentioned change people would make was move and secure equipment and/or vessels (29% of responses). For instance, people planned to “remove all gear from the water before a storm like this” and had learned “boats in the water fared better than boats out.” They also planned to improve physical structures (e.g., raising buildings per the new floodplain maps, increasing the height of banks) and obtain mitigation supplies and/or equipment (including generators, food, and freezers). Together improve physical structures and obtain mitigation supplies and/or equipment made up 18% of responses. The more general improve storm readiness and prepare earlier was similar at 14%. One respondent had learned “the importance of preparedness, having a contingency plan.” Another said he would “take evacuation seriously.” A smaller group echoed responses above regarding the importance of community, friends, and family, saying, for instance: “We learned that sticking together as fishermen and securing our vessels saved us from a major disaster” and “Most likely during an event like Sandy, the people (friends, family) right [by] you are most likely the ones who will help each other get through these storms/disasters.”
Summary This report examines the condition of fishing and fishing-related industries in New York and New Jersey one year after Sandy. While the immediate impact of the storm on fishing communities in these states was profound and previously documented, this report provides information on longer-term impacts to communities and businesses. The devastating impacts on coastal infrastructure meant that in many cases it was weeks or months before commercial or for-hire fishermen and owners of fishing-related businesses were able to assess or describe their losses in detail. Analyses of NMFS data show that a number of fish and shellfish species commonly targeted by both commercial and for-hire fishermen had immediate decreases in landings after the storm, with negative impacts for some species lasting well into the post-storm year. However, it is not clear how much these changes (especially in the early months) were due to direct impacts to fish and habitat versus decreased fishing activity due to damaged docks and vessels, or even shifts in consumer demand or changes in regulations. In addition to the impacts on business owners and their families, crew and employees have been affected by lost work time or, in some cases, lost employment altogether. Some fishermen and other business owners will never return to their previous occupations, while many have literally picked up the pieces and re-entered the industry, harvesting stocks that responded to the storm in a variety of ways and rebuilding their customer bases along with their places of business. Encouragingly, nearly three-quarters of those surveyed indicated they learned something from Sandy that would help them prepare for and react to future storms, regulations, and other hazards. Also worth noting is the degree to which social bond with friends, family, community, and employees made a difference in people’s recovery.

30
a. Impacts of Sandy
i. Economic Impacts The vast majority of participants in the study reported impacts, but not all fishing and fishing-related business sectors were impacted equally. Commercial fishermen were most concerned about stock recovery (analyses of NMFS landings data confirm decreases in landings, though precise attribution to Sandy cannot be made) and clean-up of marine debris (see NMFS 2007:43 on the similar impact of Katrina-related marine debris on Gulf Coast fishermen post-storm). For-hire fishermen and fishing-related businesses were generally most concerned about rebuilding their customer base and repairing physical damages to facilities, boats and docks. Although the initial NMFS assessment (2013:30) found that conditions steadily improved over the 4-week period following the storm (re. DOC 2013:4), this assessment found that many fishing and fishing-related businesses were still in the process of recovery after 12 months. A U.S. Department of Commerce (DOC) report on Sandy impacts on economic activity (DOC 2013:24) also found many businesses struggling a year later. Ingles (2008) reported the same for two fishing communities in Louisiana one year after Hurricane Katrina. Certainly the post Sandy difficulty in recovering was due in part to so many damages/losses not being fully insured (re. NMFS 2013:30; DOC 2013:8).
From another perspective, commercial fishermen more frequently reported physical damages/losses than did for-hire fishermen (statistically significant difference) (Table 13). Larger vessels (more than 35 ft) had larger dollar amounts of damages/losses than smaller vessels (35 ft or less) (statistically significant difference), in large part due simply to the greater initial cost of larger vessels and the larger amounts of gear and other equipment needed to operate them. In terms of revenue, however, smaller vessels had larger proportional percent loss than larger vessels (statistically significant difference). Overall uninsured damages/losses estimates totaled $200 million in New York and $250 million in New Jersey.32 Turning to revenue, 75% of fishermen and fishing-related businesses from New York, and 77% of fishermen and fishing-related businesses from New Jersey stated that their revenue was affected by Sandy in the 12 months following the storm. In terms of overall percentage revenue lost, in New York respondents reported a 26% loss and in New Jersey respondents reported a 31% loss. Those in all sectors whose primary source of income came from fishing or a related business may have been especially hard hit by the lost time and revenue, as well as the cost of repairs and replacements. For those whose fishing/fishing-related business was a secondary source of income, however, whether they were less hard hit would have depended on impacts to their primary source of income. Further, commercial and for-hire vessels were unable to fish for an average of three months, meaning they had to end their season early or start the following season late. They were also unable to access
32 The larger physical damage/loss numbers in this survey are due to multiple factors: 1) This survey had a larger number of respondents (60% more than in the 60-day assessment); 2) The mandated 60-day assessment, due to time constraints in formulating the sample, was able to acquire information only on fishermen with federal permits, while the population of this survey includes those with state permits (in fact, the largest group of fishermen interviewed have only state permits); 3) With more time, respondents to this survey were able to formulate a fuller estimate of all damages and had a better idea of what their insurance companies would cover; and 4) Damage caused by the storm limited access during the 60-day assessment to some of the hardest hit communities and thus potential survey respondents (among them some of the hardest hit).

31
infrastructure essential to their operations for an average of two and one-half months. Fishing-related businesses were unable to operate for an average of two months and to access infrastructure for just over two weeks on average. Given the importance of shoreside infrastructure (e.g., marina docks, bait and tackle stores) to fishermen, impacts to shoreside businesses would have impacted the ability of commercial and for-hire fishermen to work and private boat and shore-based anglers to pursue their recreational activities. Shore-based and private vessel angler trips were low for six months, four months longer than fishing-related businesses themselves were unable to operate. This helps to explain why marinas and bait and tackle stores reported decrease in business and/or customer base as the most important reason for revenue decreases.
ii. Social Impacts Not only were vessel and fishing-related business owners impacted, so too were fishing crew and fishing-related business employees. For approximately 20% of vessel owners, crew size had decreased by a statistically significant amount and generally not returned to pre-storm levels after 12 months. Among the approximately 30% of fishing-related businesses reporting a decrease in number of employees, both marinas and bait and tackle stores had statistically significant decreases, and their employee numbers had similarly not returned to pre-storm levels a year later. DOC (2013:4) reported that unemployment claims rose substantially immediately post-storm and were not back to pre-storm levels for four weeks. Thus, crew and employees who were let go would be expected to have been at least temporarily unemployed. That their previous employers had not re-hired them after 12 months does not mean they were still unemployed. However, crew would have had difficulty taking non-fishing jobs, given the many studies that show fishermen’s reluctance to leave the industry even in adverse economic circumstances (Smith and Clay 2010, Pollnac et al. 2014) and their frequent difficulty in adjusting to non-fishing jobs (Pollnac and Poggie 2008, Pollnac et al. 2014). Turning to recovery, most businesses reported no obstacles to recovery. Where there were obstacles, the most common was time to get assistance (e.g., from FEMA or insurance companies). For aids to recovery, the most frequent response was family, friends, and community, an indicator of social bonds (re. Hawkins and Maurer 2010 on impact of social bonds on New Orleans residents’ recovery after Katrina). Oberg et al. (In Press)33 also found in a case study that New Jersey fishermen in one port severely impacted by Sandy attributed their recovery to strong social bonds (re. Chamlee-Wright and Storr 2011 on the importance of narratives of social bonds in shaping recovery strategies). This also aligns with statistical studies showing that social capital/bonds are more important than economic capital, infrastructure, or level of damage in predicting levels of recovery (Aldrich 2011). Recent research in Japan also showed that social bonds were more important than seawalls in predicting full evacuation (Aldrich and Sawada 2014). Other research on Sandy (AP-NORC 2014; Tompson et al. 2013) has showed that communities and neighborhoods with stronger social bonds generally prepared better and recovered more quickly and completely. These results point to the need for further research on the role of social bonds in the resilience of fishing communities (re. CCPR 2014:34 on the importance of building community resilience to environmental hazards from climate change). Further, social bonds can be fostered as part of future disaster preparedness planning (FEMA 2013; Magsino 2009; Shellong 2007).
33 This work is based on results of the Rutgers-NMFS grant “Weathered Storms and Following Seas: Fisheries Recovery in the Wake of Hurricane Sandy.” National Science Foundation RAPID Grant, Award No. BCS-1318074. Bonnie McCay, Patricia M. Clay and Lisa Colburn, co-PIs.

32
It is also interesting that close to half of the respondents saw changes to the community where their fishing or fishing-related business is based in the year following Sandy. Many affected communities were still rebuilding, a process that was complicated by changes in zoning, ordinances, and regulations that respondents attributed to Sandy. In some cases communities were experiencing a shift away from year round residency to an increase in second home ownership. Especially since fishing communities on average have higher poverty rates than the national average (NMFS 2009:4), this has the potential to displace essential commercial and recreational fishing infrastructure (Colburn and Jepson 2012: 291). Petterson et al. (2006) found that gentrification increased in the immediate aftermath of Hurricane Katrina, with fishing industries and communities losing coastal land and infrastructure to tourism and second homes for wealthier individuals. Further, close to three quarters of respondents said they learned something from Sandy that will help them personally to prepare for future natural disasters of a similar nature: how to best safeguard their vessels, make their infrastructure more resistant to future damage, have appropriate supplies and equipment on hand in advance, and pay closer attention to weather reports and evacuation orders. This is a very encouraging result that can be built upon in the future, in part through strengthening social bonds.
Conclusions Major factors leading to different levels of impact on different fishing industry sectors in New York and New Jersey were: source of primary income, level of insurance coverage, and, in some cases, size of operation. Degree of impact was also driven by the relative dependence on and impacts to: the ocean (e.g., changes in fish stocks and debris in the water), infrastructure, and customer base. At the community level, a factor worth noting was that impacts to one business could cause ripple effects that led to greater overall community impacts (e.g., a downturn in for-hire or other recreational fishing means fewer customers for a bait and tackle store).The most chosen option for aid to recovery was family, friends, and community or social bonds. Social bonds were not a primary focus of the survey. However, the importance of social bonds in improving individual and community resilience has been shown in other disasters, though few such studies target fishing communities. The frequency of the response on social bonds in this survey indicates that more work will be important in the future to establish the exact relationship of strength of social bonds to level of recovery in fishing communities. In terms of modes of recovery, many respondents reported new building regulations in their communities after Sandy (e.g., new requirements from the National Flood Insurance Program). Although these changes will make communities safer in the long run, they will require financial outlays for home owners and businesses. After a hurricane, lower income individuals and industries are at risk due to increased rates of gentrification. Some fishing and fishing-related waterfront infrastructure is therefore expected to be repurposed, more so than would have occurred without the storm. Nonetheless, despite the severe impacts, or perhaps even because the severity brought them face-to-face with their own vulnerability, many individuals feel they have learned from Sandy how to better prepare for and react to future storms and other disasters and hazards. This may ultimately be a key factor in reducing impacts from future storms to commercial and recreational fishing industries, and coastal communities more broadly. Finally, lessons learned by the researchers are the importance of keeping baseline data and sample frames up to date. These two factors will facilitate and improve the ability to quickly and accurately assess impacts to future disasters, as well as to conduct impact assessments for regulatory changes.

33
References
Aldrich, Daniel P. and Yasuyuki Sawada. 2014. “The Physical and Social Determinants of Mortality in the 3.11 Tsunami.” GPRI Working Paper. Online at: http://papers.ssrn.com/sol3/papers.cfm?abstract_id=2421779 Aldrich, Daniel P. 2011. “The Power of People: Social Capital’s Role in Recovery from the 1995 Kobe Earthquake.” Natural Hazards 56(3):595-611. AP-NORC. 2014. Two Years after Superstorm Sandy: Resilience in Twelve Neighborhoods. The Associated Press-NORC Center for Public Affairs Research. NORC at the University of Chicago. Online at: http://www.apnorc.org/PDFs/Sandy/Sandy%20Phase%202%20Report_Final.pdf CDC (US Centers for Disease Control and Prevention). 2013. “Deaths Associated with Hurricane Sandy – October – November 2012”. Morbidity and Mortality Weekly Report (MMWR). Online at: http://www.cdc.gov/mmwr/preview/mmwrhtml/mm6220a1.htm Chamlee-Wright, Emily and Virgil Henry Storr. 2011. Social capital as collective narratives and post-disaster community recovery. The Sociological Review 59(2):266-282. Clay, Patricia M. and Julia Olson. 2008. “Defining ‘Fishing Communities’: Vulnerability and the Magnuson-Stevens Fisheries Conservation and Management Act.” Special section on “Vulnerability and Resilience in the Fisheries.” Patricia Pinto da Silva and Madeleine Hall, Arber, Guest editors. Human Ecology Review 15(2):143-160. Colburn, Lisa L. and Michael Jepson. 2012. “Social Indicators of Gentrification Pressure in Fishing Communities: A Context for Social Impact Assessment.” Coastal Management 40:289-300. CCPR (Council on Climate Preparedness and Resilience). 2014. Priority Agenda. Enhancing the Climate Resilience of America’s Natural Resources. The Departments of Defense, Interior, and Agriculture, the Environmental Protection Agency, the National Oceanic and Atmospheric Administration, the Federal Emergency Management Agency, and the U.S. Army Corps of Engineers. Online at: http://www.whitehouse.gov/sites/default/files/docs/enhancing_climate_resilience_of_americas_natural_resources.pdf Cutter, Susan L., Christopher G. Burton and Christopher T. Emrich. 2010. “Disaster Resilience Indicators for Benchmarking Baseline Conditions.” Journal of Homeland Security and Emergency Management 7(1):1547-7355. Cutter, Susan L., Christopher T. Emrich, Jennifer J. Webb, and Daniel Morath. 2009. “Social Vulnerability to Climate Variability Hazards: A Review of the Literature.” Final Report to Oxfam America. Online at: http://adapt.oxfamamerica.org/resources/Literature_Review.pdf Dillman, Don A., Jolene D. Smyth and Leah Melani Christian. 2009. Internet, Mail and Mixed-Mode Surveys: The Tailored Design Method. John Wiley and Sons, Inc., New York.

34
DOC (US Department of Commerce). 2013. “Economic Impact of Hurricane Sandy Potential Economic Activity Lost and Gained in New Jersey and New York.” U.S. Department of Commerce Economics and Statistics Administration Office of the Chief Economist. Online at: http://www.esa.doc.gov/sites/default/files/reports/documents/sandyfinal101713.pdf FEMA. 2013. Neighbors Helping Neighbors through Preparedness. Online at: http://www.ready.gov/neighbors-helping-neighbors-through-preparedness Greening, Holly, Peter Doering and Catherine Corbett. 2006. Hurricane Impacts on Coastal Ecosystems. Estuaries and Coasts 29(6):877-879. Hawkins, Robert L. and Katherine Maurer. 2010. Bonding, Bridging and Linking: How Social Capital Operated in New Orleans following Hurricane Katrina. British Journal of Social Work 40:1777–1793. HSS (Hurricanes: Science and Society). 2013. “Aquatic Impacts.” A joint site of the Univ. of Rhode Island Graduate School of Oceanography and the National Science Foundation. Online at: http://www.hurricanescience.org/society/impacts/environmentalimpacts/aquaticimpacts/ Ingles, Palma 2008. “Sunken boats, tangled nets, and disrupted lives: impacts of Hurricane Katrina on two coastal areas of Louisiana,” Pp. 145-167. In: Mitigating Impacts of Natural Disasters on Fisheries Ecosystems, Katherine D. McLaughlin, ed. Bethesda, Maryland: American Fisheries Society. Jepson, Michael and Lisa L. Colburn. 2013. “Development of Social Indicators of Fishing Community Vulnerability and Resilience in the U.S. Southeast and Northeast Regions.” U.S. Dept. of Commerce, NOAA Technical Memorandum NMFS-F/SPO-129, 64 p. Magsino, Sammantha L., Rapporteur. 2009. Applications of Social Network Analysis for Building Community Disaster Resilience: Workshop Summary. National Research Council. The National Academies Press. Washington, D.C. Manyena, Siambabala Bernard, Emmanuel Mavhura, Chipo Muzenda and Elias Mabaso. 2013. “Disaster risk reduction legislations: Is there a move from events to processes?” Global Environmental Change 23:1786-1794. Neria, Yuval and James M. Schultz. 2012. “The Mental Health Effects of Hurricane Sandy.” Journal of American Medical Association 308(24):2571-2572. Online at: http://www.ncbi.nlm.nih.gov/pmc/articles/PMC3638199/ NMFS. 2007. Report to Congress on the Impacts of Hurricanes Katrina, Rita, and Wilma on Alabama, Louisiana, Florida, Mississippi, and Texas Fisheries. Silver Spring, MD. 133 p. Online at: http://www.nmfs.noaa.gov/msa2007/docs/Fisheries_Report_Final.pdf NMFS. 2009. Fishing Communities of the United States, 2006. U.S. Dept. Commerce, NOAA Tech. Memo. NMFS-F/SPO-98, 84 p. Online at: http://www.st.nmfs.noaa.gov/st5/publication/index.html NMFS. 2013. Regional Impact Evaluation: An Initial Assessment of the Economic Impacts of Superstorm Sandy on New Jersey and New York Commercial and Recreational Fishing Sectors. Online at:

35
http://www.st.nmfs.noaa.gov/Assets/economics/documents/sandy/Final_Report_Sandy_Regional_Impact_Evaluation_MSA.pdf NMFS. 2014. Fisheries Economics of the United States, 2012. U.S. Dept. Commerce, NOAA Technical Memorandum. NMFS-F/SPO-137, 175p. Online at: https://www.st.nmfs.noaa.gov/st5/publication/index.html NOAA. 2012. “Secretary of Commerce declares fisheries disaster for New York and New Jersey in the aftermath of Sandy.” Press Release, Nov. 16. Online at; http://www.noaanews.noaa.gov/stories2012/20121116_fisher_declaration.html NWS (US National Weather Service). 2013. “Hurricane/Post Tropical Cyclone Sandy, October 22-29, 2012.” Service Assessment Report. Online at: http://www.nws.noaa.gov/os/assessments/pdfs/Sandy13.pdf Oberg, Angela; Flagg, Julia; McCay, Bonnie; Clay, Patricia M.; Colburn, Lisa L. In Press. "Surviving Sandy: Identity and Cultural Resilience in a New Jersey Fishing Community.” In: Taking Chances on the Coast after Hurricane Sandy. Karen O'Neill and Dan Van Abs, eds. New Brunswick, NJ: The Rutgers University Press. Petterson, John S., Laura D. Stanley, Edward Glazier, James Philipp. 2006. A Preliminary Assessment of Social and Economic Impacts Associated with Hurricane Katrina. American Anthropologist 108(4):643–670. Pollnac, Richard. B., Tarsila Seara, and Lisa L. Colburn. 2014. “Aspects of Fishery Management, Job Satisfaction and Well-being among Commercial Fishermen in the Northeastern Region of the United States.” Society and Natural Resources. Pollnac, Richard B. and John J. Poggie. 2008. “Happiness, Well-being and Psychocultural Adaptation to the Stresses Associated with Marine Fishing,” Human Ecology Review 15(2):194-200. Schellong, Alexander. 2007. "Increasing Social Capital for Disaster Response through Social Networking Services (SNS) in Japanese Local Governments.” National Center for Digital Government. Paper 11. Online at: http://scholarworks.umass.edu/ncdg/11 Smith, Courtland L. and Patricia M. Clay. 2010. “Measuring Subjective and Objective Well-being: Analyses from Five Marine Commercial Fisheries.” Human Organization 69(2):158-168. Tompson, Trevor, Jennifer Benz, Jennifer Agiesta, Kate Cagney, and Michael Meit. 2013. Resilience in the Wake of Superstorm Sandy. The Associated Press-NORC Center for Public Affairs Research. NORC at the University of Chicago. Online at: http://www.apnorc.org/projects/Pages/resilience-in-the-wake-of-superstorm-sandy.aspx

36
Appendix A
Table A1. Species common and scientific names for commercial fisheries landings data analyses Common Name(s) Scientific Name American eel Anguilla rostrate American lobster Homarus americanus American plaice/dabs Hippoglossoides platessoides American shad Alosa mediocris Atlantic bluefin tuna Thunnus thynnus Atlantic cod Gadus morhua Atlantic halibut Hippoglossus hippoglossus Atlantic herring Clupea harengus Atlantic mackerel Scomber scombrus Atlantic menhaden Brevoortia tyrannus Atlantic Pollock Pollachius virens Atlantic salmon Salmo salar Atlantic sea scallop Placopecten magellanicus Atlantic sturgeon Acipenser oxyrhynchus Atlantic surfclam Spisula solidissima Atlantic wolffish Anarhichas lupus black sea bass Centropristis striata black tip shark Carcharhinus limbatus blacknose shark Carcharhinus acrontus bluefish Pomatomus saltatrix butterfish Peprilus triacanthus coastal shark Chondrichthyes cobia Rachycentron canadum croaker Micropogonias undulates deep sea red crab Chaceon quinquedens goosefish/monkfish Lophius americanus haddock Melanogrammus aeglefinus horseshoe crab Limulus Polyphemus Illex squid Illex illecebrosus king mackerel Lutjanus synagris Loligo squid Doryteuthis (Amerigo) pealeii ocean pout Zoarces americanus ocean quahog Arctica islandica offshore hake Merluccius albidus skates Rajidae oyster toadfish Opsanus tau red drum Sciaenops ocellatus red hake Urophycis chuss redfish Sebastes fasciatus

37
windowpane flounder/sand dab Scophthalmus aquosus
sandbar shark Carcharhinus plumbeus
scup Stenotomus chrysops
shortfin mako shark Isurus oxyrinchus
silver hake/whiting Merluccius bilinearis
Spanish mackerel Scomberomorus maculatus
spiny dogfish Squalus acanthias
spot Leiostomus xanthurus
striped bass Morone saxatilis
summer flounder/fluke Paralichthys dentatus
tautog Tautoga onitis
tilefish Lopholatilus chamaeleonticeps
weakfish/drum Cynoscion regalis
white hake Urophycis tenuis
winter flounder Pseudopleuronectes americanus
witch flounder Glyptocephalus cynoglossus
yellowfin tuna Thunnus albacares
yellowtail flounder Limanda ferruginea

38
Appendix B

39

40

41

42

43

44

45

46

47

48

49
50

51

52

53
54

55

56

57

58

59

60

61

62
Appendix C
FAQ Sheet
63

64
Appendix D
Table D1. Results of the telephone survey dialing effort.
Telephone Survey Dialing Results All Sample Business Commercial For-Hire N % N % N % N %
Unable to Reach Respondent
No answer 477 11.80 135 28.30 143 10.70 199 18.40
Answering machine 1233 30.50 278 6.90 454 34.10 501 46.30
Busy number 27 0.70 11 0.70 11 0.80 5 0.50
Callback 269 6.70 121 7.50 107 8.00 41 3.80
Contacted but Incomplete
Refusal 334 8.30 195 12.00 85 6.40 54 5.00
Mid-term terminate 17 0.40 8 0.50 6 0.50 3 0.30
Refusal-little or no impact 30 0.70 15 0.90 14 1.10 1 0.10
Mail survey preferred 86 2.10 46 2.80 28 2.10 12 1.10
Not a fishing-related business 174 4.30 45 2.80 94 7.10 35 3.20
Communication issue 33 0.80 28 1.70 2 0.20 3 0.30
Company policy against surveys or no longer with company
15 0.40 13 0.80 2 0.20 0 0.00
Unable to Contact
Respondent never available 117 2.90 88 5.40 21 1.60 8 0.70
Number not in service 593 14.70 372 22.90 157 11.80 64 5.90
Wrong number 152 3.80 90 5.50 42 3.20 20 1.80
Completed Surveys
481 11.90 179 11.00 165 12.40 137 12.70
Total Sample Used
4,038 100.00 1,624 100.00 1,331 100.0 1,083 100.00
Response Rate 55.80 45.10 61.10 70.30
Refusal Rate 9.40 13.40 7.90 5.40

65
Appendix E
Table E1. Distribution of primary target species. COMMERCIAL FOR-HIRE
TARGET SPECIES NY NJ NY NJ
N %* N %* N %* N %* Groundfisha 88 34.8 31 12.6 48 33.6 140 31.3
Bassb 38 15.0 7 2.8 54 37.8 136 30.4
Highly migratoryc 10 4.0 13 5.3 12 8.4 93 20.8
Shellfishd 39 15.4 57 23.2 -- -- 3 0.7
Bluefish 19 7.5 8 3.3 24 16.8 47 10.5
Crustaceanse 20 7.9 55 22.4 -- -- 4 0.9
Drums/croakers/spot 6 2.4 7 2.8 -- -- 15 3.4
Atlantic menhaden 4 1.6 19 7.7 1 0.7 -- --
Squidf 17 6.7 5 2.0 -- -- -- --
Eels 3 1.2 11 4.5 -- -- -- --
Bait fishg 2 0.8 6 2.4 -- -- -- --
Perch/white perch -- -- 12 4.9 -- -- -- --
Otherh 7 2.8 15 6.1 -- -- 9 2.0 *Percentage of responses. Some respondents provided more than one answer per survey and therefore percentageswere calculated based on the total number of responses. A Includes flounders, fluke, monkfish, scup, skates, butterfish, tautog, sea robin, tilefish, whiting, and cod as well as the general responses ‘groundfish’ and ‘bottomfish.’ B Includes striped bass and the general response ‘bass.’ C Includes tunas, wahoo, swordfish, sharks, marlin, and dolphinfish. D Includes scallops, clams, conch, whelk, oysters, and the general response ‘shellfish.’ E Includes lobster and crabs. F Includes Loligo squid and the general response ‘squid.’ G Includes minnows and the general response ‘bait fish.’ H Includes all other species for which total frequency of responses overall was below 5%.

66
Appendix F
Table F1. Mean of estimated value per item and average percentage insured for damages/losses to Commercial fishing.
NEW YORK NEW JERSEY
ITEMS Average Value $ (SD)*
% Reported (N) **
Average % Insured (SD)
Average Value $ (SD)*
% Reported (N) **
Average % Insured (SD)
Gear 27,706 (81,453) 61.2 (51) 7.0 (22.4) 15,450 (31,225) 78.6 (66) 7.1 (22.9)
Vessel 26,059 (88,989) 37.8 (31) 24.0 (37.9) 37,239 (90,558) 27.4 (23) 23.3 (40.8)
Bait 3,780 (9,759) 31.7 (26) 3.6 (19.8) 3,610 (8,475) 19.0 (16) 4.2 (17.7)
Product 35,406 (100,544) 29.6 (24) 8.6 (24.2) 18,470 (24,342) 20.2 (17) 7.9 (26.0)
Docks 3,342 (5,208) 8.5 (7) 11.1 (20.2) 30,146 (40,885) 10.7 (9) 8.3 (28.9)
Equipment 2,950 (2,417) 4.9 (4) 8.3 (20.4) 8,255 (9,169) 10.7 (9) 0.0 (0.0) *Mean value and standard deviation of damages reported by commercial fishermen for each item listed.**Percentage from the total number of commercial fishermen who reported physical damages/losses for each item listed. Total does not equal 100% because one respondent could report physical damages/losses for more than one item per survey. Number of cases who reported physical damages/losses is presented in parentheses.
Table F2. Mean of estimated value per item and average percentage insured for damages/losses to For-Hire fishing.
NEW YORK NEW JERSEY
ITEMS Average Value $ (SD)*
% Reported (N) **
Average % Insured (SD)
Average Value $ (SD)*
% Reported (N) **
Average % Insured (SD)
Vessel 10,291(9,374) 63.1 (12) 62.4 (47.0) 30,037 (48,618) 77.1 (64) 57.5 (44.3)
Bait 318 (233) 42.1 (8) 3.1 (8.8) 1,243 (1,858) 38.5 (32) 11.0 (30.4)
Gear 3,760 (6,356) 26.3 (5) 15.0 (33.5) 7,500 (15,845) 41.0 (34) 22.3 (38.4)
Equipment 1,350 (1,866) 15.8 (3) 0.0 (0.0) 4,457 (5,759) 19.3 (16) 0.0 (0.0)
Docks -- -- -- 28,950 (33,200) 9.6 (8) 9.1 (23.1)
Product -- -- -- 321 (147) 8.4 (7) 11.1 (33.3) *Mean value and standard deviation of damages reported by for-hire fishermen for each item listed.**Percentage from the total number of for-hire fishermen who reported physical damages/losses for each item listed. Total does notequal 100% because one respondent could report physical damages/losses for more than one item per survey. Number of caseswho reported physical damages/losses is presented in parentheses.

67
Table F3. Mean of estimated value per item and average percentage insured for damages/losses to Marinas.
NEW YORK NEW JERSEY
ITEMS Average Value $ (SD)*
%Reported (N) **
Average % Insured (SD)
Average Value $ (SD)*
% Reported (N) **
Average % Insured (SD)
Buildings 157,461 (214,343) 62.8 (59) 38.7 (40.8) 251,056 (714,699) 60.7 (85) 33.7 (38.9)
Docks 143,123 (279,712) 55.3 (52) 20.1 (37.0) 180,818 (411,998) 48.6 (69) 21.3 (34.1)
Merchandise 90,275 (126,883) 41.5 (39) 28.6 (37.9) 79,496 (103,339) 37.1 (52) 18.7 (29.6)
Equipment 45,454 (57,965) 23.4 (22) 11.8 (27.8) 52,694 (81,796) 27.9 (39) 12.4 (26.4)
Vessel 102,000 (190,926) 21.3 (20) 41.1 (44.2) 107,034 (233,773) 20.7 (29) 26.5 (40.4)
Bait 3,800 (3,653) 10.6 (10) 2.9 (12.1) 4,869 (10,450) 12.9 (18) 4.5 (16.7)
Product 17,277 (23,330) 9.6 (9) 8.3 (19.5) 33,014 (56,036) 10.0 (14) 11.2 (27.9)
Gear 28,033 (36,602) 6.4 (6) 19.2 (37.0) 15,568 (25,983) 5.7 (8) 3.1 (8.5) *Mean value and standard deviation of physical damages/losses reported by Marina owners or managers for each item listed.**Percentage from the total number of Marina owners or managers who reported physical damages/losses for each item listed. Total does not equal 100% because one respondent could report physical damages/losses for more than one item per survey. Number of cases who reported physical damages/losses is presented in parentheses.
Table F4. Mean of estimated value per item and average percentage insured associated with physical damages/losses to Seafood Dealers.
NEW YORK NEW JERSEY
ITEMS Average Value $ (SD)*
% Reported (N) **
Average % Insured (SD)
Average Value $ (SD)*
% Reported (N) **
Average % Insured (SD)
Product 105,321 (260,959) 23.7 (14) 8.3 (22.5) 6,035 (7,998) 17.8 (5) 16.7 (35.3)
Buildings 94,150 (118,091) 16.9 (10) 27.1 (41.9) 99,800 (113,182) 17.8 (5) 18.9 (34.4)
Gear 68,000 (75,547) 8.4 (5) 0.0 (0.0) 13,800 (11,630) 32.1 (9) 0.0 (0.0)
Merchandise 5,120 (4,364) 8.4 (5) 12.5 (35.3) 40,583 (51,946) 10.7 (3) 45.8 (51.0)
Bait 2,925 (4,728) 6.8 (4) 0.0 (0.0) 1,066 (1,250) 10.7 (3) 0.0 (0.0)
Equipment 64,333 (108,831) 5.0 (3) 20.0 (44.7) 2,666 (2,020) 10.7 (3) 12.5 (30.6)
Docks 10,000 (7,071) 3.4 (2) 0.0 (0.0) 56,500 (92,442) 14.3 (4) 0.0 (0.0)
Vessel -- -- -- 1,971 (1,001) 10.7 (3) 0.0 (0.0) *Mean value of physical damages/losses reported by Seafood Dealer business owners or managers for each item listed.**Percentage from the total number of Seafood Dealer business owners or managers who reported physical damages/losses for each item listed. Total does not equal 100% because one respondent could report physical damages/losses for more than one item per survey. Number of businesses who reported physical damages/losses is presented in parentheses.

68
Table F5. Mean of estimated value per item and average percentage insured for physical damages/losses to Bait & Tackle Stores.
NEW YORK NEW JERSEY
ITEMS Average Value $ (SD)*
%Reported (N) **
Average % Insured (SD)
Average Value $ (SD)*
%Reported (N) **
Average % Insured (SD)
Bait 11,776 (19,325) 38.6 (17) 6.2 (25.0) 6,094 (12,036) 34.0 (17) 13.1 (33.2)
Buildings 53,923 (79,260) 29.5 (13) 8.5 (21.2) 40,000 (56,055) 38.0 (19) 22.8 (35.3)
Merchandise 25,818 (25,040) 25.0 (11) 2.3 (7.5) 64,500 (110,572) 34.0 (17) 7.5 (20.0)
Product 12,933 (20,792) 34.1 (15) 6.7 (25.8) 23,427 (44,409) 22.0 (11) 3.6 (9.1)
Equipment 10,257 (14,331) 29.5 (13) 1.8 (6.7) 13,700 (20,577) 10.0 (5) 25.0 (46.3)
Docks 23,700 (20,819) 11.4 (5) 15.0 (33.5) 18,000 (16,970) 4.0 (2) 37.5 (47.9)
Gear 18,400 (27,471) 6.8 (3) 0.0 (0.0) 3,000 (1,802) 6.0 (3) 0.0 (0.0)
Vessel 3,000 (--) 2.3 (1) -- 17,000 (13,527) 6.0 (3) 0.0 (0.0) *Mean value and standard deviation of physical damages/losses reported by Bait & Tackle store owners or managers for eachitem listed.**Percentage from the total number of Bait & Tackle owners or managers who reported physical damages/losses for each itemlisted. Total does not equal 100% because one respondent could report physical damages/losses for more than one item persurvey. Number of businesses who reported physical damages/losses is presented in parentheses.
Table F6. Mean of estimated value per item and average percentage insured for physical damages/losses to Aquaculture Facilities.
NEW YORK NEW JERSEY
ITEMS Average Value $ (SD)*
% Reported (N) **
Average % Insured (SD)
Average Value $ (SD)*
% Reported (N) **
Average % Insured (SD)
Gear 27,600 (20,032) 71.4 (5) 12.5 (25.0) 30,500 (41,719) 28.6 (2) 33.3 (57.7)
Buildings 50,000 (35,355) 28.6 (2) 0.0 (0.0) 23,833 (35,694) 42.8 (3) 0.0 (0.0)
Product 22,500 (3,535) 28.6 (2) 0.0 (0.0) 126,500 (174,655) 28.6 (2) 0.0 (0.0)
Equipment 100,000 (--) 14.3 (1) -- 3,000 (--) 14.3 (1) --
Merchandise 10,000 (--) 14.3 (1) -- 15,000 (--) 14.3 (1) --
Vessel 10,000 (--) 14.3 (1) -- -- -- --
Bait -- -- -- 400 (--) 14.3 (1) -- *Mean value of physical damages/losses reported by Aquaculture Facilities owners or managers for each item listed. Standarddeviations were not reported for aquaculture due to the small sample size for most items.**Percentage from the total number of Aquaculture Facilities owners or managers who reported physical damages/losses for eachitem listed. Total does not equal 100% because one respondent could report physical damages/losses for more than one item persurvey. Number of cases who reported physical damages/losses is presented in parentheses.