Embed Size (px)
Citation preview

Social and PsychologicalFactors in Cancer and Longevity
The Harvard community has made thisarticle openly available. Please share howthis access benefits you. Your story matters
Citable link http://nrs.harvard.edu/urn-3:HUL.InstRepos:37945645
Terms of Use This article was downloaded from Harvard University’s DASHrepository, and is made available under the terms and conditionsapplicable to Other Posted Material, as set forth at http://nrs.harvard.edu/urn-3:HUL.InstRepos:dash.current.terms-of-use#LAA

SOCIAL AND PSYCHOLOGICAL FACTORS IN CANCER AND LONGEVITY
EMILY ZEVON
A Dissertation Submitted to the Faculty of
The Harvard T.H. Chan School of Public Health
in Partial Fulfillment of the Requirements
for the Degree of Doctor of Science
in the Department of Social and Behavioral Sciences
Harvard University
Boston, Massachusetts
May, 2018

ii
Dissertation Advisor: Dr. Laura Kubzansky Emily Zevon
Social and Psychological Factors in Cancer and Longevity
Abstract
Health behaviors are frequently considered as risk factors for cancer and other diseases
that contribute to premature mortality. Despite this consideration, the prevalence of many
deleterious behaviors has remained constant or even increased over recent decades. This lack of
success in modifying behavior may be due to focus on the individual, and a failure to consider
social context and psychological states that pattern and influence the performance of behavior.
To fully understand risk factors for cancer and premature mortality it is necessary to look further
upstream from behaviors and consider psychosocial risk factors and assets, as well as the
pathways through which they are associated with health. The studies in this dissertation used
data from the Nurses’ Health Study to evaluate relationships that link the social environment to
mortality and cancer incidence via pathways including adaptive resources, adverse psychosocial
exposures, and health behaviors.
Study 1 found that participants with higher levels of depressive symptoms had a greater
risk of lung cancer compared to those with lower levels of depressive symptoms. In a test of
mediation by smoking history, lifetime pack-years of smoking accounted for approximately half
of the observed relationship. Study 2 revealed that childhood socioeconomic status,
operationalized as parental occupation, was associated with patterns of health behavior and colon
cancer risk in later life. Compared to participants with white collar parents, participants with blue
collar parents were at greater risk of adopting an unhealthy lifestyle in adulthood. Additionally,
participants with blue collar parents had a slightly elevated, but not statistically significant,

iii
increased risk of colon cancer compared to participants with white collar parents. Study 3
demonstrated that higher levels of social integration were associated with longer lifespan and a
greater likelihood of achieving exceptional longevity. This association was slightly attenuated
but remained statistically significant after controlling for health behaviors.
In conclusion, this dissertation demonstrates the role that social and psychological factors
play in cancer risk and longevity. By examining these fundamental determinants of health, this
line of research may facilitate identification of targets for effective intervention that go beyond
traditional attempts to modify single proximal risk factors for disease.

iv
Table of Contents: Abstract .......................................................................................................................................... ii
List of Figures with Captions ......................................................................................................... vi
List of Tables with Captions ........................................................................................................ viii
Acknowledgements ........................................................................................................................ ix
Introduction ..................................................................................................................................... 1
References ................................................................................................................................... 9
Study 1. Depressive Symptoms and Risk of Incident Lung Cancer Among Women in the Nurses’ Health Study .................................................................................................................................. 14
Abstract ..................................................................................................................................... 15
Introduction: .............................................................................................................................. 17
Methods: ................................................................................................................................... 20
Results: ...................................................................................................................................... 25
Discussion ................................................................................................................................. 35
References ................................................................................................................................. 39
Supplemental Materials ............................................................................................................ 43
Study 2. The Association between Childhood Socioeconomic Status, Adult Health Behaviors, and Risk of Incident Colon Cancer in the Nurses’ Health Study ................................................. 44
Abstract ..................................................................................................................................... 45
Introduction ............................................................................................................................... 47
Methods..................................................................................................................................... 50
Results ....................................................................................................................................... 55
Discussion ................................................................................................................................. 61
References ................................................................................................................................. 65
Study 3. Social Integration and Lifespan in the Nurses’ Health Study ........................................ 69
Abstract ..................................................................................................................................... 70
Introduction ............................................................................................................................... 72
Methods..................................................................................................................................... 74

v
Results ....................................................................................................................................... 81
Discussion ................................................................................................................................. 87
References ................................................................................................................................. 91
Supplemental Materials ............................................................................................................ 95

vi
List of Figures with Captions INTRODUCTION Figure 1.1: Theoretical Framework ..........................................................................................................5

vii
List of Tables with Captions STUDY 1 Table 2.1 Selected characteristics by level of depressive symptoms among 57,877 women from the Nurses’ Health Study in 1992…………………………….………………………………….26
Table 2.2 Hazard ratios and 95% confidence intervals for lung cancer by level of depressive symptoms among 51,907 women from the Nurses' Health Study……………………………….28
Table 2.3 Mediation of the association between depressive symptoms and lung cancer risk by smoking history……………………………………………………………………....…………..30
Table 2.4 Association between depressive symptoms (standard deviation change in reverse-coded MHI-5 score) and lung cancer risk, stratified by smoking history………………………..32
Table 2.5 Hazard ratios for lung cancer by level of depressive symptoms- alternative strategies for modeling depressive symptoms…………………………………………………………..….34
Table S2.1 Tumor types by smoking status, n (%)………………………………………………43 STUDY 2 Table 3.1 Age-adjusted covariates by parent occupation Values are either mean (SD) or percentages. N=100,932…………………………………………………………………………56
Table 3.2 Hazard ratios for adopting an unhealthy lifestyle over 20 years of follow-up by parent occupation among 90,032 women from the Nurses' Health Study………………………………58
Table 3.3 Hazard ratios for incident colon cancer by parent occupation among 100,932 women from the Nurses' Health Study…………………………………………………………………...60 STUDY 3 Table 4.1 Scoring criteria for social integration measure………………………………………..77
Table 4.2 Age-adjusted covariates by quartiles of social integration among women in the Nurses’ Health Study in 1992. Values are either mean (SD) or percentages. N= 73,276………………...82
Table 4.3 Percent change in lifespan associated with social integration, Nurses' Health Study, 1992-2012. N= 73,276…………………………………………………………………………...84
Table 4.4 Odds ratios for the association of social integration with survival past age of 85, Nurses' Health Study. N=17,309…………………..……………………………………………..86
Table S4.1 Percent change in lifespan associated with components of social integration, Nurses' Health Study, 1992-2012. N= 73,276……………………………………………………………95

viii
Table S4.2 Odds ratios for the association of social integration score components with survival past age of 85, Nurses' Health Study. N= 17,309………………………………………………..96

ix
Acknowledgements
This dissertation would not have been possible without the support, guidance, and
wisdom of my advisor, Laura Kubzansky. I have been fortunate to have a mentor who thinks
deeply about the needs of her students, and her patience and steady hand have been invaluable
throughout the dissertation process. Beyond her mentorship, Laura is a rigorous and innovative
researcher, and I am proud to become a part of her intellectual legacy.
I would also like thank my committee members, Ichiro Kawachi and Reginald Tucker-
Seeley, for their input and sage advice on my research. This dissertation owes much to their
insights.
I would like to thank my peers for their good humor and support. They are a group of
remarkably smart and giving people, and have contributed to this project and my life in many
ways. I have been lucky to have them along this journey with me.
I would like to thank my parents, Michael Zevon, Linda Nash, and Frank Alabiso, for
their constant support and modeling of education. They have instilled in me a lifelong interest in
research and getting to the root of a problem. My sister, Margot Zevon, has been my partner in
crime for thirty years, and her support for this project provided valuable perspective.
Last, I would like to thank my husband and partner, Matt Linton, for his unwavering
patience, support, and love. Thanks for believing in me through thick and thin, and for making
me laugh through it all.

1
Introduction
Lifespan in the United States has risen in recent decades. Between 1975 and 2015, life
expectancy at birth rose from 68.8 to 76.3 for men and from 76.6 to 81.2 for women (Statistics,
2017). However, the achievement of longevity without good health across the lifespan is a
hollow victory. It is necessary to consider illness and risk factors for illness to attain a
comprehensive understanding of morbidity and ensure that additional quantity of life is not
achieved at the expense of quality. Cancer is one such illness that contributes to significant
morbidity and premature mortality. Cancer is the second leading cause of death in the United
States, accounting for one in every four deaths in the country (American Cancer Society, 2014).
According to estimates derived from the National Cancer Institute’s Surveillance, Epidemiology,
and End Results Program data, there were 600,920 cancer deaths and 1,688,780 new cases of
cancer diagnosed in 2017 (Howlader, 2017). With such high disease burden, it is imperative to
understand modifiable risk factors for cancer, with the eventual goal of developing low-cost and
effective interventions. By understanding and ultimately mitigating these risk factors we will be
able to both reduce cancer incidence and promote general health and longevity.
Health behaviors and health behavior-related factors are frequently-assessed risk factors
for cancer and other diseases that contribute to morbidity and premature mortality. For example,
smoking, overweight and obesity, and diet are associated with higher risk of lung, colorectal,
esophageal, stomach, and other forms of cancer (Key et al., 2004; US Department of Health and
Human Services, 2014). Furthermore, a recent study of cancer in the United Kingdom (UK)
estimated that the combined population attributable risk fractions for 14 lifestyle and
environmental factors (including tobacco, diet, obesity and physical activity) accounted for 43%
of cancers in the country in 2010 (Parkin, Boyd, & Walker, 2011). These behavioral risk factors

2
for cancer are similar to those for all-cause premature mortality. Another study conducted in the
UK estimated that individuals with four unhealthy lifestyle factors had a mortality risk
equivalent to being 12 years older compared to those with no unhealthy lifestyle factors
(Kvaavik, Batty, Ursin, Huxley, & Gale, 2010).
Despite this demonstration of the relationship between health behaviors and disease and
mortality, the prevalence of most behavior-related risk factors has remained constant over recent
decades (Spring, King, Pagoto, Van Horn, & Fisher, 2015), while the prevalence of some
behavior-related factors (e.g., overweight and obesity) has increased (Wang, McPherson, Marsh,
Gortmaker, & Brown, 2011). Smoking, the health behavior responsible for the greatest number
of cancer cases, has declined overall, but this reduction has not occurred equally across gender,
racial/ethnic, and socioeconomic groups (Centers for Disease Control, 2011).
Spring and colleagues suggest that one factor contributing to the failure to significantly
reduce cancer and premature mortality risk behaviors is that health behavior change interventions
have focused primarily on the individual, and have ignored the broader social factors that pattern
behavior and restrict choice (Spring et al., 2015). As Spring et al. state: “The individual- whose
attitudes, beliefs, and habits behavioral treatments target- is embedded in a complex system that
either promulgates or discourages cancer risk behaviors” (pg. 76). Individuals engaging in health
behaviors that put them at greater risk for disease do so within a particular social, economic, and
cultural milieu. Failure to situate health behaviors within this broader context makes it
impossible to address the most fundamental causes of disease, limiting the impact of
interventions that seek to improve health by changing individual’s behaviors without regard to
the social context in which they occur (Link & Phelan, 1995).

3
As research has increasingly considered the social context of health and health behaviors
in cancer risk and premature mortality, three key factors have emerged. The first of these factors
is that socioeconomic status (SES) strongly patterns population-wide distributions of deleterious
behaviors. Research documents that individuals with lower SES are more likely to act in health-
damaging ways, although many studies rely on cross-sectional data and narrow assessments of
social status. For example, individuals with less education and lower incomes are more likely to
smoke (Centers for Disease Control, 2011; Schoenborn, Adams, & Peregoy, 2013). Additionally,
less educated and poorer individuals are less likely to meet physical activity guidelines, maintain
a healthy body mass index (BMI), and meet United States Department of Agriculture (USDA)
recommendations for fruit and vegetable consumption (Casagrande, Wang, Anderson, & Gary,
2007; Schoenborn et al., 2013).
A second key factor in the association between social environment and health is
emotional distress, characterized by depression, anxiety, and hostility, which occurs more
frequently among those with low social status (Bosma, Schrijvers, & Mackenbach, 1999;
Kubzansky, Kawachi, & Sparrow, 1999; Mendelson, Thurston, & Kubzansky, 2008). These
factors are hypothesized to increase risk of illness both through direct physiological pathways
and by contributing to the likelihood of engaging in unhealthy behaviors. For example,
individuals who are depressed are more likely to smoke and less likely to succeed in cessation
(Anda et al., 1990; Glassman et al., 1990). Depression and anxiety are also associated with
reduced physical activity, unhealthy eating habits, poor sleep quality, and excessive alcohol
consumption (Allgöwer, Wardle, & Steptoe, 2001; Strine et al., 2008). Although these
relationships are likely bi-directional, prospective research has demonstrated that high levels of
emotional distress can lead to unhealthy behaviors. For example, studies have documented that

4
depression and anxiety in earlier adolescence predict subsequent cigarette smoking initiation in
adolescents (Patton et al., 1998; Windle & Windle, 2001). Additionally, studies have shown that
depression in adolescents is associated with subsequent obesity and high BMI (Goodman &
Whitaker, 2002), and that depression in adults predicts subsequent decline in physical activity
(Patten, Williams, Lavorato, & Eliasziw, 2009).
A third key factor in the relationship between social context and health is the role of
social relationships, which function both as direct contributors to health and health behaviors and
also as a buffer that mitigates the effect of harmful exposures (e.g., stress) (Cohen & Wills, 1985;
Heaney & Israel, 2008). Strong social support and other characteristics of social relationships are
associated with increased performance of healthy behaviors, including physical activity
(McNeill, Kreuter, & Subramanian, 2006), successful management of chronic illnesses (Gallant,
2003), and smoking cessation (Wagner, Burg, & Sirois, 2004). Social relationships also affect
health independent of health behaviors by enhancing positive affect and feelings of belonging
and self-worth, which may have direct effects on physiology through neuroendocrine and
immune pathways (Cohen, Gottlieb, & Underwood, 2000). The effect of social relationships is
not universally beneficial however, and research has demonstrated that social connectedness may
also have negative health effects (House, Umberson, & Landis, 1988; Shumaker & Hill, 1991).
With an understanding of the broad social and environmental, as well as the more
specific individual forces, that shape health behaviors, we can begin to see how an isolated
examination of behavior is insufficient. Instead, an integrated model is required, one that looks
upstream from behavior to social, psychological, and environmental factors. We propose such an
integrated model (Figure 1) as the conceptual framework for the studies in this dissertation. As
shown in Figure 1, the social environment (i.e. the society and culture within which individuals

5
are embedded) shapes emotional distress, which includes both chronic distress and emotional
dysregulation. These psychosocial exposures are then embodied in individual biology and
ultimately health outcomes, both directly through their effect on physiology and indirectly by
shaping health behaviors. Material and psychosocial resources, such as social support, are
included as another potential pathway linking the social environment to health outcomes. The
model recognizes that understanding will be enhanced with a life course perspective, and
includes explicit consideration that these exposures and their attendant health effects may occur
differently at various points and may have cumulative effects across individuals’ lifespans. The
overall aim for this dissertation is to identify and assess empirical support for the pathways
described within this theoretical framework, to better understand how relationships between the
social environment, psychosocial resources, and emotional distress influence cancer disease
processes and premature mortality.
Figure 1.1: Theoretical Framework Note: arrows are drawn in a single direction for simplicity, but bidirectional relationships are likely for many constructs within the framework.

6
Study 1 considers the relationship between depression and lung cancer incidence. Much
research has been conducted on the potential role of depression and related psychosocial factors
in cancer incidence, progression, and survival (Blumberg, West, & Ellis, 1954; Giese-Davis &
Spiegel, 2003), with mixed results suggesting a complex association (Chida, Hamer, Wardle, &
Steptoe, 2008; McKenna, Zevon, Corn, & Rounds, 1999). For example, in a 2008 meta-analysis
Chida et al. found that stress-related factors increased lung cancer risk, but had no effect on
breast cancer and were associated with a reduction in the risk of thyroid cancer (Chida et al.,
2008). The specific relationship between depression and lung cancer incidence has remained
under-explored; a 2002 review of prospective research addressing the association between
psychological states and cancer identified only four studies specifically considering depression
and lung cancer risk (Dalton, Boesen, Ross, Schapiro, & Johansen, 2002). These four studies
produced inconsistent support for an effect of depression on lung cancer incidence. Dissertation
Study 1 hypothesizes that individuals with higher levels of depressive symptoms will be at
increased risk of developing lung cancer, and that this relationship will be strongly mediated by
smoking status.
Study 2 examines the relationship between childhood SES, health behaviors in adulthood,
and risk of incident colon cancer. Recent studies have established a pervasive effect of
socioeconomic status on subsequent health, with each progressively higher level of status
associated with incremental gains in well-being (Adler & Ostrove, 1999; Cohen, Janicki�
Deverts, Chen, & Matthews, 2010; Feinstein, 1993). Multiple types of cancer, however, have
been shown to defy the typical SES/health gradient, both within the US and in cross-country
comparisons (Clegg et al., 2009; Kanavos, 2006; Kawachi & Kroenke, 2006). For example,
investigations of colon cancer in the US and Europe have demonstrated conflicting results, with

7
various studies finding positive, inverse, and null relationships between adult SES and incidence
(Baquet, Horm, Gibbs, & Greenwald, 1991; Krieger et al., 1999; Papadimitriou et al., 1984;
Tavani et al., 1999; Van Loon, Van den Brandt, & Golbohm, 1995). These studies, however,
have had myriad limitations in design and methodology, including small sample size, potential
recall bias, and unmeasured confounding. To more completely capture harmful exposures across
the life course, Study 2 in this dissertation assesses childhood SES, rather than adult SES.
Childhood SES both establishes lifelong trajectories for health behaviors associated with colon
cancer risk (Cohen et al., 2010; Potter, Slattery, Bostick, & Gapstur, 1993) and predicts low SES
later in life (Urahn et al., 2012). We hypothesize the individuals with lower childhood SES will
have less healthy patterns of health behaviors and will have a higher risk for colon cancer in
adulthood.
Study 3 in this dissertation considers longevity more broadly, and investigates the
association between social integration and participants’ lifespans. A large body of research has
demonstrated beneficial effects of social relationships on a wide range of health outcomes
(Berkman & Krishna, 2014; Nausheen, Gidron, Peveler, & Moss-Morris, 2009). The relationship
between social relationships and premature mortality has been assessed extensively, with many
studies demonstrating an association between social isolation and increased risk of death
(Barger, 2013; Berkman & Krishna, 2014; Seeman, 1996). Despite the large volume of research
showing a relationship between weak social relationships and risk of premature mortality, less
research has utilized a positive framework to consider social relationships as a health asset and
assessed their relationship with longer lifespan or with exceptional longevity, and no studies
have done so in a large prospective cohort. The third study in this dissertation utilizes such a
cohort to examine the relationship between social integration and longevity, testing the

8
hypothesis that participants with higher levels of social integration will have longer lifespans and
a greater likelihood of achieving exceptional longevity, even when controlling for known
confounders.
The three studies in this dissertation evaluate various relationships in our proposed
theoretical framework that link the social environment to cancer incidence and mortality via
pathways including adaptive resources, adverse psychosocial exposures, and health behaviors.
We hope that by evaluating these aspects of the model we are contributing to a greater
understanding of the complex interplay between the social environment and individual risk
factors, and helping to contextualize important health behaviors that place individuals at
increased risk for cancer and other diseases. Furthermore, by contextualizing health behaviors
and looking at more fundamental determinants of cancer risk and mortality, we hope this work
will facilitate identification of targets for more effective interventions that go beyond traditional
attempts to modify single proximal risk factors for disease.

9
References
Adler, N. E., & Ostrove, J. M. (1999). Socioeconomic status and health: what we know and what
we don't. Annals of the New York academy of Sciences, 896(1), 3-15. Allgöwer, A., Wardle, J., & Steptoe, A. (2001). Depressive symptoms, social support, and
personal health behaviors in young men and women. Health Psychology, 20(3), 223. American Cancer Society. (2014). Cancer Facts and Figures 2014. Retrieved from Atlanta: Anda, R. F., Williamson, D. F., Escobedo, L. G., Mast, E. E., Giovino, G. A., & Remington, P.
L. (1990). Depression and the dynamics of smoking: a national perspective. Jama, 264(12), 1541-1545.
Baquet, C. R., Horm, J. W., Gibbs, T., & Greenwald, P. (1991). Socioeconomic factors and
cancer incidence among blacks and whites. Journal of the National Cancer Institute, 83(8), 551-557.
Barger, S. D. (2013). Social integration, social support and mortality in the US National Health
Interview Survey. Psychosomatic medicine, 75(5), 510-517. Berkman, L. F., & Krishna, A. (2014). Social network epidemiology. In L. F. Berkman, I.
Kawachi, & M. M. Glymour (Eds.), Social epidemiology (Second edition ed., pp. 234-289). New York, NY: Oxford University Press.
Blumberg, E. M., West, P. M., & Ellis, F. W. (1954). A possible relationship between
psychological factors and human cancer. Psychosomatic medicine, 16(4), 277-286. Bosma, H., Schrijvers, C., & Mackenbach, J. P. (1999). Socioeconomic inequalities in mortality
and importance of perceived control: cohort study. BMJ, 319(7223), 1469-1470. Casagrande, S. S., Wang, Y., Anderson, C., & Gary, T. L. (2007). Have Americans increased
their fruit and vegetable intake?: The trends between 1988 and 2002. American journal of preventive medicine, 32(4), 257-263.
Centers for Disease Control. (2011). Vital signs: current cigarette smoking among adults aged≥
18 years--United States, 2005-2010. MMWR. Morbidity and mortality weekly report, 60(35), 1207.
Chida, Y., Hamer, M., Wardle, J., & Steptoe, A. (2008). Do stress-related psychosocial factors
contribute to cancer incidence and survival? Nature clinical practice Oncology, 5(8), 466-475.
Clegg, L. X., Reichman, M. E., Miller, B. A., Hankey, B. F., Singh, G. K., Lin, Y. D., . . . Chen,
V. W. (2009). Impact of socioeconomic status on cancer incidence and stage at diagnosis:

10
selected findings from the surveillance, epidemiology, and end results: National Longitudinal Mortality Study. Cancer causes & control, 20(4), 417-435.
Cohen, S., Gottlieb, B. H., & Underwood, L. G. (2000). Social relationships and health. Social
support measurement and intervention: A guide for health and social scientists, 1-25. Cohen, S., Janicki�Deverts, D., Chen, E., & Matthews, K. A. (2010). Childhood socioeconomic
status and adult health. Annals of the New York academy of Sciences, 1186(1), 37-55. Cohen, S., & Wills, T. A. (1985). Stress, social support, and the buffering hypothesis.
Psychological bulletin, 98(2), 310. Dalton, S., Boesen, E., Ross, L., Schapiro, I., & Johansen, C. (2002). Mind and cancer: do
psychological factors cause cancer? European Journal of Cancer, 38(10), 1313-1323. Feinstein, J. S. (1993). The relationship between socioeconomic status and health: a review of
the literature. The Milbank Quarterly, 279-322. Gallant, M. P. (2003). The influence of social support on chronic illness self-management: a
review and directions for research. Health Education & Behavior, 30(2), 170-195. Giese-Davis, J., & Spiegel, D. (2003). Emotional expression and cancer progression. In R. J.
Davidson, K. R. Scherer, & H. H. Goldsmith (Eds.), Handbook of affective sciences (pp. 1053-1082). New York, NY, US: Oxford University Press.
Glassman, A. H., Helzer, J. E., Covey, L. S., Cottler, L. B., Stetner, F., Tipp, J. E., & Johnson, J.
(1990). Smoking, smoking cessation, and major depression. Jama, 264(12), 1546-1549. Goodman, E., & Whitaker, R. C. (2002). A prospective study of the role of depression in the
development and persistence of adolescent obesity. Pediatrics, 110(3), 497-504. Heaney, C. A., & Israel, B. A. (2008). Social networks and social support. Health behavior and
health education: Theory, research, and practice, 4, 189-210. House, J. S., Umberson, D., & Landis, K. R. (1988). Structures and processes of social support.
Annual review of sociology, 293-318. Howlader, N. (2017). SEER Cancer Statistics Review, 1975-2014 [based on November 2016
SEER data submission, updated April 2017]. Retrieved from the National Cancer Institute website: https://seer/. cancer. gov/csr.
Kanavos, P. (2006). The rising burden of cancer in the developing world. Annals of oncology,
17(suppl 8), viii15-viii23. Kawachi, I., & Kroenke, C. (2006). Socioeconomic disparities in cancer incidence and mortality.
Cancer epidemiology and prevention, 3, 174-188.

11
Key, T. J., Schatzkin, A., Willett, W. C., Allen, N. E., Spencer, E. A., & Travis, R. C. (2004).
Diet, nutrition and the prevention of cancer. Public health nutrition, 7(1a), 187-200. Krieger, N., Quesenberry Jr, C., Peng, T., Horn-Ross, P., Stewart, S., Brown, S., . . . Alvarez-
Martinez, L. (1999). Social class, race/ethnicity, and incidence of breast, cervix, colon, lung, and prostate cancer among Asian, Black, Hispanic, and White residents of the San Francisco Bay Area, 1988–92 (United States). Cancer causes & control, 10(6), 525-537.
Kubzansky, L. D., Kawachi, I., & Sparrow, D. (1999). Socioeconomic status, hostility, and risk
factor clustering in the Normative Aging Study: any help from the concept of allostatic load? Annals of Behavioral Medicine, 21(4), 330-338.
Kvaavik, E., Batty, G. D., Ursin, G., Huxley, R., & Gale, C. R. (2010). Influence of individual
and combined health behaviors on total and cause-specific mortality in men and women: the United Kingdom health and lifestyle survey. Archives of internal medicine, 170(8), 711-718.
Link, B. G., & Phelan, J. (1995). Social conditions as fundamental causes of disease. Journal of
health and social behavior, 80-94. McKenna, M. C., Zevon, M. A., Corn, B., & Rounds, J. (1999). Psychosocial factors and the
development of breast cancer: a meta-analysis. Health Psychology, 18(5), 520. McNeill, L. H., Kreuter, M. W., & Subramanian, S. (2006). Social environment and physical
activity: a review of concepts and evidence. Social science & medicine, 63(4), 1011-1022.
Mendelson, T., Thurston, R. C., & Kubzansky, L. D. (2008). Affective and cardiovascular effects
of experimentally-induced social status. Health Psychology, 27(4), 482. Nausheen, B., Gidron, Y., Peveler, R., & Moss-Morris, R. (2009). Social support and cancer
progression: a systematic review. Journal of psychosomatic research, 67(5), 403-415. Papadimitriou, C., Day, N., Tzonou, A., Gerovassilis, F., Manousos, O., & Trichopoulos, D.
(1984). Biosocial correlates of colorectal cancer in Greece. International Journal of Epidemiology, 13(2), 155-159.
Parkin, D. M., Boyd, L., & Walker, L. (2011). 16. The fraction of cancer attributable to lifestyle
and environmental factors in the UK in 2010. British journal of cancer, 105, S77-S81. Patten, S. B., Williams, J. V., Lavorato, D. H., & Eliasziw, M. (2009). A longitudinal community
study of major depression and physical activity. General hospital psychiatry, 31(6), 571-575.

12
Patton, G., Carlin, J., Coffey, C., Wolfe, R., Hibbert, M., & Bowes, G. (1998). Depression, anxiety, and smoking initiation: a prospective study over 3 years. American journal of public health, 88(10), 1518-1522.
Potter, J. D., Slattery, M. L., Bostick, R. M., & Gapstur, S. M. (1993). Colon cancer: a review of
the epidemiology. Epidemiologic reviews, 15(2), 499-545. Schoenborn, C. A., Adams, P. F., & Peregoy, J. A. (2013). Health behaviors of adults: United
States, 2008-2010. Vital and health statistics. Series 10, Data from the National Health Survey(257), 1-184.
Seeman, T. E. (1996). Social ties and health: The benefits of social integration. Annals of
epidemiology, 6(5), 442-451. Shumaker, S. A., & Hill, D. R. (1991). Gender differences in social support and physical health.
Health Psychology, 10(2), 102. Spring, B., King, A. C., Pagoto, S. L., Van Horn, L., & Fisher, J. D. (2015). Fostering multiple
healthy lifestyle behaviors for primary prevention of cancer. American Psychologist, 70(2), 75.
Statistics, N. C. f. H. (2017). Health, United States, 2016: with chartbook on long-term trends in
health. Strine, T. W., Mokdad, A. H., Balluz, L. S., Gonzalez, O., Crider, R., Berry, J. T., & Kroenke, K.
(2008). Depression and anxiety in the United States: findings from the 2006 Behavioral Risk Factor Surveillance System. Psychiatric Services.
Tavani, A., Fioretti, F., Franceschi, S., Gallus, S., Negri, E., Montella, M., . . . La Vecchia, C.
(1999). Education, socioeconomic status and risk of cancer of the colon and rectum. International Journal of Epidemiology, 28(3), 380-385.
Urahn, S. K., Currier, E., Elliott, D., Wechsler, L., Wilson, D., & Colbert, D. (2012). Pursuing
the American dream: Economic mobility across generations. US Department of Health and Human Services. (2014). The health consequences of smoking—
50 years of progress: a report of the Surgeon General. Atlanta, GA: US Department of Health and Human Services, Centers for Disease Control and Prevention, National Center for Chronic Disease Prevention and Health Promotion, Office on Smoking and Health, 17.
Van Loon, A., Van den Brandt, P., & Golbohm, R. (1995). Socioeconomic status and colon
cancer incidence: a prospective cohort study. British journal of cancer, 71(4), 882.

13
Wagner, J., Burg, M., & Sirois, B. (2004). Social support and the transtheoretical model: Relationship of social support to smoking cessation stage, decisional balance, process use, and temptation. Addictive behaviors, 29(5), 1039-1043.
Wang, Y. C., McPherson, K., Marsh, T., Gortmaker, S. L., & Brown, M. (2011). Health and
economic burden of the projected obesity trends in the USA and the UK. The Lancet, 378(9793), 815-825.
Windle, M., & Windle, R. C. (2001). Depressive symptoms and cigarette smoking among middle
adolescents: prospective associations and intrapersonal and interpersonal influences. Journal of consulting and clinical psychology, 69(2), 215.

14
STUDY 1. Depressive Symptoms and Risk of Incident Lung Cancer Among Women in the
Nurses’ Health Study
Emily S. Zevon1, Ichiro Kawachi1, Reginald D. Tucker-Seeley2, and Laura D. Kubzansky1
1 Department of Social and Behavioral Sciences, Harvard T.H. Chan School of Public Health,
677 Huntington Avenue, Boston, MA 02115
2 University of Southern California Leonard Davis School of Gerontology, 3715 McClintock
Avenue, Los Angeles, CA 90089

15
Abstract
Objective: Few studies have assessed the association between depressive symptoms and lung
cancer risk, and findings from existing studies have been contradictory. We examined the
association between depressive symptoms and lung cancer risk in a large prospective cohort, and
also sought to determine the role of smoking in this association.
Methods: Data are from the Nurses’ Health Study (NHS), an ongoing cohort of women followed
since 1976. Measures of depressive symptoms, smoking, and incident lung cancer were available
for 51,907 women. Depressive symptoms were first assessed in 1992 via the five-item Mental
Health Index (MHI-5), a subscale of the Short-Form 36 survey. In follow up between 1992 and
2008, 944 cases of lung cancer were identified. Lifetime pack-years of smoking were calculated
from reported smoking behaviors at baseline. Cox proportional hazards models were used to
evaluate risk of developing lung cancer according to level of depressive symptoms, adjusting for
relevant covariates. Subsequent analyses assessed mediation and effect modification by lifetime
pack-years of smoking, as well as alternative strategies for modeling depressive symptoms (e.g.
physician diagnosis & medication prescription).
Results: In multivariable analyses, women with the highest versus lowest level of depressive
symptoms had an increased risk of lung cancer (hazard ratio= 1.74; 95% CI: 1.43, 2.12) after
adjusting for age, exposure to secondhand smoke during childhood, childhood socioeconomic
status, and socioeconomic status in adulthood. When stratifying by smoking status, the hazard
ratio was 1.08 (95% CI: 0.98, 1.18) among current smokers, 1.22 (95% CI: 1.10, 1.34) among
former smokers, and 1.21 (95% CI: 1.00, 1.48) among participants without history of smoking.
In a test of mediation, lifetime pack-years of smoking accounted for 46% of the overall
16
association between depressive symptoms and cancer risk. Results were similar when employing
alternative strategies for modeling depressive symptoms.
Conclusions: Depressive symptoms are associated with greater risk of developing lung cancer
among women in the NHS. Smoking history accounts for approximately half of this association.

17
Introduction:
Lung cancer is the second most common cancer and the leading cause of cancer death in
the United States (American Cancer Society, 2015). Although lung cancer incidence has fallen in
recent decades in tandem with declining smoking prevalence (American Cancer Society, 2015),
this trend has not been equal across population subgroups. Due in large part to smoking patterns,
the decline in lung cancer began later and has occurred more slowly in women than in men
(American Cancer Society, 2015; Henley et al., 2014). Given these disparities and the still
significant overall disease burden, it is critical to identify additional modifiable risk factors to
target for prevention efforts in women, as well as to identify upstream determinants of smoking.
It has long been suggested that depression plays a role in cancer etiology and progression,
with behavioral and psychoneuroimmunological pathways commonly used to explain observed
associations (Blumberg, West, & Ellis, 1954; Giese-Davis & Spiegel, 2003; McGee, Williams, &
Elwood, 1994). Animal models support the plausibility of carcinogenic effects of stress and
depression by demonstrating their contributions to immune dysfunction (Glaser & Kiecolt-
Glaser, 2005; Holden, Pakula, & Mooney, 1998), DNA damage (Gidron, Russ, Tissarchondou,
& Warner, 2006), and tumor initiation and growth (Reiche, Nunes, & Morimoto, 2004; Sklar &
Anisman, 1979). Evidence from animal and human studies suggests that depression may play an
important etiologic role in cancers, including lung cancer (Chida, Hamer, Wardle, & Steptoe,
2008; Giese-Davis & Spiegel, 2003; Holden et al., 1998). However, prior epidemiologic studies
have often addressed cancer progression or mortality rather than incidence (Buccheri, 1998;
Giese-Davis & Spiegel, 2003). Only a few studies have investigated the association between
depression and incident lung cancer in humans, and they have presented contradictory findings.
However, these studies have been limited in various ways, including small sample size, lack of

18
prospective design, short duration of follow-up, and failure to include women (Dalton,
Mellemkjær, Olsen, Mortensen, & Johansen, 2002; Gallo, Armenian, Ford, Eaton, &
Khachaturian, 2000; Gross, Gallo, & Eaton, 2010; Kaplan & Reynolds, 1988; Knekt et al., 1996;
Penninx et al., 1998).
Depression is modifiable, and evaluating its role as a potential risk factor for lung cancer
may provide valuable insight into avenues for reducing disease. Depression is a particularly
common psychosocial exposure; in 2012, 6.9% of US adults reported having experienced at least
one major depressive episode over the previous year (Substance Abuse and Mental Health
Services Administration, 2013). Given the prevalence of exposure, prior research suggesting it
may contribute to cancer etiology, and the limited work evaluating its contribution to lung
cancer, we propose that a more detailed examination of the association between depression and
lung cancer risk is warranted. Furthermore, because women are at significantly higher risk of
depression than men (Kessler, 2003), an examination of lung cancer etiology among women may
be particularly informative.
There are multiple ways in which depression may be associated with lung cancer risk.
First, there may be a direct (i.e., independent of health behaviors) association between depression
and physiological or immunological dysregulation that promotes cancer initiation or progression.
Second, there may be an association that operates through behaviors that serve as risk factors for
cancer, such a cigarette smoking. In this case, these behaviors may serve either as mediators or
confounders of an association between depression and lung cancer, depending on whether they
are causes of or consequences of depression. Given the strong association between cigarette use
and both depression and lung cancer, it is necessary to consider the role of smoking in the
association between depression and lung cancer.

19
Prior work, however, has not explored this role in detail. Cross-sectional data indicate
that individuals with a history of depression are more likely to smoke and less likely to succeed
in cessation than individuals without a history of depression (Anda et al., 1990; Glassman et al.,
1990). Prospective studies also indicate that depression affects smoking behaviors (Breslau,
Peterson, Schultz, Chilcoat, & Andreski, 1998; Windle & Windle, 2001). Given that tobacco
exposure is the primary cause of lung cancer (Wynder & Hoffmann, 1994), smoking thus likely
represents an important mediator of the relationship between depression and lung cancer risk.
However, some prospective studies have indicated an effect in the opposite direction, i.e., that
cigarette use increases the risk of depressive symptoms (Boden, Fergusson, & Horwood, 2010).
In this case, smoking would represent a potential confounder of the association between
depressive symptoms and lung cancer risk.
Two prior studies of the association between depression and lung cancer incidence found
that smoking was a strong modifier of the relationship, with depression being a stronger
predictor of lung cancer among smokers than nonsmokers (Knekt et al., 1996; Linkins &
Comstock, 1990). While the precise mechanism for this interaction is unclear, the investigators
hypothesized that depression may influence smoking behavior (e.g. depth of inhalation and
number of cigarettes per day) in ways that alter the effect of smoking on lung cancer. They also
hypothesized that there may be a synergistic immunological effect triggered by the combination
of depression and smoking (Linkins & Comstock, 1990; Penninx et al., 1998), given that both
exposures have been shown to suppress immune function (Holden et al., 1998; Sopori, 2002). In
particular, prior research has suggested both cigarette smoking and depression lead to diminished
function of natural-killer (NK) cells, which play an important role in tumor surveillance and
destruction (Smyth, Hayakawa, Takeda, & Yagita, 2002).

20
Building on prior work in this area, we hypothesize that higher versus lower levels of
depressive symptoms will be associated with higher risk of lung cancer, and that this association
will be partially mediated by smoking history. We additionally assess the association between
depressive symptoms and lung cancer risk independent of smoking status, to ensure that the
observed association between depression symptoms and lung cancer is not attributable to
confounding by smoking. In addition to assessing depressive symptoms at study baseline, we
also consider depressive symptoms updated over the study period to determine whether there is a
different effect of more proximal exposure to depression. Lastly, we assess the effect of chronic
depression, motivated by evidence that chronic, as compared to transient, depression may be
more strongly associated with cancer risk (Penninx et al., 1998; Spiegel & Giese-Davis, 2003).
We aim to overcome the limitations of previous research by assessing the association
between depression and lung cancer incidence in a large ongoing cohort of middle-aged women
(n=121,700) followed for a mean of 36 years. The size of the cohort and length of follow-up
provide more disease cases for consideration than previous research, improving statistical power.
In addition, our study has the advantage of evaluating smoking behavior, a key potential
mediating pathway. We control for relevant confounders, including age, exposure to secondhand
smoke during childhood, childhood socioeconomic conditions, and adult socioeconomic status
(SES). We have chosen to focus on a cohort of women because the higher prevalence of
depression in women (Kessler, 2003) and slower decline of lung cancer incidence among women
compared to men (Henley et al., 2014) make women an especially vulnerable population.
Methods:
Study Population:

21
Data are from the Nurses’ Health Study (NHS) cohort, which began in 1976 with 121,700
30 to 55 year-old female registered nurses. Since 1976, NHS participants have returned biennial
questionnaires querying health, nutrition, and lifestyle, as well as a variety of social and
psychological factors. Seventy percent of invited participants responded to the initial
questionnaire, and follow-up throughout the study has exceeded 90% (Colditz, 1994).
The sample for our study included women from the Nurses’ Health Study who completed
the baseline assessment of depression in 1992. Participants who completed the assessment and
those who failed to do so were similar with regard to age and exposure to secondhand smoke in
childhood. However, participants whose parents had blue collar occupations, as well as those
with lower socioeconomic status, were less likely to complete the depression measure. We
additionally excluded women who had previously been diagnosed with cancer from the sample.
Measures:
Depression status
Depressive symptoms were assessed via the validated five-item Mental Health Inventory
(MHI-5), a subscale of the 36-Item Short Form Survey from the RAND Medical Outcomes
Study (Ware & Sherbourne, 1992). The MHI-5 was administered in the NHS in 1992, 1996 and
2000. MHI-5 scores are highly correlated (r = .95) with scores from the longer Mental Health
Inventory from which the measure is derived (Ware & Sherbourne, 1992), and the measure has
strong internal consistency reliability (alpha = .80 in the NHS) (Kroenke et al., 2005).
Depression ascertained with the MHI-5 has been shown to be highly correlated with depression
identified via the Diagnostic Interview Schedule (Robins, Helzer, Croughan, & Ratcliff, 1981),
with an area under the curve (AUC) of .89 (Berwick et al., 1991). MHI-5 scores range from 5 to
30, but are transformed to a 0 to 100 scale. Scores were classified in four categories: 0-60 (severe

22
depressive symptoms), 61-75 (high), 76-85 (moderate) and 86-100 (low or none). A cut-point of
60 was used for analyses where depressive symptoms were dichotomized; participants with
MHI-5 scores of 60 or below were considered to have high levels of depressive symptoms
(Rumpf, Meyer, Hapke, & John, 2001). Starting in 1996 and 2000 respectively, participants
reported whether they had used antidepressants (yes/no) or received a diagnosis of depression
(yes/no) on each biennial questionnaire.
Primary analyses used depressive symptoms as measured by participants’ MHI-5 scores
from 1992. When considering depression updated over the follow-up period, MHI-5 scores from
the 1996 and 2000 questionnaires were used and reports of antidepressant prescription and
physician diagnosis of depression were combined. A participant was considered to have
depressive symptoms at a particular time point if she reported a diagnosis of depression or
antidepressant prescription over the prior two years, or had an MHI-5 score at or below the cut-
point of 60. For analyses assessing chronic depression, a variable was created indicating whether
participants reported depressive symptoms at no time points, one time point, or multiple time
points over the study period.
Ascertainment of lung cancer
Lung cancer cases were ascertained from participant questionnaires, and confirmed with
medical records. Death certificates were also examined to identify cases. To limit the possibility
that latent disease experienced prior to diagnosis affected depressive symptoms, cases of lung
cancer occurring less than two years after the baseline assessment were excluded.
Cigarette smoking
Information about smoking history was collected on biennial questionnaires throughout
the study and used to classify participants according to lifetime pack-years of smoking at study

23
baseline (Al-Delaimy, Willett, Manson, Speizer, & Hu, 2001). Similar questionnaire-based self-
report measures have shown good ability to distinguish between smokers and non-smokers when
validated with serum cotinine (Vartiainen, Seppälä, Lillsunde, & Puska, 2002). Pack-years was
modeled as a continuous variable.
Covariates
Age, SES, exposure to secondhand smoke during childhood, and childhood SES were
assessed on the 1976 questionnaire unless otherwise stated. Age was calculated based on
reported year of birth and was modeled as a continuous variable. SES was based on participants’
husbands’ educations, as reported in the 1992 questionnaire, and was modelled as a categorical
variable. Exposure to secondhand smoke during childhood was captured in the 1982
questionnaire with the question “Did your parents smoke while you were living with them?” A
dichotomous variable was created, indicating whether at least one parent or no parents smoked in
the household. Childhood SES was operationalized according to parental occupation when the
participant was 16. Maternal and paternal occupations were each classified by one of three
categories, and the more prestigious occupational category between the parents was assigned to
the participant with the following hierarchy: farmer, blue collar, and white collar. A separate
category was used to indicate whether both the participant’s parents were deceased when the
participant was aged 16.
Statistical Analyses:
Statistical analyses were conducted using SAS, v9.4 (SAS Institute, Cary NC). Initial
analyses examined the distribution of covariates across 1992 depressive symptom levels,
adjusting for age. Cox proportional hazards models were used to estimate the association
between depressive symptoms and time until diagnosis of lung cancer over the follow-up period.

24
Person-years were counted from study baseline in 1992, with participants contributing person-
time until death, diagnosis of lung cancer, or the termination of the follow-up period, whichever
came first. Our first model assessed time until lung cancer diagnosis as a function of the 4-level
MHI-5 score (86-100 as reference group), adjusting for age only. A second model further
included additional potential confounding variables, including SES, exposure to secondhand
smoke in childhood, and childhood SES.
We used causal mediation analysis techniques (Valeri & VanderWeele, 2013;
VanderWeele, 2011) to assess both potential effect modification and mediation by smoking
history. First, we calculated the magnitude and statistical significance of a multiplicative
interaction term between depressive symptoms and smoking to determine whether the
association between depressive symptoms and lung cancer varied by smoking history. Second,
we assessed two regression models: a Cox proportional hazards model regressing time until lung
cancer diagnosis on MHI-5 score, and a linear regression model regressing pack-years on MHI-5
score. Both models were adjusted for the same covariates described above.
From these models, we estimated the natural direct effect of depressive symptoms on
lung cancer risk and the natural indirect effect mediated through smoking history at baseline. The
natural direct and indirect effects were also used to calculate the proportion of the total effect of
that was mediated by smoking history. Depressive symptoms were modeled as a dichotomous
variable to maximize interpretability. Confidence intervals were calculated for all mediation
estimates with standard errors obtained via the delta method (VanderWeele, 2013).
We additionally used Cox models to assess the association between depressive symptoms
and lung cancer risk in models stratified by smoking status (i.e., never, former, or current) to
isolate the independent association between depressive symptoms and lung cancer. In these

25
models, MHI-5 score was reverse coded (higher scores indicate greater depressive symptoms) to
facilitate interpretation.
Secondary analyses were conducted to determine whether the observed effects were
robust to alternative methods for classifying depressive symptoms. These analyses were
conducted following the modeling strategy described for the primary analysis. First, we assessed
the association between chronic exposure to depressive symptoms and lung cancer risk over the
study period, using the measure of chronic depression described above. Second, depression
status was updated over the course of the study period.
Results:
Over the follow-up period, 51,107 women contributed 401,612 years of person-time, and
944 cases of lung cancer were diagnosed. The age-adjusted distributions of covariates under
study are presented according to level of depressive symptoms (Table 2.1). Approximately 15%
of the sample was classified as having severe depressive symptoms (MHI-5 scores 0-60).
Participants classified as having severe levels of depressive symptoms were older, had greater
lifetime pack-years of smoking exposure, were more likely to have been exposed to second-hand
smoke in childhood, were more likely to be unmarried, and were more likely to have parents
with blue collar occupations. An examination of tumor type by smoking status demonstrated that
tumors strongly associated with smoking (e.g., squamous cell) were common among women
with a smoking and uncommon among women who had never smoked (Table S2.1).

26
Table 2.1 Selected characteristics by level of depressive symptoms among 57,877 women from the Nurses’ Health Study in 1992
Level of depressive symptoms
Severe depressive symptoms (n=8,667)
High depressive symptoms (n=11,437)
Moderate depressive symptoms (n=20,646)
Low or no depressive symptoms (n=17,127)
Average MHI-5 score 50.52(10.16) 68.67(3.26) 80.45(3.25) 90.87(3.24)
Age* 56.96(7.20) 57.59(7.20) 58.15(7.12) 59.44(6.94)
Lung cancer cases^ 235 (3%) 269 (3%) 410 (2%) 335 (2%)
Lifetime pack-years 16.59(21.83) 14.39(20.11) 12.62(18.72) 11.41(17.79)
Exposure to smoke in childhood, %
70 69 68 66
Husband’s education
Not married, % 11 9 8 8
< High school, % 7 6 6 5
High school degree, % 37 37 37 36
College degree, % 25 27 27 27
Graduate degree, % 20 21 23 24
Parent’s occupation
Both parents dead, % 1 1 1 0
Farmer, % 6 7 8 9
Blue collar, % 24 23 22 21
White collar, % 69 69 70 70 Values are means(SD) or percentages and are standardized to the age distribution of the study population. Values of polytomous variables may not sum to 100% due to rounding. * Value is not age adjusted. ^ Number of lung cancer cases over the course of the study period.

27
In modeling the risk of lung cancer according to 1992 depressive symptoms, participants
with severe depressive symptoms (MHI-5 score 0-60) had a higher risk of developing lung
cancer compared to those with low depressive symptoms (MHI-5 score 86-100) in both age-
adjusted (hazard ratio= 1.80; 95% CI: 1.48, 2.19) and fully-adjusted (HR= 1.74; 95% CI: 1.43,
2.12) models (Table 2.2). Women with high depressive symptoms (MHI-5 score 61-75) also had
an elevated risk of developing lung cancer compared to those with low depressive symptoms
(fully-adjusted HR= 1.37; 95% CI: 1.13, 1.65), although they had comparatively a lower risk
than women with severe depressive symptoms (fully-adjusted HR= 0.79; 95% CI: 0.64, 0.96).

28
Table 2.2 Hazard ratios and 95% confidence intervals for lung cancer by level of depressive symptoms among 51,907 women from the Nurses' Health Study
Level of depressive symptoms/category of MHI-5*
Depressive
(0-60) 61-75 76-85 Reference (86-100)
Age-adjusted hazard ratio 1.80 1.39 1.11 1.00 95% confidence interval 1.48, 2.19 1.15, 1.67 0.94, 1.32 Multivariable-adjusted hazard ratio^ 1.74 1.37 1.10 1.00 95% confidence interval 1.43, 2.12 1.13, 1.65 0.93, 1.30
* MHI-5, five-item Mental Health Index, a subscale of the Short Form Survey from the RAND Medical Outcomes Study
^ Multivariable-adjusted analyses adjusted for age (continuous); exposure to second-hand smoking during childhood (yes,no (reference)); parents' occupations when participant was 16 years old (both parents dead, farmer, blue collar, white collar (reference)); and husband's education (participant unmarried, less than high school, high school graduate, college graduate, graduate school (reference))

29
The interaction term for smoking and dichotomous MHI-5 score was not statistically
significant (fully-adjusted HR= 1.00; 95% CI: 0.99, 1.01), suggesting that the association
between depressive symptoms and lung cancer risk did not meaningfully vary by smoking
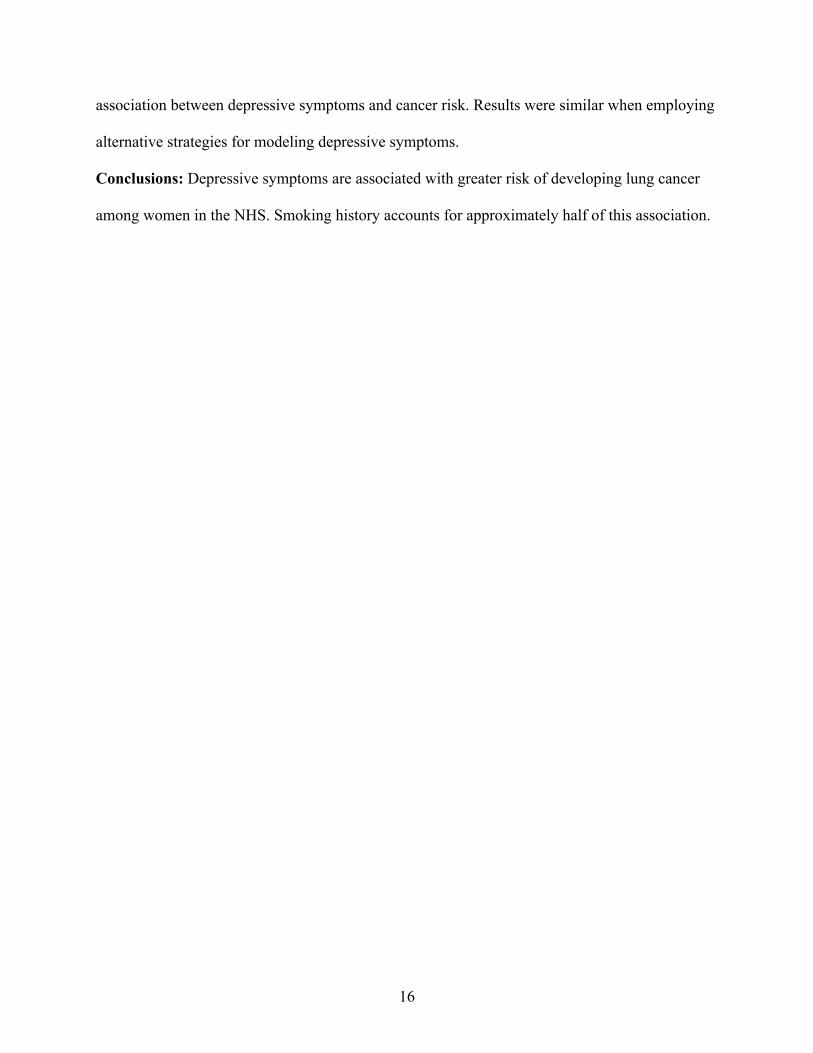
history. Mediation analyses suggested the relationship between depressive symptoms and lung
cancer risk was at least partly mediated by lifetime pack-years of smoking (Table 2.3). While
there was a significant natural direct effect of depressive symptoms in 1992 with a hazard ratio
of 1.23 (95% CI: 1.04, 1.47), the natural indirect effect of depressive symptoms (HR= 1.16; 95%
CI: 1.13, 1.19) was also significant. Findings suggested that 46% of the total effect of depressive
symptoms on lung cancer risk was mediated by smoking.
30
Table 2.3 Mediation of the association between depressive symptoms and lung cancer risk by smoking history
Hazard Ratio* p-value 95% CI
Natural direct effect 1.23 0.02 1.04, 1.47 Natural indirect effect 1.16 <0.001 1.13, 1.19 Total effect 1.43 <0.001 1.21, 1.69 Proportion mediated: 0.46
* Hazard ratio comparing high depressive symptoms (MHI < 61) to low depressive symptoms (MHI >= 61). Model is adjusted for age (continuous); exposure to second-hand smoking during childhood (yes,no (reference)); parents' occupations when participant was 16 years old (both parents dead, farmer, blue collar, white collar (reference)); and husband's education (participant unmarried, less than high school, high school graduate, college graduate, graduate school (reference))

31
In Cox analyses stratified by smoking history, the hazard ratio for a standard deviation
increase in depressive symptoms was 1.08 (95% CI: 0.98, 1.18) among current smokers, 1.22
(95% CI: 1.10, 1.34) among former smokers, and 1.21 (95% CI: 1.00, 1.48) among participants
with no history of smoking (Table 2.4). This indicates that, while smoking may serve as a
mediator, there is also an independent association between depressive symptoms and lung cancer
risk.

32
* Hazard ratio for standard deviation change in MHI-5 score. MHI-5 score has been reverse-coded so that higher scores indicate greater depressive symptoms. Model is adjusted for age (continuous); exposure to second-hand smoking during childhood (yes, no (reference)); parents' occupations when participant was 16 years old (both parents dead, farmer, blue collar, white collar (reference)); and husband's education (participant unmarried, less than high school, high school graduate, college graduate, graduate school (reference))
Table 2.4 Association between depressive symptoms (standard deviation change in reverse-coded MHI-5 score) and lung cancer risk, stratified by smoking history
Hazard Ratio* p-value 95% CI Number
of Cases
Current smokers 1.08 0.12 0.98, 1.18 471 Former smokers 1.22 <0.01 1.10, 1.34 373 Never smokers 1.21 0.05 1.00, 1.48 100

33
In a secondary analysis, participants who reported high depressive symptoms at two or
more time points over the study period had a higher risk of developing lung cancer than those
who reported depressive symptoms at no time points (fully-adjusted HR= 1.47; 95% CI: 0.96,
2.24). Participants with depressive symptoms at one time point had a slightly higher risk than
those who reported depressive symptoms at no time points (fully-adjusted HR= 1.35; 95% CI:
0.97, 1.87), although neither estimate reached conventional values of statistical significance (p-
values .073 and .078, respectively) (Table 2.5). Findings from an additional secondary analysis
evaluating the association between updated smoking status and risk of lung cancer risk were
similar to those using baseline depressive symptom measures. Time-varying high versus low
levels of depressive symptoms were associated with an increased risk of developing lung cancer
(fully-adjusted HR=1.36; 95% CI: 1.03, 1.79).

34
Table 2.5 Hazard ratios for lung cancer by level of depressive symptoms- alternative strategies for modeling depressive symptoms Level of depressive symptoms
Time-varying depression
status* Chronic depression**
High depressive symptoms
Low depressive symptoms (reference)
Depressive symptoms at 2+ time points
Depressive symptoms at 1 time point
Depressive symptoms at no time points (reference)
Age-adjusted hazard ratio 1.39 1.00 1.50 1.38 1.00 95% confidence
interval 1.05, 1.82 0.99, 2.27 0.99, 1.91 Multivariable-adjusted hazard ratio^ 1.36 1.00 1.47 1.35 1.00 95% confidence
interval 1.03, 1.79 0.96, 2.24 0.97, 1.87 * Assessment of depressive symptoms includes MHI-5 score (0-60), physician diagnosis of depression, and prescription of antidepressants. Depressive symptoms were updated over the study period. ** Participants were considered to have depressive symptoms at a given time point if they reported an MHI-5 score <= 60. ^ Multivariable-adjusted analyses adjusted for age (continuous); exposure to second-hand smoking during childhood (yes,no (reference)); parents' occupations when participant was 16 years old (both parents dead, farmer, blue collar, white collar (reference)); and husband's education (participant unmarried, less than high school, high school graduate, college graduate, graduate school (reference))

35
Discussion:
To our knowledge, this is the largest study to address the association between depressive
symptoms and incident lung cancer, and the first to consider the role of smoking history among
women. Consistent with our hypothesis, higher levels of depressive symptoms were associated
with an increased risk of developing lung cancer over the study period. This effect was robust to
alternative specifications of depressive symptoms. Contrary to prior findings (Knekt et al., 1996;
Linkins & Comstock, 1990), in this sample, the effect of depressive symptomology on lung
cancer risk did not differ by lifetime pack-years of smoking. However, there was evidence that
smoking partly mediated the association of depressive symptoms with incident lung cancer,
accounting for approximately half of the overall effect. Findings further suggested that additional
mediators are at play given the significant direct effect that was also evident. While we
hypothesized that smoking behavior mediates the association between depressive symptoms and
lung cancer risk, data available in the present study did not allow us to distinguish between
mediation and confounding. However, the persistence of an association between depressive
symptoms and lung cancer risk among participants with no history of smoking indicates that the
observed relationship is not entirely due to confounding by smoking.
These findings are consistent with prior research that has identified a positive association
between depression and lung cancer risk, including a prospective cohort study conducted among
3,239 Finnish men over 14 years of follow-up. (Knekt et al., 1996) and a retrospective cohort
study that assessed cancer outcomes for 89,491 Danish adults with depression over 12.5 years of
follow-up (Dalton, Mellemkjær, Olsen, Mortensen, & Johansen, 2002). An additional
prospective cohort study found an overall association between depressed mood and cancer, but
no association with lung cancer specifically (Penninx et al., 1998). However, findings in this
36
study were statistically adjusted for smoking, rather than considering smoking as either an effect
modifier or mediator. Contradicting our findings, two prior prospective cohorts following both
men and women found no association between depression and lung cancer (Gross, Gallo, &
Eaton, 2010; Kaplan & Reynolds, 1988), although the number of lung cancer cases identified in
these studies was limited (n of 64 and 65, respectively).
Many of the prior studies of depressive symptoms and lung cancer have been conducted
with samples that include both men and women. Although some studies have only considered
male participants, we did not identify any studies that solely included women. Studies that failed
to find an association between depressive symptoms and lung cancer were conducted in mixed-
gender cohorts. It is possible that the effect observed in the present study among women would
not be observed among men, which could partially explain the lack of association seen in studies
where men and women are analyzed together.
In addition to smoking, there are likely other behavioral pathways and perhaps direct
biological pathways (i.e., those not mediated by health behaviors) that contribute to the observed
association between increased depressive symptoms and higher lung cancer risk. Given that
smoking history accounted for only half of the observed relationship, other behaviors such as
exposure to secondhand smoke in adulthood may be considered. It is also likely that
physiological dysregulation caused by persistent depressive symptoms contributes meaningfully
to the observed relationship. Although data were not available in the present study to assess these
factors, prior research in animal models supports the plausibility of direct endocrine and neuro-
immune pathways between depression and cancer mediated by processes such as immune
dysregulation and DNA damage due to increased oxidative stress (Gidron et al., 2006; Glaser &
Kiecolt-Glaser, 2005; Reiche et al., 2004). Furthermore, research demonstrating an association

37
between depressive symptoms and higher risk of cancers that are less associated with smoking
than lung cancer (i.e., colon cancer and ovarian cancer) in the same Nurses’ Health cohort lends
support to the presence of direct biological effects of depression that are not mediated by
smoking (Huang et al., 2015; Kroenke et al., 2005). Additional studies with measurements of
relevant biomarkers are needed to validate these potential pathways and assess the extent to
which they contribute to disease.
The current study has several limitations. The MHI-5, which was used as the primary
measure of depressive symptoms, asks participants to recall their feelings over only the previous
four weeks. It is therefore possible that the measure captured transient negative affect, rather than
the type of enduring depressive symptomatology (and related cumulative damage) we expect is
most salient for lung cancer risk. In using this measure, we assumed that depression was a semi-
stable phenomenon, and that participants who reported depressive symptoms over a short period
of time were likely to also experience them in the longer term. While secondary analyses
indicated that the risk of depressive symptoms may be enhanced with chronic exposure, our
primary analysis supports the conclusion that even depressive symptoms assessed at a single
time point are predictive of lung cancer risk.
A second limitation is lack of generalizability. The NHS is a predominantly white sample
of professional women, and it is unknown whether the relationships observed in our study would
apply equally in other demographics. Additional research is required to assess how the observed
associations may apply in a more representative sample. A third limitation of the study, as with
all observational research, was the potential for residual or unmeasured confounding. While we
controlled for a variety of covariates that may be common prior causes of both depressive
symptoms and lung cancer, it is possible that these factors were inadequately measured or that

38
additional salient confounders were excluded from analyses. However, given the size of the
observed effect and its robustness to the covariates included in our models, we do not expect that
unmeasured confounding would substantially change our conclusions.
The current study also had numerous strengths. A primary advantage was its large sample
size and long duration of follow-up, which facilitated the ascertainment of a large number of
cases and provided sufficient power to detect a statistically significant association between
depressive symptoms and lung cancer risk. Additional strengths of the study included its
validation of lung cancer diagnoses via medical records, thorough consideration of the potential
role of smoking, and assessment of lung cancer risk specifically among women.
In conclusion, this study demonstrates a prospective association between depressive
symptoms and greater risk of lung cancer that is partially mediated by smoking history.
Smoking, however, remains the overwhelming cause of lung cancer. In the sample used for this
analysis, 90% of all lung cancer cases were observed among women who were current or former
smokers. Thus, smoking prevention and cessation remain the most important factors for the
reduction of lung cancer. Depression, however, is a modifiable risk factor that promotes smoking
initiation and interferes with cessation, and thus should be prioritized as an upstream contributor
to behavior. Additionally, as demonstrated in this study, depression appears to also contribute to
lung cancer risk independent of its association with smoking. This finding warrants additional
research into the potential biological mechanisms for such an effect. Considered together, this
research points to the necessity of looking beyond behavioral determinants of disease to consider
the social and psychological factors that may shape the distribution of those determinants as well
as exert a direct effect on disease risk.

39
References
Al-Delaimy, W. K., Willett, W. C., Manson, J. E., Speizer, F. E., & Hu, F. B. (2001). Smoking
and Mortality Among Women With Type 2 Diabetes The Nurses’ Health Study cohort. Diabetes care, 24(12), 2043-2048.
American Cancer Society. (2015). Cancer Facts and Figures, 2015. Retrieved from Atlanta:
Anda, R. F., Williamson, D. F., Escobedo, L. G., Mast, E. E., Giovino, G. A., & Remington, P. L. (1990). Depression and the dynamics of smoking: a national perspective. Jama, 264(12), 1541-1545.
Berwick, D. M., Murphy, J. M., Goldman, P. A., Ware Jr, J. E., Barsky, A. J., & Weinstein, M. C. (1991). Performance of a five-item mental health screening test. Medical care, 29(2), 169-176.
Blumberg, E. M., West, P. M., & Ellis, F. W. (1954). A possible relationship between psychological factors and human cancer. Psychosomatic medicine, 16(4), 277-286.
Breslau, N., Peterson, E. L., Schultz, L. R., Chilcoat, H. D., & Andreski, P. (1998). Major depression and stages of smoking: a longitudinal investigation. Archives of general psychiatry, 55(2), 161-166.
Buccheri, G. (1998). Depressive reactions to lung cancer are common and often followed by a poor outcome. European Respiratory Journal, 11(1), 173-178.
Boden, J. M., Fergusson, D. M., & Horwood, L. J. (2010). Cigarette smoking and depression: tests of causal linkages using a longitudinal birth cohort. The British Journal of Psychiatry, 196(6), 440-446.
Chida, Y., Hamer, M., Wardle, J., & Steptoe, A. (2008). Do stress-related psychosocial factors
contribute to cancer incidence and survival? Nature clinical practice Oncology, 5(8), 466-475.
Colditz, G. A. (1994). The nurses' health study: a cohort of US women followed since 1976. Journal of the American Medical Women's Association, 50(2), 40-44.
Dalton, S. O., Mellemkjær, L., Olsen, J. H., Mortensen, P. B., & Johansen, C. (2002). Depression and cancer risk: a register-based study of patients hospitalized with affective disorders, Denmark, 1969–1993. American journal of Epidemiology, 155(12), 1088-1095.
Gallo, J. J., Armenian, H. K., Ford, D. E., Eaton, W. W., & Khachaturian, A. S. (2000). Major depression and cancer: the 13-year follow-up of the Baltimore epidemiologic catchment area sample (United States). Cancer causes & control, 11(8), 751-758.

40
Gidron, Y., Russ, K., Tissarchondou, H., & Warner, J. (2006). The relation between psychological factors and DNA-damage: a critical review. Biological psychology, 72(3), 291-304.
Giese-Davis, J., & Spiegel, D. (2003). Emotional expression and cancer progression. In R. J. Davidson, K. R. Scherer, & H. H. Goldsmith (Eds.), Handbook of affective sciences (pp. 1053-1082). New York, NY, US: Oxford University Press.
Glaser, R., & Kiecolt-Glaser, J. K. (2005). Stress-induced immune dysfunction: implications for health. Nature Reviews Immunology, 5(3), 243-251.
Glassman, A. H., Helzer, J. E., Covey, L. S., Cottler, L. B., Stetner, F., Tipp, J. E., & Johnson, J. (1990). Smoking, smoking cessation, and major depression. Jama, 264(12), 1546-1549.
Gross, A. L., Gallo, J. J., & Eaton, W. W. (2010). Depression and cancer risk: 24 years of follow-up of the Baltimore Epidemiologic Catchment Area sample. Cancer causes & control, 21(2), 191-199.
Henley, S. J., Richards, T. B., Underwood, J. M., Eheman, C. R., Plescia, M., & McAfee, T. A. (2014). Lung cancer incidence trends among men and women--United States, 2005-2009. MMWR. Morbidity and mortality weekly report, 63(1), 1-5.
Holden, R., Pakula, I., & Mooney, P. (1998). An immunological model connecting the pathogenesis of stress, depression and carcinoma. Medical hypotheses, 51(4), 309-314.
Huang, T., Poole, E. M., Okereke, O. I., Kubzansky, L. D., Eliassen, A. H., Sood, A. K., . . . Tworoger, S. S. (2015). Depression and risk of epithelial ovarian cancer: results from two large prospective cohort studies. Gynecologic oncology, 139(3), 481-486.
Kaplan, G. A., & Reynolds, P. (1988). Depression and cancer mortality and morbidity:
prospective evidence from the Alameda County study. Journal of behavioral medicine, 11(1), 1-13.
Kessler, R. C. (2003). Epidemiology of women and depression. Journal of affective disorders, 74(1), 5-13.
Knekt, P., Raitasalo, R., Heliövaara, M., Lehtinen, V., Pukkala, E., Teppo, L., . . . Aromaa, A. (1996). Elevated lung cancer risk among persons with depressed mood. American journal of Epidemiology, 144(12), 1096-1103.
Kroenke, C. H., Bennett, G. G., Fuchs, C., Giovannucci, E., Kawachi, I., Schernhammer, E., . . . Kubzansky, L. D. (2005). Depressive symptoms and prospective incidence of colorectal cancer in women. American journal of Epidemiology, 162(9), 839-848.
Linkins, R. W., & Comstock, G. W. (1990). Depressed mood and development of cancer. American journal of Epidemiology, 132(5), 962-972.

41
McGee, R., Williams, S., & Elwood, M. (1994). Depression and the development of cancer: a meta-analysis. Social science & medicine, 38(1), 187-192.
Penninx, B. W., Guralnik, J. M., Havlik, R. J., Pahor, M., Ferrucci, L., Cerhan, J. R., & Wallace, R. B. (1998). Chronically depressed mood and cancer risk in older persons. Journal of the National Cancer Institute, 90(24), 1888-1893.
Reiche, E. M. V., Nunes, S. O. V., & Morimoto, H. K. (2004). Stress, depression, the immune system, and cancer. The lancet oncology, 5(10), 617-625.
Robins, L. N., Helzer, J. E., Croughan, J., & Ratcliff, K. S. (1981). National Institute of Mental Health diagnostic interview schedule: its history, characteristics, and validity. Archives of general psychiatry, 38(4), 381-389.
Rumpf, H.-J., Meyer, C., Hapke, U., & John, U. (2001). Screening for mental health: validity of the MHI-5 using DSM-IV Axis I psychiatric disorders as gold standard. Psychiatry research, 105(3), 243-253.
Sklar, L. S., & Anisman, H. (1979). Stress and coping factors influence tumor growth. Science,
205(4405), 513-515.
Smyth, M. J., Hayakawa, Y., Takeda, K., & Yagita, H. (2002). New aspects of natural-killer-cell surveillance and therapy of cancer. Nature Reviews Cancer, 2(11), 850-861.
Sopori, M. (2002). Effects of cigarette smoke on the immune system. Nature Reviews Immunology, 2(5), 372-377.
Spiegel, D., & Giese-Davis, J. (2003). Depression and cancer: mechanisms and disease progression. Biological psychiatry, 54(3), 269-282.
Substance Abuse and Mental Health Services Administration. (2013). Results from the 2012 national survey on drug use and health: summary of national findings. Retrieved from Rockville, MD:
Valeri, L., & VanderWeele, T. J. (2013). Mediation analysis allowing for exposure–mediator interactions and causal interpretation: Theoretical assumptions and implementation with SAS and SPSS macros. Psychological methods, 18(2), 137.
VanderWeele, T. J. (2011). Causal mediation analysis with survival data. Epidemiology (Cambridge, Mass.), 22(4), 582.
VanderWeele, T. J. (2013). A three-way decomposition of a total effect into direct, indirect, and interactive effects. Epidemiology (Cambridge, Mass.), 24(2), 224.
Vartiainen, E., Seppälä, T., Lillsunde, P., & Puska, P. (2002). Validation of self reported smoking by serum cotinine measurement in a community-based study. Journal of epidemiology and community health, 56(3), 167-170.

42
Ware, J. E., & Sherbourne, C. D. (1992). The MOS 36-item short-form health survey (SF-36): I. Conceptual framework and item selection. Medical care, 473-483.
Windle, M., & Windle, R. C. (2001). Depressive symptoms and cigarette smoking among middle adolescents: prospective associations and intrapersonal and interpersonal influences. Journal of consulting and clinical psychology, 69(2), 215.
Wynder, E. L., & Hoffmann, D. (1994). Smoking and lung cancer: scientific challenges and opportunities. Cancer Research, 54(20), 5284-5295.

43
Supplemental Materials
Table S2.1 Tumor types by smoking status, n (%) Category of smoking status Non-smokers Former smokers Current smokers Squamous cell 3 (2.2) 76 (13.3) 117 (18.8) Small cell 2 (1.5) 56 (9.8) 121 (19.5) Adenocarcinoma 100 (73.0) 287 (50.3) 238 (38.3) Large cell 5 (3.7) 25 (4.4) 21 (3.4) Combined epidermoid and
adenocarcinoma 7 (5.1) 67 (11.7) 73 (11.8) Carcinoid 12 (8.8) 17 (3.0) 5 (0.8) Papillary tumor surface epitheliium, mixed
tumor with carcinosarcoma, sarcoma, pleural tumor/mesothelioma 3 (2.2) 7 (1.2) 1 (0.2)
Other carcinoma/unknown type 5 (3.7) 36 (6.3) 45 (7.3) Proportion of total cases 10% 43% 47%

44
STUDY 2. The Association between Childhood Socioeconomic Status, Adult Health
Behaviors, and Risk of Incident Colon Cancer in the Nurses’ Health Study
Emily S. Zevon1, Ichiro Kawachi1, Reginald D. Tucker-Seeley2, and Laura D. Kubzansky1
1 Department of Social and Behavioral Sciences, Harvard T.H. Chan School of Public Health,
677 Huntington Avenue, Boston, MA 02115
2 University of Southern California Leonard Davis School of Gerontology, 3715 McClintock
Avenue, Los Angeles, CA 90089

45
Abstract
Objective: Prior studies have considered the association between SES and colon cancer risk, but
no clear pattern has been established. Few studies have considered socioeconomic status
assessed in childhood, which captures a longer history of exposure and may set trajectories for
cancer-relevant health behaviors (e.g., diet and physical activity) in adulthood. We tested the
hypothesis that lower childhood SES would be associated with engaging in fewer healthful
behaviors and with a higher risk of incident colon cancer in adulthood.
Methods: Data are from the Nurses’ Health Study, an ongoing cohort of women started in 1976.
Childhood socioeconomic status was operationalized as parent occupation when the participant
was 16 years old, and was assessed at study baseline. Unhealthy lifestyle in adulthood was
operationalized via a score incorporating smoking status, body mass index [BMI], diet, alcohol
consumption, and physical activity. Analyses used Cox proportional hazards models to evaluate
the association between childhood SES and time until adopting an unhealthy lifestyle over 20
years of follow-up. Additional analyses used Cox proportional hazards models to assess the risk
of developing colon cancer according to parent occupation over 36 years of follow-up, during
which 2,090 cases of colon cancer were identified.
Results: Women whose parents had white collar occupations served as the reference group in all
analyses. Women whose parents were blue collar were at greater risk of adopting an unhealthy
lifestyle over the study period (HR= 1.06; 95% CI: 1.04, 1.09). Having blue collar parents was
associated with a small increase in the risk of developing colon cancer after adjusting for age and
family history of colon cancer, however the effect was not statistically significant (HR= 1.07;
95% CI: 0.97, 1.18). Women whose parents were farmers had a lower risk of colon cancer (HR=
0.83; 95% CI: 0.70, 0.98).

46
Conclusions: Low childhood socioeconomic status was associated with risk of developing an
unhealthy lifestyle in adulthood, even among a sample of professional women. However, in this
sample, women whose parents were white collar did not have a meaningfully lower risk of colon
cancer than women whose parents were blue collar.

47
Introduction:
The association between socioeconomic status (SES) and health status has been
extensively documented (Adler et al., 1994) across diverse health outcomes (Adler & Ostrove,
1999; Feinstein, 1993; Smith, Carroll, Rankin, & Rowan, 1992). Not only does SES predict
overall health status, research demonstrates that each incremental increase in the social hierarchy
is associated with health gains, an effect often described as the SES-health gradient (Marmot et
al., 1991). As part of this body of research, many studies have examined social disparities in
cancer incidence and mortality (Krieger, 2005; Ward et al., 2004). However, in the case of
cancer, the SES-health gradient is not as consistent as with other health outcomes, and with some
types of cancer (e.g., breast cancer and melanoma) the gradient is even reversed (Adler &
Ostrove, 1999; Kawachi & Kroenke, 2006). Colon cancer is the third most common cancer
among men and women in the US, and the second leading cause of cancer death among men and
women combined (American Cancer Society, 2015). Research on the relationship between SES
and colon cancer incidence has demonstrated significant heterogeneity of effect across different
studies and populations. Given the high disease burden and need for effective intervention, it is
imperative to reconcile these conflicted findings.
Previous research has considered the effect of adult SES on colon cancer risk. Some of
these studies have unexpectedly found that higher SES was associated with increased risk of
developing colon cancer (Ferraroni, Negri, La Vecchia, D'Avanzo, & Franceschi, 1989; Tavani
et al., 1999; Van Loon, Van den Brandt, & Golbohm, 1995), while others found the more
expected association between lower SES and colon cancer risk (Kim, Masyn, Kawachi, Laden,
& Colditz, 2010), and some found no association (Papadimitriou et al., 1984). Large prospective
cohort studies have found conflicting inverse versus positive associations between SES and

48
colon cancer risk (Kim et al., 2010; Van Loon et al., 1995). However, with an increasing
appreciation of the importance of a life course perspective (Berkman, 2009), investigators have
noted that assessments of the relationship between adult SES and disease risk may provide too
limited an approach to the study of disease etiology. While SES in adulthood strongly predicts
many health outcomes, consideration of proximal exposure to harmful social environments may
be insufficient for understanding risk in diseases with long latency periods such as colon cancer.
An additional limitation of SES assessment in previous research has been the focus on
measures of occupation and education, which do not reliably capture SES for women (Duncan,
Daly, McDonough, & Williams, 2002). This may be especially problematic in studies conducted
among participants born in the early 20th century, when women were subject to different social
expectations for work and education than men. Even in recent generations, the social and
psychological implications of occupation and education may be different for men and women,
with women experiencing less advantage in income and status from equivalent educational and
occupational achievement (Macintyre & Hunt, 1997).
Recent epidemiological research has increasingly suggested the importance of
considering early life determinants and possible childhood origins of disease. Childhood SES has
been shown to predict mortality and other health outcomes in adulthood, frequently exhibiting
the same positive monotonic relationship observed between adult SES and health (Cohen,
Janicki-Deverts, Chen, & Matthews, 2010; Galobardes, Lynch, & Smith, 2004; Galobardes,
Lynch, & Smith, 2008; Stringhini et al., 2010). Environmental, behavioral, and physiological
pathways through which childhood SES may affect adult health have been identified (Cohen et
al., 2010). Childhood SES has the advantage of encapsulating a longer history of exposure to
adverse socioeconomic conditions, and may be less subject to gender-based differences in

49
meaning. Childhood SES also captures participants’ broader social environment, which may be a
better predictor of women’s health than individual measures of SES (Krieger, 1991).
While research on the health effects of childhood SES has primarily focused on mortality
and cardiovascular disease outcomes (Cohen et al., 2010), there are plausible mechanisms by
which childhood SES may also affect colon cancer risk. Health-related behaviors are likely to be
an important pathway. For example, lower childhood SES is associated with reduced physical
activity and less healthy diet in childhood, which establishes trajectories for these health
behaviors that extend through adulthood (Cohen et al., 2010). Health behavior-related factors in
adulthood such as diet, physical activity, and BMI strongly pattern the incidence of colon cancer
(Giovannucci et al., 1995; Willett, Stampfer, Colditz, Rosner, & Speizer, 1990), and we expect
that by shaping these behaviors, childhood SES may influence colon cancer risk later in life.
Thus, by examining the relationship between childhood SES and health behaviors in adulthood,
as well as the association between childhood SES and colon cancer risk, we can contribute to a
broader understanding of predictors of disease incidence and suggest possible targets for early
intervention.
The current study utilized a large prospective cohort of women to investigate the
association between childhood SES and cancer-relevant health behaviors in adulthood, as well as
the association between childhood SES and colon cancer. We hypothesized that participants with
lower childhood SES would exhibit worse patterns of health behaviors by adopting an unhealthy
lifestyle sooner than participants with higher childhood SES. We additionally hypothesized that
participants with low SES would demonstrate a higher risk for incident colon cancer than
participants with high childhood SES. Because unhealthy behaviors tend to cluster rather than
occurring individually (Noble, Paul, Turon, & Oldmeadow, 2015), we considered health

50
behavior-related factors individually at baseline and combined in a healthy lifestyle score that
was measured repeatedly over the 20-year study period. Based on prior work, effect modification
by BMI and smoking status was also assessed in analyses evaluating SES in relation to colon
cancer risk.
Methods:
Study Population:
Data are from the Nurses’ Health Study (NHS) cohort, which began in 1976 with 121,700
30 to 55 year-old female registered nurses. Since 1976, NHS participants have returned biennial
questionnaires collecting data on health, nutrition, and lifestyle, as well as a variety of social and
psychological factors. Seventy percent of invited participants responded to the initial
questionnaire, and follow-up throughout the study has exceeded 90% (Colditz, 1994). Additional
details about the sample, protocol, and follow-up have been described elsewhere (Colditz, 1994).
The sample for our analysis of healthy lifestyle included women enrolled in the cohort as of 1990
who had data available for at least four of the five health behaviors at any assessment point over
the 20-year follow up period, and who completed the measure of childhood SES (n=90,032). The
sample for our analysis of colon cancer risk included women who had not been previously
diagnosed with cancer at study baseline in 1976 and who completed the measure of childhood
SES (n=100,932). The institutional review board at Brigham and Women’s Hospital reviewed
and approved this study, and participants provided informed consent by returning questionnaires.
Measures:
Exposure. Childhood SES was operationalized according to parental occupation when the
participant was 16, as reported on the 1976 questionnaire. Following Census Bureau
classification standards, maternal and paternal occupations were assigned to the following

51
categories: professional/technical, managers/officials/proprietors, clerical and kindred workers,
skilled blue collar, domestic and service workers, farmers/farm workers, and laborers. These
classifications have been shown to be a good proxy for income and prestige, which importantly
shape childhood environment (Gliksman et al., 1995; Liberatos, Link, & Kelsey, 1987).
Following previous work with this measure in the NHS (Gliksman et al., 1995), these categories
were consolidated to three broader classifications: white collar (professional/technical,
managers/officials/proprietors, clerical and kindred workers), blue collar (skilled blue collar,
domestic and service workers, laborers), and farmer. We additionally determined whether either
parent was deceased when the participant was sixteen by comparing mother’s and father’s years
of death with the participant’s year of birth (Gliksman et al., 1995; Liberatos et al., 1987).
For participants that had a deceased parent at age 16, the surviving parent’s occupational
classification (i.e. white collar, blue collar, or farmer) was used as the indicator of parental SES.
Participants that reported both parents as deceased (n=557) were excluded from the analyses. For
participants with both parents living at age 16, the higher prestige parental occupation was used,
with the following the hierarchy from highest to lowest: white collar, blue collar, and farmer
(Gliksman et al., 1995). Thus, parental SES was modeled as a three-level categorical variable
with the following categories: white collar (reference), blue collar, and farmer.
Outcomes.
Healthy lifestyle. Following prior work, a healthy lifestyle was defined by meeting
recommended levels on at least four of five health behavior or behavior-related factors, including
weekly physical activity levels, body mass index (BMI), smoking, daily alcohol consumption,
and diet quality (Trudel-Fitzgerald et al., 2017). In NHS, prior work has found approximately
37% of colon cancer cases are attributable to unhealthy lifestyle using a similar score (Erdrich,

52
Zhang, Giovannucci, & Willett, 2015). Each component of the healthy lifestyle score was
assessed at 4-year intervals over the 20-year follow-up period between 1990 and 2010. Weekly
physical activity was determined according to the number of minutes per week spent in moderate
to vigorous activity (e.g., brisk walking, bicycling). Participants were considered to have healthy
physical activity if they met the recommendations for engaging in physical activity 150 or more
minutes per week. BMI was calculated using participants’ self-reported height (1976
questionnaire) and weight. Self-reported weight has been shown to be highly correlated (r =
0.97) with weight measured by study staff among a sample of women from the NHS cohort
(Rimm et al., 1990). Healthy BMI was defined as 25kg/m2 or less. Smoking was assessed
according to self-reported status. Participants were classified as healthy if they reported never
having smoked or being former smokers.
Daily alcohol consumption was assessed via self-report, which has demonstrated strong
validity when compared to a gold standard dietary record measure (Giovannucci et al., 1991).
Participants were considered to have healthy alcohol consumption if they averaged no more than
one 14-gram alcoholic drink per day (US Department of Health and Human Services & US
Department of Agriculture, 2010). Diet was assessed via a 131-item food frequency
questionnaire, a detailed description of which has been previously published (Hu et al., 1997).
The Alternative Healthy Eating Index (AHEI) (McCullough et al., 2002) was used to assign a
score ranging from 0-110, based on high intake of fruit, vegetables, nuts, soy, and cereal fiber,
and low consumption of red meat, saturated fat, and trans fats. Participants were considered to
have a healthy diet if they scored in the top 40% of AHEI scores.
These behavior-related variables were combined to create a healthy lifestyle score, which
has been used extensively in the NHS (Trudel-Fitzgerald et al., 2017). While some individual

53
behavior-related variables were measured earlier in the follow-up, the 1988 and 1990
questionnaires were the first time that all components of the healthy lifestyle composite were
available, yielding the potential for six measurements of healthy lifestyle over the follow-up
period. To derive a healthy lifestyle score, participants were assigned one point for each of the
five health behavior-related domains (i.e., physical activity, BMI, smoking, alcohol
consumption, and diet) on which they met recommendations for healthy behavior. These points
were summed to create score ranging from 0 (least healthy) to 5 (healthiest). For time points at
which one of the component scores was missing, the score was computed by dividing the
available score by the fraction of components available and rounding to the nearest whole
number. The score was set to missing if two or more of the five components were missing. At
each of the six time points, the lifestyle score was dichotomized at the cut-point of four, with
participants considered to have a healthy lifestyle if they met recommendations in four or more
of the health behavior-related domains (Trudel-Fitzgerald et al., 2017).
Colon cancer. Colon cancer cases have been ascertained from participant questionnaires,
with death certificates also used to identify incident cases. For any report of incident disease,
participants were contacted for permission to review medical and pathology records. These
documents were reviewed by study physicians who were blinded to exposure status. Colon
cancer cases were defined per the International Classification of Diseases, Ninth Revision (ICD-
9). To mitigate the risk of observing a spurious association due to latent disease at baseline, we
only considered colon cancer cases occurring more than two years after the baseline assessment
in 1976. Cases of colon cancer were ascertained through the end of the follow-up period in 2012.
Other covariates.

54
Age was included in all analyses as a potential confounder, and parental history of colon
cancer was included as a potential confounder in analyses modeling colon cancer risk. Age was
calculated based on the date of birth reported on the 1976 questionnaire and modeled as a
continuous variable. Parental history of colon cancer was assessed on the 1996 questionnaire.
Because parental colon cancer during participants’ childhoods (rather than parental colon cancer
during participants’ adulthoods) is most likely to serve as a confounder, we only considered
colon cancer diagnosed when the parent was aged 50 or younger. Parental history was modeled
as a dichotomous variable (yes/no) indicating whether the participant had a parent diagnosed
with colon cancer before age 50.
Statistical Analysis:
Statistical analyses were conducted using SAS, v9.4 (SAS Institute, Cary NC). We
compared participants who were versus were not included in analyses of either healthy lifestyle
or colon cancer risk. We then examined the association between parental occupation categories
and each of the covariates, adjusting for age. To evaluate the association between childhood SES
and individual health behaviors in adulthood, we used separate logistic regression models to
assess the association between parental occupation categories and likelihood of engaging in each
unhealthy behavior in 1988 or 1990. Cox proportional hazards models assessed the association
between parental occupation and time until adoption of an unhealthy lifestyle between 1990 and
2010, with unhealthy lifestyle defined as dropping below a score of four out of five healthy
behaviors.
Cox proportional hazards models were also used to estimate the association between
parental occupation and time until diagnosis of colon cancer over the follow-up period. Person-
years were counted from study baseline in 1976, with participants contributing person-time until

55
death, diagnosis of colon cancer, or the termination of the follow-up period, whichever came
first. A minimally adjusted model assessed time until colon cancer diagnosis as a function of
parental occupation, adjusting for age. A second model added parental history of colon cancer as
a potential confounder. Analyses were subsequently stratified to assess potential effect
modification by BMI (≥ 25 vs. <25 kg/m2) and smoking status (ever smoker vs. never smoker)
assessed at baseline in 1976. When results differed by strata, we evaluated an interaction term
between parental occupation and a dichotomous version of the effect modifier variable. Analyses
evaluating whether health behaviors might mediate effects of SES on colon cancer risk were
planned. However, as reported below, because the association between childhood SES and colon
cancer was not statistically significant, we did not further explore mediation by healthy lifestyle.
Results:
Descriptive: Descriptive statistics are shown in Table 3.1. Over a 36-year follow-up
period, 100,932 women contributed 2,948,998 years of person time and 2,090 cases of colon
cancer were diagnosed. Among these women, 8% had parents who were farmers, 23% had blue
collar parents, and 69% had white collar parents. Participants whose parents were white collar
tended to be younger and more educated than participants whose parents were in other
occupation categories. In 1988, children of white collar parents were less likely to have BMI
>25kg/m2 and to be inactive, although they were more likely to be current smokers.

56
Table 3.1 Age-adjusted covariates by parent occupation Values are either mean (SD) or percentages. N=100,932
Parent Occupation
Farmer (n=8,077)
Blue collar (n=23,441)
White collar (n=69,415)
Age in 1976* 44.75(6.81) 42.47(7.05) 41.66(7.19)
Colon cancer, % 2 3 2
Family hx, % 6 7 7
Education
- RN, % 75 76 68
- BA, % 18 16 22
- Master’s, % 6 7 9
- Doctorate, % 0 1 1
BMI ≤25kg/m2 in 1988, % 55 50 56
Former/never smoker in 1988, % 87 80 79
Physically active in 1988, % 32 30 33
≤15g/day alcohol in 1990, % 92 91 87
Healthy diet in 1990, % 41 39 41
Values are means(SD) or percentages and are standardized to the age distribution of the study population. Values of polytomous variables may not sum to 100% due to rounding * Value is not age adjusted

57
Analysis of health behaviors: When considering health behavior-related factors assessed
in 1988 and 1990, 7% of the sample did not meet recommendations for any health behaviors or
met recommendations for one health behavior, 58% met recommendations for two or three
health behaviors, and 34% met recommendations for four or five health behaviors. In logistic
regression analyses controlling for age and modeling the odds of failing to meet
recommendations for each of the health behavior-related factors, participants with blue collar
parents were more likely to have unhealthy levels of physical activity (OR=1.15; 95% CI: 1.11,
1.20), to be overweight (OR=1.24; 95% CI: 1.20, 1.29), and to have poor diet quality (OR=1.10;
95% CI: 1.06, 1.14), and were less likely to consume excess alcohol (OR=0.69; 95% CI: 0.65,
0.73) than participants with white collar parents. There was no association with smoking status.
Participants with parents who were farmers were less likely to consume excess alcohol
(OR=0.59; 95% CI: 0.54, 0.65) and were less likely to be current smokers (OR=0.61; 95% CI:
0.57, 0.65) than participants with white collar parents. Physical activity, BMI, and diet were not
associated with having parents who were farmers versus white collar workers.
In a Cox proportional hazards model assessing the relationship between parent
occupation and time until adopting an unhealthy lifestyle between 1990 and 2010, relative to
women whose parents were white collar workers, women whose parents were farmers were 6%
less likely to adopt an unhealthy lifestyle (95% CI: 0.91, 0.98), while women whose parents were
blue collar were 6% more likely to adopt an unhealthy lifestyle (95% CI: 1.04, 1.09) over the
study period when controlling for age (Table 3.2).

58
Table 3.2 Hazard ratios for adopting an unhealthy lifestyle over 20 years of follow-up by parent occupation among 90,032 women from the Nurses' Health Study
Model 1 (Age
adjusted) Model 2 (Fully
adjusted)* HR 95% CI HR 95% CI
Parent occupation White collar Reference Farmer 0.94 0.91 0.98 0.94 0.91 0.98 Blue collar 1.06 1.0 1.09 1.06 1.04 1.09 Bold text indicates p<0.05 * Model is adjusted for age and parents' history of colon cancer (yes, no (reference))

59
CSES and colon cancer risk: In Cox models, compared with women whose parents were
white collar workers, participants whose parents were farmers had a lower risk of incident colon
cancer in both age adjusted and fully adjusted models (HR for fully adjusted model= 0.83; 95%
CI: 0.70, 0.98) (Table 3.3). There was a small increase in risk of cancer associated with having
parents who were blue collar (HR for fully adjusted model= 1.07; 95% CI: 0.97, 1.18), but the
association did not reach statistical significance. There was no evidence of effect modification by
either BMI or smoking status, as effects were similar across strata in stratified analyses.

60
Table 3.3 Hazard ratios for incident colon cancer by parent occupation among 100,932 women from the Nurses' Health Study
Model 1 (Age
adjusted) Model 2 (Fully
adjusted)* HR 95% CI HR 95% CI
Parent occupation White collar Reference Farmer 0.83 0.70 0.97 0.83 0.70 0.98 Blue collar 1.07 0.97 1.18 1.07 0.97 1.18 Bold text indicates p<0.05 * Model is adjusted for age and parents' history of colon cancer (yes, no (reference))

61
Discussion:
To the best of our knowledge, this is the first study to evaluate the association between
childhood SES and a healthy lifestyle score in adulthood, as well as the first study to explicitly
address the association between childhood SES and incident colon cancer. We hypothesized that
more prestigious parental occupations would be associated with a healthier profile of health
behavior-related factors in adulthood by establishing a pattern of healthy behavior that persists
across the life course. We also hypothesized that higher childhood SES would be associated with
reduced risk of colon cancer in adulthood through health behaviors and other unmeasured
pathways.
In analyses considering the association between childhood SES and individual health
behaviors in adulthood, children of white collar parents had better diet, better physical activity
levels, and were less likely to be overweight than children of blue collar parents, although they
were more likely to consume excess alcohol. In Cox models assessing the time until adoption of
an unhealthy lifestyle, women whose parents had white collar occupations were at lower risk of
adopting an unhealthy lifestyle over the follow-up period than those whose parents had blue
collar occupations. This effect of low childhood SES on worse health behaviors in adulthood is
in line with previous research that has identified how adversity and social stress experienced in
early life can manifest in unhealthy lifestyle across the life course (Miller, Chen, & Parker, 2011;
Repetti, Taylor, & Seeman, 2002). Observed in a cohort of women who have achieved high
levels of education and professional occupations, it indicates that there is a strong and persistent
effect of low socioeconomic status that may not be fully overcome or reversed by improved
social environment in adulthood. This “behavioral residue” of poor social conditions in
childhood is analogous to the “biological residue” identified by Miller et al. (Miller et al., 2009);

62
early life experiences leave a mark on both immediate biology and health behavior-related
factors that may not be modified by later intervention.
Our hypothesis that higher childhood SES would be associated with reduced risk of colon
cancer was not strongly supported by the data, as the magnitude of the association between
having blue versus white collar parents was small (albeit in the expected direction) and did not
reach statistical significance. These effect estimates were similar when the sample was stratified
by BMI or by smoking status. Somewhat unexpectedly, our findings suggested that having
parents who were farmers versus white collar was significantly associated with reduced risk of
developing colon cancer even after adjusting for all potential confounders. To our knowledge,
this is the first study to find that the children of farmers versus white collar parents have a lower
risk of colon cancer, although some research has identified a higher risk of cancers associated
with pesticide exposure. This lower observed risk of colon cancer may be partially explained by
the health behavior profiles of children of farmers, who were much less likely to consume excess
alcohol and to have ever smoked than children of white collar workers. It is likely that some
aspect of childhood spent in a farm environment in the early 20th century established lifelong
patterns for these behaviors which reduced colon cancer risk in adulthood. Given that dairy
consumption has been shown to be protective against colon cancer (Aune et al., 2012), it is also
possible that some of the reduced risk observed among the children of farmers is due to greater
consumption of milk products. However, data on childhood diet were not available in the present
study to further test this hypothesis.
The finding that colon cancer risk was only suggestively higher among children of blue
versus white collar parents may reflect a true absence of association, or may be a product of
limitations of the current study. In favor of the finding reflecting a true null association, the

63
survival analysis for cancer incidence included a large number of participants and more than
three decades of follow-up, which allowed the evaluation of more than 2,000 cases of colon
cancer. With such a large sample, the current study should have had sufficient power to detect
even a small effect of childhood SES. Additionally, by validating participants’ self-reports of
cancer via medical records, we were able to ensure accuracy and completeness in our
enumeration of cases.
However, the sample within which we assessed the association may not capture the
relationship between childhood SES and colon cancer risk within the general population.
Participants enter the NHS cohort by virtue of their singular professional occupation. Thus,
women who join the cohort and come from lower status backgrounds may share characteristics
that facilitate the achievement of a nursing career, and may not be representative of the broader
social group. This could distort the associations observed in this study, and may partially account
for the weak finding regarding whether lower SES childhood may confer increased colon cancer
risk in adulthood. In addition, women who choose nursing as a profession likely have a special
interest in health and well-being, which may shape their health behaviors and other colon cancer
risk factors and thus obviate a more substantial effect of childhood SES.
An additional limitation that may have contributed to the weak finding is the study’s
limited assessment of childhood SES. While parental occupation has predicted diverse health
outcomes across numerous studies (Cohen et al., 2010; Galobardes et al., 2004), and was
associated with adult health behaviors in the current study, it likely fails to capture the full
picture of a child’s social environment. For example, parent’s occupation does not necessarily
capture whether a participant experienced social or material deprivation during their childhood.
Accordingly, it may not allow us to fully identify a true relationship between childhood social

64
conditions and cancer incidence. Additionally, while our study is prospective in that childhood
SES is assessed prior to ascertainment of study outcomes, assessment of the exposure is still
dependent on recollection of conditions from childhood, and therefore is potentially subject to
bias.
The results from our analyses indicate that, even in a sample of women who have
achieved professional status in their adult lives, there is a residual effect of low childhood SES
that manifests in health behavior profiles in adulthood. If we were able to assess associations in a
sample that was not selected based on a shared profession, these effects of childhood SES on
health behaviors would likely be more pronounced and perhaps so too would there be a more
pronounced risk of incident colon cancer. This finding contributes to a body of research
emphasizing the importance of early childhood environments for adult health risks, and supports
the theory that there are lasting effects of childhood environment that cannot be overcome by
improved circumstances in later life. To mitigate these effects, it is essential to develop
interventions and policies to reduce childhood poverty and enrich deprived childhood
environments.

65
References
Adler, N. E., Boyce, T., Chesney, M. A., Cohen, S., Folkman, S., Kahn, R. L., & Syme, S. L. (1994). Socioeconomic status and health: the challenge of the gradient. American Psychologist, 49(1), 15.
Adler, N. E., & Ostrove, J. M. (1999). Socioeconomic status and health: what we know and what
we don't. Annals of the New York academy of Sciences, 896(1), 3-15. American Cancer Society. (2015). Cancer Facts and Figures, 2015. Retrieved from Atlanta: Aune, D., Lau, R., Chan, D., Vieira, R., Greenwood, D., Kampman, E., & Norat, T. (2012).
Dairy products and colorectal cancer risk: a systematic review and meta-analysis of cohort studies. Annals of oncology, 23(1), 37-45.
Berkman, L. F. (2009). Social epidemiology: social determinants of health in the United States:
are we losing ground? Annual review of public health, 30, 27-41. Cohen, S., Janicki-Deverts, D., Chen, E., & Matthews, K. A. (2010). Childhood socioeconomic
status and adult health. Annals of the New York academy of Sciences, 1186(1), 37-55. Colditz, G. A. (1994). The nurses' health study: a cohort of US women followed since 1976.
Journal of the American Medical Women's Association, 50(2), 40-44. Duncan, G. J., Daly, M. C., McDonough, P., & Williams, D. R. (2002). Optimal indicators of
socioeconomic status for health research. American journal of public health, 92(7), 1151-1157.
Erdrich, J., Zhang, X., Giovannucci, E., & Willett, W. (2015). Proportion of colon cancer
attributable to lifestyle in a cohort of US women. Cancer causes & control, 26(9), 1271-1279.
Feinstein, J. S. (1993). The relationship between socioeconomic status and health: a review of
the literature. The Milbank Quarterly, 279-322. Ferraroni, M., Negri, E., La Vecchia, C., D'Avanzo, B., & Franceschi, S. (1989). Socioeconomic
indicators, tobacco and alcohol in the aetiology of digestive tract neoplasms. International Journal of Epidemiology, 18(3), 556-562.
Galobardes, B., Lynch, J. W., & Smith, G. D. (2004). Childhood socioeconomic circumstances
and cause-specific mortality in adulthood: systematic review and interpretation. Epidemiologic reviews, 26(1), 7-21.

66
Galobardes, B., Lynch, J. W., & Smith, G. D. (2008). Is the association between childhood socioeconomic circumstances and cause-specific mortality established? Update of a systematic review. Journal of epidemiology and community health, 62(5), 387-390.
Giovannucci, E., Ascherio, A., Rimm, E. B., Colditz, G. A., Stampfer, M. J., & Willett, W. C.
(1995). Physical activity, obesity, and risk for colon cancer and adenoma in men. Annals of Internal Medicine, 122(5), 327-334.
Giovannucci, E., Colditz, G., Stampfer, M. J., Rimm, E. B., Litin, L., Sampson, L., & Willett, W.
C. (1991). The assessment of alcohol consumption by a simple self-administered questionnaire. American journal of Epidemiology, 133(8), 810-817.
Gliksman, M. D., Kawachi, I., Hunter, D., Colditz, G. A., Manson, J., Stampfer, M. J., . . .
Hennekens, C. H. (1995). Childhood socioeconomic status and risk of cardiovascular disease in middle aged US women: a prospective study. Journal of epidemiology and community health, 49(1), 10-15.
Hu, F. B., Stampfer, M. J., Manson, J. E., Rimm, E., Colditz, G. A., Rosner, B. A., . . . Willett,
W. C. (1997). Dietary fat intake and the risk of coronary heart disease in women. New England Journal of Medicine, 337(21), 1491-1499.
Kawachi, I., & Kroenke, C. (2006). Socioeconomic disparities in cancer incidence and mortality.
Cancer epidemiology and prevention, 3, 174-188. Kim, D., Masyn, K. E., Kawachi, I., Laden, F., & Colditz, G. A. (2010). Neighborhood
socioeconomic status and behavioral pathways to risks of colon and rectal cancer in women. Cancer, 116(17), 4187-4196.
Krieger, N. (1991). Women and social class: a methodological study comparing individual,
household, and census measures as predictors of black/white differences in reproductive history. Journal of epidemiology and community health, 45(1), 35-42.
Krieger, N. (2005). Defining and investigating social disparities in cancer: critical issues. Cancer
causes & control, 16(1), 5-14. Liberatos, P., Link, B. G., & Kelsey, J. L. (1987). The measurement of social class in
epidemiology. Epidemiologic reviews, 10, 87-121. Macintyre, S., & Hunt, K. (1997). Socio-economic position, gender and health how do they
interact? Journal of Health Psychology, 2(3), 315-334. Marmot, M. G., Stansfeld, S., Patel, C., North, F., Head, J., White, I., . . . Smith, G. D. (1991).
Health inequalities among British civil servants: the Whitehall II study. The Lancet, 337(8754), 1387-1393.
67
McCullough, M. L., Feskanich, D., Stampfer, M. J., Giovannucci, E. L., Rimm, E. B., Hu, F. B., . . . Willett, W. C. (2002). Diet quality and major chronic disease risk in men and women: moving toward improved dietary guidance. The American journal of clinical nutrition, 76(6), 1261-1271.
Miller, G. E., Chen, E., Fok, A. K., Walker, H., Lim, A., Nicholls, E. F., . . . Kobor, M. S.
(2009). Low early-life social class leaves a biological residue manifested by decreased glucocorticoid and increased proinflammatory signaling. Proceedings of the National Academy of Sciences, 106(34), 14716-14721.
Miller, G. E., Chen, E., & Parker, K. J. (2011). Psychological stress in childhood and
susceptibility to the chronic diseases of aging: moving toward a model of behavioral and biological mechanisms. Psychological bulletin, 137(6), 959.
Noble, N., Paul, C., Turon, H., & Oldmeadow, C. (2015). Which modifiable health risk
behaviours are related? A systematic review of the clustering of Smoking, Nutrition, Alcohol and Physical activity (‘SNAP’) health risk factors. Preventive medicine, 81, 16-41.
Papadimitriou, C., Day, N., Tzonou, A., Gerovassilis, F., Manousos, O., & Trichopoulos, D.
(1984). Biosocial correlates of colorectal cancer in Greece. International Journal of Epidemiology, 13(2), 155-159.
Repetti, R. L., Taylor, S. E., & Seeman, T. E. (2002). Risky families: family social environments
and the mental and physical health of offspring. Psychological bulletin, 128(2), 330. Rimm, E. B., Stampfer, M. J., Colditz, G. A., Chute, C. G., Litin, L. B., & Willett, W. C. (1990).
Validity of self-reported waist and hip circumferences in men and women. Epidemiology, 1(6), 466-473.
Smith, G. D., Carroll, D., Rankin, S., & Rowan, D. (1992). Socioeconomic differentials in
mortality: evidence from Glasgow graveyards. BMJ, 305(6868), 1554-1557. Stringhini, S., Dugravot, A., Kivimaki, M., Shipley, M., Zins, M., Goldberg, M., . . . Singh-
Manoux, A. (2010). Do different measures of early life socioeconomic circumstances predict adult mortality? Evidence from the British Whitehall II and French GAZEL studies. Journal of epidemiology and community health, jech. 2009.102376.
Tavani, A., Fioretti, F., Franceschi, S., Gallus, S., Negri, E., Montella, M., . . . La Vecchia, C.
(1999). Education, socioeconomic status and risk of cancer of the colon and rectum. International Journal of Epidemiology, 28(3), 380-385.
Trudel-Fitzgerald, C., Tworoger, S., Poole, E., Zhang, X., Giovannucci, E., Meyerhardt, J., &
Kubzansky, L. (2017). Psychological Symptoms and Subsequent Healthy Lifestyle After a Colorectal Cancer Diagnosis. Health psychology: official journal of the Division of Health Psychology, American Psychological Association.

68
US Department of Health and Human Services, & US Department of Agriculture. (2010).
Dietary guidelines for Americans, 2010. Washington, DC: US Government Printing Office.
Van Loon, A., Van den Brandt, P., & Golbohm, R. (1995). Socioeconomic status and colon
cancer incidence: a prospective cohort study. British journal of cancer, 71(4), 882. Ward, E., Jemal, A., Cokkinides, V., Singh, G. K., Cardinez, C., Ghafoor, A., & Thun, M.
(2004). Cancer disparities by race/ethnicity and socioeconomic status. CA: a cancer journal for clinicians, 54(2), 78-93.
Willett, W. C., Stampfer, M. J., Colditz, G. A., Rosner, B. A., & Speizer, F. E. (1990). Relation
of meat, fat, and fiber intake to the risk of colon cancer in a prospective study among women. New England Journal of Medicine, 323(24), 1664-1672.

69
STUDY 3. Social Integration and Lifespan in the Nurses’ Health Study
Emily S. Zevon1, Ichiro Kawachi1, Reginald D. Tucker-Seeley2, and Laura D. Kubzansky1
1 Department of Social and Behavioral Sciences, Harvard T.H. Chan School of Public Health,
677 Huntington Avenue, Boston, MA 02115
2 University of Southern California Leonard Davis School of Gerontology, 3715 McClintock
Avenue, Los Angeles, CA 90089

70
Abstract
Background: Prior studies have documented a consistent association between stronger social
relationships and reduced risk of mortality. However, fewer of these studies have focused on
social integration, which considers both quantity and quality of social contacts. Additionally,
prior work has focused on adverse health outcomes, but has less often considered the association
between social relationships and the extension of lifespan or achievement of exceptional
longevity. In this study, we tested whether greater levels of social integration were associated
with longer lifespan and a greater likelihood of achieving exceptional longevity.
Methods: Data are from the Nurses’ Health Study (NHS), an ongoing cohort of women followed
since 1976 with biennial mailed questionnaires. Social integration was assessed using the
Berkman-Syme Social Network Index, administered in 1992. Deaths were ascertained from
participants’ families, postal authorities, and death registries. Primary analyses (n=73,276) used
accelerated failure time models to assess changes in lifespan associated with each category of
social integration, in models progressively controlling for demographic confounders, health
status variables, and health behavior-related factors measured at baseline. Secondary analyses
used logistic regression to evaluate the likelihood of surviving to the age of 85 among the subset
of women who had the possibility of reaching that age during cohort follow-up (n=17,309).
Results: Across models, higher levels of social integration were associated with increased
longevity in a graded relationship (p-value for trend <0.01). For example, in models adjusted for
demographic variables and health status, women with the highest versus lowest levels of social
integration had 18.0% (95% CI: 15.8, 20.3) longer lifespan. Among women who could have
reached the age of 85 during follow-up, participants with the highest versus lowest levels of
social integration had 1.7 times the odds of surviving to the age of 85. In both failure time and

71
logistic regression analyses, findings were maintained after adjusting for all relevant covariates,
including depression.
Conclusion: Higher levels of social integration are associated with greater lifespan and
likelihood of achieving exceptional longevity among women in the NHS.

72
Introduction:
As lifespan has increased in industrialized countries, exceptional longevity beyond 85
years has become increasingly common. Research across diverse organisms has consistently
demonstrated that increases in lifespan are often accompanied by delayed morbidity (Longo et
al., 2015), indicating that studying factors associated with increased longevity may yield new
insights regarding how to promote long and healthy lives. Research on exceptional longevity has
largely focused on identifying biomedical factors (e.g., genetic variants) that are associated with
increased survival, but an emerging body of research has suggested non-genetic factors matter as
well. Accordingly, research has begun to identify psychosocial assets, such as optimism and
other facets of positive psychological well-being, as potential predictors of longer life (Boehm &
Kubzansky, 2012; Kim et al., 2017).
Social relationships have also been identified as a key predictor of human health
(Berkman & Krishna, 2014; Cohen & Wills, 1985; House, Umberson, & Landis, 1988).
Research has demonstrated beneficial effects of social support and networks on a wide range of
health outcomes (Berkman, Leo-Summers, & Horwitz, 1992; Kawachi et al., 1996), with
cognitive, emotional, behavioral, and direct biological pathways proposed to explain observed
associations (Cohen, 1988). The relationship between social relationships and premature
mortality has been assessed extensively, with many studies demonstrating an association
between social isolation and increased risk of death (Barger, 2013; Berkman & Krishna, 2014;
Seeman, 1996). Fewer studies have utilized a positive framework to consider social relationships
as a health asset and examined the association between social integration and the likelihood of
achieving or maintaining health or healthy aging.

73
Research suggests that psychosocial assets, such as social integration, are associated with
health outcomes above and beyond the effects of poor psychosocial functioning (Kubzansky,
Boehm, & Segerstrom, 2015). As such, the consideration of risk factors that are associated with
disease and mortality is not necessarily equivalent to the examination of positive factors that are
associated with the attainment and maintenance of good health. For example, in a nationally
representative sample of adults, individuals with the greatest emotional vitality had a 23-30%
lower risk of developing disease than individuals with the lowest emotional vitality (Kubzansky
& Thurston, 2007). This associated persisted after controlling for psychological distress,
indicating that psychological assets are predictive of health beyond the effect of negative affect.
Identifying diverse assets that promote health across the life course, particularly health in aging,
will both help to achieve optimal functioning and reduce exposure to health risks, informing a
“primordial prevention” approach (Strasser, 1978). Although healthy aging is a multidimensional
construct that is often defined to incorporate physical, cognitive, and emotional well-being, the
achievement of long lifespan is its most basic prerequisite (Woods et al., 2016). By
understanding assets that promote longevity we can take a step outside the paradigm of disease
and mortality, and create new insights regarding the means through which long and healthy lives
can be achieved.
In the present study, we assessed social integration, which refers to the number, type, and
frequency of social contacts, and evaluated its association with increased longevity. We focus on
social integration, rather than social support or social network characteristics, because it has been
associated with health outcomes more consistently than other social relationship constructs
(Cohen & Janicki-Deverts, 2009; Holt-Lunstad, Smith, & Layton, 2010). To assess the
association between social integration and duration of lifespan, we used data from a large

74
ongoing cohort of women to evaluate if higher levels of social integration are associated with
longer lifespan, as well as with greater likelihood of attaining exceptional longevity. These
analyses controlled for initial health status, as well as a range of other potential confounders,
identified based on prior research in this domain.
To explicitly evaluate one potential underlying pathway, we included a set of models
assessing health behavior-related factors, and additionally considered individual domains of
social integration (e.g., religious participation and number of close friends) to ascertain whether
some components were differentially salient for longevity. We also considered the role of
depression, because prior research has suggested that greater social integration is associated with
less depression, although the direction of causality is unclear (Berkman, Glass, Brissette, &
Seeman, 2000). While it is possible that depression affects both social integration and lifespan,
thus confounding our association of interest, we think it is more likely that depression is a
consequence of social integration and thus a mediator. However, as we do not have the
appropriate data to fully test the directionality of these effects, we considered depression as a
potential confounder in a sensitivity analysis.
Methods:
Study Population:
Data are from the ongoing Nurses’ Health Study (NHS) cohort, which began in 1976
with 121,700 30 to 55 year-old female registered nurses. Since 1976, NHS participants have
returned biennial questionnaires collecting data on health, nutrition, and lifestyle, as well as a
variety of social and psychological factors. Seventy percent of invited participants responded to
the initial questionnaire, and follow-up throughout the study has exceeded 90% (Colditz, 1994).
Additional details about the sample, protocol, and follow-up have been described elsewhere

75
(Colditz, 1994). The sample for our primary analysis included women enrolled in the first NHS
cohort who completed the 1992 measure of social integration and have been followed through
2012. Participants were excluded from analyses if they were missing data on social integration or
demographic covariates, reducing the sample size from 103,601 to 73,276 women. For secondary
analyses assessing the likelihood of survival to the age of 85, the sample was further restricted to
participants born before 1928, for whom it was possible to reach the age of 85 during the study
period (n=17,309).
Measures:
Social integration. Social integration, a construct that captures the number, type, and
frequency of social contacts, was assessed with the Berkman-Syme Social Network Index (SNI)
(Berkman & Krishna, 2014; Berkman & Syme, 1979), administered via questionnaire in 1992.
The SNI assesses quantity and type of social relationships across four domains: marriage,
contacts with close friends and relatives, religious membership, and informal and formal group
associations (Berkman & Syme, 1979). The measure has shown good test-retest reliability and
acceptable construct validity, and has predicted breast cancer survival and mental functioning in
samples of women from the NHS (Achat et al., 1998; Berkman & Krishna, 2014; Kroenke,
Kubzansky, Schernhammer, Holmes, & Kawachi, 2006). Following prior work with this measure
in the NHS (Chang et al., 2017), each of the four domains of social integration was scored from
0 (least integrated) to 3 (most integrated) (Table 4.1). These domain scores were summed to
create a continuous SNI score ranging from 0 (least integrated) to 12 (most integrated). The
continuous SNI score was considered missing if scores for any of the four domains were
unavailable. This score was then divided into quartiles to allow for examination of discontinuous
or threshold effects. Thus, participants were classified according to four levels of social

76
integration: least integrated (reference), moderately integrated, well integrated, and most
integrated (Kawachi et al., 1996; Kroenke et al., 2006). Because effects are hypothesized to be
cumulative and stable, the social integration score was not updated in longitudinal analyses, but
the construct was relatively stable (r=.71 between assessments separated by eight years).

77
Table 4.1 Scoring criteria for social integration measure
N/A: not available
Item Score of 3 if: Score of 2 if: Score of 1 if: Score of 0 if:
Marital status Married, living with a partner
N/A N/A Widowed, separated, divorced, or single
Religious service attendance ≥ once/week 1-3 times/month <once/month Never
Number of close friends 6+ 3-5 1-2 None
Group participation 6+ Hours/week 3-5 Hours/week 1-2 Hours/week None

78
Lifespan. Lifespan was operationalized as changes in predicted lifespan. We also
considered exceptional longevity, which was defined as survival to the age of 85. Deaths are
reported by participants’ families and by postal authorities. The names of non-respondents are
searched within the National Death Index, which has compiled data from state death registries
since 1979 (Kreger, 1979). A test of the sensitivity of death ascertainment from the National
Death Index found that the method correctly identified 97% of known deaths among a sample of
NHS participants for whom death certificates were available (Stampfer et al., 1984). Date of
death is ascertained from death records. In the current study, deaths were identified through the
end of 2012. To address potential concerns about reverse causation (i.e., that poor health may
lead to worse rating of social integration), only deaths occurring more than two years after the
baseline assessment were considered.
Covariates. Demographic variables including age (continuous), education level
(registered nurse/associate degree, bachelor degree, or master’s/doctoral degree), and husband’s
education level (less than high school, some high school, high school graduate, college graduate,
or graduate degree) were considered as potential confounders. These variables were queried on
the 1992 questionnaire. Analyses also considered self-reported history of major chronic diseases,
including high cholesterol, high blood pressure, diabetes, cancer, stroke, and myocardial
infarction (MI). These variables were assessed at study baseline in 1992 and were included in
analyses individually as dichotomous variables (yes vs. no). Depressive symptoms were assessed
in 1992 via the five-item Mental Health Inventory (MHI-5), a subscale of the 36-Item Short
Form Survey from the RAND Medical Outcomes Study (Ware & Sherbourne, 1992). Scores on
the measure ranged from 0 (most depressed) to 100 (least depressed), and participants were

79
classified as having depressive symptoms (yes vs. no) if their score was less than 60 (Rumpf,
Meyer, Hapke, & John, 2001).
Health behavior-related variables, such as smoking history, physical activity, alcohol
consumption, diet quality, and body mass index (BMI) were considered as covariates that might
either confound or potentially lie on the pathway between social integration and longevity. Self-
reported smoking history (current vs. former/never) was collected on the 1992 questionnaire.
Physical activity was also queried on the 1992 questionnaire, and was modeled as a dichotomous
variable indicating whether the participant met recommended levels of physical activity, i.e.,
reported ≥150 minutes of moderate-to-vigorous physical activity per week. Alcohol consumption
and diet quality were assessed via a food frequency questionnaire (Hu et al., 1997) administered
in 1994. Alcohol was modeled as a dichotomous variable indicating whether participants met
recommendations for no more than one 14-gram alcoholic drink per day (US Department of
Health and Human Services & US Department of Agriculture, 2010). Diet quality was
operationalized as a continuous variable using the Alternative Health Eating Index (AHEI),
which assigns a dietary score ranging from 0 (lowest quality) to 110 (highest quality) based on
high intake of fruits, vegetables, nuts, soy, and cereal fiber, and low consumption of red meat,
saturated fat, and trans fat (McCullough et al., 2002). Body mass index (BMI) was calculated
using participants’ self-reported height (1976 questionnaire) and weight (1992 questionnaire).
Self-reported weight has been shown to be highly correlated (r = 0.97) with weight measured by
study staff among a sample of women from the NHS cohort (Rimm et al., 1990).
Statistical Analysis:
Statistical analyses were conducted using SAS, v9.4 (SAS Institute, Cary NC). We first
examined the association between categories of social integration and each covariate, adjusting

80
for age. A set of four accelerated failure time (AFT) models were used in primary analyses to
estimate the proportion by which participants’ lifespans changed in association with level of
social integration. These models provide the advantage of easily interpretable results (i.e.,
percent change in lifespan), while incorporating longitudinal data and control for multiple
covariates. A minimally-adjusted model included potential demographic confounders (age,
husband’s education, and participant’s education). A second model, the core model, further
adjusted for baseline health status variables (high cholesterol, high blood pressure, and history of
MI, stroke, diabetes, and cancer). A third model included demographic confounders and health
behavior-related factors (i.e., smoking history, physical activity, alcohol consumption, diet
quality, and BMI) to assess whether behavior accounted for any of the observed association
between SI and longevity. A fourth model adjusted for all covariates simultaneously. Sample
size for the third and fourth models was slightly reduced because of incomplete data for health
behavior variables; participants who were missing data on any health-behavior related variable
were excluded (n=2,086). We applied the transformation 100(eβ – 1) to the regression coefficient
for our primary exposure, social integration, to interpret the findings as the percent change in the
expected survival time comparing each social integration category to the reference (least
integrated). A positive coefficient suggests that categories representing greater levels of social
integration are associated with greater longevity.
We conducted two sensitivity analyses. First, we examined whether any of the four
domains of social integration (i.e. marriage, close friends, group membership, and religious
involvement) were differentially predictive of longevity. In this analysis, we evaluated separate
models, considering each domain as an independent predictor in the core AFT model described
above. A second sensitivity analysis considered the role of depression by evaluating changes in
81
the effect estimates for social integration when including depressive symptoms in the core model
controlling for demographic and health status covariates.
We also conducted analyses using logistic regression to assess the likelihood of survival
to the age of 85, using the same modeling strategy described for AFT analyses. Similar
sensitivity analyses were also conducted to explore the roles of individual domains of social
integration and to assess depressive symptoms as a potential confounder.
Results:
The age-adjusted distributions of covariates in 1992 are presented by level of social
integration for the primary analytic sample (i.e., the sample for AFT analyses) in Table 4.2.
Twenty-five percent of this sample (n=18,446) died within the study period. Participants
classified as “most integrated” (highest category of social integration) had continuous SNI scores
that ranged from 10-12, and the mean SNI score in the sample was 7.6. The mean participant age
in 1992 was 58 years. Participants classified as having high levels of social integration reported
husbands having higher levels of education, were less likely to be depressed, had better health
behavior profiles (e.g., were less likely to have smoked, and were more likely to be active), and
were less likely to have high blood pressure or diabetes. At the study baseline in 1992, 82% of
participants were married, 40% reported having six or more close friends, 54% reported
attending religious services once a week or more, and 11% reported participating in non-
religious groups for six or more hours per week.

82
Table 4.2 Age-adjusted covariates by quartiles of social integration among women in the Nurses’ Health Study in 1992. Values are either mean (SD) or percentages. N= 73,276
Quartile of Social Integration
Least Integrated (n=15,061)
21%
Moderately Integrated (n=17,881)
24%
Well Integrated (n=22,965)
31%
Most Integrated (n=17,369)
24%
Demographic factors Age in 1992* 58.2 (7.1) 58.5 (7.2) 58.7 (7.1) 59.8 (7.0)
Education - RN or BA % 90 89 91 90
- MA or doctoral, % 10 10 9 9 Husband’s education
- < High school degree, % 6 6 6 4 - High school degree, % 30 34 36 33
- > High school degree, % 34 45 48 54 - Missing, % 29 15 11 9
Health conditions
Depressive symptoms, % 22 17 14 9
High cholesterol, % 45 46 46 46 High blood pressure, % 36 35 34 32
Diabetes, % 7 6 5 5 Cardiovascular disease, % 3 3 3 2
Health behaviors Cancer, % 10 10 9 10
Ever smoker, % 66 60 53 46 Physically active, % 49 55 56 62
Low-moderate alcohol, % 88 89 91 92 BMI 26.10 (5.67) 25.96 (5.34) 25.93 (5.10) 25.89 (5.06)
Alternative healthy eating index
50.57(14.83) 51.48(14.00) 51.47(13.72) 52.35(13.45)
Values are standardized to the age distribution of the study population. * Value is not age adjusted

83
Accelerated failure time analyses demonstrated a graded association between higher
levels of social integration and longer lifespan (p-value for trend <0.01 in all models) (Table
4.3). In models adjusted for demographic variables and health status, compared to women with
the lowest levels of social integration, women who were well integrated and women who were
the most socially integrated had 11.9% (95% CI: 9.9, 13.9) and 18.0% (95% CI: 15.8, 20.3)
longer lifespan, respectively. These associations declined slightly to 8.4% (95% CI: 6.5, 10.4)
and 12.2% (95% CI: 10.0, 14.4) when health behaviors were added to the model, but remained
statistically significant. In a fully-adjusted model assessing SNI score as a continuous variable,
each one-unit increase in social integration was associated with a 1.7% (95% CI: 1.5, 2.0)
increase in lifespan.

84
Table 4.3 Percent change in lifespan associated with social integration, Nurses' Health Study, 1992-2012. N= 73,276 Social Integration Score Quartile
Least Integrated Moderately
Integrated Well Integrated Most Integrated
% 95% CI % 95% CI % 95% CI % 95% CI
Model 1: Demographics 1.00 Referent 9.21 7.14, 11.32 13.5 11.44, 15.60 19.89 17.55, 22.27
Model 2: Demographics and health conditions 1.00 Referent 8.13 6.11, 10.19 11.90 9.89, 13.94 18.01 15.75, 20.32
Model 3: Demographics and health behaviors* 1.00 Referent 6.91 4.88, 8.97 9.58 7.58, 11.63 13.38 11.15, 15.66
Model 4: All variables* 1.00 Referent 6.14 4.15, 8.17 8.42 6.46, 10.41 12.21 10.03, 14.44
Model 1: age, education, and husband's education Model 2: age, education, husband's education, high cholesterol, high blood pressure, diabetes, hx of cancer, hx of stroke, and hx of MI Model 3: age, education, husband's education, smoking hx, physical activity, alcohol, BMI, and diet index Model 4: age, education, husband's education, high cholesterol, high blood pressure, diabetes, hx of cancer, hx of stroke, hx of MI, smoking hx, physical activity, alcohol, BMI, and diet index * Sample size for these models was 71,190 because of missing data for health behaviors.

85
In AFT models assessing the domains of social integration separately, three of the four
domains were associated with increased longevity in models controlling for demographic and
health status variables (Table S4.1). Participants with the highest versus lowest level of group
participation had a lifespan 7.4% longer (95% CI: 5.2, 9.7). Participants with the highest versus
lowest level of religious attendance had a lifespan 11.3% longer (95% CI: 9.6, 13.1).
Additionally, being married as of 1992 was associated with a 10.3% increase in lifespan
compared to being unmarried (95% CI: 8.6, 12.0). Number of close friends was not associated
with changes in longevity. In a sensitivity analysis assessing depressive symptoms as a potential
confounder, findings were materially unchanged; for example, the effect estimate comparing the
most to the least socially integrated participants declined slightly to 16.5% and remained
statistically significant (95% CI: 14.3, 18.8).
Of the women who were included in analyses of exceptional longevity, 11,347 (66%)
survived to the age of 85. Similar to findings in AFT analyses, there was a graded association
between higher levels of social integration and greater likelihood of exceptional longevity (p-
value for trend <0.01 in all models) (Table 4.4). For example, in the core model, compared to
women with the lowest levels of social integration, the odds of achieving exceptional longevity
for participants who were well integrated and who were the most integrated were higher with
odds ratios (ORs) 1.5 (95% CI: 1.3, 1.6) and 1.7 (95% CI: 1.6, 1.9), respectively. These
associations declined slightly, but remained statistically significant, when health behaviors were
included in the models. In a fully-adjusted model assessing SNI score as a continuous variable,
the odds ratio for exceptional longevity associated with a one-unit increase in social integration
was 1.05 (95% CI: 1.04, 1.07).

86
Table 4.4 Odds ratios for the association of social integration with survival past age of 85, Nurses' Health Study. N=17,309
Social Integration Score Quartile
Least Integrated Moderately
Integrated Well Integrated Most Integrated
OR 95% CI OR 95% CI OR 95% CI OR 95% CI
Model 1: Demographics 1.00 Referent 1.28 1.17, 1.41 1.52 1.38, 1.66 1.79 1.63, 1.97
Model 2: Demographics and health conditions 1.00 Referent 1.26 1.14, 1.39 1.46 1.33, 1.61 1.71 1.55, 1.88
Model 3: Demographics and health behaviors* 1.00 Referent 1.20 1.08, 1.32 1.34 1.22, 1.48 1.49 1.35, 1.64
Model 4: All variables* 1.00 Referent 1.18 1.06, 1.31 1.31 1.18, 1.44 1.44 1.30, 1.59
Model 1: age, education, and husband's education Model 2: age, education, husband's education, high cholesterol, high blood pressure, diabetes, hx of cancer, hx of stroke, and hx of MI
Model 3: age, education, husband's education, smoking hx, physical activity, alcohol, BMI, and diet index Model 4: age, education, husband's education, high cholesterol, high blood pressure, diabetes, hx of cancer, hx of stroke, hx of MI, smoking hx, physical activity, alcohol, BMI, and diet index * Sample size for these models was 16,789 because of missing data for health behaviors.

87
Component-specific analyses of the SNI demonstrated that greater group participation,
greater religious service attendance, and currently being married were associated with greater
likelihood of exceptional longevity, although there was no statistically significant association for
number of friends (Table S4.2). In an additional sensitivity analysis, effect estimates were
materially unchanged (OR for most vs. least integrated in core model=1.7, 95% CI:1.6, 1.9)
when depressive symptoms were included in the model as a potential confounder.
Discussion:
To our knowledge, this the largest study to assess the association between social
integration and lifespan, and the first to consider the association between social integration and
the achievement of exceptional longevity. Consistent with our hypothesis, higher levels of social
integration were associated with an increased lifespan and greater likelihood of exceptional
longevity. This association persisted in models adjusting for chronic health conditions, and was
slightly attenuated when controlling for health behaviors. The attenuation of the effect estimate
when health behaviors were added to the model is congruent with our hypothesis that health
behavior-related factors serve as pathways by which social relationships affect human health
although further work is needed temporality and rule out the possibility of confounding. Due to
data availability, we could not definitively assess whether depression preceded or was
consequent to social integration; however, sensitivity analyses controlling for depressive
symptoms indicated only slight attenuation of the association between social integration and
lifespan and effect estimates remained statistically significant.
In analyses where the domains of the SNI were assessed separately, religious
participation, participation in social groups, and being married were associated with increased
lifespan and likelihood of exceptional longevity, while number of close friends was not. This is

88
consistent with previous research in the same cohort that demonstrated an overall association
between higher social integration and lower risk of coronary heart disease but no association
with the close friend subdomain (Chang et al., 2017). However, other research using a breast
cancer patient population from this cohort demonstrated that number of close friends, but no
other individual domains of social integration, was associated with greater likelihood of survival
(Kroenke et al., 2006). This discrepancy points to the potential specificity of the health effects of
social relationships- what is beneficial in one set of circumstances (i.e., a healthy population)
may be less effective in another (i.e., a patient population)- and lends support to the idea that the
health effects of social integration may be context dependent, rather than universal. At a
minimum, findings in healthy versus patient populations may not be interchangeable.
There are a variety of mechanisms that might explain the association between social
integration and improved health outcomes. Strong social support and other characteristics of
social relationships are associated with increased performance of healthy behaviors, including
physical activity (McNeill, Kreuter, & Subramanian, 2006), successful management of chronic
illnesses (Gallant, 2003; Tay, Tan, Diener, & Gonzalez, 2013), and smoking cessation (Wagner,
Burg, & Sirois, 2004). Social relationships may increase likelihood of experiencing positive
psychological states that promote the performance of health-related behaviors. They may also
improve health independently of health behaviors by enhancing positive affect and feelings of
belonging and self-worth, which may have direct beneficial effects on physiology through
neuroendocrine and immune pathways (Cohen, Gottlieb, & Underwood, 2000). In both cross-
sectional and longitudinal observational studies, greater social integration and other positive
characteristics of social relationships have been linked to improved biomarkers of metabolic

89
function (e.g., cholesterol and blood pressure) (Yang et al., 2016; Yang, Li, & Ji, 2013) and to
reduced systemic inflammation (Penwell & Larkin, 2010; Yang et al., 2016).
Several limitations of the present study are important to note. Findings may not be
generalizable, as the NHS is comprised of predominantly white women with a common
profession. It is possible that some characteristics shared among this cohort change the observed
association between social integration and exceptional longevity, such that the same relationship
would not hold in a more nationally representative sample. An additional limitation of this study,
as with all observational research, is the potential for unmeasured confounding. However, our
analyses controlled for a wide range of demographic and health status variables that may serve as
confounders, as well as for variables that are more likely to be mediators, such as depressive
symptoms. The relationship between social integration and exceptional longevity remained
robust and statistically significant when controlling for all these variables, mitigating the
possibility of a spurious relationship.
This study also has several strengths, chief among them its well-characterized cohort and
duration of follow-up. By following a large number of women over decades, we were able to
assess social integration at an early date, and prospectively observe participants’ lifespans over
twenty years of follow-up. This prospective follow-up enabled the assessment of exceptional
longevity, and provided reasonable power to detect an effect of social integration. Prospective
follow-up also reduces concerns about the potential for reverse causation. Another important
strength of the study is the rich characterization of the cohort, permitting control for a wide range
of potential confounders.
As longer lifespans become more achievable through improved disease prevention and
medical technology, it is increasingly important to work towards a better understanding of

90
psychosocial assets that can help promote longer and healthier lives. A greater appreciation of
these assets may be able to inform our thinking about the resources or reserves that are necessary
to help people successfully age with better health. Social integration, as demonstrated in these
analyses and others, is one such health asset that has a strong and consistent association with
longevity. Furthermore, although many efforts at intervention have fallen short, there is good
evidence that social integration is modifiable (Cohen & Janicki-Deverts, 2009). If we can find
effective ways to intervene on social integration we may be able to develop low-cost and
targeted interventions to help individuals achieve longer, healthier, and happier lives.

91
References
Achat, H., Kawachi, I., Levine, S., Berkey, C., Coakley, E., & Colditz, G. (1998). Social networks, stress and health-related quality of life. Quality of life research, 7(8), 735-750.
Barger, S. D. (2013). Social integration, social support and mortality in the US National Health
Interview Survey. Psychosomatic medicine, 75(5), 510-517. Berkman, L. F., Glass, T., Brissette, I., & Seeman, T. E. (2000). From social integration to
health: Durkheim in the new millennium. Social science & medicine, 51(6), 843-857. Berkman, L. F., & Krishna, A. (2014). Social network epidemiology. In L. F. Berkman, I.
Kawachi, & M. M. Glymour (Eds.), Social epidemiology (Second edition ed., pp. 234-289). New York, NY: Oxford University Press.
Berkman, L. F., Leo-Summers, L., & Horwitz, R. I. (1992). Emotional support and survival after
myocardial infarction: a prospective, population-based study of the elderly. Annals of Internal Medicine, 117(12), 1003-1009.
Berkman, L. F., & Syme, S. L. (1979). Social networks, host resistance, and mortality: a nine-
year follow-up study of Alameda County residents. American journal of Epidemiology, 109(2), 186-204.
Boehm, J. K., & Kubzansky, L. D. (2012). The heart's content: the association between positive
psychological well-being and cardiovascular health. Psychological bulletin, 138(4), 655. Chang, S. C., Glymour, M., Cornelis, M., Walter, S., Rimm, E. B., Tchetgen Tchetgen, E., . . .
Kubzansky, L. D. (2017). Social Integration and Reduced Risk of Coronary Heart Disease in Women: The Role of Lifestyle Behaviors. Circ Res, 120(12), 1927-1937. doi:10.1161/circresaha.116.309443
Cohen, S. (1988). Psychosocial models of the role of social support in the etiology of physical
disease. Health Psychology, 7(3), 269. Cohen, S., Gottlieb, B. H., & Underwood, L. G. (2000). Social relationships and health. Social
support measurement and intervention: A guide for health and social scientists, 1-25. Cohen, S., & Janicki-Deverts, D. (2009). Can we improve our physical health by altering our
social networks? Perspectives on Psychological Science, 4(4), 375-378. Cohen, S., & Wills, T. A. (1985). Stress, social support, and the buffering hypothesis.
Psychological bulletin, 98(2), 310. Colditz, G. A. (1994). The nurses' health study: a cohort of US women followed since 1976.
Journal of the American Medical Women's Association, 50(2), 40-44.

92
Gallant, M. P. (2003). The influence of social support on chronic illness self-management: a review and directions for research. Health Education & Behavior, 30(2), 170-195.
Holt-Lunstad, J., Smith, T. B., & Layton, J. B. (2010). Social relationships and mortality risk: a
meta-analytic review. PLoS medicine, 7(7), 859. House, J. S., Umberson, D., & Landis, K. R. (1988). Structures and processes of social support.
Annual review of sociology, 293-318. Hu, F. B., Stampfer, M. J., Manson, J. E., Rimm, E., Colditz, G. A., Rosner, B. A., . . . Willett,
W. C. (1997). Dietary fat intake and the risk of coronary heart disease in women. New England Journal of Medicine, 337(21), 1491-1499.
Kawachi, I., Colditz, G. A., Ascherio, A., Rimm, E. B., Giovannucci, E., Stampfer, M. J., &
Willett, W. C. (1996). A prospective study of social networks in relation to total mortality and cardiovascular disease in men in the USA. Journal of epidemiology and community health, 50(3), 245-251.
Kim, E. S., Hagan, K. A., Grodstein, F., DeMeo, D. L., De Vivo, I., & Kubzansky, L. D. (2017).
Optimism and Cause-Specific Mortality: A Prospective Cohort Study. American journal of Epidemiology, 185(1), 21-29.
Kreger, A. (1979). National Death Index. Paper presented at the Proceedings of the Annual
Symposium on Computer Application in Medical Care. Kroenke, C. H., Kubzansky, L. D., Schernhammer, E. S., Holmes, M. D., & Kawachi, I. (2006).
Social networks, social support, and survival after breast cancer diagnosis. Journal of Clinical Oncology, 24(7), 1105-1111.
Kubzansky, L. D., Boehm, J. K., & Segerstrom, S. C. (2015). Positive psychological functioning
and the biology of health. Social and Personality Psychology Compass, 9(12), 645-660. Kubzansky, L. D., & Thurston, R. C. (2007). Emotional vitality and incident coronary heart
disease: benefits of healthy psychological functioning. Archives of general psychiatry, 64(12), 1393-1401.
Longo, V. D., Antebi, A., Bartke, A., Barzilai, N., Brown-Borg, H. M., Caruso, C., . . . Gems, D.
(2015). Interventions to slow aging in humans: are we ready? Aging cell, 14(4), 497-510. McCullough, M. L., Feskanich, D., Stampfer, M. J., Giovannucci, E. L., Rimm, E. B., Hu, F. B.,
. . . Willett, W. C. (2002). Diet quality and major chronic disease risk in men and women: moving toward improved dietary guidance. The American journal of clinical nutrition, 76(6), 1261-1271.

93
McNeill, L. H., Kreuter, M. W., & Subramanian, S. (2006). Social environment and physical activity: a review of concepts and evidence. Social science & medicine, 63(4), 1011-1022.
Penwell, L. M., & Larkin, K. T. (2010). Social support and risk for cardiovascular disease and
cancer: a qualitative review examining the role of inflammatory processes. Health Psychology Review, 4(1), 42-55.
Rimm, E. B., Stampfer, M. J., Colditz, G. A., Chute, C. G., Litin, L. B., & Willett, W. C. (1990).
Validity of self-reported waist and hip circumferences in men and women. Epidemiology, 1(6), 466-473.
Rumpf, H.-J., Meyer, C., Hapke, U., & John, U. (2001). Screening for mental health: validity of
the MHI-5 using DSM-IV Axis I psychiatric disorders as gold standard. Psychiatry research, 105(3), 243-253.
Seeman, T. E. (1996). Social ties and health: The benefits of social integration. Annals of
epidemiology, 6(5), 442-451. Stampfer, M. J., Willett, W. C., Speizer, F. E., Dysert, D. C., Lipnick, R., Rosner, B., &
Hennekens, C. H. (1984). Test of the national death index. American journal of Epidemiology, 119(5), 837-839.
Strasser, T. (1978). Reflections on cardiovascular diseases. Interdisciplinary Science Reviews,
3(3), 225-230. Tay, L., Tan, K., Diener, E., & Gonzalez, E. (2013). Social relations, health behaviors, and
health outcomes: A survey and synthesis. Applied Psychology: Health and Well-Being, 5(1), 28-78.
US Department of Health and Human Services, & US Department of Agriculture. (2010).
Dietary guidelines for Americans, 2010. Washington, DC: US Government Printing Office.
Wagner, J., Burg, M., & Sirois, B. (2004). Social support and the transtheoretical model:
Relationship of social support to smoking cessation stage, decisional balance, process use, and temptation. Addictive behaviors, 29(5), 1039-1043.
Ware, J. E., & Sherbourne, C. D. (1992). The MOS 36-item short-form health survey (SF-36): I.
Conceptual framework and item selection. Medical care, 473-483. Woods, N. F., Rillamas-Sun, E., Cochrane, B. B., La Croix, A. Z., Seeman, T. E., Tindle, H. A., .
. . Manson, J. E. (2016). Aging well: observations from the Women’s Health Initiative study. Journals of Gerontology Series A: Biomedical Sciences and Medical Sciences, 71(Suppl_1), S3-S12.

94
Yang, Y. C., Boen, C., Gerken, K., Li, T., Schorpp, K., & Harris, K. M. (2016). Social relationships and physiological determinants of longevity across the human life span. Proceedings of the National Academy of Sciences, 113(3), 578-583.
Yang, Y. C., Li, T., & Ji, Y. (2013). Impact of social integration on metabolic functions:
evidence from a nationally representative longitudinal study of US older adults. BMC Public Health, 13(1), 1210.

95
Supplemental Materials
Table S4.1 Percent change in lifespan associated with components of social integration, Nurses' Health Study, 1992-2012. N= 73,276
Core Model*
% 95% CI
Group participation (ref=0 hours)
1-2 hours 6.24 4.57, 7.94 3-5 hours 8.45 6.49, 10.44 6+ hours 7.44 5.23, 9.70 Religious attendance (ref= almost never)
<once/month 1.83 -0.50, 4.21 1-3x/month 9.45 6.85, 12.11 >=once/week 11.34 9.60, 13.09
No. of friends (ref= 0 friends)
1-2 friends 2.00 -2.66, 6.76 3-5 friends 4.29 -0.02, 8.97 6+ friends 5.38 0.85, 10.09
Marital status (ref=unmarried) 10.29 8.58, 12.04
*Model includes: age, education, husband's education, high cholesterol, high blood pressure, diabetes, hx of cancer, hx of stroke, and hx of MI

96
Table S4.2 Odds ratios for the association of social integration score components with survival past age of 85, Nurses' Health Study. N= 17,309
Core Model*
OR 95% CI
Group participation (ref=0 hours)
1-2 hours 1.24 1.14, 1.35 3-5 hours 1.34 1.22, 1.46 6+ hours 1.30 1.18, 1.43
Religious attendance (ref= almost never)
<once/month 1.03 0.91, 1.16 1-3x/month 1.32 1.16, 1.50 >=once/week 1.37 1.26, 1.48
No. of friends (ref= 0 friends)
1-2 friends 0.93 0.73, 1.19 3-5 friends 1.00 0.79, 1.23 6+ friends 1.06 0.84, 1.34
Marital status (ref=unmarried) 1.32 1.23, 1.42
*Model includes: age, education, husband's education, high cholesterol, high blood pressure, diabetes, hx of cancer, hx of stroke, and hx of MI