Embed Size (px)
Citation preview

Social Aspects of Aquaculture in the Bay of Fundy
Prepared by Bryn Robinson, B.A.
University of New Brunswick, Saint John
July 2004

Abstract
A six month study investigated the attitudes towards monoculture and integrated aquaculture systems in the Bay of Fundy. Little research to date has examined the social aspects of aquaculture, although many would agree that this information is crucial for an educated and holistic understanding of the industry. A total of 165 participants from stakeholder, industry and environmental groups completed a self-report measure of their aquaculture knowledge and opinions. It was found that members of the public were more negative towards current monoculture, and although they are relatively unfamiliar with proposed integrated aquaculture, they feel positive that integration would be successful. Recommendations for continued research in this area are also discussed.

Introduction Different definitions of “sustainability” exist, but there is a consensus that the concept includes socio-economic variables and environmental integrity. The species cultivated must be profitable, with little risk. The industry must also be environmentally neutral. Similarly, there must be social acceptance of the industry.
Although successful as a food source, and an enhancement to local economies,
aquaculture raises some concerns. With increased production costs (see Naylor et al., 2000),
direct discharge of nutrients from farms, and a host of disruptive social issues – destruction and
vandalism of cages and habitats, visual pollution, altered familial work patterns, and degradation
of community nutrition (Corbin & Young, 1997) – aquaculture planners face a complex problem.
In an attempt to alleviate and understand these issues, an AquaNet and ACOA funded
initiative has been investigating a solution used for centuries in Asian countries – conversion. By
integrating fed aquaculture (finfish) with inorganic extractive aquaculture (seaweeds) and
organic extractive aquaculture (shellfish), the wastes of one resource user become a resource
(fertilizer or food) for the others. Sustainable systems can optimize industry efficiency and create
diversification, while ensuring the remediation of the consequences of its activities to maintain
coastal water health (Chopin et al., 2001).
Most salmon raised in the Bay of Fundy are in cage sites using monoculture techniques,
amid concerns of environmental and socio-economic viability. An integrated approach will
hopefully challenge many of these issues. Research over the last two years has involved the
development of an industrial pilot integrated system, by co-cultivating salmon (Salmo salar),
kelp (Laminaria saccharina) and blue mussel (Mytilus edulis). Results to date have been
positive, supporting the establishment of integrated, multi-trophic aquaculture systems (see
Chopin, et al, 2003, for details).

Social forces may significantly hinder any sustainable aquaculture plan to reach its full
potential, even under ideal biological and economic conditions – yet it has often been overlooked
in most designs (Bardach, 1997). However, a lack of understanding of the inherent social and
familial systems of affected people is counterproductive to any biological advancement. The
study discussed in this report will examine whether integrated aquaculture will be more
acceptable to consumers and stakeholders than monoculture, and whether this acceptance will
enhance social sustainability.
Social Acceptability of Aquaculture …as long as populations grow and economic conditions improve for many, the most sustainable development will be one that attains the best possible relationship of the forces active in local and regional dynamic cultural and economic systems as well as in larger dynamic, but normally slower changing, ecological systems. (Pillay, 1994)
The basis of social attitudes
People constantly evaluate the world around them: other people, objects surrounding
them, and ideas they hear about. These evaluations are generated from one or a combination of
their emotional reactions, their thoughts, and/or their behaviour in response to the stimulus. The
appraisals to their outside world are known as their attitudes (Aronson, Wilson, Akert, & Fehr,
2002). Attitude formation is further influenced by personal relevance and familiarity with the
situation, creating variations in the combination of emotions, thoughts, and behaviours used to
guide attitudes. With these factors, attitudes cannot be generalized between situations, so each
new case warrants examination. Making the effort to understand attitude sources, though, is
worthwhile. Planners can anticipate and effectively manage any reactions to proposals.
Information that is personally relevant to community members can then be provided. The groups
in question will thus pay more attention, feeling properly informed and less threatened by
change. Taking the steps to understand ultimately creates an invaluable addition to the process of
integrating new aquaculture practices to community life.
Previous studies on aquaculture attitudes
Social acceptability in aquaculture development has not been subject to large amounts of
study. One study of interest, conducted by Schreiber, Matthews, and Elliott (2003), proposed that
influences from industry and environmental groups were the basis of aquaculture attitudes. They
found that groups deliver their respective aquaculture images to the public to elicit desired
responses, a technique known as framing. It was found that industry frames fish production as
technologically efficient. Fish are envisioned as a part of a larger “machine” that generates food
and economic growth, rather than a living organism. Thus, such frames would make industry
changes more acceptable to the general public. Conversely, environmentalists “re-frame” fish to
be breathing, feeling organisms: properties to which we can relate, and which directly contrast
industry efforts.
A recent ocean management study conducted by the Department of Fisheries and Oceans
(2003), though, provides some direction. Compared to 1996 survey results, gradual, positive
trends toward greater familiarity of aquaculture definitions and topics were found: 66% more
Atlantic province participants were “very familiar” with aquaculture definitions, and 43% less
participants claimed to be “not at all familiar”. Although promising results, little change was
found in people who had had “little” to “some” familiarity. Evidently, there is an overall trend
towards greater knowledge, but more detail is needed to ensure the acceptance, and thus success,
of sustainable aquaculture systems.
The importance of social acceptability: examples of aquaculture attitudes
Reactions to aquaculture developments have been largely negative. In Chile, although
salmon farming has created more than 30,000 jobs in the remote Xth and XIth Regions, there has
been social dislocation and marginalization of the poor (Barrett and Caniggia, 2002). This has
led to resistance to salmon farming, and even deliberate destruction of cages. Opening these
areas to salmon fishing would create an incentive for further vandalism, and so has been opposed
by salmon farmers (Soto et al., 2001). In Canada, there has also been resistance to “enclosing the
commons” by salmon farming. Opposition has come from herring fishers, cottage owners and
recreational boaters.
Social Attitudes about Aquaculture
It is evident that social acceptability is essential for successful sustainable aquaculture. This research aims to provide the initiative with convincing social evidence of both risks and benefits. Results should supply baseline knowledge that will guide further biological, economic, and social research efforts, and education on aquaculture practices. It should also minimize risk and concern. Ultimately, this research should aid in generating a comprehensive aquaculture model that will improve the quality of life of Canadians.
Hypothesis: The amount of aquaculture knowledge that participants have will be
influenced by their links to the industry. Industry workers will have the most knowledge,
followed by those in environmental groups and government agencies, then community residents
with relational ties to the industry. Residents with no ties will have less knowledge, but less than
those outside the affected communities.
Methods and Experimental Design
Participants
General Public. The first sample consisted of residents from affected communities.
These people were recruited from advertisements posted in public community areas, and from a
random selection of names (Aliant Telecom, 2003). Through both of these methods, an N of
approximately 1220 was contacted for participation, with 110 respondents to date. A complete
community profile of Charlotte County can be found in Appendix A.
Industry. The second sample consisted of industry members – a varied sample that
included fisheries management and workers, food processors and distributors, and professional
organizations. The sample was invited primarily through mailed invitations to participate, with
15 companies and professional organizations contacted. Participants responding to public
advertisements and general public mailings were also included in this group for analysis. A total
of 53 industry members have responded to date, but only a few from formal company invitations.
Environmental non-government organizations (ENGO). The third sample consisted
of ENGO members, also invited to participate through mailed invitations. A total of 10
organizations across the country were contacted, with 2 respondents to date.
First Nations. A fourth sample was invited to participate, through mailed surveys to 5
organizations. To date, there are no respondents from this population.
Measures
Demographics. The demographics questionnaire consisted of questions regarding age,
gender, occupation, interest in current events, relational links to the industry, and approximate
consumption of seafood products. Industry participants were also asked for employment
questions.
Attitudes about Aquaculture. Sixteen questions assessed baseline knowledge and
opinions of current aquaculture methods. Similar questions were asked on integrated
aquaculture. Overall opinion about aquaculture and general views on food industries were also
asked.
Experimental Design
Two study sessions were run: a six week period in February to mid March, and a 13 week
period from mid April to mid July. In both sessions, the procedure was the same for all
populations.

General Public. One week before making contact, poster advertisements were used to
invite the public to complete the survey, either online, or through the mail. Posters also stated the
opportunity to be randomly selected for one of three $100 cash prizes. The following week, a
random sample was generated (Aliant Telecom, 2003), and mailed surveys. Letters provided
informed consent, and outlined the aim and voluntary nature of the study. The end of surveys
provided return mailing instructions, and prompted participants to provide mail/email addresses
to receive a summary of the results.
Industry. Simultaneously, industry opinion was assessed through online and mail
methods. The sample was first contacted through invitations sent to professional organizations,
asking permission to contact their membership for participation. Based on response, companies
were picked towards the end of the study and sent invitations with several survey copies.
Other populations. Two environmental groups, and five First Nations organizations,
were also invited to participate in the same manner as industry organizations.
For all three populations, reminders were sent to all remaining respondents, halfway
through the six-week study period.
Results and Discussion
Demographics
A total of 165 participants responded from 3 populations. The response rate for the
general public group (N=110) was 11.4%, expected in survey research. A total of 53 respondents
were from the 15 professional organizations and companies surveyed to date. With
environmental groups, 2 respondents came from the 2 environmental organizations invited to
participate. Additional demographic information is found in Table 1.

Although larger samples are needed to
increase confidence in the results, there are
several trends evident in the data to be discussed
here. At this time, environmentalist responses
will be omitted due to an extremely low response
number (N=2).
Table 1: Demographic information Total: N = 165
Average age: 50.5 years, range: 14 – 87
General Public (N =110) 74 male, 41 female
Industry (N =53) 36 male, 11 female
ENGO (N =2) 50.0% male, 50.0% female
Consumer Information
Industry members stated product cost as the main factor in making food purchases.
Conversely, more community respondents indicated that they were concerned with the product
healthiness. With the consumption of seafood, fish is eaten on a weekly basis by many
respondents in both groups.
Shellfish and marine plants are
eaten more on a monthly basis,
with marine plant consumption being the lowest. Since one of the pilot integrated farm’s outputs
is kelp, researchers may have to consider other markets for kelp, at least on a local scale.
Links to the Industry
Community and industry populations remain in contact with current events: 86% of the
public, and 72% of the industry sampled, use media on a daily basis. In both groups, television
was the most popular methods of staying informed, closely followed by radio and newspaper.
General public respondents are also linked to the industry through various relationships, with
only 17% asserting that they do not know people working in the aquaculture industry.
Table 2: Consumption of Seafood General Public Industry
Fish (weekly) 67% (N=105) 66% (N=53) Shellfish (monthly) 76% (N=83) 84% (N=45) Marine plants (monthly) 90% (N=51) 93% (N=27)

Familiarity of Industry Practices
Familiarity with aquaculture was gauged with definitions of current and proposed
aquaculture practices. When asked about aquaculture, 71% of community members, and 93% of
industry members, indicated being very to moderately familiar with the definition presented.
Knowledge gaps emerged in
the public sample when
presented with an integrated
aquaculture definition: only
30% were very to moderately
familiar. Considering the
majority of this sample is
linked to the industry via
relationships (83%) or use of media (86%), it would appear that the information about integrated
systems simply has not been well distributed to this sample.
020406080
100
CurrentMethods
ProposedMethods
Figure 1: Familiarity with Aquaculture Methods
GeneralPublic
Industry
Opinion of Industry Practices
General public respondents had mostly a positive (38%) or a neutral (30%) opinion to
these methods. When asked how they think they would feel about integrated aquaculture,
responses became more positive (58%) or neutral (36%). Industry responses were more polar in
their opinion of current practices – either positive (56%) or negative (24%). This group did show
a similar shift towards more positive feelings with integration, with 74% stating that they would
feel positive, and 15% as neutral.
With the industry group, the increased number of positive responses is likely based on
familiarity with integration. The results of the community participants are more interesting, given
the negative tone of qualitative feedback in the surveys. The positive feelings shown towards
current aquaculture are hypothesized to be a result of perceived benefits (i.e., employment,
stronger economy) more than repulsion by the myriad of perceived costs. With the little
familiarity, coupled with the negative survey tone, the increased positive feelings towards
integrated aquaculture could stem from a desire to see an improvement to current methods.
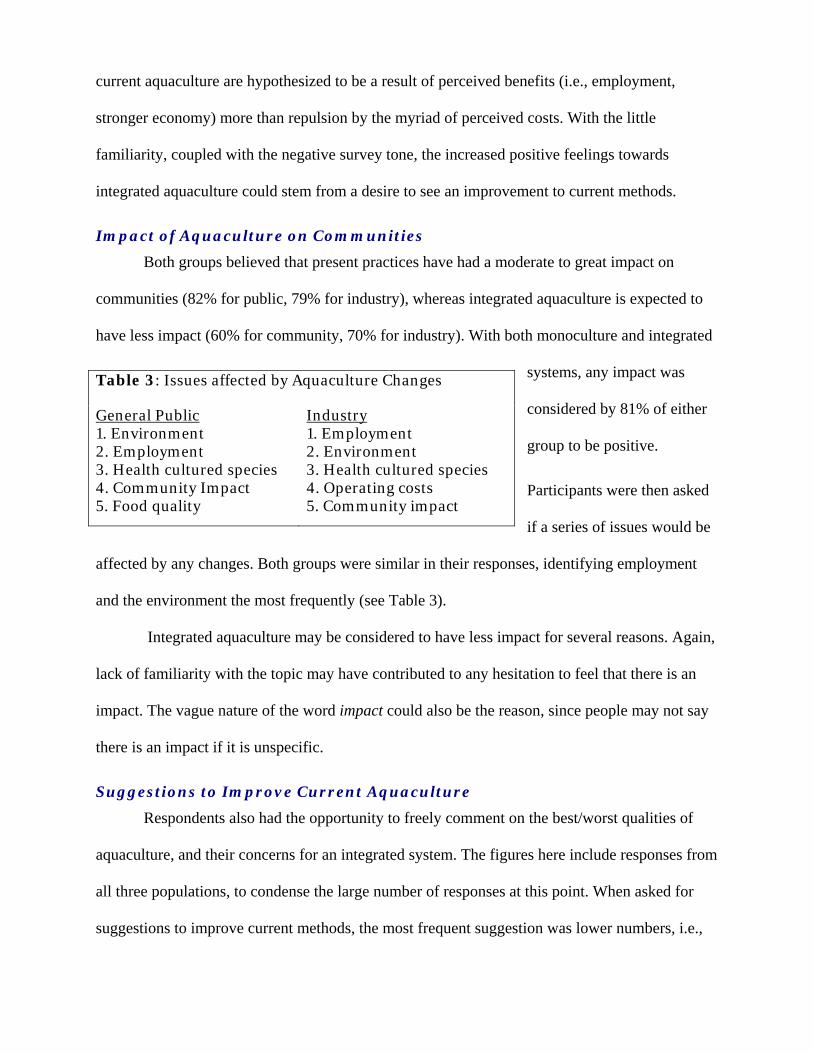
Impact of Aquaculture on Communities
Both groups believed that present practices have had a moderate to great impact on
communities (82% for public, 79% for industry), whereas integrated aquaculture is expected to
have less impact (60% for community, 70% for industry). With both monoculture and integrated
systems, any impact was
considered by 81% of either
group to be positive.
Participants were then asked
if a series of issues would be
affected by any changes. Both groups were similar in their responses, identifying employment
and the environment the most frequently (see Table 3).
Integrated aquaculture may be considered to have less impact for several reasons. Again,
lack of familiarity with the topic may have contributed to any hesitation to feel that there is an
impact. The vague nature of the word impact could also be the reason, since people may not say
there is an impact if it is unspecific.
Table 3: Issues affected by Aquaculture Changes
General Public 1. Environment 2. Employment 3. Health cultured species 4. Community Impact 5. Food quality
Industry 1. Employment 2. Environment 3. Health cultured species 4. Operating costs 5. Community impact
Suggestions to Improve Current Aquaculture
Respondents also had the opportunity to freely comment on the best/worst qualities of
aquaculture, and their concerns for an integrated system. The figures here include responses from
all three populations, to condense the large number of responses at this point. When asked for
suggestions to improve current methods, the most frequent suggestion was lower numbers, i.e.,

sites with fewer cages, less fish per cage, to eliminate over-crowding and promote good
husbandry.
Figure 2: Suggestions to Improve Aquaculture
Lower numbers (N=23)
Improved regulation (N=21)
Waste management (N=20)
Less neg. enviro.impact (N=11)
Good research basis (N=10)
Use of chemicals/drugs (N=8)
Table 4: Sample Comments - Suggestions to Improve Aquaculture “…the changes be positive changes and are done cautiously...based on scientific fact, not pseudo-science…” – male, 41, industry “…need land based operation; open net pen system not appropriate for marine environment” – female, 48, environmental “…control numbers of fish on site; cut out monetary government handouts…” – male, 49, general public “…I agree with what is being done now, however I think that the number of stock in each cage should be dropped.” – male, 42, general public “…I think the practicing on most of the salmon sites are reckless. From what I’ve experienced working in the industry [the owners] should have better husbandry…” – male, 41, industry “…let the industry support itself…” – male, 58, general public “…better policing: stricter government and local community control” – male, 68, general public

Best Qualities of Current Aquaculture
The variety of responses dropped dramatically when participants were asked about the
best feature of the aquaculture industry. Those who did respond had named employment and
economic benefits to local communities, as advantages.
Figure 3: Best Features of Aquaculture
Employment (N=65)
Food production (N=18)
Community economics (N=21)
Good quality (N=13)
Replenish natural stocks (N=9)
Table 5: Sample Comments- Best Feature of Aquaculture Industry “…large employer in the related communities” - male, 40, industry “… I think that it is a good way to replenish the natural stocks” - female, 20, industry “… it produces a sustainable healthy food product with the least environmental impact of any other food production method” – male, 42, industry “…provides strong economic benefits to Charlotte County” - female, 61, general public“… I think the aquaculture industry (especially salmon) despite its growing pains, is a winner” – male, 66, general public “…I don't think there is a good feature at present. The industry is completely out of control.” - male, 68, general public

Concerns with Integrated Aquaculture
Similar to concerns with current aquaculture methods, respondents most frequently
named environmental issues and overstocking species as their concerns. Participants also
demonstrated concern with introducing integration without the proper research and pilot
studies. Figure 4 demonstrates these issues.
Figure 4: Concerns with Integrated Aquaculture
Pilot system needed (N=11)
Ecological impact (N=13)
Disease control (N=5)
Space for sites/crowding (N=5)
Toxins (N=4)
Table 6: Sample Comments – Concerns with Integrated Aquaculture “…health concerns, i.e., mussels feeding on toxic [fish] waste” – female, 54, general public “…let the positive news flow – the only news we hear about aquaculture is negative… make sure species are matched properly to enhance each other.” – male, 38, industry “…it has to be done in moderation, have some test sites first…” – male, 45, industry “…my only concern is if the fish are unhealthy (i.e., ISA, sea lice, etc.)…what it will do to the mussels, kelp, etc” – female, 40, industry “…should not lead to increased aquaculture density in coastal areas; should not lead to siting in more environmentally fragile areas” – male, 54, general public

Approval of Aquaculture Practices
General public respondents were slightly in favour of current methods, but indicated greater
approval of integrated methods.
Industry respondents mirrored
these results (see Figure 5).
Figure 6 illustrates people’s
projected opinions of integrated
aquaculture. As shown, personal
opinions of the industry are not
apt to change with the
introduction of integrated aquaculture, nor the public’s opinion of food distributors, as indicated
by the majority of respondents
of both groups. However, many
respondents did believe that
integration would improve the
public’s opinion of the industry.
020406080
100
CurrentMethods
ProposedMethods
Figure 5: Approval of Aquaculture Methods
GeneralPublic
Industry
Overall, 90% of general
public responses, and 89% of
industry responses, believed that integrated aquaculture would be a successful venture. Even
with a lack of familiarity with integrated aquaculture principles, community participants have
confidence in new methods of farming. The fact that people are approving of new aquaculture
methods, with little knowledge of alternatives or the consequences, suggests that they are ready
to make changes from current methods. When people become more familiar with integrated
aquaculture, it will be interesting in future research, to see if they still approve.
0102030405060
Personal Public(industry)
Public(food dist.)
Figure 6: Opinion will change due to Integration
GeneralPublic
Industry

Recommendations for Future Research
Small communities have a markedly different mentality than that found in larger
municipalities, and thus provide a unique challenge to our research. Close knit bonds, the result
of families growing together for generations, can make it more difficult for an outsider to survey
attitudes – especially a subject that is equally valued and criticized. As stated, greater sample
numbers are needed to generate confidence in the results. These first results, however, do
provide some useful directions to guide the development of integrated aquaculture.
I. Modified Surveys
Increasing the sample is of primary focus. The surveys used on the two sessions can
continue to be used to gather data. If new populations need to be targeted, these surveys can be
easily adapted with minor changes, if any. The surveys can be found in Appendix D.
II. Online Discussion Forums
Online discussion forums were created, using participant responses from Time 1 as a
guide. Research sites such as Royal Roads University Forum (http://www.rrupublicforum.ca)
have made effective use of this economic and accessible tool. The data from these forums would
not be representative of the population, but for those with access, it can generate an ongoing
dialogue between groups that normally do not have the ability to discuss these topics. It would
also provide researchers with new ideas for survey development.
III. Focus Groups
Focus group sessions can provide a great enhancement to survey data collected. With
limited questionnaire space, the dialogue should engage community members in a dynamic and
informative way. It also provides participants with the opportunity to have in-depth, personal
discussions about their opinions. Ultimately, it provides researchers with necessary qualitative
data, while letting participants know that the project is earnest in making a positive change.

Detailed suggestions for conducting focus groups, along with proposed session materials, are
found in Appendix E.
IV. Personal Experience with the Industry
Attitudes are often generated from a combination of thought processes and emotions
created from experience. To further increase acceptability, these attitude sources must be
targeted. One emotional source involves experiences with the industry, direct (with workers) or
indirect (with results of industry activities). In surveys, negative aquaculture opinions were often
described through personal encounters with workers and any destructive physical evidence of a
company’s presence. A new survey (Appendix F) has been created to follow-up with previous
participants, and asks specifically about experiences with the industry and for suggestions to
improve industry interactions. This new survey also measures any change in attitude since their
last participation.
V. Media Effects
Another source of attitudes is the facts that allow people to make decisions about the
industry. The media plays a critical role in providing both factual and emotional information to
the public. As a preliminary investigation, a small news search was conducted for the last 2 years
on aquaculture-related news items in the local newspaper, the Canadian Broadcasting Corp., and
national magazines. Based on titles/small article excerpts, the negativity conveyed by the media
was overwhelming. Approximately 43% of the news items (N = 123) were viewed as having a
negative tone or explicitly state negative feelings towards the industry. These types of feelings
are mirrored in the concerns participants had. Although this overview was brief, and would
require more articles and inter-rater reliability to substantiate this information, the search added
credibility to the idea that the media plays an important role in the feelings people have towards

aquaculture. If industry wishes to increase acceptability, the media will be integral to success. A
further literature review of popular media is certainly warranted.
VI. Information dissemination
Information dissemination of clear and unbiased facts should be a key priority for the
Integrated Aquaculture project. Studies (i.e., Burbridge, Hendrick, Roth & Rosenthal, 2001;
Frankic & Hershner, 2003) have found time and time again, that involving the public in policy
creation can ease the introduction of aquaculture – but often people are misinformed (Burbridge
et al., 2001). Media is well used with these groups, and should be used to our advantage. We
must also consider that relationships with industry members provide another information source.
By keeping the industry well informed, many community members will also become informed.
We should also bear in mind that both groups have different concerns with aquaculture. Any
promotional or educational materials, or discussions, will have to be tailored to the pertinent
issues for each group.
Local people can provide key knowledge to the area, and those working in the industry
can certainly provide their experience. Overall, this survey demonstrated that both community
residents and industry members have both local knowledge and strong emotional ties with the
industry. Planning, instead of having to resolve conflicts, will save time and build valuable
working relationships between the public and those bringing aquaculture to the region. Providing
information in the form of open forums, brochures, etc. that is both objective and user friendly, is
essential.
Conclusions
Evidently, a consideration of community contribution and culture is crucial to the success
of this project. As Pillay (2001) noted, “technological progress in the next millennium has to go
hand-in-hand with social and ethical acceptability”. The opinions gathered can significantly
contribute to the project for successful sustainable aquaculture in southern New Brunswick. The
hypothesis that increased links to the industry will increase knowledge of aquaculture methods
appeared evident in this sample, although future research is needed before making this assertion
with confidence. Planners can use this and future data to anticipate possible design problems, and
those affected can receive information regarding pertinent risks and benefits of sustainable
models that is tailored to existing attitudes. These results can also be useful for those in other
regions wishing to adopt similar practices. A plan for sustainable aquaculture reinvesting in the
community, reinforcing and adapting itself to, and not conflicting, specific social values of the
communities, will have increased success of acceptance and prosperity (Corbin & Young, 1997).

References Aliant Telecom. (2003). Charlotte County Phone Book. New Brunswick
Aronson et al, (2002). Social Psychology, Canadian Edition. Toronto: McGraw-Hill.
Bardach, J. (1997). Fish as Food and the Case for Aquaculture. In Bardach, J. (ed.) Sustainable
Aquaculture. New York: Wiley and Sons.
Burbridge, P, Hendrick,V., Roth, E., & Rosenthal, H. (2001). Social & economic policy issues
relevant to marine aquaculture. J. Applied Ichthyology, 17.
Corbin, J.S., & Young, L.G.L. (1997). Planning, Regulation, and Administration of Sustainable
Aquaculture. In Bardach, J. (ed.) Sustainable Aquaculture. New York: Wiley and Sons.
Department of Fisheries and Oceans (2003). Canadian Attitudes toward DFO Issues study
(2003). Retrieved from http://www.dfo-mpo.gc.ca, on October 23rd, 2003.
Frankic, A., & Hershner, C. (2003). Sustainable Aquaculture: developing the promise of
aquaculture Aquaculture International, 11.
Schreiber, D., Matthews, R., & Elliott, B. (2003). The Framing of Farmed Fish: Product,
Efficiency and Technology. Canadian Journal of Sociology, 28(2),
Shang, Y.C. & Tisdell, C.A. (1997). Economic Decision Making in Sustainable Aquacultural
Development. In Bardach, J. (ed) Sustainable Aquaculture. New York: Wiley and Sons

Appendix A: Regional History and Culture of Charlotte County (Data courtesy of Stats Canada Census 2001)
Community historical background and context
Charlotte County is primarily made up of seven communities, with Blacks Harbour, Grand Manan, St. Andrews, St. George and St. Stephen as the main service areas of the region:
• Blacks Harbour (pop. 1082) is part company town and part fishing village, hosting both the largest sardine canner in the world (Connors Brothers) and headquarters for the largest fresh Atlantic salmon supplier in North America (Heritage Salmon).
• St. George (pop. 1509) is the major aquacultural centre for the province. • St Andrews (pop 1869) is one of Canada's oldest towns, characterized by resorts and historic
properties. Tourism is an integral part of the local economy. • St. Stephen (pop. 4667) is home to an international chocolate centre (Ganong’s), and also
serves as the main entry point from the USA into the Atlantic Provinces. • The Fundy Isles are comprised of Grand Manan (pop. 2610), Deer Island (pop.851), and
Campobello (pop.1195), situated in the heart of the Bay of Fundy. Grand Manan is deeply trenched in tradition and history, making a tight knit and bonded community of fisherman, scientists, writers, and artists.
Population and Demographic Characteristics
Since 1996, the county population has demonstrated 0% growth. Unlike other more bilingual/francophone regions in the province, 92.7% of Charlotte County speaks only English. Also, compared to the rest of New Brunswick, this population has a higher proportion of over 65 year old members, as evident in the sample. Gender is approximately evenly distributed in the population, but the sample is comprised of more males.
Of the working age population: • 42.7% had completed high school and continued to some form of post-secondary education. • 34.1% completed their post-secondary education. • 7.2% work in agricultural related fields • 17.1% are unemployed, due to the seasonal work in fisheries, farms and tourism.
Employment and economic base
Fisheries and aquaculture are an important part to the Charlotte County lifestyle. With a rich fishing tradition, the area employs approximately 3500 people in the industry. One area in particular, Blacks Harbour, houses the world’s largest sardine industry, employing 1500 people in all aspects of the catch, process, and distribution of the product. Dulse from Grand Manan is also a growing industry. Aquaculture in the County represents over 95% of provincial total aquaculture production (est. 40 000 tons/annum, a farm gate value of 191 million). The industry has provided over $50 million in wages and benefits per annum, and 2700 direct and indirect jobs, to the county.
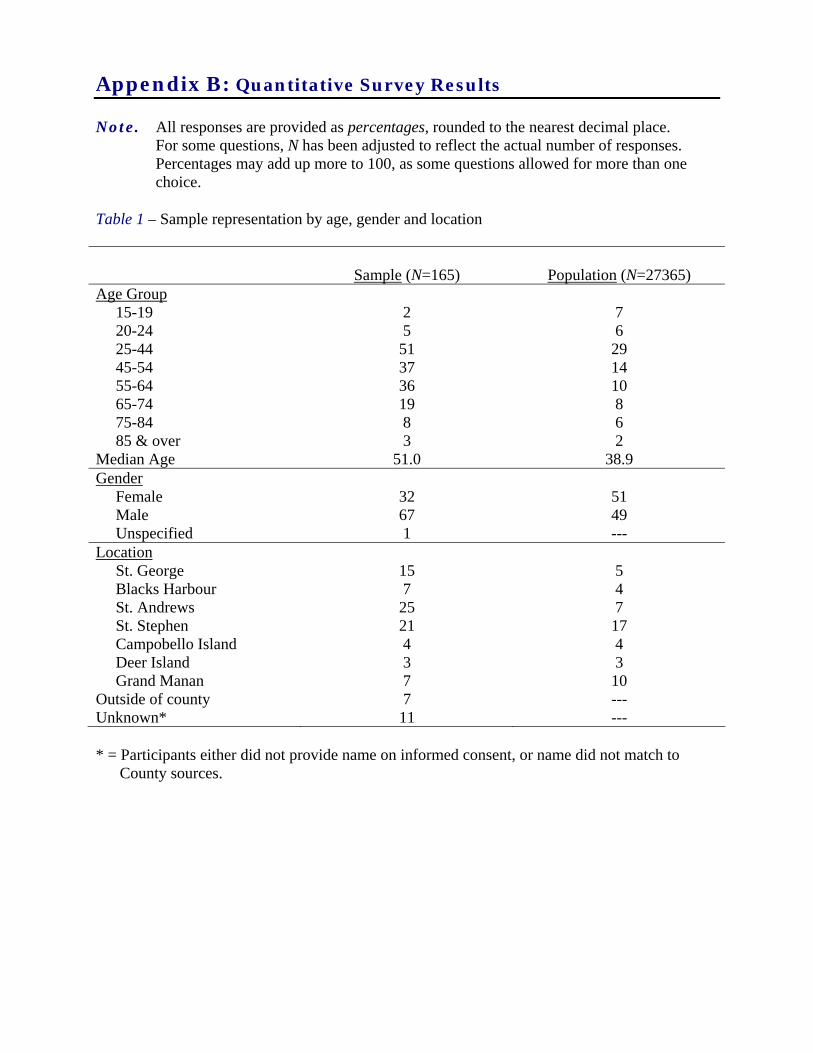
Appendix B: Quantitative Survey Results Note. All responses are provided as percentages, rounded to the nearest decimal place. For some questions, N has been adjusted to reflect the actual number of responses.
Percentages may add up more to 100, as some questions allowed for more than one choice.
Table 1 – Sample representation by age, gender and location
Sample (N=165) Population (N=27365) Age Group 15-19 2 7 20-24 5 6 25-44 51 29 45-54 37 14 55-64 36 10 65-74 19 8 75-84 8 6 85 & over 3 2 Median Age 51.0 38.9 Gender Female 32 51 Male 67 49 Unspecified 1 --- Location St. George 15 5 Blacks Harbour 7 4 St. Andrews 25 7 St. Stephen 21 17 Campobello Island 4 4 Deer Island 3 3 Grand Manan 7 10 Outside of county 7 --- Unknown* 11 --- * = Participants either did not provide name on informed consent, or name did not match to County sources.

Table 2 – Industry representation
Industry (N =53)
ENGO (N =2) Job type Officea 23 --- Site labourerb 38 --- Distribution --- --- Educationc 9 --- Research & Developmentd 15 1 Veterinarian 2 --- Governmente 4 --- Otherf 2 --- Species Salmon 39 50 Herring 13 --- Alt. species 17 --- Shellfish 13 --- Lobster/crab 4 --- Marine Plants 9 --- Other --- ---
a = sales/administration, management b = farming, feeding, construction, factory c = students, instructors d = researchers, consultants e = provincial, federal f = traditional fishers
Table 3 - Consumer information: consumption and purchase of seafood

General Public N =110
Industry N =53
ENGO N =2
Fish Daily Weekly Monthly
(N =105) 1 67 32
--- 66 32
--- 50 50
Shellfish Daily Weekly Monthly
(N =83) --- 24 76
(N =45) --- 16 84
--- --- 50
Marine plants Daily Weekly Monthly
(N =51) --- 10 90
(N =27) --- 7 93
--- --- ---
Purchase influences (N =105) Cost 87 91 --- Health 91 89 100 Convenience 50 48 --- Advertisements 22 17 --- Other 11 17 ---
Table 4 – Links to the Aquaculture Industry

General Public N =110
Industry N =53
ENGO N =2
Use of Media (N =108) Daily 86 72 100.0 Weekly 6 15 --- Monthly 4 11 --- Never 4 2 --- Type of Media Used (N =105) Newspaper 57 51 50 Magazines 32 26 50 Radio 57 51 100 Internet 21 32 --- Television All types listed
63 27
58 30
50 ---
Other --- 6 --- Level of Interest (N =106) None at all 7 2 --- Slight 11 4 --- Some 19 11 --- Moderate 34 25 --- A lot 29 60 100 Contacts in Industry (N=101) One/both parents 1 2 --- One/more children 17 2 --- My spouse/partner 3 2 --- One/more friends 60 6 50 No one 17 --- 50
Table 5 - Question #1: Aquaculture is defined as the farming of aquatic animals - fish, mollusks, crustaceans – and aquatic plants. It is presently most often done with one species at a time – for example, monoculture of salmon, monoculture of mussels, and so on. Please rate your familiarity with this definition:
General Public N =110
Industry N =53
ENGO N =2
Very familiar 38 74 100 Mod. Familiar 33 19 --- Slightly familiar 19 6 --- Not at all familiar 10 2 ---
Table 6 - Question #2: Please indicate your feelings about the present practices of aquaculture:

General Public N =109
Industry N =53
ENGO N =2
Very positive 5 19 --- Positive 33 37 --- Neutral 30 19 --- Negative 18 24 --- Very negative 6 --- 100 No opinion 7 2 ---
Table 7 - Question #3: How do you feel that present aquaculture practices impacted your community?
General Public
N =109 Industry N =53
ENGO N =2
No impact --- 4 --- Some 7 6 --- Moderate 29 13 50 Great 56 76 50 No basis to judge/unsure 6 --- --- Positive impact
(N=90) 82
(N=48) 79
(N=1) ---
Negative impact 18 21 50
Table 8 - Question #4: Do you approve of current aquaculture practices?
General Public N =90
Industry N =48
ENGO N =2
Yes 61 62 --- No 39 38 100
Table 9 - Question #7: Research today is examining the developing of integrated aquaculture: the farming of animals and plants (such as mussels and kelp) that take out food from the same water as farmed animals (such as fish) – which provide food to the water. Please indicate your familiarity with this definition:
General Public
N =110 Industry N =53
ENGO N =2
Very familiar 10 37 50 Moderately 20 30 50 Slightly 33 15 --- Not at all 37 19 ---
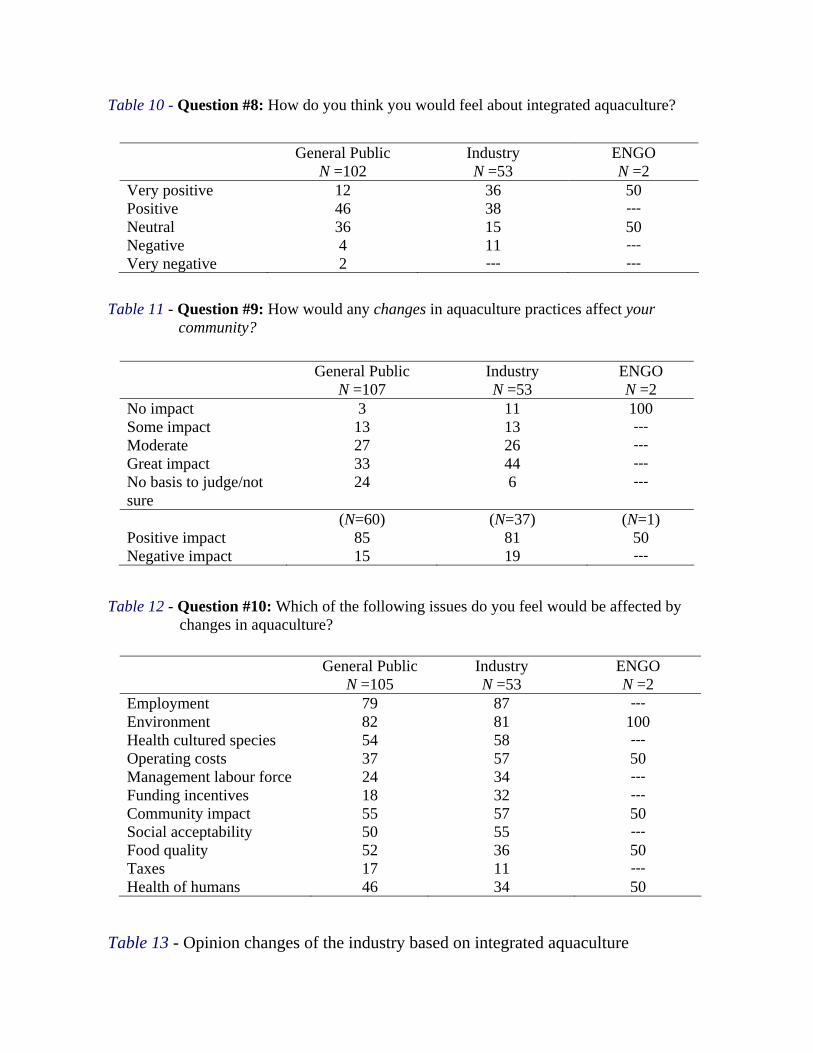
Table 10 - Question #8: How do you think you would feel about integrated aquaculture?
General Public N =102
Industry N =53
ENGO N =2
Very positive 12 36 50 Positive 46 38 --- Neutral 36 15 50 Negative 4 11 --- Very negative 2 --- ---
Table 11 - Question #9: How would any changes in aquaculture practices affect your community?
General Public
N =107 Industry N =53
ENGO N =2
No impact 3 11 100 Some impact 13 13 --- Moderate 27 26 --- Great impact 33 44 --- No basis to judge/not sure
24 6 ---
Positive impact
(N=60) 85
(N=37) 81
(N=1) 50
Negative impact 15 19 ---
Table 12 - Question #10: Which of the following issues do you feel would be affected by changes in aquaculture?
General Public
N =105 Industry N =53
ENGO N =2
Employment 79 87 --- Environment 82 81 100 Health cultured species 54 58 --- Operating costs 37 57 50 Management labour force 24 34 --- Funding incentives 18 32 --- Community impact 55 57 50 Social acceptability 50 55 --- Food quality 52 36 50 Taxes 17 11 --- Health of humans 46 34 50
Table 13 - Opinion changes of the industry based on integrated aquaculture

General Public
N =110 Industry N =53
ENGO N =2
Would you approve of IA? Yes No
(N=92) 88 12
(N=47) 87 13
(N=1) 50 ---
Opinion change due to IA? Yes, more positive Yes, more negative No
(N=93) 32 4 61
(N=50) 34 6 62
50 --- 50
Change public opinion? Yes, more positive Yes, more negative No
(N=90) 57 2 39
(N=47) 47 9 43
50 --- 50
Change public opinion of food distributors? Yes, more positive Yes, more negative No
(N=87)
45 6 48
(N=45)
29 9 64
50 --- 50
Would IA be successful? Yes No
(N=88) 90 10
(N=46) 89 11
(N=1) 100 ---
Appendix C: Qualitative Survey Results
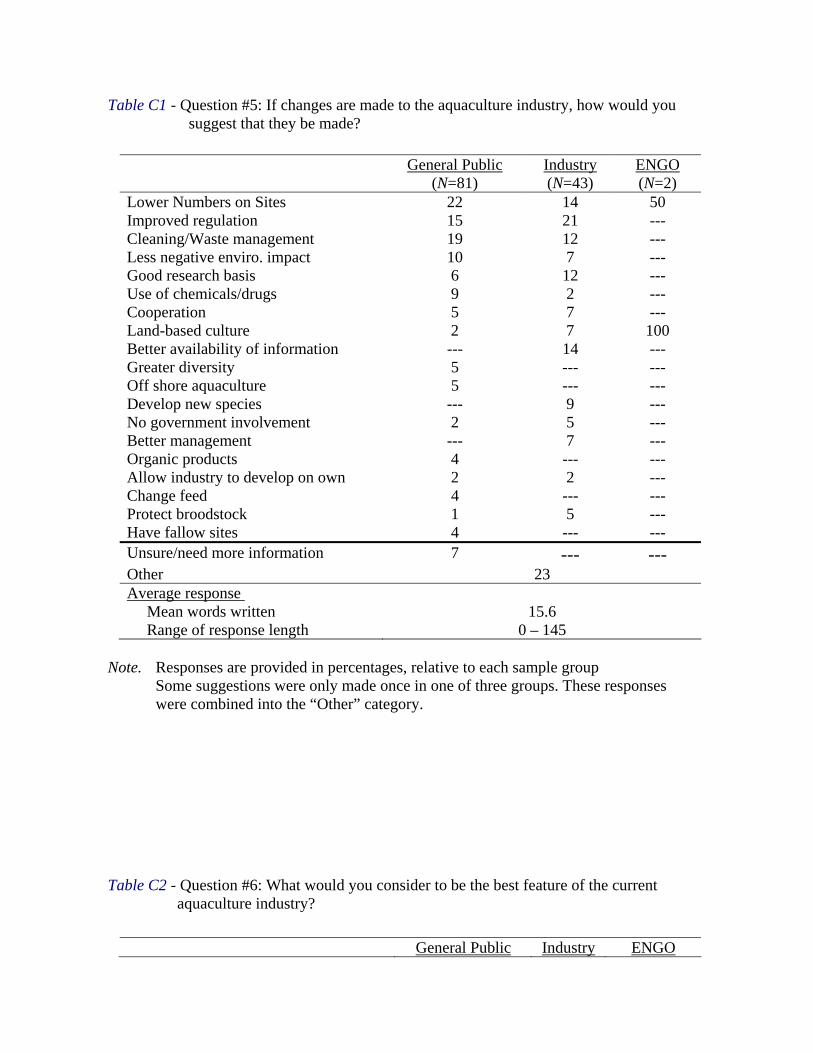
Table C1 - Question #5: If changes are made to the aquaculture industry, how would you suggest that they be made?
General Public
(N=81) Industry (N=43)
ENGO (N=2)
Lower Numbers on Sites 22 14 50 Improved regulation 15 21 --- Cleaning/Waste management 19 12 --- Less negative enviro. impact 10 7 --- Good research basis 6 12 --- Use of chemicals/drugs 9 2 --- Cooperation 5 7 --- Land-based culture 2 7 100 Better availability of information --- 14 --- Greater diversity 5 --- --- Off shore aquaculture 5 --- --- Develop new species --- 9 --- No government involvement 2 5 --- Better management --- 7 --- Organic products 4 --- --- Allow industry to develop on own 2 2 --- Change feed 4 --- --- Protect broodstock 1 5 --- Have fallow sites 4 --- --- Unsure/need more information 7 --- --- Other 23 Average response Mean words written 15.6 Range of response length 0 – 145
Note. Responses are provided in percentages, relative to each sample group Some suggestions were only made once in one of three groups. These responses were combined into the “Other” category.
Table C2 - Question #6: What would you consider to be the best feature of the current aquaculture industry?
General Public Industry ENGO

(N=80) (N=41) (N=2) Employment in local communities 55 49 50 Food production 15 15 --- Economic input into communities 16 20 --- Good quality/quantity 10 12 --- Method of replenishing stocks 9 5 --- Overall ecological impact 1 7 --- Overall positive community impact 3 2 --- Low prices 4 --- --- Technology used --- 7 --- Unsure/need more information 1 --- 50 Other 23 Average response Mean words written 7.3 Range of response length 0 – 65
Note. Responses are provided in percentages, relative to each sample group Some suggestions were only made once in one of three groups. These responses were combined into the “Other” category. Table C 3 – Question #11: If you believe that there are any areas or issues of concern with an integrated aquaculture system, please indicate these below:
General Public (N=42)
Industry (N=21)
ENGO (N=2)
Ecological Impact 24 14 --- Pilot studies/research needed 14 14 100 Disease control 5 14 --- Space for sites/crowding 10 5 --- Toxins 7 5 --- Quality of food 2 10 --- Cannot replicate nature 7 --- --- Information for the public --- 14 --- Unsure/need more information 12 5 --- Other 24 Average response Mean words written 8.1 Range of response length 0 – 122
Note. Responses are provided in percentages, relative to each sample group Some suggestions were only made once in one of three groups. These responses were combined into the “Other” category.