Embed Size (px)
Citation preview

Social Barriers to Entrepreneurship in Africa:
The Forced Mutual Help Hypothesis∗
Philippe Alby1 Emmanuelle Auriol2 Pierre Nguimkeu3
June 10, 2013
Abstract: Africa economy is characterized by a large informal sector and by an over-
representation of entrepreneurs of foreign origin in the formal one. The paper argues that
social arrangements prevailing in Africa partly explain these results. As formality marks
economic success, local entrepreneurs in the formal sector have the social obligation to
provide a job and to redistribute their wealth to the members of their extended family.
Such firms are less productive than their foreign counterparts. High family taxes and
reduced profit margins discourage formal entrepreneurship. The relevance of the theory
is assessed with a database compiling surveys from 10,480 enterprises in 31 Sub-Saharan
African countries performed between 2002 and 2007. The empirical analysis supports the
theoretical analysis. Combined with the lack of credit, the labor management distortion
created by the family tax takes its toll on the growth of the African formal economy. Using
the estimated structural parameters, the proportion of missing African entrepreneurs
varies between 5% and 8% of the overall workforce of the formal sector.
Keywords: Entrepreneurship; Family Solidarity; Informal Sector; Africa
JEL classification: H53, H55, L26, O14, O17, O55
∗We would like to thank the French Development Agency (AFD) and the Social Science and Hu-manities Research Council of Canada (SSHRC) for their financial support. Philippe Alby acknowledgefinancial support from grant RENTSEP ANR-09-BLAN-0325. We would like to thank Pascal Lavergne,Andrew Foster, Ken Jackson, Marcel Fafchamps, Flore Gubert, Jean-Philippe Platteau, Jean-Marie Ba-land, Stephane Straub, Jean-Paul Azam, Priscila Souza, Pierre Dubois, Fabio Grazi for useful comments.We also thank participants of the 2012 conference of the Canadian Economic Association, of the invitedsession on Entrepreneurship in Developing Countries at the 2012 European Economic Association, of the2011 scientific meeting of the European Union Development Network, of the 5th International Confer-ence on Applied Statistics organized by the Academy of Economic Study in Bucharest, of the Barazasworkshop at Toulouse School of Economics.
1Toulouse School of Economics (ARQADE) Toulouse, Place Anatole-France, 31042 Toulouse cedex,France, email: [email protected]
2Toulouse School of Economics (ARQADE and IDEI) Toulouse, Place Anatole-France, 31042 Toulousecedex, France, email: [email protected]
3Georgia State University, Andrew Young School of Policy Studies, PO Box 3992, Atlanta, GA 30302-
1
1 Introduction
African countries are characterized by a dual economy where a small modern industrial-
ized sector co-exists with a large informal sector.1 The limited size of the formal sector
explains that direct taxation in percentage of GDP is three time lower in Sub-Saharan
Africa than in advanced economies.2 With very low tax revenue as a proportion of GDP,
African countries do not provide much public goods and even less social protection. On
average, Sub-Saharan Africa countries allocate only 4.8 per cent of their gross domestic
product to social security (ILO 2010). This is the lowest level of investment in social
protection for a region in the world.3 In the absence of a public safety net, Africans have
developed a culture of ”forced mutual help” (Firth 1951). Wealthy Africans have the
social obligation to share their ressources with their needy relatives and extended family.
Since becoming an entrepreneur in the formal sector marks economic success, it inevitably
involves in the African context substantial family taxation. Combining theoretical and
empirical analysis the paper studies how the forced mutual help constraint influences for-
mal entrepreneurship. It distinguishes local entrepreneurs from entrepreneurs of foreign
origin. The theoretical analysis shows that the forced mutual help constraint is distortive
because it leads to overstaffing in local firms, which as a result are less efficient than firms
managed by foreigners. Disadvantaged by the family taxation and the misallocation of la-
bor it yields, individual of local origin becomes less often entrepreneur. Exploiting World
Bank surveys from 10,480 enterprises in 31 Sub-Saharan African countries performed be-
tween 2002 and 2007, we next confront the model predictions with the available data.
Since these empirical results support the theory, we finally estimate the percentage of
missing local entrepreneurs in the formal sector with the help of structural estimations.
The study of barriers to entrepreneurship is not new in the literature. Since the
seminal paper by Evans and Jovanovic (1989) that has shown on US data the importance
of borrowing constraints in entrepreneurial choice, many papers have emphasis that the
tightness of credit constraints is a major obstacle to entrepreneurship. In developing
countries imperfect capital markets have hence been found to be a key determinant of
informality (see for instance Straub 2005, De Mel et al. 2008, Grimm et al. 2011).
Another important determinant of informality, and thus of firm growth, is the existence
of entry sunk costs to the formal sector. These costs are proportionally higher in poor
3992, USA; email: [email protected] International Labour Organization estimates that urban informal employment absorbs 61% of
the urban labor force in Africa (ILO 1999). Similarly more than 90% of new jobs created between1990-1994 in Africa were in the informal sector (Kuchta-Helbling 2000).
2For international comparison of countries’ tax structure and level see Tanzi and Zee (2000), Martinez-Vazquez et al. (2009) and Keen and Mansour (2010).
3In comparison it is 23.2% for countries of Western Europe and the world average is 10.9 % (see ILO2010). Tanzi and Schuknecht (2000) show that the difference between OECD and developing countries’public expenditure is the OECD’s expenditure on social security.
2
countries than in advanced economies. As a result firms in developing countries, especially
small ones, remain informal, because becoming formal involves fixed costs that are beyond
the reach of poor entrepreneurs (see Djankov et al 2002, Auriol and Warlters 2005).
Finally, excessive or inappropriate government regulations have also been found to be
a significant constraint on entrepreneurship (e.g., Botero et al. 2004 on labor market
regulation).
In the African context additional barriers to entrepreneurship must exist for the local
people. Indeed ”small and medium enterprise (SME) are almost everywhere in Africa,
mainly in the hands of non-African aliens” (Tshikuku 2001). For instance in his study on
SME in Kenya and Zimbabwe, Fafchamps (2004) finds that only 32% of firms are in the
hand of indigenous-African. This result is confirmed by Biggs and Shah (2006) who find
that in Kenya most firms are in the hands of Asians, while in Zimbabwe they are in the
hands of Europeans and to a lesser extent Asians. Biggs and Shah (2006) find that ethnic
minority groups, such as the Indian in East Africa, the European in Southern Africa, the
Lebanese in West Africa, dominate many of the major manufacturing activities. In this
paper we study a new type of barriers to entrepreneurship, related to the forced mutual
help norms prevailing in Africa, that contribute to explain this equilibrium.
There is a substantial literature, mainly anthropologic but also economic, on the
possible negative impact of solidarity norms on economic development. Platteau (2006)
explains that private wealth accumulation is perceived as an anti-social behavior in most
traditional Africa. He quotes the anthropologist Woodburn (1998 : 52) who based on
his observations of Hadza hunter-gatherers in Tanzania writes: ”People who have more
than they manifestly need are put under relentless pressure to share”. In fact in most
social networks in Africa sharing is a moral principle and accumulation is not well per-
ceived. The impact of these social norms on economic outcome has been shown to be
distortive. For instance Anderson and Baland (2002) show that women join roscas to
protect their savings from their husbands and hence to save at a higher rate than they
would at home. Studying credit cooperatives in Cameroon, Baland et al. (2011) find
that 20% of the loans are fully collateralized by savings held by the borrowers in the
same credit institutions. Yet the net interest payments represents 13% of the amount
borrowed. Based on interviews with members of the cooperatives, the authors show that
some individuals systematically use credit as a way to pretend that they are too poor to
have available savings. By doing so, they can successfully oppose request for financial
help from friends and relatives. Similarly Duflo et al. (2011) argue that Kenyan farmers
do not invest in fertilizer, although it would substantially raise their yield, because it
is difficult for them to protect their savings from consumption demands. Bernard et al.
(2010) analyze theoretically the role of social norms in opposing economic differentiation
on the emergence of market-oriented organizations and show that they tend to preclude
3
their emergence and distort their structure. They illustrate their results using a dataset
of 646 village organizations in Burkina Faso. Finally recent experiments in Kenya and
in Liberia confirm that social pressures to share with relatives create disincentives to
make profitable investments. In rural Kenya within a controlled laboratory environment,
Jakiela and Owen (2010) find that both women, particularly unmarried women, and men,
particularly when they have recently been asked for gifts or loans by relatives, are willing
to reduce their expected profits to avoid making positive income shocks observable to the
community. In a similar type of experiment conducted in Liberia, Nillesen, Beekman, and
Gatto (2011) combining survey and experiment data, find that individuals with strong
family ties within the community tend to make lower profitable investments than indi-
viduals with weaker family ties. They are also willing to pay to hide their money. These
findings support the hypothesis that kinship networks can hamper profitable investments,
as people want to avoid sharing their wealth with an extensive network.
However none of these papers study how this problem mights affect the decision to
become a formal entrepreneur, and thus the development of a healthy productive sector.
The only paper focusing on the issue of entrepreneurship in this context is the paper
by Grimm et al. (2011) and it studies the informal sector. It aims to contribute to the
literature on high capital returns in small informal firms by analyzing whether social
networks, more specifically those related to the family and kin, act as a constraint for
informal entrepreneurs or as an asset. They use an original data set (1-2-3 surveys)
covering informal entrepreneurs in seven West-African agglomerations. They find that
local social networks within the city have positive effects on factor use and hence added
value, presumably by easing credit and insurance markets constraints. However they
also find robust negative effects associated with social networks tied to the village of
origin. These effects get diluted with geographical distance, probably because with rising
distance it is easier to hide the generated income and to protect it from abusive demands.
The present paper is complementary to the Grimm et al. (2011) paper as it focus on the
formal sector. It contributes to the new literature on the forced mutual help constraint
by exploring how it impacts the decision to become a formal entrepreneur in the African
context.
To guide the analysis, we model the choice of potential entrepreneurs with idiosyn-
cratic ability and a fixed amount of capital, between becoming entrepreneur in the formal
sector or becoming a wage worker/self-employed in the informal sector. We consider for-
eigners and local entrepreneurs. Contrary to the former, local entrepreneurs have the
social obligation to subsidize their family. We show that they minimize the burden of the
family tax by employing their relatives as much as they can. This strategy maximizes
the entrepreneur net profit. However it is socially costly because family members do
not necessarily have the right qualifications for the job. Recruiting family and relatives
4
rather than the best qualified people distorts productive efficiency. Everything else being
equal local firms are less productive and less profitable than firms owned by foreign-
ers. Reduced profit margins discourage entrepreneurship: with similar credit constraint
and entrepreneurial ability local people becomes less often entrepreneurs than foreigners.
Combined with a lack of credit this precludes Sub-Saharan formal sector from growing.
We derive from the model three main sets of predictions. First the labor force of
local firms, which mainly comes from the pool of unemployed manager’s relatives, is less
qualified and less competent than the labor force of foreign firms. This implies that the
labor force composition and also training programs offered by the local firms differ from
those of foreign ones. Second the theory predicts that the local firm has a larger labor
force embodied in a larger labor/capital ratio. Third the labor productivity of a local
firm is lower than the labor productivity of a regular firm. Finally if the problem of forced
solidarity is indeed relevant, the results should be different in countries with relatively
better social protection than in countries without such social protection.
The empirical relevance of the model predictions is assessed with the help of the Enter-
prise Survey database maintained by the World Bank.4 This database compiles surveys
from 10,480 formal enterprises in 31 Sub-Saharan African countries performed between
2002 and 2007. The estimations reveal that African entrepreneurs are credit constrained,
which is consistent with previous results in the literature. More interestingly they reveal
that African entrepreneurs are also constrained in the labor market. The estimations on
labor force composition, training, labor to capital ratio and labor productivity are all
consistent with the model predictions.
We next use our theoretical model and data on workers of formal firms to perform
a structural estimation of the model. This allows us to get an estimate of the fraction
of missing African entrepreneurs, that is, the proportion of African wage-workers who
would have chosen to become entrepreneurs if potential social pressure to redistribute
resources didn’t exist. Structural estimates are obtained by maximizing a likelihood
function constructed by matching the expected probability of occupations as generated
by the model to the actual occupational status observed in the data. The results show
that between 5 to 8 percent of African workers are self-excluded from entrepreneurship
due to social pressure.
Finally, we use the Institutional Profiles Database5 as a complementary source of data
to assess the presence of social safety nets within each surveyed country. An Institutional
Solidarity Index (ISI hereafter) is computed for 21 of the 31 countries surveyed by the
World Bank. We split the countries into two sub sample according to whether they are
4Available at http://www.enterprisesurveys.org/.5http://www.cepii.fr/anglaisgraph/bdd/institutions.htm
5

worse or better than the median sample ISI. Regressions show that local firms located
in countries with poor social protection are strongly affected by the forced solidarity
constraint while it is not the case for local firms located in countries with better social
protection. This suggests that social security, public retirement plans, and other public
schemes aimed at protecting unemployed, sick or old people in advanced economies are
not solely explained by people inner taste for solidarity and redistribution. They are
also economic tools to prevent an inefficient allocation of labor in firms. The lack of such
mechanisms in Sub-Sahara Africa seems very costly. By eroding the local firms productiv-
ity, forced mutual help constitutes additional barriers to formal entrepreneurship. With
an atrophied formal sector, tax revenues are low. This reduces further the government
ability to develop social security and insurance, reinforcing the need for family/ethnic
solidarities.
The next section builds a model of entrepreneurial choice which formalizes the forced
mutual help constraint for local entrepreneur and from which we derive testable predic-
tions. Section 3 assesses the relevance of the theory on a sample of 31 African countries.
Finally, section 4 offers some concluding remarks.
2 The model
The model is based on Evans and Jovanovic (1989). There is in the economy a continuum
of potential entrepreneurs. They have different ability (e.g., different education level,
human and social capital) captured by a parameter θ. To keep the exposition simple we
present in the main text a Cobb-Douglas specification of the production function
Y = θKαL1−α α ∈ (0, 1) (1)
where K is the stock of capital and L the quantity of labor used in the firm of en-
trepreneur with ability θ. However the Appendix 6.1 shows that our results are robust to
a general specification of the production function (i.e., any function f(θ,K, L) increasing
and concave in each of its arguments).
We assume that the maximal stock of capital available to the entrepreneur, K, is
constrained. This assumption is consistent with the fact that entrepreneurs are credit
constrained in Africa. The exogenous threshold may vary from one individual to the other.
By contrast labor supply is plentiful. The entrepreneurs optimize freely the quantity of
labor, denoted L, hired in their firms. The unit price of capital is r and the unit price
of labor is w. Each individual has one unit of labor that he can use either to become an
entrepreneur or to work for a wage w > 0 (i.e., in other people firms or as self-employed).
6

The optimal choice depends on the capital available to the agent and on his/her ability.
We make the following assumption about ability dispersion.
A1 θ are independently distributed in [0, θ].
The model establishes a distinction beteween local entrepreneurs, identified by l, and
”foreign” entrepreneurs (i.e, foreigners, outsiders), identified by f . Local entrepreneurs
face the social obligation to support their relatives. We assume that they have to pay a
tax T ≥ 0 to their family. We focus on a lump sum tax as it is a priori less distortive than
a proportional tax. If productive inefficiency occurs in the local firm, it will not be related
to the structure of the family tax. Moreover a lump sum tax is also less demanding in
term of information acquisition. By contrast to implement a proportional tax on profit
the entrepreneur’s relatives need to observe the profit of the firm. The empirical evidences
mentioned in the introduction show that the local entrepreneurs will do everything they
can to hide this information (see Jakiela and Owen (2010), Nillesen, Beekman, and Gatto
(2011), Balland et al (2012)). Nevertheless our results are robust to the introduction of
a proportional tax (see the discussion below).
The entrepreneurs can pay the family tax either directly in cash or they can pay it by
hiring their relatives for a wage w. Since they are chosen for their family connexion, needy
relatives tend to be less efficient than regular workers chosen for their sheer ability.6 The
productivity of one unit of labor by a relative is β ≤ 1, while a regular worker productivity
is 1. The amount of productive labor available to a local firm is
Ll = L+ βLf (2)
where Lf is the number of family members hired in the local firm and L the number of
regular workers. By contrast a regular firm hires workers for their ability. The amount
of productive labor available is simply Lf , the number of workers hired by the firm.
Lf = L (3)
Finally becoming formal usually involved sunk cost in the form of entry/registration
fees in developing countries. Adding such fixed costs to the formal sector entry would
not change the results of the paper as both type of firms, local and foreign, would have
to pay it. We thus avoid introducing new notation by assuming that it is nil. In what
follows we study the benchmark case of a foreign entrepreneur.
6The entrepreneur is confronted with a cream-skimming problem. The most productive and educatedrelatives are able to find a position elsewhere or can become also entrepreneur. The people who ask forpermanent help in the form of a job are the less productive.
7

2.1 Entrepreneur without family liability
We study the incentive an individual might have to become a formal entrepreneur. She
might work for a wage w or use her time to become an entrepreneur. Entrepreneur is
credit constrained so that she can borrow at most K. Without any loss of generality the
price of the output is normalized to 1. Since the stock of capital that can be invested
is constrained by K, the entrepreneur optimizes her profit with respect to L for any K.
The objective function of the entrepreneur is
maxL
Πf (L) = θKαL1−α − wL− rK. (4)
The first order condition is
(1− α)θKαL−α − w = 0. (5)
It is easy to check that the profit function is concave in L. The optimal employment
level is:
Lf =
((1− α)θ
w
) 1α
K. (6)
Substituting Lf in (4), the profit of the foreign entrepreneur with ability θ and a stock
of capital K is:
Πf (θ) =
[α
1− α
((1− α)θ
w1−α
) 1α
− r
]K. (7)
Πf (θ) is linear in K, which implies that the optimum is reached either for 0 or for
the maximum value. We deduce that the agent with ability θ and borrowing capacity K
will choose to become an entrepreneur if her profit is higher than her earning as a wage
worker. That is, if Πf (θ) ≥ w. In this case she chooses to invest the maximum possible
amount K in her firm. Let θf (K) be the value of θ so that Πf (θ) = w.7
θf (K) =
(w + rK
K
)αw1−α
αα(1− α)1−α (8)
7If we add entry sunk cost to the formal sector, F , the profit is decreased by this amount so thatthe entry condition simply becomes Πf (θ) ≥ w + F . One can easily generalized the paper results bysubstituting in what follow F + rK to rK.
8
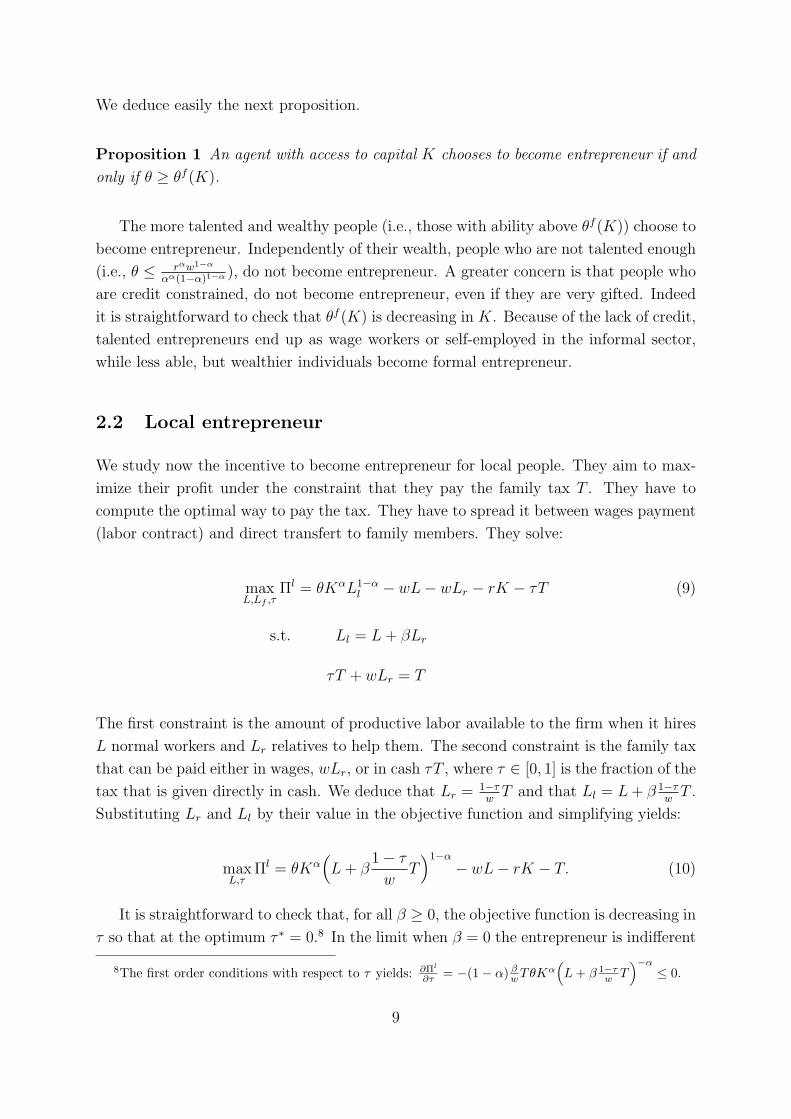
We deduce easily the next proposition.
Proposition 1 An agent with access to capital K chooses to become entrepreneur if and
only if θ ≥ θf (K).
The more talented and wealthy people (i.e., those with ability above θf (K)) choose to
become entrepreneur. Independently of their wealth, people who are not talented enough
(i.e., θ ≤ rαw1−α
αα(1−α)1−α), do not become entrepreneur. A greater concern is that people who
are credit constrained, do not become entrepreneur, even if they are very gifted. Indeed
it is straightforward to check that θf (K) is decreasing in K. Because of the lack of credit,
talented entrepreneurs end up as wage workers or self-employed in the informal sector,
while less able, but wealthier individuals become formal entrepreneur.
2.2 Local entrepreneur
We study now the incentive to become entrepreneur for local people. They aim to max-
imize their profit under the constraint that they pay the family tax T . They have to
compute the optimal way to pay the tax. They have to spread it between wages payment
(labor contract) and direct transfert to family members. They solve:
maxL,Lf ,τ
Πl = θKαL1−αl − wL− wLr − rK − τT (9)
s.t. Ll = L+ βLr
τT + wLr = T
The first constraint is the amount of productive labor available to the firm when it hires
L normal workers and Lr relatives to help them. The second constraint is the family tax
that can be paid either in wages, wLr, or in cash τT , where τ ∈ [0, 1] is the fraction of the
tax that is given directly in cash. We deduce that Lr = 1−τwT and that Ll = L+ β 1−τ
wT .
Substituting Lr and Ll by their value in the objective function and simplifying yields:
maxL,τ
Πl = θKα(L+ β
1− τw
T)1−α
− wL− rK − T. (10)
It is straightforward to check that, for all β ≥ 0, the objective function is decreasing in
τ so that at the optimum τ ∗ = 0.8 In the limit when β = 0 the entrepreneur is indifferent
8The first order conditions with respect to τ yields: ∂Πl
∂τ = −(1− α) βwTθKα(L+ β 1−τ
w T)−α
≤ 0.
9

between hiring her relatives or paying a cash transfer. This result is collected in the next
proposition.
Proposition 2 Independently of the value of β ≥ 0 a local entrepreneur always prefers
to pay the family tax by hiring his relatives in the firm.
The result in Proposition 2 is very robust. First, as shown in Appendix 6.1, it does not
depend on the specific form of the production function. Any other regular production
function leads exactly to the same result. Second it does not depend on the way the
family tax is computed. For instance with a proportional tax with rate t on profit, the
tax constraint becomes tΠl = wLr + τΠl. The amount that the entrepreneur needs to
pay in cash (i.e., without any labor compensation) is τΠl = tΠl−wLr. The entrepreneur
then maximizes Πl(1 − τ) = Πl(1 − t) + wLr such that Πl = θKα(L + βLr)1−α − wL −
wLr − rK. This objective function increases with Lr. The entrepreneur, who has to pay
a proportional profit tax to her family, pays it preferably in wages in exchange of labor
supply.
The result in Proposition 2 is not obvious economically because by hiring relatives the
entrepreneur reduces the productivity of the firm, and thus its profit. This is especially
true when β is very low. However it is optimal from the entrepreneur point of view.
Indeed she is not interested in maximizing productive efficiency, nor the firm’s profit.
She is interested in maximizing her net revenue. The entrepreneur who has to pay a tax,
would rather get some compensation in kind for it, rather than nothing. Family taxation
is thus socially distortive because it creates an incentive to hire inefficient workers. It
pushes the local firms away from the productive efficiency frontier. In practice formal
entrepreneurs pay the family tax both by employing their relatives and by direct cash
transfers. Indeed some of the requests they face are small and one shot (e.g., for funerals,
weddings, hospital fees, medicines) while others come from people who live too far away
or are too young to work (e.g. for schooling or migration costs). In these cases they
cannot make them work in exchange for their financial support. They thus also give cash
to people who are not employed in their firm.9
We next compute the optimal employment level in the local firm. It is easy to check
that the objective function is concave in L. The first order condition, which is also
sufficient, is:∂Πl
∂L= (1− α)θKα
(L+ β
1− τw
T)−α− w = 0. (11)
9We are grateful to Marcel Fafchamps for pointing out this fact.
10

Since τ ∗ = 0 we have L∗r = Tw
so that equation (11) is equivalent to:
(1− α)θKα(L+ β
T
w
)−α= w. (12)
The quantity of external labor that maximises the firm profit is:
L =
(θ(1− α)
w
) 1α
K − βTw. (13)
Depending on the parameters values, L is not always positive. The optimal level of
external hiring for a local firm is:
L∗ = Max
{0,
(θ(1− α)
w
) 1α
K − βTw
}. (14)
We deduce that L∗ > 0 if and only if θ > w1−α
(βTwK
)α. In order to rule out corner solution
(i.e., L∗ = 0) in the sequel of the paper we make the following assumption.
A2 α + β ≤ 1.
We will check later that assumption A2 implies that if an individual chooses to become
a formal entrepreneur then her θ is large enough so that L∗ > 0 (i.e., θ > w1−α
(βTwK
)α).
Substituting L∗r and L∗ in the profit function (9), the entrepreneur earning is:
Πl(θ) =
[α
1− α
((1− α)θ
w1−α
) 1α
− r
]K − (1− β)T. (15)
Let ∆Π = Πf (θ)− Πl(θ). Comparing (7) and (15) yields:
∆Π = (1− β)T ≥ 0. (16)
Since they have to pay a tax to their relatives, it is intuitive that local firms’ profit is
smaller than foreign firms’ profit. However the gap is smaller than T and decreases with
β. In the limit, when β = 1, the two types of firms are equally profitable. This result
illuminates that local entrepreneurs have very strong incentives to help their relatives by
employing them, rather than by giving direct cash transfers. By doing so they lower the
burden of the family tax and are able to somehow close their revenue gap. They also
have incentive to train them in order to increase β. We will check in the empirical section
whether they use training in this way or not.
11
We next compute the threshold value θ so that a local individual is willing to become
an entrepreneur. The agent with characteristic θ and K will choose to become an en-
trepreneur if her profit is higher than her earning as a wage worker. That is, if Πl(θ) ≥ w.
Let θl be the value of θ so that Πl(θ) = w.
θl(K) =
(w + rK + (1− β)T
K
)αw1−α
αα(1− α)1−α (17)
The agent chooses to become an entrepreneur in the formal sector if and only if
θ ≥ θl(K). One can checked that θl(K) > w1−α
(βTwK
)αis equivalent to w+rK
βT+ 1−β
β>
α1−α , which is always true under assumption A2. Then if an agent becomes a formal
entrepreneur she necessarily chooses a strictly positive level of external labor L∗ > 0.
Comparing next equations (8) and (17) an autochtone with capital K and ability θ is at
a disadvantage to become an entrepreneur compared to a foreigner: θl(K) ≥ θf (K).
Proposition 3 Local people choose to become entrepreneur if and only if θ ≥ θl(K) ≥θf (K).
It is straightforward to check that θl(K) is decreasing and convex in K. Moreover
if w ≤ 2K, θf (K) is also convex in K. Figure 1 illustrates Proposition 3 under the
assumption that w ≤ 2K. The horizontal axis represents the stock of capital available to
the individual, while the vertical axis represents the individual’s ability. In the dashed
area, below the curve θl(K), are the individuals who choose to work for a wage, while
the region above the curve represents those who become entrepreneur.
As illustrated Figure 1 local people become less often entrepreneur in the formal sector
compared to their foreign counterparts. It is interesting to check how the gap between
local and regular entrepreneurs entry decision, ∆θ(K) = θl(K)− θf (K), evolves when K
increases. One can easily check that:
d∆θ(K)
dK≤ 0. (18)
The entrepreneurship gap is larger for countries where credit constraints are tighter.
This is likely to be the case in the poorest countries. These are also countries where the
social obligation to help relatives is the strongest. With small level of capital available
for potential entrepreneurs the family taxes weight heavily on the growth of the formal
productive sector, and thus on the economy.
It is important to stress again that although the theory developed in this section use
a specific functional form for production technology, we show in the Appendix 6.1 that
12
our results are not driven by any specific functional form and hence the Cobb-Douglas
technology used here is made for the sake of simplicity and ease of economic interpretation
only.
-
6
θ
Wage workers
K
Figure 1: Entrepreneurship decision for locals and foreigners
0
rαw1−α
αα(1−α)1−α
θf (K)θ`(K)
Entrepreneurs
���
%%%%%%%%%%%%%%
�����������
��������
#######�
�����
�����
������������
�����������
����������
���������
���������
��������
��������
��������
3 Empirical Analysis
We want to assess how the forced mutual help constraint impacts entrepreneurship in Sub-
Sahara Africa. The empirical analysis proceeds in two steps. In the first step we check
that the data are consistent with the predictions of the model. In a second step we run
structural estimations of the model to estimate the percentage of missing entrepreneurs.
3.1 Implications of the Model
The theory implies that local entrepreneurs pay the family tax preferably by hiring their
relatives (Proposition 2). They should thus hire significantly more through informal
13

means than their foreign counterparts. Moreover if the theory is accurate the labor force
of local firms is less qualified and less competent than the labor force of other type of
firms. We study the labor force composition (i.e., the proportion of unqualified workers)
to assess the relevance of this point. We also look at the training programs offered by
the firms to their different type of employees. Indeed if workers are hired because of
forced solidarity and not because of their qualifications, the local entrepreneurs might
want to train them to make them more productive and hence reduce their profit gap
1 − β. Focusing on the level of employment, the theory predicts that, everything else
being equal, a local firm has a larger labor force than a regular firm:
LlKl
=
(θ(1− α)
w
) 1α
+ (1− β)T
wKl
≥ LfKf
=
(θ(1− α)
w
) 1α
. (19)
where Ll = L∗+L∗r, with L∗ being defined in (14) and L∗r = Tw
, and with Lf being defined
in equation (6).
Finally comparing the labor productivity of a local firm, yl =θKα
l L1−αl
Ll, with the labor
productivity of a foreign firm, yf =θKα
f L1−αf
Lf, equation (19) implies that local firms are
less productive than foreign ones:
yl = θ
(Kl
Ll
)α
≤ yf = θ
(Kf
Lf
)α
. (20)
3.2 The data
To conduct our empirical analysis we use the Enterprise Survey database maintained
by the World Bank.10 This database compiles surveys from 10,480 enterprises in 31
Sub-Saharan African countries performed between 2002 and 2007.11 Standardized survey
instruments and a uniform sampling methodology were used to minimize measurement
error and to yield data that are comparable across different economies. We have merged
them in a unique database to conduct our analysis of formal entrepreneurship in Africa.
The surveys have been designed to be representative of the formal economy. They
cover small, medium-sized and large enterprises in manufacturing and services sectors.12
10Available at http://www.enterprisesurveys.org/.11The surveyed countries are Eritrea, Ethiopia and Zambia in 2002; Kenya, Lesotho, Mali, Senegal,
South Africa, Tanzania and Uganda in 2003; Benin in 2004; Madagascar, Malawi, Mauritius and Niger in2005; Angola, Botswana, Burkina Faso, Burundi, Cameroon, Cape Verde, DRC, gambia, Guinea, GuineaBissau, Mauritania, Namibia, Rwanda, Swaziland, Tanzania and Uganda in 2006; Ghana, Mozambique,Senegal and South Africa in 2007.
12Manufacturing and service sectors consist of 16 two-digit (ISIC) industry classifications: agro-industry, chemicals and pharmaceutics, construction, electronics, food and beverages, garments and
14

Sample size for the selected industries are large enough to conduct statistically robust
analyses. The surveys provide information on firm performance, firm’s perceptions about
investment climate, and objective measures of the obstacles to firm operations and growth
(see the appendix 6.2 for more details).
We also use Institutional Profiles Database13 as a complementary set of data to assess
the presence of social safety nets within each surveyed country. The Institutional Profiles
Database presents a set of indicators on the institutional characteristics of 123 developed
and developing countries covering 96% of the world population and 99% of world GDP.
There are various institutional characteristics. For the purpose of the present analysis
we focus on the institutional solidarity index available for 2001, 2006 and 2009. This
particular index covers sickness, unemployment and retirement coverage for workers. For
each of these coverage a score between 0 (no protection) and 4 (large protection) is
attributed.14 Using these 3 scores, an Institutional Solidarity Index (ISI hereafter) is
computed for each year as the sum of the 3 scores weighted by the standard deviation
(for all the countries). As the timing of both database differs and considering that
institutional solidarity is less volatile than firms’ performances we compute the average
ISI between 2001, 2006 and 2009. Hence, we have one ISI for 21 over the 31 countries
surveyed by the World Bank. This index goes from the minimum 0.00 for Namibia to
2.72 for Mauritius.
The information about entrepreneurs nationality is not available in Enterprise Sur-
veys. However there is the ownership structure of the firms. Hence, the key variable
used throughout the paper is the firm’s ownership status. To proxy entrepreneurs type,
between ”local” and ”foreign”, we make the assumption that an entirely domestically
owned firm is run by a local manager. Whereas a firm financed (even marginally) by for-
eigners cannot be classified as a local family business. In particular it can escape forced
family taxation by appointing a foreign manager. We distinguish entirely domestically
owned firms, labeled ”private domestic firms”, from others (i.e., mixed or fully foreign
ownership structures) labeled ”private foreign firms”. As shown in table 1 in the ap-
pendix our classification works well to pin down local family businesses. Indeed in more
than 98% of the cases the largest shareholder in these entirely domestically owned firms
is an individual and/or a family, and in 85% of the cases this individual (or a family
member) is the manager of the firm. By contrast in ”private foreign firms” the largest
shareholders are, in addition to individual or family members, a foreign company (i.e., in
71% of the cases). Moreover when the ”private foreign firm” is own by an individual or
leather, hotels and restaurants, IT services, metals and machinery, mining and quarrying, non-metallicand plastic materials, paper, retail and wholesale trade, textiles, transport, wood and furniture.
13http://www.cepii.fr/anglaisgraph/bdd/institutions.htm14With 0 if there is no coverage by public or private institutions for sickness, unemployment or un-
employment. When such coverage exist, grade from 1 (small proportion of the population covered) to 4(very large proportion of the population covered)
15

a family member this individual is significantly less often the manager of the firm than
in ”private domestic firms”.
A first look at the data shows that foreign firms are significantly larger than domestic
ones. Table 2 in the appendix shows that roughly 64 % of private domestic firms have
less than 20 workers, compared with 36 % for private foreign ones. Conversely, only
9 % of private domestic firms have more than 100 employees, compared with 31 % of
private foreign ones. Moreover the average workforce is systematically and significantly
(at the 1 percent level) smaller in domestic firms than in foreign firms. This seems to
contradict the theory above as we predict larger workforce in local firms. However the
theoretical result holds true ”everything else being equal”. In practice the local firms
might try to cope with their relatively low quality workforce by specializing in industries
that do not required high skilled workers. Table 3 in the appendix shows that local
firms tend to specialize in services and traditional industry such as wood and furniture
or garments and leather, while foreign firms tend to specialize in more high-tech industry
such as agro-industry, chemicals and pharmaceutical, or plastic material. They are also
significantly more present in textile and construction. Finally local and foreign firms
might face different constraints on the credit market. Statistics in table 4 on credit and
financing shows that foreign firms have more often an overdraft facility or a line of credit
(generally in a private commercial bank), when they contract a loan it is collateralized
more often by machinery and intangible asset and less often by personal assets than in
domestic firms. Domestic firms are discouraged more often than foreign ones to apply for
a loan (although they claim more often to need one) by the complexity of procedures, the
high interest rates, the collateral requirements, or simply because they think they will
not get it.15
If entrepreneurs face social pressure to hire their relatives this should show in the
means used by firms to find new workers. Table 5 in the appendix shows that domestic
firms rely heavily on informal sources to meet their recruitment needs. In roughly 63%
of the cases they use family and/or friends networks to hire new employees, in sharp
contrast with private foreign firms which rely in 60% of the cases on other means than
family network to hire new employees (i.e. essentially public announcements and public
or private placement offices).
Our theory highlights that the social pressure which forces local entrepreneurs to hire
their relatives translates into a relatively poor quality of the workforce in local firms. The
descriptive statistics of the labor force composition presented in Table 6 in the appendix
reveals an over representation of unqualified workers in these firms. The supervision
15Domestic firms also have their financial statement reviewed far less often by an external auditor thanforeign ones. This might be the result of a deliberate strategy of the owner/manager to hide the truefinancial state of his firms to his relatives.
16

ratio, which is the number of non production workers over the number of production
workers, is almost 14% lower in private domestic firms than in foreign ones. Moreover,
not only production workers are over represented in private domestic firms, they are also
significantly less educated. Indeed, the proportion of firms with an average education
level of a production worker below 6 years is significantly higher (i.e., by 10 percentage
point) in domestic firms.
If it is true that local entrepreneurs hire their relatives because of social obligations
and not because they need them, they have to find a way to overcome their lack of
qualification. Table 7 presents internal training schemes proposed by firms to their em-
ployees. The proportion of firms offering training is much lower (i.e., by 20%) for domestic
firms than for foreign ones. However, when domestic firms do offer such programs, they
train more their production workers (i.e., 70% of them) compared to foreign firms (58%
of them). Moreover, among production workers, domestic firms tend to target more
unskilled ones compared to foreign firms, although the difference is not statistically sig-
nificant. Finally, the length of the training periods is significantly greater in domestic
firms. In other words, when they are able to offer training programs, domestic firms train
more their (unskilled) production workers than their foreign counterparts.
We might consider an alternative set of explanations that may produce similar em-
pirical results. In particular family workers might actually be a preferred alternative
for many purposes. Suppose there is a problem of adverse selection, particularly among
uncredentialed workers. Family firms would then use information rents to attract less
educated (but of better quality, at least per unit dollar) workers, train them more (be-
cause they will stay around longer), and need to use less supervision because they are
more trustworthy. As domestic firms recruit more through family and friends, they may
need to monitor less their production workers as some peer pressure may take place in
these local firms. There is actually some evidence that networks play precisely this role of
allocating less credentialed workers into higher skilled occupations in a different cultural
context (see Munshi 2003 and 2011).16 Another positive impact of family firms is that
they might somehow ease credit and insurance markets constraints. This is at least what
Grimm et al. (2011) suggest to explain that local family network within the city have
positive effects on factor use and added value in their sample of informal firms.17 This is
also consistent with our data: local firms rely significantly more, although modestly, on
family and friends to finance their working capital and their new investment than foreign
firms (see table 4).
16We are grateful to Andrew Foster for suggesting this discussion.17However they also find, consistently with our study, robust negative effects associated with social
networks tied to the village of origin. These effects get diluted with geographical distance, probablybecause with rising distance it is easier to hide the generated income and to protect it from abusivedemands.
17

0
10 000
20 000
30 000
40 000
50 000
60 000
70 000
80 000
Private Domestic Firms Private Foreign Firms
Small Firms (< 20)
Medium Firms (20-99)
Large Firms (>100)
Figure 2 : Profit ($) per employee according to ownership and size.
To assess which of the positive or negative ”family” effects dominate in the formal
sector in Sub-Sahara Africa we need to look at firms’ profitability. Our theoretical model
emphasizes that domestic firms should perform poorly compared to the other firms: The
social pressures born by local entrepreneurs lead to an inefficient allocation of labor
which reduces local firms’ productivity. By contrast if family members are the preferred
alternative of the firm manager because he is able to sort them out and pick among
his uneducated relatives the most able and trustworthy workers, we should observe that
local firms perform better than the foreign ones. Figure 2 highlights that domestic firms
are less productive than foreign ones. One could argue that this lower productivity is a
consequence of the fact that small firms prevail within domestic firms. However, table 8
in the appendix shows that medium and large size domestic firms are significantly less
productive than their foreign counterparts. For the small size firms the difference in
productivity is large but not significant due to the large variance in this group (i.e., small
firms are quite heterogeneous in term of profitability). Another piece of evidence can be
found in cases studies. Henry (1996, 2003) has studied successful African firms in the
18
formal sector. He shows that key to these firms success is the fact that they have found
ways to limit the burden of the forced mutual help constraint.18
Although these descriptive statistics are consistent with our theoretical results, the
differences in workforce composition, training schemes or profitability can be due to other
firms’ characteristics. We now turn to the regression analysis to check the robustness of
these preliminary results with a more complete set of controls.
3.3 Regression results
The variables used in the regressions are described in Table 9 in the Appendix. In each
specification we control for the country and the year in which the survey was run, the
economic sector or activity, as well as the firms’ size and the average education level of
the workforce.
(REGRESSION 1)
In the first set of regressions we focus on the prediction related to the workforce
composition. Our dependent variable is the labor to capital ratio (in log). We regress
this variable over a dummy variable controlling for the type of the firm (100 % of the firm
is owned by the domestic private sector). In all the regressions our variable of interest,
or its interaction term, is positive which is the expected sign and is significantly (at the
1 percent level) different from 0.
Column 1 controls for basic workforce and firms’ characteristics such as age, location,
stock of capital and export status. It also controls for firms’ degree of modernity through
an ISO certification dummy and for the presence of trade union and training programs
within the firm. Young, exporting firms with an ISO certification have more capital
intensive production process than the other firms. Interestingly, firms declaring that
they face difficulties to find adequately educated workers are also more capital intensive.
Descriptive statistics show that foreign firms are more concerned by this problem than
domestic firms. As a result foreign firms might try to cope with the relative penury
of educated workers by training them. Then local and foreign firms use training in a
different way. Private domestic firms offer training programs to cope with the constraint
of compulsory hiring of unskilled (or inadequate) workers, and thus target blue collars,
while foreign firms focus on white collars.
18The strategy of these successful firms include recruitment by external agency and placement officeto limit the burden of hiring relatives, the development of very detailed procedure books for workers,including managers, to help them oppose inappropriate requests from their extended family, the divisionof task so that it requires at minimum two persons to complete one task. This last strategy has provento be very successful to collect bills in a private water company by helping the agents to oppose demandfrom their acquaintances to waive their bills (see Henry 1996 and 2003).
19

To assess the relevance of this idea we introduce in the second specification (column 2)
the interaction of training programs with our variable of interest (100 percent of the firm
is domestically owned). If training practices are the same in local and in foreign firms we
do not expect this interaction term to be significantly different from 0. The interaction
term is positive and highly significant (at the 1% level), while the variable 100 percent
of the firm is domestically owned becomes insignificant. The training dummy, which
is negative, becomes highly significant. Foreign firms that offer training programs have
significantly lower labor to capital ratio than domestic ones. These more capital intensive
firms have more complex production technology. Training programs help them to match
workers’ skills with technology complexity. By contrast private domestic firms that offer
training programs have higher labor to capital ratio. In magnitude it cancels out the
effect of having a training program suggesting that these local firms do not manage to
reduce their labor to capital ratio through training.
Introducing different variables measuring firms’ access to credit (overdraft or credit
facilities, access or cost of financing as a major or severe constraint for firms and a
dummy controlling for the fact that 100 percent of firms’ working capital is financed
through internal funds) in column 3, 4 and 5 do not change these basic results. However
these new sets of regressions confirm that firms are credit constrained. When they have
overdraft or credit facilities they adopt more capital intensive technologies.
Since domestic firms might be more credit constrained than firms owned by foreigners,
controlling for the type of industry or activity, they might be obliged to specialize in
more labor intensive technologies. To check the relevance of this idea we introduce in
columns 4 and 5 an interaction term between having an overdraft or credit facilities
and being a domestic firm. This interaction term is negative, which is the expected
sign, but it is not significantly different from zero, suggesting that the credit constraint
does not play differently for local and foreign firms. To further disentangle credit and
labor market effects in column 5 we add the interactions between training programs and
domestic firms, and between access to credit and domestic firms. The result is the same
as in column 2: the excessive proportion of workers in local firms seems to be related
to their inadequate skills rather than to technological choice due to credit constraints.
Private domestic firms that offer training sessions display a significantly (at the 1% level)
more labor intensive technology than their foreign counterparts. Firms are also credit
constraint as the overdraft or credit facilities dummy is negative and highly significant.
In other words, local firms face constraints both on the credit market and on the labor
market, and the labor market constraint is specific to them.
In practice social pressure on domestic entrepreneurs to redistribute their wealth is
related to the absence of social security. If the problem is indeed the lack of public safety
net, in countries which offer more social protection local entrepreneurs should be under
20
less pressure to hire their relatives. To assess the relevance of this idea, we split the
countries sample in two subsamples according to the ISI index described section 3.2. One
sub-sample, labeled ”Worse Solidarity Sample”, includes the countries presenting a rela-
tively low institutional solidarity (ISI below the countries sample median), while the other
one, labeled ”Better Solidarity Sample”, includes the countries characterized by a higher
institutional solidarity (ISI above the sampling median). There are 7 countries (Benin,
Botswana, Ghana, Kenya, Mauritius, Senegal and South Africa) which are classified as
having better institutional solidarity and 14 countries (Angola, Burkina Faso, Cameroon,
DRC, Ethiopia, Madagascar, Mali, Mauritania, Mozambique, Namibia, Niger, Tanzania,
Uganda, Zambia) which are classified as having worse institutional solidarity. Table 10
in the appendix reproduces the set of regression 1 column 2 (interaction between training
programs and domestic firm) and column 5 (interaction between training programs and
domestic firms, and interaction between access to credit and domestic firms) separately
for the two samples. The econometric results are consistent with the theory. In the better
solidarity sample the training dummy and the interaction between training programs and
domestic firms loose their significance which is the expected result if the local firms face
less pressure to hire their relatives and thus face similar hiring constraints than foreign
ones. In contrast in the worse solidarity sample, they are highly significant. This suggests
that in the worse solidarity sample domestic firms are constrained by the low quality of
their workforce mainly hired from extended family and relatives. Some of them try to
mitigate this problem through internal training programs as shown in the tables.
As a last robustness check we run a set of regressions with the proportion of production
workers as dependant variable (see Table 11 in the appendix). The preceding result
suggests that local firms are more labor intensive and use training in a different way than
foreign firms (i.e., to deal with their unqualified blue collars). This result is confirmed
here. Being a domestic firm increases significantly the proportion of production workers
compared to a foreign firm with similar training scheme (or absence of it). Moreover the
interaction term between training programs and domestic firms dummies is negative and
significant (at the 1% level). It is large as well. The proportion of production workers is
lower in a local firm with a training program than in a local firm without such program.
Interestingly the training dummy is still significant but it becomes positive. Foreign firms
that do training have a larger proportion of production workers. The two variables are
thus complement for foreign firms, while there are substitute for local firms. This confirms
that they do not fill the same purpose. Finally when we add the three coefficients, the
total effect of being local and having a training program is positive. Local firms manage
to reduce the proportion of production worker through training, however not to the point
reached by foreign firms.
(REGRESSION 2)
21
According to the theory, labor productivity should be smaller in local firms. We test
the impact of being a local firm on labor productivity in regression 2. The dependant
variable is the total sales per employee.19 We use the same specifications as in the previous
regressions. The results are consistent with the predictions of the model: everything else
being equal, a local firm has a significantly lower productivity of labor than a foreign one.
According to our estimations the total sales per employee (in dollars) in a local firm is
lower by a percentage which varies between 30% and 37%.
Exporting firms, firms having an ISO certification, firms with higher stock of capital,
or firms with trade unions display significantly higher labor productivity. Surprising at
first sight the last result is consistent with the fact that trade unions are not found in local
private firms mainly composed of the owner relatives. Extended family members do not
syndicate. In the African context the presence of trade union signals a fairly modern firm
with sophisticated labor relationship. More importantly firms enjoying overdraft or credit
facilities are systematically more productive. These results confirm again that firms in
Africa are credit constraint. Foreign firms that offer training program are generally more
productive than firms without such programs. By contrast there is no specific effect of
training on the productivity of domestic firms (see columns 2 and 5). This result suggests
that training programs are not very effective at alleviating the major labor productivity
problem burdening local firms. In particular it does not compensate for the very strong
negative impact of being 100% domestic on the total sales per employee ratio. The local
firms’ challenge is thus twofold: to gain a better access to the credit market and to
manage their poorly qualified relatives.
In regression 12 in the appendix we conduct a robustness check by running the la-
bor productivity regressions separately for the better and worse institutional solidarity
samples. As expected, being a domestic firm affects significantly and negatively labor
productivity under worse institutional solidarity sample only. Moreover exporting, hav-
ing an ISO certification, a larger stock of capital, an overdraft or credit facilities are
significantly correlated with a higher labor productivity. When firms do operate under
better institutional solidarity, firms’ location, ISO certification, capital stock and training
programs are the only variable that positively correlated with labor productivity.
19This variable is a better measure of productivity than the profit per employee as it minimizesmeasurement errors and endogeneity problem. Indeed sales data is easy to collect (i.e., it is just afigure), while profits data is subjected to measurement errors because it is computed from the sales andestimation of the costs. For the sake of completeness we have nevertheless run regressions with the profitper employee and the results are similar with the results in regression 2 (computations available uponrequest).
22

4 Structural estimation
The preceding section conveyed only one part of our story which was to analyze firms
and agents behavior among those who are entrepreneurs. Consistently with the experi-
ments and the cases studies mentioned in the introduction, our descriptive statistics and
regressions show that the forced mutual help constraint distorts labor management in
local African firms. In this section, we thus focus on the other part of the story by taking
into account those who decided not to become entrepreneurs, that is, wage-workers. The
goal is to measure the impact of social pressures on individuals decision to become for-
mal entrepreneurs. The structural estimation therefore uses data on workers employed in
formal firms. One of the interesting things about the structural estimates of the model is
that it allows us to estimate the proportion of missing African entrepreneurs, that is, the
proportion of individuals who would have chosen to become entrepreneurs if they were
not subject to potential social pressures.
4.1 Estimation procedure
Our structural estimation proceeds as follows. We start by making a parametric assump-
tion over the distribution of talent. We then identify entrepreneurs versus wage-workers
in our sample and use the distributional assumption of talent to provide estimates of our
theoretical model. The estimation of missing entrepreneurs then follows by computing
the gap between threshold ability levels of becoming entrepreneurs for foreign and local
entrepreneurs.
Since the entrepreneurial talent θ is not observable by the econometrician we make
a structural assumption over its distribution in order to estimate the model. Formally,
we assume that the entrepreneurial ability is correlated with education and experience.
However, we allow these correlations to differ between locals and foreigners to account for
the possibly differences in the quality of education or experience across the two groups.
Denote by F the set of foreigners and L the set of locals. The ability equation is given
by:
ln θi =
δ0f + δ1f ln(1 + Si) + δ2f ln(1 +Xi) + εif , if i ∈ F
δ0l + δ1l ln(1 + Si) + δ2l ln(1 +Xi) + εil, if i ∈ L(21)
where Si are the years of education of agent i, and Xi are years of experience of agent i.
The error terms εif and εil are assumed to be independently and normally distributed
across agents, with mean 0 and variances σ2f and σ2
l , respectively. This log-linear specifi-
cation of the talent distribution has also been considered by Evans & Jovanovic (1989),
23

and Paulson, Townsend & Karaivanov (2006). In the Appendix 6.5 we relax the nor-
mality assumption to allow for unknown distributions of εif and εil (i.e., semiparametric
estimations) and hence check the validity of the normality assumption.
The allocation of agents in entrepreneurship (Ei = 1) and wage work (Ei = 0) can be
modeled by Ei =
{I{θi ≥ θif}, if i ∈ FI{θi ≥ θif}, if i ∈ L
where I{·} is the indicator function that equals 1 if its argument is true and 0 other-
wise. The critical ability thresholds θif and θil that determine entrepreneurial decision
for foreigners and locals are those given in Equations (8) and (17). Note that the con-
dition θ ≥ θf is satisfied by both local and foreign entrepreneurs. However, because of
family liability, satisfying θ ≥ θf does not necessarily imply that one is an entrepreneur.
The probability of becoming entrepreneur (including both foreigners and locals) in our
economy is given by
Pr[Ei = 1] = Pr[Ei = 1|i ∈ F ] Pr(i ∈ F) + Pr[Ei = 1|i ∈ L] Pr(i ∈ L)
= (1− pi) Pr(θi ≥ θif |i ∈ F) + pi Pr(θi ≥ θil|i ∈ L)
where pi is the probability that agent i is a local (i.e., is an agent with potential family
liability).
Denote by Ki the amount of capital used by the agent. Because agent i is not neces-
sarily an entrepreneur, this variable is not observed for all individuals. We therefore need
to construct a suitable measure for the agent’s capital or potential capital. We use two
approaches: The first one, which is presented in the main text, is to exogenously fix the
capital of agent i to be the sample mean of the capital used by the firms in the country in
which agent i operates.20 Agents operating in the same country therefore face the same
amount of capital. This way, estimated variations in decisions can be interpreted as due
to other conditions than capital constraints. The second approach, which is presented in
the appendix 6.4, is to take Ki as the actual capital of the agent if he is an entrepreneur.
If agent i is a wage-worker, Ki is taken to be his total labour income (including salary,
allowances and benefits) topped up with the amount he would be willing to pay for an
HIV test.21
The vector [1, Si, Xi, Ki, wi, ri, ]′ is the vector of observable characteristics of agent i.
20The capital of a firm is calculated as the three-years average of the total annual investment of thisfirm. A better proxy would be the yearly book value of the firm, but very few firms reported this amount.
21A better proxy would have been their total wealth including savings and other belongings, butour data are drawn from enterprise surveys rather household surveys and therefore do not contain thisinformation. However, since income is likely related to savings and the amount the worker is willing topay for a HIV test likely correlated with their wealth, this variable gives information that reasonablydifferentiate workers in their capacity of obtaining capital for their business venture.
24

wi and ri are the average wage and the average borrowing interest rate in the commercial
banks observed in the country in which agent i operates.22
Plugging the expression of θif given by formula (8) and of θil given by formula (17)in the above equation, we get
Pr[Ei = 1] = (1− pi) Pr{
ln θi ≥ α ln(wi
Ki+ ri
)− α lnα− (1− α) ln(1− α) + (1− α) lnwi
∣∣i ∈ F}+ pi Pr
{ln θi ≥ α ln
(wi
Ki+ ri + (1−β)Ti
Ki
)− α lnα− (1− α) ln(1− α) + (1− α) lnwi
∣∣i ∈ L} .The data available do not contain information about the family tax Ti transferred by
agent i. However, Equation (16) from the theoretical model predicts that Πf (θi)−Πl(θi) =(1−β)Ti. Therefore we can use the data to approximate (1−β)Ti with ∆Πi, the averagedifference of profits between foreign and local firms in the country in which agent ioperates. Denote by Zi = [1, Si, Xi, Ki, wi, ri, pi,∆Πi]
′ the vector of observable datarelative to agent i. Using the specification (21) we then get
Pr[Ei = 1|Zi] = (1− pi)Φ(
1σf
{γ0f + δ1f ln(1 + Si) + δ2f ln(1 +Xi)− α ln
(wi
Ki+ ri
)− (1− α) lnwi
})+ piΦ
(1σl
{γ0l + δ1l ln(1 + Si) + δ2l ln(1 +Xi)− α ln
(wi
Ki+ ri + ∆Πi
Ki
)− (1− α) lnwi
})= H(Zi, ψ).
(22)
where γ0j = δ0j + α lnα + (1− α) ln(1− α), j = f, l, and Φ(·) is the cumulative density
function of the standard normal. For the estimation, we take pi as the proportion of
foreigners in the sample. The vector of parameters ψ = [δ0f , δ1f , δ2f , σf , δ0l, δ1l, δ2l, σl, α]′
is then the vector of structural parameters of the model to be estimated.
The sample log-likelihood function of the econometric model can therefore be written
as:
Ln(ψ) =n∑i=1
{Ei lnH(Zi, ψ) + (1− Ei) ln(1−H(Zi, ψ))} (23)
The maximum likelihood estimation is performed by numerically maximizing (23) with
respect to the set of parameters ψ = [δ0f , δ1f , δ2f , σf , δ0l, δ1l, δ2l, σl, α]′. These parameters
correspond to the constant term of the ability distribution, δ0; the interaction between
education and ability, δ1; the interaction between experience and ability, δ2; the standard
deviation of the ability distribution, σ; and the productivity of capital in the production
technology, α.
We now describe a procedure to estimate the proportion of missing African en-trepreneurs, that is, the proportion of talented individuals who rather chose not to beentrepreneurs because of potential social pressures. Our theoretical model predicts a local
22These rates are available on the countries central bank websites.
25

wage-worker i whose ability θi belongs to [θif , θil] is a missing local entrepreneur, withprobability
mi = Pr{θif ≤ θi ≤ θil|i ∈ L}Pr(i ∈ L)
= pi
[Φ(
1σl
{γ0l + δ1l ln(1 + Si) + δ2l ln(1 +Xi)− α ln
(wi
Ki+ ri
)− (1− α) lnwi
})− Φ
(1σl
{γ0l + δ1l ln(1 + Si) + δ2l ln(1 +Xi)− α ln
(wi
Ki+ ri + ∆Πi
Ki
)− (1− α) lnwi
})] (24)
The above equation allows us to estimate the proportion of missing entrepreneurs by
m =1
n
n∑i=1
mi (25)
where mi obtained from (24) by plugging-in the parameter estimates ψ.
4.2 Estimation results
The data used to estimate our structural parameters come from the same Enterprise
Survey data described in Section 3. However, we focus on data regarding Employees
Questionnaires as they contain information about both employers and employees in each
formal surveyed firm. The survey provides information about workers age, position in the
company, experience and qualifications, education, wage/salary and allowances, opinion
about the performance of the firm, etc. Because of many missing/aberrant data in the
Employees Questionnaires they had to be checked and matched with each firms indi-
vidually. Our final database contains six countries with exploitable data: Benin, Kenya
and Senegal, whose institutional solidarity index is above the sample median (i.e., better
solidarity index group) and Mali, Uganda, and Tanzania, whose institutional solidarity
index is below the sample median (i.e., worse solidarity index group).
In our sample, we restrict our definition of entrepreneur to be the top manager who
also is the largest shareholder of the firm. The remaining individuals are considered
wage-workers. The merged data from our countries surveys is composed of 11.3% of
entrepreneurs and 88.7% of wage-workers for the whole sample, while the proportions are
12.5% of entrepreneurs for the better solidarity sample, and 11% of entrepreneurs for the
worse solidarity one. The interest rate faced by each individual is the average observed
interest rate in the country where they operate. Borrowing rate in the sample is 15.9%
with 14.8% for the better solidarity sample, and 18.4% for the worse solidarity sample.
Finally foreign firms represent 18.1% (18.54% in the worse solidarity sample and 17.67%
in the better solidarity one) of all firms.
26

We do not observe the nationality/origin of the workers. If the talent distribution
were the same for foreigners and for locals, it would not matter. However the assumption
of common distribution is rejected by our base case estimates, which show that people
working in foreign and local firms are not drawn from the same distribution of talent.
Foreigners who chose to migrate and to start a business abroad are presumably different
from the local population. We thus consider that foreigner and local people are not
drawn from the same distribution of talent. The problem then is to allocate individuals
between ”local” and ”foreign”. We make the assumption that the workers in a local
firm are local and that the workers in a foreign firm are foreigner. This assumption is
reasonable for the local firms as they recruit essentially through family network, and are
thus populated with local workers. But it is less accurate for foreign firms that recruit
more by formal means and have presumably on board both types of workers (i.e. foreign
and local). It implies that we count as foreigner local people. Since these locals have
been able to find a job in a foreign firm, they are presumably different (i.e. better) than
those who need to rely on their family network for help. In particular some of them
might be talented enough to become an entrepreneur, but have chosen to work as a wage
worker to avoid the burden of sustaining their relatives. Our estimations neglect those
individuals by treating them as wage workers of foreign origin. We hence over-estimate
the talent threshold above which a foreigner becomes an entrepreneur and by the same
token under-estimate the percentage of missing local entrepreneurs.23
Table 4.2 presents the maximum likelihood estimation results for the theoretical model
parameters from our sample. We report estimates for the whole sample, for the better
solidarity sample (containing Benin, Kenya and Senegal) and for the worse solidarity
sample (containing Mali, Uganda, and Tanzania). We also provide P-values for the
comparison of estimates between better and worse stratifications (see last column of
the table). Except for the capital return parameter that has a rather relatively large
standard error in the worse solidarity sample, all structural estimates produce reasonable
parameter values that are significant at 1%. The constant terms of log talent δ0f and
δ0l are estimated at 3.35 for foreigners and 3.65 for locals in our whole sample and are
both lower for the better solidarity sample compared to the worse solidarity one. This
parameter represents the average natural talent of individuals, that is, their minimum
average talent regardless of their education and experience.
The correlation between talent and years of schooling as captured by δ1f and δ1l are
estimated at 0.39 and 0.35 respectively. This means that each percentage increase in
23When we run estimations (not shown here to save space) assuming that the talent distribution isthe same for foreigners and for locals, the percentage of missing entrepreneurs is indeed higher. Howeverthe assumption of common distribution is rejected by our base case estimates.
27

years of schooling is associated with a 0.39% increase in average talent for foreigners
and a 0.35% increase of average talent for locals. The parameters that relate years of
work experience to entrepreneurial talent, δ2f and δ2l, are also estimated to be 0.20
and 0.19 respectively, in the whole sample. This means that 1% increase in years of
work experience is associated with a 0.20% increase in average entrepreneurial talent
for foreigners and 0.19% for locals. These estimates show that education tends to have
higher effect on entrepreneurial ability compared to professional experience. However,
the relationships between education, experience and talent are not necessarily uniform
across solidarity stratifications. Education and experience tend to matter for talent in
countries with worse solidarity more than it does in countries with better solidarity, and
the difference between estimates across these stratifications is strongly significant. In
other words, everything else equal, individuals in countries with worse solidarity need to
accumulate more years of education and experience to be able to compete with those
from better solidarity countries.
The parameter α is estimated to be 0.019 for the whole sample. This means that a 10%
increase in business investment would be associated with a 0.19% increase in profit. This
estimate of α is smaller than those usually obtained for the informal economy (see Grimm
et al. 2011, Kremer et al 2010, Udry and Anagol 2006). This suggests that businesses
in the formal sector operate at a higher scale with low marginal returns though they
face some degree of financial constraints as well. This parameter tend to be significantly
higher for better solidarity countries compared to worse solidarity countries, although it
is not accurately estimated for the worse solidarity sample. Finally, standard deviations
for ability, σf and σl, are larger in better solidarity sample compared to worse solidarity
sample. This is presumably due to the fact that a better institutional environment
attracts a larger variety of talented individuals than a worse institutional environment
does.
Using the estimated structural parameters, we calculated the fraction of the popula-
tion that has values of θ and of other characteristics satisfying the conditions of Propo-
sition 1 and 3, yet prefer wage-work to entrepreneurship because of the social burden
that the latter occupation implies. This fraction of the population is the proportion of
missing African entrepreneurs and our model predicts that they represent about 7.6%
of the overall workforce in the formal sector. This proportion is even higher in coun-
tries with worse institutional solidarity environment. In particular, the difference in the
loss of entrepreneurs across the two stratifications represents a significant proportion of
about 3.4% of the workforce. This finding is consistent with our theoretical model and
descriptive statistics and further testifies that better social safety nets may encourage
28

Table 4.2 : Structural Maximum Likelihood Estimates of the Model
Type Parameter Name Whole Better Worse Differencesample solidarity solidarity Pvalue
Foreigners Log ability - constant δ0f 3.347 2.9401 3.5105 0.0000(0.0005) (0.0006) (0.0019)
Log ability - education δ1f 0.3981 0.4784 0.2886 0.0000(0.0008) (0.0003) (0.0045)
Log ability - experience δ2f 0.2032 0.3934 0.1614 0.0000(0.0172) (0.0002) (0.0037)
Stand. dev. for ability σf 0.6392 0.8913 0.3796 0.0000(0.0019) (0.0003) (0.0075)
Locals Log ability - constant δ0l 3.6510 2.4042 3.9601 0.0000(0.0008) (0.0007) (0.0016)
Log ability - education δ1l 0.3501 0.4041 0.2232 0.0000(0.0004) (0.0002) (0.0037)
Log ability - experience δ2l 0.1948 0.3015 0.1084 0.0000(0.0190) (0.0002) (0.0028)
Stand. dev. for ability σl 0.5019 0.8202 0.2158 0.0000(0.0012) (0.0005) (0.0082)
All Capital returns α 0.0198 0.0709 0.0321* 0.0457(0.0054) (0.0012) (0.0185)
Log-likelihood -2698 -1347.1 -1238.2
Number of Obs. 7834 3962 3872
Frac. missing entrepreneurs m 0.0760 0.0538 0.0877 0.000(0.0029) (0.0032) (0.0042)
Asymptotic standard errors in parenthesis* Not significant
entrepreneurship in Africa by relaxing social obligations. It is important to note that
the 7.6% of missing entrepreneurs obtained here is an underestimated proportion of the
overall missingness. In fact, it only estimates the proportion of formal wage-workers who
are not willing to become entrepreneurs in spite of having good entrepreneurial abilities.
It does not include, for example, possible informal entrepreneurs who have the capacity
of becoming formal but are not willing to do so because they don’t want to send a too
strong signal of successfulness to their family and relatives.
The different robustness checks conducted are reassuringly consistent with our base
case estimates. First when we assume that the talent distribution is the same for for-
eigners and for locals the fraction of missing entrepreneurs is estimated to be 8% for the
whole sample (6.2% for the better ISI sample and 9.5% for the worse one). It is slightly
29

larger than in our base case, which is expected as our base case tends to under-estimate
the percentage of missing entrepreneurs by assuming that all the workers in foreign firms
are foreigners. To save space we do not present these results here because our results
show that the ability distributions of workers in foreign firms is statistically different from
that of locals. Thus, a model with common distribution (which is in fact a special case
of the model with separate distributions) is necessarily restrictive and misspecified as
an equality test across the coefficients from the two respective groups is rejected by the
data.24
Second the estimation results presented in Table 4.2 are those using the first approach
of measuring capital by exogenously fixing it to be the sample mean of the capital used
by the firms in the country in which the individual operates. The results from the
second approach, where capital is measured by the actual capital of the agent if he is an
entrepreneur, and by his total labour income topped up with the amount he would be
willing to pay for an HIV test if he is a wage worker, are presented in Appendix 6.4. The
estimations obtained from this second approach yield a fraction of missing entrepreneurs
of 5.6%. The fraction of missing entrepreneurs in the latter estimation is smaller than
the former. This difference can be understood as follows: in the first case all individuals
are assumed to have access to the same amount of capital which understates the level
financial constraints faced by wage-workers, whereas in practice the constraints they face
are twofold: capital and labor. So in the first case barriers to entrepreneurship can only
be attributed to family tax, whereas in the second case additional credit constraints are
taken into account. Since we do not observe the stock of capital that would be available to
a wage worker if he was willing to start his own business, we proxy it by his labour income
topped up with the amount he would be willing to pay for an HIV test. This amount
is an under-estimation of the capital available to a worker as it does not include his
borrowing capacity, nor the assets he might own and are unknown to the econometrician.
By overstating the constraint the wage-workers face on the capital market this method
gives us a lower bound for the fraction of missing entrepreneurs due to the forced mutual
help constraint.
Third in examining the semiparametric results, presented in the Appendix 6.5, the
following facts are notable. Overall, the results from the parametric and the semiparamet-
ric approaches are comparable. The signs, sizes and significance levels of both estimates
are very similar. This suggests that the normal parametrization assumed earlier is not
strongly at odds with the data. There however seems to be a little accuracy gain in the
semiparametric estimation. Standard deviations from the semiparametric estimates tend
24The estimations are available upon request.
30
to be smaller. In particular, the capital returns that was insignificant in the parametric
approach has a smaller variance in the semiparametric estimation and turns out to be
significant at the 5% level, though the estimated parameter values obtained from both
approaches are quite close (see table 13).
Our structural estimates are a suggestive insight of what a more refined research
using more thorough information and less stringent functional forms assumptions may
reveal. Yet the results obtained are very appealing. While none of parametric or semi-
parametric findings presented here is definitive on its own, taken together they reinforce
the predictions from the theoretical model that mutual help is a significant barrier to
entrepreneurship. The fraction of missing entrepreneurs obtained in this framework rep-
resents an important amount of implied wealth and an even higher proportion of implied
jobs. These missing formal enterprises represent a gap in the formal sector and in tax
revenues that could be used to improve social safety nets to lower the need of mutual
help.
5 Conclusion
This paper argued that the forced solidarity social norms prevailing in Sub-Sahara Africa
is detrimental to the continent economic growth as it precludes many local talented
people to become formal entrepreneurs. We estimate that between 5.5% and 7% of the
workers in the formal sector are prevented to become entrepreneur by the forced mutual
help constraint. Local entrepreneurs are hence constrained on the credit market and
on the labor market, and the labor market constraint is specific to them. Foreigners
have a competitive hedge as they do not suffer from the same labor distortions. This
productivity gap helps to explain the over-representation of minority entrepreneurs in
the region, like the Indians in East Africa and the Lebanese and Syrians in West Africa.
The analysis also helps to explain the puzzling result that very small firms in de-
veloping countries exhibit extremely high returns on capital (Banerjee and Duflo, 2004;
De Mel et al 2008). The non monotonicity of capital returns according to firms size is
usually explained by inefficient financial markets. In the African context the excessive
returns are also the result of additional labor market constraints: talented entrepreneurs
are stuck with small informal firms because they are afraid, if they become formal, to
face the social obligation of hiring and subsidizing their extended network of relatives.
Combined with tight credit constraints it helps to explain the excessive returns on their
small firms.
31

Finally, the analysis sheds a new light on social protection. If it is so widespread
in rich countries, and currently being developed in emerging economies (see Barrientos
2013),25 it is because it leads to economic benefits. Social security, public retirement
plans, and other public schemes aimed at protecting the unemployed, the sick, the children
or the old are not solely explained by advanced economies aspiration for solidarity and
redistribution. They are economic tools to prevent inefficient allocation of resources.
They allow individuals and firms to disconnect their decisions of recruitment, investment
and savings from family protection. Africa is the region of the world with the lowest level
of public social protection (see ILO 2010). Moving from this equilibrium of laissez-faire to
an equilibrium with a minimum protection is yet possible. The ILO has estimated that (in
a sample of sub-Saharan African countries) a universal basic child benefit scheme would
cost between 1.7% and 3.4% of GDP, a universal basic old age pension scheme would cost
between 0.7% and 1.3% of GDP, and an employment guarantee scheme covering 10% of
the working age population would cost between 0.4% and 0.7% of GDP.
25Barientos (2013) shows that there has been a staggering growth of anti-poverty transfer programmesin developing countries since the middle of the 1990s. According to the author computations a conserva-tive estimate of their reach indicates that between 0.75 and 1 billion people in developing countries arecurrently receiving such social transfers.
32
Bibliography
Anderson, S., and J.-M. Baland (2002): ”The Economics of Roscas and Intrahousehold
Resource Allocation,” Quarterly Journal of Economics, 117(3), 963-995.
Auriol, E., and M. Warlters (2005) ”Taxation Base in Developing countries”, Journal
of Public Economics, 89, 625-646.
Baland, J.-M., Guirkinger, C. and Mali, C. (2011). ”Pretending to be Poor: Borrowing
to Escape Forced Solidarity in Cameroon”, Economic Development and Cultural Change,
60(1): 1-16.
Banerjee, A. and Duflo, E. (2004). Do Firms Want to Borrow More? Testing Credit
Constraints Using a Directed Lending Program. CEPR Discussion Papers 4681
Barrientos, A., (2013) ”Social Assistance in Developing Countries” Armando Barri-
entos, forthcoming Cambridge University Press - available from July 2013
Bernard, T. A. de Janvry, and E. Sadoulet (2010), ”When Does Community Conser-
vatism Constrain Village Organizations?”, Economic Development and Cultural Change,
Vol. 58, No 4, pp. 609-641
Biggs, T. and M. K. Shah (2006), ”African Small and Medium Enterprises, Networks,
and Manufacturing Performance”, World Bank Policy Research Working Paper 3855
Botero, J. S. Djankov, R. La Porta, F. Lopez-de-Silanes and A. Shleifer (2004), ”The
Regulation of Labor”, The Quarterly Journal of Economics 119 (4): 1339-1382.
Burgess, R., and N. Stern (1993) “Taxation and Development,” Journal of Economic
Literature, vol. XXXI, June, pp.762-830.
Charmes, Jacques (2000) “The Contribution of Informal Sector to GDP in Developing
Countries: Assessment, Estimates, Methods, Orientations for the Future”. Working
paper prepared for the 4th Meeting of the Delhi Group on Informal sector Statistics.
De Mel, S., McKenzie, D., and Woodruff, C. (2008), ”Returns to Capital in Microen-
terprises: Evidence from a Field Experiment”, The Quarterly Journal of Economics,
123(4), 1329-1372.
Djankov S., R. LA Porta, F. Lopez-de-Silanes, and A. Shleifer (2002), “The Regulation
of Entry”, Quartely Journal of Economics, February, vol CXVII, Issue 1, 1-37.
Duflo, E., Kremer, M. and Robinson, J. (2011). ”Nudging Farmers to use Fertilizer:
Evidence from Kenya”, American Economic Review, 101, (6), pp. 2350-90.
D. S. Evans and B. Jovanovic (1989), ”An Estimated Model of Entrepreneurial Choice
33
under Liquidity Constraints”, The Journal of Political Economy, vol. 97, no. 4
Fafchamps, M. (2004) Market Institutions in Sub-Saharan Africa. Cambridge, Mass:
MIT press.
Firth, R. (1951), ”Elements of Social Organization”, Beacon Press.
Grimm, M., Krueger, J., Lay, J. (2011). ”Barriers to Entry and Returns to Capi-
tal in Informal Activities: Evidence from Sub-Saharan Africa”. Review of Income and
Wealth, Special Issue: The Informal Economy in Developing Countries: Analysis and
Measurement, 57, Issue Supplement s1, pp. 27u53
Grimm, M., F Gubert, O. Koriko, J. Lay, C. J. Nordman, (2011), ”Kinship-ties and
entrepreneurship in Western Africa”, mimeo DIAL.
Henry, A. (1996), ”L’adaptation des entreprises Africaines face O un environnement
hostile”, Nouveaux Mondes N. 6, publication du CRES.
Henry, A. (2003), ”Entreprises mondialisUes en Afrique: comportements et formes
institutionnelles”, Colloque de Cerisy ”vers les civilisations mondialisUes? de l’ethologie
O la prospective”.
Ichimura, H. (1993). “Semiparametric Least Squares (SLS) and Weighted SLS Esti-
mation of Single Index Models”. Journal of Econometrics 58, 71-120.
ILO (1999), “Trade Unions and the Informal Sector”, International Labour Organi-
sation.
ILO (2010), ”World Social Security Report 2010/11: Providing coverage in times of
crisis and beyond, International Labour Office u Geneva, International Labour Organi-
sation.
Jakiela P. and O. Owen, (2010),“Does Africa Need a Rotten Kin Theorem? Experi-
mental Evidence from Village Economies”, mimeo
Kazianga, H. (2006). ”Motives for Household Private Transfers in Rural Burkina
Faso”, Journal of Development Economics, 79(1), pp.73-117.
Keen, M. and M. Mansour, (2010) ”Revenue Mobilisation in Sub-Saharan Africa:
Challenges from Globalisation” Development Policy Review, Vol. 28, No. 5, pp. 553-
571, September 2010.
Klein, R. W.; R. H. Spady (1993). “An Efficient Semiparametric Estimator for Binary
Response Models”. Econometrica 61 (2), 387-421.
Kremer,M., Lee,J.N. and Robinson, J.M. (2010) ”The return to capital for small
34

retailers in Kenya: Evidence from Inventories” Mimeo, Havard University
Kuchta-Helbling C. (2000), Background paper for the workshop “Barriers to Partici-
pation: The Informal Sector in Emerging Democracies”, Sao Paulo, Brazil November 13,
2000.
Martinez-Vazquez, J., V. Vulovic, and Y. Liu (2009), ”Direct versus Indirect Taxation:
Trends, Theory and Economic Significance”, International Studies Program , Working
paper 09-11
Munshi, K. (2003) ”Networks in the Modern Economy: Mexican Migrants in the U.S.
Labor Market”, Quarterly Journal of Economics, 118(2): 549-597.
Munshi, K. (2011) ”Strength in Numbers: Networks as a Solution to Occupational
Traps”, Review of Economic Studies 78, 1069-1101.
Newbery, David M.G. and Nicholas H. Stern (eds). (1987), “The Theory of Taxation
for Developing Countries”. New York: Oxford University Press.
Nillesen, E.E.M., Beekman, G., and Gatto, M., (2011), ”Kinship Networks and In-
vestment in post-war Liberia”, mimeo
Paulson, A., R. Townsend and A. Karaivanov, 2006, ”Distinguishing Limited Commit-
ment from Moral Hazard in a Model of Entrepreneurship”, Journal of Political Economy,
144(1), pp. 100-44.
Platteau J.-P. (2000), ”Institutions, Social Norms and Economic Development”. Har-
wood Academic Publishers: Amsterdam.
Platteau J-P. (2006), ”Solidarity Norms and Institutions in Village Societies : Static
and Dynamic Considerations”, in the Handbook of the Economics of Giving, Altruism
and Reciprocity, S. Kolm and J. Mercier-Ythier (eds.), Amsterdam: North-Holland and
Elsevier.
Straub, S. (2005), ”Informal sector: The credit market channel”, Journal of Develop-
ment Economics 78, 299u 321
Tanzi, V., Zee, H., 2000. ”Tax Policy for Emerging Markets: Developing Countries”,
National Tax Journal, Vol. 53 no. 2 (June 2000) pp. 299-322
Tanzi, V. and L. Schuknecht (2000), ”Public Spending in the 20th Century: A Global
Perspective”, Cambridge University Press.
Townsend, R.M. (1994) æRisk and Insurance in Village IndiaÆ, Econometrica, 62(3),
pp.539-591.
35

Tshikuku, K. (2001) ”Culture, entrepreneurship and development in Africa” down-
loadable at http://unpan1.un.org/intradoc/groups/public/documents/idep/unpan003349.pdf
Udry, C. and Anagol S. (2006) ”The return to capital in Ghana”, American Economic
Review 96 (2) 388-393.
Woodburn, J., 1998, ”Sharing Is Not a Form of Exchange: An Analysis of Property-
Sharing in Immediate-Return Hunter-Gatherer Societieso, in C.M. Hann (ed.), Property
Relations uReviewing the Anthropological Tradition, Cambridge: Cambridge University
Press, pp. 48-63.
36

6 Appendix
6.1 Model Implications with a general production technology
In this section, we show that our theoretical predictions can be obtained with any pro-
duction technology that satisfies basic reasonable assumptions. Let assume that the
production function of an entrepreneur with ability θ is
Y = f(θ,K, L) (26)
where K is the stock of capital and L the quantity of labor used in the firm. The function
f(θ,K, L) is assumed to be continuously differentiable, strictly increasing and concave
in each of its argument. Moreover, fK(θ,K, L) is increasing in θ (i.e. the marginal
productivity of capital increases with entrepreneurial ability).
6.1.1 Entrepreneur without family liability
The objective function of the foreign entrepreneur is
maxL
Πf (L) = f(θ,K, L)− wL− rK. (27)
The optimal employment level in a firm run by an entrepreneur with ability θ and a stock
of capital K is then Lf = Lf (θ,K) where Lf satisfies the first-order condition
fL(θ,K, L) = w (28)
Substituting Lf in (27), the profit of the entrepreneur with ability θ and a stock of capital
K is:
Πf (θ,K) = f(θ,K, Lf (θ,K))− wLf (θ,K)− rK. (29)
Let θf (K) be the value of θ for which Πf (θ,K) = w.
Proposition 6.1 An agent with access to capital K chooses to become entrepreneur if
and only if θ ≥ θf (K).
Proof. An agent with access to capital K chooses to become entrepreneur if and only
Πf (θ,K) ≥ w. Since Πf (θ,K) is a strictly increasing function of θ this is equivalent to
θ ≥ θf (K).
37

6.1.2 Local entrepreneur
The local entrepreneur solves the following problem
maxL,Lr,τ
Πl = f(θ,K, L+ βLr)− wL− wLr − rK − τT (30)
τT + wLr = T
where τ is the fraction of the tax that is given directly in cash and β ≤ 1 is the productivity
of one unit of labor by a relative. Note that the local entrepreneur hires L+ Lr units of
labor whereas the amount of productive labor is only L + βLr. Substituting Lr by its
value in the objective function yields:
maxL,τ
Πl = f(θ,K, L+ β
1− τw
T)− wL− rK − T. (31)
The first order conditions with respect to τ yields:
∂Πl
∂τ= −β
wfL
(θ,K, L+ β
1− τw
T)≤ 0. (32)
For all β ≥ 0 the objective function is decreasing in τ so that at the optimum τ ∗ = 0.
In the limit when β = 0 the entrepreneur is indifferent between hiring her relatives or
paying a cash transfer. This result is collected in the next proposition.
Proposition 6.2 Independently of the value of β ≥ 0 a local entrepreneur always pays
the family tax by hiring relatives in the firm.
We next characterize the optimal employment level in the local firm. The first order
condition, which is also sufficient, is:
∂Πl
∂L= fL
(θ,K, L+ β
1− τw
T)− w = 0. (33)
Since τ ∗ = 0 we have L∗r = Tw
so that the condition that characterizes the optimal quantity
of external labor Ll = Ll(θ,K) is given by:
fL
(θ,K, Ll +
β
wT)
= w. (34)
Substituting L∗r and Ll(θ,K) in the profit function (30), the entrepreneur earning is:
Πl(θ,K) = f(θ,K, Ll(θ,K) +
β
wT)− wLl(θ,K)− rK − T (35)
38

Proposition 6.3 For an ability level θ and an amount of capital K:
(i) local firms’ profit is smaller than regular firms’ profit:
∆Π = Πf (θ,K)− Πl(θ,K) ≥ (1− β)T ≥ 0;
(ii) the profit gap increases with family tax T , and decreases with family productivity β:
∂∆Π
∂T= 1− β > 0,
∂∆Π
∂β= −T < 0.
Proof. (i) Πf (θ,K)− Πl(θ,K) = f(θ,K, Lf )− f(θ,K, Ll + βwT )− w(Lf − Ll) + T .
By the concavity of f(θ,K, L) with respect to its argument L, it must be the case that
f(θ,K, Lr) − f(θ,K, Ll + βwT ) ≥ (Lr − Ll − β
wT )fL(θ,K, Lr). Therefore, Πf (θ,K) −
Πl(θ,K) ≥ (Lr−Ll− βwT )fL(θ,K, Lr)−w(Lf −Ll) + T . Using the first-order condition
(5), we get Πf (θ,K)− Πl(θ,K) ≥ w(Lr − Ll − β
wT)− w(Lf − Ll) + T .
That is, Πf (θ,K)− Πl(θ,K) ≥ (1− β)T ≥ 0.
(ii) Taking the derivative of ∆Π with respect to T yields
∂∆Π
∂T= −β
wfL(θ,K, Ll +
β
wT ) + 1.
Using the first-order condition (34), we get ∂∆Π∂T
= −β + 1.
Taking the derivative of ∆Π with respect to β yields ∂∆Π∂β
= −TwfL(θ,K, Ll + β
wT ).
Using the first-order condition (34), we get ∂∆Π∂β
= −T
Note that in the case of a production technology with constant returns to scale, we
have the equality Πf (θ)− Πl(θ) = (1− β)T. We next characterize the threshold value θ
so that a local individual is willing to become entrepreneur. Let θl be the value of θ so
that Πl(θ,K) = w.
Proposition 6.4 (i) Local people choose to become entrepreneur if and only if θ ≥ θl(K).
(ii)An autochtone with capital K and ability θ is at a disadvantage to become an en-
trepreneur compared to a foreigner: θl(K) ≥ θf (K).
(iii) The decision to become entrepreneur increases with increasing values of the available
capital:dθj(K)
dK≤ 0, j ∈ {f, l}.
(iv) The gap between local and regular entrepreneurs entry decision, ∆θ(K) = θl(K) −θf (K), decreases with increasing values of capital K:
d∆θ(K)
dK≤ 0. (36)
39

Proof.
(i) Similar to Proposition 1.
(ii) By Proposition 6.3(i), we have Πf (θl, K) ≥ Πl(θl, K).
But Πl(θl, K) = w = Πf (θf , K). Hence, Πf (θl, K) ≥ Πf (θf , K), which by the strict
monotonicity of Πf (θ,K) with respect to θ, implies θl > θf
(iii) If we differentiate the equation Πf (θf , K) = w characterizing θf with respect to
K, we get∂Πf (θf , K)
∂θ
dθf (K)
dK+∂Π(θf , K)
∂K= 0.
That is, fθ(θf , K, Lf )
dθf (K)
dK= r−fK(θf , K, Lf ) = fK(θf , Kf , Lf )−fK(θf , K, Lf ). where
Kf is the optimal capital obtained from the first-order conditions of the entrepreneur’s
problem. Since we assumed that the maximum capital available to the entrepreneur K is
constrained, we obviously have Kf > K. Because f(θ, ·, L) is strictly concave, fK(θ, ·, L)
must be strictly decreasing, so that Kf > K implies fK(θf , Kf , Lf ) < fK(θf , K, Lf ). It
follows that fθ(θf , K, Lf )
dθf (K)
dK< 0 and therefore
dθf (K)
dK< 0. The same argument
applies to show thatdθl(K)
dK< 0.
(iv) First, let’s observe that since the function fL(θ,K, ·) is strictly decreasing (by the
strict concavity of f(θ,K, ·)), it follows the first-order conditions characterizing Lf and
Ll, fL(θf , K, Lf ) = w = fL(θf , K, Ll +β
wT ), imply that we must have
Lf = Ll +β
wT = L (37)
If we totally differentiate the equality Πl(θl, K) = Πf (θf , K) with respect to K, we get:
fθ(θl, K, L)
dθl(K)
dK+ fK(θl, K, L)− r = fθ(θ
f , K, L)dθf (K)
dK+ fK(θf , K, L)− r, which is
equivalent to: fθ(θl)d∆θ(K)
dK=(fθ(θ
f )− fθ(θl)) dθf (K)
dK+(fK(θf )− fK(θl)
)We know
from (iii) above that we have:dθf (K)
dK< 0. Since fθ(·, K, L)) is decreasing and θl ≥ θf ,
we must have fθ(θl) ≤ fθ(θ
f ), that is fθ(θf )− fθ(θl) ≥ 0. Likewise, because fK(·, K, L))
is increasing and θl ≥ θf , we must have fK(θl) ≥ fK(θf ), that is, fK(θf )− fK(θl) ≤ 0.
It then follows that fθ(θl)d∆θ(K)
dK≤ 0, so that,
d∆θ(K)
dK≤ 0.
40

Denote by L∗l = Ll + L∗r the total quantity of labor hired by the local entrepreneur.
We have the following results
Proposition 6.5 (i) Everything else being equal local firms have larger labor to capital
ratio than foreign firms:L∗lKl≥ Lf
Kf,
(ii)Everything else being equal (i.e., for the same θ and the same K), the labor productivity
of local firms is smaller than that of regular ones: yl =YlL∗l≤ yf =
YfLf
.
Proof.
(i) We know that L∗r =1
wT , and that by Equation (37), Ll = Lf −
β
wT . Hence, L∗l =
Lf + (1− β)T
w≥ Lf . Then
L∗lK≥ Lf
K.
(ii) Recall that Lf = Ll +β
wT . Then,
yl =YlL∗l
=f(θ,K, Ll +
β
wT )
L∗l≤f(θ,K, Ll +
β
wT )
Lf=f(θ,K, Lf )
Lf= yf .
The nature of the selection to different sectors of the economy, as implied by our the
theoretical model, can be summarized by Figure 3.
Figure 3: Entrepreneurship decision
0 5 10 15 200.6
0.8
1
1.2
1.4
1.6
1.8
2
T
Entrepreneur
Worker
!l(! ) = w
!
0
!r (!) = w! r
! l(T )
Student Version of MATLAB
0 5 10 15 200.6
0.8
1
1.2
1.4
1.6
1.8
2
T
Worker
!
0
!r (!) = w
Entrepreneur
!r
! l(T )
!l(! ) = w
Student Version of MATLAB
(a) Locals (b) Foreigners
6.2 Data and descriptive statistics
The data used in the empirical analysis come from two sources:
• The Enterprise Survey database maintained by the World Bank is available at:
http://www.enterprisesurveys.org/.
41

• The Institutional Profiles Database is available at:
http://www.cepii.fr/anglaisgraph/bdd/institutions.htm
The standard Enterprise Survey questionnaire is comprised of three parts:
1. The first part of the questionnaire deals with the internal structure of businesses
and the investment climate within which these businesses operate, including bu-
reaucratic obstacles and infrastructure constraints;
2. The second part deals with finances, production and markets and provides infor-
mation on business performance which can be correlated to business characteristics
and investment climate obtained in the first part of the questionnaire. The detailed
accounting data allows for comparison of the competitiveness of industries across
African countries;
3. The third part of the questionnaire, which is particularly relevant for the present
study, deals with human resources and labor market issues, including the effects of
government labor regulations on the cost of doing business and the structure, as
well as the cost and quality of the workforce.
In what follows we present the descriptive statistics used in the main text.
42

Table 1: Main shareholders of the firm
Description of the largest shareholder or owner in your firm (multiple answers acceptable)
Private Domestic Firms
Private Foreign Firms
Individual or Family 98,02% 81,34% ‐16,67% ***
Domestic company 34,77% 15,76% ‐19,00% ***
Foreign company 0,00% 71,01% 71,00% ***
Bank or Investment fund 1,35% 3,23% 1,90%
Other (Employees, Government…) 14,00% 12,62% ‐1,38%
Average Pct of firm owned by the largest shareholder or owner 83,73% 71,35% 12,38% ***
If the largest shareholder or owner is an individual or family member,is he also the manager/director?
Yes 85,11% 72,76% ‐12,35% ***
is he male?
Yes 88,33% 87,46% ‐0,87%
Difference between Foreign and Domestic
Table 2: Sample of firms according to ownership and size
% of FirmsPrivate Domestic
FirmsPrivate Foreign
Firms
Small Firms (< 20) 63,70% 35,69% -28,01% ***
Medium Firms (20-99) 27,13% 33,00% 5,87% ***
Large Firms (>100) 9,16% 31,31% 22,15% ***
Average WorkforcePrivate Domestic
FirmsPrivate Foreign
Firms
Small Firms (< 20) 8,7 9,7 1 ***
Medium Firms (20-99) 39 43 4 ***
Large Firms (>100) 362 570 208 ***
Difference between Foreign and Domestic
Difference between Foreign and Domestic
43

Table 3: Repartition of firms by industry according to ownership
Repartition of firms by industry (in percentage)
Retail and wholesale trade 14,82% 15,14% 0,32% 21
Food & Beverages 10,86% 11,42% 0,56% 153
Wood and furniture 11,68% 5,87% -5,81% *** 51
Other manufacturing 9,26% 8,17% -1,08% 61
Metals and machinery 9,00% 8,12% -0,88% 99
Garments & Leather 8,21% 6,65% -1,56% ** 115
Hotels and restaurants 7,53% 5,29% -2,24% *** 17
Other services 5,87% 4,71% -1,16% ** 18
Agroindustry 4,57% 7,96% 3,40% *** 88
Chemicals and pharmaceutics 3,75% 7,28% 3,53% *** 84
Non-metallic and plastic materials 2,49% 5,08% 2,59% *** 100
Other unclassified 3,00% 2,83% -0,17% 60
Textiles 2,52% 4,50% 1,98% *** 260
Construction 2,49% 3,88% 1,39% *** 51
Paper 1,67% 1,52% -0,15% 74
IT services 1,16% 0,47% -0,69% *** 10
Transport 0,47% 0,47% 0,00% 15
Electronics 0,48% 0,31% -0,17% 127
Mining and quarrying 0,17% 0,31% 0,14% 616
Average Number of employee per firmsIndustries
Private Domestic Firms
Private Foreign Firms
Difference between Foreign and Domestic
44

Table 4: Credit and overdraft facilities
Yes 36,05% 50,49% 14,45% ***
Private commercial banks 80,11% 88,19% 8,08% ***
State‐owned banks 8,78% 5,56% ‐3,22% *
Non‐bank financial institutions 9,52% 3,47% ‐6,05% ***
Other 1,59% 2,78% 1,19%
Yes 47,72% 73,01% 25,29% ***
Did the Firm Apply For a Loan
Yes 21,65% 22,69% 1,04%
yes 85,28% 82,76% ‐2,52%
Of What Type
Land 57,19% 60,14% 2,95%
Machinery 35,50% 55,24% 19,75% ***
Intangible Assets 23,06% 30,99% 7,92% *
Personal Assets 37,84% 27,27% ‐10,57% **
No need for a loan 34,58% 57,35% 22,77% ***
Application procedures are complex 18,84% 9,99% ‐8,85% ***
Interest rates are not favorable 20,14% 15,94% ‐4,21% ***
Collateral requirements are unattainable 10,13% 5,27% ‐4,86% ***
Size of loan and maturity are insufficient 2,75% 1,91% ‐0,84%
Did not think it would be approved 13,41% 9,43% ‐3,99% ***
Other 0,14% 0,11% ‐0,03%
Difference between Foreign and Domestic
Financial statement reviewed by an external auditor
If Yes. Does This Loan Requires a Collateral
If No. Why the firm did not apply for a loan
CreditPrivate Domestic
FirmsPrivate Foreign
Firms
Overdraft Facility or Line of Credit
If Yes. In what type of Institutions
45

Table 5: Ways to recruit new employees
Means used by firms to find workersPrivate Domestic
FirmsPrivate Foreign
Firms
Through family/friends 62,81% 40,47% -22,34% ***
Public or Private placement office 7,26% 10,83% 3,57% ***
Public announcement/advertisement 16,96% 32,41% 15,45% ***
Other 12,97% 16,29% 3,32% ***
Difference between Foreign and Domestic
Table 6: Labor force composition according to ownership
Private Domestic Firms
Private Foreign Firms
Blue Collar (Pct) 75,07% 72,13% ‐2,94% ***
White Collar (Pct) 24,93% 27,87% 2,94% ***
Supervision Ratio (Pct) 45,16% 58,79% 13,63% ***
Average Total Workforce 49,43 196,06 146,63 ***
0 - 3 years 11,5% 8,7% -2,81% *
4 - 6 years 30,3% 22,6% -7,61% ***
7 - 9 years 48,6% 53,8% 5,21% **
10 - 12 years 6,1% 11,1% 4,99% ***
More than 13 years 3,6% 3,8% 0,21%
Nb: this question was only asked in countries surveyed between 2002 and 2005
Answers are taken into account only when the sum is equal to 100%
Less than 6 years 26,8% 21,7% -5,07% ***
6 - 9 years 24,3% 18,7% -5,63% ***
10 - 12 years 34,6% 36,8% 2,19%
More than 12 years 14,3% 22,8% 8,50% ***
Difference between Foreign and Domestic
Description of firms' workforce
Average Education of a production worker
% of the workforce having the following education level
The blue collar ratio is the number of production workers divided by the total workforcein the firm. Similarly white collar ratio is the number of non production workers dividedby the total workforce in the firm.
46

Table 7: Firms training programs according to ownership
Surveys of 2006 and 2009
Private Domestic Firms
Private Foreign Firms
% of firms offering Training programs 27,4% 46,6% 19,1% ***
% of production workers trained 70,4% 58,4% -12,0% ***
% of non-production workers trained 55,9% 51,2% -4,7%
NB: These questions were asked only for surveys made between 2006 and 2009
Surveys of 2002 and 2005
Private Domestic Firms
Private Foreign Firms
% of firms offering Training programs 32,4% 52,4% 20,0% **
% of skilled production workers trained 37,3% 40,0% 2,7%
Average number of weeks of training per employee 7,7 6,0 -1,7 *
% of unskilled production workers trained 29,6% 28,0% -1,5%
Average number of weeks of training per employee 10,3 7,4 -2,9 *
NB: These questions were asked only for surveys made between 2002 and 2005
Difference between Foreign and Domestic
Difference between Foreign and Domestic
There are two different tables because the questionnaire changed between the period 2002-2005 and 2006-2009. The questions asked were not exactly the same. Yet the percentageof firms offering training programs is pretty stable at about 20%.
Table 8: Firms profit according to ownership and size
Profit ($) per EmployeePrivate Domestic
FirmsPrivate Foreign
FirmsSmall Firms (< 20) 38 361 75 415 37 054
Medium Firms (20-99) 26 300 59 682 33 382 ***
Large Firms (>100) 45 455 72 101 26 646 ***
Difference between Foreign and Domestic
47

6.3 Regressions outputs
Table 9: Descriptive statistics of variables used in the regressions
Data Mean Median Std Dev Minimum Maximum Observation
% of production workers 76,82 80 17,96 0 100 3 100
Labor to capital ($) ratio 2,03 0,0003 24,37 1,42E-07 1 087 3 118
Total sales ($) per employee 42 777 9 277 563 429 0,28 2,96E+07 3 099
Net book value of capital stock ($) 1 667 126 80 177 1,37E+07 0 4,25E+08 3 118
Completely domesticaly owned firm (dummy) 0,79 1 0,41 0 1 3 118
Export (dummy) 0,18 0 0,38 0 1 3 118
Age of the firm (years) 15,99 10 15,94 0 128 3 118
Trade union presence in the firm (dummy) 0,36 0 0,48 0 1 3 118
Firm located in the capital city (dummy) 0,54 1 0,50 0 1 3 118
ISO certification (dummy) 0,16 0 0,37 0 1 3 118
Firm offers training program (dummy) 0,36 0 0,48 0 1 3 118
Firm has an overdraft or credit facilities (dummy) 0,44 0 0,50 0 1 2 945
Experience of top manager (years) 11,57 10 9,44 0 50 3 045
Workers education and skills is a major or severe constraint (dummy) 0,15 0 0,36 0 1 3 113
100% of working capital is financed through internal funds (dummy) 0,32 0 0,47 0 1 3 094
Access and/or cost of financing is a major or severe constraint (dummy) 0,21 0 0,41 0 1 3 081
48

Table 10: Explaining Labor to Capital ratio according to institutional solidarity index
Equations (1) (2) (3) (4)
Dependent Variable Labor/Capital ($)
Ratio (log)
Labor/Capital ($)
Ratio (log)
Labor/Capital ($)
Ratio (log)
Labor/Capital ($)
Ratio (log)
Constant -8,262 -10,821 -8,681 -9,09
(14.39)*** (6.16)*** (7.20)*** (9.58)***
100 % of the firm is owned 0,335 1,22 0,247 0,185
by domestic private sector
(dummy)
(1.21) (1.33) (1.33) (0.73)
Firms' characteristics
Age of the firm (log) 0,009 0,058 0,325 0,391
(0.13) (0.55) (3.17)*** (3.71)***
Firm located in the capital 0,745 0,614 -0,239 -0,128
town (dummy) (1.14) (1.03) (0.73) (0.39)
Export dummy -0,719 -0,589 -0,535 -0,455
(2.44)** (1.98)* (2.29)** (1.95)*
Firm has as an ISO -0,219 -0,155 -0,692 -0,596
certification n(dummy) (1.28) (0.57) (2.06)** (1.86)*
Trade union presence -0,523 -0,707 0,291 0,306
within the firm (dummy) (1.92)* (2.13)** (1.03) (1.09)
Firm offers training 0,142 -0,032 -0,833 -0,818
programs (dummy) (0.32) (0.07) (2.91)*** (2.96)***
Training dummy * 100 % 0,436 0,774 0,698 0,845
domestic dummy (1.05) (1.82)* (2.19)** (2.69)***
Workforce characteristics
Experience of the -0,129 -0,188 -0,129 -0,103
top manager (log) (1.56) (1.65) (1.70)* (1.52)
Workers education and -0,118 0,081 -0,414 -0,424
skills is a major or severe
constraint (dummy)
(0.60) (0.32) (2.14)** (1.86)*
Access to credit
Firm has an overdraft 0,373 -1,173
or credit facilities (dummy) (0.48) (3.92)***
Overdraft dummy * 100% -1,199 0,082
domestic dummy (1.37) (0.25)
Access and/or cost 0,32 -0,452
of financing is a major or severe
constraint (dummy)
(0.93) (1.82)*
100% of working capital is -0,251 -0,056
financed through internal fund
(dummy)
(0.89) (0.17)
Observations 600 443 1 871 1 822
R-squared 0,13 0,16 0,19 0,21
Size of the firms, country, year, activity and average education of the workforce dummies are included
in all the regressions
Better Solidarity Sample Worse Solidarity Sample
Method OLS, Absolute value of robust t statistics in parentheses
* significant at 10%; ** significant at 5%; *** significant at 1%
49

Table 11: Explaining the percentage of production workers
Equations (1) (2)
Dependent Variable % of Production
Workers (log)
% of Production
Workers (log)
Constant 4,405 4,252
(53.88)*** (47.03)***
100 % of the firm is owned 0,085 0,101
by domestic private sector (dummy) (2.48)** (2.50)**
Firms' characteristics
Age of the firm (log) -0,009 -0,018
(0.87) (1.92)*
Firm located in the capital -0,041 -0,041
town (dummy) (1.75)* (1.84)*
Export dummy 0,011 0,013
(0.45) (0.47)
Firm has as an ISO -0,038 -0,039
certification n(dummy) (1.77)* (1.67)*
Trade union presence -0,031 -0,024
within the firm (dummy) (1.40) (1.05)
Capital Stock (log) -0.004 -0.003
(1.45) (1.18)
Firm offers training 0,079 0,072
programs (dummy) (2.38)** (1.95)*
Training dummy * 100 % -0,151 -0,142
domestic dummy (3.79)*** (3.22)***
Workforce characteristics
Experience of the -0,02 -0,018
top manager (log) (1.85)* (1.59)
Workers education and -0,037 -0,04
skills is a major or severe constraint
(dummy)
(1.36) (1.29)
Access to credit
Firm has an overdraft 0,004
or credit facilities (dummy) (0.09)
Overdraft dummy * 100% -0,026
domestic dummy (0.57)
Access and/or cost -0,036
of financing is a major or severe constraint
(dummy)
(1.47)
100% of working capital is 0,027
financed through internal fund (dummy) (1.59)
Observations 3 025 2 819
R-squared 0,12 0,13
Size of the firms, country, year, activity and average education of the
workforce dummies are included in all the regressions
Method OLS, Absolute value of robust t statistics in parentheses
* significant at 10%; ** significant at 5%; *** significant at 1%
50
Table 12: Explaining Sales per Employee ratio according to institutional solidarity index
Equations (1) (2) (3) (4)
Dependent Variable Total Sales ($) Per
Employee (log)
Total Sales ($) Per
Employee (log)
Total Sales ($) Per
Employee (log)
Total Sales ($) Per
Employee (log)
Constant 11,462 8,934 2,741 2,678
(19.79)*** (19.95)*** (7.91)*** (8.08)***
100 % of the firm is owned -0,217 -0,196 -0,36 -0,282
by domestic private sector
(dummy)
(1.13) (0.80) (3.83)*** (2.72)***
Firms' characteristics
Age of the firm (log) 0,007 0,01 -0,019 -0,059
(0.13) (0.17) (0.43) (1.37)
Firm located in the capital 0,664 0,596 -0,001 -0,017
town (dummy) (2.75)** (2.46)** (0.02) (0.22)
Export dummy 0,07 0,068 0,445 0,401
(0.98) (0.61) (3.56)*** (3.34)***
Firm has as an ISO 0,342 0,246 0,491 0,486
certification n(dummy) (3.92)*** (2.09)** (4.43)*** (4.38)***
Trade union presence -0,028 0 0,168 0,152
within the firm (dummy) (0.18) (0.00) (2.27)** (1.97)*
Capital Stock (log) 0.063 0.050 0.083 0.072
(1.76)* (2.58)** (7.80)*** (6.85)***
Firm offers training 0,351 0,323 0,103 0,089
programs (dummy) (2.14)** (1.83)* (0.84) (0.72)
Training dummy * 100 % -0,1 -0,106 -0,018 -0,047
domestic dummy (0.66) (0.72) (0.12) (0.32)
Workforce characteristics
Experience of the 0,03 0,023 -0,057 -0,029
top manager (log) (0.65) (0.47) (1.50) (0.69)
Workers education and -0,01 0,001 0,117 0,1
skills is a major or severe
constraint (dummy)
(0.09) (0.01) (1.26) (1.14)
Access to credit
Firm has an overdraft 0,365 0,545
or credit facilities (dummy) (1.19) (3.74)***
Overdraft dummy * 100% -0,177 -0,193
domestic dummy (0.75) (1.45)
Access and/or cost -0,107 0,126
of financing is a major or severe
constraint (dummy)
(1.04) (0.88)
100% of working capital is 0,172 -0,018
financed through internal fund
(dummy)
(1.47) (0.25)
Observations 597 441 1 861 1 812
R-squared 0,29 0,37 0,52 0,54
Size of the firms, country, year, activity and average education of the workforce dummies areincluded
in all the regressions
* significant at 10%; ** significant at 5%; *** significant at 1%
Better Solidarity Sample Worse Solidarity Sample
Method OLS, Absolute value of robust t statistics in parentheses
51
6.4 Structural Maximum Likelihood Estimates of the Model:
using income as a proxy for capital
Table 13: Structural Maximum Likelihood Estimates of the Model: using income as aproxy for capital
Type Parameter Name Whole Better Worse Differencesample solidarity solidarity Pvalue
Foreigners Log ability - constant δ0f 4.47 3.41 3.815 0.0000(0.0012) (0.036) (0.0932)
Log ability - education δ1f 0.2817 0.586 0.2784 0.0000(0.0022) (0.0531) (0.0715)
Log ability - experience δ2f 0.2620 0.4934 0.1921 0.0000(0.0293) (0.013) (0.037)
Stand. dev. for ability σf 0.7421 0.9012 0.5917 0.0000(0.0192) (0.0023) (0.0481)
Locals Log ability - constant δ0l 4.021 3.48 4.1709 0.0000(0.0012) (0.0307) (0.0208)
Log ability - education δ1l 0.3902 0.4230 0.2732 0.0000(0.0024) (0.0051) (0.0234)
Log ability - experience δ2l 0.2502 0.3702 0.2904 0.0000(0.0201) (0.0121) (0.0130)
Stand. dev. for ability σl 0.5605 0.9102 0.2603 0.0000(0.0207) (0.0204) (0.0219)
All Capital returns α 0.0201 0.0912 0.0462 0.0701(0.0152) (0.0104) (0.0313)
Log-likelihood -3018 -1809.1 -1784.2
Number of Obs. 7834 3962 3872
Frac. missing entrepreneurs m 0.0560 0.0429 0.0605 0.000(0.0081) (0.0071) (0.0026)
Asymptotic standard errors in parenthesis* Not significant
6.5 Semiparametric estimation of the model
Here we allow the distributions of the error terms εil and εif in the talent distribution
given by Equation (21) to be unknown. Because the constant terms are not identified in
the semiparametric single-index estimation, we shift them into the error terms so that the
52

unknown distributions of interest are for εif +γ0f and εil+γ0l. The remaining parameters
of the model are identified up to a scaling constant.
In this case we have a new version for Equation (22), rewritten as:
Pr[Ei = 1|Zi] = (1− pi)Ψf
{δ1f ln(1 + Si) + δ2f ln(1 +Xi)− α ln
(wiKi
+ ri
)− (1− α) lnwi
}+ piΨl
{δ1l ln(1 + Si) + δ2l ln(1 +Xi)− α ln
(wiKi
+ ri +∆Πi
Ki
)− (1− α) lnwi
} (38)
Where Ψf (·) and Ψl(·) are the unknown CDFs of the talent of foreigners and locals
respectively.
For the simplicity of the exposition, we adopt the following notations: δf =(δ1f , δ2f ,−(1−
α)), δl =
(δ1l, δ2l,−(1− α)
)′, xi =
(ln(1 + Si), ln(1 +Xi), lnwi
)′, kif = ln
(wiKi
+ ri
)and
kil = ln(wiKi
+ ri + ∆ΠiKi
). Then Equation(38) above can be rewritten as
Pr[Ei = 1|xi, kif , kil] = (1− pi)Ψf (x′iδf − αkif ) + piΨl(x
′iδl − αkil).
Because we do not specify variances for the distributions of talent, our structural param-
eter vector of interest is now ψ = [δ1f , δ2f , δ1l, δ2l, α]′. To estimate ψ in this model, we
use a semiparametric likelihood approach which is similar to the one proposed by Klein
and Spady (1993). Given Ψf and Ψl, the log-likelihood is
Ln(ψ,Ψf ,Ψl) =n∑i=1
[Ei ln[(1− pi)Ψf (x
′iδf − αkif ) + piΨl(x
′iδl − αkil)]
+ (1− Ei) ln[1− (1− pi)Ψf (x′iδf − αkif )− piΨl(x
′iδl − αkli)]
] (39)
However, Ψf and Ψl are unknown. So following Ichimura (1993) and Klein and Spady
(1993) one can replace Ψf and Ψl in the above formula by nonparametric estimates Ψf
and Ψl. To estimate Ψf and Ψl, we start by noticing that we can write
E[Ei|xi, kif , i ∈ F ] = Ψf (x′iδf − αkif )
and
E[Ei|xi, kil, i ∈ L] = Ψl(x′iδl − αkil)
Hence, leave-one-out Nadaraya-Watson estimates for Ψf and Ψl can be defined by
Ψf (x′iδf − αkif ) =
∑j∈F ,j 6=i yjK
((xi−xj)′δf−α(kif−kjf )
h
)∑
j∈F ,j 6=iK(
(xi−xj)′δf−α(kif−kjf )
h
) (40)
53

and
Ψl(x′iδl − αkil) =
∑j∈L,j 6=i yjK
((xi−xj)′δl−α(kil−kjl)
h
)∑
j∈L,j 6=iK(
(xi−xj)′δl−α(kil−kjl)h
) (41)
Where K(·) is the gaussian kernel function.
Substituting Ψf by Ψf and Ψl by Ψl in Equation (39) leads to the feasible likelihood
criterion
Ln(ψ) =n∑i=1
[Ei ln[(1− pi)Ψf (x
′iδf − αkif ) + piΨl(x
′iδl − αkil)]
+ (1− Ei) ln[1− (1− pi)Ψf (x′iδf − αkif )− piΨl(x
′iδl − αkil)]
] (42)
Maximizing (42) with respect to ψ leads to a semiparametric maximum likelihood esti-
mator of ψ, denoted ψS. Maximization is performed numerically by solving the first order
condition obtained from (42). This includes using an extensive grid search for initial val-
ues of the parameter vector ψ, and introducing a trimming function to trimmed out small
values for the denominators in (40) and (41). As suggested by Klein and Spady (1993),
the bandwidth used for the kernel estimation is chosen at h = n−1/7. Standard errors
(in parenthesis in the results table) are obtained by computing the sample counterpart
of the asymptotic variance-covariance matrix of the structural parameters.
From the semiparametric estimator ψS, we can compute the fraction of missing en-
trepreneurs as described in Equations (24) and (25) above, where the semiparametric
estimates are used in the formula, and the normal CDFs are replaced by the nonpara-
metric CDFs. In other words, the proportion of missing entrepreneurs is estimated by
m =1
n
n∑i=1
mi (43)
where mi is given by
mi = (1− pi)[Ψl
(δ1l ln(1 + Si) + δ2l ln(1 +Xi)− α ln
(wiKi
+ ri)− (1− α) lnwi
)− Ψl
(δ1l ln(1 + Si) + δ2l ln(1 +Xi)− α ln
(wiKi
+ ri +∆Πi
Ki
)− (1− α) lnwi
)] (44)
The results of the semiparametric estimation are presented in the tables 14 and 15.
54
Table 14: Structural Semiparametric Estimates of the Model: base case
Type Parameter Name Whole Better Worse Differencesample solidarity solidarity Pvalue
Foreigners Log ability - education δ1f 0.3261 0.3913 0.2461 0.0000(0.0016) (0.0012) (0.0022)
Log ability - experience δ2f 0.1958 0.2132 0.1401 0.0000(0.0131) (0.0001) (0.0012)
Locals Log ability - education δ1l 0.2702 0.3013 0.2104 0.0000(0.0002) (0.0001) (0.0051)
Log ability - experience δ2l 0.1246 0.2649 0.1126 0.0000(0.0132) (0.0001) (0.0017)
All Capital returns α 0.0213 0.0672 0.0374 0.0708(0.0047) (0.0031) (0.0162)
Number of Obs. 7834 3962 3872
Frac. missing entrepreneurs m 0.0707 0.0512 0.0801 0.000(0.0028) (0.0035) (0.0043)
Asymptotic standard errors in parenthesis
Table 15: Structural Semiparametric Estimates of the Model: using income as a proxyfor capital
Type Parameter Name Whole Better Worse Differencesample solidarity solidarity Pvalue
Foreigners Log ability - education δ1f 0.3923 0.4012 0.2712 0.0000(0.0018) (0.0014) (0.0031)
Log ability - experience δ2f 0.2081 0.2201 0.1413 0.0000(0.0192) (0.0002) (0.0022)
Locals Log ability - education δ1l 0.2322 0.3001 0.2015 0.0000(0.0024) (0.0011) (0.0048)
Log ability - experience δ2l 0.1412 0.2748 0.1317 0.0000(0.0132) (0.0021) (0.0031)
All Capital returns α 0.0259 0.0723 0.0388 0.0753(0.0047) (0.0031) (0.0162)
Number of Obs. 7834 3962 3872
Frac. missing entrepreneurs m 0.0545 0.0457 0.0701 0.000(0.0029) (0.0046) (0.0039)
Asymptotic standard errors in parenthesis
55

Regression 1: Explaining Labor to Capital Ratio
Equations (1) (2) (3) (4) (5)
Dependent Variable Labor / Capital ($) Ratio (log)
Labor / Capital ($) Ratio (log)
Labor / Capital ($) Ratio (log)
Labor / Capital ($) Ratio (log)
Labor / Capital ($) Ratio (log)
Constant -7,464 -7,122 -8,644 -8,739 -8,336
(19.13)*** (18.09)*** (17.29)*** (17.00)*** (16.48)***
100 % of the firm is owned 0,476 0,206 0,49 0,636 0,373
by domestic private sector (dummy)
(3.59)*** (1.22) (3.47)*** (2.93)*** (1.60)
Firms' characteristics
Age of the firm (log) 0,205 0,206 0,255 0,253 0,253
(2.97)*** (3.00)*** (3.33)*** (3.29)*** (3.32)***
Firm located in the capital -0,277 -0,282 -0,193 -0,189 -0,193
town (dummy) (1.01) (1.03) (0.71) (0.70) (0.71)
Export dummy -0,578 -0,574 -0,518 -0,528 -0,524
(3.37)*** (3.36)*** (3.01)*** (3.06)*** (3.05)***
Firm has as an ISO -0,368 -0,346 -0,335 -0,343 -0,316
certification n(dummy) (1.91)* (1.82)* (1.60) (1.64) (1.53)
Trade union presence 0,046 0,051 0,071 0,069 0,075
within the firm (dummy) (0.22) (0.24) (0.34) (0.33) (0.36)
Firm offers training -0,126 -0,562 -0,09 -0,09 -0,697
programs (dummy) (0.93) (2.61)*** (0.66) (0.66) (3.25)***
Training dummy * 100 % 0,559 0,779
domestic dummy (2.37)** (3.17)***
Workforce characteristics
Experience of the -0,075 -0,072 -0,067 -0,066 -0,062
top manager (log) (1.41) (1.37) (1.23) (1.21) (1.15)
Workers education and -0,25 -0,255 -0,222 -0,219 -0,228
skills is a major or severe constraint (dummy)
(1.91)* (1.94)* (1.46) (1.43) (1.48)
Access to credit
Firm has an overdraft -1,092 -0,886 -0,754
or credit facilities (dummy) (6.80)*** (3.48)*** (3.02)***
Overdraft dummy * 100% -0,273 -0,453
domestic dummy (0.96) (1.60)
Access and/or cost -0,065 -0,064 -0,054
of financing is a major or severe constraint (dummy)
(0.36) (0.35) (0.30)
100% of working capital is -0,15 -0,155 -0,151
financed through internal fund (dummy)
(0.68) (0.70) (0.69)
Observations 3 040 3 040 2 830 2 830 2 830
R-squared 0,23 0,23 0,24 0,24 0,24
Size of the firms, country, year, activity and average education of the workforce dummies are included in all the regressions
Method OLS, Absolute value of robust t statistics in parentheses
* significant at 10%; ** significant at 5%; *** significant at 1%
56

Regression 2: Explaining Sales per Employee ratio
Equations (1) (2) (3) (4) (5)
Dependent Variable Total Sales ($) Per
Employee (log)
Total Sales ($) Per
Employee (log)
Total Sales ($) Per
Employee (log)
Total Sales ($) Per
Employee (log)
Total Sales ($) Per
Employee (log)
Constant 9,061 9,052 8,296 8,238 8,222
(37.71)*** (36.06)*** (45.79)*** (44.65)*** (42.73)***
100% of the firm is owned -0,373 -0,366 -0,398 -0,318 -0,303
by domestic private sector
(dummy)
(6.27)*** (4.64)*** (6.94)*** (3.83)*** (3.38)***
Firms' characteristics
Age of the firm (log) 0,003 0,003 -0,01 -0,011 -0,011
(0.11) (0.10) (0.31) (0.35) (0.35)
Firm located in the 0,104 0,104 0,093 0,095 0,095
capital town (dummy) (1.44) (1.43) (1.28) (1.30) (1.30)
Export dummy 0,251 0,251 0,265 0,258 0,258
(3.32)*** (3.32)*** (3.41)*** (3.31)*** (3.31)***
Firm has as an ISO 0,413 0,413 0,388 0,384 0,383
certification (dummy) (5.65)*** (5.63)*** (5.03)*** (4.97)*** (4.94)***
Trade union presence 0,12 0,12 0,114 0,113 0,112
within the firm (dummy) (2.04)** (2.03)** (1.93)* (1.90)* (1.90)*
Capital Stock (log) 0.083 0.083 0.075 0.075 0.075
(9.37)*** (9.35)*** (9.21)*** (9.26)*** (9.22)***
Firm offers training 0,118 0,129 0,104 0,104 0,139
programs (dummy) (2.84)*** (1.32) (2.39)** (2.39)** (1.34)
Training dummy * 100% -0,013 -0,044
domestic dummy (0.12) (0.38)
Workforce characteristics
Experience of the -0,028 -0,028 -0,02 -0,02 -0,02
top manager (log) (1.16) (1.16) (0.75) (0.74) (0.75)
Workers education and 0,08 0,08 0,068 0,069 0,07
skills is a major or severe
constraint (dummy)
(1.26) (1.26) (1.05) (1.07) (1.08)
Access to credit
Firm has an overdraft 0,366 0,478 0,471
or credit facilities (dummy) (5.63)*** (4.43)*** (4.25)***
Overdraft dummy*100% -0,148 -0,138
domestic dummy (1.52) (1.37)
Access and/or cost -0,029 -0,027 -0,028
of financing is a major or
severe constraint (dummy)
(0.28) (0.27) (0.28)
100% of working capital -0,007 -0,009 -0,009
is financed through internal
fund (dummy)
(0.13) (0.17) (0.18)
Observations 3 026 3 026 2 817 2 817 2 817
R-squared 0,57 0,57 0,57 0,57 0,57
Size of the firms, country, year, activity and average education of the workforce dummies are included in all the regressions
Method OLS, Absolute value of robust t statistics in parentheses
* significant at 10%; ** significant at 5%; *** significant at 1%
57