Embed Size (px)
Citation preview
International Journal of Asian Social Science, 2017, 7(1): 63-84
63
† Corresponding author
DOI: 10.18488/journal.1/2017.7.1/1.1.63.84
ISSN(e): 2224-4441/ISSN(p): 2226-5139
© 2017 AESS Publications. All Rights Reserved.
SOCIAL CAPITAL IN SELECTED BUSINESS ASSOCIATIONS OF FOOD PROCESSING SMES IN TANZANIA AND RWANDA: A SYNTHETIC BASED APPROACH
Freddy Jirabi Gamba1 1Faculty of Economics and Management Sciences Institute of Finance Management (IFM), Dar es Salaam, Tanzania
ABSTRACT
The presence of social capital has been instrumental for effective performance and development of business
associations, the private sector and the economy at large. Sometimes social capital has been equated to networking
and associational undertakings in socio-cultural and economic settings. This study analyses the extent to which social
capital is experienced in selected business associations of food processing SMEs in Tanzania and Rwanda in terms of
trust and social cohesion, collective action and information sharing. Target population of the study was food
processing SMEs. Sample size was 145 SMEs. Responses of the subjects were collected through questionnaires and
comparative analysis was used. Based on World Bank Declaration of twin initiatives which states that: “Institutional
reform and the promotion of social capital are key elements on the road to empowerment”? It is observed that
Rwanda had put the twin initiative into practice and enabled the shift of socio-cultural and economic paradigm. It is
concluded that Rwandan business associations have more social capital than Tanzanian ones and so would influence
the private sector and the economy. The implication is that Rwanda as a country with organised and empowering
social capital structures can develop faster than Tanzania.
© 2017 AESS Publications. All Rights Reserved.
Keywords: Social capital, Business association, SMEs, Trust, Collective action, Information sharing.
Contribution/ Originality
This study contributes in the existing literature by comparing social capital in business set-up in countries
belonging to the same regional block. Available literature concern largely with measuring it at the aggregate national
and cross-country frameworks in informal groupings, political and democratic aspects lacking focus on business and
regional orientations.
1. INTRODUCTION
This paper aims at analysing and comparing social capital (SC) in selected business associations (BAs) of food
processing SMEs in Tanzania and Rwanda in terms of trust and social cohesion (TSC), collective action (CA) and
information sharing for attempting to explain differences in development considering that institutional reform is
visibly adopted to both countries. Other social capital elements such as networking, values and norms are embedded
in associations‟ structures (Cote and Healy, 2001). Dimensions of SC categorize BAs as one of the types of networks,
which is a key element in structural SC (Granovetter, 1973; Hazleton and Kennan, 2000). This implies that BAs are
among the constructs of SC. SC and BAs are recognised as catalysts for private sector development in both
developed and developing economies (Bennett and Ramsden, 2007). Though BAs role to provide services that SMEs
International Journal of Asian Social Science
ISSN(e): 2224-4441/ISSN(p): 2226-5139
URL: www.aessweb.com
International Journal of Asian Social Science, 2017, 7(1): 63-84
64
© 2017 AESS Publications. All Rights Reserved.
utilise in economies is well documented in literature less is done in national and regional priority sectors (Pedersen,
2003). Food processing sector is one of priority sectors for economic development in East African countries (URT,
2003; Rotich, 2005; URT, 2005; 2009; Republic of Kenya, 2010; Republic of Rwanda, 2012) where national
programmes such as NSGRP- 2005, Kilimo Kwanza – 2009 and NDV 2025 are promoted in Tanzania, whereas,
Kenya Vision 2030 and Rwanda Vision 2020 are described in Kenya and Rwanda Respectively. Therefore, this sector
commands huge development impact and is documented in various national and regional policies.Elements or
components of SC are described to enrich the analysis of this study (Cote and Healy, 2001; Dudwick et al., 2006;
Sabatini, 2009; Nuzzo, 2010). Moreover, the nexus of SC and BAs is displayed in literature (Hazleton and Kennan,
2000; Goldsmith, 2002; Miruka, 2007). Miruka (2007) assertion that SC is “the organic development of the whole
society” triggers the need for general comparison between East African countries where specificities of Tanzania and
Rwanda can be visualized for a start.
The contexts of Rwanda and Tanzania have been taking opposite directions. Rwanda cultural and economic
trends have been alerting the need of more understanding. It is controversial for example, how the economy of
Rwanda has improved dramatically after the 1994 genocide. The ethnic discrimination associated with lack of trust
between ethnic groups has characterized Rwanda since Belgium colonialism. Historically, Rwanda had strong
exclusive bonding SC within the two giant ethnic groups; the Tutsi and the Hutu. However, lack of trust, social
cohesion and minimal sharing of economically constructive information was dominating (Sullivan et al., 2006).
These shortcomings had resulted to ethnic discrimination, lack of empowerment to entrepreneurs and difficult of
building transparent and focused business networks and associations. Tanzania in the other hand with more than 120
tribes has experienced peace and tranquillity, free movement of people, and lack of visible ethnic discrimination.
However the business performance and change has not been noticeably connected to the context. This implies that
while Rwanda had bonding SC, Tanzania had not put SC into political and productive processes (Fukuyama, 1995;
Healy, 2001). Other Demographic Parameters of Tanzania and Rwanda that can instigate skeptism and need of
understanding performance and development enablers are such that (1) Tanzania‟s geographical area is 39 times
larger than Rwanda‟s area; (2) the Tanzania‟s population is 4.1 times larger than Rwanda‟s population; (3) Rwanda‟s
population density is 8.5 times larger than Tanzanian; (4) More rural populated in Rwanda than Tanzania, whereas,
Urban population is bigger in Tanzania than Rwanda; (5) Rwanda‟s population is growing faster than Tanzanian; (6)
Tanzania has experienced peaceful change of political power while violence has been observed in Rwanda before the
genocide in 1994, Rwanda now is exercising democracy; (7) Entrepreneurs and Business Managers are younger in
Rwanda than Tanzania; The government leaders are younger in Rwanda than in Tanzania. Despite the described
context of Rwanda, the rank that Rwanda holds in the world of economy by now can instigate need of investigating
the reasons and compare with other economies with historically stable political and economic pillars. The experience
of civil wars in Rwanda was an undeniable evidence of lack of SC (Schiff, 1998; Narayan and Pritchett, 1999). There
is a paradigm shift in Rwanda that needed to be understood and in social relations, this can be described as “shifting
from bonding social capital to higher level of social capital”(emphasis added)namely bridging and linking social
capital.
2. METHODOLOGY
The sample size was 145 food processing SMEs belonging to four BAs, two from Rwanda and two from
Tanzania. Responses of the subjects were collected through questionnaires, which were administered among them
and unstructured interview were employed for seeking more insight. The non-response rate was 13%. Questionnaires
were administered among the SMEs operating in Dar es Salaam, Coast and Arusha in Tanzania and Kigali and its
outskirts such as inRwandex, Kinamba 1 and 2, Giticyinyoni, Giticyi Industrial Area, Muhanga, Nyagatare, Kabuye
and Kigali Industrial Area in Rwanda. Convinient sampling technique was used. The analysis is based on synthetic
approach of measuring SC which uses unit-weighted composite variable, where data from each variable are being
International Journal of Asian Social Science, 2017, 7(1): 63-84
65
© 2017 AESS Publications. All Rights Reserved.
equally weighted (Dudwick et al., 2006; Sabatini, 2009; Nuzzo, 2010). The approach combines various SC aspects
and determines the average into a single synthetic measure. The reason of using synthetic approach is the multi-
dimensional nature of the concept of SC.
3. LITERATURE REVIEW
3.1. What is Capital and Social Capital?
The term capital originated from economics. According to Marshall (1920) capital is that part of wealth which
can be used for further production except free gifts of nature. Therefore, money, machines, factories are included in
capital provided they are used in production. Later, the modern forms of capital bearing productive economic
meaning such as human, physical, financial and social capital came into being (Bourdieu, 1986). The term capital has
been commonly used in accounting and finance using terms like initial capital, working capital, share capital, equity
capital, debt capital, paid up capital, and fixed capital. On the other hand Social capital (SC) is “the ability of people
to work together for common purposes in groups and organizations” (Fukuyama, 1995). “SC is defined by its
function. It is not a single entity, but a variety of different entities having two characteristics in common. One, they all
consist of some aspect of social structure, and two, they facilitate certain actions of individuals who are within the
structure” (Coleman, 1990). SC is a common property resource whose value depends on the level of interaction
between people. Therefore, it includes features of social organization such as networks, norms, and social trust that
facilitate coordination and cooperation for mutual benefit (Putnam, 1993). Cote and Healy (2001) define SC as
"networks together with shared norms, values and understandings that facilitate co-operation within or among
groups". The World Bank (WB) is more expansive and suggests: “SC refers to the institutions, relationships, and
norms that shape the quality and quantity of a society‟s social interactions. SC is not just the sum of the institutions
which underpin a society; it is the glue that holds them together”. Miruka (2007) described SC as the organic
development of the whole society. Like Fukuyama (1995) and Coleman (1990); Warren (2008) asserts that the
fundamental function attributed to SC is the ability of people to group together to obtain some collective benefit.
These benefits are for the entire group as well as captured by individuals within the group. Mwangi and Ouma (2012)
demonstrated that SC enables people to attach greater value in their groups which facilitate collective action.
Mwangi and Ouma (2012) further reflects on Bowles and Gintis (2002) who argue that a group is comprised of
people who interact directly, frequently and in multi-faceted ways for creating value. Bowles and Gintis (2002)
further propose that groups lower uncertainty and reduce transaction costs, thereby fostering economic activity at the
micro level, while at the same time providing a new analytical tool to explain some macro phenomena. Bennett and
Ramsden (2007) argues that associations enable access to private information unavailable to markets, monitor
members‟ behaviour and punish individual members who go against the social norms. According to Mwangi and
Ouma (2012) sharing information among members reduces transactions costs, increases the sense of belonging that
facilitates collective decision making while the solidarity and reciprocity that emerge from the networks diminish
opportunistic behaviour.
3.2. The Relationship between Social Capital and BAs
The relationship between SC and BAs is important for establishing their interdependence and co-existence. First,
according Fukuyama (1995) SC presides when people work together in formal or informal setting. This means BAs
are some of settings that enable group tasks, which is argued by Fukuyama (1995) as important for social and
economic progress. This can mean that having an association of people or an institution implies the presence of SC.
However, SC is a precondition and prerequisite for forming and running a BA (Goldsmith, 2002). Second, the three
dimensions of SC namely, structural, relational and cognitive; categorize organizations and associations as one of the
types of networks, which is a key element in structural SC (Granovetter, 1973; Hazleton and Kennan, 2000). This
implies that BAs are among the constructs of SC. Third, SC is an infrastructure as they are economic infrastructure
International Journal of Asian Social Science, 2017, 7(1): 63-84
66
© 2017 AESS Publications. All Rights Reserved.
and enables formation of various voluntary or statutory, and formal or informal social institutions such as civil society
organizations (CSOs) and Professional associations (PAs) which in turn depending on the context, produce different
forms of SC (Granovetter, 1973; Hazleton and Kennan, 2000). Fourth, the co-existence of BAs and SC; There are
debates about the co-existence of BAs and SC. BAs as one of the networks and being voluntary and formal
organizations of business firms based on „acquired‟ status (Miruka, 2007) and informal and birth based status engage
in different negotiations (Moore and Hamalai, 1993). They negotiate and bargain over public policy issues and
internal operations; this needs quality SC (Fukuyama, 1995). The SC builds trust among actors who are within and
without the BA and therefore promotes transparency, freedom of expression and collective action for group
endeavours. This suggests that the presence of SC enables creation of vibrant and well functioning BAs.
Social Capital is one of factors for effective BAs. Doner and Schneider (2000a) gave three factors for ensuring
effective performance of BAs namely; (1) high density of membership which enables BAs‟ adequate member
representation and transparency; (2) valuable selective benefits - the services provided by BAs that promote
opportunities, members‟ motivation to join, commitment and prolonged life span of the BA; and (3) effective internal
mediation for member interests. Bennett (2000) and Bennett and Ramsden (2007) concurred with the factors that they
enable a BA to resolve internal obstacles to collective actions. Dudwick et al. (2006) showed that collective action is
one of SC elements and is about how people work with others in associations in response to crisis. Moreover, Gabbay
and Leenders (2002) noted that collective action is used to deal with constraints beyond enterprise ability. However,
Fukuyama (1995) and others asserted that the effective performance of BAs are facilitated bysocial capital which is
reflected through participation, trust, norms and values, and freedom of expression, advocacy and information
sharing, collective action and empowerment which are important to members in a BA (Woolcock, 2001). Fukuyama
(1995) mapped connectivity between BAs and SC arguing that a well built SC is important for BAs‟ advocacy and
effective support to members. According to Woolcock (2001) SC being the value of social networks, should produce
relations with productive benefits to promote networks such as BAs.
SC contributes not only to the BA performance, but also to enterprise performance through information,
influence, control and power and solidarity benefits to actors (Granovetter, 1973; Coleman, 1988; Ahrne and
Brunsson, 2008). First, Information benefits such as information quality, timeliness, and relevance, backed by mutual
continuous interactions are shared amongst BA members. Information about opportunities such as acquisition of
contract opportunities and current industry innovations and trend, and some externalities such as brokering and
agency activities based on reciprocal flow of information can be shared (Agalo, 2010). Second, SC-generated
influence, control and power benefits include the creation of influence zone that allows actors to get things done and
achieve set goals. This promotes interests and commitment of members towards the social relation and enables them
to negotiate favourably to their interest and become powerful players. According to Ouchi (1980) people who gain
relatively more influence, control and power usually tend to play leadership roles for the future of the relationship and
enterprise performance. Third, solidarity benefits as addressed by Ouchi (1980) and others show that social capital‟s
established norms and beliefs associated with trust and exclusivity in the network allows compliance with set rules
and customs and reduce the need of formal control. This result to lower monitoring costs, higher commitment and
reduced conflict due to more focus to super-ordinate goals (Ouchi, 1980; Adler and Kwon, 2002). Therefore, SC
facilitates BAs in acquisition of resource and functional capabilities necessary for their members‟ enterprise
performance such as financial, physical, technological as well as human capital (Firkin, 2003; Mbura, 2007). It is also
a base for collective action, cost saving and simplification of business operations through acquisition and sharing of
market information and facilities, joint marketing, purchasing and sub-contracting (McCord, 2005; Mbura, 2007;
Rutashobya and Shimba, 2009). Though availability of such SC generated capabilities can enable improved
performance of enterprises, their contribution to SMEs performance is more critical due to SMEs challenging
business environment (OECD, 2013).
International Journal of Asian Social Science, 2017, 7(1): 63-84
67
© 2017 AESS Publications. All Rights Reserved.
3.3. Elements of Social Capital
Elements of SC are (1) trust and social cohesion (TSC), (2) collective action (CA), (3) information sharing (IS)
and (4) network. Trust and social cohesion go together in this study because they are both off-springs of a relational
SC perspective (Hazleton and Kennan, 2000; Dudwick et al., 2006). Social cohesion is the tenacity of social bonds
and their dual potential to include or exclude members of the association. This can be demonstrated through social
events such as weddings, funerals and other seasonal occasions (Hazleton and Kennan, 2000). Trust is referred to as a
sense that members of the social structure (such as BAs) are conducting their relations in good faith and the absence
of individuals who act out of self interest. Trust is the key component of the relational dimension of SC. The
formation of effective and stable relationships depends on the existence of relational SC. Trust is frequently cited as a
major element of SC and is central to relational dimension (Grootaert and Bastelaer, 2002b). Trust has been seen as
both pivotal to developing relationships (Cowles, 1997; Lewicki et al., 1998) and a product of effective relationships.
There two types of trust which are particularly important to SC, benevolence based trust and cognitive based trust.
Benevolence based or affective trust is established upon the perception that others‟ intentions and motives are
mutually beneficial, and that both parties have interpersonal caring. Therefore an individual trusts when they express
confidence in others intentions and motives (Lewicki et al., 1998). Competence based or cognitive trust is grounded
in the belief that others‟ are dependable and reliable. When individuals trust, they believe that others will behave as
expected and meet their obligations (Lewicki et al., 1998)
Collective action (CA) as SC element was primarily mapped by Olson (1965). According to Dudwick et al.
(2006) and World Bank (2006) CA is how depth people work with others in their association on joint projects and/or
in response to a problem or crisis. For business community, CA is used to deal with constraints beyond enterprise
ability (Labianca et al., 1998; Hedaa, 1999; Gabbay and Leenders, 2002). This shows that CA takes place in
organizations or structural social relations. As observed by Meinzen-Dick et al. (2004) CA definitions have in
common the following features: the involvement of a group of people, shared interests, common and voluntary
actions to pursue those shared interests. They also noted that the CA can take a form of cooperation and coordination.
Uphoff (1993) noted that people in CA consider the consequences of violating association expectations regarding
participation norms. Ostrom (1990) described as “the logic of CA” and focuses on getting individuals to pursue their
joint benefits rather than their individual welfare. According to Hirschman (1984) CA happens in two aspects. One is
when there are multiple cases where CA is instigated by adverse experience to which a group of people is affected,
and two, focuses on probing on the conditions under which people take action when there is no expected actions from
regulatory mechanisms. CA is an alternative where formals fail to deliver (Ostrom, 2004). It is carried out by formal
and informal organizations settings, where local networks or local groups organize, cooperate and coordinate actions
to achieve specific short-term purposes.CA can be influenced by a number of factors. First, the characteristics of
resources involved and the knowledge and predictability of such resources (Pretty, 2003). The second factor is the
characteristics of the group involved, which should have an appropriate size and homogeneity; and above all, it
should allow the participants involved in the CAs to increase their social relationships through trust, norms,
reciprocity, obligations and expectations, values and attitudes, culture, information and knowledge,
associations/institutions, rules and sanctions . The third factor is the involved institutional arrangements (North, 1990;
Ostrom, 1990; Evans, 1995). The success will depend on set rules and effective monitoring and sanction systems.
According to Mantino (2010) the rules implemented for CA should be linked to the combination of „human capital‟
(knowledge resources), social capital (trust, reciprocity and other social relations) and „political capital‟(capacity for
CA). Fourth, external forces and authorities also affect CA to a large extent.
Another element of SC is communication and information sharing (IS).These are patterns and means by which
BA or network members receive and share information regarding such issues as BA performance, market conditions,
investment opportunities, and the extent of access to media infrastructures. Networks and trust are the key
components of SC in structural and relational perspectives respectively but communication and IS is one of the

International Journal of Asian Social Science, 2017, 7(1): 63-84
68
© 2017 AESS Publications. All Rights Reserved.
cognitive relations of SC enabling learning and sharing of knowledge. Scholars support that long term economic
change is through the coordination of economic activities, the facilitation of collaborations across social, political,
economic, and cultural divides and the institutionalization of cooperation in a society. The coordination, collaboration
and cooperation is possible only if there is communication and IS between different actors (Murphy, 2002). The
information asymmetry has been a major hindrance in acquiring, distributing and utilizing resources such as
economic/financial, human, physical, organizational and technological capital. SC for example, facilitates policies
formulation, reforms and economic performance through enabling participation, trust, freedom of expression,
advocacy and policy formulation and implementation through effective communication and IS (Fukuyama, 1995).
For SMEs to get public services for legal and statutory operations such as registration, licensing, taxation and
government guarantees need to access information from the sources and share them with trustful people for filtration
and reduction of risks. The acquisition of capabilities such as accessing markets and technical business services, sub-
contracting arrangements, joint marketing, advocacy for a better business and policy environment, depend on access
to information, its infrastructure and information flow (Kotler, 2001; Goldsmith, 2002; Mbura, 2007; Agalo, 2010).
Nuzzo (2010); Sabatini (2009); Putnam (1993) and others have proposed social capital synthetic indicators based
on the combination of different social attitudes. The main reason of this approach is the multi-dimensional nature of
the concept of social capital as advocated by many social scientists (Putnam, 1993; Cote and Healy, 2001). The
synthetic approach combines many different social aspects and determines the average (such as family and friends
network, interest in public affairs, trust in people and institutions and so on) into a single synthetic measure. The
indicator is called synthetic properly because it represents a virtual construction. In other words, is very difficult to
define. On the other hand, outcome-based indicators enable to establish the impact of social capital to a targeted
society (Guiso et al., 2004).
Trust and Social Cohesion - Synthetic based on
Sabatini (2009);Nuzzo (2010);Putnam et al. (1993)
Feeling Valued by the BA
Trust of BA Leaders
Trust of Members of Business Associations
Visiting fellow BA members for business
discussions
Possibilty to Ask / Get Help to man Business on
Absence
Freedom to Speak in BAs
Collective Action - Synthetic based on Sabatini
(2009);Nuzzo (2010)
Participation in collective action
Collective action by confronting the government
Knowing committee members of BAs
Extent of cohesiveness among members
Information sharing - Synthetic based on Sabatini
(2009);Nuzzo (2010)
BA members attendance of events
Likeliness of visiting fellow members
Telephone conversation with fellow members
Knowledge of sources of appropriate information.
Members choice of information source
BA involvement in promoting information sharing
Empowerment/ Provision of Functional/ Operational
Capabilities and Network - Outcome based on Guiso
et al. (2004). This is not covered in this study
Financial Services
Research & Development
Marketing services,
Management & Leadership
Production, Quality of Products and Technology
Trade mission, Trade Fair & Exhibitions
4. FINDINGS
4.1. Social Capital in terms of Trust and Social Cohesion
This section presents findings about levels of trust and social cohesion in BAs. The composite means are
established using SPSS formular for creating Unit-Weighted Composite Variable
TSCC = Mean (TSC1,TSC2, TSC3 TSC4, TSC5,TSC6 TSC7 ..................TSCn)
Where TSCC, is Trust and Social Cohesion Composite
International Journal of Asian Social Science, 2017, 7(1): 63-84
69
© 2017 AESS Publications. All Rights Reserved.
TSC1-n , are various trust and social cohesion variables
Multi-indicators of trust and social cohesion were used to construct SC variable composites, these included:
Members' feeling valued by BAs, members„ trustful to BA leaders, members trust to fellow members, tendency of
visiting businesses of fellow members, Possibility to ask/get help to man business on absence, freedom to speak when
having disagreement to everyone.
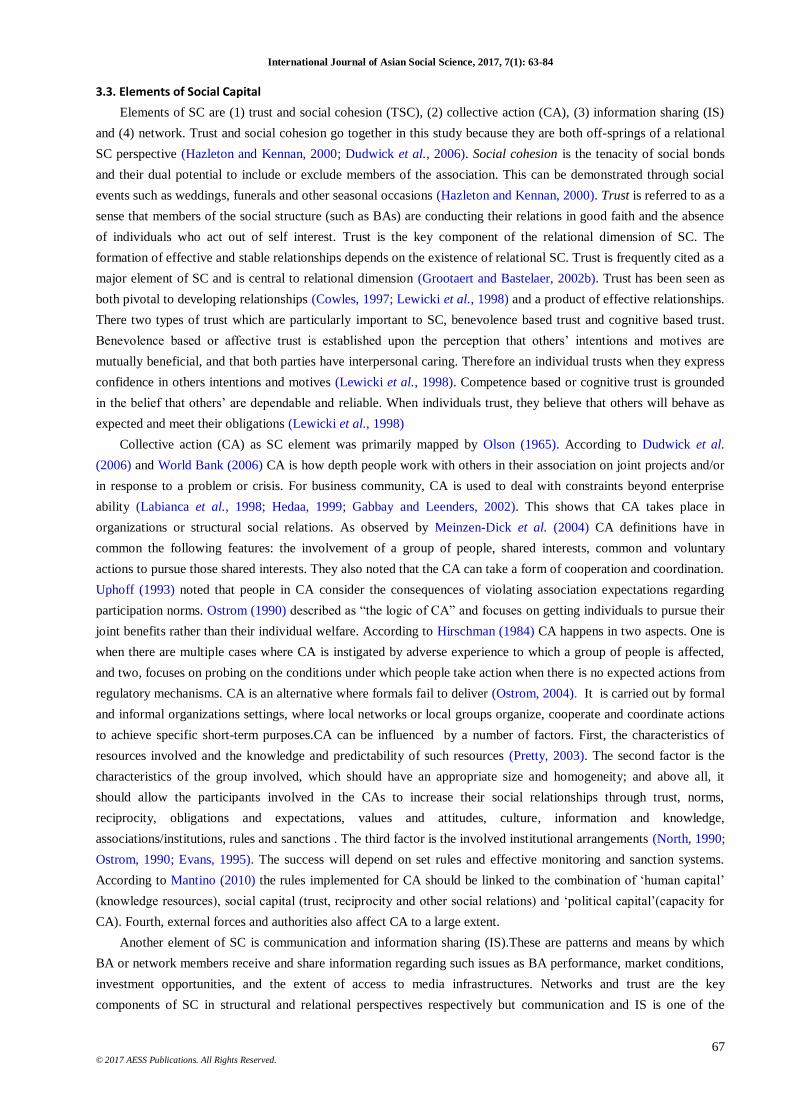
Feeling Valued by the BA: The respondents were asked the following question: “Do you feel valued by the
business association?” The results show that AMMIRWA, APPROBUJAAR and AMAGRO members felt mostly
valued by their associations. Most of TAFOPA members felt not valued. Figure.1 shows the extent to which of BA
members were valued:
Figure-1. Members' feeling valued by BAs
Trust of Business Association Leaders: It was found that all AMAGRO respondents (100%) had trust in their
leaders, because no respondent had indicated any elememt of lack of trust. Similarly, AMMIRWA leaders attracted
such trust to varied extents. Though there is high trust to APPROJUBAAR leaders, there were few respondents who
showed that the leaders were sometimes or somewhat trusted. It was established that there is little trust to TAFOPA
leaders.The results are presented in the Figure 2:
Figure-2. Members Trust of Business Association Leaders
Trust of Members of Business Associations: The BA members were also asked to determine the percentage of
business association„s members who were trustful. The results showed that 49% and 77% of AMMIRWA and
APPROBUJAAR of Rwanda respectively are excellently trustful, hence making 63% of members to be regarded as
excellently trustful in Rwanda. In Tanzania, only 15% of members were regarded as excellently trustful. On average,

International Journal of Asian Social Science, 2017, 7(1): 63-84
70
© 2017 AESS Publications. All Rights Reserved.
it was determined that 49% and 23% of AMMIRWA and APPROBUJAAR of Rwanda were trustful above average.
In Tanzania, 100% and 20% of AMAGRO and TAFOPA members, respectively, reported to have above average
trust. It was also determined that 50% of TAFOPA members were averagely trustful.
Visiting Fellow BA Members for Business Discussion: Respondents were asked to indicate their extent of
visiting each other within one month. The results in Figure 3 show that members of AMMIRWA and AMAGRO
visited their fellow members most frequently followed by APPROBUJAAR. TAFOPA members were not visiting.
Figure-3. Tendency of Visting Fellow Members for Business Discussion
Possibilty to Ask/Get Help to man Business on Absence: Entrepreneurs in Rwanda were more readily to ask/get help
than entrepreneuers from Tanzania. Figure 4 presents the results:
Figure-4. Possibilty to Ask/Get Help to Man Business on Absence
Freedom to Speak in BAs: When responding to a question „„If you disagree with what everyone else agreed on
in a BA meeting, would you feel free to speak out?„„ Figure 5 presents the results. It is showing that with AMAGRO,
a member can disagree with everybody in the association meeting and still feel free and safe to speak out without
fear. There is a mixed results from other associations, about 20% of AMMIRWA respondents that they cannot speak
out their views freely, and 22% of APPROBUJAAR respondents reported to reserve their opinions in case they do
not accept on issues. The TAFOPA respondents indicated that 45% would not speak in case of total disagreement.
International Journal of Asian Social Science, 2017, 7(1): 63-84
71
© 2017 AESS Publications. All Rights Reserved.
Figure-5. Freedom to Speak when Having Disagreement to Everyone
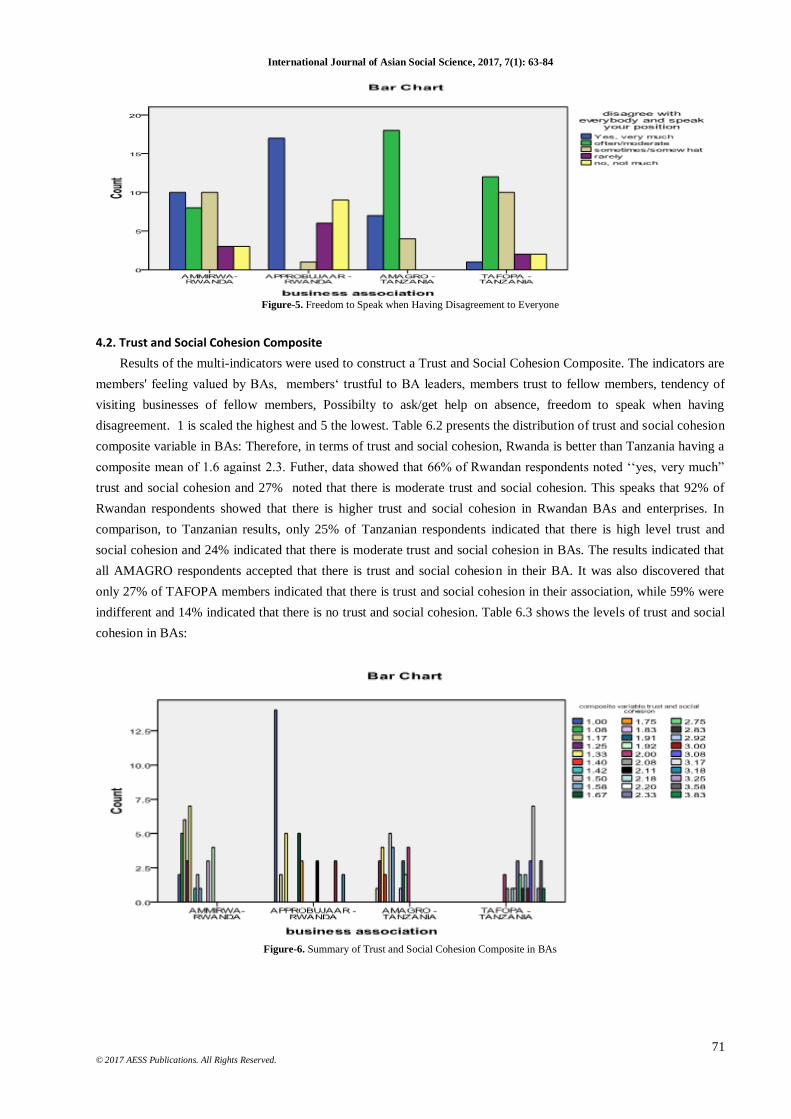
4.2. Trust and Social Cohesion Composite
Results of the multi-indicators were used to construct a Trust and Social Cohesion Composite. The indicators are
members' feeling valued by BAs, members„ trustful to BA leaders, members trust to fellow members, tendency of
visiting businesses of fellow members, Possibilty to ask/get help on absence, freedom to speak when having
disagreement. 1 is scaled the highest and 5 the lowest. Table 6.2 presents the distribution of trust and social cohesion
composite variable in BAs: Therefore, in terms of trust and social cohesion, Rwanda is better than Tanzania having a
composite mean of 1.6 against 2.3. Futher, data showed that 66% of Rwandan respondents noted „„yes, very much”
trust and social cohesion and 27% noted that there is moderate trust and social cohesion. This speaks that 92% of
Rwandan respondents showed that there is higher trust and social cohesion in Rwandan BAs and enterprises. In
comparison, to Tanzanian results, only 25% of Tanzanian respondents indicated that there is high level trust and
social cohesion and 24% indicated that there is moderate trust and social cohesion in BAs. The results indicated that
all AMAGRO respondents accepted that there is trust and social cohesion in their BA. It was also discovered that
only 27% of TAFOPA members indicated that there is trust and social cohesion in their association, while 59% were
indifferent and 14% indicated that there is no trust and social cohesion. Table 6.3 shows the levels of trust and social
cohesion in BAs:
Figure-6. Summary of Trust and Social Cohesion Composite in BAs
International Journal of Asian Social Science, 2017, 7(1): 63-84
72
© 2017 AESS Publications. All Rights Reserved.
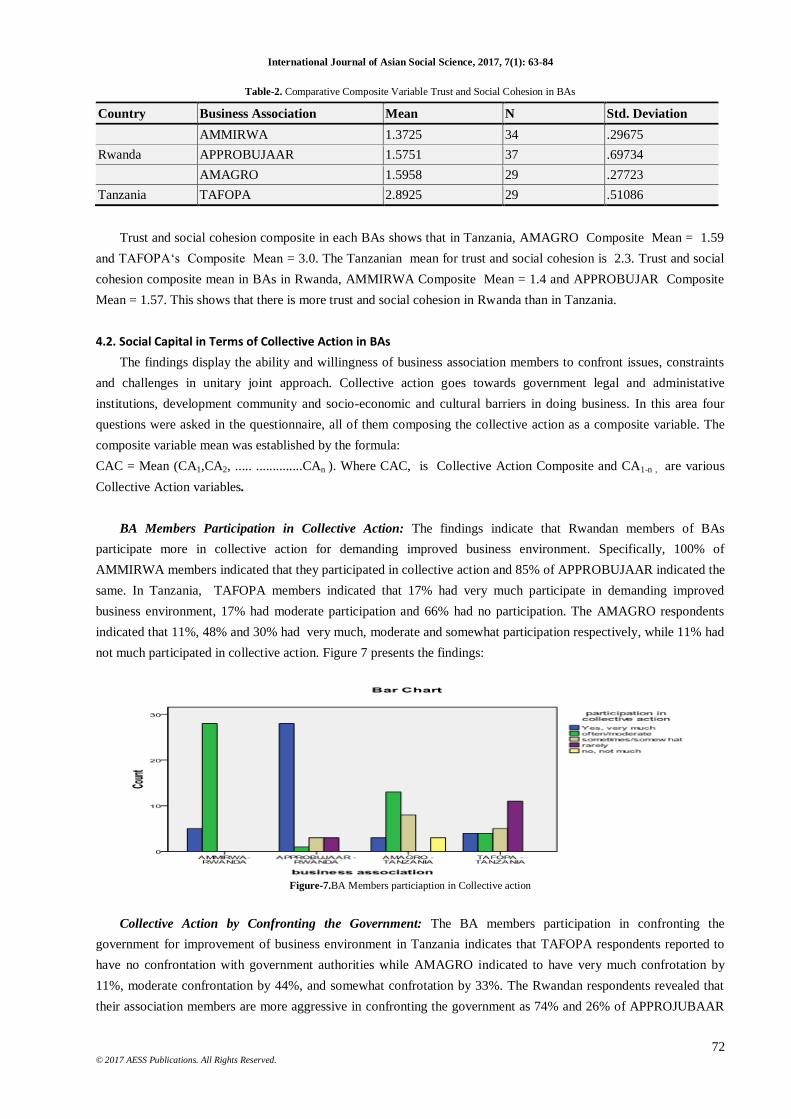
Table-2. Comparative Composite Variable Trust and Social Cohesion in BAs
Country Business Association Mean N Std. Deviation
AMMIRWA 1.3725 34 .29675
Rwanda APPROBUJAAR 1.5751 37 .69734
AMAGRO 1.5958 29 .27723
Tanzania TAFOPA 2.8925 29 .51086
Trust and social cohesion composite in each BAs shows that in Tanzania, AMAGRO Composite Mean = 1.59
and TAFOPA„s Composite Mean = 3.0. The Tanzanian mean for trust and social cohesion is 2.3. Trust and social
cohesion composite mean in BAs in Rwanda, AMMIRWA Composite Mean = 1.4 and APPROBUJAR Composite
Mean = 1.57. This shows that there is more trust and social cohesion in Rwanda than in Tanzania.
4.2. Social Capital in Terms of Collective Action in BAs
The findings display the ability and willingness of business association members to confront issues, constraints
and challenges in unitary joint approach. Collective action goes towards government legal and administative
institutions, development community and socio-economic and cultural barriers in doing business. In this area four
questions were asked in the questionnaire, all of them composing the collective action as a composite variable. The
composite variable mean was established by the formula:
CAC = Mean (CA1,CA2, ..... ..............CAn ). Where CAC, is Collective Action Composite and CA1-n , are various
Collective Action variables.
BA Members Participation in Collective Action: The findings indicate that Rwandan members of BAs
participate more in collective action for demanding improved business environment. Specifically, 100% of
AMMIRWA members indicated that they participated in collective action and 85% of APPROBUJAAR indicated the
same. In Tanzania, TAFOPA members indicated that 17% had very much participate in demanding improved
business environment, 17% had moderate participation and 66% had no participation. The AMAGRO respondents
indicated that 11%, 48% and 30% had very much, moderate and somewhat participation respectively, while 11% had
not much participated in collective action. Figure 7 presents the findings:
Figure-7.BA Members particiaption in Collective action
Collective Action by Confronting the Government: The BA members participation in confronting the
government for improvement of business environment in Tanzania indicates that TAFOPA respondents reported to
have no confrontation with government authorities while AMAGRO indicated to have very much confrotation by
11%, moderate confrontation by 44%, and somewhat confrotation by 33%. The Rwandan respondents revealed that
their association members are more aggressive in confronting the government as 74% and 26% of APPROJUBAAR
International Journal of Asian Social Science, 2017, 7(1): 63-84
73
© 2017 AESS Publications. All Rights Reserved.
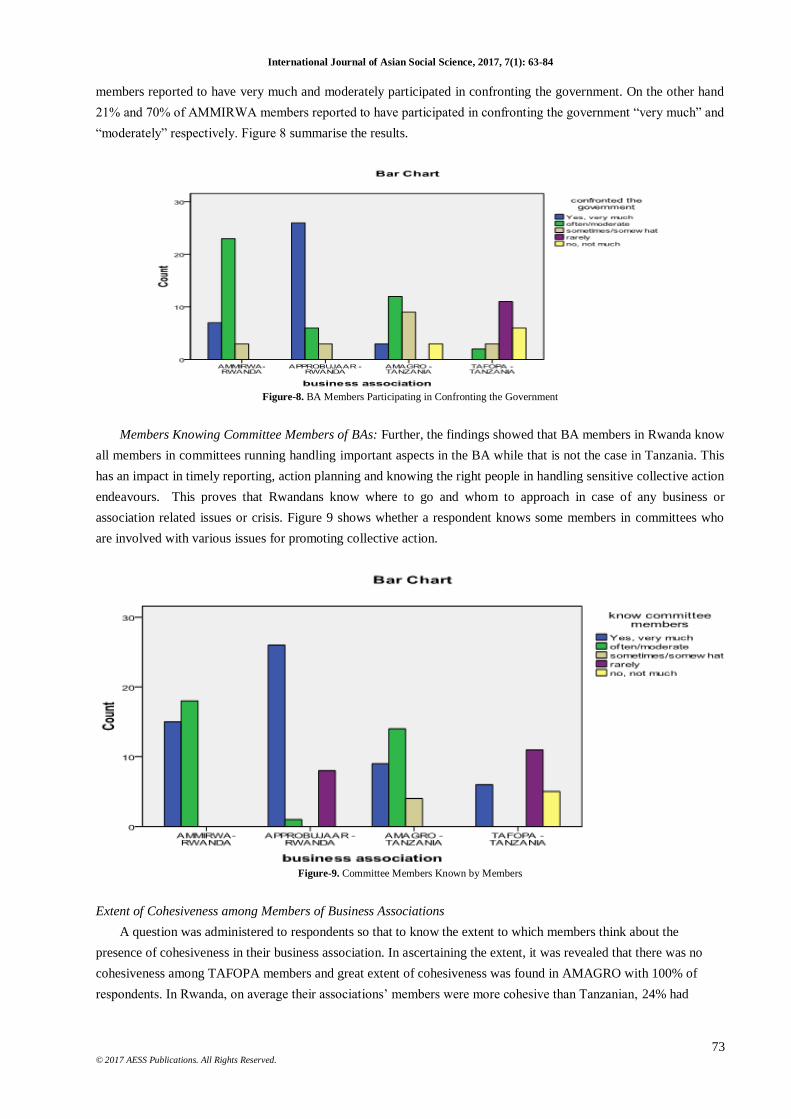
members reported to have very much and moderately participated in confronting the government. On the other hand
21% and 70% of AMMIRWA members reported to have participated in confronting the government “very much” and
“moderately” respectively. Figure 8 summarise the results.
Figure-8. BA Members Participating in Confronting the Government
Members Knowing Committee Members of BAs: Further, the findings showed that BA members in Rwanda know
all members in committees running handling important aspects in the BA while that is not the case in Tanzania. This
has an impact in timely reporting, action planning and knowing the right people in handling sensitive collective action
endeavours. This proves that Rwandans know where to go and whom to approach in case of any business or
association related issues or crisis. Figure 9 shows whether a respondent knows some members in committees who
are involved with various issues for promoting collective action.
Figure-9. Committee Members Known by Members
Extent of Cohesiveness among Members of Business Associations
A question was administered to respondents so that to know the extent to which members think about the
presence of cohesiveness in their business association. In ascertaining the extent, it was revealed that there was no
cohesiveness among TAFOPA members and great extent of cohesiveness was found in AMAGRO with 100% of
respondents. In Rwanda, on average their associations‟ members were more cohesive than Tanzanian, 24% had
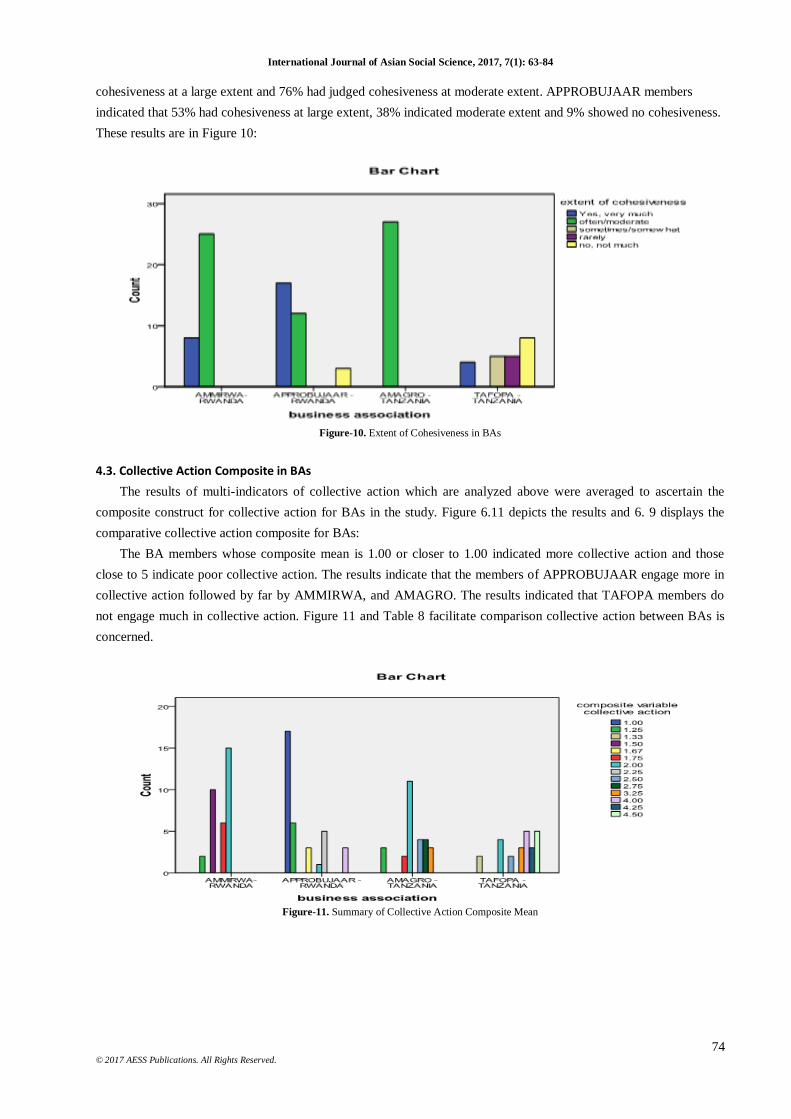
International Journal of Asian Social Science, 2017, 7(1): 63-84
74
© 2017 AESS Publications. All Rights Reserved.
cohesiveness at a large extent and 76% had judged cohesiveness at moderate extent. APPROBUJAAR members
indicated that 53% had cohesiveness at large extent, 38% indicated moderate extent and 9% showed no cohesiveness.
These results are in Figure 10:
Figure-10. Extent of Cohesiveness in BAs
4.3. Collective Action Composite in BAs
The results of multi-indicators of collective action which are analyzed above were averaged to ascertain the
composite construct for collective action for BAs in the study. Figure 6.11 depicts the results and 6. 9 displays the
comparative collective action composite for BAs:
The BA members whose composite mean is 1.00 or closer to 1.00 indicated more collective action and those
close to 5 indicate poor collective action. The results indicate that the members of APPROBUJAAR engage more in
collective action followed by far by AMMIRWA, and AMAGRO. The results indicated that TAFOPA members do
not engage much in collective action. Figure 11 and Table 8 facilitate comparison collective action between BAs is
concerned.
Figure-11. Summary of Collective Action Composite Mean
International Journal of Asian Social Science, 2017, 7(1): 63-84
75
© 2017 AESS Publications. All Rights Reserved.
Table-8. Comparative Composite Variable Collective Action
Country Business association Mean N Std. Deviation
Rwanda AMMIRWA 1.7576 33 .25376
APPROJUBAAR 1.5643 35 .88078
Tanzania AMAGRO 2.2222 27 .56896
TAFOPA 3.3611 24 1.10436
Total 2.1296 119 .99698
The tables shows that there is more social capital in terms of collective action in Rwandan BAs than Tanzanian
BAs. APPROJUBAAR is leading with a composite mean of 1.56 and TAFOPA is the last with a composite mean of
3.36.
4.4. Social Capital in Terms of Communication and Information Sharing in BAs
Sharing of information is one of the key aspects of SC and healthy BA. In principle, lack of information is being
identified as a major constraint in doing business. Though, it is a SC aspect, it is also the reason for establishing BAs
so as to reduce the cost of business operations to entrepreneurs through reducing information assymetry. Information
shared can come from varied sources, shapes and timing; therefore sharing can enable information customization and
validation for business decisions. This sections presents the responses to some questions that were combined to form
a sharing of information composite. These questions are multi-indicators of a single concept of sharing information.
The composite construction of Information Sharing used the following formula:
INFOC = Mean (INFO1,INFO2, INFO3 .. ...........................................INFOn)
Where INFOC, is Information Sharing Composite
INFO1-n , are various Information sharing variables
The questions which were asked to ascertain the extent of information sharing included three parts; first part had
four questions attempting to establish the sharing of information among members or intensity of information sharing,
second part had three questions attempting to establish the understanding and choice of members about the source of
information and whether the BA was a main choice as a source of information, the last part had one question that
traced if the BAs were facilitating sharing of information among members. Most sharing of information include
attending events, visiting a fellow member‟s business, telephone conversations and personal conversation. The
sharing of information is possible when members have information to share, knowing the right source of information
when needing to make a decision without enough information and are ready for sharing information.
4.5. Intensity of Information Sharing in BAs
The intensity of information sharing shows the magnitude of interactions, occasions and connections between
members that gives more opportunity to share information. This intensity is explained in terms of members
attendance to events, visiting their fellow members and telephone conversation made with fellow members. The
empirical findings are as follows:
BA Members Attendance to Events: The data indicate that 67% of respondents of both Rwandan AMMIRWA
and APPROBUJAAR accepted to have very much attending events in the last past months, whereas, AMMIRWA
had 51% and APPROBUJAAR had 82%. The AMMIRWA respondents indicate 100% participation in events when
very much and moderate attendance is combined. In Tanzania, while TAFOPA respondents indicate 20% of
participation, the AMAGRO respondents indicated 100% participation in events when very much and moderate
attendance are combined. The results in Figure 6.12:
International Journal of Asian Social Science, 2017, 7(1): 63-84
76
© 2017 AESS Publications. All Rights Reserved.
Figure-12. BA Members„ Attendance of Events
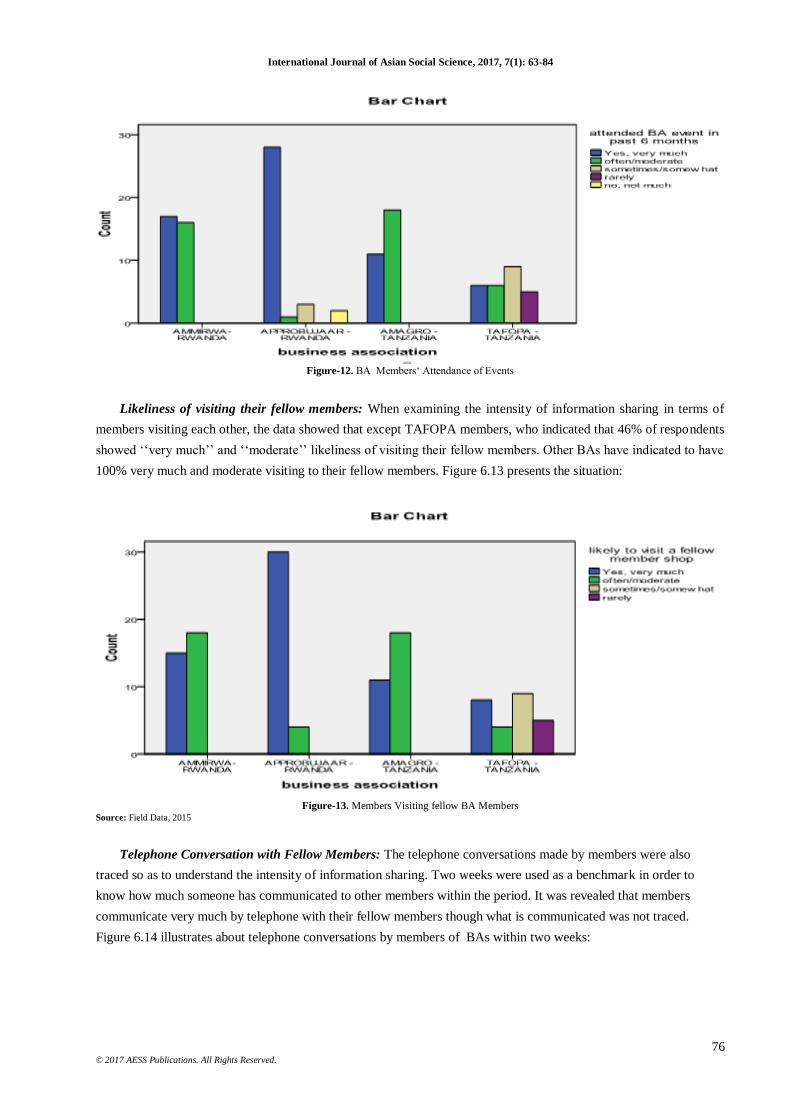
Likeliness of visiting their fellow members: When examining the intensity of information sharing in terms of
members visiting each other, the data showed that except TAFOPA members, who indicated that 46% of respondents
showed „„very much‟‟ and „„moderate‟‟ likeliness of visiting their fellow members. Other BAs have indicated to have
100% very much and moderate visiting to their fellow members. Figure 6.13 presents the situation:
Figure-13. Members Visiting fellow BA Members
Source: Field Data, 2015
Telephone Conversation with Fellow Members: The telephone conversations made by members were also
traced so as to understand the intensity of information sharing. Two weeks were used as a benchmark in order to
know how much someone has communicated to other members within the period. It was revealed that members
communicate very much by telephone with their fellow members though what is communicated was not traced.
Figure 6.14 illustrates about telephone conversations by members of BAs within two weeks:

International Journal of Asian Social Science, 2017, 7(1): 63-84
77
© 2017 AESS Publications. All Rights Reserved.
Figure-14. Telephone Conversation with Fellow Members Within Two Weeks
Knowledge and Choice of Source of Information by Members: The knowledge of source of appropriate
information is crucial for right decision making and choice of source of information. The results show that the
members of AMMIRWA, APPROJUBAAR and AMAGRO know very much and moderately where to get
appropriate information (see Figure 6.15). Nevertheless, APPROJUBAAR and TAFOPA members seem to have not
expected their business association as a main source of information. The statistics show that 100% of both
AMMIRWA and AMAGRO members who were respondents to this study see their association as a main source of
information in “very much” (by 60%) and “moderate” (by 40%). Figure 6.15 shows the members‟ choice of BAs as a
source of information:
Figure-15. Members Knowing Source of Appropriate Information

International Journal of Asian Social Science, 2017, 7(1): 63-84
78
© 2017 AESS Publications. All Rights Reserved.
Figure-16. Members Choice of a BA as a Source of Information
Involvement of BAs in Promoting Information Sharing:The results indicate that BAs in Rwanda engage more
in promoting of information sharing than Tanzanian associations. Though that is the amalgamated fact, it shows that
the AMAGRO in Tanzania is equally promoting information sharing as Rwandan associations while TAFOPA is
lagging far behind. The analyzed data indicate that 15 out of 33 AMMIRWA respondents responded that their
association was “very much” promoting information sharing, this is 45% of AMMIRWA respondents while 55%
showed that sharing of information was promoted “moderately”. In APPROBUJAR, 28 out of 34 respondents
responded that their association was “very much” promoting information sharing. This is 82% of APPROBUJAAR
respondents while 18% showed that sharing of information was promoted “moderately”. It is noted that there was no
Rwandan respondent who denied the engagement of their association in promoting information sharing. On the other
hand all AMAGRO members (of Tanzania) also did not deny the participation in information sharing; 10 out of 29
and 19 out of 29 respondents being 34% and 66% indicated that their association was promoting information sharing
“very much” and “moderately” respectively. However, 70% of TAFOPA members indicated that their association
did not promote information sharing at all. Table 6.12 shows the results about the extent BAs involve in promotion
of information sharing:
Table-11.Business Associations„ Promotion of Information Sharing
Business association
Total
BA Promote info
sharing RWANDA TANZANIA
AMMIRWA APPROBUJAAR AMAGRO TAFOPA
“Yes, very much” 15 28 10 4 57
“often/moderate” 18 6 19 4 47
“sometimes” 0 0 0 18 18
Total 33 34 29 26 122
4.6. Information Sharing Composite in BAs
Information sharing construct made from questions bearing multi-indicators of information sharing showed the
concentrated mean scored for sampled BAs. The results indicate that the members from AMMIRWA,
APPROBUJAAR and AMAGRO are used to share information while those from TAFOPA hardly share information.
The members whose composite mean is 1.00 or closer to 1.00 indicated more information sharing and those close to 5
indicate poor information sharing. The composite mean for TAFOPA for example, concentrated between 2.88 to 3.32
International Journal of Asian Social Science, 2017, 7(1): 63-84
79
© 2017 AESS Publications. All Rights Reserved.
showing that 60% of their members were not sharing information. APPROJUBAAR members indicated to have
highly sharing information.
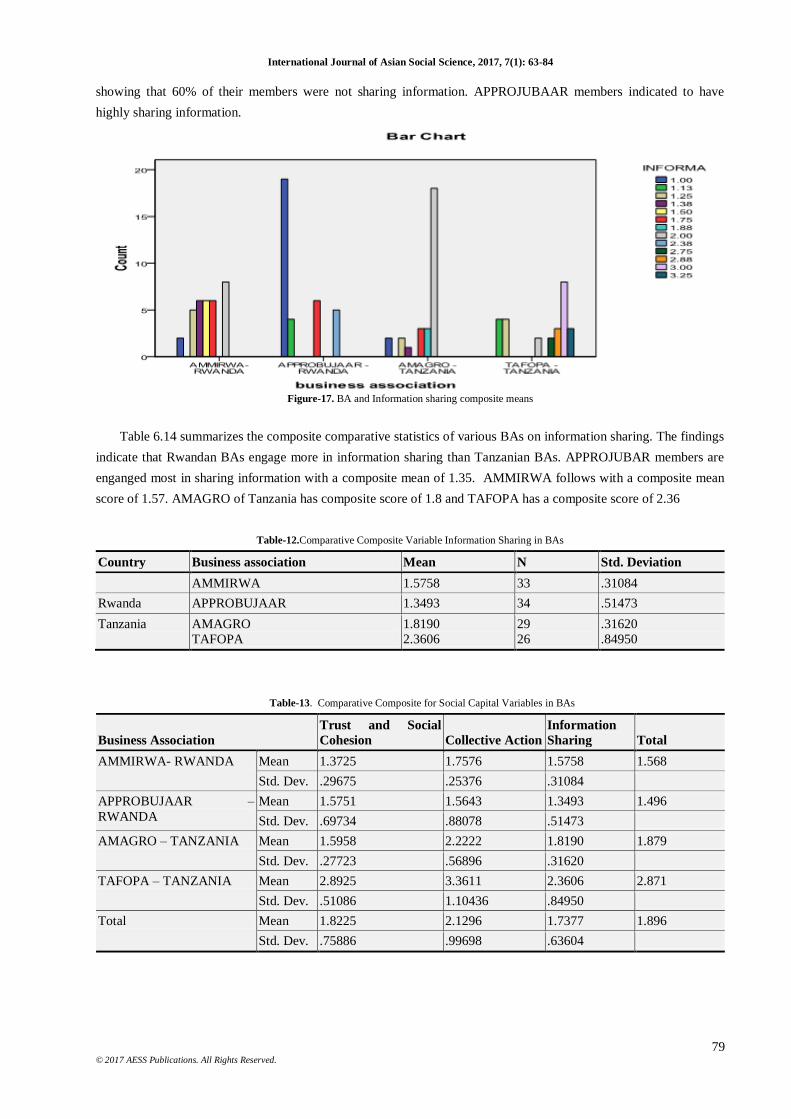
Figure-17. BA and Information sharing composite means
Table 6.14 summarizes the composite comparative statistics of various BAs on information sharing. The findings
indicate that Rwandan BAs engage more in information sharing than Tanzanian BAs. APPROJUBAR members are
enganged most in sharing information with a composite mean of 1.35. AMMIRWA follows with a composite mean
score of 1.57. AMAGRO of Tanzania has composite score of 1.8 and TAFOPA has a composite score of 2.36
Table-12.Comparative Composite Variable Information Sharing in BAs
Country Business association Mean N Std. Deviation
AMMIRWA 1.5758 33 .31084
Rwanda APPROBUJAAR 1.3493 34 .51473
Tanzania AMAGRO
TAFOPA
1.8190
2.3606
29
26
.31620
.84950
Table-13. Comparative Composite for Social Capital Variables in BAs
Business Association
Trust and Social
Cohesion Collective Action
Information
Sharing Total
AMMIRWA- RWANDA Mean 1.3725 1.7576 1.5758 1.568
Std. Dev. .29675 .25376 .31084
APPROBUJAAR –
RWANDA
Mean 1.5751 1.5643 1.3493 1.496
Std. Dev. .69734 .88078 .51473
AMAGRO – TANZANIA Mean 1.5958 2.2222 1.8190 1.879
Std. Dev. .27723 .56896 .31620
TAFOPA – TANZANIA Mean 2.8925 3.3611 2.3606 2.871
Std. Dev. .51086 1.10436 .84950
Total Mean 1.8225 2.1296 1.7377 1.896
Std. Dev. .75886 .99698 .63604
International Journal of Asian Social Science, 2017, 7(1): 63-84
80
© 2017 AESS Publications. All Rights Reserved.
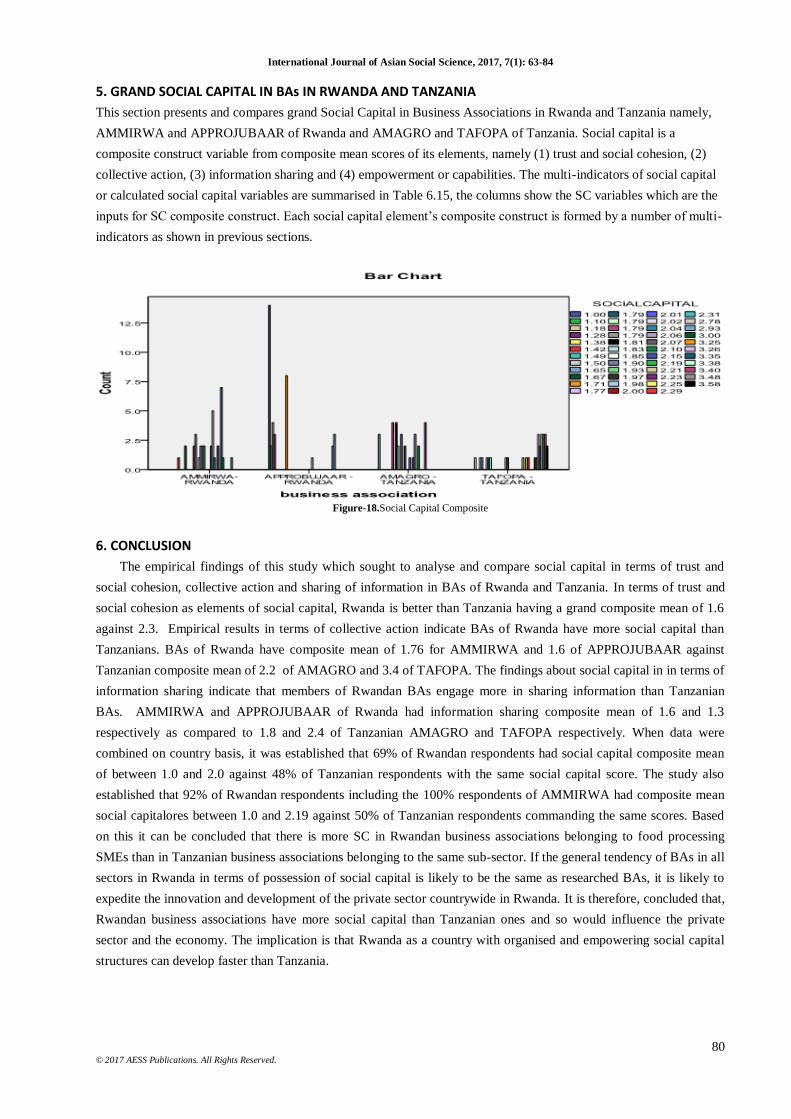
5. GRAND SOCIAL CAPITAL IN BAs IN RWANDA AND TANZANIA
This section presents and compares grand Social Capital in Business Associations in Rwanda and Tanzania namely,
AMMIRWA and APPROJUBAAR of Rwanda and AMAGRO and TAFOPA of Tanzania. Social capital is a
composite construct variable from composite mean scores of its elements, namely (1) trust and social cohesion, (2)
collective action, (3) information sharing and (4) empowerment or capabilities. The multi-indicators of social capital
or calculated social capital variables are summarised in Table 6.15, the columns show the SC variables which are the
inputs for SC composite construct. Each social capital element‟s composite construct is formed by a number of multi-
indicators as shown in previous sections.
Figure-18.Social Capital Composite
6. CONCLUSION
The empirical findings of this study which sought to analyse and compare social capital in terms of trust and
social cohesion, collective action and sharing of information in BAs of Rwanda and Tanzania. In terms of trust and
social cohesion as elements of social capital, Rwanda is better than Tanzania having a grand composite mean of 1.6
against 2.3. Empirical results in terms of collective action indicate BAs of Rwanda have more social capital than
Tanzanians. BAs of Rwanda have composite mean of 1.76 for AMMIRWA and 1.6 of APPROJUBAAR against
Tanzanian composite mean of 2.2 of AMAGRO and 3.4 of TAFOPA. The findings about social capital in in terms of
information sharing indicate that members of Rwandan BAs engage more in sharing information than Tanzanian
BAs. AMMIRWA and APPROJUBAAR of Rwanda had information sharing composite mean of 1.6 and 1.3
respectively as compared to 1.8 and 2.4 of Tanzanian AMAGRO and TAFOPA respectively. When data were
combined on country basis, it was established that 69% of Rwandan respondents had social capital composite mean
of between 1.0 and 2.0 against 48% of Tanzanian respondents with the same social capital score. The study also
established that 92% of Rwandan respondents including the 100% respondents of AMMIRWA had composite mean
social capitalores between 1.0 and 2.19 against 50% of Tanzanian respondents commanding the same scores. Based
on this it can be concluded that there is more SC in Rwandan business associations belonging to food processing
SMEs than in Tanzanian business associations belonging to the same sub-sector. If the general tendency of BAs in all
sectors in Rwanda in terms of possession of social capital is likely to be the same as researched BAs, it is likely to
expedite the innovation and development of the private sector countrywide in Rwanda. It is therefore, concluded that,
Rwandan business associations have more social capital than Tanzanian ones and so would influence the private
sector and the economy. The implication is that Rwanda as a country with organised and empowering social capital
structures can develop faster than Tanzania.
International Journal of Asian Social Science, 2017, 7(1): 63-84
81
© 2017 AESS Publications. All Rights Reserved.
REFERENCES
Adler, P. and S.-W. Kwon, 2002. Social capital: Prospects for a new concept. Academy of Business Review, 27(1): 17-40.
Agalo, V., 2010. Informal cross border trade in East African community: Implications for regional integration and development .
Nairobi: CUTS Africa Resource Centre.
Ahrne, G. and N. Brunsson, 2008. Meta-organizations. Cheltenham: Edward Elgar.
Bennett, R. and M. Ramsden, 2007. The contribution of business associations to SMEs: Strategy, bundling or reassurance?
International Small Business Journal, 25(1): 49-76.
Bennett, R.J., 2000. The logic of membership of sectoral business associations. Review of Social Economy, 58(1): 17-42.
Bourdieu, P., 1986. The forms of Capital, in J. Richardson, ed. Handbook of theory and research for the sociology of education.
Westport: Greenwood Press.
Bowles, S. and H. Gintis, 2002. Social capital and community governance. Economic Journal, 112(483): 419–436.
Coleman, J., 1988. Social capital in the creation of human capital. American Journal of Sociology, 94(Supplement): S95-S120.
Coleman, J., 1990. Foundations of social theory. Cambridge: Harvard University Press.
Cote, S. and T. Healy, 2001. The well-being of nations. The role of human and social capital. Paris: Organisation for Economic
Co-operation and Development.
Cowles, D., 1997. The role of trust in customer relationships. Management Decision, 35(4): 273-282.
Doner, R. and B. Schneider, 2000a. Business associations and economic development: Why some associations contribute more
than others. Business and Politics, 2(3): 261-288.
Dudwick, N., K. Kuehnast, V. Jones and M. Woolcock, 2006. Analyzing social capital in context: A guide to using qualitative
methods and data. Available from http://www.worldbank.org/poverty/scapital/htm [Accessed 12/6/ 2012].
Evans, P., 1995. Government action, social capital and development: Reviewing the evidence on synergy. Princeton, N.J:
Princeton University Press.
Firkin, P., 2003. Entrepreneurship capital. In De Bruin, A. (Ed). Entrepreneurship: New perspective in a global Age. Aldershot:
Ashgate. pp: 57-75.
Fukuyama, F., 1995. Social capital and the global economy. Foreign Affairs, 74(5): 89-103, quoted in Halpern, D. (1999) Social
capital: the new golden goose. Faculty of Social and Political Sciences, Cambridge University. Unpublished Review.
Gabbay, S. and R. Leenders, 2002. Social capital of organizations: From social structure to the management of corporate social
capital (Working Paper). Groningen: Univ. of Groningen, Research Institute SOM (Systems, Organisations and
Management).
Goldsmith, A., 2002. Business associations and better governance in Africa. Public Administration Development, 22(1): 39–49.
Granovetter, M., 1973. The strength of weak ties. American Journal of Sociology, 78(6): 1360-1380.
Grootaert, C. and V. Bastelaer, 2002b. Introduction and overview. 1-7 in the role of social capital in development. (Eds). Bastelaer
V. Melbourne: Cambridge University Press.
Guiso, L., P. Sapienza and L. Zingales, 2004. The role of social capital in financial development. American Economic Review,
94(3): 526-556.
Hazleton, V. and W. Kennan, 2000. Social capital: Reconceptulizing the bottom line. Corporate Communications: An International
Journal, 5(2): 81-86.
Healy, T., 2001. Health promotion and social capital. Conference Paper. International Evidence for the impact of Social Capital on
Well Being. National University of Ireland, Galway.
Hedaa, L., 1999. Black holes in networks. Advances in International Marketing, 9(1): 131-145.
Hirschman, A., 1984. Getting ahead collectively: Grassroots organizations in Latin America. New York: Pergamon Press.
Kotler, P., 2001. Marketing management. 10th Edn., New Delhi: Prentice Hall.
Labianca, G., D.J. Brass and B. Gray, 1998. Social networks and perceptions of intergroup conflict: The role of negative
relationships and third parties. Academy of Management Journal, 41(1): 55-67.
International Journal of Asian Social Science, 2017, 7(1): 63-84
82
© 2017 AESS Publications. All Rights Reserved.
Lewicki, R.J., D.J. McAllister and R.J. Bies, 1998. Trust and distrust: New relationships and realities. Academy of Management
Review, 23(1): 438-458.
Mantino, F., 2010. Understanding delivery mechanisms in EU rural development policies: An institutional approach. Paper
Presented at the 118th Seminar of the EAAE Rural Development: Governance, Policy Design and Delivery, Ljubljana,
Slovenia August 25–27.
Marshall, A., 1920. Principles of economics. London: Macmillan.
Mbura, O., 2007. The role of entrepreneurial networks in the acquisition of marketing information (MI) resources: Selected small
manufacturing firms in Tanzania. PhD Thesis,University of Dar es Salaam.
McCord, M.T., 2005. The role of business associations, civil society and media in addressing corruption. Romania: CIPE.
Meinzen-Dick, R., M. Di Gregorio and N. McCarthy, 2004. Methods for studying collective action in rural development. Agric
Syst, 82(3): 197–214.
Miruka, O.C., 2007. Social capital and good governance in Kenyan public provisioning. PhD Thesis, University of
Witswatersrand, Johanesburg.
Moore, P. and L. Hamalai, 1993. Economic liberalization, political pluralism and business associations in developing countries.
World Development, 21(12): 1895-1912.
Murphy, J., 2002. Networks, trust, and innovation in Tanzania‟s manufacturing sector. World Development, 30(4): 591-619.
Mwangi, I. and A. Ouma, 2012. Social capital and access to credit in Kenya. American Journal of Social and Management
Sciences, 3(1): 8-16.
Narayan, D. and L. Pritchett, 1999. Cents and sociability: Household income and social capital in rural Tanzania. Economic
Development and Cultural Change, 47(4): 871-897.
North, D., 1990. Institutions, institutional change, and economic performance. New York: Cambridge University Press.
Nuzzo, G., 2010. Un seconolo di statistiche sociali: Persistenza oconvergenza tra le regioni Italiane? Quaderni dell‟Ufficio
Ricerche Storiche Banca d‟Italia N.11 December 2006.
OECD, 2013. Providing agri-environmental public goods through collective action. Paris: OECD Publishing.
Olson, M., 1965. The logic of collective action. Cambridge: Harvard University Press.
Ostrom, E., 1990. Governing the commons: The evolution of institutions for collective action. New York: Cambridge University
Press.
Ostrom, E., 2004. Understanding collective action. In: Meinzen-Dick R, Gregorio M D (Eds). Collective action and property rights
for sustainable development, 2020 vision for food, agriculture and the environment. Washington: Focus 11, IFPRI
International Food Policy Research Institute.
Ouchi, W., 1980. Markets, bureaucracies and clans. A¬dministrative Science Quarterly, 25: 129-141.
Pedersen, P., 2003. Flexibility, networks and clusters: Strategies of small enterprise development in unstable developing
economies. In Kappel, R., Dornberger, U., Meier, M., and Rietdorf, U (Eds). Hamburg: Klein- und Mittelunternehmen in
Entwicklungslaender.
Pretty, J., 2003. Social capital and the collective management of resources. Science, 302(5652): 1912–1914.
Putnam, R., 1993. The prosperous community: Social capital and public life. American Prospect, 4(13): 35-42.
Putnam, R., L. Leonardi and R. Nanetti, 1993. Making democracy work. Civil traditions in modern Italy. New Jersey: Princeton.
Republic of Kenya, 2010. Kenya vision 2030. Available from www.vision2030.go.ke [Accessed 20/7/2012].
Republic of Rwanda, 2012. Rwanda vision 2020. Available from www.gov.rw [Accessed 15 March, 2013].
Rotich, M.C., 2005. Food processing: Agro industries: Policy and strategies to encourage food value addition in an industrial
setting. Workshop on Value Addition on Agricultural Products Nairobi 3rd – 4th March 2005.
Rutashobya, L. and A. Shimba, 2009. Networks, social networks and entrepreneurial outcomes in Tanzania. Journal of African
Business, 10(1): 67-83.
Sabatini, F., 2009. Social capital as social networks: A new framework for measurement and an empirical analysis of its
determinants and consequences. Journal of Socio-Economics, 38(3): 429-442.

International Journal of Asian Social Science, 2017, 7(1): 63-84
83
© 2017 AESS Publications. All Rights Reserved.
Schiff, M., 1998. Regional integration as diplomacy. World Bank Economic Review, Oxford University Press, 12(2): 271-295.
Sullivan, J., K. Bettcher and A. Shkolnikov, 2006. Business associations, business climate, and economic growth: Evidence from
transition economies. Washington DC: CIPE.
Uphoff, N., 1993. Grassroots organizations and NGOs in rural development: Opportunities with diminishing states and expanding
markets: World Development, 21(4): 607-622.
URT, 2003. Tanzania SME development policy, 2003. Mkukuta II, NDV 2025, Kilimo KWANZA. Available from
www.tanzania.go.tz [Accessed April, 2012].
URT, 2005. National strategy for growth and reduction of poverty 2005-2010. Available from www.tanzania.go.tz [Accessed 22
May, 2015].
URT, 2009. Kilimo Kwanza. Available from www.tanzania.go.tz [Accessed June 2015].
Warren, R., 2008. The nature and logic of bad social capital. The handbook of social capital. (Eds). Dario Castiglione, Jan Van
Deth, and Guglielmo Wolleb. NY: OUP.
Woolcock, M., 2001. The place of social capital in understanding social and economic outcomes. ISUMA Canadian Journal of
Policy Research, 2(1): 11-17.
World Bank, 2006. Enhancing agricultural innovation: How to go beyond the strengthening of research systems. Washington: The
World Bank.
BIBLIOGRAPHY
Araujo, L. and G. Easton, 1999. A relational resource perspective on social capital. In R.Th. A. J.B. Leenders and S. M. Gabbay
(Eds). Corporate social capital and liability: Boston: Kluwer. pp: 68-87.
Cohen, S. and N. Kaimenakis, 2007. Intellectual capital and corporate performance in knowledge intensive SMEs. Learning
Organisation, 14(3): 241 – 262.
Coleman, W., 1985. Analysing the associative action of business: Policy advocacy and policy participation. Canadian Public
Administration, 28(3): 413-433.
Daud, S. and Y. Wan, 2010. Knowledge management and firm peformance in SMEs: The role of social capital as a mediating
variable. Asian Academy of Management Journal, 15(2): 135 -155.
Doner, R. and B. Schneider, 2000b. The new institutional economics, business associations and development. ILO Discussion
Papers, 110: 1-25.
Fafchamps, M. and B. Minten, 1999. Social capital and the firm: Evidence from agricultural trade. World Bank, Social Capital
Initiative (SCI), Working Paper No. 17.
Fukuyama, F., 2000. Social capital and civil society international monetary fund Working Paper WP/00/74.24.
Gargiulo, M. and M. Benassi, 1999. The dark side of social capital. In Gabbay, S. M. (Ed.). Corporate social capital and liability.
Amsterdam: Kluwer Academic Publishers.
Geys, B. and Z. Murdoch, 2008. How to make head or tail of bridging and bonding? Addressing the methodological ambiguity.
British Journal of Sociology, 59(3): 435-454.
Ghauli, P., 2001. Using networks to solve export-marketing problems of small and medium firms from developing countries.
European Journal of Marketing, 37(5/6): 728-752.
Grootaert, C., 1997. Social capital: The missing link? In expanding the measure of wealth: Indicators of environmentally
sustainable development. Environmentally Sustainable Development Studies and Monographs Series No. 7. Washington,
DC: The World Bank.
Hall, R. and C. James, 1999. Why do some countries produce more output per worker than others? Quarterly Journal of
Economics, 114(1): 83-116.
Helliwell, J. and R. Putnam, 1995. Economic growth and social capital in Italy. Eastern Economic Journal, 21(3): 295-307.
Jessop, B., 2008. State power: A strategic-relational approach. Cambridge: Polity Press.
International Journal of Asian Social Science, 2017, 7(1): 63-84
84
© 2017 AESS Publications. All Rights Reserved.
Krackhardt, D. and J.R. Hanson, 1993. Informal networks: The company behind the chart. Harvard Business Review, 71(4): 104-
113.
Marshall, G., 1998. A dictionary of sociology. New York: Oxford University Press.
McCormick, D., 1999. African enterprise clusters and industrialization: Theory and reality. World Development, 27(9): 1531–
1552.
McCormick, D. and P. Pedersen, 1996. Small enterprises: Flexibility and networking in an African context. Nairobi:Longhorn
Kenya.
Meghana, A., D. Asli and V. Maksimovic, 2011. Small vs. Young firms across the world contribution to employment, job creation
and growth. 2-3. Policy Research Working Paper; No. WPS 5631. Washington, DC: World Bank. Available from
http://documents.worldbank.org/curated/en/2011/04/16920541/small-vs-young-firms-across-world-contribution-
employment-job-creation-growth [Accessed 10/9/2015].
Mills, J., D. Gibbon, J. Ingram, M. Reed, C. Short and J. Dwyer, 2010. Collective action for effective environmental management
and social learning in Wales. Proceedings of the 9th European IFSA Symposium, 4–7 July 2010. Vienna, Austria.
Nahapiet, J. and S. Ghoshal, 1998. Social capital, intellectual capital and organizational advantage. Academy of Management
Review, 23(2): 242-266.
Nanayakkara, G., H. Wijewardena and A. De Zoysa, 2008. The owner/manager‟s mentality and the financial performance of
SMEs. Journal of Small Business and Enterprise Development, 15(1): 150-161.
Narayan, D., 1999. Bonds and bridges: Social capital and poverty. Policy Research Working Paper 2167. Poverty Reduction and
Economic Management Network. Washington, D.C: World Bank.
Olson, M., 1982. The rise and decline of nations. New Haven, CT: Yale University Press.
Ostrom, E., 2007. Collective action theory. In: Boix C, Stokes S (Eds). The Oxford handbook of comparative politics. Oxford:
Oxford University Press.
Park, S., 2007. The role of trade associations in Notheast Asian economic growth during the 1st half of the 20th century. Asian
Pacific Economic and Business History Conference (APEBH), University of Sydney. 12-14 February.
Pedersen, P., 1997a. Small African towns – between rural networks and urban hierarchies. Aldershot: Avebury.
Putnam, R., 1995. Bowling alone: America's declining social capital. Journal of Democracy, 6(1): 65-78.
Putnam, R., 2000. Bowling alone - the collapse and revival of American community. New York: Simon & Schuster.
Robu, M., 2013. The dynamic and importance of SMEs in economy. USV Annals of Economics and Public Administration, 13(1-
17): 84-89.
Sen, K., 2010. From collusion to collaboration: State-business relations and economic performance in India. Institute for policy
and development management. Machester: IPPG.
Shimba, A.I., 2006. The impact of networking activities on performance of SMEs: A study of Tanzanian Manufacturing firms.
PhD Thesis, University of Dar es Salaam.
Temple, J., 1998. Initial conditions, social capital and growth in Africa. Journal of African Economies, 7(3): 309–347.
Wilson, P.A., 1997. Building social capital: A learning agenda for 21st century. Urban Studies, 34 (5-6): 745 -760.
World Bank, 1993. The East Asian miracle. New York: Oxford University Press.
World Bank, 2000. World Development Report (2000/2001): Attacking Poverty. New York: Oxford University Press.
World Bank, 2009. World Development Report 2010: Development and Climate Change., Washington D. C: The World Bank.
Zafirovski, M., 2005. Social exchange theory under scrutiny: A positive critique of its economic-behaviorist formulations.
Electronic Journal of Sociology, 2(2): 1-40.
Views and opinions expressed in this article are the views and opinions of the authors, International Journal of Asian Social Science shall not
be responsible or answerable for any loss, damage or liability etc. caused in relation to/arising out of the use of the content.