Embed Size (px)
Citation preview

Social Contagion
Social ContagionModelsBackground
Granovetter’s model
Network version
Groups
Chaos
References
Frame 1/86
Social ContagionPrinciples of Complex Systems
Course 300, Fall, 2008
Prof. Peter Dodds
Department of Mathematics & StatisticsUniversity of Vermont
Licensed under the Creative Commons Attribution-NonCommercial-ShareAlike 3.0 License.
Social Contagion
Social ContagionModelsBackground
Granovetter’s model
Network version
Groups
Chaos
References
Frame 2/86
Outline
Social Contagion ModelsBackgroundGranovetter’s modelNetwork versionGroupsChaos
References
Social Contagion
Social ContagionModelsBackground
Granovetter’s model
Network version
Groups
Chaos
References
Frame 4/86
Social Contagion

Social Contagion
Social ContagionModelsBackground
Granovetter’s model
Network version
Groups
Chaos
References
Frame 5/86
Social Contagion

Social Contagion
Social ContagionModelsBackground
Granovetter’s model
Network version
Groups
Chaos
References
Frame 6/86
Social Contagion
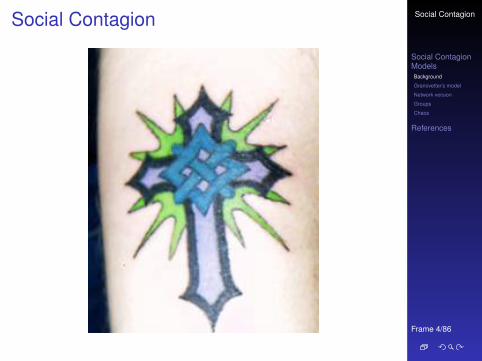
Examples aboundI fashionI strikingI smoking (�) [6]
I residentialsegregation [15]
I ipodsI obesity (�) [5]
I Harry PotterI votingI gossip
I Rubik’s cubeI religious beliefsI leaving lectures
SIR and SIRS contagion possible
I Classes of behavior versus specific behavior: dieting

Social Contagion
Social ContagionModelsBackground
Granovetter’s model
Network version
Groups
Chaos
References
Frame 7/86
Framingham heart study:
Evolving network stories:
I The spread of quitting smoking (�) [6]
I The spread of spreading (�) [5]

Social Contagion
Social ContagionModelsBackground
Granovetter’s model
Network version
Groups
Chaos
References
Frame 8/86
Social Contagion
Two focuses for usI Widespread media influenceI Word-of-mouth influence

Social Contagion
Social ContagionModelsBackground
Granovetter’s model
Network version
Groups
Chaos
References
Frame 9/86
Social Contagion
We need to understand influenceI Who influences whom? Very hard to measure...I What kinds of influence response functions are
there?I Are some individuals super influencers?
Highly popularized by Gladwell [8] as ‘connectors’I The infectious idea of opinion leaders (Katz and
Lazarsfeld) [12]

Social Contagion
Social ContagionModelsBackground
Granovetter’s model
Network version
Groups
Chaos
References
Frame 10/86
The hypodermic model of influence

Social Contagion
Social ContagionModelsBackground
Granovetter’s model
Network version
Groups
Chaos
References
Frame 11/86
The two step model of influence [12]

Social Contagion
Social ContagionModelsBackground
Granovetter’s model
Network version
Groups
Chaos
References
Frame 12/86
The general model of influence

Social Contagion
Social ContagionModelsBackground
Granovetter’s model
Network version
Groups
Chaos
References
Frame 13/86
Social Contagion
Why do things spread?
I Because of system level properties?I Or properties of special individuals?I Is the match that lights the fire important?I Yes. But only because we are narrative-making
machines...I We like to think things happened for reasons...I System/group properties harder to understandI Always good to examine what is said before and
after the fact...

Social Contagion
Social ContagionModelsBackground
Granovetter’s model
Network version
Groups
Chaos
References
Frame 14/86
The Mona Lisa
I “Becoming Mona Lisa: The Making of a GlobalIcon”—David Sassoon
I Not the world’s greatest painting from the start...I Escalation through theft, vandalism, parody, ...

Social Contagion
Social ContagionModelsBackground
Granovetter’s model
Network version
Groups
Chaos
References
Frame 15/86
The completely unpredicted fall of EasternEurope
Timur Kuran: [13, 14] “Now Out of Never: The Element ofSurprise in the East European Revolution of 1989”

Social Contagion
Social ContagionModelsBackground
Granovetter’s model
Network version
Groups
Chaos
References
Frame 16/86
The dismal predictive powers of editors...

Social Contagion
Social ContagionModelsBackground
Granovetter’s model
Network version
Groups
Chaos
References
Frame 17/86
Social Contagion
Messing with social connections
I Ads based on message content(e.g., Google and email)
I Buzz mediaI Facebook’s advertising: Beacon (�)

Social Contagion
Social ContagionModelsBackground
Granovetter’s model
Network version
Groups
Chaos
References
Frame 18/86
Getting others to do things for you
A very good book: ‘Influence’ by Robert Cialdini [7]
Six modes of influence
1. Reciprocation: The Old Give and Take... and Take2. Commitment and Consistency: Hobgoblins of the
Mind3. Social Proof: Truths Are Us4. Liking: The Friendly Thief5. Authority: Directed Deference6. Scarcity: The Rule of the Few

Social Contagion
Social ContagionModelsBackground
Granovetter’s model
Network version
Groups
Chaos
References
Frame 19/86
Examples
I Reciprocation: Free samples, Hare KrishnasI Commitment and Consistency: HazingI Social Proof: Catherine Genovese, JonestownI Liking: Separation into groups is enough to cause
problems.I Authority: Milgram’s obedience to authority
experiment.I Scarcity: Prohibition.

Social Contagion
Social ContagionModelsBackground
Granovetter’s model
Network version
Groups
Chaos
References
Frame 20/86
Getting others to do things for you
I Cialdini’s modes are heuristics that help up us getthrough life.
I Useful but can be leveraged...

Social Contagion
Social ContagionModelsBackground
Granovetter’s model
Network version
Groups
Chaos
References
Frame 21/86
Social Contagion
Other acts of influenceI Conspicuous Consumption (Veblen, 1912)I Conspicuous Destruction (Potlatch)
Social Contagion
Social ContagionModelsBackground
Granovetter’s model
Network version
Groups
Chaos
References
Frame 22/86
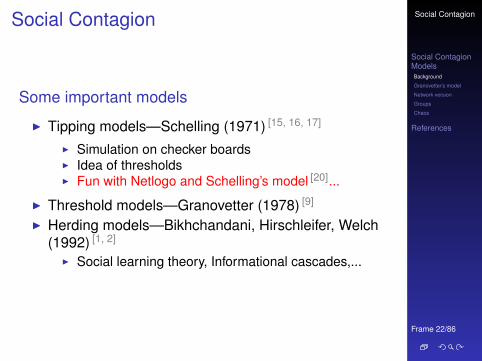
Social Contagion
Some important models
I Tipping models—Schelling (1971) [15, 16, 17]
I Simulation on checker boardsI Idea of thresholdsI Fun with Netlogo and Schelling’s model [20]...
I Threshold models—Granovetter (1978) [9]
I Herding models—Bikhchandani, Hirschleifer, Welch(1992) [1, 2]
I Social learning theory, Informational cascades,...

Social Contagion
Social ContagionModelsBackground
Granovetter’s model
Network version
Groups
Chaos
References
Frame 23/86
Social contagion models
ThresholdsI Basic idea: individuals adopt a behavior when a
certain fraction of others have adoptedI ‘Others’ may be everyone in a population, an
individual’s close friends, any reference group.I Response can be probabilistic or deterministic.I Individual thresholds can varyI Assumption: order of others’ adoption does not
matter... (unrealistic).I Assumption: level of influence per person is uniform
(unrealistic).

Social Contagion
Social ContagionModelsBackground
Granovetter’s model
Network version
Groups
Chaos
References
Frame 24/86
Social Contagion
Some possible origins of thresholds:
I Desire to coordinate, to conform.I Lack of information: impute the worth of a good or
behavior based on degree of adoption (social proof)I Economics: Network effects or network externalitiesI Externalities = Effects on others not directly involved
in a transactionI Examples: telephones, fax machine, Facebook,
operating systemsI An individual’s utility increases with the adoption
level among peers and the population in general

Social Contagion
Social ContagionModelsBackground
Granovetter’s model
Network version
Groups
Chaos
References
Frame 26/86
Social Contagion
Granovetter’s Threshold model—definitionsI φ∗ = threshold of an individual.I f (φ∗) = distribution of thresholds in a population.I F (φ∗) = cumulative distribution =
∫ φ∗φ′∗=0 f (φ′∗)dφ′∗
I φt = fraction of people ‘rioting’ at time step t .

Social Contagion
Social ContagionModelsBackground
Granovetter’s model
Network version
Groups
Chaos
References
Frame 27/86
Threshold models
0 0.2 0.4 0.6 0.8 10
0.2
0.4
0.6
0.8
1
φ
p
0 0.2 0.4 0.6 0.8 10
0.2
0.4
0.6
0.8
1
φp
I Example threshold influence response functions:deterministic and stochastic
I φ = fraction of contacts ‘on’ (e.g., rioting)I Two states: S and I.

Social Contagion
Social ContagionModelsBackground
Granovetter’s model
Network version
Groups
Chaos
References
Frame 28/86
Threshold models
I At time t + 1, fraction rioting = fraction with φ∗ ≤ φt .I
φt+1 =
∫ φt
0f (φ∗)dφ∗ = F (φ∗)|φt
0 = F (φt)
I ⇒ Iterative maps of the unit interval [0, 1].

Social Contagion
Social ContagionModelsBackground
Granovetter’s model
Network version
Groups
Chaos
References
Frame 29/86
Threshold models
Action based on perceived behavior of others.
0 10
0.2
0.4
0.6
0.8
1
φi∗
A
φi,t
Pr(a
i,t+
1=1)
0 0.5 10
0.5
1
1.5
2
2.5B
φ∗
f (φ∗ )
0 0.5 10
0.2
0.4
0.6
0.8
1
φt
φ t+1 =
F (
φ t)
C
I Two states: S and I.I φ = fraction of contacts ‘on’ (e.g., rioting)I Discrete time update (strong assumption!)I This is a Critical mass model

Social Contagion
Social ContagionModelsBackground
Granovetter’s model
Network version
Groups
Chaos
References
Frame 30/86
Threshold models
0 0.2 0.4 0.6 0.8 10
0.5
1
1.5
2
γ
f(γ)
0 0.2 0.4 0.6 0.8 10
0.2
0.4
0.6
0.8
1
φt
φ t+1
I Another example of critical mass model...

Social Contagion
Social ContagionModelsBackground
Granovetter’s model
Network version
Groups
Chaos
References
Frame 31/86
Threshold models
0 0.2 0.4 0.6 0.8 10
0.5
1
1.5
2
2.5
3
γ
f(γ)
0 0.2 0.4 0.6 0.8 10
0.2
0.4
0.6
0.8
1
φt
φ t+1
I Example of single stable state model

Social Contagion
Social ContagionModelsBackground
Granovetter’s model
Network version
Groups
Chaos
References
Frame 32/86
Threshold models
Implications for collective action theory:
1. Collective uniformity 6⇒ individual uniformity2. Small individual changes ⇒ large global changes

Social Contagion
Social ContagionModelsBackground
Granovetter’s model
Network version
Groups
Chaos
References
Frame 33/86
Threshold models
Chaotic behavior possible [11, 10]
0 0.2 0.4 0.6 0.8 10
0.2
0.4
0.6
0.8
1
xn
F (
x n+1 )
0 0.2 0.4 0.6 0.8 10
0.2
0.4
0.6
0.8
1
xn
F (
x n+1 )
I Period doubling arises as map amplitude r isincreased.
I Synchronous update assumption is crucial

Social Contagion
Social ContagionModelsBackground
Granovetter’s model
Network version
Groups
Chaos
References
Frame 35/86
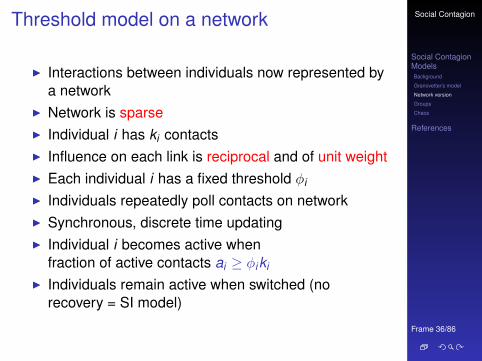
Threshold model on a network
Many years after Granovetter and Soong’s work:
“A simple model of global cascades on random networks”D. J. Watts. Proc. Natl. Acad. Sci., 2002 [19]
I Mean field model → network modelI Individuals now have a limited view of the world
Social Contagion
Social ContagionModelsBackground
Granovetter’s model
Network version
Groups
Chaos
References
Frame 36/86
Threshold model on a network
I Interactions between individuals now represented bya network
I Network is sparseI Individual i has ki contactsI Influence on each link is reciprocal and of unit weightI Each individual i has a fixed threshold φi
I Individuals repeatedly poll contacts on networkI Synchronous, discrete time updatingI Individual i becomes active when
fraction of active contacts ai ≥ φiki
I Individuals remain active when switched (norecovery = SI model)

Social Contagion
Social ContagionModelsBackground
Granovetter’s model
Network version
Groups
Chaos
References
Frame 37/86
Threshold model on a network
t=1
bc
e
a
d
t=1 t=2
c
a
b
a
bc
ee
d d
t=1 t=2 t=3
c
a
bc
e
a
b
e
a
bc
e
d dd
I All nodes have threshold φ = 0.2.

Social Contagion
Social ContagionModelsBackground
Granovetter’s model
Network version
Groups
Chaos
References
Frame 38/86
Snowballing
The Cascade Condition:
If one individual is initially activated, what is theprobability that an activation will spread over a network?
What features of a network determine whether a cascadewill occur or not?

Social Contagion
Social ContagionModelsBackground
Granovetter’s model
Network version
Groups
Chaos
References
Frame 39/86
Snowballing
First study random networks:
I Start with N nodes with a degree distribution pk
I Nodes are randomly connected (carefully so)I Aim: Figure out when activation will propagateI Determine a cascade condition

Social Contagion
Social ContagionModelsBackground
Granovetter’s model
Network version
Groups
Chaos
References
Frame 40/86
Snowballing
Follow active linksI An active link is a link connected to an activated
node.I If an infected link leads to at least 1 more infected
link, then activation spreads.I We need to understand which nodes can be
activated when only one of their neigbors becomesactive.

Social Contagion
Social ContagionModelsBackground
Granovetter’s model
Network version
Groups
Chaos
References
Frame 41/86
The most gullible
Vulnerables:I We call individuals who can be activated by just one
contact being active vulnerablesI The vulnerability condition for node i :
1/ki ≥ φi
I Which means # contacts ki ≤ b1/φicI For global cascades on random networks, must have
a global cluster of vulnerables [19]
I Cluster of vulnerables = critical massI Network story: 1 node → critical mass → everyone.

Social Contagion
Social ContagionModelsBackground
Granovetter’s model
Network version
Groups
Chaos
References
Frame 42/86
Cascade condition
Back to following a link:
I Link from leads to a node with probability ∝ kPk .I Follows from links being random + having k chances
to connect to a node with degree k .I Normalization:
∞∑k=0
kPk = 〈k〉 = z
I SoP(linked node has degree k) =
kPk
〈k〉

Social Contagion
Social ContagionModelsBackground
Granovetter’s model
Network version
Groups
Chaos
References
Frame 43/86
Cascade condition
Next: Vulnerability of linked node
I Linked node is vulnerable with probability
βk =
∫ 1/k
φ′∗=0
f (φ′∗)dφ′∗
I If linked node is vulnerable, it produces k − 1 newoutgoing active links
I If linked node is not vulnerable, it produces no activelinks.

Social Contagion
Social ContagionModelsBackground
Granovetter’s model
Network version
Groups
Chaos
References
Frame 44/86
Cascade condition
Putting things together:
I Expected number of active edges produced by anactive edge =
I∞∑
k=1
(k − 1)βkkPk
z︸ ︷︷ ︸success
+ 0(1− βk )kPk
z︸ ︷︷ ︸failure
I
=∞∑
k=1
(k − 1)kβkPk/z

Social Contagion
Social ContagionModelsBackground
Granovetter’s model
Network version
Groups
Chaos
References
Frame 45/86
Cascade condition
So... for random networks with fixed degree distributions,cacades take off when:
∞∑k=1
k(k − 1)βkPk/z ≥ 1.
I βk = probability a degree k node is vulnerable.I Pk = probability a node has degree k .
Social Contagion
Social ContagionModelsBackground
Granovetter’s model
Network version
Groups
Chaos
References
Frame 46/86
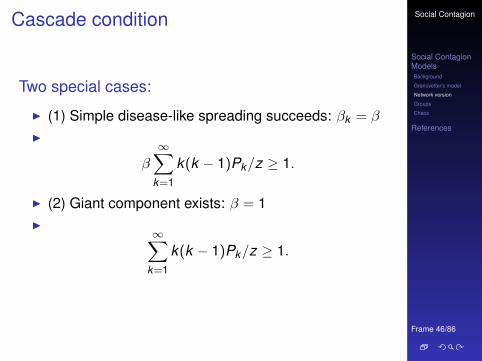
Cascade condition
Two special cases:
I (1) Simple disease-like spreading succeeds: βk = β
I
β
∞∑k=1
k(k − 1)Pk/z ≥ 1.
I (2) Giant component exists: β = 1I
∞∑k=1
k(k − 1)Pk/z ≥ 1.

Social Contagion
Social ContagionModelsBackground
Granovetter’s model
Network version
Groups
Chaos
References
Frame 47/86
Cascades on random networks
1 2 3 4 5 6 70
0.2
0.4
0.6
0.8
1
z
⟨ S
⟩
Example networks
PossibleNo
Cascades
Low influence
Fraction ofVulnerables
cascade sizeFinal
CascadesNo Cascades
CascadesNo
High influence
I Cascades occuronly if size of maxvulnerable cluster> 0.
I System may be‘robust-yet-fragile’.
I ‘Ignorance’facilitatesspreading.

Social Contagion
Social ContagionModelsBackground
Granovetter’s model
Network version
Groups
Chaos
References
Frame 48/86
Cascade window for random networks
1 2 3 4 5 6 70
0.2
0.4
0.6
0.8
1
z
⟨ S
⟩
0.05 0.1 0.15 0.2 0.250
5
10
15
20
25
30
φ
z
cascades
no cascades
infl
uenc
e
= uniform individual threshold
I ‘Cascade window’ widens as threshold φ decreases.I Lower thresholds enable spreading.

Social Contagion
Social ContagionModelsBackground
Granovetter’s model
Network version
Groups
Chaos
References
Frame 49/86
Cascade window for random networks
Social Contagion
Social ContagionModelsBackground
Granovetter’s model
Network version
Groups
Chaos
References
Frame 50/86
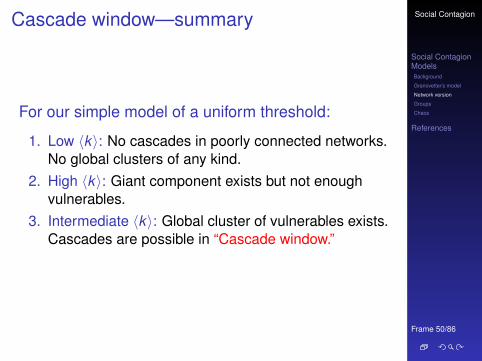
Cascade window—summary
For our simple model of a uniform threshold:
1. Low 〈k〉: No cascades in poorly connected networks.No global clusters of any kind.
2. High 〈k〉: Giant component exists but not enoughvulnerables.
3. Intermediate 〈k〉: Global cluster of vulnerables exists.Cascades are possible in “Cascade window.”

Social Contagion
Social ContagionModelsBackground
Granovetter’s model
Network version
Groups
Chaos
References
Frame 51/86
All-to-all versus random networks
0
0.2
0.4
0.6
0.8
1
a0 a
t
F (
a t+1)
all−to−all networks
A
0
0.2
0.4
0.6
0.8
1
⟨ k ⟩
⟨ S ⟩
random networks
B
0 0.2 0.4 0.6 0.8 10
0.2
0.4
0.6
0.8
1
a0 a’
0at
F (
a t+1)
C
0 5 10 15 200
0.2
0.4
0.6
0.8
1
⟨ k ⟩
⟨ S ⟩
D
0 0.5 10
5
10
φ∗
f (φ ∗)
0 0.5 10
2
4
φ∗
f (φ ∗)

Social Contagion
Social ContagionModelsBackground
Granovetter’s model
Network version
Groups
Chaos
References
Frame 52/86
Early adopters—degree distributions
t = 0 t = 1 t = 2 t = 3
0 5 10 15 200
0.05
0.1
0.15
0.2
t = 0
0 5 10 15 200
0.2
0.4
0.6
0.8
t = 1
0 5 10 15 200
0.2
0.4
0.6
0.8
t = 2
0 5 10 15 200
0.2
0.4
0.6
0.8
t = 3
t = 4 t = 6 t = 8 t = 10
0 5 10 15 200
0.1
0.2
0.3
0.4
0.5
t = 4
0 5 10 15 200
0.1
0.2
0.3
0.4
0.5
t = 6
0 5 10 15 200
0.1
0.2
0.3
0.4
t = 8
0 5 10 15 200
0.1
0.2
0.3
0.4
t = 10
t = 12 t = 14 t = 16 t = 18
0 5 10 15 200
0.05
0.1
0.15
0.2
t = 12
0 5 10 15 200
0.05
0.1
0.15
0.2
t = 14
0 5 10 15 200
0.05
0.1
0.15
0.2
t = 16
0 5 10 15 200
0.05
0.1
0.15
0.2
t = 18
Pk ,t versus k

Social Contagion
Social ContagionModelsBackground
Granovetter’s model
Network version
Groups
Chaos
References
Frame 53/86
The multiplier effect:
1 2 3 4 5 60
0.2
0.4
0.6
0.8
1
navg
S avg
A
1 2 3 4 5 60
1
2
3
4
navg
B
Gain
InfluenceInfluence
Averageindividuals
Top 10% individuals
Cas
cade
siz
e
Cascade size ratio
Degree ratio
I Fairly uniform levels of individual influence.I Multiplier effect is mostly below 1.

Social Contagion
Social ContagionModelsBackground
Granovetter’s model
Network version
Groups
Chaos
References
Frame 54/86
The multiplier effect:
1 2 3 4 5 60
0.2
0.4
0.6
0.8
1
navg
S avg
A
1 2 3 4 5 60
3
6
9
12
navg
B
Cas
cade
siz
e
InfluenceAverageIndividuals
Top 10% individuals Cascade size ratio
Degree ratio
Gain
I Skewed influence distribution example.

Social Contagion
Social ContagionModelsBackground
Granovetter’s model
Network version
Groups
Chaos
References
Frame 55/86
Special subnetworks can act as triggers
i0
A
B
I φ = 1/3 for all nodes

Social Contagion
Social ContagionModelsBackground
Granovetter’s model
Network version
Groups
Chaos
References
Frame 57/86
The power of groups...
despair.com
“A few harmless flakesworking together canunleash an avalancheof destruction.”

Social Contagion
Social ContagionModelsBackground
Granovetter’s model
Network version
Groups
Chaos
References
Frame 58/86
Extensions
I Assumption of sparse interactions is goodI Degree distribution is (generally) key to a network’s
functionI Still, random networks don’t represent all networksI Major element missing: group structure

Social Contagion
Social ContagionModelsBackground
Granovetter’s model
Network version
Groups
Chaos
References
Frame 59/86
Group structure—Ramified random networks
p = intergroup connection probabilityq = intragroup connection probability.

Social Contagion
Social ContagionModelsBackground
Granovetter’s model
Network version
Groups
Chaos
References
Frame 60/86
Bipartite networks
c d ea b
2 3 41
a
b
c
d
e
contexts
individuals
unipartitenetwork

Social Contagion
Social ContagionModelsBackground
Granovetter’s model
Network version
Groups
Chaos
References
Frame 61/86
Context distance
eca
high schoolteacher
occupation
health careeducation
nurse doctorteacherkindergarten
db

Social Contagion
Social ContagionModelsBackground
Granovetter’s model
Network version
Groups
Chaos
References
Frame 62/86
Generalized affiliation model
100
eca b d
geography occupation age
0
(Blau & Schwartz, Simmel, Breiger)

Social Contagion
Social ContagionModelsBackground
Granovetter’s model
Network version
Groups
Chaos
References
Frame 63/86
Generalized affiliation model networks withtriadic closure
I Connect nodes with probability ∝ exp−αd
whereα = homophily parameterandd = distance between nodes (height of lowestcommon ancestor)
I τ1 = intergroup probability of friend-of-friendconnection
I τ2 = intragroup probability of friend-of-friendconnection

Social Contagion
Social ContagionModelsBackground
Granovetter’s model
Network version
Groups
Chaos
References
Frame 64/86
Cascade windows for group-based networksG
ener
alize
d Af
filiat
ion
A
Gro
up n
etwo
rks
Single seed Coherent group seed
Mod
el n
etwo
rks
Random set seed
Rand
om
F
C
D E
B

Social Contagion
Social ContagionModelsBackground
Granovetter’s model
Network version
Groups
Chaos
References
Frame 65/86
Multiplier effect for group-based networks:
4 8 12 16 200
0.2
0.4
0.6
0.8
1
navg
S avg
A
4 8 12 16 200
1
2
3
navg
B
0 4 8 12 160
0.2
0.4
0.6
0.8
1
navg
S avg
C
0 4 8 12 160
1
2
3
navg
D
Degree ratio
Gain
Cascadesize ratio
Cascadesize ratio < 1!
I Multiplier almost always below 1.
Social Contagion
Social ContagionModelsBackground
Granovetter’s model
Network version
Groups
Chaos
References
Frame 66/86
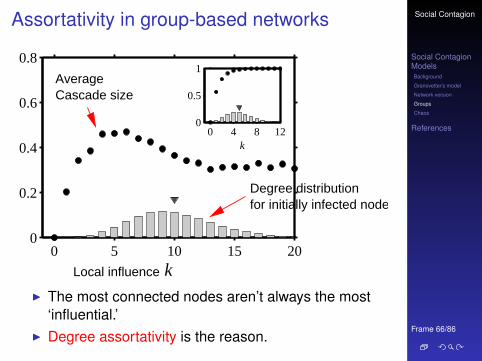
Assortativity in group-based networks
0 5 10 15 200
0.2
0.4
0.6
0.8
k
0 4 8 120
0.5
1
k
AverageCascade size
Local influence
Degree distributionfor initially infected node
I The most connected nodes aren’t always the most‘influential.’
I Degree assortativity is the reason.
Social Contagion
Social ContagionModelsBackground
Granovetter’s model
Network version
Groups
Chaos
References
Frame 67/86
Social contagion
Summary
I ‘Influential vulnerables’ are key to spread.I Early adopters are mostly vulnerables.I Vulnerable nodes important but not necessary.I Groups may greatly facilitate spread.I Seems that cascade condition is a global one.I Most extreme/unexpected cascades occur in highly
connected networksI ‘Influentials’ are posterior constructs.I Many potential influentials exist.

Social Contagion
Social ContagionModelsBackground
Granovetter’s model
Network version
Groups
Chaos
References
Frame 68/86
Social contagion
Implications
I Focus on the influential vulnerables.I Create entities that can be transmitted successfully
through many individuals rather than broadcast fromone ‘influential.’
I Only simple ideas can spread by word-of-mouth.(Idea of opinion leaders spreads well...)
I Want enough individuals who will adopt and display.I Displaying can be passive = free (yo-yo’s, fashion),
or active = harder to achieve (political messages).I Entities can be novel or designed to combine with
others, e.g. block another one.

Social Contagion
Social ContagionModelsBackground
Granovetter’s model
Network version
Groups
Chaos
References
Frame 70/86
Chaotic contagion:
I What if individual response functions are notmonotonic?
I Consider a simple deterministic version:
I Node i has an ‘activation threshold’ φi,1
. . . and a ‘de-activation threshold’ φi,2
I Nodes like to imitate but only up to alimit—they don’t want to be likeeveryone else.
0 10
0.2
0.4
0.6
0.8
1
!i,1
"!i,2
"
A
!i,t
Pr(ai,t+1=1)
0 0.5 10
0.2
0.4
0.6
0.8
1B
!1
"
!2"
0 0.5 10
0.2
0.4
0.6
0.8
1
!1
"
!2"
C
0 0.5 10
0.5
1
0 0.5 10
0.5
1

Social Contagion
Social ContagionModelsBackground
Granovetter’s model
Network version
Groups
Chaos
References
Frame 71/86
Two population examples:
0 10
0.2
0.4
0.6
0.8
1
φi,1∗ φ
i,2∗
A
φi,t
Pr(a
i,t+
1=1)
0 0.5 10
0.2
0.4
0.6
0.8
1B
φ1∗
φ 2∗
0 0.5 10
0.2
0.4
0.6
0.8
1
φ1∗
φ 2∗
C
0 0.5 10
0.5
1
0 0.5 10
0.5
1
I Randomly select (φi,1, φi,2) from gray regions shownin plots B and C.
I Insets show composite response function averagedover population.
I We’ll consider plot C’s example: the tent map.

Social Contagion
Social ContagionModelsBackground
Granovetter’s model
Network version
Groups
Chaos
References
Frame 72/86
Chaotic contagion
Definition of the tent map:
F (x) =
{rx for 0 ≤ x ≤ 1
2 ,
r(1− x) for 12 ≤ x ≤ 1.
I The usual business: look at how F iteratively mapsthe unit interval [0, 1].

Social Contagion
Social ContagionModelsBackground
Granovetter’s model
Network version
Groups
Chaos
References
Frame 73/86
The tent map
Effect of increasing r from 1 to 2.
0 0.2 0.4 0.6 0.8 10
0.2
0.4
0.6
0.8
1
xn
F (
x n+1 )
0 0.2 0.4 0.6 0.8 10
0.2
0.4
0.6
0.8
1
xn
F (
x n+1 )
0 0.2 0.4 0.6 0.8 10
0.2
0.4
0.6
0.8
1
xn
F (
x n+1 )
Orbit diagram:Chaotic behavior increasesas map slope r is increased.

Social Contagion
Social ContagionModelsBackground
Granovetter’s model
Network version
Groups
Chaos
References
Frame 74/86
Chaotic behavior
Take r = 2 case:
0 0.2 0.4 0.6 0.8 10
0.2
0.4
0.6
0.8
1
xn
F (
x n+1 )
I What happens if nodes have limited information?I As before, allow interactions to take place on a
sparse random network.I Vary average degree z = 〈k〉, a measure of
information

Social Contagion
Social ContagionModelsBackground
Granovetter’s model
Network version
Groups
Chaos
References
Frame 75/86
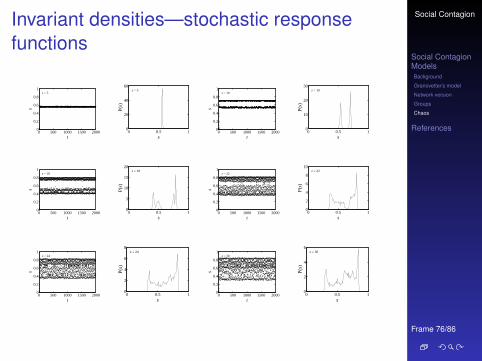
Invariant densities—stochastic responsefunctions
0 500 1000 1500 20000
0.2
0.4
0.6
0.8
1
t
s
z = 5
0 0.5 10
20
40
60
sP(
s)
z = 5
activation time series activation density
Social Contagion
Social ContagionModelsBackground
Granovetter’s model
Network version
Groups
Chaos
References
Frame 76/86
Invariant densities—stochastic responsefunctions
0 500 1000 1500 20000
0.2
0.4
0.6
0.8
1
t
s
z = 5
0 0.5 10
20
40
60
s
P(s)
z = 5
0 500 1000 1500 20000
0.2
0.4
0.6
0.8
1
t
s
z = 10
0 0.5 10
10
20
30
s
P(s)
z = 10
0 500 1000 1500 20000
0.2
0.4
0.6
0.8
1
t
s
z = 18
0 0.5 10
5
10
15
20
s
P(s)
z = 18
0 500 1000 1500 20000
0.2
0.4
0.6
0.8
1
t
s
z = 22
0 0.5 10
2
4
6
8
10
s
P(s)
z = 22
0 500 1000 1500 20000
0.2
0.4
0.6
0.8
1
t
s
z = 24
0 0.5 10
2
4
6
8
s
P(s)
z = 24
0 500 1000 1500 20000
0.2
0.4
0.6
0.8
1
t
s
z = 30
0 0.5 10
2
4
6
sP(
s)
z = 30

Social Contagion
Social ContagionModelsBackground
Granovetter’s model
Network version
Groups
Chaos
References
Frame 77/86
Invariant densities—deterministic responsefunctions for one specific network with〈k〉 = 18
0 500 1000 1500 20000
0.2
0.4
0.6
0.8
1
t
s
z = 18
0 0.5 10
10
20
30
s
P(s)
z = 18
0 500 1000 1500 20000
0.2
0.4
0.6
0.8
1
t
s
z = 18
0 0.5 10
5
10
15
20
25
s
P(s)
z = 18
0 500 1000 1500 20000
0.2
0.4
0.6
0.8
1
t
s
z = 18
0 0.5 10
10
20
30
40
50
s
P(s)
z = 18
0 500 1000 1500 20000
0.2
0.4
0.6
0.8
1
t
s
z = 18
0 0.5 10
10
20
30
40
50
s
P(s)
z = 18
0 500 1000 1500 20000
0.2
0.4
0.6
0.8
1
t
s
z = 18
0 0.5 10
2
4
6
8
s
P(s)
z = 18
0 500 1000 1500 20000
0.2
0.4
0.6
0.8
1
t
s
z = 18
0 0.5 10
10
20
30
s
P(s)
z = 18

Social Contagion
Social ContagionModelsBackground
Granovetter’s model
Network version
Groups
Chaos
References
Frame 78/86
Invariant densities—stochastic responsefunctions
0 500 1000 1500 20000
0.2
0.4
0.6
0.8
1
t
s
z = 100
0 0.5 10
1
2
3
4
s
P(s)
z = 100
0 500 1000 1500 20000
0.2
0.4
0.6
0.8
1
t
s
z = 1000
0 0.5 10
0.5
1
1.5
2
2.5
s
P(s)
z = 1000
Trying out higher values of 〈k〉. . .

Social Contagion
Social ContagionModelsBackground
Granovetter’s model
Network version
Groups
Chaos
References
Frame 79/86
Invariant densities—deterministic responsefunctions
0 500 1000 1500 20000
0.2
0.4
0.6
0.8
1
t
s
z = 100
0 0.5 10
1
2
3
4
s
P(s)
z = 100
0 500 1000 1500 20000
0.2
0.4
0.6
0.8
1
t
s
z = 1000
0 0.5 10
0.5
1
1.5
2
2.5
s
P(s)
z = 1000
0 5000 100000
0.2
0.4
0.6
0.8
1
t
s
z = 100
0 0.5 10
10
20
30
s
P(s)
z = 100
Trying out higher values of 〈k〉. . .

Social Contagion
Social ContagionModelsBackground
Granovetter’s model
Network version
Groups
Chaos
References
Frame 80/86
Connectivity leads to chaos:
Stochastic response functions:

Social Contagion
Social ContagionModelsBackground
Granovetter’s model
Network version
Groups
Chaos
References
Frame 81/86
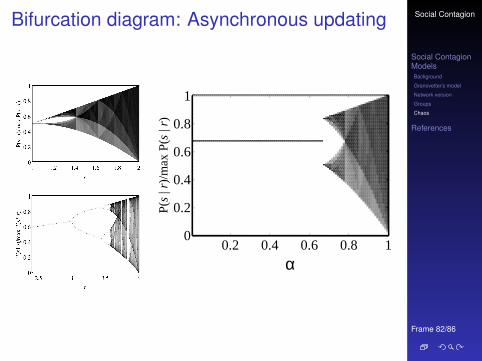
Chaotic behavior in coupled systems
Coupled maps are well explored(Kaneko/Kuramoto):
xi,n+1 = f (xi,n) +∑j∈Ni
δi,j f (xj,n)
I Ni = neighborhood of node i
1. Node states are continuous2. Increase δ and neighborhood size |N |
⇒ synchronization
But for contagion model:
1. Node states are binary2. Asynchrony remains as connectivity increases
Social Contagion
Social ContagionModelsBackground
Granovetter’s model
Network version
Groups
Chaos
References
Frame 82/86
Bifurcation diagram: Asynchronous updating
0.2 0.4 0.6 0.8 10
0.2
0.4
0.6
0.8
1
α
P(s
| r)/
max
P(s
| r)

Social Contagion
Social ContagionModelsBackground
Granovetter’s model
Network version
Groups
Chaos
References
Frame 83/86
References I
S. Bikhchandani, D. Hirshleifer, and I. Welch.A theory of fads, fashion, custom, and culturalchange as informational cascades.J. Polit. Econ., 100:992–1026, 1992.
S. Bikhchandani, D. Hirshleifer, and I. Welch.Learning from the behavior of others: Conformity,fads, and informational cascades.J. Econ. Perspect., 12(3):151–170, 1998. pdf (�)
J. Carlson and J. Doyle.Highly optimized tolerance: A mechanism for powerlaws in design systems.Phys. Rev. Lett., 60(2):1412–1427, 1999. pdf (�)
Social Contagion
Social ContagionModelsBackground
Granovetter’s model
Network version
Groups
Chaos
References
Frame 84/86
References II
J. Carlson and J. Doyle.Highly optimized tolerance: Robustness and designin complex systems.Phys. Rev. Lett., 84(11):2529–2532, 2000. pdf (�)
N. A. Christakis and J. H. Fowler.The spread of obesity in a large social network over32 years.New England Journal of Medicine, 357:370–379,2007. pdf (�)
N. A. Christakis and J. H. Fowler.The collective dynamics of smoking in a large socialnetwork.New England Journal of Medicine, 358:2249–2258,2008. pdf (�)
Social Contagion
Social ContagionModelsBackground
Granovetter’s model
Network version
Groups
Chaos
References
Frame 85/86
References III
R. B. Cialdini.Influence: Science and Practice.Allyn and Bacon, Boston, MA, 4th edition, 2000.
M. Gladwell.The Tipping Point.Little, Brown and Company, New York, 2000.
M. Granovetter.Threshold models of collective behavior.Am. J. Sociol., 83(6):1420–1443, 1978. pdf (�)
M. Granovetter and R. Soong.Threshold models of diversity: Chinese restaurants,residential segregation, and the spiral of silence.Sociological Methodology, 18:69–104, 1988. pdf (�)

Social Contagion
Social ContagionModelsBackground
Granovetter’s model
Network version
Groups
Chaos
References
Frame 86/86
References IV
M. S. Granovetter and R. Soong.Threshold models of interpersonal effects inconsumer demand.Journal of Economic Behavior & Organization,7:83–99, 1986.Formulates threshold as function of price, andintroduces exogenous supply curve. pdf (�)
E. Katz and P. F. Lazarsfeld.Personal Influence.The Free Press, New York, 1955.
T. Kuran.Now out of never: The element of surprise in the easteuropean revolution of 1989.World Politics, 44:7–48, 1991.
Social Contagion
Social ContagionModelsBackground
Granovetter’s model
Network version
Groups
Chaos
References
Frame 87/86
References V
T. Kuran.Private Truths, Public Lies: The SocialConsequences of Preference Falsification.Harvard University Press, Cambridge, MA, Reprintedition, 1997.
T. Schelling.Dynamic models of segregation.J. Math. Sociol., 1:143–186, 1971.
T. C. Schelling.Hockey helmets, concealed weapons, and daylightsaving: A study of binary choices with externalities.J. Conflict Resolut., 17:381–428, 1973.
T. C. Schelling.Micromotives and Macrobehavior.Norton, New York, 1978.

Social Contagion
Social ContagionModelsBackground
Granovetter’s model
Network version
Groups
Chaos
References
Frame 88/86
References VI
D. Sornette.Critical Phenomena in Natural Sciences.Springer-Verlag, Berlin, 2nd edition, 2003.
D. J. Watts.A simple model of global cascades on randomnetworks.Proc. Natl. Acad. Sci., 99(9):5766–5771, 2002.pdf (�)
U. Wilensky.Netlogo segregation model.http://ccl.northwestern.edu/netlogo/models/Segregation. Center for ConnectedLearning and Computer-Based Modeling,Northwestern University, Evanston, IL., 1998.