Embed Size (px)
Citation preview

17
Social Data Mining to Improve Bioinspired Intelligent Systems
Alberto Ochoa 1 ,ض, Arturo Hernández2, Saúl González1, Arnulfo Castro1, Alexander Gelbukh3, Alberto Hernández4 and Halina Iztebegovič5
1Juarez City University, ,CIATEC ض
2CIMAT, 3CIC-IPN,
4CIICAp-UAEM, 5Montenegro University
México ض4 ,3 , 2 ,15Montenegro
1. Introduction The proposal of this chapter is to explain the implementation of social data mining to improve results in bioinspired intelligent systems using generation of clusters, associative rules; decision trees, associated models, dioramas and multivariable analysis for obtain knowledge about any issue related with a topic. This kind of intelligent systems using bioinspired computing – specially, group intelligence techniques such as: Ant Colony, Particle Swarm Optimization and Cultural Algorithms- that try to simulate biological processes that occur in the nature. Intelligent agents use this information to make decisions to improve a needed heuristic optimization in different fields such as: negotiation, argumentation or artificial societies simulation. First in section 2 of this chapter, we approach different concepts related with social data mining and how to use different ways to analyze and model the necessary information to support the correct decision of agents; in next three sections we explain the way to generate a specific behaviour by using group intelligence techniques –ant colony (section 3), particle swarm optimization (section 4) and cultural algorithms (section 5), In section 6, we apply this knowledge in diverse fields and application domains that use a heuristic optimization. In section 7 we compare different cases of studies: Eurovision Voting problem, and the Distribution of Elements. Finally in section 8 we provide our conclusions and outline our future research.
2. Social data mining – basic notions Social data mining systems enable people to share opinions and obtain a benefit from each other’s experience. These systems do this by mining and redistributing information from computational records of social activity such as Usenet messages, system usage history,

Data Mining in Medical and Biological Research
292
citations, and hyperlinks among others. Two general questions for evaluating such systems are: (1) is the extracted information valuable? , and (2) do interfaces based on extracted information improve user tasks performance? We report here on social data mining applications, systems that mine information from the structure and content of web pages and provide an exploratory information workspace interface. We carried out experiments that yielded positive answers to both evaluation questions. First, a number of automatically computable features about web sites do a good job of predicting expert quality judgments about sites. Second, compared to popular web search interfaces, the Topic Shop interface to this information lets users select significantly higher quality sites, in less time and with less effort, and to organize the sites they select into personally meaningful collections quickly and easily. We conclude by discussing how our results may be applied and considering how they touch on general issues concerning quality, expertise, and consensus The motivation for the social data mining approach goes back at least to Vannevar Bush’s As We May Think essay. Bush envisioned scholars blazing trails through repositories of information and realized that these trails subsequently could be followed by others. Everyone could walk in the footsteps of the masters. In our work, we have formulated a similar intuition using the metaphor of a path through the woods. However, this metaphor highlights the role of collective effort, rather than the individual. A path results from the decisions of many individuals, united only by where they choose to walk, yet still reflects a rough notion of what the walkers find to be a good path. The path both reflects history of use and serves as a resource for future users. Social data mining approaches seek analogous situations in the computational world. Researchers look for situations where groups of people are producing computational records (such as documents, Usenet messages, or web sites and links) as part of their normal activity. Potentially useful information implicit in these records is identified, computational techniques to harvest and aggregate the information are invented, and visualization techniques to present the results are designed. Thus, computation discovers and makes explicit the “paths through the woods” created by particular user communities. And, unlike ratings-based collaborative filtering systems (Resnick et al., 1994), social data mining systems do not require users to engage in any new activity; rather, they seek to exploit user preference information implicit in records of existing activity. The “history-enriched digital objects” line of work (Hill et al., 1992) was a seminal effort in this approach. It began from the observation that objects in the real world accumulate wear over the history of their use, and that this wear — such as the path through the woods or the dog-eared pages in a paperback book or the smudges on certain recipes in a cookbook — informs future usage. Edit Wear and Read Wear were terms used to describe computational analogues of these phenomena. Statistics such as time spent reading various parts of a document, counts of spreadsheet cell recalculations, and menu selections were captured. These statistics were then used to modify the appearance of documents and other interface objects in accordance with prior use. For example, scrollbars were annotated with horizontal lines of differing length and color to represent amount of editing (or reading) by various users. Other work has focused on extracting information from online conversations such as Usenet. PHOAKS (Hill & Terveen, 1996) mines messages in Usenet newsgroups looking for mentions of web pages. It categorizes and aggregates mentions to create lists of popular web pages for each group. In (Viegas et al, 1990) have harvested information from Usenet newsgroups and chats and have used them to create visualizations of the conversation.

Social Data Mining to Improve Bioinspired Intelligent Systems
293
These visualizations can be used to find conversations with desirable properties, such as equality of participation or many regular participants. (Smith & Fiore, 2001) also extracted information from newsgroups and designed visualizations of the conversational thread structure, contributions by individual posters, and the relationships between posters. Still other work has focused on extracting information from web usage logs. Footprints (Wexelblat et al., 1999) records user browsing history, analyzes it to find commonly traversed links between web pages, and constructs several different visualizations of this data to aid user navigation through a web site. Pursuing the metaphor of navigation, some researchers have used the term social navigation to characterize work of this nature (Munro et al., 1999). Finally, a distinct technical approach was taken by (Chalmers et al., 1998). They used the activity path – e.g., a sequence of URLs visited during a browsing session – as the basic unit. They have developed techniques to compute similarities between paths and to make recommendations on this basis – for example, to recommend pages to you that others browsed in close proximity to pages you browsed.
Mining the Web Most relevant to the concerns of this paper is the work that mines the structure of the World Wide Web itself. The Web, with its rich content, link structure, and usage logs, has been a major domain for social data mining research. A basic intuition is that a link from one web site to another may indicate both similarity of content between the sites and an endorsement of the linked-to site. An intellectual antecedent for this work is the field of bibliometrics, which studies patterns of co-citation in texts (Egghe et al., 1990). Various clustering and rating algorithms have been designed to extract information from link structure. (Ochoa et al, 2007) was developed a categorization algorithm that used hyperlink structure (as well as text similarity and user’s data access) to categorize web pages into various functional roles and using Cultural Algortihms. Before (Pitkow & Pirolli, 1997) experimented with clustering algorithms based on co-citation analysis, in which pairs of documents were clustered based on the number of times they were both cited by a third document Kleinberg formalized the notion of document quality within a hyper-linked collection using the concept of authority (Kleinberg, 1998). At first pass, an authoritative document is one that many other documents link to. However, this notion can be strengthened by observing that links from all documents aren’t equally valuable – some documents are better hubs for a given topic. Hubs and authorities stand in a mutually reinforcing relationship: a good authority is a document that is linked to by many good hubs, and a good hub is a document that links to many authorities. Kleinberg developed an iterative algorithm for computing authorities and hubs. He presented examples that suggested the algorithm could help to filter out irrelevant or poor quality documents (i.e., they would have low authority scores) and identify high-quality documents (they would have high authority scores). He also showed that his algorithm could be used to cluster pages within a collection, in effect disambiguating the query that generated the collection. For example, a query on “Jaguar” returned items concerning the animal, the car, and the NFL team, but Kleinberg’s algorithm splits the pages into three sets, corresponding to the three meanings. Several researchers have extended this basic algorithm. Weight links based on the similarity of the text that surrounded the hyperlink in the source document to the query that defined the topic made several important extensions. First, they weighted documents based on their
Data Mining in Medical and Biological Research
294
similarity to the query topic. Second, they count only links between documents from different hosts, and average the contribution of links from any given host to a specific document. That is, if there are k links from documents on one host to a document D on another host, then each of the links is assigned a weight of 1/k when the authority score of D is computed. In experiments, they showed that their extensions led to significant improvements over the basic authority algorithm. PageRank is another link-based algorithm for ranking documents. Like Kleinberg’s algorithm, this is an iterative algorithm that computes a document’s score based on the scores of documents that link to it. PageRank puts more emphasis on the quality of the links to a particular document. Documents linked to by other documents with high PageRank scores will themselves receive a higher PageRank score than documents linked to by low scoring documents. In summary, much recent research has experimented with algorithms for extracting information from web structure. A major motivation for these algorithms is that they can be used to compute measures of document quality. Yet this work has proceeded without much experimental evaluation, leaving two basic questions unanswered: first, what benefits do the more complicated link-based algorithms provide beyond simple link counts? And second, how well do the various link-based metrics (in-links, authority scores, PageRank scores) actually correlate with human quality judgments? We will report on an experiment that investigates these issues.
Information Workspaces Once information has been extracted, it must be presented in a user interface. Users must be able to evaluate collections of items, select items they find useful, and organize them into personally meaningful collections. (Card et al, 1991) introduced the concept of information workspaces to refer to environments in which information items can be stored and manipulated. A departure point for most such systems is the file manager popularized by the Apple Macintosh and then in Microsoft Windows. Such systems typically include a list view, which shows various properties of items, and an icon view, which lets users organize icons representing the items in a 2D space. (Mander et al., 1992) enhanced the basic metaphor with the addition of “piles”. Users could create and manipulate piles of items. Interesting interaction techniques for displaying, browsing, and searching piles were designed and tested. Bookmarks are the most popular way to create personal information workspaces of web resources. Bookmarks consist of lists of URLs; typically the title of the web page is used as the label for the URL. Users may organize their bookmarks into a hierarchical category structure. (Abrams et al., 1998) carried out an extensive study of how several hundred web users used bookmarks. They observed a number of strategies for organizing bookmarks, including a flat ordered list, a single level of folders, and hierarchical folders. They also made four design recommendations to help users manage their bookmarks more effectively. First, bookmarks must be easy to organize, e.g., via automatic sorting techniques. Second, visualization techniques are necessary to provide comprehensive overviews of large sets of bookmarks. Third, rich representations of sites are required; many users noted that site titles are not accurate descriptors of site content. Finally, tools for managing bookmarks must be well integrated with web browsers. Many researchers have created experimental information workspace interfaces, often designed expressly for web documents. (Card et al., 1996) describe the Web Book, which uses a book

Social Data Mining to Improve Bioinspired Intelligent Systems
295
metaphor to group a collection of related web pages for viewing and interaction, and the Web Forager, an interface that lets users view and manage multiple Web Books. In addition to these novel interfaces, they also presented a set of automatic methods for generating collections (Web Books) of related pages, such as recursively following all relative links from a specified web page, following all (absolute) links from a page one level, extracting “book-like” structures by following “next” and “previous” links, and grouping pages returned from a search query. (Mackinlay et al., 1995) developed a novel user interface for accessing articles from a citation database. The central UI object is a “Butterfly”, which represents an article, its references, and its citers. The interface makes it easy for users to browse among related articles, group articles, and generate queries to retrieve articles that stand in a particular relationship to the current article. The Data Mountain of (Robertson et al., 1998) represents documents as thumbnail images in a 3D virtual space. Users can move and group the images freely, with various interesting visual and audio cues used to help users arrange the documents. In a study comparing the use of Data Mountain to Internet Explorer Favorites, Data Mountain users retrieved items more quickly, with less incorrect or failed retrieval. Other researchers have created interfaces to support users in constructing, evolving, and managing collections of information resources. SenseMaker (Baldonado et al, 1997) focuses on supporting users in the contextual evolution of their interest in a topic. It attempts to make it easy to evolve a collection, e.g., expanding it by query-by-example operations or limiting it by applying a filter. Scatter/Gather (Pirolli et al, 1996) supports the browsing of large collections of text, allowing users to iteratively reveal topic structure and locate desirable documents. VIKI system (Marshall et al., 1994) lets user organize collections of items by arranging them in 2D space. Hierarchical collections are supported. Later extensions (Shipman et al., 1999) added automatic visual layouts, specifically non-linear layouts such as fisheye views. (Hightower et al., 1998) addressed the observation that users often return to previously visited pages. They used Pad++ (Bederson et al., 1996) to implement PadPrints, browser companion software that presents a zoomable interface to a user’s browsing history there are a number of important issues that deserve further investigation. One direction is to seek new sources for mining information about user preferences. As we have discussed, researchers have investigated hyperlink structure, electronic conversations, navigation histories and other usage logs, and purchasing history. One area with great potential is electronic media usage, in particular, listening to digital music. By observing what music someone is listening to, a system can infer the songs, artists, and genres that person prefers, and use this information to recommend additional songs and artists, and to put the person in touch with other people with similar interests. We took a step in this direction with a system that lets users visualize individual and group listening histories and define new play lists relative to listening history (Terveen et al., 2002). (Crossen et al., 2002) reported on a system that learns user preferences from the music they listen to, then selects songs to play in a shared physical environment, based in part on the preferences of all people present. As user preferences are extracted from more and more sources, the issue of combining different types of preferences becomes important. For example, PHOAKS extracted preferences about web pages from Usenet messages and presented them to users. As users browsed through this information, PHOAKS tracked which pages users clicked on (another type of implicit preference), and users also could rate web pages (explicit preferences).

Data Mining in Medical and Biological Research
296
Developing general techniques for combining different types of preferences is a challenge. (Billsus et al. 1998) was presented a method for weighting different types of contributions; however, whether this is the best combination method and how to determine appropriate weights are still open issues. It is worth pointing out that the task that TopicShop supports – selecting a subset of items from a large set and then organizing the subset arises – is quite general and occurs in other contexts. For example, of the many people I exchange email with, a small subset are “contacts” whom I wish to keep track of, and organize into groups which I can use to manage my communication. We have applied this intuition in a project with Steve Whittaker, developing a new interface for the ContactMap contact management system (Whittaker et al., 2002). Features about potential contacts including their organization and frequency and regency of communication are extracted from email archives and presented in a table; as in TopicShop, the table can be sorted by any of the columns. And, when users find important contacts, they add them to their “map” (equivalent to the TopicShop Work Area) by dragging and dropping. Contacts on the map are organized by spatial arrangement and color coding. This experience illustrates that the general interaction paradigm of TopicShop can be applied in an altogether different domain. While our experiment compared TopicShop to the state-of-the-art Web directory Yahoo, it may have occurred to the reader that our techniques are suitable for integration with such a system. This is absolutely correct. Both directory systems, which contain categories of web sites typically built by a person, and search engines, which retrieve documents based on their similarity to a query, could benefit. An effective way to apply the results of our research would be to enhance (say) Yahoo by (1) using a WebCrawler/analyzer to augment each manually constructed collection of pages with the sorts of profiles our experiments showed effective, and (2) providing a TopicShop-style information workspace interface. Such a system would combine the advantages of people – applying judgment to select the initial set of collections – and computers – applying analysis techniques to provide enhanced information and to keep the collections up to date. A similar tactic could be taken by a search engine; this would be most efficient for one such as Google that already maintains a database of links between web pages. Finally, note that this argument shows that even a very large, manually constructed set of “seed” pages can be enhanced significantly by providing additional features, grouping pages into sites, and offering a good user interface
3. Behaviour in group intelligence techniques – ant colony Various biologically inspired approaches to problem solving using a social metaphor have been proposed. For example, both Particle Swarm Optimization (PSO) and Ant Colony Optimization (ACO) have been employed to solve problems in optimization and design. Both approaches employ simple social interactions between agents to produce emergent social structures that are used to solve a given problem. In this paper we investigate the emergence and power of more complex social systems based upon principles of cultural evolution. Cultural Algorithms employ a basic set of knowledge sources, each related to knowledge observed in various social species. These knowledge sources are then combined to direct the decisions of the individual agents in solving optimization problems. Here we develop an algorithm based upon an analogy to the marginal value theorem in foraging theory to guide the integration of these different knowledge sources to direct the agent population. Various phases of problem solving emerge from the combined use of these knowledge sources and these phases result in the emergence of individual roles within the

Social Data Mining to Improve Bioinspired Intelligent Systems
297
population in terms of leaders and followers. These roles result in organized swarming in the population level and knowledge swarms in the social belief space. Application to real-valued function optimization in engineering design is used to illustrate the principles.
Ant Colony Algorithm Ant Colony Optimization (ACO) is based on the observation, in the laboratory, of colonies of ants. Investigators found that ants are able to find the shortest path from the source of food to the nest without using visual tracks (Hölldobler et al, 1990). Also it was observed that they were able to adapt to the changes on the environment, for example, using a new path once the previously used stops being feasible due an obstacle. It is well known that the primary manner how the ants form and maintain a path is by using pheromones. In the ant colony proposed by (Dorigo et al, 1996), an ant is frequently defined as an agent of simple calculations that iteratively constructs a solution to a problem, a problem of trajectory planning. In this model, ants deposit certain amount of pheromones, a chemical substance, whereas they walk, and each ant probabilistically prefers to follow a pheromone-rich direction. Thus, the pheromone and its density through the path are the knowledge that in ACO shares among the individual ants. The partial solutions of the problem correspond to states where each ant is moved from one state to another. ψ corresponds to a more complex partial solution. In each step σ, each ant k calculates a set of feasible expansions to its present state, and then it moves to one of these, according to a distribution of the specified probability as it follows:
Here the set tabuk represents a set of feasible movements for ant k and the parameter α defines the relative importance of the path with respect to its attraction. After each iteration t of the algorithm, trails are updated using the following formula:
τιψ(t) = ρτιψ(t-1)+Δτιψ where ρ is a user-defined coefficient and Δτιψ represents the sum of the contributions of all ants that use move (ιψ) to construct their solution. An iterative process increases the level of those cells related to moves that were part of “good” solutions, while decreasing all others.The pseudo-code from (Maniezzo, 2000) describes how the basic Ant Colony Optimization works:
1. (Initialization) initialize τιψ, ∀ι, ψ 2. (Construction) For each ant k do repeat compute ηιψ, ∀ι, ψ choose in probability the state to move into append the chosen move to the k-th ant’s set tabuk

Data Mining in Medical and Biological Research
298
until ant k has completed its solution [apply a local optimization procedure] enddo 3. (Trail update) For each ant move (ι, ψ) do Compute Δτιψ and update the trail values 4. (Terminating condition) If not (end_condition) go to step 2
ACO is applied extensively to problems of optimization of trajectory planning in many areas like symmetric and asymmetric variants of the travelling agent, as well as problems of partitioning and the associated times of telecommunication networks. What emerges from the social interaction in the colony of ants are the trajectories of high performance according to the defined terms of performance given by certain functions. Some unexpected trajectory characteristics have been demonstrated for certain kinds of problems such as to find the minimum cost path of a general graph. Recently, a number of algorithms inspired in the behaviour of social groups has been used to solve complex problems of optimization. Some of these algorithms include the particle swarm optimization (PSO) (Kennedy & Eberhart, 1995), ant colony (ACO) (Dorigo et al., 1995), and cultural algorithms (Reynolds et al., 2005). These three algorithms use a model based on a population as the base of the algorithm and solve problems by sharing information via the social interaction among agents.
Fig. 1. Scale of Social Interaction.
Figure 1 expresses each of these approaches in terms of space and the continuous time on which the social interactions happen. We must notice that colony of ants and particle swarm are found near the left end of this continuity. For example, in particle swarm, the agents can locally change their speed and direction of movement by the interaction with other agents. In ant colony, the agents locally interchange the information in terms of the density and gradient of pheromone that marks their path. The pheromone is deposited by an ant that moves through the path. The frequency in the use of a path is indicated by the amount of pheromone that has been deposited, considering its degradation in the atmosphere up to a certain level. The cultural algorithms on the other hand allow agents to act reciprocally in diverse ways using several reflective forms of symbolic information present in complex cultural systems. The basic cultural algorithm allows that individuals communicate via a shared space of beliefs. The shared space considers five basic types of information that can

Social Data Mining to Improve Bioinspired Intelligent Systems
299
be shared mentally or symbolically. It is well known that the scale of interaction within complex systems affects the nature of the structure arising from the interaction of agents within that system (Holland, 1998). Now we examine briefly each one of the three social models for solution of problems in terms of the nature of their social interactions and their own distinctive features.
4. Behaviour in group intelligence techniques – particle swarm optimization Particle Swarm Optimization (PSO) is a stocastic technique based in the optimization of a population, developed by Kennedy and inspired by the social behavior of the flock of birds or the shoals of fishes. In PSO, the potential solutions, called particles, move through the space of the problem following the trajectories of their optimal neighbors. Each individual particle does not lose either their last better aptitudes or the ones of its neighbors (social vision) within a fixed radius. This information determines its following direction and speed (cognitive vision). PSO is initialized with a particle group at random (solutions) and later looks for optimal degrees putting the day the generations. In each iteration, each particle is bought up to date better following both "values“. The first best solution (aptitude) that has reached until now (the value of the aptitude also is stored). This value is called pbest. The other "best" S-value is followed by the optimizer of the particle accumulation, which is the best value obtained until now by any particle in the population. This second better S-value a best global and call gbest. When a particle participates in the population like its topological neighbors, the second best S-value the best premises and lbest is called. After finding better values the particle updates both its speed and position with the following equations (a) and (b):
v[]=v[]+c1*rand()*(pbest[]–present[])+c2*rand()*(gbest[]–present[]) (a)
present[] = present[]+v[] (b)
v[] is the particle velocity, present[] is the current particle (solution).pbest[] and gbest[] are defined as started before.rand() is a random number between (0,1). c1,c2 are learning factors. Usually c1, = c2 = 2. The pseudocode of the initial version of PSO for variables of real value is determined by (Kennedy et al., 2001) of the next way: For each particle initialize particle End For Do For each particle calculate fitness value if the fitness value is better than the best fitness value (pBest) in history set current value as the new pBest End for choose the particle with the best fitness value of all the particles as the gBest For each particle calculate particle velocity according equation (a) update particle position according equation (b) End for While maximum iterations or minimum error criteria is not attained
Data Mining in Medical and Biological Research
300
In order to simulate the individual and interpersonal learning of the cultural transmission (social), PSO manages simplicity and effectiveness (speed of convergence). It has performed well in a variety of test problems. It operates suitably on two dimensions but they can theoretically be extended to multiple dimensions. Due to the simplicity of its social behavior with respect to its results with base in the convergence, ranks of convergence, and other unexpected characteristics have been produced. The unexpected characteristic base is the swarm of particles, or coordinated movement of individuals through the space search towards the optimal solution.
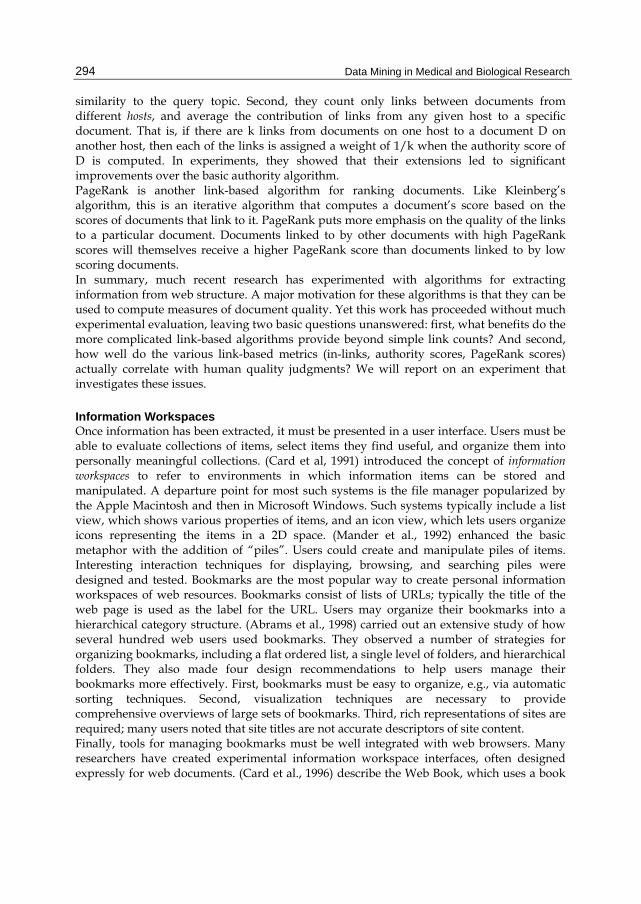
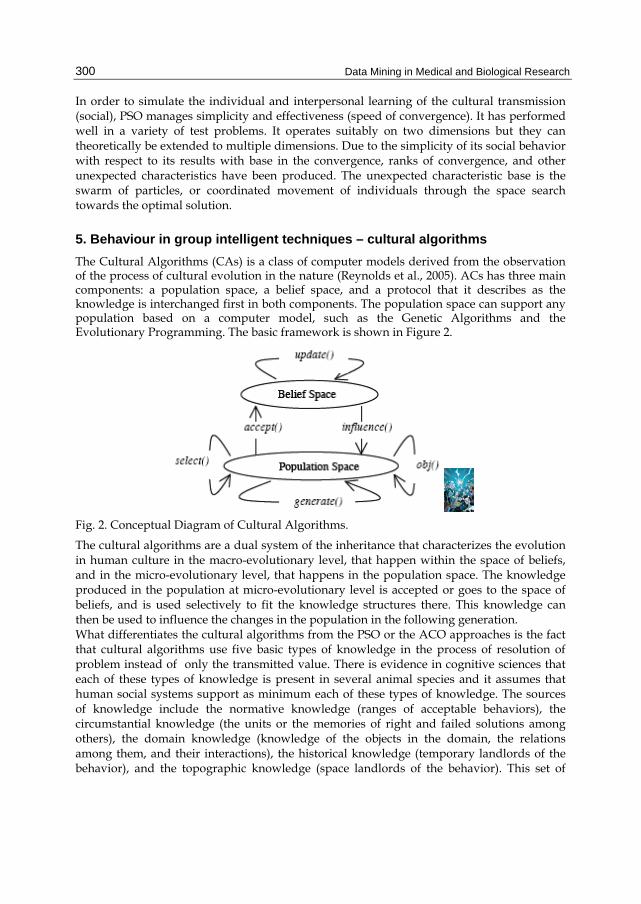
5. Behaviour in group intelligent techniques – cultural algorithms The Cultural Algorithms (CAs) is a class of computer models derived from the observation of the process of cultural evolution in the nature (Reynolds et al., 2005). ACs has three main components: a population space, a belief space, and a protocol that it describes as the knowledge is interchanged first in both components. The population space can support any population based on a computer model, such as the Genetic Algorithms and the Evolutionary Programming. The basic framework is shown in Figure 2.
Fig. 2. Conceptual Diagram of Cultural Algorithms.
The cultural algorithms are a dual system of the inheritance that characterizes the evolution in human culture in the macro-evolutionary level, that happen within the space of beliefs, and in the micro-evolutionary level, that happens in the population space. The knowledge produced in the population at micro-evolutionary level is accepted or goes to the space of beliefs, and is used selectively to fit the knowledge structures there. This knowledge can then be used to influence the changes in the population in the following generation. What differentiates the cultural algorithms from the PSO or the ACO approaches is the fact that cultural algorithms use five basic types of knowledge in the process of resolution of problem instead of only the transmitted value. There is evidence in cognitive sciences that each of these types of knowledge is present in several animal species and it assumes that human social systems support as minimum each of these types of knowledge. The sources of knowledge include the normative knowledge (ranges of acceptable behaviors), the circumstantial knowledge (the units or the memories of right and failed solutions among others), the domain knowledge (knowledge of the objects in the domain, the relations among them, and their interactions), the historical knowledge (temporary landlords of the behavior), and the topographic knowledge (space landlords of the behavior). This set of

Social Data Mining to Improve Bioinspired Intelligent Systems
301
categories is seen as complete for a given domain in the sense that all knowledge available can be expressed in terms of a combination of one of these classifications.
6. Evolve computing applying to diverse fields that use a heuristic optimization The cultural algorithms have been tested with benchmarking problems (Chung et al., 1998) and also have been applied successfully in a diverse number of application areas such as modelling the evolution of agriculture, learning conceptualizing (Morrison et al., 1999), optimization of real-value functions (Jin et al., 1999) , re-engineering of the knowledge bases for the manufacturing assembly processes (Rychlyckyj et al., 2003), modelling systems of price incentives based on agents, distribution of elements in a diorama, in predicting a ranking in Eurovisión, in the simulation of a social model in an intelligent game (Ochoa, Ponce et al., 2007), and combined with Predator/Prey Game for analyzing cultural problems (Ochoa, Quezada et al., 2008) among others. Whereas it is right, the relative complexity of the sources of knowledge and its interaction make difficult to determine because the cultural algorithms work so well. Indicated alternatively, under what conditions some systems indeed can solve a given problem and the belief space can be seen as samples For a right process to solve the problem. We begin this section examining how cultural algorithms solve problems of resources optimization within an experimental atmosphere. In our research, first we use a simulated atmosphere of the world of cubes, and we adapted it for our experiments. Within this world, the resources are distributed in piles (cones) in the land (Sugarscape style) (Epstein et al, 1996). We can put in the landscape an arbitrary number of cones, each with a size that varies, to produce surfaces of the forage of the complexity that varies. The distribution of cones can be static, dynamic, and deceptive (in which the positioning of some cone hides better areas of agents than they climb the hill). Then the agents build reciprocally social via these several sources of knowledge to find the optimal degree, and in the dynamic atmosphere they don’t lose his position, that changes in a certain rate. Then we investigated the appearance of social landlords in both the population space and the belief space when the problem is solved successfully. We use later what we have learned of this experimental atmosphere to solve complex problems in engineering design. Then we observed whether the similar social structures emerge there. We compared the operation of the systems with the optimization of the particles swarm. Since our problem of the cones world can be described as a search space problem, we used a framework inspired by theoretical results of the biology of populations. Specifically, the agents select diverse sources of knowledge based on which we characterized like "marginal value of información". The inspiration for this comes from the classic work (Charnov, 1976) referring to "marginal theorem of value". In certain situations, the agents who used the marginal value theorem could optimize their product of resource within an atmosphere. Simply stated, the marginal value theorem says that an agent remains within a location in the land until the present resource is minor that the predicted half value. Then one moves to another cell that satisfies each marginal constraint with the value. Here we used an approach to the integration of the knowledge that uses a principle corresponding to "marginal value of knowledge". With this approach, is more probable that an individual uses a strategy that is on the average than it uses other sources of knowledge. Then it was observed that the social organizations emerge in the population space and that the space of

Data Mining in Medical and Biological Research
302
beliefs assures the total success for the system. We use this approach of integration based on marginal value with an evolutionary model of programming for the population and with the five sources of knowledge as the frame of the base to the problems of solution within the simulated atmosphere and of the real world. We wished to show that the use of the marginal value helps to the integration of the knowledge producing the following emergent structures and behaviors: 1. The appearance of certain phases to solve problems in terms of the relative operation of
diverse sources of knowledge in a certain time. We labelled these phases like: heavy, granular, granuloses fine and backward movement. Each phase is characterized by the domination of a set or subgroup of knowledge sources that are the best to generate new solutions in that phase. Indeed, the dominant subgroup of knowledge sources is often applied in a specific sequence within each phase. It appears a type of knowledge that produces new solutions that therefore are operated on the other knowledge source. The transitions between the phases happen when the solutions produced by a phase can be exploded better by the sources of knowledge associated with the following phase.
2. The appearance of groups of individuals that move within the space of the problem as a result of the interaction of the cultural knowledge. From these phases they emerged continuously in static, dynamic, and deceptive atmospheres when the marginal approach and the integration of the s-value used. We call them " cultural groups of populations".
3. Then we observed the group knowledge in a put-level, we called them "clusters of knowledge". Due to this, the sources of the group knowledge in the goal level were produced by the interaction of the sources of knowledge via the marginal value theorem and this one serves to induce a group in the level of population.
7. Cases of studies of data mining to improve evolve computing Diverse applications inspired in social data mining combined with evolve computing have a great value. In this section, we present two of them in order to compare their contributions; the first is related with a hybrid system that permits to determine the ranking of a debutant country in the Eurovision Song Contest. In the other, it is showed an intelligent tool which accommodate societies in a diorama which performs the accommodations by evaluating cultural and social differences.
7.1 Hybrid system using data mining and particle swarm optimization to determine the ranking of a new participant in Eurovision. Many problems involve not structured environments which can be solved from the perspective of Particle Swarm Optimization (PSO). In this research we analyze the voting behavior in a popular song contest held every year in Europe. The dataset makes possible to analyze the determinants of success, and gives a rare opportunity to run a direct test of vote trading from logrolling. We show that they are rather driven by linguistic and cultural proximities between singers and voting countries. With this information it is possible to predict the score of a new country, and distribute the votes for a lot of the participants; this paper tries to explain this social behavior. The Eurovision Song Contest (ESC) held for the first time in Lugano, Switzerland, in 1956, where seven countries competed. Non-European countries can also take part: Israel,

Social Data Mining to Improve Bioinspired Intelligent Systems
303
Morocco, Turkey, Armenia and Georgia are now regular participants. In 2008 Azerbaijan and San Marino will participate for the first time. Since 2002, there are 24 slots for finalists, four of which are reserved for the Big Four (France, Germany, Spain and the United Kingdom). Each ESC is broadcasted by television; in 2001 the contest was broadcasted live all around the world. Nowadays, it is watched by several hundred millions of people. The ratings are normalized so that the favorite song gets 12 points, the next one 10, and then 8, 7, 6, 5, 4, 3, 2 and 1. This allows each voting country to give positive ratings to ten other countries. Participating countries cannot vote for their nationals. The order in which candidates perform is randomly drawn before the competition starts. When performance ends, countries are asked to cast their votes. Results are announced country by country, in the same order in which participants performed. Participants are ranked according to their aggregate score. Eurovision have been studied with different perspectives: the compatibility between countries and the political and cultural structures of Europe (Rauhlen, 1997), the persistent structure of hegemony in the Eurovision Song Contest (Suaremi et al., 2006), cultural voting (Yair, 1995) and the analysis about Grand Prix which evaluate many countries participating in different years and with different many of countries competing (Yair et al., 1996), among others. This research is novel because analyze the behavior of all countries when arrived a new country in a new ESC. The objective is to predict the final ranking of Azerbaijan and San Marino, the new contenders in Eurovision Song Contest 2008. The organization of this section is the following. The analysis of the 52 ESC editions to incorporate a priori knowledge about the voting patterns and relationships between neighbor countries is explained. Next, the problem statement is defined. The COPSO algorithm is thoroughly explained. Our approach is then tested in the ESC 2007. The experiments and the analysis applied to estimate the final ranking of Azerbaijan and San Marino in ESC 2008 are explained and finally the conclusions are provided. Eurovision Ranking using Data Mining.
Data mining is the search of global patterns and the existent relationships among the data of immense databases, but that are hidden inside the vast quantity of information (Ochoa A., Meneguzzi, P. Et al, 2006). These relationships represent knowledge of value about the objects that are in the database. This information is not necessarily a faithful copy of the information stored in the databases. Rather, is the information that one can deduce from the database. One of the main problems in data mining is that the number of possible extracted relationships is exponential. Therefore, there are a great variety of machine’s learning heuristics that have been proposed for the discovery of knowledge in databases. One of the most popular approaches to represent the results of data mining is to use decision trees. A decision tree provides a procedure to recognize a given case for a concept. It is a “divide and conquer” strategy for the acquisition of the concept (instance). Decision trees have been useful in a great variety of practical cases in science and engineering; in our case we use data mining to characterize the historical voting behavior for each country. Thus, we selected societies that have participated and characterized its behavior based on their previously emitted votes, which allowed to describe in great detail both the society and the individual. The purpose is to explain υij, the vote (that is, the number of points) casted by the people of country i ∈ L in evaluating the performer of country j ∈ L (i≠j, since country i can not vote for its own candidate), where L is the total number of participating countries. If countries i and j (i≠j) exchanged their votes, without taking into account any other feature, the voting equation could simply be written
Data Mining in Medical and Biological Research
304
υji = αijυij + uij (1)
Where αij is a commitment parameter, and υij a random disturbance. If exchanges of votes were “perfect”, and both countries kept their commitment, αij would be equal to 1. More generally, such an equation should contain variables k={1,…,K representing the characteristics (language of songs –English, French, Italian-, lyrics, music, genre and others) of a performer (singer or band) from country i, and variables representing the performances of the country i along its Ti participations in the ESC.
(2)
where β and γ are parameters to be estimated. The part associated with beta parameter is related with the attributes of performance of a song (music, lyrics, language among others) and her/his/their interpreter(s). The part associated with gamma parameter is the related with the performance of a country during the ESC’s participations (example: Armenia has participated in 2006 and 2007). A problem arises with the fact that it will appear on the other side of the equation for the observation concerning the vote of country i for the singer representing country j. This can be dealt with in several ways. First, and this is the easiest way, instead of using υij in the right-hand side, one can use the vote cast in previous competition, say υij-1, though one could think that countries would not necessarily keep their commitment over time. An alternative is to use only half of the observations along all ESC editions; thus, every υij that appears in the right-hand side of the equation is not used in the left-hand side. The voting equation is estimated by linear methods. The influence of the order in which musicians appear in competition has often been outlined. The exogenous order in which candidates perform is thus included as determinant. Other variables include (a) a dummy for host country, determined by the citizenship of the previous year’s winner-the variable takes the value 1 for the performer whose citizenship is the same as that of the host country-, (b) the language (Gelbukh et al, 2007), in which the artist sings (English, French, Spanish, Italian, in other), (c) gender of the artist, and (d) whether the artist sings alone, in a duo or in a group. The last group of variables will include linguistic and cultural distances between voters and performers, and may dispense us from using variables that characterize voters. National culture differences are represented by the four dimensions studied in (Ginsburgh et al., 2005). These studies identified and scored the four following dimensions that make for “cultural distances”: Power Distance: It measures the extent to which the less powerful members of a society accept that power is distributed unequally; it focuses in the degree of equality between individuals; Individualism: It measures the degree to which individuals in a society are integrated into a group; it focuses on the degree a society reinforces individual or collective achievements and interpersonal relationships; Masculinity: It refers to the distribution of roles between genders in a society; it focuses on the degree a society reinforces the traditional masculine work role of male achievement, control, and power; Uncertainty avoidance: It deals with the society’s tolerance for uncertainty or ambiguity, and refers to man’s search for truth.

Social Data Mining to Improve Bioinspired Intelligent Systems
305
Table 1 illustrates the correlations between the cultural distance and native languages for the countries (Gelbukh & Sidorov, 2006) that are present in our sample. Uncertainty avoidance is correlated with three other variables, but otherwise, distances seem to pick up very different dimensions of people’s behavior. One of the most interesting characteristics observed in this experiment were the diversity of the cultural patterns established by each community. The structured scenes associated with the agents cannot be reproduced in general, so time and space belong to a give moment. They represent a unique form, needs and innovator of adaptive behavior which solves a followed computational problem of a complex change of relations. The generated configurations can metaphorically be related to the knowledge of the behavior of the community with respect to an optimization problem (to make alliances to obtain a better ranking). Columns (a) to (d) of Table 2 contain the results of an OLS estimation of equation 2. We first observe that quality always plays a very significant role, which should of course not be surprising. Logrolling is significant only in (a), in which no account is taken of linguistic and cultural distances. It ceases to be in all the other equations once linguistic and/or cultural distances are also accounted for. Note that even when the coefficient is significantly different from zero, its value is very small. Order of appearance plays no role, while among the other variables, the only one which has some influence is “sung in French”. Though not all distance coefficients are significantly different from 0 at the level of 5 percent of probability, they all pick negative signs (the larger the

Data Mining in Medical and Biological Research
306
distance, the lower the rating). The Table 3 presents the expected performance rates for 2008. The performance rate tries to predict the country rank through environment variables observed along 52 previous ESC editions. The Table 3 shows the performance rate of the last ESC where Ukraine had the highest rate. In the ESC 2007 the winner was Serbia which had a performance rate of 0.55, below the top-10. The performance rates were estimated based on the characteristics listed in Table 4 and the country performance along previously participations in every ESC edition. For example, in ESC 2007 participated 42 countries hence it was more complex to obtain a second place than in 1981 for example, when only 20 countries participated. Obviously, for the new contenders, Azerbaiyan and San Marino,

Social Data Mining to Improve Bioinspired Intelligent Systems
307
there is not historical information available. The information obtained through data mining, denotes a similar behavior of countries into the same neighborhood and with similar characteristics (language, territorial extension, religion, in others). Thus, the historical performance for Azerbaijan was calculated from Armenia, Georgia, Bosnia & Herzegovina and Turkey; and for San Marino was calculated from Italy, Switzerland, Andorra, Monaco, Malta and Luxembourg. The parameters used by the model to calculate the performance rate are: β=0.4 and γ=0.6. The model used to calculate the values of Table 3 is the following:
(3)
Where Ti is the number of ESC editions that country i has participated. Equation 3 is a synthesis of the voting model presented in Equation 2. The missed term αijυij represents the voting behavior expected between countries i and j. A robust model was developed adding probability terms that reflect the voting history between a judge country I and a contender country j(υij). The complete model and its implicit problem are explained in the next section. Problem Statement.
The objective of this study is to estimate the position rank of the new contenders, Azerbaijan and San Marino. This implies to estimate the final voting matrix, where every cell j, i represents the score given to contender i by country j; that is υji. For attaining a well prediction, the model should controls the voting behavior between judges and contenders taking into account the historical performance that reflects the cultural empathy, the commonality of regions, the returning voting patterns, in others. The estimated performance rate could guide the model towards an optimal voting configuration according to the current expectations of the experts. The next objective function posses these two important features of the ESC, the voting behavior and the performance rate explained in the previous Section. Notice that Equation 3 is part of Equation 4.
Maximize
(4)
Subject to: • Country j can not vote for itself. • Country j just can vote one time for contender i. • Country j just can give a score k to only one contender i. Where N is the number of voting countries, C is the number of contenders, S is the number of available scores S={12,10,8,7,6,5,4,3,2,1} and maxs=12 is the maximum score. The first two terms represent the performance of the final ranking. In the first term of equation 4, cij is the probability that a score k was given by country j for a contender country i. Table 5 shows an example of the probabilities cij of Finland for score s=12. Along 52 ESC editions, Finland has received 19 times a score of 12 points from 11 different countries. Sweden and Iceland are the countries which have voted more times for Finland, both with 3 editions. Therefore, they are the countries with highest probabilities Cij. In the second term of Equation 4, Pik is the probability that a country i receives a score k from country j. Table 6 shows an example of

Data Mining in Medical and Biological Research
308
the probabilities pik of Finland with Germany. Finland has received 16 votes from Germany. In 4 times, Germany has given a score of 1 point to Finland; thus, it is the score with highest probability pik. For the last term of Equation 4, si represents the scores sum got by a contender country i from every country j≠i; and ri represents the expected performance rate of the country i in the competition (see Table 3). The probabilities cij and qij were calculated based on the previous ESC editions. The probabilities for Azerbaiyan and San Marino were calculated observing the behavior of the voting along 52 ESC editions between a mature country and a new contender.
The model explained in this section, implies to solve a combinatorial problem which attempts to estimate the final voting table of ESC 2008 (for predicting the position rank of Azerbaijan and San Marino). The constrained optimization problem has two parts. In the

Social Data Mining to Improve Bioinspired Intelligent Systems
309
first part, the problem is to find the optimal combination that maximizes the sum of probabilities (first two terms of Equation 4). This implies 43 voting countries (subject to the mentioned constraints) which must assign 10 different scores (S) to 25 contender countries, resulting 2.99E+14 possible combinations. In the second part, the total sum of the votes obtained by every contender country is calculated. The vote sums (si) are used to calculate the weighted sum presented in Equation 4 (third term). This implies again to find the optimal combination out of 2.99E+14 possible solutions. The maximization of both parts of the problem generates a tradeoff between the voting behavior and the performance rate. For solving the current optimization problem, we use a simple and innovative PSO used on constrained optimization problems which is thoroughly explained in the next section.
Constrained optimization via PSO.
Particle Swarm Optimization (PSO) (Kennedy & Eberhart, 1999) is an algorithm inspired by the motion of a bird flock. Each member of the flock is called “particle”. In PSO, the source of diversity, called variation, comes from two sources. One is the difference between the particle`s current position xt and the global best GBest (best solution found by the flock), and the other is the difference between the particle’s current position xt and its best historical value PBest (best solution found by the particle). Although variation provides diversity, it can only be sustained for a limited number of generations because convergence of the flock to the best is necessary to refine the solution. The velocity equation combines the local information of the particle with global information of the flock, in the following way.
Fig. 3. Neighborhood strctures for PSO

Data Mining in Medical and Biological Research
310
Fig. 4. Ring neighborhood structures. a)Doubly-linked ring (original PSO). b) Sigly-linked ring A leader can be global to all the flock, or local to a flock’s neighborhood. Flock neighborhoods have a structure that defines the way information is concentrated and then distributed among its members. The most common flock organizations are shown in Figure 1. The organization of the flock affects search capacity and convergence. The original ring structure is implemented by a doubly-linked list, as shown in Figure 4-a. COPSO uses an alternative ring implementation, the singly-linked list, shown in Figure 4-b. This structure improved the success of experimental results by a very important factor. Experiments ESC 2007: Model Validation. In order to know the performance of the proposed model, it was tested in estimating the final ranking of the countries which competed for the first time on the ESC 2007: Czech Republic, Georgia, Montenegro and Serbia. In the ESC 2007, these 4 countries competed in the unique Semi-Final stage against other 24 countries for obtaining just 10 places to the Final stage. In the Final stage, 14 countries were waiting for competing against the first 10 places of the Semi-Final. The 14 finalists were composed by the “Big Four” (Germany, Spain, France and United Kingdom) and the first 10 places of the ESC 2006. The list of contenders for every stage is available in the web host of the ESC 2008. For estimating the voting matrix, 30 runs of each experiment, Semi-Final and Final, were performed to obtain a better estimation of the final ranking. In every run, 350,000 function evaluations were performed. For the Semi-Final stage, the result of every run is a voting matrix and a rating list from 1 to 28. The average along the 30 runs was calculated for every contender. Next, the average ranking was obtained to determine the 10 countries which were going to contend in the Final stage. Three measures were calculated from the 30 runs: average, median, and interquartile range. The interquartile range has a comprehensiveness of 50% around the median value (second quartile Q2), which is calculated through the lower quartile Q1 (first quartile) and upper quartile Q3 (third quartile). In descriptive statistics a quartile is any of the three values which divide the sorted data set into four equal parts, so that each part represents 1/4 of the sampled population. The difference between the upper and lower quartiles is called the interquartile range. The results of the Final stage for Georgia and Serbia. In ESC 2007, Georgia obtained the 12th position in the Final stage, which is a value into the estimated interquartile range and very close to the average value predicted along 30 runs. Nevertheless, the predictions for Serbia are far away to the reality. Serbia was the winner of the ESC 2007. Maybe, no ESC experts had guessed that a new contender would win the contest. The ESC 2007 results showed how hard is to estimate the ESC’s behavior. In the next section, the estimation of our approach for ESC 2008 is presented.
Social Data Mining to Improve Bioinspired Intelligent Systems
311
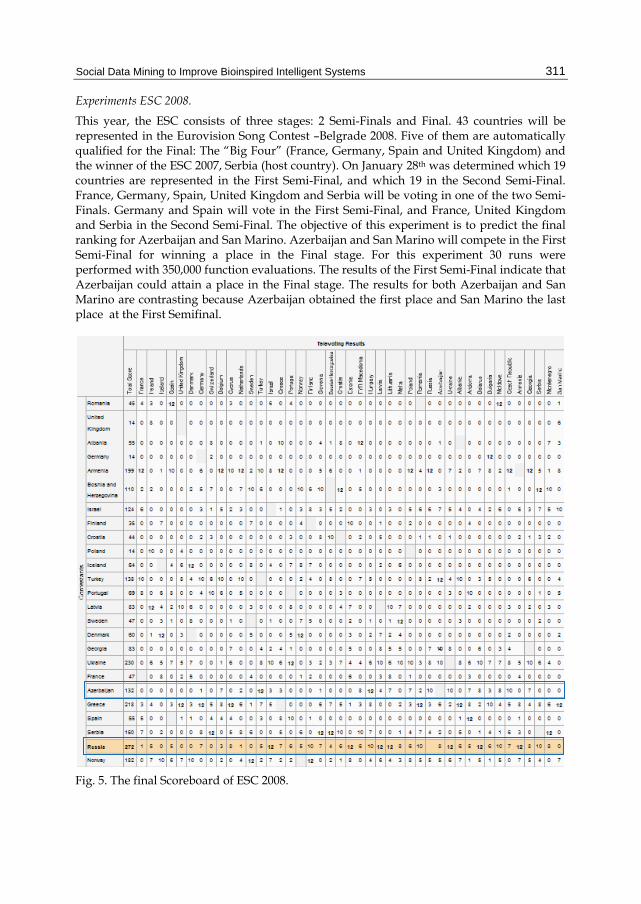
Experiments ESC 2008.
This year, the ESC consists of three stages: 2 Semi-Finals and Final. 43 countries will be represented in the Eurovision Song Contest –Belgrade 2008. Five of them are automatically qualified for the Final: The “Big Four” (France, Germany, Spain and United Kingdom) and the winner of the ESC 2007, Serbia (host country). On January 28th was determined which 19 countries are represented in the First Semi-Final, and which 19 in the Second Semi-Final. France, Germany, Spain, United Kingdom and Serbia will be voting in one of the two Semi-Finals. Germany and Spain will vote in the First Semi-Final, and France, United Kingdom and Serbia in the Second Semi-Final. The objective of this experiment is to predict the final ranking for Azerbaijan and San Marino. Azerbaijan and San Marino will compete in the First Semi-Final for winning a place in the Final stage. For this experiment 30 runs were performed with 350,000 function evaluations. The results of the First Semi-Final indicate that Azerbaijan could attain a place in the Final stage. The results for both Azerbaijan and San Marino are contrasting because Azerbaijan obtained the first place and San Marino the last place at the First Semifinal.
Fig. 5. The final Scoreboard of ESC 2008.

Data Mining in Medical and Biological Research
312
The average median and interquartile range for the 30 runs were calculated by determine the results of the Final stage. The experiments predict a 7th place for Azerbaijan in the ESC 2008. Also, the results estimate an interquartile range equal to 4, that is a final ranking from 3rd to 11th. The final position of Azerbaijan was 8th place, and the final Scoreboard of ESC 2008 is showed in Figure 5, Azerbaijan is the 20 th row, and is emphasized using a blue box.
Conclusions.
The prediction of future events is a hard task, also impossible in several topics. There are several methods that have been used as an auxiliary tool, for building estimation models (Data Mining, Regression models, Support Vector Machines, Neural Networks). In this work, data mining and evolutionary computation are combined for predicting the behavior of the European society in a music contest. A huge set of models to predict the final ranking of the Eurovision Song Contest can be found in its web host. These works do not have focussed their attention in model the behavior of the European society when a new country competes for the first time in the ESC. Our approach propose a model that includes two main features: voting behavior and cultural characteristics. The model incorporates historical information about the vote assignation, that European society has performed along previously ESC editions. Besides the model includes information about intrinsic characteristics of the contender that represents a country (language, lyrics, genre, in others). The prediction performance was judged the last 24th May, 2008 when Eurovision Song Contest – Belgrade 2008 was developed. Next year this research is oriented to obtain the ranking of a returned country: Slovakia which doesn’t compete since 1998. We will utilize our proposed model and the information of another returned country Monaco who returned to ESC after 25 years in 2004 and its linguistic neighboor Czech Republic.
7.2 A hybrid methodology for classifying elements in a Social Diorama Evolutionary computation is a generic term used to make reference to the solution of planned and implemented computational problems based in models involving an evolutionary process. Most of the evolutionary algorithms propose biological paradigms, and the concepts of natural selection, mutation and reproduction. Nevertheless, other paradigms exist that can be adopted in the creation of evolutionary algorithms. Many environment problems are not structured, that can be considered from the perspective of cultural paradigms; the cultural paradigms offer a wide range of categorized models that don’t know the possible solutions to the problem - a common situation in the real world. The intention of the present subsection is to apply the computational properties of the cultural technology; in this case of corroborating them by means of mining data to propose the solution to a specific problem, adapted from the modeled literature about societies. Combined to this, we analyzed the location of a representing individual in a society with respect to the social similarity of his neighbors, in a form of a popular representation denominated diorama. The set of study conformed by 87 societies allowed us to analyze the individual characteristics without affecting the total sense of the diorama, and gave us the opportunity to emulate the distances that separate each one and also group them into the cluster that they belong to. Demonstrating that characteristic linguistics exists and culture that approximates them as well as they move apart. By means of this information it is

Social Data Mining to Improve Bioinspired Intelligent Systems
313
possible to predict the best diorama, redistributing the individuals that are part of it. This article tries to explain this representation of social behavior. The Cultural Algorithms are an approach of Evolutionary Computing, which use the culture like a vehicle to store excellent and accessible information to all the members of the population during many generations. Like in a human society, the cultural changes act as time advances; this provides a line base for the interpretation and documentation of individual behaviour within a society (Desmond et al., 1995). The Cultural Algorithms were developed to model the evolution of the cultural component through the time and to demonstrate how it learns and acquires knowledge. In agreement with this conception, the cultural algorithms can be used to lead the process of the self-adaptation within evolutionary systems in a variety of application areas (Callogerodóttir & Ochoa, 2007). The basic cultural algorithm can be described by means of the following pseudo code (Figure 6).
Begin t=0; Initialize POP(t); /* Initialization of population */ Initialize BLF(t); /* Initialization of believing space */ Repeat Evaluate POP(t); Vote (BLF (t), Accept (POP(t)))); Adjust (BLF (t)); Evolve(POP(t), Influence(BLF(t))); t = t +1; Select POP(t) from POP(t-1); Until (Term condition is reached) End
Fig. 6. Pseudo code base of Cultural Algorithms.
Initially a population of individuals that define the solution space, which is represented like a set of solutions within the space search, is generated randomly to create the first generation. In our example, the solution space contains a list of the attributes that can be used in the classification procedure. The space of beliefs is emptiness. For each generation, the Cultural Algorithm will be able to evolve a population of individuals using "frame" Vote-Inherit-Promote (VIP). During the phase of vote, the members of the population are evaluated to identify their contribution to the space of beliefs by using the acceptance function. These beliefs contribute in most of the solution of the problem and are selected or put to voting as they contribute to the present space of beliefs. The belief space is modified when the inherited beliefs are combined with the beliefs that have been added by the present generation, this is made using a reasoning process that allows updating the space of beliefs. Next, the updated space of beliefs is used to influence the evolution of the population. The belief space is used to influence the rest of the population and the acceptance of its beliefs is modified. During the last phase a new population is reproduced using a basic set of evolutionary operators. This new population might be evaluated and the cycle continues successively, until all the population has the same space of beliefs (Tang et al., 2006). Cycle VIP finishes when a condition of completion is introduced. This condition is usually reached when only a small or no change is detected in the population through

Data Mining in Medical and Biological Research
314
several generations or when certain knowledge in the space has emerged from beliefs, as it is appreciated above in Figure 6. Diorama: the social net representation.
A social network is a social structure that can be represented making use of different types of diagrams. The two most common types are the graph and the diorama. The graph is a collection of objects called vertices or nodes that are connected by lines edges or arcs. The nodes represent individuals which sometimes are denominated actors and the edges represent the relations that exist between these actors. The relations can be of different type, like financial interchanges, sexual friendship, relations, or places of tourism, for example. The social networks can be classified in: Dyadic: They only indicate absence or existence of relation between two actors. Valued: The extent of relation can be moderate in terms of order or weight, for example: number of sexual encounters between two persons. Transitive: The relation between actor A and B is always reciprocal. (Example: both read the same Blog habitually.) Directed: In this case an actor A has a relation with actor B, but, that does not imply that B has the same relation with A. (Example: to lend money) The representation of a social network can consist of one or more graphs where these graphs conceptualize the network, that is, the representation is made mainly on the basis of the relations that exist among the actors who conform the network. On the other hand dioramas are representations elaborated with materials or elements in three dimensions, which sometimes represent a scene of the real life. They are located in front of a curved bottom that can be painted in such a way that it simulates real surroundings and also they can be enhanced with illumination effects. In this subsection, we focus our attention in a practical problem of the literature related to Social Modeling, the accomplishment of a diorama, which allows us to understand the position that keeps a society with respect to others. The capacity to establish the locations in the diorama, allows us to establish "the negotiation of the best position" for the given set of societies. The solution to this problem could be given by a sequence of generations of agents, denoted "community". The agents can only reassign a position with respect to the other societies, according to previous behaviors (Ochoa, Ponce, et al., 2007) as seen in figure 7. A diorama can accommodate plant, animals, people, and battles among other things. In the case of the social networks, a diorama, unlike the graphs, characterizes the social network, that is, in a dyoram one of the actors who conform the network according to their roll and to the position imagines each that they have within the same one. The development of the social networks requires on one hand, the conceptual development, and on another, the development of discreet mathematical measures that allow ontological to explore the human systems from a sustained concept and in the data. But it is necessary to prioritize the conceptual development and the categories of the social network system, and at the same time thinking about the mathematical model. Distributing elements within a diorama.
From the point of view of the agents, the problem of optimization is very complex, taking into account that the best location of a representing individual for a society, with respect to other representatives, is not known. In the proposed algorithm for the cultural change, the individuals in the space of beliefs (beliefspace) through their best paradigm (BestParadigm) are put to zero to represent the fact that culture increases the amount of expectations associated with the location of a society with respect to others, giving an incentive to the behavior associated with the best paradigm (BestParadigm). We selected 87 societies
Social Data Mining to Improve Bioinspired Intelligent Systems
315
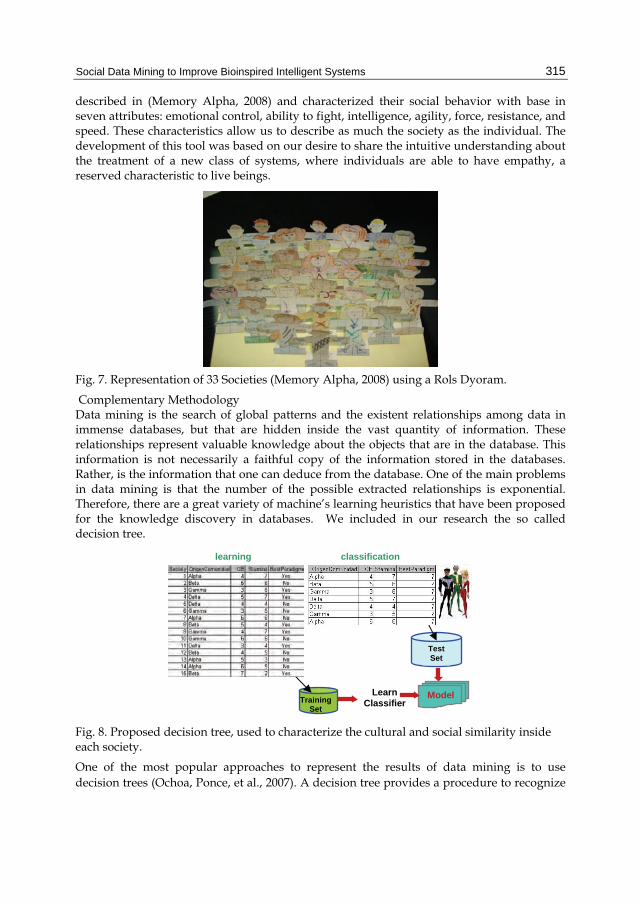
described in (Memory Alpha, 2008) and characterized their social behavior with base in seven attributes: emotional control, ability to fight, intelligence, agility, force, resistance, and speed. These characteristics allow us to describe as much the society as the individual. The development of this tool was based on our desire to share the intuitive understanding about the treatment of a new class of systems, where individuals are able to have empathy, a reserved characteristic to live beings.
Fig. 7. Representation of 33 Societies (Memory Alpha, 2008) using a Rols Dyoram.
Complementary Methodology Data mining is the search of global patterns and the existent relationships among data in immense databases, but that are hidden inside the vast quantity of information. These relationships represent valuable knowledge about the objects that are in the database. This information is not necessarily a faithful copy of the information stored in the databases. Rather, is the information that one can deduce from the database. One of the main problems in data mining is that the number of the possible extracted relationships is exponential. Therefore, there are a great variety of machine’s learning heuristics that have been proposed for the knowledge discovery in databases. We included in our research the so called decision tree.
Fig. 8. Proposed decision tree, used to characterize the cultural and social similarity inside each society.
One of the most popular approaches to represent the results of data mining is to use decision trees (Ochoa, Ponce, et al., 2007). A decision tree provides a procedure to recognize
learning classification
Training Set
Model Learn Classifier
TestSet

Data Mining in Medical and Biological Research
316
a given case for a concept. It is a “divide and conquer” strategy for the acquisition of the concept (instance). Decision trees have been useful in a great variety of practical cases in science and engineering (Zolezzi, Aandraison & Ochoa-Zezzatti); in this case we used data mining to characterize the individuals of each society (agents' community) and to understand how they obtain the best paradigm, as shown in figure 8.
Experiments
In order to achieve the most efficient arrangement of individuals in a social network, we developed an atmosphere to store the data of each one of the representing individuals of each society. This was made with the purpose of distributing in an optimal manner each of the evaluated societies. One of the most interesting characteristics observed in this experiment was the diversity of the cultural patterns established by each community. The structured scenes associated with agents cannot be reproduced in general, since they only represent a little moment in the space and time of the different societies. This represents a unique form and innovation of adaptive behavior which solves a computational problem. It does not cluster societies based only on their external appearance (genotype), but try to solve a computational problem that involves a complex change among the existing relations. The generated configurations can be metaphoric related to the knowledge of the behavior of the community with respect to an optimization problem (to belong culturally to a cluster with other similar societies that are not in the same quadrant (Memory Alpha, 2008)). The main experiment consisted of detailing each of the 87 communities, with 500 agents, and one condition of unemployment of 50 generations. This allowed us to generate different scenes for the best possible diorama, which was obtained after comparing the different cultural and social similarities from each community to determine the existing relations among them. The developed tool classified each of the societies belonging to each quadrant, with two tonalities, the strong tone for societies that included linguistic identity, and a smooth tone for societies only with a cultural identity. This permitted to identify changes in the time with respect to the other societies (see Figure 9).
Fig. 9. Graph constructed by means of the use of Cultural Algorithms and Clusterization (Social Data Mining). Using Cultural Algorithms we improved substantially the understanding of how to obtain the "best paradigm", because we classified properly the agent communities based on an approach that keeps their relation attributes. This allowed us to understand that the concept of "negotiation" exists with base in the determination of the function of acceptance on the part of the rest from the communities to the proposed locations for the rest of the same ones.
Red Tones = AlphaQuadrant Yellow Tones = Beta Quadrant Blue Tones = Gamma Quadrant Green Tones = Delta Quadrant

Social Data Mining to Improve Bioinspired Intelligent Systems
317
The Cultural Algorithms offer a powerful alternative for optimization problems and redistribution of clusterization. For that reason, this technique provides a quite comprehensible panorama of the cultural phenomenon represented (Ochoa, Ponce, et al., 2007). This technique allowed us to visualize the possibility of generating experimental knowledge created by the community of agents for a given application domain. The analysis of the level and degree of cognitive knowledge of each community is a desired aspect to evaluate for the future work. The answer can reside between the similarity that exists in the communication between two different cultures and how these are perceived. On the other hand, to understand the true similarities of different societies, based on the characteristics that group them in a cluster as well as those that make them unique, demonstrates that the small variations go beyond phenotypes characteristics and are mainly associate to tastes and similar characteristics developed through the time (Vukčević & Ochoa et al., 2007). A new Artificial intelligence can take care to analyze individually these complexities that each society has, without forgetting that still they need methods to understand original and particular characteristics of each society.
8. Conclusion and the future research. Social Data Mining try to improve the proposed solution by many evolving compute techniques (Ant Colony, PSO, and Cultural Algorithms) and provides knowledge by obtain the best solution in the search space. There are an important number of questions that deserve additional research. One will be to find new information sources to mine users preferences. An area with great potential is the electronic usage of media, specifically, digital music. By analyzing what kind of music is someone listening, a system can deduce the songs, the singers and the genders the person prefers, and by using this information recommending additional songs and artists, to get the person in touch with people of similar interests. We made an approach on this direction with a system that allows users to view individual and historical group listening lists and define with this information new listening lists (Ochoa, 2007). These systems learn of the user preferences based on the listened music, after songs are selected to be played on a shared physical environment, based on the preferences of the whole participants.
(a) (b) (c)
Fig. 10. Phases of solution of Japanese Puzzle using Data Mining and Cultural Algorithms.

Data Mining in Medical and Biological Research
318
Future research are Japanese Puzzles, which are a complex and combinatorial problem (see Figure 10). By using social data mining and cultural algorithms we believe it is possible to resolve them with less epoches; current benchmark has a restriction of 100*100 cells but using these two techniques we believe it is possible to overcome this restriction and obtain better results than those obtained by applying only genetic algorithms. In (González & Ochoa, 2008) is presented an approach to this novel research.
8. References Abrams, D., Baecker, R., and Chignell, M. Information Archiving with Bookmarks: Personal
Web Space Construction and Organization, in Proceedingsof CHI’98 (Los Angeles CA, April 1998), ACM Press, 41-48.
Baldonado, M.Q.W., and Winograd, T. An Information-Exploration Interface Supporting the Contextual Evolution of a User’s Interests, in Proceedings ofCHI’97 (Atlanta GA, March 1997), ACM Press, 11-18.
Bederson, B.B., Hollan, J.D., Perlin, K., Meyer, J., Bacon, D., and Furnas, G. 1996. Pad++: A zoomable graphical sketchpad for exploring alternate interface physics. J. Visual Lang. Comput. 7, 3–31.
Billsus, D. & Pazzani, M. Learning Collaborative Information Filters, in Proceedings of the International Conference on Machine Learning (Madison WI, July 1998), Morgan Kaufmann Publishers.
Callogerodóttir Z. & Ochoa A. Optimization Problem Solving using Predator/Prey Games and Cultural Algorithms In Proceedings of NDAM’2003, Reykiavik; Iceland.
Card, S.K., Robertson, G.C., and Mackinlay, J.D. The Information Visualizer, an Information Workspace, in Proceedings of CHI’91 (New Orleans LA, April 1991), ACM Press, 181-188.
Card, S.K., Robertson, G.C., and York, W. The WebBook and the Web Forager: An Information Workspace for the World-Wide Web, in Proceedings of CHI’96(Vancouver BC, April 1996), ACM Press, 111-117
Chalmers, M., Rodden, K., and Brodbeck, D. The Order of Things: Activity- Centred Information Access, In Proceedings of 7th International Conference on the WWW, 1998. (Brisbane Australia, April 1998), 359-367.
Charnov, E. L. Optimal Foraging: the Marginal Value Theorem”. Theoretical Population Biology, 9, 129-136, 1976.
Chung, C. & Reynolds, G. R. CAEP: An Evolution-based Tool for Real-Valued Function Optimization using Cultural Algorithms. International Journal on Artificial Intelligence Tools, 7(3), 239-291, 1998.
Crossen, A., Budzik, J., and Hammond, K.J. Flytrap: Intelligent Group Music Recommendation, in Proceedings of IUI’2002 (San Francisco CA, January 2002), ACM Press.
Desmond, A. & Moore J. Darwin–la vida de un evolucionista atormentado. Generación Editorial; Brazil, 1995.
Dorigo, M., Maniezzo, V. & Colorni, A., 1996, “Ant System: Optimization by a Colony of Cooperating Agents”. IEEE Transactions on Systems, Man and Cybernetics-Part B, 26(1), 29-41.
Egghe, L and Rousseau, R. Introduction to Informetrics: Quantitative methods in library, documentation, and information science. Elsevier, New York, NY, 1990.
Epstein, J. & Axtell R. Growing Artificial Societies. MIT Press/Brookings Institue, Cambridge, MA, 1996.
Gelbukh, A. & Sidorov G. Alignment of Paragraphs in Bilingual Texts Using Bilingual Dictionaries and Dynamic Programming. In Proceedings of CIARP 2005: 824-833

Social Data Mining to Improve Bioinspired Intelligent Systems
319
Gelbukh, A.; Sidorov, G. & Chanona-Hernández, L. Lexical-Based Alignment for Reconstruction of Structure in Parallel Texts. In Proceedings of NLDB 2007: 401-406
Ginsburgh, V. and Noury A.. Cultural voting: The Eurovision Song Contest. http://ssrn.com/abstract=884379, 2005.
Gónzalez S. & Ochoa A. Resolution of Japanese puzzles using Data Mining and Cultural Algorithms. (Accepted paper) In Proceedings of COMCEV’2008, México; 2008.
Hightower, R.R., Ring, L.T., Helfman, ,J.I., Bederson, B.B., and Hollan, J.D., Graphical multiscale Web histories: A study of PadPrints. in Proceedings of Hypertext ’98 (Pittsburgh PA, June 1998). ACM Press, New York, NY.
Hill, W.C., Hollan, J.D., Wroblewski, D., and McCandless, T., Edit Wear and Read Wear, In: Proceedings of CHI'92. (Monterey CA, May 1992), ACM Press, 3-9.
Hill, W. C. and Terveen, L. G. Using Frequency-of-Mention in Public Conversations for Social Filtering. in Proceedings of CSCW’96 (Boston MA, November 1996), ACM Press, 106-112.
Holland, J. H. Emergence in Evolve Compute. Addison-Wesley Press, Reading, MA, 1-10, 1998. Hölldobler, B. & Wilson, E. O. The Ants. Springer-Verlag, Berlin, 1990. Jin, X.. & Reynolds, G.R. Using Knowledge-Based Evolutionary Computation to Solve
Nonlinear Constraint Optimization Problems: a Cultural Algorithm Approach. In Proceeding of the 1999 CEC, 1672-1678, 1999.
Kennedy, J. & Eberhart, R. C. Particle Swarm Optimization. In Proceeding of the IEEE International Conference on Neural Networks, Perth, Australia, IEEE Service Center, 12-13, 1995.
Kennedy, J. and Eberhart, R. The Particle Swarm: Social Adaptation in Information-Processing Systems. McGraw-Hill, London, 1999.
Kennedy, J.; Eberhat, R.C.; & Shi, Y. Swarm Intelligence. Morgan Kaufmann Publishers, San Francisco, CA, 2001.
Kleinberg, J.M. Authoritative Sources in a Hyperlinked Environment, in Proceedings of 1998 ACM-SIAM Symposium on Discrete Algorithms (San Francisco CA, January 1998), ACM Press.
Mackinlay, J.D., Rao, R., and Card, S.K. An Organic User Interface for Searching Citation Links, in Proceedings of CHI’95 (Denver CO, May 1995), ACM Press, 67-73.
Mander, R., Salomon, G., and Wong, Y.Y. A ‘Pile’ Metaphor for Supporting Casual Organization of Information, in Proceedings of CHI’92 (Monterey CA, May 1992), ACM Press, 627-634.
Maniezzo, V. Ant Colony Optimization: An Overview, 2000. Marshall, C., Shipman, F., and Coombs, J. VIKI: Spatial Hypertext Supporting Emergent
Structure, in Proceedings of ACM ECHT '94, (Edinburgh, Scotland, September 1994). ACM Press,13-23.
Memory Alpha. memory-alpha.org (Star Trek World), 2008. Morrison, R. & De Jong, K. A Test Problem Generator for Non-Stationary Environments. In
Proceedings of Congress on Evolutionary Computation, IEEE Press, 2047-2053, 1999. Munro, A.J, Höök, K., and Benyon, D (Eds.) Social Navigation of Information Space. Springer,
1999. Ochoa, A. et al. Explain a Weblog Community, in Proceedings of HAIS’2007 (Salamanca,
Spain), 2007. Ochoa A., Meneguzzi P. et al. Italianitá: Discovering a Pygmalion effect on Italian
communities using data mining. In Proceedings of CORE’2006. Ochoa A., Ponce J. et al. Baharastar – Simulador de Algoritmos Culturales para la Minería
de Datos Social. In Proceedings of COMCEV’2007, México, 2007.

Data Mining in Medical and Biological Research
320
Ochoa A., Quezada S. et al. From Russia with disdain: Simulating a civil War by means of Predator/Prey Game & Cultural Algorithms. (Accepted paper) MICAI’2008; México, 2008.
Pirolli, P., Schank, P., Hearst, M., and Diehl, Scatter/Gather Browsing Communicates the Topic Structure of a Very Large Text Collection, in Proceedings of CHI’96 (Vancouver BC, April 1996), ACM Press, 213-220.
Pitkow, J., and Pirolli, P. Life, Death, and Lawfulness on the Electronic Frontier, in Proceedings of CHI’97 (Atlanta GA, March 1997), ACM Press, 383-390.
Rauhlen, M.. Culture’s Consequences. Beverly Hils, California: Sage, 1997. Resnick, P., Iacovou, N., Suchak, M., Bergstrom, P., Riedl, J. GroupLens. An Open
Architecture for Collaborative Filtering of Netnews. In: Proceedings of CSCW’94 (Chapel Hill NC, October 1994), ACM Press, 175-186.
Reynolds, R. G. & Saleem, S. M. “The Impact of Environmental Dynamics on Cultural Emergence”. Perspectives on Adaptions in Natural and Artificial Systems. Oxford University Press, 253-280, 2005.
Robertson, G., Czerwinski, M., Larson, K., Robbins, D.C. Data Mountain: Using Spatial Memory for Document Management, in Proceedings of UIST’98 (San Francisco CA, November 1998), ACM Press, 153-162.
Rychlyckyj, N.; Ostrowski, D.; Schleis, G. & Reynolds, R. G. Using Cultural Algorithms in industry. In Proceedings of the 2003 IEEE Swarm Intelligence Symposium, 187-192, 2003.
Shipman, F., Marshall, C., and LeMere, M. Beyond Location: Hypertext Workspaces and Non-Linear Views, in Proceedings of ACM Hypertext '99, ACM Press, 121-130.
Smith, M.A., and Fiore, A.T. Visualization Components for Persistent Conversations, in Proceedings of CHI’2001 (Seattle WA, April 1998), ACM Press, 136-143.
Suaremi, T., Shikari, K., & Hal Shayera. Understand social groups using artificial intelligence techniques. In Proceedings of NDAM’2006, Reykiavik, Iceland, 2006.
Tang, H. et al. The Emergence of Social Network Hierarchy Using Cultural Algorithms, VLDB'06, Seoul, Korea, 2006.
Terveen, L.G., McMackin, J., Amento, B., and Hill, W. Specifying Preferences Based On User History, in Proceedings of CHI’2002 (Minneapolis MN, April 2002), ACM Press.
Viegas, F.B. and Donath, J.S. Chat Circles, in Proceedings of CHI’99 (Pittsburgh, PA, May 1990), ACM Press, 9-16.
Vukčević I., Ochoa A. & Đraguljovič, H. Similar cultural relationships in Montenegro. WKDD’2007, England, 2007.
Wexelblat, A. and Maes, P. Footprints: History-Rich Tools for Information Foraging, in Proceedings of CHI’99 (Pittsburgh PA, May 1999), ACM Press, 270-277.
Whittaker, S., Jones, Q., and Terveen, L. Persistence and Conversation Stream Management: Conversation and Contact Management, in Proceedings of HICSS’02.
Yair, G.. Unite unite Europe: The political and cultural structures of Europe as relected in the eurovision song contest. Social Netwroks, 17(2): 147-161, 1995.
Yair, G. & Maman, D. The persistent structure of hegemony in the ESC. Acta Sociologica, 39:309-325, 1996.
Zolezzi, D.; Aandraison, D. & Ochoa-Zezzatti, A. A model to explain the extinction of San Benedicto Rock Wren using Cultural Algorithms. In Proceedings of OCAAI’2007. Bakú, Azerbaijan, 2007.