Embed Size (px)
Citation preview
Social Demographic Predictors of Graduation Rate Completers
Prof. Irmannette Torres-LugoAssistant Researcher
Office of Institutional Research & Planning - UPRM
Purpose
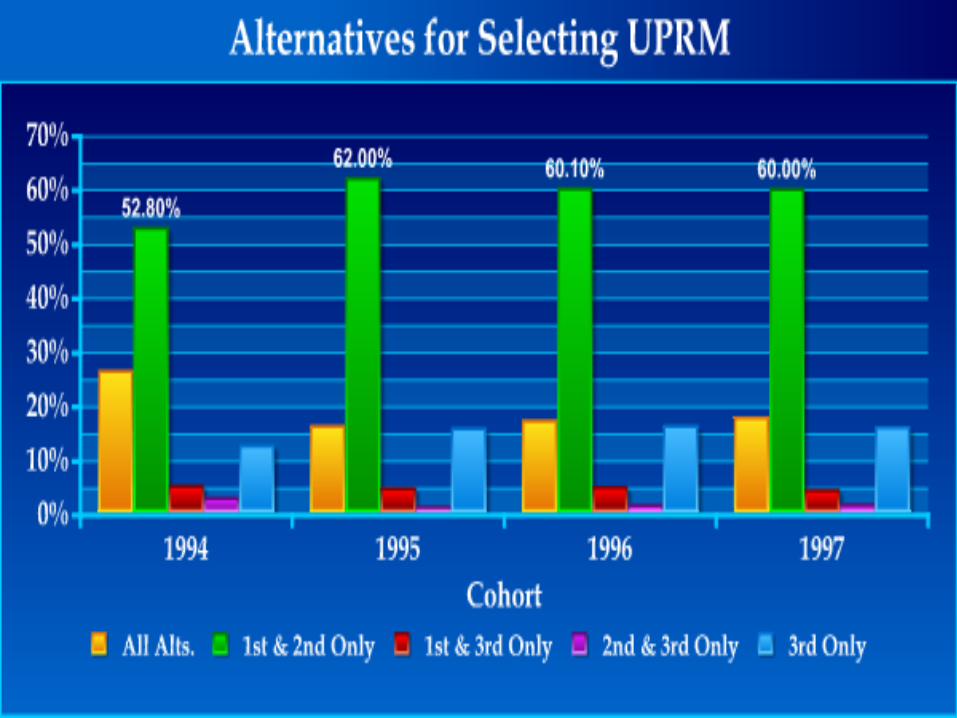
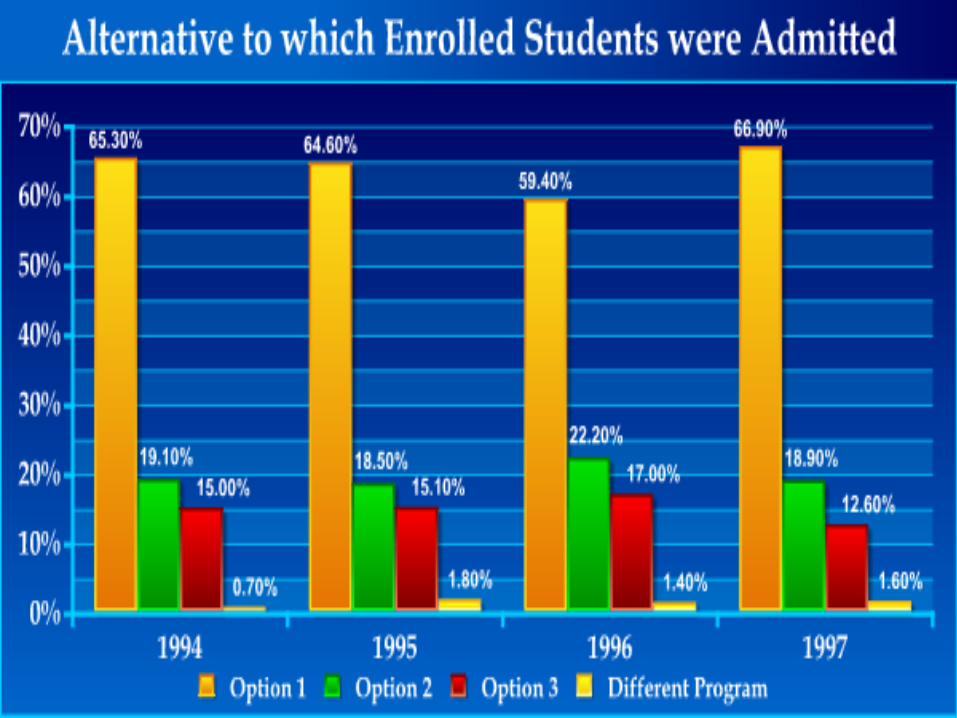
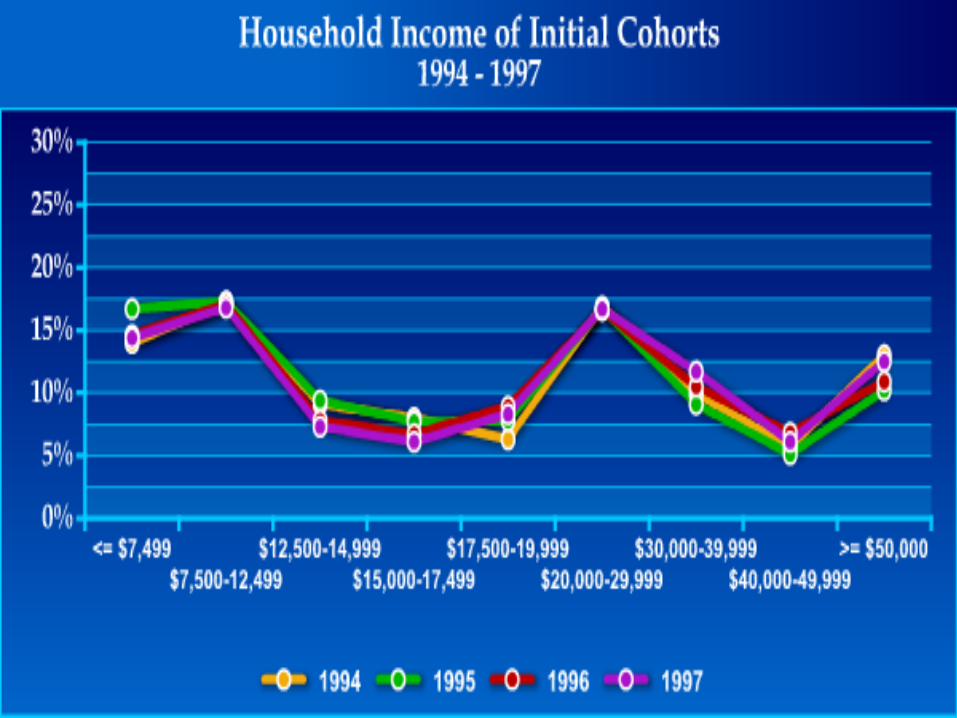
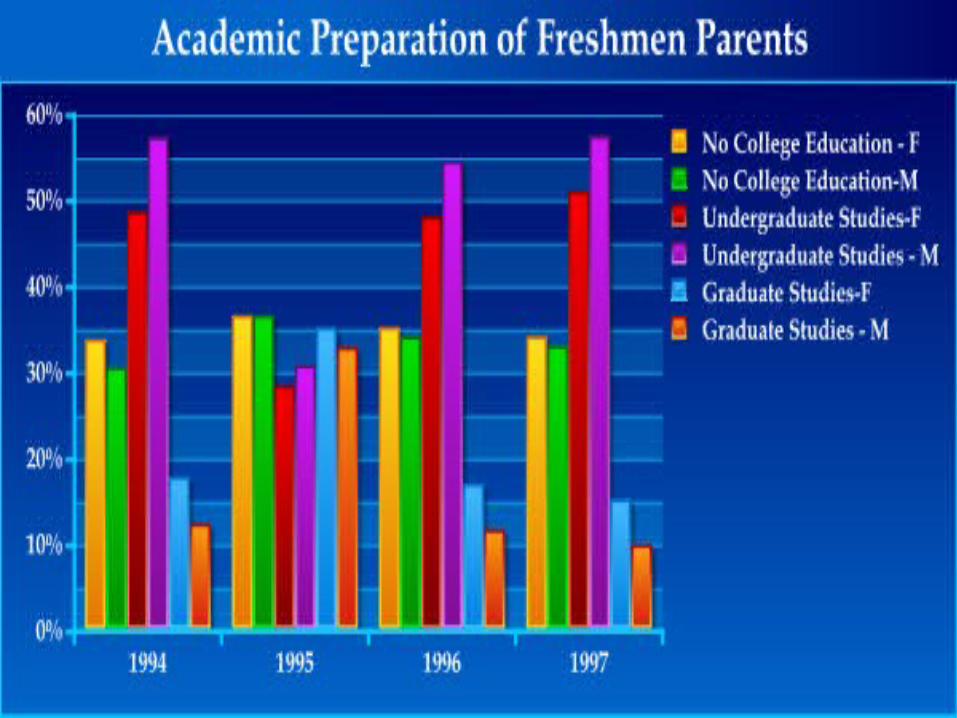
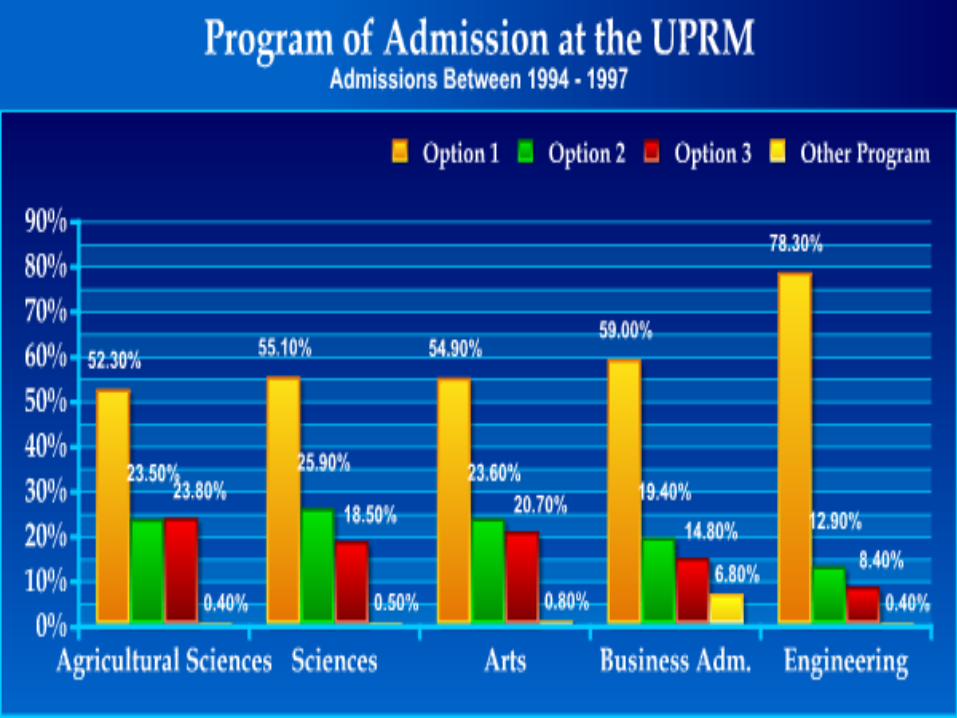
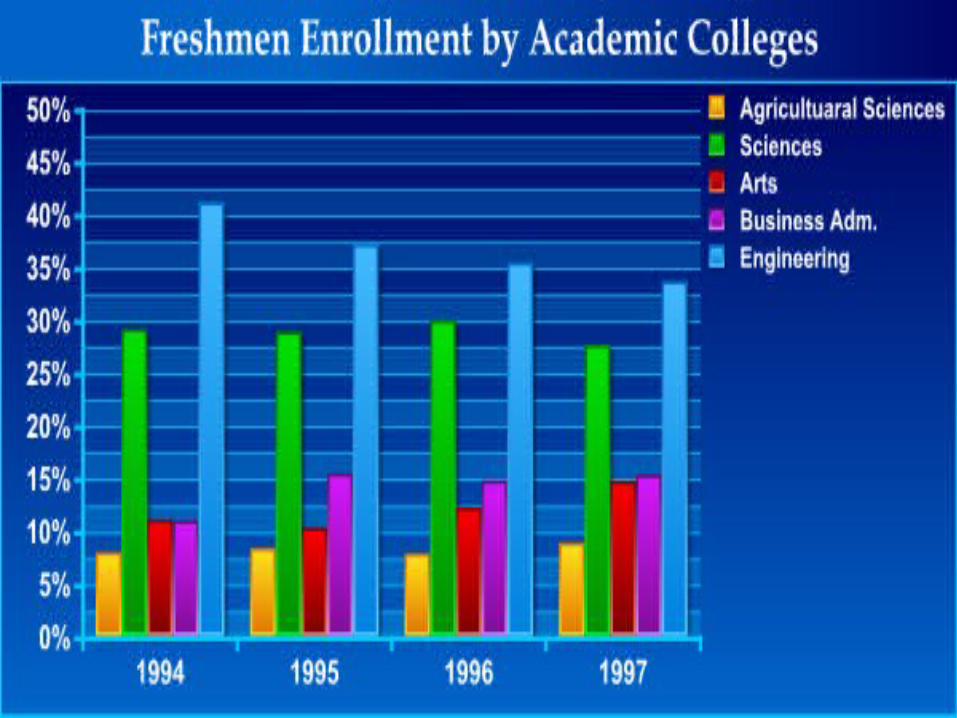
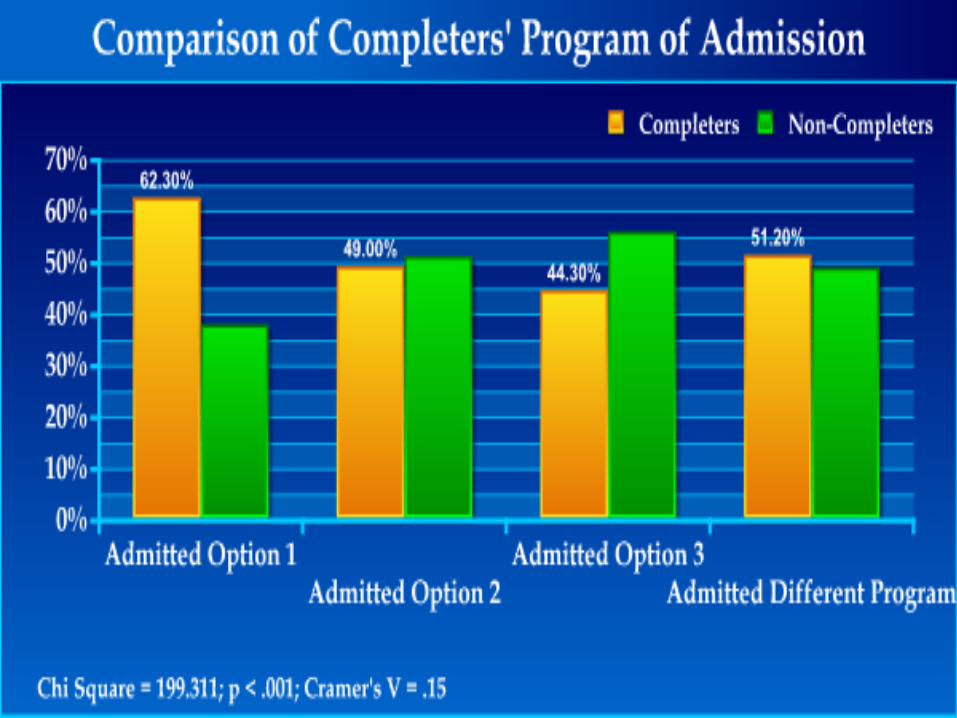
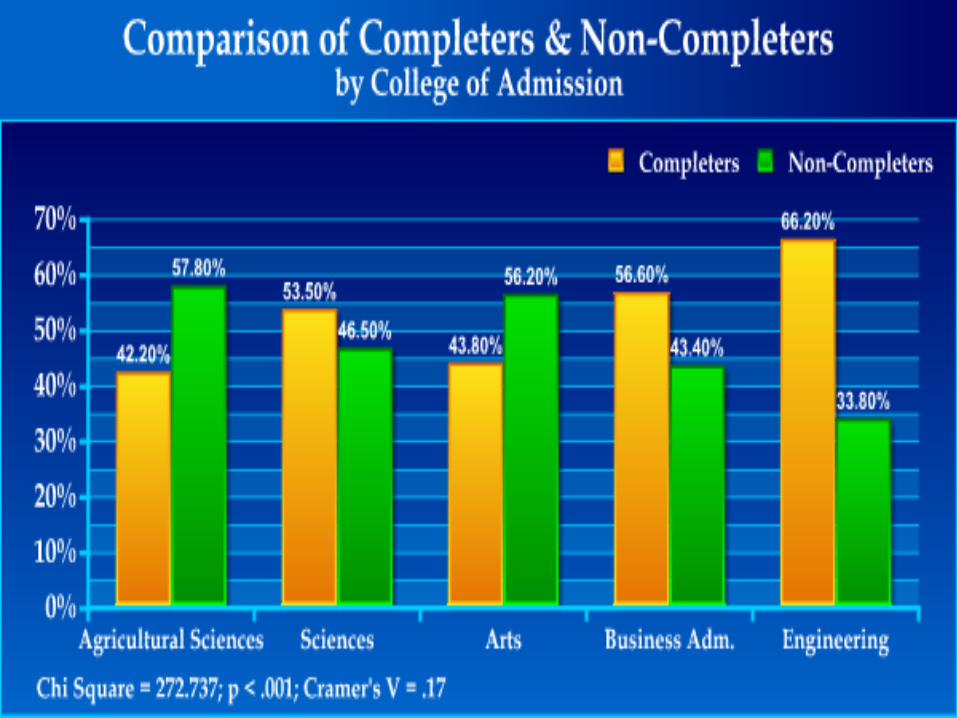
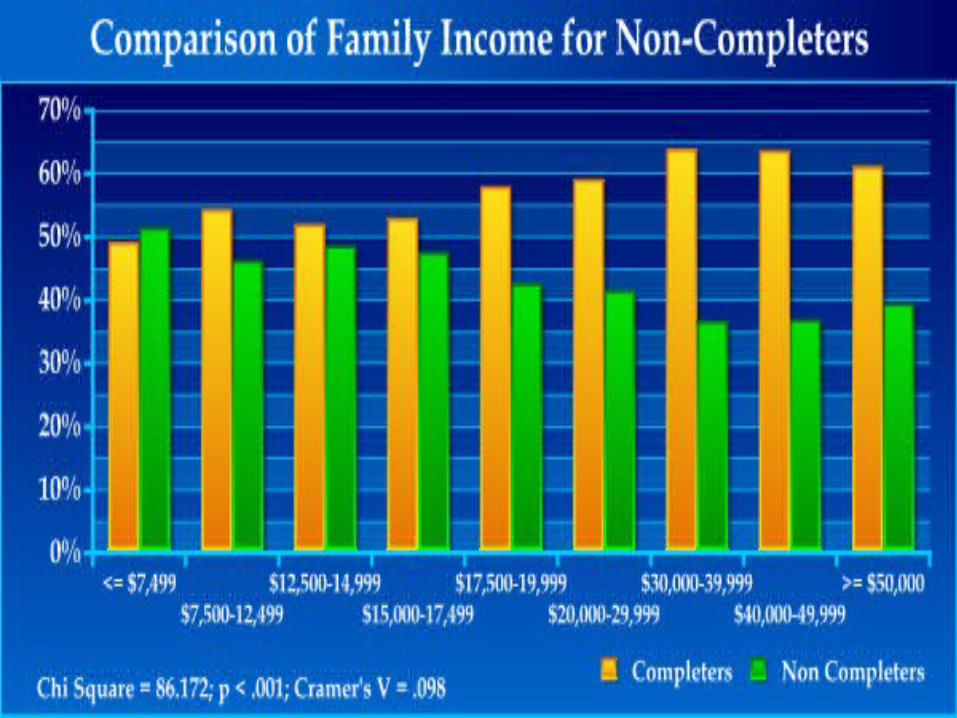
Describe the UPRM first-time degree-seeking students in terms of: Program options for admission to UPRM College of Admission Academic history Family income Parental Education
Determine if there are differences amongst these variables in terms of being a completer within 150% normal time to degree
Identify potential areas of intervention
UPRM Description Undergraduate Profile (Carnegie
2005):Full-time four year institution with long
programs (i.e., 5 years)More selectiveLow transfer-in
Admissions are done at the systemic level and are based on a General Admission Index which is a composite of the students’ High School GPA and the Verbal and Mathematical Aptitude scores of the CEEB

Present Study Uses data from the UPR Central
Administration data supplied on the admission applications
Is merged with the data bases of academic achievement that have been established by the UPRM OIRP.
Is a work in progress in model seeking to identify areas of intervention and information to be gathered in order to improve student graduation rates.
Who are the UPRM first-time degree-seeking students?
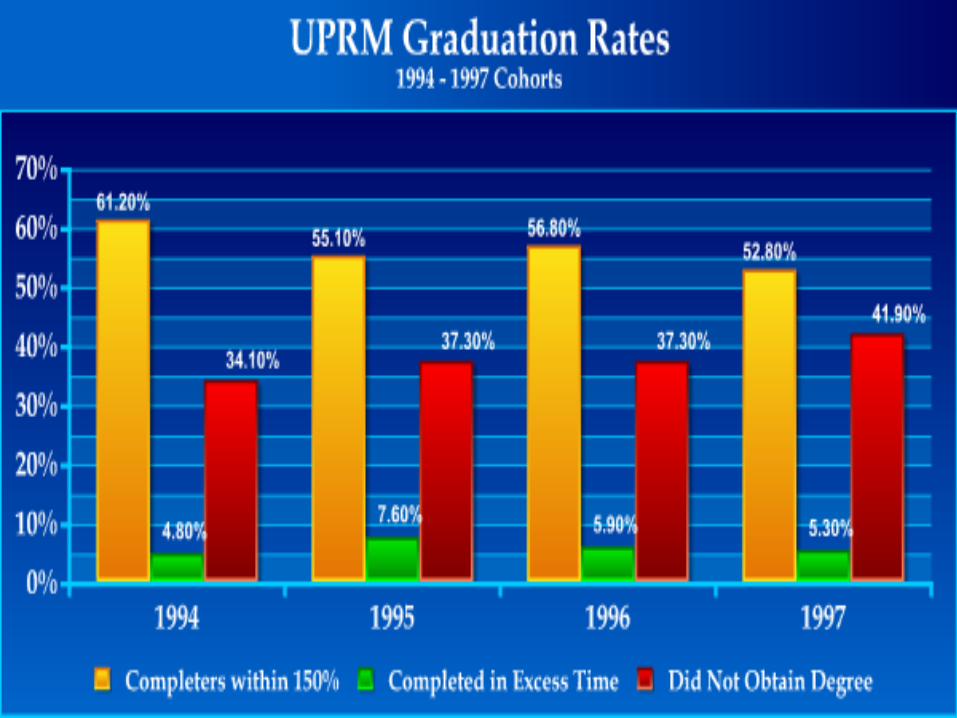
What is the UPRM Graduation Rate?
Are there differences between completers and non-completers?
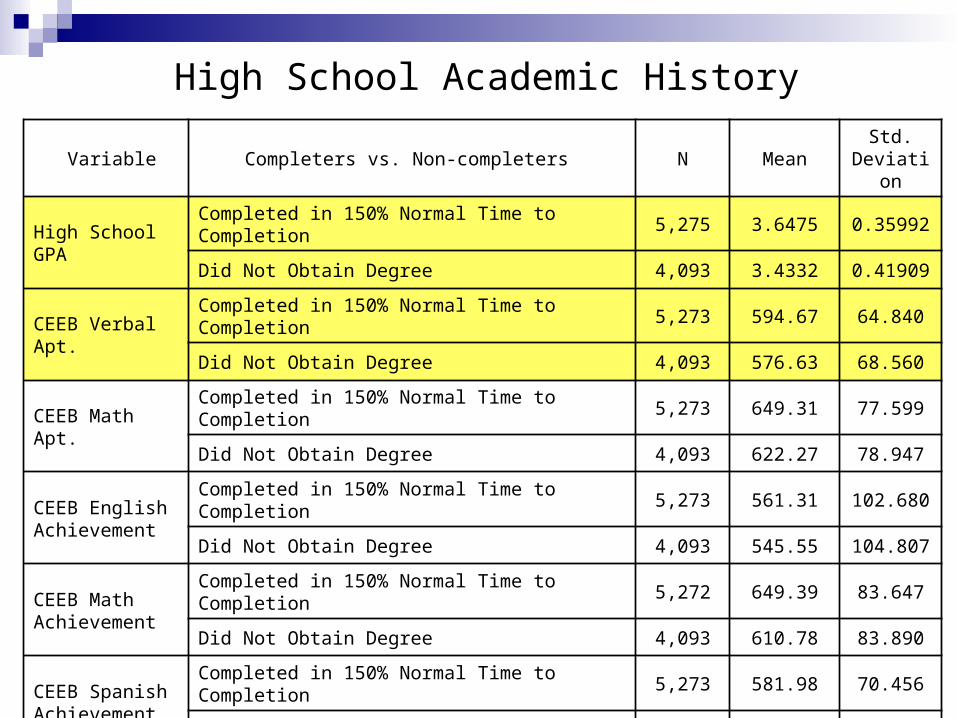
Variable Completers vs. Non-completers N MeanStd.
Deviation
High School GPA
Completed in 150% Normal Time to Completion
5,275 3.6475 0.35992
Did Not Obtain Degree 4,093 3.4332 0.41909
CEEB Verbal Apt.
Completed in 150% Normal Time to Completion
5,273 594.67 64.840
Did Not Obtain Degree 4,093 576.63 68.560
CEEB Math Apt.
Completed in 150% Normal Time to Completion
5,273 649.31 77.599
Did Not Obtain Degree 4,093 622.27 78.947
CEEB English Achievement
Completed in 150% Normal Time to Completion
5,273 561.31 102.680
Did Not Obtain Degree 4,093 545.55 104.807
CEEB Math Achievement
Completed in 150% Normal Time to Completion
5,272 649.39 83.647
Did Not Obtain Degree 4,093 610.78 83.890
CEEB Spanish Achievement
Completed in 150% Normal Time to Completion
5,273 581.98 70.456
Did Not Obtain Degree 4,093 551.87 73.439
General Admission Index
Completed in 150% Normal Time to Completion
5,275 315.91 31.521
Did Not Obtain Degree 4,093 299.11 32.078
High School Academic History

Conclusion and Future Possibilities…
Significant differences warrant further explorationData validation is requiredStratified statistical analysis have to be
performed to pinpoint the degree of association amongst variables and what variables are mostly associated
New methods must be established to gather more insight:
NSSE results Freshmen Surveys Student Profile
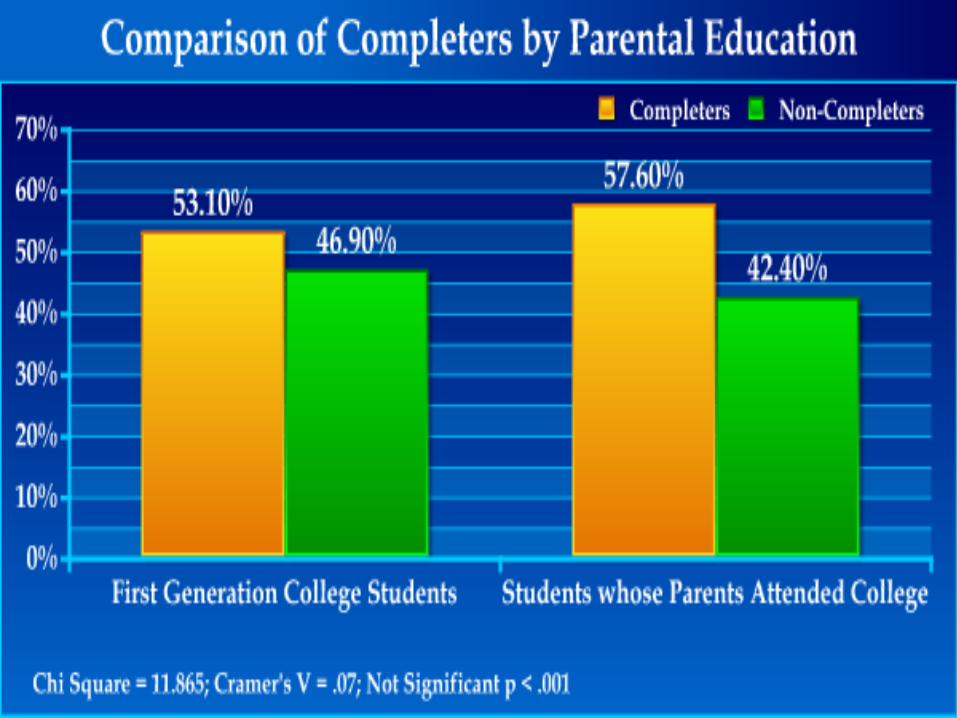
All variables explored revealed significant differences except for parental education:Data for 1995 must be validated since it
does not follow the trend for the responses offered in the other years
Data revealing differences amongst demographic variables of completers and non-completers offers insight to areas for early intervention:This would require early knowledge of
who these students are Initiatives implemented must be non-
discriminatory
Final Reflections Despite finding significant differences,
the greatest variance explained for any of the variables fluctuated between 15% - 17% Further quantitative variables must be
analyzedOther variables are serving as
confounding variablesThe challenge is to design systems and
mechanisms for identifying these variables.

Questions & Suggestions

We invite you to visit our website:
http://oiip.uprm.edu/For further information feel free to contact:
Prof. Irmannette [email protected]
(787) 265 - 5465