Embed Size (px)
Citation preview
Social Demographics and Health
Achievements
An Ecological Analysis of Institutional Delivery
and Immunization Coverage in India
April 2021
Saroj Kumar
Abhishek Kumar
Rakesh Kumar William Joe
1
Social Demographics and Health Achievements
An Ecological Analysis of Institutional Delivery and Immunization Coverage in India
Saroj Kumar, Abhishek Kumar, Rakesh Kumar and William Joe*
Population Research Centre,
Institute of Economic Growth,
Delhi University North Campus, Delhi 110007
ABSTRACT
The National Rural Health Mission of India was expected to have two broad kinds of impacts
on institutional delivery and immunization coverage. First, to significantly increase
institutional delivery and immunization coverage levels across all districts and, second, to
enhance equity by reducing utilization gaps between districts with higher and lower share of
marginalised population. This paper adopts a lens of social demography and presents an
ecological analysis of poor performing districts in nine high focus States of India. We find
that between year 2007-08 and 2012-13 there has been considerable progress in institutional
delivery across all the districts but improvements in full immunization coverage has been
slow and many districts are failing to sustain progress in immunization coverage.
Econometric analysis reveals that districts with higher shares of Muslims display slowest
progress. The association is robust even in models adjusted for district-level clustering.
Districts with greater availability of specialists in public health facilities have a favorable
impact on institutional births whereas female literacy levels have significant influence on
immunization. In concluding, we discuss the need for policy debiasing as more than a
uniform approach is necessary to facilitate rapid progress in immunization across districts.
Keywords: Social demography, Immunization, Institutional births, District Level Household
Survey (DLHS), National Health Mission (NHM)
2
Social Demographics and Health Achievements
An Ecological Analysis of Institutional Delivery and Immunization Coverage in India
Introduction
The National Rural Health Mission (NRHM) – a flagship programme of the Government of
India - was launched in 2005 to achieve faster and equitable improvements in maternal and
child health outcomes in the country (Planning Commission of India, 2011). The NRHM
recommended almost uniform set of strategies and interventions across states and districts to
ensure universal coverage of maternal and child health care services. The states were
entrusted to prepare the programme implementation plans for strengthening supply-side
factors such as availability and quality of health infrastructure and human resources across
districts. Also, on an unprecedented scale, the Mission rolled out demand-side financing
scheme by providing direct monetary incentives to the beneficiaries to promote institutional
births (conditional cash transfer programme, Janani Suraksha Yojana, JSY). Furthermore,
under Janani Shishu Suraksha Karyakram, (JSSK) provisions were made for free drugs,
diagnostics and drop-back facilities for pregnant women and mothers to promote uptake of
maternal and child health care services.
Community engagement was identified as an integral part of the programme strategies to
achieve greater mobilization and support from local level institutions such as Panchayats and
schools. The Mission developed a network of community health workers (named as
Accredited Social Health Activists, ASHAs) to improve health awareness and promote
linkages between communities and the public health system. These efforts, along with JSY,
contributed towards an overall increase in utilization of maternal health care services with
3
particularly favourable impact on institutional delivery that increased from 39% in 2005-06 to
79% in 2015-16 (IIPS, 2015-16; Vellakkal, 2017a, 2017b; Powell-Jackson et al. 2015; Lim et
al., 2010). However, in case of childhood immunization (44% 2005-06 to 62% in 2015-16)
India failed to experience improvements of similar magnitude (IIPS, 2015-16; Dasgupta et al.
2014). Progress notwithstanding, the representativeness of national achievement in
institutional delivery and immunization coverage is also questionable because of huge inter-
district disparities across states and regions (ORGI & IEG, 2016). This assumes critical
relevance because districts are identified as the key unit for planning, administration and
programme implementation. Against this backdrop, this paper presents an ecological
analysis of dissimilar health progress across selected Indian districts and highlights issues for
policy debiasing for greater effectiveness.
The analysis adopts a social demographic perspective that is regarded as an important
theoretical approach to understand such spatial disparities in health and health care progress
(Arcaya et al. 2015; Kawachi, 2002; Krieger, 2001; Williams, 2001; Curtis & Jones, 1998).
In particular, spatial disparities in health and health care achievements are linked to
differences in socioeconomic profile of the place. Such disparities are expected because of
both compositional and contextual effects associated with a place (Curtis & Jones, 1998).
The former type of effect is attributable to the variations in the distribution of type of people
whose individual characteristics influence health and health care whereas the latter effect
embodies the influence of the social and physical environment in shaping health and
achievement. In fact, segregation based on such compositional effects is argued to be an
important determinant of quality of health care provisioning with significant disadvantages
for the marginalized subgroups (William & Collins, 2001). Even in the Indian context, it is
noted that regions with greater concentration of historically marginalized social groups
4
(Scheduled Caste or Scheduled Tribe, SC or ST) suffer from high incidence of poverty,
illiteracy and health deprivations (Thorat et al. 2016; Thorat & Dubey, 2012; Baru et al.
2010; Sengupta et al. 2008; Desai & Kulkarni, 2008). Similarly, regions with higher share of
Muslim population depict poor social and economic development (Sachar, 2006). Entailing
such an ecological approach assumes salience in policymaking and offers vital insights
regarding the associations between contextual, structural and sociological dimensions of
public health (Curtis & Jones, 1998; Susser, 1994; Schwartz, 1994).
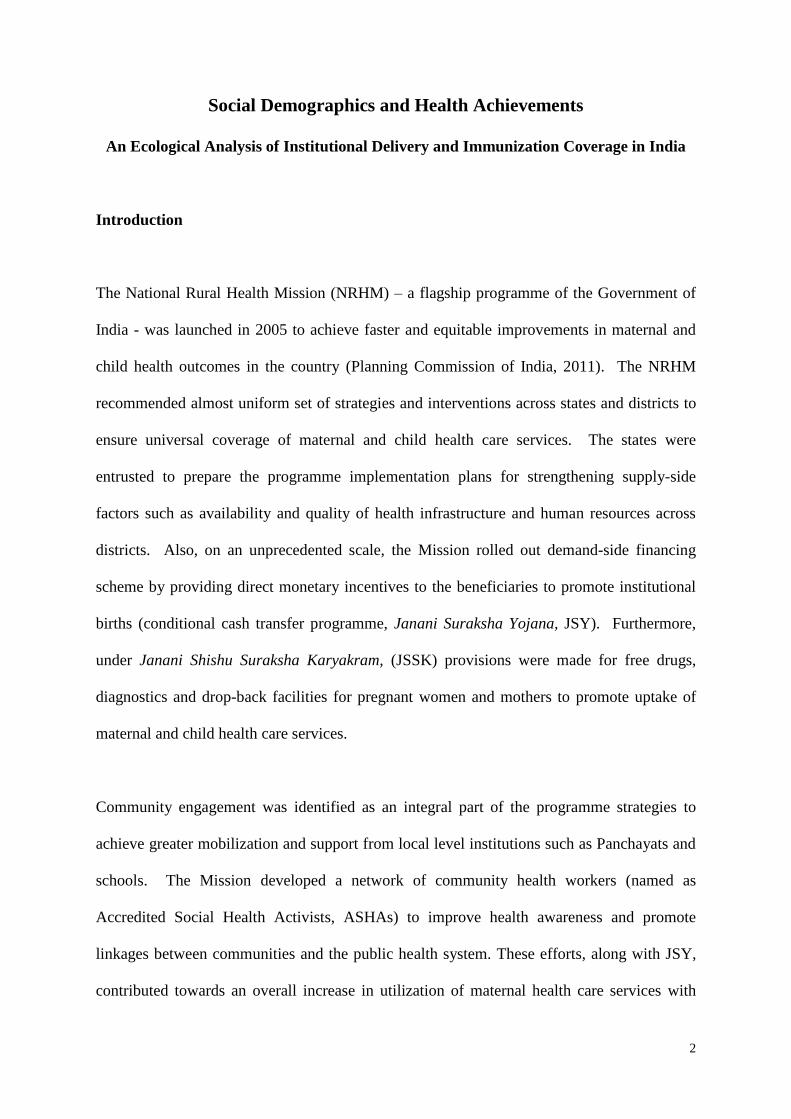
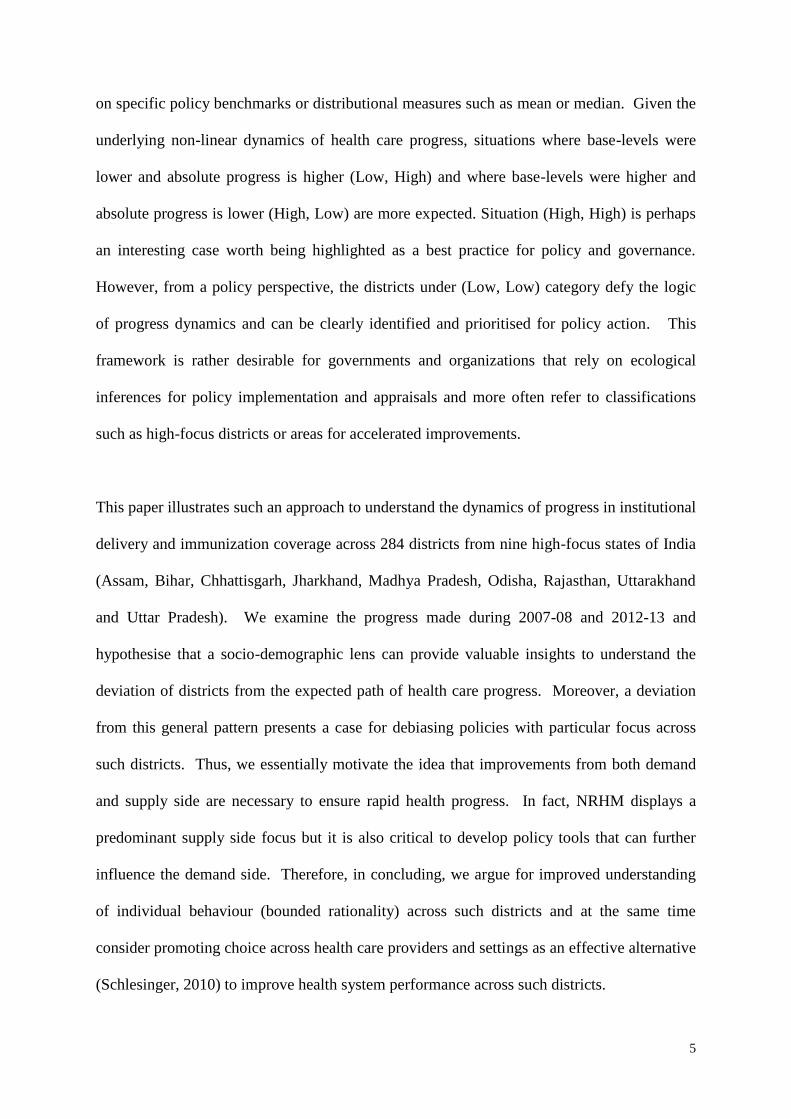
Figure 1: A typology of base-level and progress relationship
Progress
Low High
Base level
Low (Low, Low) (Low, High)
High (High, Low) (High, High)
Before proceeding further, it is critical to account for an elementary inverse association
between base level of health indicator and the progress thereon (Waage et al. 2010; Easterly,
2009; Prennushi et al. 2002; Dasgupta, 1990; Sen, 1981). In fact, it is widely acknowledged
that regions with higher base-levels are more likely to demonstrate slower progress than those
with lower base-levels (Fukuda-Parr et al. 2013; Kakwani, 1993). A simple two-way
classification of districts in terms of base-level and progress further illustrates this concern.
Figure 1 shows that districts can be categorised into those with higher and lower base-levels
and, similarly, those with higher and lower progress. Thus, a mutually exclusive
classification of districts is possible whereby the threshold cut-off point can be defined based
5
on specific policy benchmarks or distributional measures such as mean or median. Given the
underlying non-linear dynamics of health care progress, situations where base-levels were
lower and absolute progress is higher (Low, High) and where base-levels were higher and
absolute progress is lower (High, Low) are more expected. Situation (High, High) is perhaps
an interesting case worth being highlighted as a best practice for policy and governance.
However, from a policy perspective, the districts under (Low, Low) category defy the logic
of progress dynamics and can be clearly identified and prioritised for policy action. This
framework is rather desirable for governments and organizations that rely on ecological
inferences for policy implementation and appraisals and more often refer to classifications
such as high-focus districts or areas for accelerated improvements.
This paper illustrates such an approach to understand the dynamics of progress in institutional
delivery and immunization coverage across 284 districts from nine high-focus states of India
(Assam, Bihar, Chhattisgarh, Jharkhand, Madhya Pradesh, Odisha, Rajasthan, Uttarakhand
and Uttar Pradesh). We examine the progress made during 2007-08 and 2012-13 and
hypothesise that a socio-demographic lens can provide valuable insights to understand the
deviation of districts from the expected path of health care progress. Moreover, a deviation
from this general pattern presents a case for debiasing policies with particular focus across
such districts. Thus, we essentially motivate the idea that improvements from both demand
and supply side are necessary to ensure rapid health progress. In fact, NRHM displays a
predominant supply side focus but it is also critical to develop policy tools that can further
influence the demand side. Therefore, in concluding, we argue for improved understanding
of individual behaviour (bounded rationality) across such districts and at the same time
consider promoting choice across health care providers and settings as an effective alternative
(Schlesinger, 2010) to improve health system performance across such districts.
6
Data and methods
The analysis is based on 284 districts from nine States of India namely Assam, Bihar,
Chhattisgarh, Jharkhand, Madhya Pradesh, Odisha, Rajasthan, Uttar Pradesh and
Uttarakhand. These States have relatively high fertility and child mortality rates and account
for about one-half of the total population of India (ORGI, 2016). The district level
information regarding institutional delivery and full immunization coverage obtained from
the District Level Household Survey (DLHS) 2007-08 factsheets (IIPS 2008) and Annual
Health Survey (AHS) 2012-13 factsheets (RGI 2014) are used to understand progress during
this period (IIPS, 2007-08; ORGI, 2012-13). Although, NRHM was launched in 2005, but
this analysis considers 2007-08 estimates as the base period for this analysis. The year 2012-
13 provides sufficient time gap for the programme to make a comprehensible impact on these
health care indicators.
The district level shares of SC, ST and Muslim population is available from Census of India
2001 and 2011. As we aim to examine whether there is a significant difference in levels of
institutional delivery and full immunization coverage across districts with higher share of
vulnerable social groups viz. SC, ST, Muslims, therefore, we use a threshold of 25%
population share to categorize districts on the basis of socio-demographic composition as
high SC, high ST or high Muslim population district. The distribution of districts across
these States as well as information regarding number of districts with greater concentration
(more than 25%) of ST, SC and Muslim population is available in Supplementary Table S1.
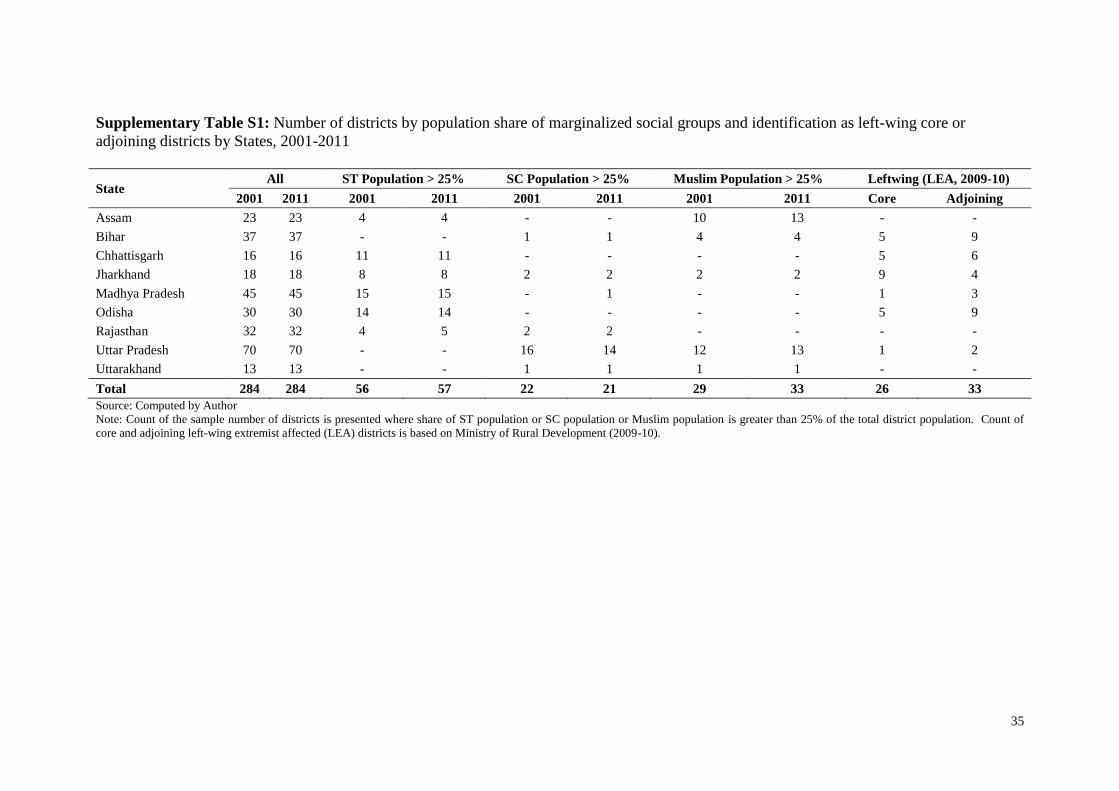
Overall, about one-fifth of the 284 districts have a greater concentration of ST population.
Madhya Pradesh, Odisha and Chhattisgarh have 15, 14 and 11 districts respectively with
higher concentration of ST population. Uttar Pradesh has a large number of districts with
7
greater concentration of the SC population (16 and 14 in 2001 and 2011, respectively). More
than 10% of the districts have a higher concentration of Muslim population. In particular,
Assam, Uttar Pradesh and Bihar have more districts with higher proportion of Muslim
population than others.
During the NRHM period, there have been other developmental changes which could have
directly or indirectly contributed to improvements in institutional delivery and immunization
coverage. Therefore, we also include certain key developmental variables to discern their
influence on progress between 2007-08 and 2012-13. In particular, we use the region-
specific poverty headcount ratios for the years 2004-05 and 2011-12 to proxy the income
deprivation levels across districts in the respective time-periods (Chauhan et al. 2015).
Census of India information regarding male and female literacy rates for the years 2001 and
2011 is used to capture social development across districts. District level household
electrification information from Census of India 2001 and 2011 is used to proxy
infrastructure improvements. We also use classification of the districts as Left-Wing
Effected (LWE) core and adjoining areas based on secondary information available from
www.indiastats.com. About one-fifth of the 284 districts are classified as left-wing
extremism affected (LWE) core or adjoining districts.
We also explore the role of availability of human resources in public health facilities,
particularly at district hospitals (DHs) and community health centres (CHCs) as this can
significantly influence service uptake by the community and also improve overall monitoring
and performance at the sub-district level. For this purpose, we use the human resources
information collected through DLHS 2012-13 public health facility surveys and generate a
district level human resource score which is defined as a sum of total number of specialists in
8
the DHs and CHCs of a given district. The information regarding availability of the
following specialists at the DH level and CHC level is considered: Obstetrician &
Gynaecologist, Paediatrician, Anaesthetist, Radiographer and availability of ultrasound
facility. The components are added to arrive at district level human resources score
(Cronbach’s alpha: 0.70).
We present statistical summaries of district-level progress in institutional delivery and full
immunization coverage. A simple difference-in-differences method is used to test whether
there is a statistically significant difference in average level of health care utilization levels
across the different types of districts. From this analysis, we seek to infer whether there have
been any reductions in the disparities over the years for districts classified on the basis of
sociodemographic composition of marginalized social groups. It is worthwhile to mention
that the change in outcomes for the comparison districts serves as the counterfactual here.
This analysis of change in levels of institutional delivery and full immunization coverage
across these districts is further complemented by adjusting for influence of other factors over
these health care indicators. For this purpose, we use random-effects multilevel regression
model to examine the association between share of vulnerable population subgroups and
district-level progress in health care utilization. The regression model also includes
interaction terms for time period and type of district to discern whether certain districts
performed exceptionally different from others.
Finally, we use the generalized ordered logit model to assess whether districts with higher
concentration of certain marginalized social groups are more likely to deviate from the
expected progress dynamics. For this purpose, following Figure 1, the districts are classified
into three ordered-categories: 1) LL districts, 2) HL or LH districts and 3) HH districts. LL
9
refers to districts with lower base level health achievement than average level across districts
and the progress in health achievement also being lower than average progress across
districts. HL refers to districts with base level health achievement above average level across
districts but progress in health achievement is noted to be below average progress across
districts. LH refers to districts with base level health achievements below the average level
across districts but progress in health achievement is found to be above average progress
across districts. HH refers to districts whose base level health achievement is higher than
average level across districts and progress in health achievement is also greater than average
progress across districts. Given the categories, the generalized ordered logit could be written
as follows (Williams, 2006):
P(Yi > 𝑗) = g(Xβj) =exp(αj + Xiβj)
1 + {exp(αj + Xiβj)}, j = 1, 2, … , K − 1
Where, Y is the dependent variable with K categories and X is the vector of explanatory
variables with coefficients βj. The generalized ordered logit essentially relaxes the parallel
lines constraint underlying the simple ordered logit model. More specifically, in a simple
ordered logit β values are same for all values of K categories of dependent variable (hence the
parallel lines assumption) whereas in the generalized ordered model the β’s are allowed to
vary across the K categories of dependent variable. The results are based on a partial
proportional odds model whereby we use a Wald test to check the parallel lines assumption
for variables (William, 2006; Long & Freese, 2014). Following (William, 2006), the results
are reported using gamma (γ) parameterization such that each of the explanatory variable has
one β coefficient (interpreted as the constant component of log odds ratio across cut-off
points) with γ coefficients (interpreted as the increment at the cut-off point) being reported
only for those explanatory variables that violate the parallel lines assumption.
10
Results
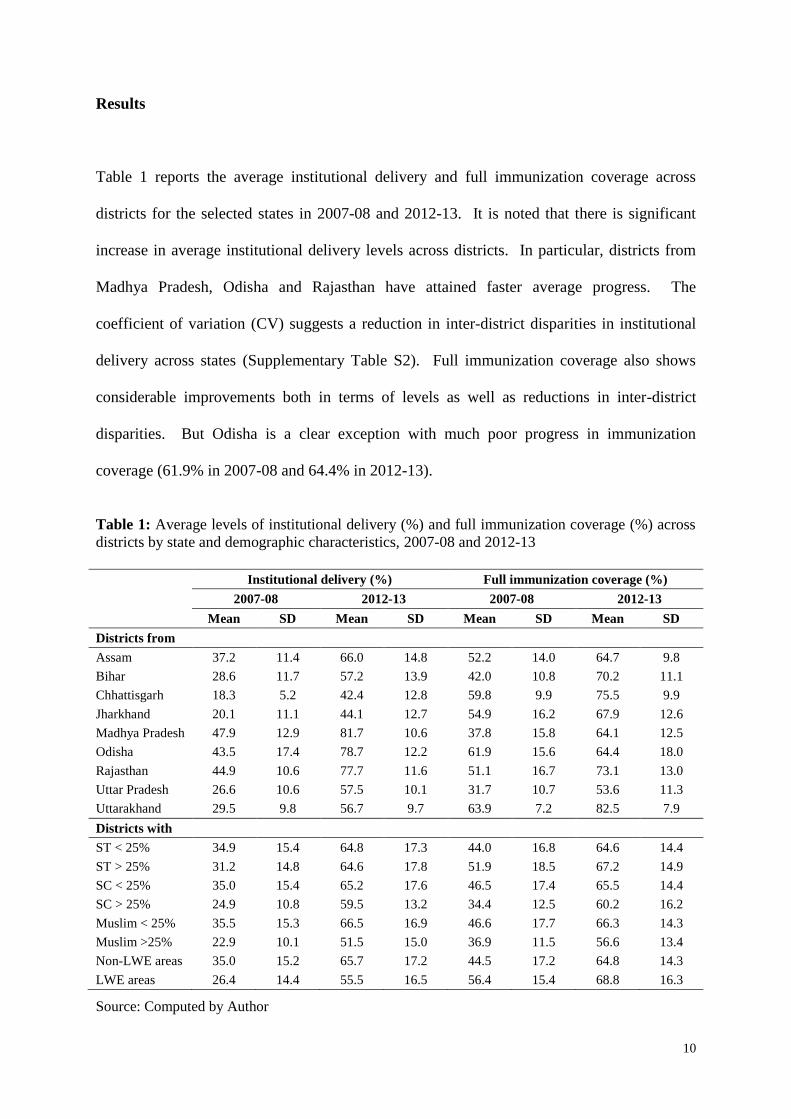
Table 1 reports the average institutional delivery and full immunization coverage across
districts for the selected states in 2007-08 and 2012-13. It is noted that there is significant
increase in average institutional delivery levels across districts. In particular, districts from
Madhya Pradesh, Odisha and Rajasthan have attained faster average progress. The
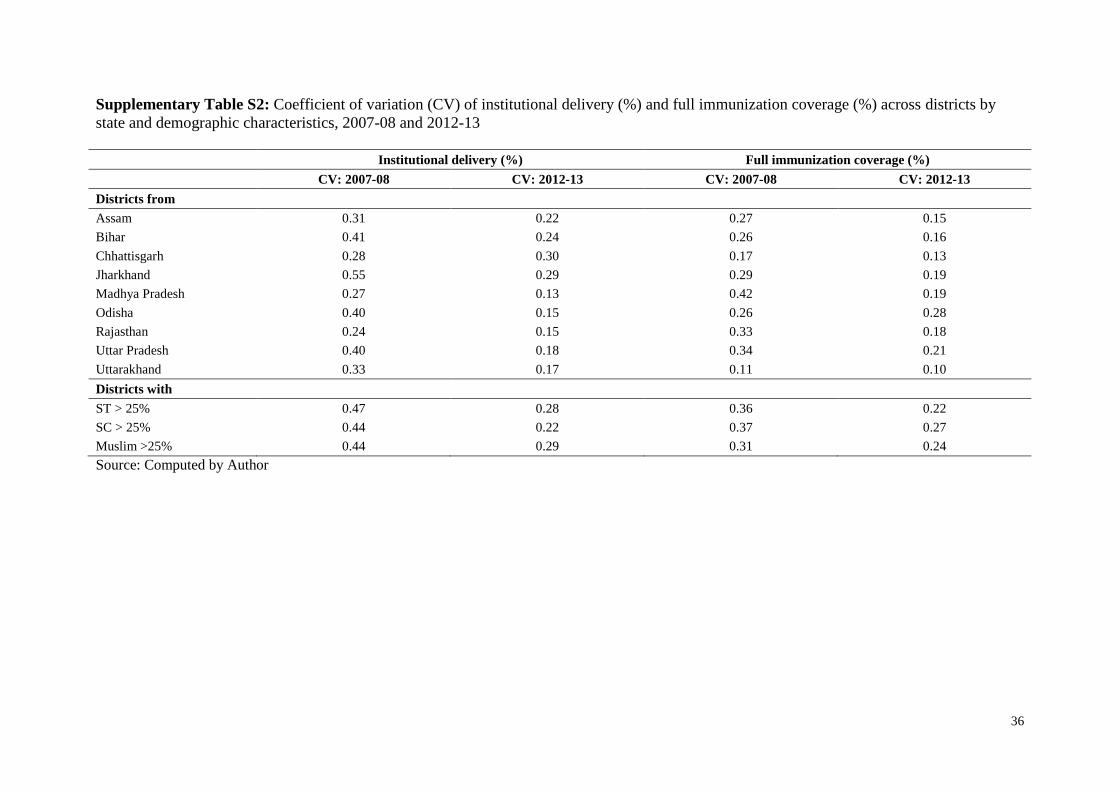
coefficient of variation (CV) suggests a reduction in inter-district disparities in institutional
delivery across states (Supplementary Table S2). Full immunization coverage also shows
considerable improvements both in terms of levels as well as reductions in inter-district
disparities. But Odisha is a clear exception with much poor progress in immunization
coverage (61.9% in 2007-08 and 64.4% in 2012-13).
Table 1: Average levels of institutional delivery (%) and full immunization coverage (%) across
districts by state and demographic characteristics, 2007-08 and 2012-13
Institutional delivery (%) Full immunization coverage (%)
2007-08 2012-13 2007-08 2012-13
Mean SD Mean SD Mean SD Mean SD
Districts from
Assam 37.2 11.4 66.0 14.8 52.2 14.0 64.7 9.8
Bihar 28.6 11.7 57.2 13.9 42.0 10.8 70.2 11.1
Chhattisgarh 18.3 5.2 42.4 12.8 59.8 9.9 75.5 9.9
Jharkhand 20.1 11.1 44.1 12.7 54.9 16.2 67.9 12.6
Madhya Pradesh 47.9 12.9 81.7 10.6 37.8 15.8 64.1 12.5
Odisha 43.5 17.4 78.7 12.2 61.9 15.6 64.4 18.0
Rajasthan 44.9 10.6 77.7 11.6 51.1 16.7 73.1 13.0
Uttar Pradesh 26.6 10.6 57.5 10.1 31.7 10.7 53.6 11.3
Uttarakhand 29.5 9.8 56.7 9.7 63.9 7.2 82.5 7.9
Districts with
ST < 25% 34.9 15.4 64.8 17.3 44.0 16.8 64.6 14.4
ST > 25% 31.2 14.8 64.6 17.8 51.9 18.5 67.2 14.9
SC < 25% 35.0 15.4 65.2 17.6 46.5 17.4 65.5 14.4
SC > 25% 24.9 10.8 59.5 13.2 34.4 12.5 60.2 16.2
Muslim < 25% 35.5 15.3 66.5 16.9 46.6 17.7 66.3 14.3
Muslim >25% 22.9 10.1 51.5 15.0 36.9 11.5 56.6 13.4
Non-LWE areas 35.0 15.2 65.7 17.2 44.5 17.2 64.8 14.3
LWE areas 26.4 14.4 55.5 16.5 56.4 15.4 68.8 16.3
Source: Computed by Author
11
Table 1 also reports similar information for districts classified on the basis of social
demographic composition with specific focus on districts having greater share of
marginalized population subgroups (ST, SC and Muslim). Although, there have been
improvements in levels of institutional delivery and immunization coverage across all
districts but districts with higher shares of Muslim population display lower average health
achievement.
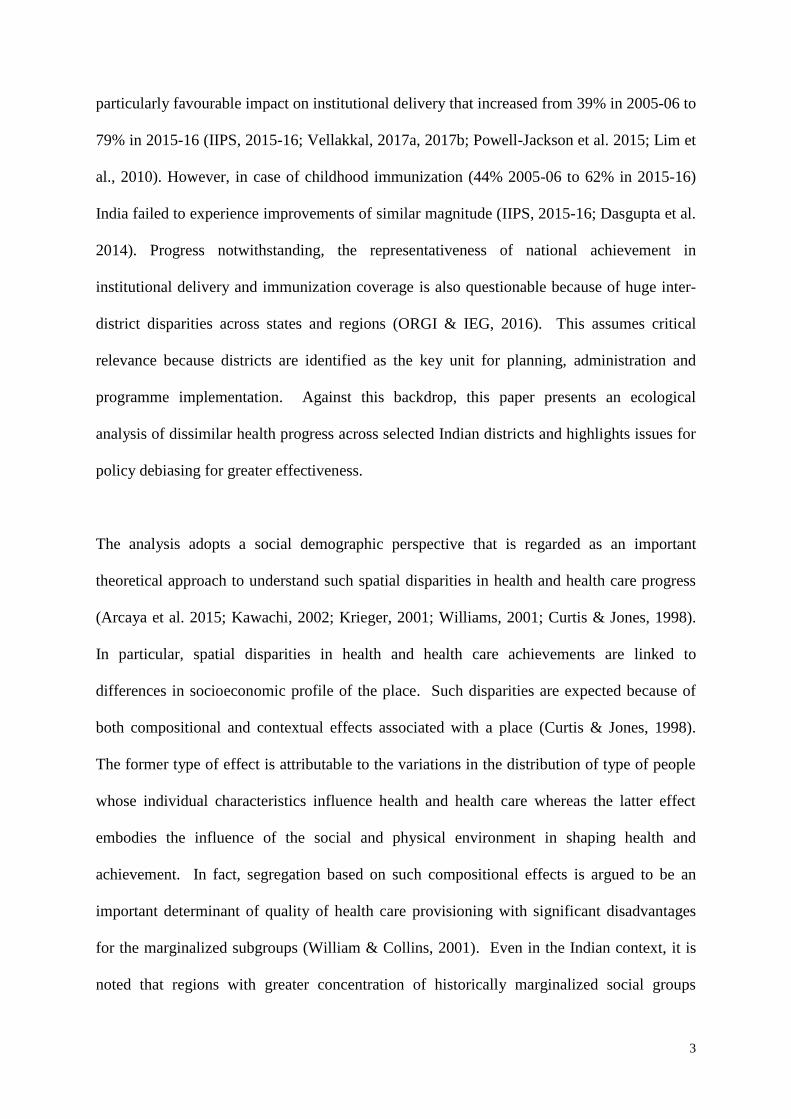
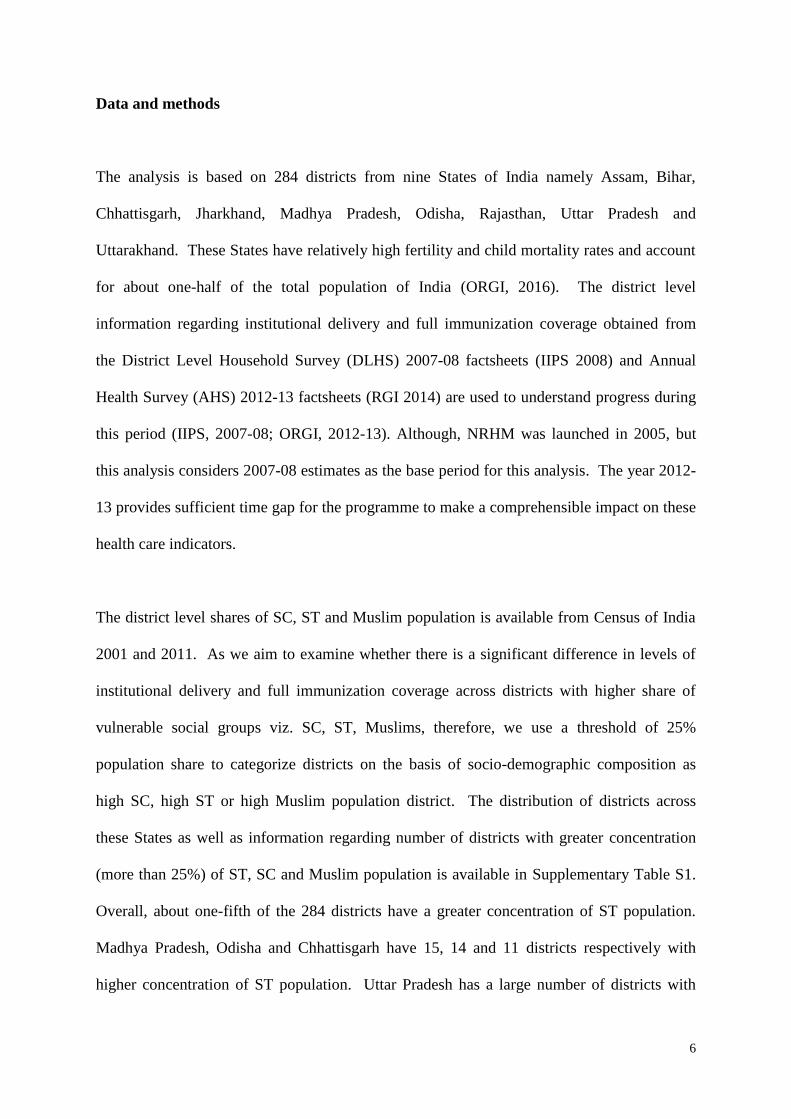
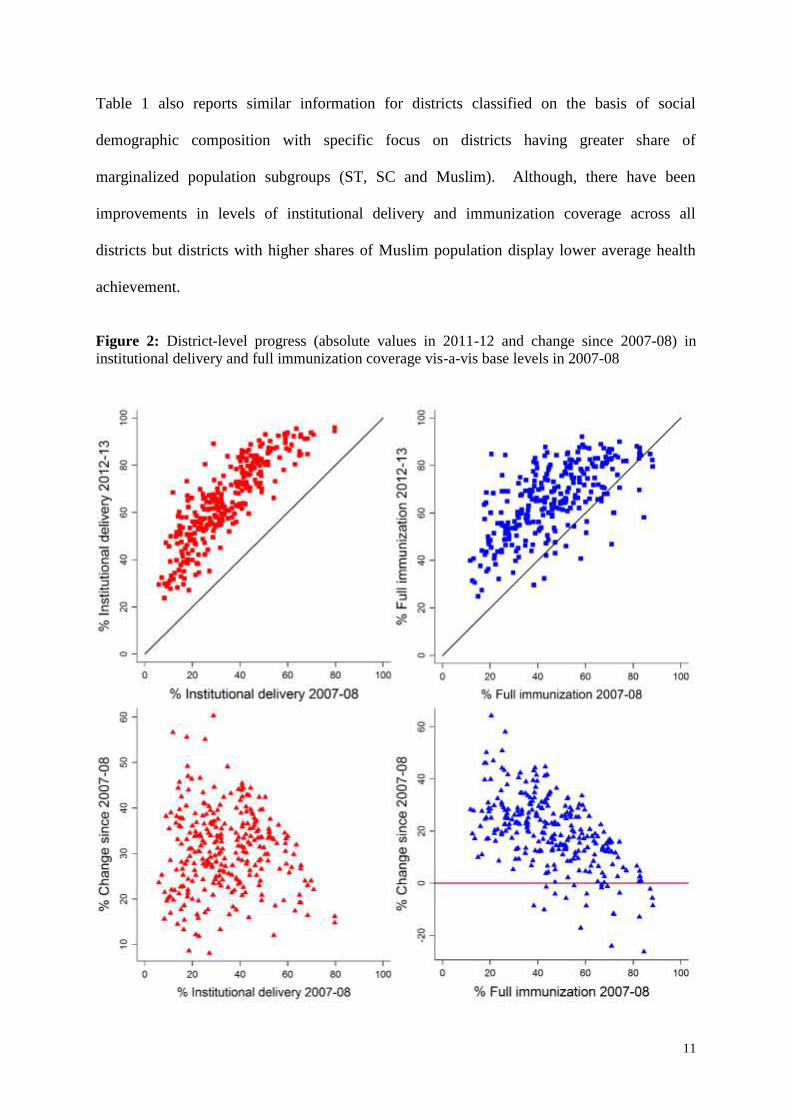
Figure 2: District-level progress (absolute values in 2011-12 and change since 2007-08) in
institutional delivery and full immunization coverage vis-a-vis base levels in 2007-08
12
Figure 2 depicts the association between base-level (2007-08) averages and progress in
institutional delivery and immunization coverage across districts. In the top panel, x-axis
plots the base level of the indicator, y-axis plots the coverage reported in 2012-13 and the
diagonal represents the line of no change. In case of institutional delivery all the districts are
found above the diagonal indicating that all the districts registered a positive change in
institutional delivery. However, in case of immunization there are a number of districts
where the coverage has shrunk between 2007-08 and 2012-13. The bottom panel in Figure 2
presents a comparison of district-level progress vis-à-vis base level of the indicator. In case
of immunization coverage, it is noted that most of the districts with very low or negative
progress had higher base levels. But greater variations are observed in case of progress in
institutional delivery. In particular, despite lower base levels, a large number of districts
were unable to achieve greater progress in institutional delivery.
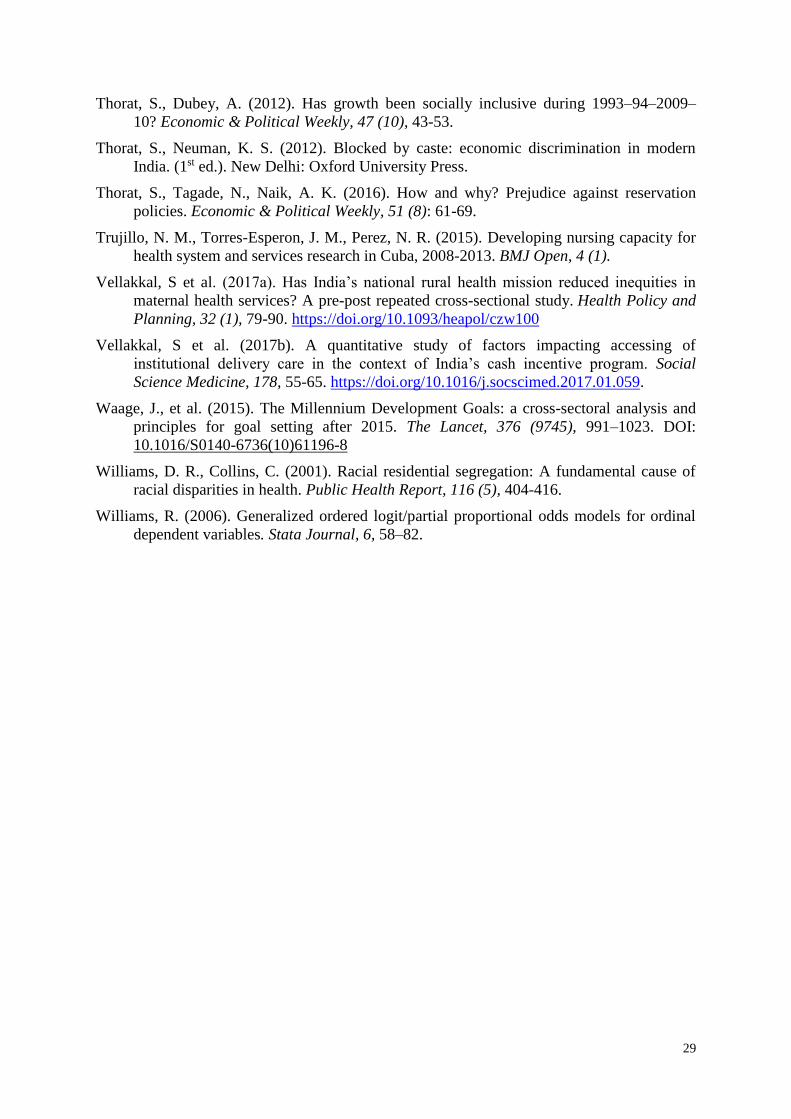
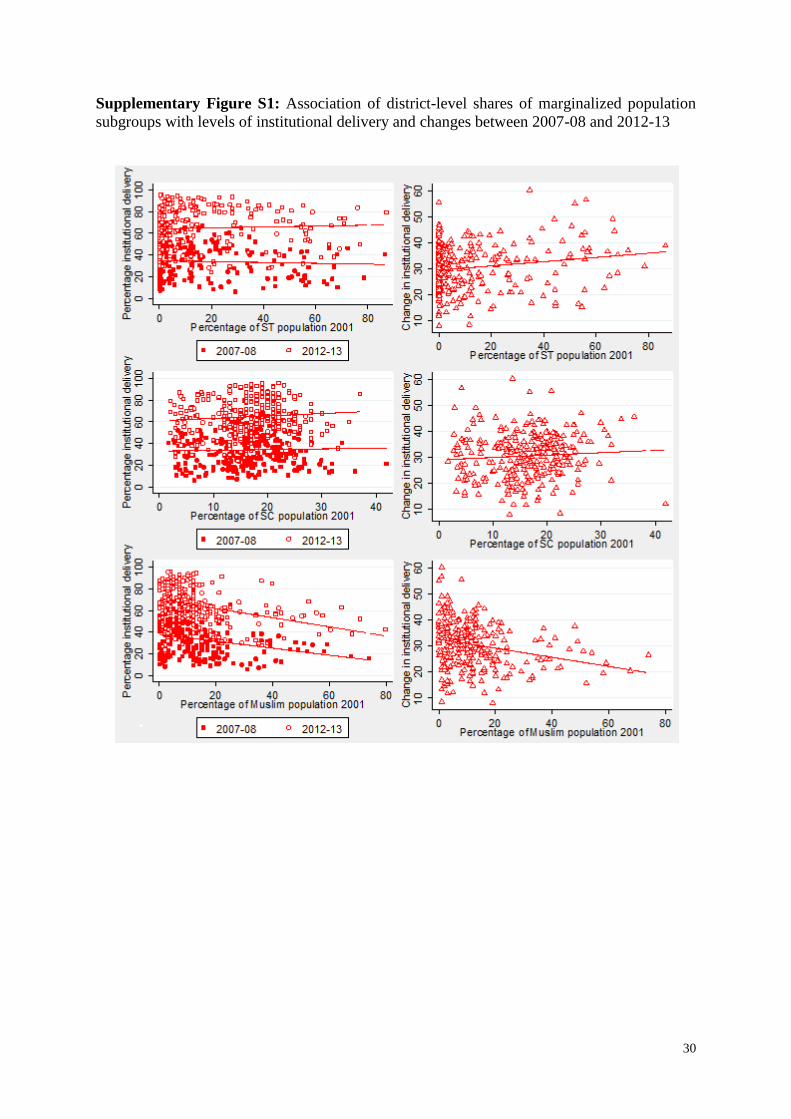
Supplementary Figures S1 and S2 explore the association between share of marginalized
population and levels of institutional delivery and immunization coverage, respectively,
across districts for both periods. It is observed that the levels of institutional delivery across
districts do not share any significant association with proportion of SC or ST population. But
districts with higher concentration of Muslim population display lower levels of institutional
delivery. Moreover, the patterns have remained unchanged between 2007-08 and 2012-13.
In case of full immunization coverage, it is observed that districts with higher proportion of
ST population have higher immunization levels whereas districts with higher SC or Muslim
population have lower immunization coverage.
But between 2007-08 and 2012-13, progress has been slower in districts with higher ST
population whereas greater absolute progress is noted in districts with higher SC population.
13
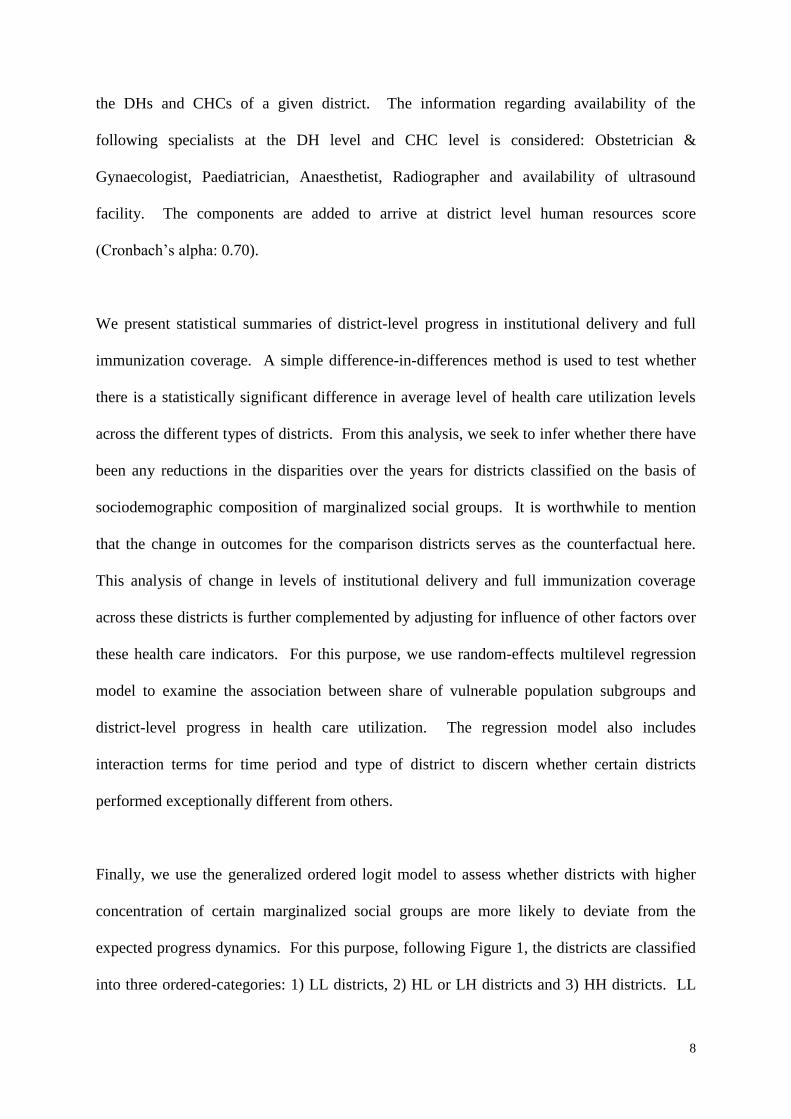
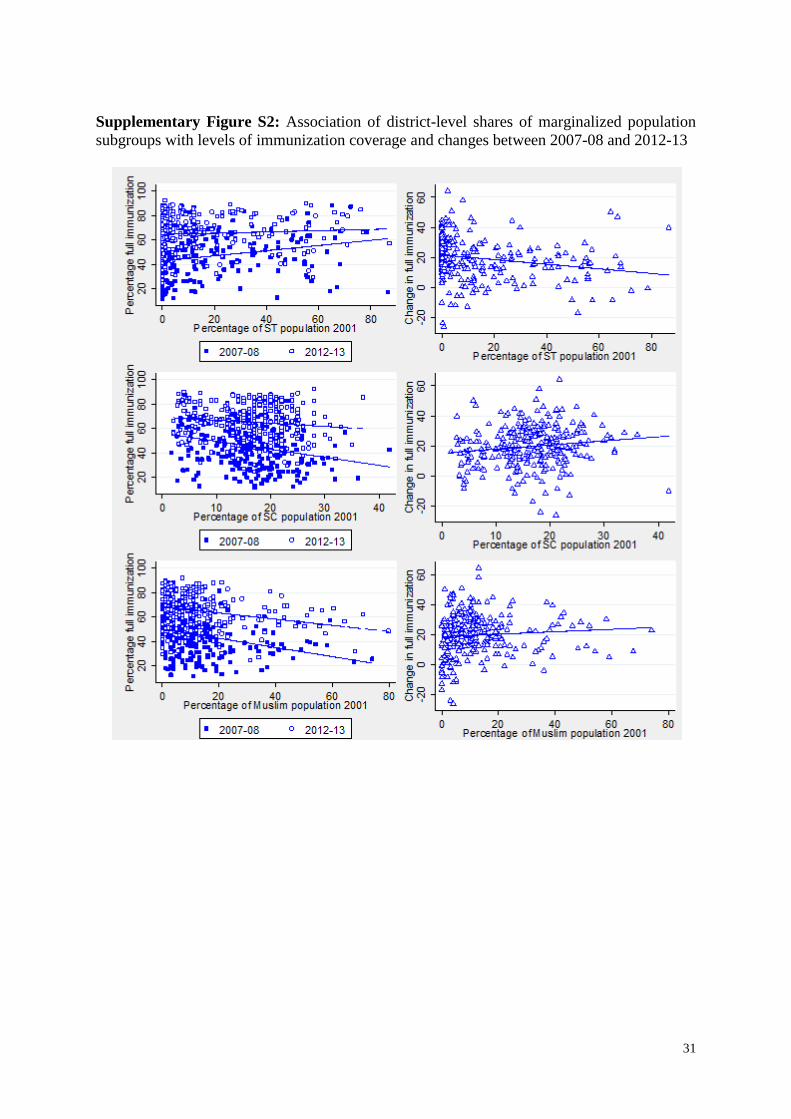
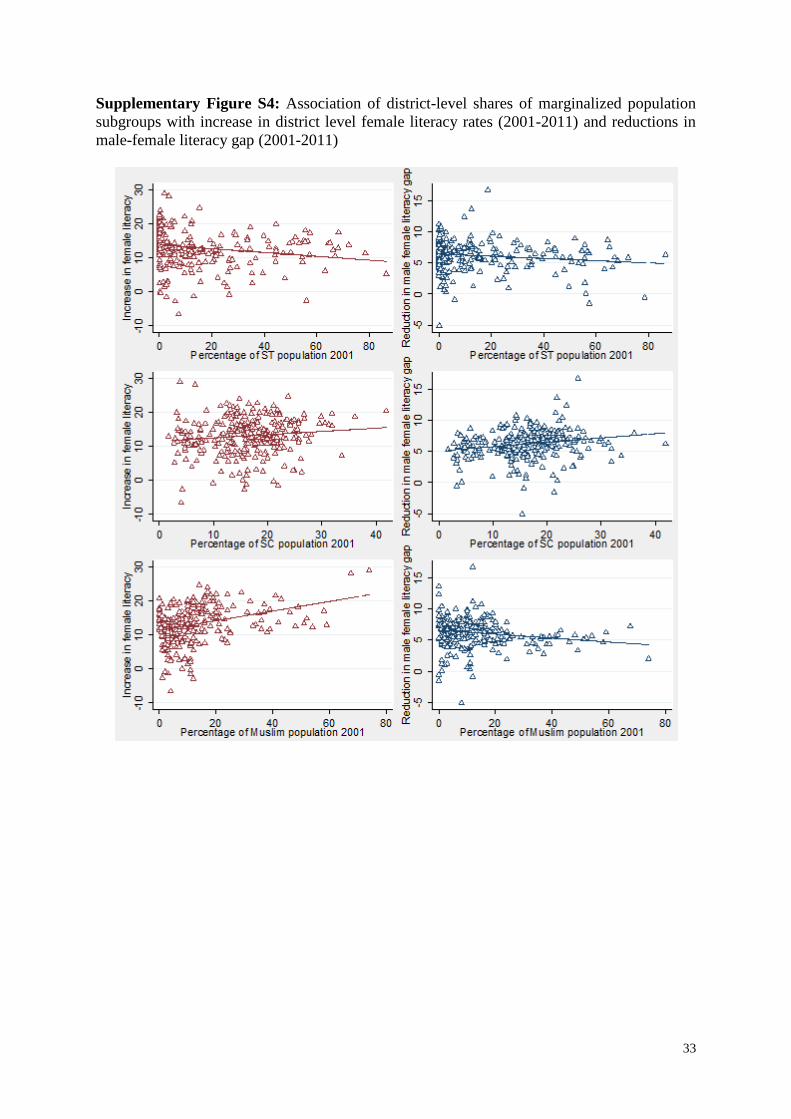
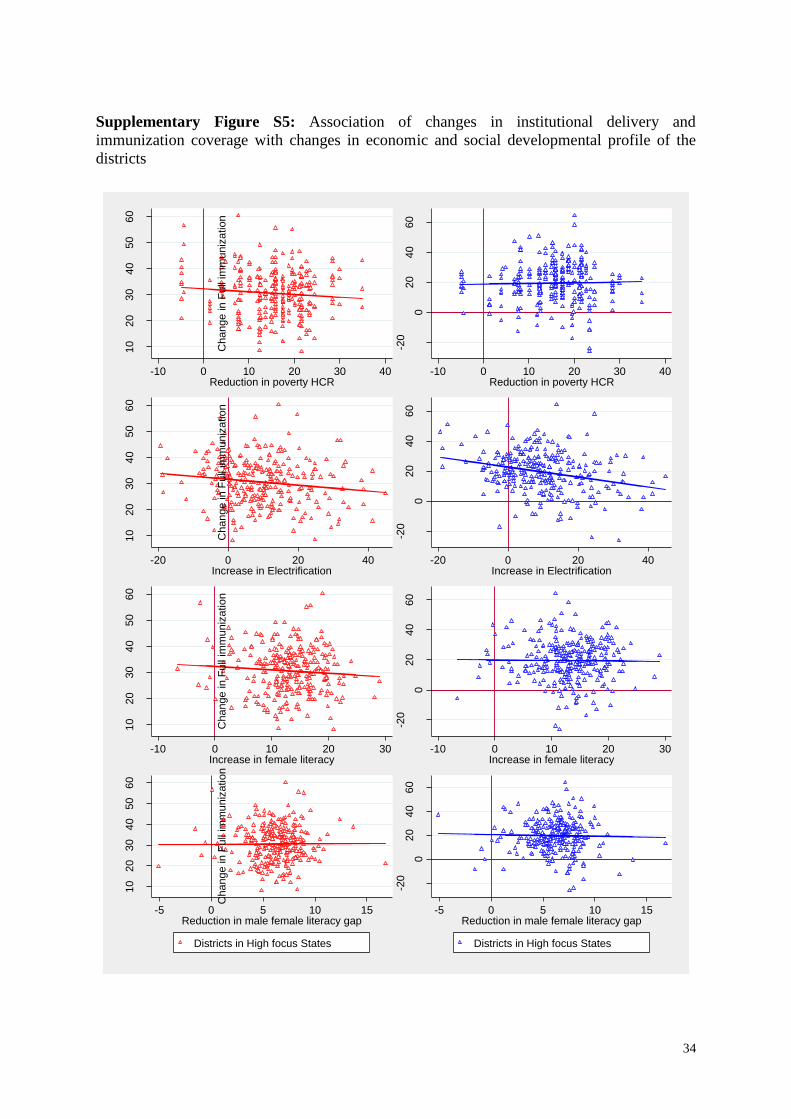
Associations between social demographic profile and developmental indicator are further
explored in Supplementary Figures S3 and S4 (poverty headcount ratio and female literacy,
respectively). But as shown in Supplementary Figure S5, there is not much influence of
district level change in these developmental variables on change in institutional delivery or
immunization coverage.
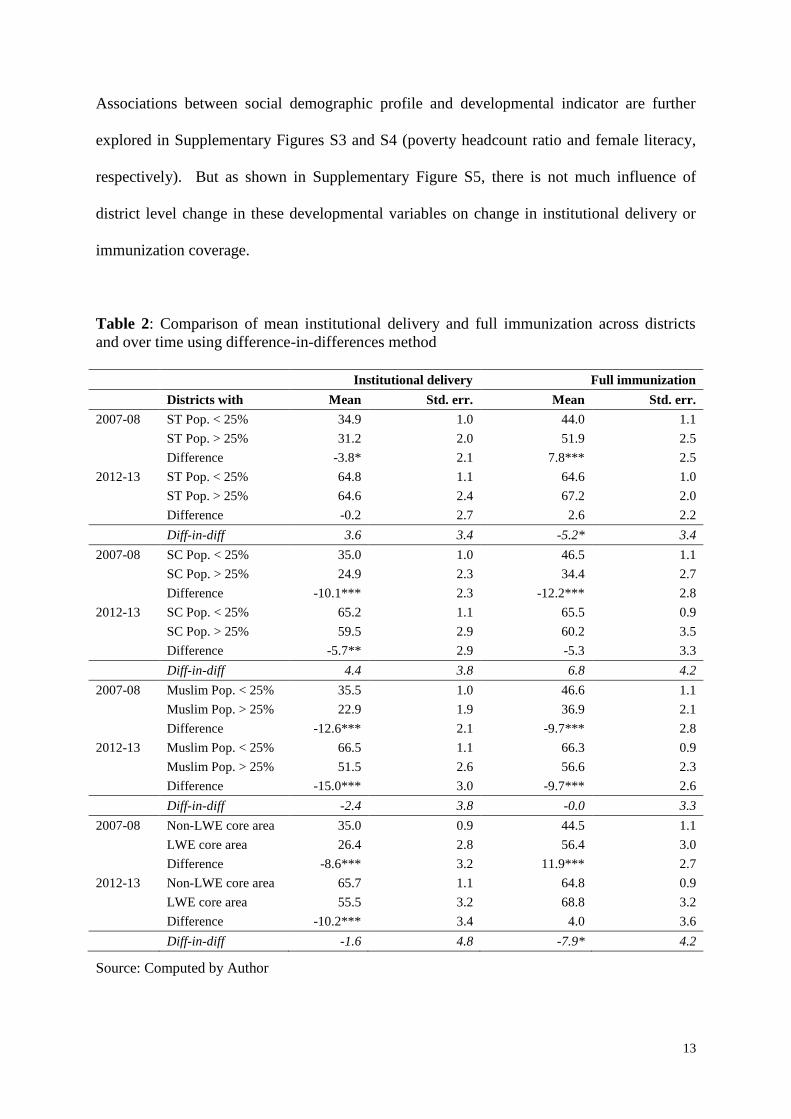
Table 2: Comparison of mean institutional delivery and full immunization across districts
and over time using difference-in-differences method
Institutional delivery Full immunization
Districts with Mean Std. err. Mean Std. err.
2007-08 ST Pop. < 25% 34.9 1.0 44.0 1.1
ST Pop. > 25% 31.2 2.0 51.9 2.5
Difference -3.8* 2.1 7.8*** 2.5
2012-13 ST Pop. < 25% 64.8 1.1 64.6 1.0
ST Pop. > 25% 64.6 2.4 67.2 2.0
Difference -0.2 2.7 2.6 2.2
Diff-in-diff 3.6 3.4 -5.2* 3.4
2007-08 SC Pop. < 25% 35.0 1.0 46.5 1.1
SC Pop. > 25% 24.9 2.3 34.4 2.7
Difference -10.1*** 2.3 -12.2*** 2.8
2012-13 SC Pop. < 25% 65.2 1.1 65.5 0.9
SC Pop. > 25% 59.5 2.9 60.2 3.5
Difference -5.7** 2.9 -5.3 3.3
Diff-in-diff 4.4 3.8 6.8 4.2
2007-08 Muslim Pop. < 25% 35.5 1.0 46.6 1.1
Muslim Pop. > 25% 22.9 1.9 36.9 2.1
Difference -12.6*** 2.1 -9.7*** 2.8
2012-13 Muslim Pop. < 25% 66.5 1.1 66.3 0.9
Muslim Pop. > 25% 51.5 2.6 56.6 2.3
Difference -15.0*** 3.0 -9.7*** 2.6
Diff-in-diff -2.4 3.8 -0.0 3.3
2007-08 Non-LWE core area 35.0 0.9 44.5 1.1
LWE core area 26.4 2.8 56.4 3.0
Difference -8.6*** 3.2 11.9*** 2.7
2012-13 Non-LWE core area 65.7 1.1 64.8 0.9
LWE core area 55.5 3.2 68.8 3.2
Difference -10.2*** 3.4 4.0 3.6
Diff-in-diff -1.6 4.8 -7.9* 4.2
Source: Computed by Author
14
A simple difference-in-differences approach is used to examine whether there has been a
significant increase in the mean levels of institutional delivery and immunization coverage
across districts segregated on the basis of demographic composition (Table 2). In 2007-08
there was a significant difference (p<0.1) in institutional delivery levels of districts with low
(34.9%) or high (31.2%) ST population but this difference has disappeared in 2012-13. We
observe a significant difference in average institutional delivery across districts with low or
high SC population in both the years. In 2007-08 the difference in averages was about 10.1%
(p<0.01) whereas it has reduced to 5.7% (p<0.05) in 2012-13. However, the insignificant
difference-in-differences statistic suggests that there is still considerable gap between districts
with high and low share of SC population. It is also noted that the difference in average
institutional delivery across district with high and low share of Muslim population has
increased from 12.6% (p<0.01) in 2007-08 to 15.0% (p<0.01) in 2012-13. The LWE core
districts also show lower averages than those non-LWE districts in both the years.
In case immunization coverage, in 2007-08 there was a significant average gap of 7.8%
(p<0.01) among districts with higher and lower share of ST population but it has disappeared
because of greater improvements in districts with lower ST population. A significant
difference-in-differences statistic of 5.2 (p<0.1) confirms the reduction. Similar reduction
across districts with high and low SC population is observed but the effect is statistically
insignificant. However, there is no evidence of diminishing gap (9.7% in both periods)
between districts with higher and lower shares of Muslim population. Nevertheless, there has
been a significant bridging of differences in immunization coverage between LWE affected
and non-LWE districts partly because of slow improvements in LWE affected districts.
15
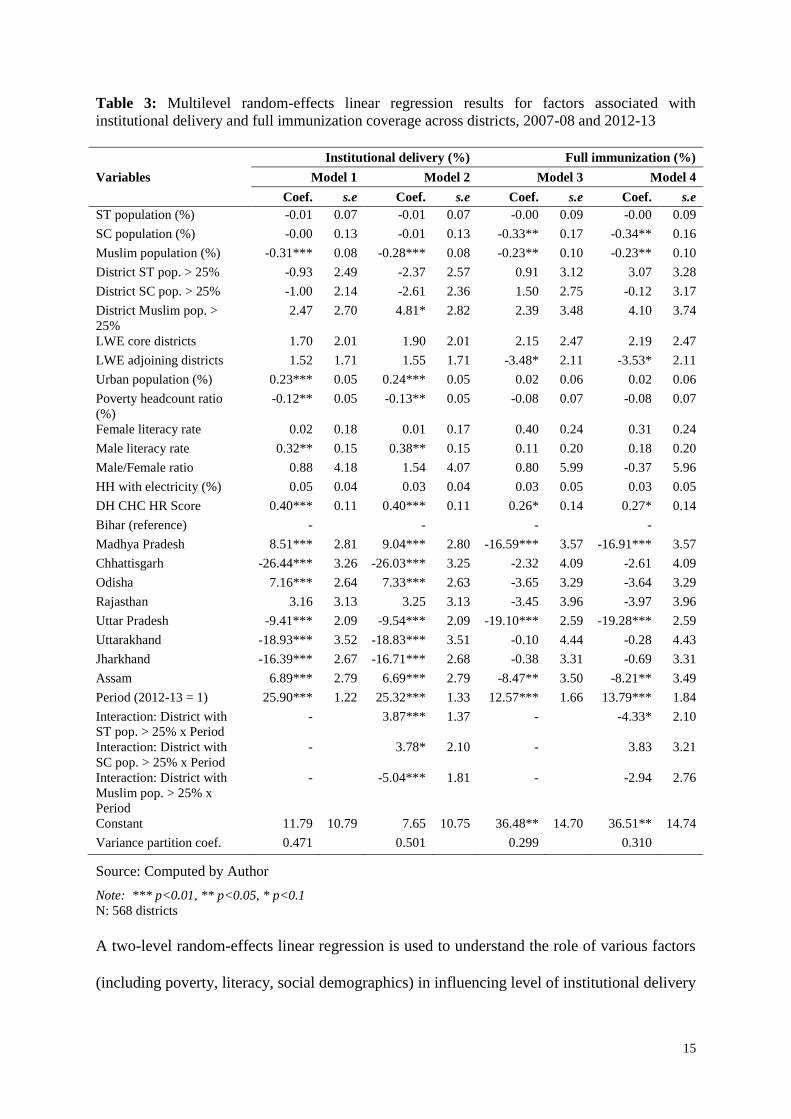
Table 3: Multilevel random-effects linear regression results for factors associated with
institutional delivery and full immunization coverage across districts, 2007-08 and 2012-13
Variables
Institutional delivery (%) Full immunization (%)
Model 1 Model 2 Model 3 Model 4
Coef. s.e Coef. s.e Coef. s.e Coef. s.e
ST population (%) -0.01 0.07 -0.01 0.07 -0.00 0.09 -0.00 0.09
SC population (%) -0.00 0.13 -0.01 0.13 -0.33** 0.17 -0.34** 0.16
Muslim population (%) -0.31*** 0.08 -0.28*** 0.08 -0.23** 0.10 -0.23** 0.10
District ST pop. > 25% -0.93 2.49 -2.37 2.57 0.91 3.12 3.07 3.28
District SC pop. > 25% -1.00 2.14 -2.61 2.36 1.50 2.75 -0.12 3.17
District Muslim pop. >
25%
2.47 2.70 4.81* 2.82 2.39 3.48 4.10 3.74
LWE core districts 1.70 2.01 1.90 2.01 2.15 2.47 2.19 2.47
LWE adjoining districts 1.52 1.71 1.55 1.71 -3.48* 2.11 -3.53* 2.11
Urban population (%) 0.23*** 0.05 0.24*** 0.05 0.02 0.06 0.02 0.06
Poverty headcount ratio
(%)
-0.12** 0.05 -0.13** 0.05 -0.08 0.07 -0.08 0.07
Female literacy rate 0.02 0.18 0.01 0.17 0.40 0.24 0.31 0.24
Male literacy rate 0.32** 0.15 0.38** 0.15 0.11 0.20 0.18 0.20
Male/Female ratio 0.88 4.18 1.54 4.07 0.80 5.99 -0.37 5.96
HH with electricity (%) 0.05 0.04 0.03 0.04 0.03 0.05 0.03 0.05
DH CHC HR Score 0.40*** 0.11 0.40*** 0.11 0.26* 0.14 0.27* 0.14
Bihar (reference) - - - -
Madhya Pradesh 8.51*** 2.81 9.04*** 2.80 -16.59*** 3.57 -16.91*** 3.57
Chhattisgarh -26.44*** 3.26 -26.03*** 3.25 -2.32 4.09 -2.61 4.09
Odisha 7.16*** 2.64 7.33*** 2.63 -3.65 3.29 -3.64 3.29
Rajasthan 3.16 3.13 3.25 3.13 -3.45 3.96 -3.97 3.96
Uttar Pradesh -9.41*** 2.09 -9.54*** 2.09 -19.10*** 2.59 -19.28*** 2.59
Uttarakhand -18.93*** 3.52 -18.83*** 3.51 -0.10 4.44 -0.28 4.43
Jharkhand -16.39*** 2.67 -16.71*** 2.68 -0.38 3.31 -0.69 3.31
Assam 6.89*** 2.79 6.69*** 2.79 -8.47** 3.50 -8.21** 3.49
Period (2012-13 = 1) 25.90*** 1.22 25.32*** 1.33 12.57*** 1.66 13.79*** 1.84
Interaction: District with
ST pop. > 25% x Period
- 3.87*** 1.37 - -4.33* 2.10
Interaction: District with
SC pop. > 25% x Period
- 3.78* 2.10 - 3.83 3.21
Interaction: District with
Muslim pop. > 25% x
Period
- -5.04*** 1.81 - -2.94 2.76
Constant 11.79 10.79 7.65 10.75 36.48** 14.70 36.51** 14.74
Variance partition coef. 0.471 0.501 0.299 0.310
Source: Computed by Author
Note: *** p<0.01, ** p<0.05, * p<0.1 N: 568 districts
A two-level random-effects linear regression is used to understand the role of various factors
(including poverty, literacy, social demographics) in influencing level of institutional delivery
16
and immunization coverage across districts. Specifically, two separate models are used for
each of the dependent variables whereby the second model also estimates an interaction
effect between year and district social demographics to discern whether there was a
differential impact across these districts. A period dummy variable is included to comment on
the potential influence of NRHM between 2007-08 and 2012-13. The model accounts for
clustering at the district-level. The regression results are presented in Table 3. A positive
and significant coefficient of the period dummy indicates that NRHM can be attributed with
significant increase (about 25.0%, p < 0.01) in the level of institutional delivery across
districts. A favourable impact (about 13.0%, p < 0.01) is also noted in case of immunization
coverage though the magnitude of the coefficient is smaller than institutional delivery.
Compared to others, districts with higher Muslim population display significantly lower
institutional delivery and immunization coverage. In fact, 1% increase in share of Muslim
population is associated with about 0.3% (p < 0.01) and 0.2% (p < 0.05) lower levels of
institutional delivery and immunization coverage, respectively. No such association can be
noted for ST population but a similar disadvantage is noted for SC population, particularly in
immunization coverage.
The interaction term for time period and districts with higher shares of marginalized
population reveals that, post 2007-08, districts with higher ST population have registered
significant increment (3.9%, p < 0.01) in institutional delivery but these districts also
registered a significant decline in immunization coverage (4.3%, p < 0.1). Districts with
higher proportion of SC population also experienced significant increment (3.8%, p < 0.1) in
institutional delivery post NRHM but no such gains are noted in immunization coverage. But
districts with higher Muslim population registered slower progress (5.0%, p < 0.01) in
institutional delivery post 2007-08 and also failed to experience any significant gains in
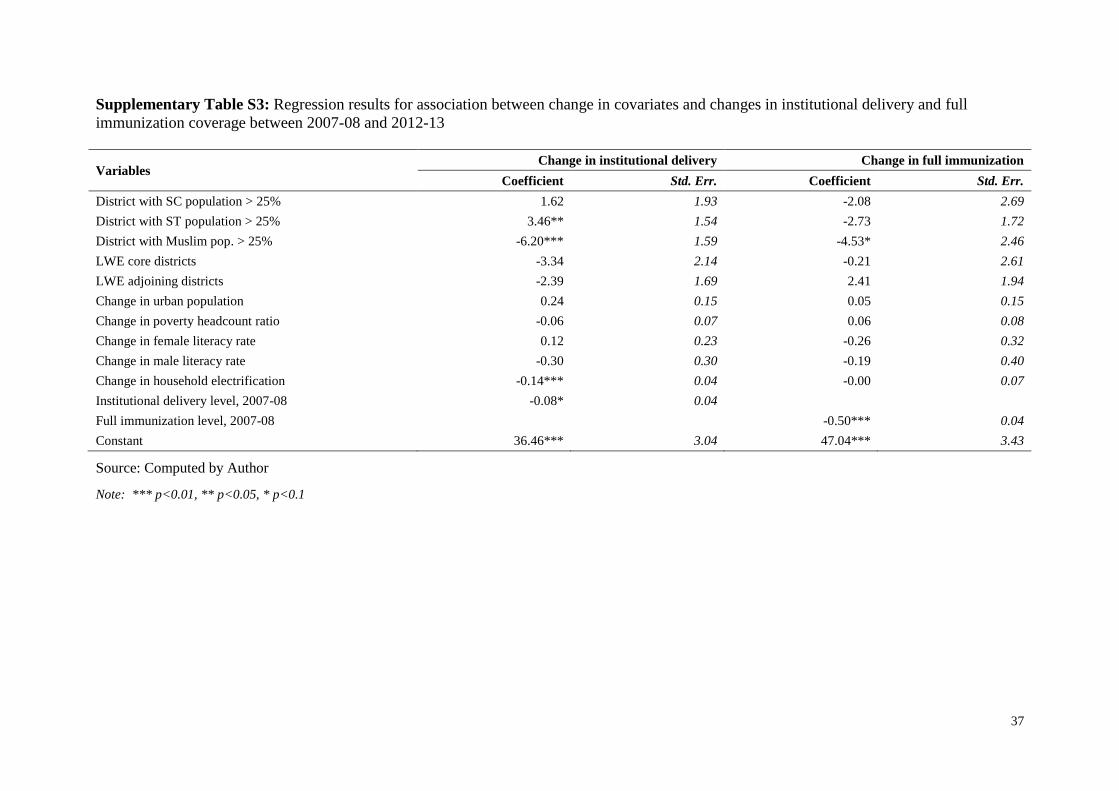
immunization coverage. In fact, additional regressions suggest that change in levels of
17
institutional delivery and immunization coverage is also slower in districts with higher share
of Muslim population (Supplementary Table S3).
Among other variables, better availability of human resources at the CHCs and the DHs had a
favourable impact on district level institutional delivery (0.4%, p < 0.01) and immunization
coverage (0.3%, p < 0.1). Higher urban population had a positive influence (0.2%, p < 0.01)
on institutional delivery but no such impact is observed on immunization coverage.
Similarly, districts with higher poverty headcount ratio were likely to have lower institutional
delivery levels. Interestingly, female literacy rates had no significant impact on levels of
institutional delivery or immunization coverage though districts with higher male literacy
showed higher levels of institutional delivery. Average district level outcomes varied
considerably across states with Madhya Pradesh, Odisha and Assam recording much better
levels of institutional delivery than Bihar most of the states performed poorly in
immunization coverage during this period.
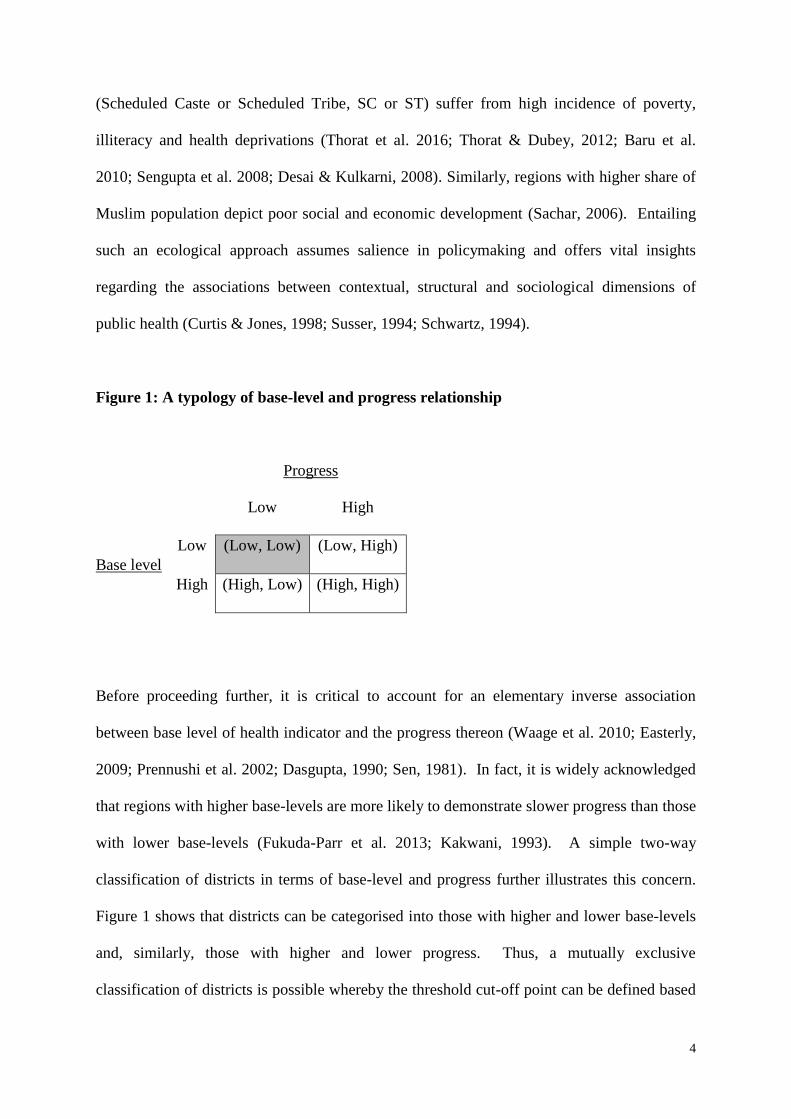
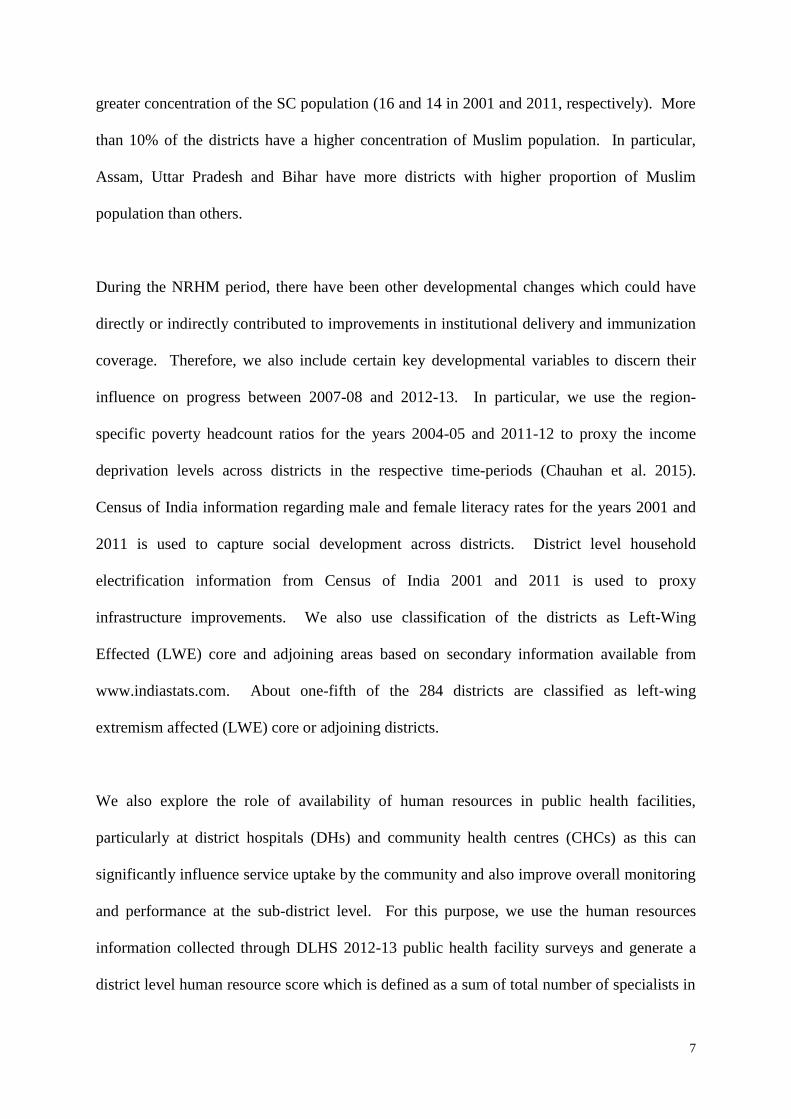
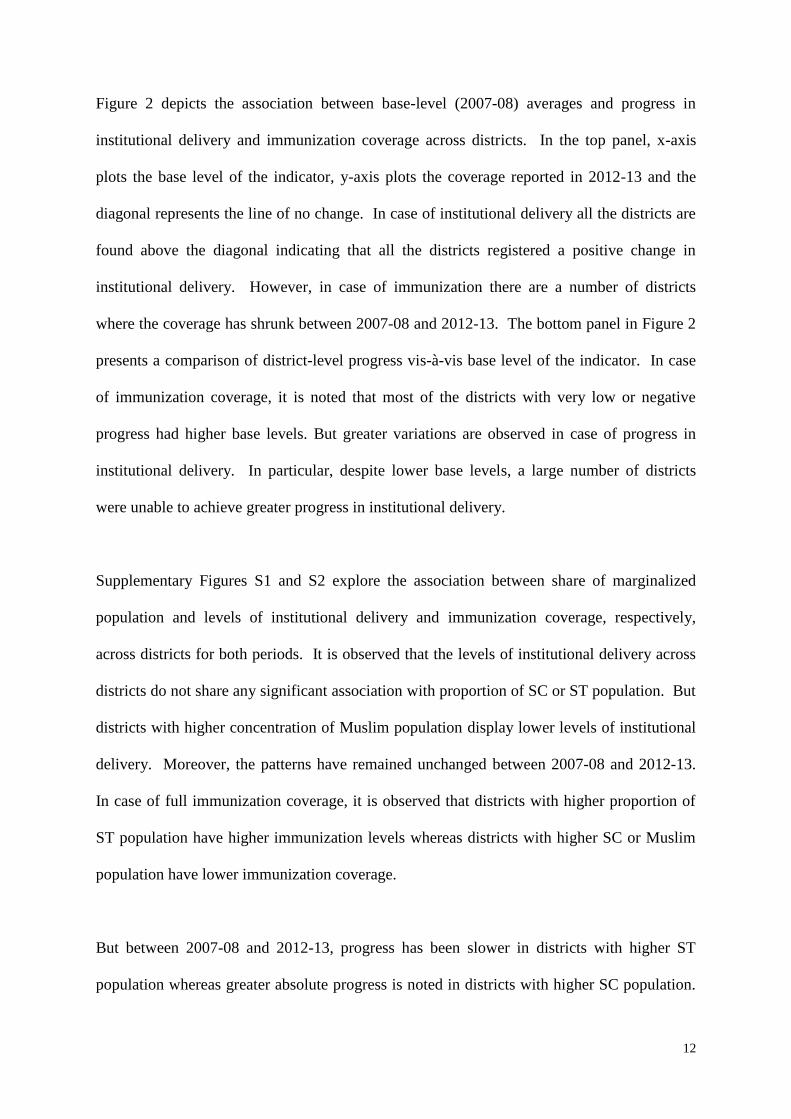
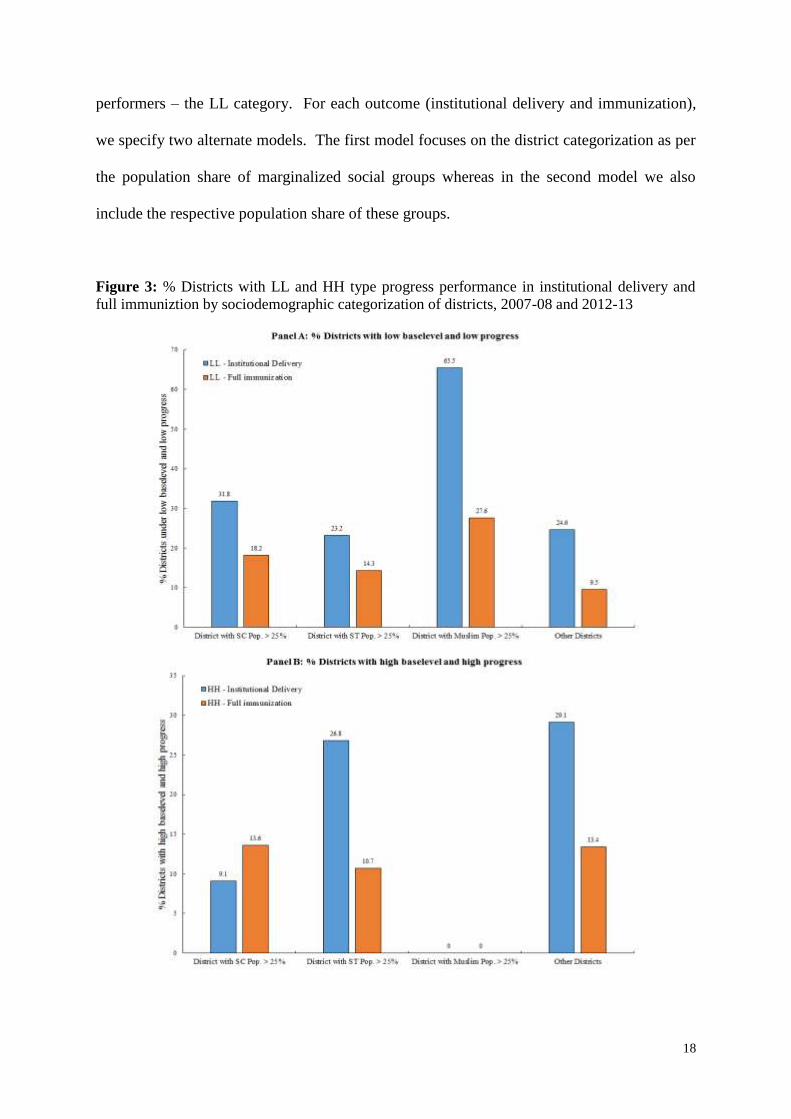
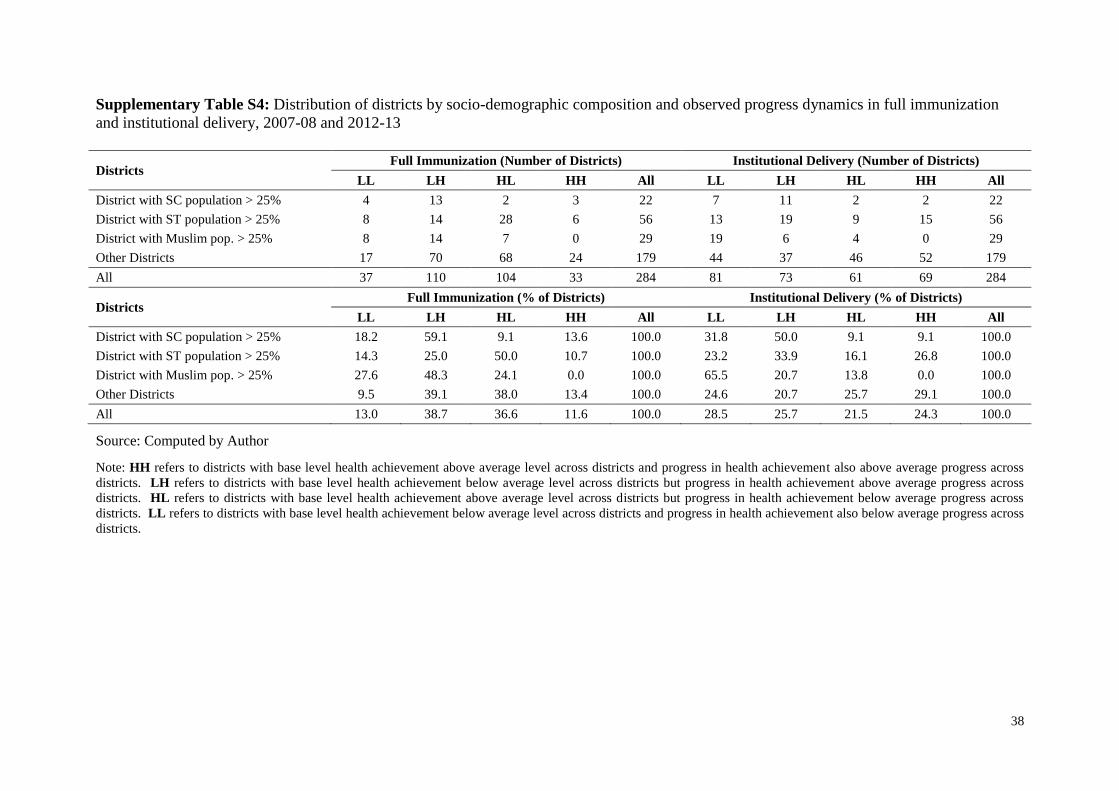
Finally, we examine the socio-demographic features of districts that have deviated from the
expected progress dynamics. Supplementary Table S4 reports the distribution of districts
categorised based on the sociodemographic composition and typology presented in Figure 1.
Specifically, we present the relative share of districts from each socio-demographic
composition and observe that districts with higher share (> 25% population) of Muslim
population are more likely to have poor progress despite having lower base levels (LL
category). In fact, it is apparent that none of districts with higher share of Muslim population
have higher base levels and higher progress - the HH category. For further insights, a
generalized ordered logit model is employed that adjusts for key developmental indicators
while assessing the socio-demographic particulars of districts that are more likely to be poor
18
performers – the LL category. For each outcome (institutional delivery and immunization),
we specify two alternate models. The first model focuses on the district categorization as per
the population share of marginalized social groups whereas in the second model we also
include the respective population share of these groups.
Figure 3: % Districts with LL and HH type progress performance in institutional delivery and
full immuniztion by sociodemographic categorization of districts, 2007-08 and 2012-13
19
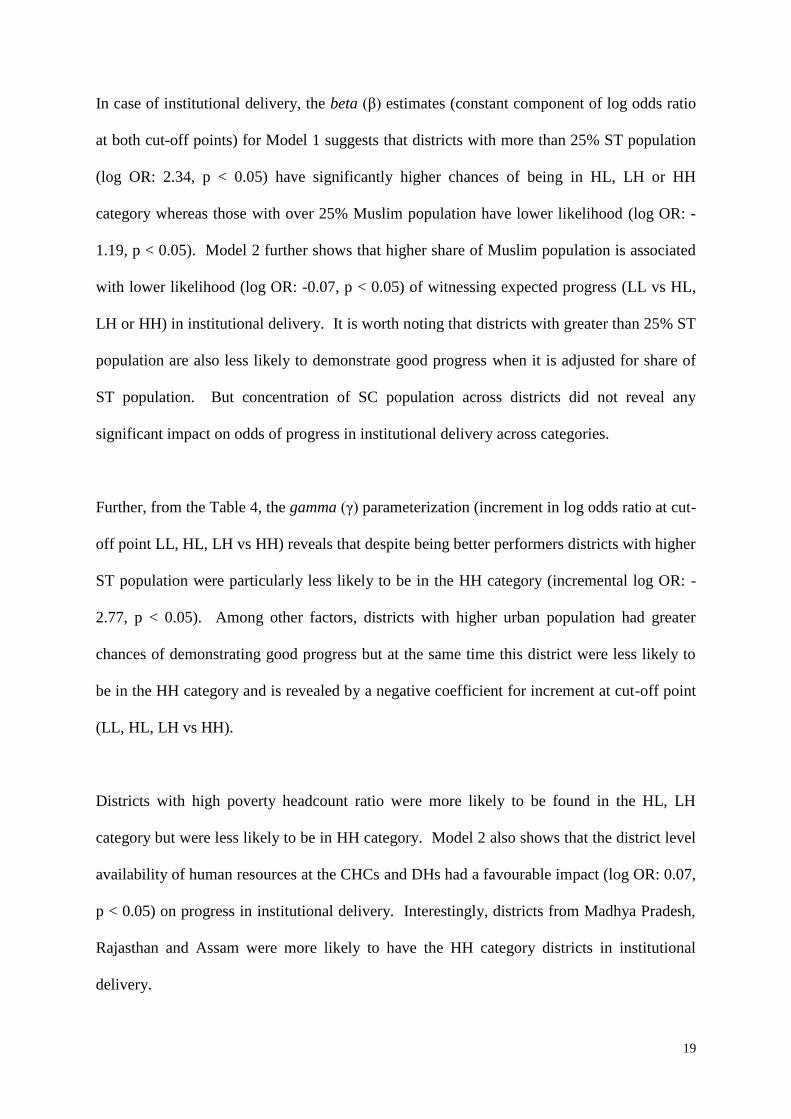
In case of institutional delivery, the beta (β) estimates (constant component of log odds ratio
at both cut-off points) for Model 1 suggests that districts with more than 25% ST population
(log OR: 2.34, p < 0.05) have significantly higher chances of being in HL, LH or HH
category whereas those with over 25% Muslim population have lower likelihood (log OR: -
1.19, p < 0.05). Model 2 further shows that higher share of Muslim population is associated
with lower likelihood (log OR: -0.07, p < 0.05) of witnessing expected progress (LL vs HL,
LH or HH) in institutional delivery. It is worth noting that districts with greater than 25% ST
population are also less likely to demonstrate good progress when it is adjusted for share of
ST population. But concentration of SC population across districts did not reveal any
significant impact on odds of progress in institutional delivery across categories.
Further, from the Table 4, the gamma (γ) parameterization (increment in log odds ratio at cut-
off point LL, HL, LH vs HH) reveals that despite being better performers districts with higher
ST population were particularly less likely to be in the HH category (incremental log OR: -
2.77, p < 0.05). Among other factors, districts with higher urban population had greater
chances of demonstrating good progress but at the same time this district were less likely to
be in the HH category and is revealed by a negative coefficient for increment at cut-off point
(LL, HL, LH vs HH).
Districts with high poverty headcount ratio were more likely to be found in the HL, LH
category but were less likely to be in HH category. Model 2 also shows that the district level
availability of human resources at the CHCs and DHs had a favourable impact (log OR: 0.07,
p < 0.05) on progress in institutional delivery. Interestingly, districts from Madhya Pradesh,
Rajasthan and Assam were more likely to have the HH category districts in institutional
delivery.
20
Table 4: Log odds ratios for generalized ordered logit model for progress in institutional delivery
and immunization coverage across nine states, India 2007-08 and 2012-13
Variables
Institutional delivery Full immunization
Model 1 Model 2 Model 3 Model 4
Coef. s.e Coef. s.e Coef. s.e Coef. s.e
Beta: Constant component of ln(OR) across cut-off points (HH, HL, LH vs LL) for all variables
District with ST Pop. > 25% 2.34** 1.06 -1.67** 0.84 -0.04 0.50 0.46 0.84
District with SC Pop. > 25% -0.03 0.57 0.27 0.69 0.53 0.58 1.06 0.78
Dist. with Muslim Pop. > 25% -1.19** 0.54 0.26 0.95 -0.88 0.54 0.23 0.93
Scheduled tribe Pop. (%) -
0.13*** 0.03 -
-0.03 0.02
Scheduled caste Pop. (%) -
-0.01 0.04 -
-0.06 0.05
Muslim Pop. (%) -
-0.07** 0.03 -
-0.06* 0.03
Urban Pop. (%) 0.05** 0.02 0.06*** 0.02 0.00 0.01 0.01 0.02
Poverty headcount ratio (%) 0.08** 0.04 -0.01 0.02 -0.04* 0.02 -0.08*** 0.03
Change in poverty HCR -0.14*** 0.05 -0.01 0.02 0.01 0.03 0.02 0.03
Female literacy rate (%) 0.01 0.02 0.03 0.02 0.05** 0.02 0.06** 0.03
Change in female literacy rate -0.05 0.05 -0.03 0.05 0.02 0.05 0.12** 0.06
LWE core districts 0.42 0.62 -0.11 0.68 -0.77 0.64 -0.72 0.65
LWE adjoining districts 0.57 0.55 0.33 0.57 0.03 0.52 1.88 1.22
DH CHC HR score 0.05 0.03 0.07** 0.03 -0.00 0.04 0.00 0.04
Bihar (reference) -
-
-
-
Chhattisgarh -7.18*** 1.51 -9.18*** 1.82 0.14 0.89 0.44 0.97
Jharkhand -4.83*** 1.15 -6.08*** 1.39 -0.36 0.85 0.01 0.92
Madhya Pradesh 3.41*** 0.76 -0.31 1.25 -1.73** 0.72 -1.50* 0.83
Odisha 2.32*** 0.85 1.31 0.91 -1.41* 0.75 -0.86 0.93
Rajasthan 2.51*** 0.83 -0.98 1.09 -1.28 0.86 -0.97 0.94
Uttar Pradesh -0.75 0.58 -1.07* 0.62 -2.83*** 0.66 -2.87*** 0.73
Uttarakhand 0.06 0.97 -2.93*** 0.99 -0.48 0.88 0.43 1.06
Assam -1.11 0.90 -1.45 1.04 -2.13** 0.90 -1.54 1.03
Gamma: Increment at cut-off point (HH vs HL, LH &LL) for variables violating parallel lines assumption
District with ST Pop. > 25% -2.77** 1.16 -
-
-
Scheduled tribe Pop. (%) -
-0.11*** 0.03 -
-
Urban Pop. (%) -0.09*** 0.02 -0.10*** 0.03 -
-
Poverty headcount ratio (%) -0.10*** 0.03 -
-
0.08** 0.03
Change in poverty HCR 0.13*** 0.05 -
-
-
Female literacy rate (%) -
-
-
-0.07** 0.03
Change in female literacy rate -
-
-
-0.17** 0.07
LWE adjoining districts -
-
-
-2.78** 1.37
Madhya Pradesh -
3.16*** 1.17 -
-
Rajasthan -
3.08*** 0.95 -
-
Assam 2.96*** 0.81 2.95*** 0.96 -
-
Source: Computed by Author
Note: *** p<0.01, ** p<0.05, * p<0.1
N: 284 districts HH refers to districts with base level health achievement above average level across districts and progress in
health achievement also above average progress across districts. HL refers to districts with base level health
achievement above average level across districts but progress in health achievement below average progress
across districts. LH refers to districts with base level health achievement below average level across districts
but progress in health achievement above average progress across districts. LL refers to districts with base level
health achievement below average level across districts and progress in health achievement also below average
progress across districts.
21
In case of immunization coverage, no such social demographic specific (dis)advantages are
apparent but Model 4 reveals that districts with higher share of Muslim population are less
likely (log OR: -0.06, p < 0.1) to deviate from the expected progress dynamics. Districts with
high poverty head count ratio are also less likely to be good performers in immunization
coverage. Importantly, districts with higher female literacy rate and change in female literacy
demonstrated good progress in immunization coverage. Besides, districts from Uttar Pradesh
had significantly higher likelihood of being poor performers in immunization coverage.
Discussion
Following the launch of NRHM, there has been substantial increase in public health
investments across states (Choudhury & Amar Nath, 2012). The focus of NRHM is on
promoting universal health care coverage in basic maternal and child health care services
with particular emphasis on institutional delivery and full immunization coverage. These
investments were expected to bridge inter-state and intra-state disparities in utilization of
basic health care services. Based on the analysis of 284 districts across nine high focus
states, we find that between 2007-08 and 2012-13 there has been considerable progress in
institutional delivery across all the districts but improvements in full immunization coverage
has been slow and below programme potentials. Especially, there is rather mixed
performance in immunization coverage among districts that had relatively high levels of
immunization coverage during 2007-08. In fact, a number of districts register a decline in
overall immunization coverage when compared to the base reference year, 2007-08
(Dasgupta et al. 2014). This clearly is a policy concern as it brings out the difficulties in
sustaining progress in immunization coverage across districts.
22
We adopted a social demographic perspective to examine how progress in institutional
delivery and immunization coverage varies across districts with differing concentration of
marginalized social groups. Social group affiliations are crucial in assessing human
development in India (Majumdar & Subramanian, 2001; Dreze & Sen, 1999). Although, it is
noted that marginalized social groups (SC, ST and Muslims) have poor health outcomes
(Thorat et al. 2016; Sachar, 2006; Dreze & Murthi, 2001) but our findings further
demonstrate that districts with higher concentration of such marginalized social groups are
also less likely to experience faster progress and at the same time more likely to deviate from
the expected progress dynamics. In particular, regression analysis suggests that districts with
higher share of Muslim population had significantly lower progress in both institutional
delivery and immunization coverage. The associations are robust even after adjusting for
district-specific random effects. Besides, it is also revealed that LWE affected core districts
had lower average achievements in both immunization and institutional delivery but the gap
in district level averages has decreased in recent years.
There can be two broad ways to understand causes of slow progress in districts with higher
concentration of marginalized population. The first explanation is that marginalized groups
often reside in disadvantaged areas (including LWE core areas) and have been isolated from
mainstream developmental process (Sachar, 2006; Dreze & Sen, 1999; Mathew, 2012). For
instance, income poverty is one of the major forms of deprivation among marginalized
groups in India and marginalized communities like SC, ST and Muslims are unable to
experience faster reductions in poverty (Sengupta et al. 2008). In fact, NRHM policies such
as JSY that aimed at improving the demand-side of services have shown favorable impact
(Powell-Jackson, 2015; Lim et al. 2010) and our results further confirm that districts with
higher poverty are more likely to demonstrate better progress (HL or LH category). Similarly,
23
utilization of health services may be affected by social concerns such as literacy, gender bias
and women empowerment (Murthi et al. 1995; Jejeebhoy, 1997). In particular, female
literacy is found to be a significant determinant of district-level fertility and child mortality
(Dreze & Murthi, 2001). Our results also suggest that female literacy levels have a
particularly influential impact on progress in immunization coverage across districts whereas
in case of institutional delivery effects of high male literacy is more prominent. This also
highlights the leveraging effect of female literacy in case of immunization coverage.
A second set of explanation revolves around efficacy of programme implementation and
management (Husain, 2011; Duggal, 2009; Ashtekar, 2008). The deployment of medical
staff and development of health infrastructure has been an overarching concern that deters
rapid progress (Rao et al. 2011; Rao et al. 2012). For instance, shortage of human resource,
particularly clinical staff including medical doctors, gynecologists and surgeons, is a chronic
problem of the Indian public health system. Our findings lend credence to this explanation as
it is noted that districts with better staffed CHCs and DHs have better health care utilization,
particularly institutional births. In fact, we note significant correlation across districts such
that understaffed locations also have higher shares (> 25%) of ST and Muslim population.
The public health system in India has been grappling with such distributional inefficacies
(Hazarika et al. 2013) and should be accounted for while discussing the role of social factors
in influencing health care outcomes. Besides the quality of community mobilization services
including efficacy of community health workers (ASHAs or members of VHSNCs) is rather
varied and perhaps is underperforming in regions with diverse social composition (Gopalan et
al. 2012).
24
Overall, such inequitable distribution of benefits of developmental policies and programmes
across districts with varying socio-demographic profile reiterates the need for effective
policies for mainstreaming (Thorat & Neuman, 2012). While the overarching NRHM policy
framework had substantial contribution but the status of health care indicators makes it clear
that there are diminishing benefits in recent years (IIPS, 2015-16; ORGI, 2016). At this
juncture, there is an urgency to engage in policy debiasing as at this juncture more than a
uniform approach will be necessary to facilitate rapid progress among backward districts and
marginalized groups (McGinnis et al. 2002). In this regard, it is worth noting an increased
support among policymakers and practitioners for policy debiasing of health promoting social
norms (Trujillo et al. 2015). Given the trend, there is considerable scope for debiasing in the
context of immunization policies and to overcome potential cognitive and socio-cultural
biases that adversely influence the programme outcomes (Laskowski, 2016; Balarajan et al.
2011; Paul et al. 2011; Jolly & Douglas, 2014). In particular, debiasing should aim to address
intersectional inequalities in immunization across marginalized groups, particularly those
residing in disadvantaged locations including urban hotspots as well as peri-urban areas
(Dasgupta et al. 2014; Joe, 2015). Debiasing in case of immunization coverage can draw
motivation from the success of JSY but an equal emphasis on debiasing the cognitive and
information environment is also necessary. Also, it is likely that externalities of such
cognitive debiasing may be larger and can ensure sustained behavior. In fact, going forward,
ensuring and sustaining universal immunization coverage can be a major challenge for India
as even developed countries such as the United States is finding it difficult to swim against
the tide of anti-vaccine conspiracy theories (Laskowski, 2016).
Before concluding, it is important to list the limitations of the study. First, the analysis is
based on 284 districts from nine states of India but nevertheless the results are of
25
considerable relevance because these states are regarded as high policy focus states and also
account for over 50% of total population and over 60% of total births in India. Second,
between Census 2001 and Census 2011 a few district boundaries were redefined and to that
extent this may have marginally affected the enumeration of proportion of population from
different social groups. However, we do not expect these limitations to alter our major
conclusions.
Conclusion
This paper reveals that despite uniform policy strategies across India, the progress in
institutional delivery and immunization coverage varied across districts with much slower
pace of improvements in areas with higher representation of marginalized social groups,
particularly the STs and the Muslims. These districts were also more likely to display low
progress despite lower base levels and thus deviate from the expected dynamics of progress.
Moreover, when compared to institutional delivery, the observed pace of improvements in
immunization coverage across these districts leaves much to be desired. The challenges of
experiencing higher progress or sustaining higher immunization coverage thus calls for
further policy debiasing with specific attention on cognitive and information environment to
achieve the sustainable development goal (SDG) related to universal coverage in basic health
services. Debiasing is also warranted to strengthen programme management or deployment of
medical personnel in deprived areas.
26
References
Arcaya, M. C., Arcaya, A. L., Subramanian, S. V. (2015). Inequalities in health: definitions,
concepts, and theories. Global Health Action, 8, 1-7. doi: 10.3402/gha.v8.27106
Ashtekar, S. (2008). The national rural health mission: A stocktaking. Economic & Political
Weekly, 43 (37), 23-26.
Balarajan, Y., Selvaraj, S., Subramanian, S. V. (2011). Health care and equity in India. The
Lancet, 377 (9764), 505-515. https://doi.org/10.1007/s11205-015-1006-6
Baru, R., Acharya, A, Acharya, S., Kumar, A. S., and Nagaraj, K. (2010). Inequities in access
to health services in India: caste, class and region. Economic & Political Weekly, 45
(38), 49-58.
Chauhan, R. K., Mohanty, S. K., Subramanian, S. V, Parida, J. K., Padhi, B. (2015). Regional
estimates of poverty and inequality in India, 1993–2012. Social Indicators Research,
127 (3), 1249-1296. https://doi.org/10.1007/s11205-015-1006-6
Choudhury, M, Amar Nath, H. K. (2012). An estimate of public expenditure on health in
India. National Institute of Public Finance and Policy, New Delhi. Retrieved from:
www.nipfp.org.in/media/medialibrary/2013/08/health_estimates_report.pdf
Curtis, S., Jones, I. R. (1998). Is there a place for geography in the analysis of health
inequality? Sociology of Health & Illness, 20 (5), 645-672.
Dasgupta, P. (1990). Well-being and the extent of its realisation in poor countries. The
Economic Journal, 100 (400), 1-32. DOI:10.2307/2234181
Dasgupta, R., Dasgupta, P., Agrawal, A. (2014). Decline in immunization coverage across
well-performing districts in India: an urban conundrum? Indian Journal of Pediatrics,
81 (9), 847-849. doi: 10.1007/s12098-014-1426-3
Desai, S., Kulkarni, V. (2008). Changing educational inequalities in India in the context of
affirmative action. Demography, 45 (2), 245-70.
Drèze, J., Murthi, M. (2001). Fertility, education, and development: evidence from
India. Population and Development Review, 27(1), 33-63. doi:10.1111/j.1728-
4457.2001.00033.x Retrieved from http://onlinelibrary.wiley.com/doi/10.1111/j.1728-
4457.2001.00033.x/abstract
Dreze, J., Sen, A. K. (1999). India: economic development and social opportunity (1st ed.).
New York: Oxford University Press.
Duggal, R. (2009). Sinking flagships and health budgets in India. Economic & Political
Weekly, 44 (33), 14-16.
Easterly, W. (2009). How the Millennium Development Goals are unfair to Africa. World
Development, 37 (1), 26-35.
Fukuda-Parr, S., Greenstein, J., Stewart, D. (2013). How MDG success and failure should be
judged: Faster progress or achieving the targets? World Development, 41, 19–30.
https://doi.org/10.1016/j.worlddev.2012.06.014.
Gopalan, S. S., Mohanty, S., Das, A. (2012). Assessing community health workers’
performance motivation: a mixed-methods approach on India's Accredited Social
Health Activists (ASHA) programme. BMJ Open, 2 (5), 1-10. DOI: 10.1136/bmjopen-
2012-001557
27
Hazarika, D., Thangaraj, M., Sahu, S. K., Kathiresan, K. (2013). Genetic diversity in three
populations of Avicennia marina along the east coast of India by RAPD markers.
Journal Environmental Biology, 34 (3), 663-66.
Husain, Z. (2011). Health of the national rural health mission. Economic & Political Weekly,
46 (04), 53-60.
International Institute of Population Sciences. (2008). District level household and Facility
survey fact sheet 2007-08. Mumbai, India. Retrieved from: http://rchiips.org/state-fact-
sheet-rch3.html
International Institute of Population Sciences. (2015-16). National Family Health Survey Fact
Sheet 2015-16.Mumbai, India. Retrieved from:
http://rchiips.org/NFHS/pdf/NFHS4/India.pdf
Jejeebhoy, S. J. (1997). Addressing women's reproductive health needs: Priorities for the
family welfare programme. Economic & Political Weekly, 32 (9-10), 475-84.
Joe, W. (2015). Intersectional inequalities in immunization in India 1992-93 to 2005-06: A
progress assessment. Health Policy and Planning, 30 (4), 407-22.
https://doi.org/10.1093/heapol/czu023.
Jolly, D., Douglas, K. M. (2014). The effects of anti-vaccine conspiracy theories on
vaccination intentions. PLoS ONE, 9 (2), e89177. DOI: 10.1371/journal.pone.0089177.
Kakwani, N. (1993). Performance in living standards: an international comparison. Journal of
Development Economics, 41 (2), 307–36. https://doi.org/10.1016/0304-3878(93)90061-
Q
Kawachi, I., Subramanian, S. V., Almeida-Filho, N. (2002). A glossary for health
inequalities. Journal of Epidemiology & Community Health, 56 (9), 647-652.
Krieger, N. A. (2001). A glossary for social epidemiology. Historical roots of social
epidemiology. Journal of Epidemiological Community Health, 55, 693-700.
http://dx.doi.org/10.1136/jech.55.10.693.
Laskowski, M. (2016). Nudging towards vaccination: A behavioural law and economics
approach to childhood immunization policy. Texas Law Review, 94 (601), 601-628.
Lim, S. S., et al. (2010). India's Janani Suraksha Yojana, a conditional cash transfer
programme to increase births in health facilities: An impact evaluation. The Lancet, 375
(9730), 2009-2023. http://dx.doi.org/10.1016/S0140-6736(10)60744-1
Long, J. S., Freese, J. (2014). Regression models for categorical dependent variables using
Stata (3rd ed.). Texas, USA: Stata Press.
Majumdar, M., Subramanian, S. (2001). Capability failure and group disparities: some
evidence from India for the 1980s. Journal of Development Studies, 37 (5), 104-140.
http://dx.doi.org/10.1080/00220380412331322141
Mathew, J. L. (2012). Inequity in childhood immunization in India: a systematic
review. Indian Journal of Paediatric, 49 (3), 203-223. PMID: 22484740.
McGinnis, J. M., Williams-Russo, P., Knickman, J. R. (2002). The case for more active
policy attention to health promotion. Health Affair (Millwood), 21 (2), 78-93.
Murthi, M., Guio, A. C., Dreze, J. (1995). Mortality, fertility, and gender bias in India: A
district-level analysis. Population and Development Review, 21 (4), 745-782.
28
Office of the Registrar General of India (ORGI) & Institute of Economic Growth (IEG).
Annual Health Survey-2016, Fact Sheet. New Delhi. Retrieved from:
http://www.censusindia.gov.in/vital_statistics/AHS/AHS_report_part1.pdf
Office of the Registrar General of India (ORGI). Annual Health Survey 2012-13 Fact Sheet.
New Delhi. Retrieved from: http://www.censusindia.gov.in/vital
statistics/ASHBulletins/ASH Facstsheets 2012 13.html
Paul, V. K., et al. (2011). Reproductive health, and child health and nutrition in India:
meeting the challenge. The Lancet, 377 (9762), 332-349.
https://doi.org/10.1016/S0140-6736(10)61492-4
Planning Commission of India. (2011). Faster, sustainable and more inclusive growth: An
approach to the 12th Five Year Plan. New Delhi: Government of India,
Retrievedfrom:http://planningcommission.gov.in/plans/planrel/12appdrft/appraoch_12p
lan.pdf
Powell-Jackson, T., Mazumdar, S., Mills, A. (2015). Financial incentives in health: New
evidence from India's Janani Suraksha Yojana. Journal of Health Economics, 43, 154-
169. https://doi.org/10.1016/j.jhealeco.2015.07.001
Prennushi, G., Rubio, G., Subbarao, K. (2002). Monitoring and evaluation. In: Klugman, J.,
(Ed.). A sourcebook for poverty reduction strategies. Washington, DC, World Bank.
Rao, K. D., Bhatnagar, A., Berman, P. (2012). So many, yet few: Human resources for health
in India. Human Resources for Health, 10 (1), 1-19. DOI: 10.1186/1478-4491-10-19
Rao, M., Rao, K. D., Kumar, A. S., Chatterjee, M., Sundararaman, T. (2011). Human
resources for health in India. The Lancet, 377 (9765), 587-598.
doi: http://dx.doi.org/10.1016/S0140-6736(10)61888-0
Robinson, W. S. (1950). Ecological correlation and the behaviour of individuals. American
Journal of Sociological Review, 15 (3), 351-357.
Sachar, J. R., (2006). Social, Economic and Educational Status of the Muslim Community of
India. New Delhi; Ministry of Minority Affairs; Government of India. Retrieved from:
http://www.minorityaffairs.gov.in/reports/sachar-committee-report
Schlesinger, M. (2010). Choice cuts: parsing policymakers pursuit of patient empowerment
from an individual perspective. Health Economic Policy and Law, 5 (3): 365-387. DOI:
https://doi.org/10.1017/S174413311000006X
Schwartz, S. H. (1994). Are there universal aspects in the structure and content of human
values? Journal of Social Issues, 50 (4), 19-45. DOI: 10.1111/j.1540-
4560.1994.tb01196.x
Selvin, H. C. (1958). Durkheim’s suicide and problems of empirical research. American
Journal of Sociology, 63 (6), 607-619. https://doi.org/10.1086/222356.
Sen, A. K. (1981). Poverty and Famines: An essay on entitlement and deprivation. 1st ed.
New York: Oxford University Press.
Sengupta, A., Kannan, K. P., Raveendran, G. (2008). India's common people: Who are they,
how many are they and how do they live? Economic & Political Weekly, 43 (11), 49-
63.
Susser, M. (1994). The logic in ecological: I. the logic of analysis. American Journal of
Public Health, 84 (5), 825-829.
29
Thorat, S., Dubey, A. (2012). Has growth been socially inclusive during 1993–94–2009–
10? Economic & Political Weekly, 47 (10), 43-53.
Thorat, S., Neuman, K. S. (2012). Blocked by caste: economic discrimination in modern
India. (1st ed.). New Delhi: Oxford University Press.
Thorat, S., Tagade, N., Naik, A. K. (2016). How and why? Prejudice against reservation
policies. Economic & Political Weekly, 51 (8): 61-69.
Trujillo, N. M., Torres-Esperon, J. M., Perez, N. R. (2015). Developing nursing capacity for
health system and services research in Cuba, 2008-2013. BMJ Open, 4 (1).
Vellakkal, S et al. (2017a). Has India’s national rural health mission reduced inequities in
maternal health services? A pre-post repeated cross-sectional study. Health Policy and
Planning, 32 (1), 79-90. https://doi.org/10.1093/heapol/czw100
Vellakkal, S et al. (2017b). A quantitative study of factors impacting accessing of
institutional delivery care in the context of India’s cash incentive program. Social
Science Medicine, 178, 55-65. https://doi.org/10.1016/j.socscimed.2017.01.059.
Waage, J., et al. (2015). The Millennium Development Goals: a cross-sectoral analysis and
principles for goal setting after 2015. The Lancet, 376 (9745), 991–1023. DOI:
10.1016/S0140-6736(10)61196-8
Williams, D. R., Collins, C. (2001). Racial residential segregation: A fundamental cause of
racial disparities in health. Public Health Report, 116 (5), 404-416.
Williams, R. (2006). Generalized ordered logit/partial proportional odds models for ordinal
dependent variables. Stata Journal, 6, 58–82.
30
Supplementary Figure S1: Association of district-level shares of marginalized population
subgroups with levels of institutional delivery and changes between 2007-08 and 2012-13
31
Supplementary Figure S2: Association of district-level shares of marginalized population
subgroups with levels of immunization coverage and changes between 2007-08 and 2012-13
32
Supplementary Figure S3: Association of district-level shares of marginalized population
subgroups with reductions in poverty headcount ratio (2004-05 and 2011-12) and increase in
electrification (2001-2011) across households
33
Supplementary Figure S4: Association of district-level shares of marginalized population
subgroups with increase in district level female literacy rates (2001-2011) and reductions in
male-female literacy gap (2001-2011)
34
Supplementary Figure S5: Association of changes in institutional delivery and
immunization coverage with changes in economic and social developmental profile of the
districts
10
20
30
40
50
60
Ch
an
ge
in
Institu
tio
na
l de
live
ry
-10 0 10 20 30 40Reduction in poverty HCR
-20
020
40
60
Ch
an
ge
in
Fu
ll im
mu
niz
atio
n
-10 0 10 20 30 40Reduction in poverty HCR
10
20
30
40
50
60
Ch
an
ge
in
Institu
tio
na
l de
live
ry
-20 0 20 40Increase in Electrification
-20
020
40
60
Ch
an
ge
in
Fu
ll im
mu
niz
atio
n
-20 0 20 40Increase in Electrification
10
20
30
40
50
60
Ch
an
ge
in
Institu
tio
na
l de
live
ry
-10 0 10 20 30Increase in female literacy
-20
020
40
60
Ch
an
ge
in
Fu
ll im
mu
niz
atio
n
-10 0 10 20 30Increase in female literacy
10
20
30
40
50
60
Ch
an
ge
in
Institu
tio
na
l de
live
ry
-5 0 5 10 15Reduction in male female literacy gap
Districts in High focus States
-20
020
40
60
Ch
an
ge
in
Fu
ll im
mu
niz
atio
n
-5 0 5 10 15Reduction in male female literacy gap
Districts in High focus States
35
Supplementary Table S1: Number of districts by population share of marginalized social groups and identification as left-wing core or
adjoining districts by States, 2001-2011
State All ST Population > 25% SC Population > 25% Muslim Population > 25% Leftwing (LEA, 2009-10)
2001 2011 2001 2011 2001 2011 2001 2011 Core Adjoining
Assam 23 23 4 4 - - 10 13 - -
Bihar 37 37 - - 1 1 4 4 5 9
Chhattisgarh 16 16 11 11 - - - - 5 6
Jharkhand 18 18 8 8 2 2 2 2 9 4
Madhya Pradesh 45 45 15 15 - 1 - - 1 3
Odisha 30 30 14 14 - - - - 5 9
Rajasthan 32 32 4 5 2 2 - - - -
Uttar Pradesh 70 70 - - 16 14 12 13 1 2
Uttarakhand 13 13 - - 1 1 1 1 - -
Total 284 284 56 57 22 21 29 33 26 33
Source: Computed by Author
Note: Count of the sample number of districts is presented where share of ST population or SC population or Muslim population is greater than 25% of the total district population. Count of
core and adjoining left-wing extremist affected (LEA) districts is based on Ministry of Rural Development (2009-10).
36
Supplementary Table S2: Coefficient of variation (CV) of institutional delivery (%) and full immunization coverage (%) across districts by
state and demographic characteristics, 2007-08 and 2012-13
Institutional delivery (%) Full immunization coverage (%)
CV: 2007-08 CV: 2012-13 CV: 2007-08 CV: 2012-13
Districts from
Assam 0.31 0.22 0.27 0.15
Bihar 0.41 0.24 0.26 0.16
Chhattisgarh 0.28 0.30 0.17 0.13
Jharkhand 0.55 0.29 0.29 0.19
Madhya Pradesh 0.27 0.13 0.42 0.19
Odisha 0.40 0.15 0.26 0.28
Rajasthan 0.24 0.15 0.33 0.18
Uttar Pradesh 0.40 0.18 0.34 0.21
Uttarakhand 0.33 0.17 0.11 0.10
Districts with
ST > 25% 0.47 0.28 0.36 0.22
SC > 25% 0.44 0.22 0.37 0.27
Muslim >25% 0.44 0.29 0.31 0.24
Source: Computed by Author
37
Supplementary Table S3: Regression results for association between change in covariates and changes in institutional delivery and full
immunization coverage between 2007-08 and 2012-13
Variables Change in institutional delivery Change in full immunization
Coefficient Std. Err. Coefficient Std. Err.
District with SC population > 25% 1.62 1.93 -2.08 2.69
District with ST population > 25% 3.46** 1.54 -2.73 1.72
District with Muslim pop. > 25% -6.20*** 1.59 -4.53* 2.46
LWE core districts -3.34 2.14 -0.21 2.61
LWE adjoining districts -2.39 1.69 2.41 1.94
Change in urban population 0.24 0.15 0.05 0.15
Change in poverty headcount ratio -0.06 0.07 0.06 0.08
Change in female literacy rate 0.12 0.23 -0.26 0.32
Change in male literacy rate -0.30 0.30 -0.19 0.40
Change in household electrification -0.14*** 0.04 -0.00 0.07
Institutional delivery level, 2007-08 -0.08* 0.04
Full immunization level, 2007-08
-0.50*** 0.04
Constant 36.46*** 3.04 47.04*** 3.43
Source: Computed by Author
Note: *** p<0.01, ** p<0.05, * p<0.1
38
Supplementary Table S4: Distribution of districts by socio-demographic composition and observed progress dynamics in full immunization
and institutional delivery, 2007-08 and 2012-13
Districts Full Immunization (Number of Districts) Institutional Delivery (Number of Districts)
LL LH HL HH All LL LH HL HH All
District with SC population > 25% 4 13 2 3 22 7 11 2 2 22
District with ST population > 25% 8 14 28 6 56 13 19 9 15 56
District with Muslim pop. > 25% 8 14 7 0 29 19 6 4 0 29
Other Districts 17 70 68 24 179 44 37 46 52 179
All 37 110 104 33 284 81 73 61 69 284
Districts Full Immunization (% of Districts) Institutional Delivery (% of Districts)
LL LH HL HH All LL LH HL HH All
District with SC population > 25% 18.2 59.1 9.1 13.6 100.0 31.8 50.0 9.1 9.1 100.0
District with ST population > 25% 14.3 25.0 50.0 10.7 100.0 23.2 33.9 16.1 26.8 100.0
District with Muslim pop. > 25% 27.6 48.3 24.1 0.0 100.0 65.5 20.7 13.8 0.0 100.0
Other Districts 9.5 39.1 38.0 13.4 100.0 24.6 20.7 25.7 29.1 100.0
All 13.0 38.7 36.6 11.6 100.0 28.5 25.7 21.5 24.3 100.0
Source: Computed by Author
Note: HH refers to districts with base level health achievement above average level across districts and progress in health achievement also above average progress across
districts. LH refers to districts with base level health achievement below average level across districts but progress in health achievement above average progress across
districts. HL refers to districts with base level health achievement above average level across districts but progress in health achievement below average progress across
districts. LL refers to districts with base level health achievement below average level across districts and progress in health achievement also below average progress across
districts.
Recent IEG Working Papers:
Sharma, Swati (April 2021). Gender and workplace interactions: who is likely to lose? , Working Paper Sr. No.: 426
Das, Saudamini and Mitra, Arup (April 2021). Does climate change perception make livelihood diversification more effective? Evidence from the consumption mobility study of rural households, Working Paper Sr. No.: 425
Bhattacharjea, Aditya and De, Oindrila (March 2021). India’s Cartel Penalty Practices, Optimal Restitution and Deterrence, Working Paper Sr. No.: 424
Kumari, Dezy and Naregal, Veena(March 2021). Revisiting Reports of the First National Labour Commission & the Second National Labour Commission: Labour Policy Analysis, Working Paper Sr. No.: 423
Naregal, Veena and Kumari, Dezy (March 2021). Policy Analysis beyond Development Economics: Questions for Labour Policy Analysis, Working Paper Sr. No.: 422
Kamila, Anshuman and Mehra, Meeta Keswani (March 2021). EXPLORING THE CONVERGENCE PUZZLE IN INDIA: Combining neoclassical and endogenous models to understand growth experience of Indian states, Working Paper Sr. No.: 421
Sekhar, C.S.C (2021). Price or income support to farmers? Policy options and implications, Working Paper Sr. No.: 420
Gupta, Indrani, Chowdhury, Samik, Ranjan, Avantika and Saun, Diwas Singh (Feb. 2021). Priorities in Budgetary Allocations for Health during the Fourteenth Finance Commission: Evidence from Five States, Working Paper Sr. No.: 419
IEG Working Paper No. 427
INSTITUTE OF ECONOMIC GROWTH
University Enclave, University of Delhi (North Campus) Delhi 110007, India
Tel: 27667288/365/424 Email: [email protected]
April 2021