Embed Size (px)
Citation preview
SOCIAL-EMOTIONAL AND CHARACTER DEVELOPMENT SCALE Development and Initial Validation With Urban Elementary School Students
Peter Ji David L. DuBois Adler School of Professional Psychology University of Illinois at Chicago
Brian R. Flay Oregon State University
The Social-Emotional and Character Development Scale (SECDS) is intended as a measnre of social-emotional skills and character for elementary school-age children. This study investigated the measure's psychometric properties using data collected over 5 waves for a cohort of students followed from Grades 3 to 5 in 14 nrban elementary schools (NRange ~ 500 to 593). Confirmatory factor analysis indicated good fit to the measnre' s hypothesized first- and second-order factor structure at each wave. Scales corresponding to the first-order factor structure demonstrated adequate internal consistency and test-retest reliability. Consistent with previous research using similar measnres of social-emotional skills and character, a longitudinal analysis indicated that the means for these scales decreased over the 5 waves. The validity of the SECDS general and individual scales was supported via their patterns of association with measnres of expected correlates of social-emotional skills and character. Overall, findings suggest the SECDS is appropriate for assessing the development of different facets of social-emotional skills and character dnring elementary grades and that it could be useful for investigating their role in the developmental pathways for a range of important youth outcomes.
In recent years, schools and youth-serving organizations increasingly have adopted programs based on theories of social-emotional learning (SEL) (Weissberg & O'Brien, 2004) and social-emotional and character develop-
ment (SECD) (Elias, 2009). Notwithstanding the potential for other important differences, it is noteworthy that programs developed within SEL and SECD frameworks tend to overlap considerably in their focus on strengthening
• Peter Ji, Adler School of Professional Psychology, 17 North Dearborn Street, Chicago, IL 60602. Telephone: 312-662-4354. E-mail: [email protected]
Jonrnal of Research in Character Education, 9(2), 2013, pp. 121-147 Copyright© 2013 Information Age Publishing, Inc.
ISSN 1543-1223 All rights of reproduction in any form reserved.
122
students' skills and behaviors in areas such as prosocial behavior, honesty, self-development and self-control (Elias, 2009; Elias, Parker, Kash, & Dunkeblau, 2007; Park, 2004). The aims of these programs are to improve students' SEL and SECD competencies in these areas that, in tum, prevent negative student outcomes such as violence and substance use, and promote positive student outcomes such as social competence and academic achievement (Beets et al., 2009; Bierman et al., 2010; E. C. Brown, Low, Smith, & Haggerty, 2011; Elias & Haynes, 2008; Miller, Kraus, & Veltkamp, 2005). Evaluations of SEL and SECD programs have each yielded evidence to support their ability to address these outcomes (for reviews, see Durlak, Weissberg, Dymnicki, Taylor, & Schellinger, 2011; Institute for Educational Sciences, 2007). Research that informs the design and evaluation of both types of programs thus shares a need for reliable and valid measures that assess SEL and SECD related skills and behaviors. In this paper, we introduce a new measure, the Social-Emotional and Character Development Scale (SECDS), that is designed to assess skills and behaviors with likely relevance to SEL and SECD programs. We present findings from our study of the measure's psychometric properties using data gathered from elementary school students who participated in an evaluation of Positive Action, a school-based SECD intervention.
Conceptualizations of both SEL and SECD emphasize those social and emotional skills that promote youth's positive adaptation and well-being. One influential conceptualization of SEL is that it encompasses the skills, includmg self-management, self-awareness, social-awareness, relationship skills, and responsible decision making, that youth need to handle themselves, their relationships and their work effectively and ethically (Zins, Weissberg, Wang, & Walberg, 2004). These types of skills are expected to prepare youth for success in adulthood by teaching them to be good communicators, cooperative members of a team, effective leaders, and caring,
Journal of Research in Character Education Vol. 9, No. 2, 2013
concerned members of their communities (Denham, 2006; Greenberg et al., 2003).
Conceptualizations of SECD have emphasized the importance of these types of skills as well (Elias, 2009). Regarding character specifically, Baumrind (1998) provided the following definition, which is representative of others that have been offered in the literature (Elias, 2009; Park, 2004): "Character refers to such positive and cultivated habits as social responsibility, moral commitment, self-discipline and resoluteness by which constellation the whole person is judged to be deficient, adequate, or exemplary" (p. 4). A person with good character is making a conscious decision to act in accordance with principles that are valued by society, so that the person makes decisions that reflect, not only the quality of the person, but that are also good for others and society (Park & Peterson, 2006).
Both SEL and SECD conceptualizations highlight several specific skills or behaviors that are important for youth and their development. These include (but are not necessarily limited to) prosocial behavior, honesty, self-improvement, self-control, and respect for rules and expected behaviors within the school and home. With regard to prosocial behavior, for example, the Collaborative for Academic and Social and Emotional Leaming included social awareness and relationship skills as part of their conceptualization of SEL (Payton et al., 2000; Zins et al., 2004). Similarly a youth's ability to take the perspective of others and to demonstrate respectful social interactions have been viewed as important components of SECD (Rose-Krasnor, 1997; Selman, 2003; Shultz, Selman, & Larusso, 2003). With regard to self-improvement, self-awareness and self-development have been viewed as significant components of SEL (Denham, Wyatt, Bassett, Echeverria, & Knox, 2009; Payton et al., 2000; Zins et al., 2004). The development of one's own personal qualities, capacities, talents, and skills are also viewed as demonstrations of exemplary character (King et al., 2005; Lerner et al., 2005). Similar overlap is evident with respect to self-control and
Social-Emotional and Character Development Scale
honesty, with conceptualizations of SEL referring to these skills as self-regulation and responsible decision making (Eisenberg, Hofer, & Vaughan, 2007; Elias et al., 1997; Rothbart, Posner, & Kieras, 2006), and those of SECD referring to them as the management of emotions and truthfulness toward self and others (Berkowitz & Grych, 2000; Eisenberg, Champion, & Ma, 2004; King et al., 2005; Lerner et al., 2005; Park, Peterson, & Seligman, 2004). Discussions of both SEL and SECD also emphasize the extent to which youth demonstrate respect for rules and expectations for appropriate behavior and by implication adult authority figures (e.g., teachers and parents), with studies indicating that such behavior may differ considerably across home and school settings (Brand & Feiner, 1996; Dishion, Patterson, Stoolmiller, & Skinner, 1991; Morris, Silk, & Steinberg, 2007; Pettit, Bates, & Dodge, 1997).
It is of further note that conceptualizations of SEL and SECD (or character specifically) each include references to broader, meta- or second-order manifestations of these constructs. Such constructs may reflect a youth's overarching motivation and ability to act in several interrelated ways that are consistent with social-emotional learning and good character (Baumrind, 1998; Denham, 2006; Park & Peterson, 2006; Payton et al., 2000; Zins et al., 2004). The viability of an SEL or SECD second-order construct is supported by evidence of higher order manifestations of related constructs, including self-concept (Marsh & Craven, 2006; Marsh, Trautwein, Ludtke, Koller, & Baumert, 2006), self-esteem (DuBois, Feiner, Brand, Phillips, & Lease, 1996), and positive youth development (Lerner et al., 2005).
Despite the broad base of interest in programs that focus on SEL and SECD within schools and other settings, comprehensive approaches to assessing the behaviors and skills underlying these constructs are in an early stage of development (for reviews, see Humphrey et al., 2011; Wigglesworth, Humphrey, Kalambouka, & Lendrum, 2010;
123
Wilson-Ahlstrom, Yohalem, DuBois, & Ji, 2011 ). Although scales assessing skills and behaviors in areas similar to those highlighted above have demonstrated encouraging psychometric properties, several concerns merit attention.
First, reviews of available instrumentation have revealed a relative lack of measures of SEL and SECD constructs for younger child populations, especially those that use self-report paper-pencil measures to record children's responses (Merrell & Gueldner, 2010; Person, Moiduddin, Hague-Angus, & Malone, 2009). It may be difficult to assess constructs relevant to SEL and SECD in a valid manner without directly assessing the personal knowledge that children have of their own behaviors, associated attitudes and motivations. This is a potentially significant limitation given the existence of several programs that target children in the early years of schooling that may require sound measures of SEL and SECD constructs for evaluations of impact.
Second, as Denham et al. (2009) noted, the skills and behaviors associated with SEL and SECD may manifest themselves differently as children mature, and contexts such as home, school, and peer groups exert varying degrees of influence on their development. Few studies, however, have examined the psychometric properties of instruments intended to measure constructs relevant to SEL and SECD as children mature and develop during the important early developmental years.
Third, only a few studies have used factor analysis to investigate the structural validity of instruments that measure the intended distinct SEL and SECD skills and behaviors (Humphrey et al., 2011). With notable exceptions (e.g., Bowers et al., 2010), possible higher order hierarchical or second-order factor structures that might reflect broader SEL and SECD constructs have not been considered.
Finally, reports of SEL and SECD instruments offer little evidence for their validity. Durlak et al. (2011) noted that a majority of studies they reviewed in their meta-analysis of
124
evaluations of social and emotional learning programs had a notable lack of instruments with established validity to measure program impacts. Past reviews of SEL and SECD instruments similarly have commented on the limited amount of evidence for their validity (e.g., Humphrey et al., 2011; Wigglesworth et al., 2010). Key issues in this regard include demonstrating that SEL and SECD instruments are associated in expected ways with indices of constructs that theory and prior research suggest should contribute to, and/or be outcomes supported by, SEL and SECD related skills (Person, Moiduddin, Hague-Angus, & Malone, 2009; WilsonAhlstrom et al., 2011 ). Moreover, reports of validity evidence by student gender and race are lacking and would be informative for examining SEL and SECD program impacts for different student demographics (WilsonAhlstrom et al., 2011 ).
The instrument that is the focus of the present research, the Social-Emotional and Character Development Scale (SECDS), was developed in the context of an ongoing program of research on the Positive Action (PA) program that was conducted with Chicago Public Schools. The PA program includes classroom, school wide climate, family, and community components (Flay & Allred, 2003, 2010; Flay, Allred, & Ordway, 2001) and is based on theories of self-concept/esteem (DuBois, Flay, & Fagen, 2009; Purkey, 1970; Purkey & Novak, 1996), learning, behavior, and school ecology (Flay & Allred, 2010; Flay, Snyder, & Petraitis, 2009). The program is designed to improve the abilities of children and adolescents to have positive prosocial interactions with peers, to be honest with self and others, to engage in self-improvement, to exhibit self-control, and to demonstrate respect for rules and expectations for appropriate behavior in school and home contexts. These skills and behaviors, in turn, are intended collectively to strengthen overall socialemotional competencies and character (Flay & Allred, 201 O; Flay et al., 2009; Lewis et al., 2012; Washburn et al., 2011) and contribute to
Journal of Research in Character Education Vol. 9, No. 2, 2013
both the prevention of problem behaviors, such as violence and substance abuse, and the promotion of positive outcomes such as academic achievement (Flay & Allred, 2010).
The SECDS is intended to assess each of the previously identified overlapping facets of social-emotional learning and character (i.e., prosocial behavior, honesty, self-development, self-control, and respect for rules and expectations for appropriate behavior both at school and in the home, respectively). We conceptualize these different facets of skill and behavior as being subsumed under a more global construct of overall social-emotional and character development. The SECDS uses a self-report format and is designed for use with children as young as third grade. Our broader goal in developing the measure is to contribute an instrument to the literature that would be of value both in the evaluation of SEL and SECD programs and in research on the development of social-emotional skills and character among elementary school-age children.
This initial study of the SECDS had four primary aims. Using confirmatory factor analysis, a first aim was to investigate support for the SECD S's hypothesized multidimensional and second-order factor structure. A second aim was to examine the internal reliability of the measure including, as recommended by Wilson-Ahlstrom et al. (2011), separate estimates of reliability across subgroups of children varying in age, gender, and race/ethnicity. We also examined the test-retest reliability of the measure. A third aim was to test for potential changes in both the absolute and relative levels of scores on the measure over the course of the study, during which children progressed from grade three to grade five. A final aim was to conduct analyses that address the validity of the instrument according to the framework and recommendations of several prior studies (Humphrey et al., 2011; Person et al., 2009; Wigglesworth et al., 201 O; Wilson-Ahlstrom et al., 2011 ). After establishing the factor structure of the SECDS, validity analyses examined the degree to which scores on the measures exhibited expected associations with measures
Social-Emotional and Character Development Scale
of relevant constructs (i.e., those that would be expected to contribute to and/or be influenced by the development of SECD related skills and behaviors).
METHOD
Study Design
Data for this study came from an evaluation of the PA program that was conducted under the auspices of the Social and Character Development cooperative agreement funded by Institute for Education Sciences (IES Grant # R215S020218) (Social and Character Development Research Consortium, 2010). Chicago was one of seven sites nationwide evaluating the effects of school-based interventions designed to promote children's social and character development. The schools that participated in the Chicago site evaluation consisted of 14 K-6 and K-8 elementary schools in the Chicago Public Schools. Of the 14 schools in matched pairs, seven were assigned randomly to implement the PA program and seven were assigned to a control group (for details on the matching process and the study design, see Ji et al., 2006).
Following the IES research design, the PA program study design was a cluster-focused intent-to-treat analysis (Vuchinich, Flay, Aber, & Bickman, 2012). By the end of Grade 5, there were five waves of data collection. We followed a cohort of students that was surveyed initially in the fall of Grade 3 (preintervention baseline, wave one) and subsequently in the spring of Grade 3 (wave two), fall and spring of Grade 4 (waves three and four), and the spring of Grade 5 (wave five), from 2004 to 2007. At each time of assessment, we attempted to collect data from all students in the grade cohort being followed, including those who had transferred into schools since the inception of the research, but not from those students in the study cohort who had left the study schools (Brown et al., 2008; Vuchinich et al., 2012). Across time, then, the
125
student cohort could be considered "dynamic" (i.e., changing) because of student mobility.
Human Subjects Approvals
The IES research trial was approved by Institutional Review Boards at the University of Illinois at Chicago and Oregon State University, the Research Review Board at Chicago Public Schools, and the Public/Private Ventures Institutional Review Board for Mathematica Policy Research (MPR).
Sample
The percentage of parents who returned the consent form and indicated "yes" for their child to participate ranged from was 65% to 79% over the five waves. For those students for whom we obtained written parental consent, the overall assent rate was well over 90% over the five waves. The numbers of students surveyed at each of the five waves was 593, 563, 549, 512, and 500, respectively. Due to high levels of annual mobility in the study schools (average of36%, see Ji et al., 2006), of the 593 students enrolled in the study at wave one, only 284 remained in the study and completed measures across all five waves. A total of 459 students over the course of the study provided data for at least two of the five waves. The demographics of students participating in the study at wave one were as follows: 54% female; 54% Black/African American, 30% Hispanic/Latino, 11 % Caucasian, and 5% Asian/ Asian American; and 90% families were low-income as indicated by the student receiving free lunches at school.
Procedure
The University of Illinois at Chicago research staff administered the SECDS as part of a battery of several self-report measures to participating students in their classrooms. On a separate day, research staff from MPR administered an additional set of surveys (noted in
126
the Measures section) that were common to all the sites participating in the larger IES research trial. For both administrations, the testing time took approximately 45 minutes. Research staff read the instructions and individual items for each measure aloud to ensure that reading level did not impede students' ability to complete the measures appropriately.
To assess test-retest reliability, at wave five the SECDS and other measures were administered a second time to a small sample of students (n = 32) in two of the control group schools two weeks after the primary survey administration.
Measures
Social-Emotional and Character Development Scale. The SECDS consisted of 28 items that were intended to assess different facets of social-emotional skills and character (see Appendix). According to the FleschKincaid reading grade level, the readability of the items was 3 .4, or slightly higher than a third-grade reading level. An earlier version of the measure consisting of 46 items was piloted with a sample of 300 students enrolled in Grades 3 through 5 in two Chicago Public Schools, neither of which was part of the research from which the current sample was derived. Factor analyses performed on these data were used as a basis for reducing the measure to 28 items. The number of items retained for each of the targeted facets of social emotional skills and character were as follows: (1) Prosocial Behavior - 6 items, (2) Honesty - 6 items, (3) Self-Control - 5 items, ( 4) Self-Development - 4 items, ( 5) Respect at School - 5 items, and (6) Respect at Home - 4 items. Items were rated on a 4-point scale with simplified response anchors (NO!, no, yes, YES!) that were suitable for younger elementary school students. Each item was scored 1 to 4 in the direction of reports of more positive social-emotional skills and character.
Measures for validity analyses. Data for use in validity analyses were obtained from the wave one and wave five assessments (unless
Journal of Research in Character Education Vol. 9, No. 2, 2013
otherwise noted) and included measures of each of the following constructs: engagement with school, negative school orientation, peer group affiliation, positive and negative values, social problem solving, altruistic behavior, positive and negative affect, self-esteem, life satisfaction, positive health behaviors, grades, depression, anxiety, and risk behavior (the last three administered at wave five only).
Except where noted, measures used the aforementioned 4-point response scale (NO!, no, yes, YES!). We altered the original response scales of several measures to fit this format. It was viewed as important to do so, however, both for ensuring that measures were suitable for use with younger students and for minimizing potential confusion arising from having different response scales across measures. In several instances, briefer versions of measures also were used to maintain a reasonable length for the overall survey battery. Unless otherwise noted, the briefer versions of measures were derived on the basis of selecting items judged appropriate for younger students as well as the results of reliability analyses conducted using data from the pilot sample referred to above. All measures were scored by averaging responses across items, with items scored such that higher scores indicated greater levels of the construct.
Engagement with school. The Engagement Versus Disaffection with Learning measure assessed students' engagement in their school work (Furrer & Skinner, 2003). For the present research, only the 10 positive valence items from the original measure were used. Sample items included "When I'm in class, I join in on class discussion" and "In class, I work as hard as I can." Internal consistency estimates were acceptable (alpha coefficient of .84 at both waves one and five). This measure was administered by the MPR research team.
Negative school orientation. To assess the extent to which students had negative perceptions of school or were not interested in school, a measure was used that consisted of the eight negative valence items from the previously referenced Engagement Versus Disaffection
Social-Emotional and Character Development Scale
with Leaming and Sense of School as a Community measures. Sample items included "The students don't really care about each other" and "When I'm in class, my mind wanders." Internal consistency estimates were acceptable (alpha coefficient of. 72 at both waves one and five). This measure was administered by the MPR research team.
Peer group affiliation. The Peer Group Affiliation Scale assessed students' affiliation with other youth who engaged in either negative or positive behaviors (Elliot et al., 1996). The scale consisted of seven items. The item stem was "How many of your friends do these things?" Sample items included " ... get good grades in school?" (positive behaviors) and " ... bully other kids?" (negative behaviors). The response scale was: None, Some, Most, and All. The measure yielded two scores indicating the extent to which students reported having friends who engaged in negative or positive behaviors, respectively. Internal consistency estimates ranged from questionable to acceptable (alpha coefficients at waves one and five of .60 and .64, respectively, for positive behaviors and .84 and .83 for negative behaviors).
Positive and negative values. The Belief in the Moral Order measure assessed students' endorsement of socially desirable and undesirable behaviors (Arthur, Hawkins, Catalano, & Pollard, 2000). The measure consisted of 11 items and sample items included "It is important to be honest with your teachers, even if they get upset with you or you get punished" (positive values) and "It is OK to hit someone if they hit you first" (negative values). The measure yielded two scores, one for positive and one for negative moral values. Internal consistency estimates ranged from questionable to acceptable (alpha coefficients at waves one and five of .69 and .81, respectively, for positive behaviors, and .59 and .72 for negative behaviors).
Social problem solving. The Social Skills Problem Solving Measure assessed students' ability to solve interpersonal social problems (Aber, Brown, Jones, & Samples, 1995). The
127
measure consisted of eight pictures accompanied by one or two sentences that described an interpersonal problem. Students chose which of five possible responses they felt would solve the problem. The measure yielded scores that indicated the students' use of competent as well as aggressive social problem solving. For the present research, five items (scenarios) were selected from the full measure. Internal consistency estimates were poor to questionable (alpha coefficients at waves one and five of .58 and .66, respectively, for competent problem-solving, and .50 and .59 for aggressive problem-solving).
Altruistic behavior. The Altruism Scale (Soloman, Battistich, Watson, Schaps, & Lewis, 2000) assessed how often students engaged in helping behavior. The measure consisted of eight items and sample items included "At school/someplace else, I helped someone who was hurt" and "At school/someplace else, I cheered up someone who was sad." The response scale was: Never, Once or twice, A few times, and Many times. Internal consistency was acceptable (alpha coefficient at waves one and five of .85 and .86). This measure was administered by the MPR research team.
Positive and negative affect. The Positive and Negative Affect Scale (PANAS) assessed students' levels of positive and negative affect and was previously validated for students in grades four to eight (Laurent et al., 1999). The present research used a shorter 12-item version of the original 20-item measure. In addition, the time frame for questions was adapted to refer to the "past two weeks" rather than the "past few weeks" and the original 5-point response scale was adapted to a 4-point scale (None of the time, Some of the time, Most of the time, All of the time). The item stem was "How much of the time have you been feeling this way over the past 2 weeks?" Sample items included "Happy" (positive affect) and "Nervous" (negative affect). Internal consistency estimates were questionable to acceptable (alpha coefficients at waves one and five of .68
128
and .81, respectively, for positive affect, and .74 and .76 for negative affect).
Self-esteem. The Self-Esteem Questionnaire is a multidimensional measure of self-esteem that was previously validated for use with students between 10 and 15 years of age (DuBois et al., 1996). Items consisted of statements about evaluations of the self in various domains as well as overall feelings of self-worth. Only the 4-item global self-esteem measure was used for the present investigation. Sample items included "I am happy with myself as a person" and "I am as well liked by other kids as I want to be." Internal consistency estimates ranged from questionable to acceptable (alpha coefficient of .61 and .79 at waves one and five).
Life satisfaction. The Student's Life Satisfaction Scale assessed students' perceived quality of life (Huebner, 199la, 199lb). The measure was previously validated for use with third- through eighth-grade students. The present research used a shorter 3-item version of the original 7-item measure. The question stem was "Do you agree with the following statements about you?" Sample items included "I feel successful in life" and "I feel happy about my life." Internal consistency estimates were acceptable (alpha coefficient of. 70 and .80 at waves one and five).
Positive health behavior. The Positive Health Behavior Scale was developed for the present research to assess how often students engaged in different healthy and unhealthy behaviors in the areas of diet, exercise, rest and hygiene. The measure consisted of 10 items. Sample items included, "I eat fresh fruits and vegetables" (healthy) and "I eat junk food (chips, candy)" (unhealthy). The response scale was: None of the time, Some of the time, Most of the time, and All of the time. Items that asked about unhealthy behaviors were reversed scored. Internal consistency estimates were poor (coefficient alpha of .56 and .58 at waves one and five). However, coefficient alpha may not be a suitable index for internal consistency when the measure is based on reports of discrete, potentially independent
Journal of Research in Character Education Vol. 9, No. 2, 2013
behaviors (Bollen & Lennox, 1991; Streiner, 2003). Rather, test-retest reliability may be better for gauging the measure's reliability. The estimate of test-retest reliability based on data available at wave 5 (r = .85) was, in fact, notably higher than the internal consistency estimates.
Grades. Students were asked a single question about their academic grades. The question stem was "What grades have you been getting this year in school?" The response scale was: Mostly F's, Mix of D's and F's, Mostly D's, Mix of C's and D's, Mostly C's, Mix of B's and C's, Mostly B's, Mix of A's and B's, and Mostly A's.
Depression and anxiety. The Anxiety and Depression scales of the Child Form of the Behavior Assessment System for Children (Reynolds & Kamphaus, 2002) are self-report measures of symptoms of depression and anxiety for school-age children. For the present research, we selected six items to assess depression and six items to assess anxiety based on an examination of the factor loadings provided by another research group that was part of the larger IES trial (Brown & Jones, 2008).These items were administered only at wave five. Sample items included "Nothing ever goes right for me" (depression) and "I often worry about something bad happening to me" (anxiety). The response scale was: True or False. Internal consistency estimates were acceptable (coefficient alpha of. 79 and. 77, for depression and anxiety).
Risk behavior. The Risk Behavior Survey assessed the frequency of students engaging in violence related and substance use behaviors (Centers for Disease Control and Prevention, 2004). The measure consisted of 11 items and was administered only at wave five. Sample items included "Carried a knife or razor to use to hurt someone" (violence related) and "Smoked a cigarette (or used some other form of tobacco)" (substance use). The response scale was: None, Once, 2-5 times, and More than 5 times. Scores for each type of behavior were calculated by counting the number of items where the student indicated having
Social-Emotional and Character Development Scale
engaged in the behavior at least once. Internal consistency estimates were acceptable ( coefficient alpha of. 76 and .63 for violence related behaviors and substance abuse). As with the health behavior scale, due to the nature of the items, test-retest reliability may be better for gauging the scale's reliability. The test-retest coefficient available at wave five for violence related behaviors was r = .77and for substance use was r = .84.
Analysis Plan
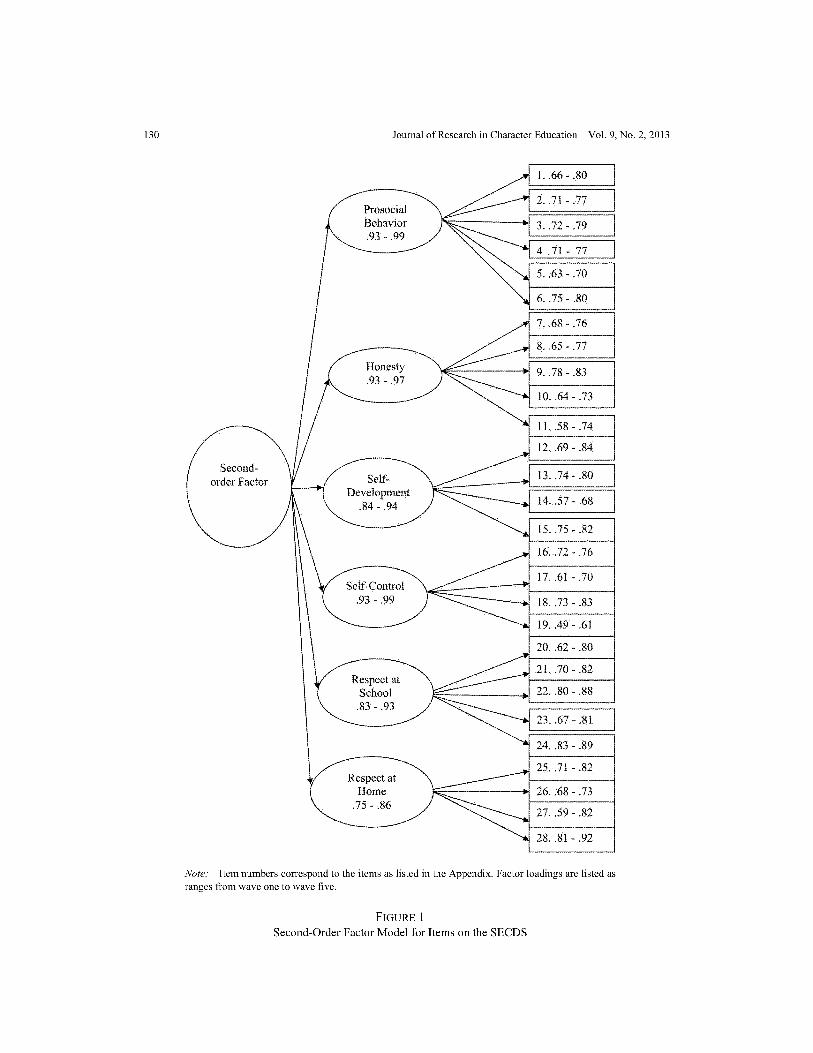
We frrst used confrrmatory factor analysis (CFA) to evaluate the degree to which responses on the SECDS were consistent with the multidimensional, hierarchical conceptualization of social-emotional skills and character that guided the development of the instrument (see Figure 1 ). To test support for this conceptualization, we fitted a second-order factor model to the data. In this model, the 28 SECDS items were assigned to their respective factors that represented each of the six specific facets of SECDS skills and behaviors; these factors were, in turn, nested within a second-order factor. We compared the fit of this model to two alternative models. One alternative model was a single-factor model that had all 28 items loading on one factor. The second alternative model was a correlated-factors model. In this model, the 28 items loaded on their respective factors and all intercorrelations among these factors were specified. This model represented an alternative to accounting for associations among factors that did not involve specifying a second-order factor. These analyses were conducted at each of the five waves.
We used the MPlus program (Version 5.2) to conduct the CF As (Muthen & Muthen, 2007). Because of the ordinal nature of the observed variables (i.e., SECDS items), it was necessary to use estimation procedures for ordinal data available in MPlus (Muthen & Muthen, 2007), specifically WLSMV (weighted least squares with a diagonal weight matrix) estimation. This approach produced robust estimates of the chi-square goodness of
129
fit statistic and corrected for distributional properties of the observed data. To assess adequacy of fit for each model, we relied on multiple fit indices: the Root Mean Square Error of Approximation (RMSEA), Comparative Fit Index (CFI), and Tucker Fit Index (TFI) (Bollen, 1989; Hu & Bentler, 1999). Acceptable fit was indicated by RMSEA values that were equal to or less than .08, and ideally less than or equal to .05, and by CFI and TFI values of at least . 90 and ideally . 95 or greater (Hu & Bentler, 1999; Yu, 2002). We used the chi-square difference test (DIFFTEST option in MPlus) to compare the fit of the hypothesized second-order factor model with that of each alternative model (Li, Stanton, & Yu, 2007; Muthen & Muthen, 2007). A significant difference in chi-square would indicate that the second-order factor model fit the data better than the alternative model.
After establishing the best-fitting factor structure for the SECDS, we examined the internal reliability of the scales that corresponded to the six facets of social-emotional learning and character (i.e., the first-order factors in the CF A analyses) implied by this model at all five waves. We also examined the internal reliability of scales by gender and by racial group (Caucasian, Black/African-American, Hispanic/Latino; Asian/Asian-American was omitted because of small sample size). We used correlations to examine the test-retest reliability of SECDS general and individual scales at wave five.
To examine potential differences in the scores for each scale across the five waves as well as differences in scores across scales at each wave, we conducted a doubly-repeated measures ANOV A with both time and scale as factors. This longitudinal analysis used the SECDS individual scales (i.e., first-order factors) and was limited to students with complete data across all waves.
We conducted the validity analyses at both wave one and wave five. We examined the extent to which SECDS scores exhibited associations with correlates of social-emotional skills and character, both concurrently using
130
Secondorder Factor
Journal of Research in Character Education Vol. 9, No. 2, 2013
Prosocial Behavior .91- .99
Honesty .93 - .97
SelfDevelopment
.84 - .94
Respect at School
.83 - .93
Respect at Home
.75 - .86
1. .66 - .80
2 .. 71 - .77
3 .. 72 - .79
4 .. 71 - .77
5 .. 63 - .70
6 .. 75 - .80
7 .. 68- .76
8 .. 65 - .77
9 .. 78 - .83
10 .. 64 - .73
11. .58 - .74
12 .. 69 - .84
13 .. 74 - .80
14 .. 57 - .68
15 .. 75 - .82
16 .. 72 - .76
17 .. 61 - .70
18 .. 73 - .83
19 .. 49 - .61
20 .. 62 - .80
21. .70 - .82
22 .. 80 - .88
23 .. 67 - .81
24 .. 83 - .89
25 .. 71 - .82
26 .. 68 - .73
27 .. 59- .82
28 .. 81 - .92
Note: Item numbers correspond to the items as listed in the Appendix. Factor loadings are listed as ranges from wave one to wave five.
FIGURE 1 Second-Order Factor Model for Items on the SECDS
Social-Emotional and Character Development Scale
data from waves one and five as well as longitudinally using wave one SECDS scores and wave five measures of selected constructs (positive health behavior, student self-report grades, depression, anxiety, substance use behavior, and violence related behavior). We computed partial correlations that controlled for the following demographic and study design variables, using dummy codes where appropriate: gender and racial group (Caucasian, Black/ African-American, Hispanic/ Latino), the school the student was enrolled in, and the school's assignment to treatment or control condition.
To determine the extent to which the results from the validity analyses were consistent across student demographics, we examined the partial correlations by gender and racial group, controlling for the gender and racial group as appropriate, and the aforementioned study design variables. We used the formulas provided by Darlington (1990) to test for potential differences in the partial correlations separately between gender and racial groups.
RESULTS
Confirmatory Factor Analyses
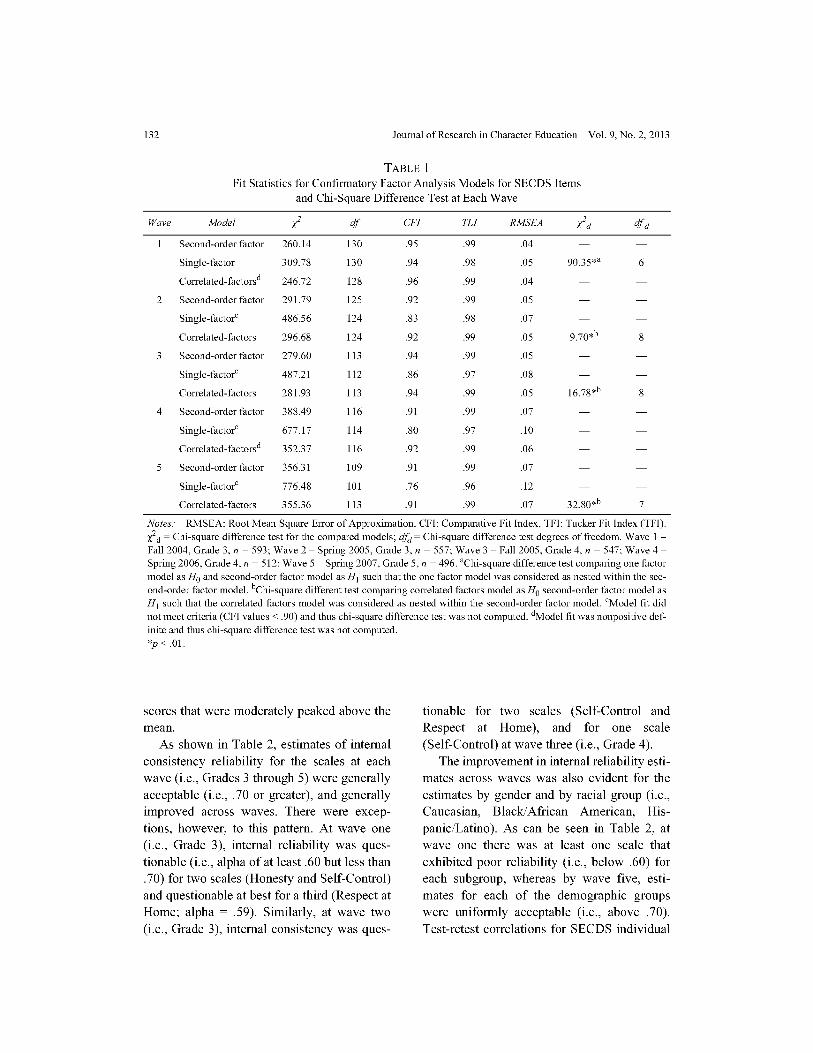
Table 1 presents the fit statistics forthe three factor models at each wave. The hypothesized second-order factor model demonstrated adequate fit at all five waves, with CFI and TLI values above .90 and RMSEA values below .08. The single-factor model demonstrated adequate fit only at wave one whereas at each of the other waves, the CFI values for this model were below .90. As shown in Table 1, the difference test comparing the second-order factor model to the single-factor model was significant at wave one (tests were not conducted for the single-factor model at waves two through five because the model did not meet fit criteria), indicating a superior fit for the second-order model. The correlated-factors model demonstrated adequate fit only at waves two, three, and five. At waves one and four, this model yielded a non-positive definite matrix, indicat-
131
ing problems with its fit. The difference test comparing the second-order factor model to the correlated-factors model was significant at waves two, three, and five (tests were not conducted for the correlated-factors model at waves one and four because the model demonstrated non-positive definite fit), again indicating a superior fit for the second-order model. In summary, both individual model-fit statistics and comparisons of fit between models consistently indicated that the second-order factor model was the best fitting model.
Figure 1 presents the factor loadings for both the items and the frrst-order factors on the second-order factor, for the second-order factor model at each wave. Item factor loadings were all substantial (i.e., > .47) and, in most cases, were similar in magnitude across most waves. Loadings for the factors on the second-order factor were also large (i.e., > .75) and similar in magnitude across waves.
Descriptive Statistics, Reliability Analyses, and Intercorrelations for the SE CDS General and Individual Scales
Based on the superior fit of the second-order factor model, scores for the SECDS general and individual scales were computed based on this model. These included six scales comprised of items corresponding to each of the model's first-order factors representing different facets of social-emotional skills and character (Prosocial Behavior, Honesty, Self-Development, Self-Control, Respect at School, Respect at Home). An additional scale (General) was computed as the average of the six scales corresponding to the first-order factors and thus corresponded to the model's second-order factor. Scale scores were computed by averaging responses to relevant items and scores ranged from 1 (NO!) to 4 (YES!). Table 2 reports the means and standard deviations for all the scales. Scores demonstrated negative skewness (mean of -1.13 across all scales and waves), indicating that they clustered at the high end of the scale, and positive kurtosis (mean of 1.20), indicating a distribution of
132 Journal of Research in Character Education Vol. 9, No. 2, 2013
TABLE 1 Fit Statistics for Confirmatory Factor Analysis Models for SECDS Items
and Chi-Square Difference Test at Each Wave
Wave Model I df CF! TL! RMS EA Id dfd
Second-order factor 260.14 130 .95 .99 .04
Single-factor 309.78 130 .94 .98 .05 90.35*a 6
Correlated-factorsd 246.72 128 .96 .99 .04
2 Second-order factor 291.79 125 .92 .99 .05
Single-factor0 486.56 124 .83 .98 .07
Correlated-factors 296.68 124 .92 .99 .05 9.70*b 8
3 Second-order factor 279.60 113 .94 .99 .05
Single-factor0 487.21 112 .86 .97 .08
Correlated-factors 281.93 113 .94 .99 .05 16.78*b 8
4 Second-order factor 388.49 116 .91 .99 .07
Single-factor0 677.17 114 .80 .97 .10
Correlated-factorsd 352.37 116 .92 .99 .06
5 Second-order factor 356.31 109 .91 .99 .07
Single-factor0 776.48 101 .76 .96 .12
Correlated-factors 355.36 113 .91 .99 .07 32.80*b 7
Notes: RMSEA: Root Mean Square Error of Approximation, CF!: Comparative Fit Index, TFI: Tucker Fit Index (TFI). x2 d ~ Chi-square difference test for the compared models; dfd ~ Chi-square difference test degrees of freedom. Wave 1 -Fall 2004, Grade 3, n ~ 593; Wave 2 - Spring 2005, Grade 3, n ~ 557; Wave 3 - Fall 2005, Grade 4, n ~ 547; Wave 4 -Spring 2006, Grade 4, n ~ 512; Wave 5 - Spring 2007, Grade 5, n ~ 496. aChi-square difference test comparing one factor model as H0 and second-order factor model as H 1 such that the one factor model was considered as nested within the sec-ond-order factor model. bChi-square different test comparing correlated factors model as Ho second-order factor model as H 1 such that the correlated factors model was considered as nested within the second-order factor model. 0 Model fit did not meet criteria (CF! values< .90) and thus chi-square difference test was not computed. dModel fit was nonpositive def-inite and thus chi-square difference test was not computed. *p < .01.
scores that were moderately peaked above the mean.
As shown in Table 2, estimates of internal consistency reliability for the scales at each wave (i.e., Grades 3 through 5) were generally acceptable (i.e., . 70 or greater), and generally improved across waves. There were exceptions, however, to this pattern. At wave one (i.e., Grade 3), internal reliability was questionable (i.e., alpha of at least .60 but less than . 70) for two scales (Honesty and Self-Control) and questionable at best for a third (Respect at Home; alpha = .59). Similarly, at wave two (i.e., Grade 3), internal consistency was ques-
tionable for two scales (Self-Control and Respect at Home), and for one scale (Self-Control) at wave three (i.e., Grade 4).
The improvement in internal reliability estimates across waves was also evident for the estimates by gender and by racial group (i.e., Caucasian, Black/ African American, Hispanic/Latino). As can be seen in Table 2, at wave one there was at least one scale that exhibited poor reliability (i.e., below .60) for each subgroup, whereas by wave five, estimates for each of the demographic groups were uniformly acceptable (i.e., above . 70). Test-retest correlations for SECDS individual
Social-Emotional and Character Development Scale 133
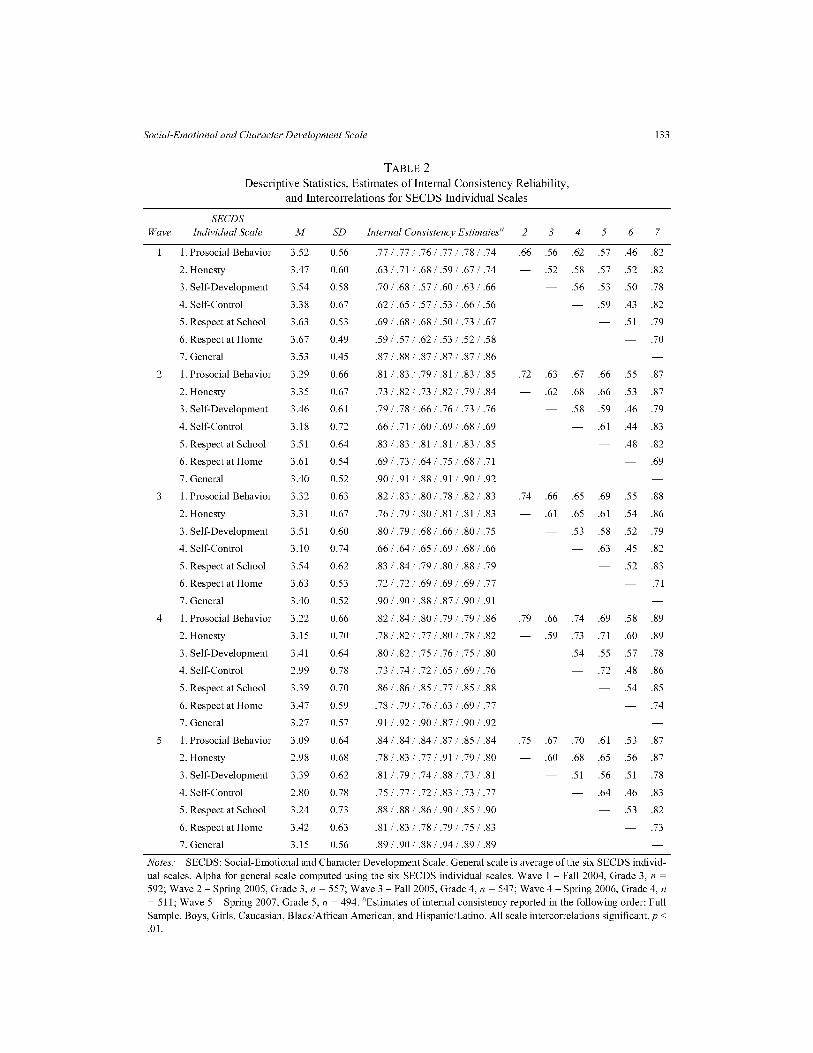
TABLE 2 Descriptive Statistics, Estimates oflntemal Consistency Reliability,
and Intercorrelations for SECDS Individual Scales
SE CDS Wave Individual Scale M SD Internal Consistency Estimates0 2 3 4 5 6 7
1. Prosocial Behavior 3.52 0.56 .77 I .77 I .76 I .77 I .78 I .74 .66 .56 .62 .57 .46 .82
2. Honesty 3.47 0.60 .63 I .71 I .68 I .59 I .67 I .74 .52 .58 .57 .52 .82
3. Self-Development 3.54 0.58 .70 I .68 I .57 I .60 I .63 I .66 .56 .53 .50 .78
4. Self-Control 3.38 0.67 .62 I .65 I .57 I .53 I .66 I .56 .59 .43 .82
5. Respect at School 3.63 0.53 .69 I .68 I .68 I .50 I .73 I .67 .51 .79
6. Respect at Home 3.67 0.49 .59 I .57 I .62 I .53 I .52 I .58 .70
7. General 3.53 0.45 .87 I .88 I .87 I .87 I .87 I .86
2 1. Prosocial Behavior 3.29 0.66 .81 I .83 I .79 I .81 I .83 I .85 .72 .63 .67 .66 .55 .87
2. Honesty 3.35 0.67 .73 I .82 I .73 I .82 I .79 I .84 .62 .68 .66 .53 .87
3. Self-Development 3.46 0.61 .79 I .78 I .66 I .76 I .73 I .76 .58 .59 .46 .79
4. Self-Control 3.18 0.72 .66 I .71 I .60 I .69 I .68 I .69 .61 .44 .83
5. Respect at School 3.51 0.64 .83 I .83 I .81 I .81 I .83 I .85 .48 .82
6. Respect at Home 3.61 0.54 .69 I .73 I .64 I .75 I .68 I .71 .69
7. General 3.40 0.52 .90 I .91 I .88 I .91 I .90 I .92
3 1. Prosocial Behavior 3.32 0.63 .82 I .83 I .80 I .78 I .82 I .83 .74 .66 .65 .69 .55 .88
2. Honesty 3.31 0.67 .76 I .79 I .80 I .81 I .81 I .83 .61 .65 .61 .54 .86
3. Self-Development 3.51 0.60 .80 I .79 I .68 I .66 I .80 I .75 .53 .58 .52 .79
4. Self-Control 3.10 0.74 .66 I .64 I .65 I .69 I .68 I .66 .63 .45 .82
5. Respect at School 3.54 0.62 .83 I .84 I .79 I .80 I .88 I .79 .52 .83
6. Respect at Home 3.63 0.53 .72 I .72 I .69 I .69 I .69 I .77 .71
7. General 3.40 0.52 .90 I .90 I .88 I .87 I .90 I .91
4 1. Prosocial Behavior 3.22 0.66 .82 I .84 I .80 I .79 I .79 I .86 .79 .66 .74 .69 .58 .89
2. Honesty 3.15 0.70 .78 I .82 I .77 I .80 I .78 I .82 .59 .73 .71 .60 .89
3. Self-Development 3.41 0.64 .80 I .82 I .75 I .76 I .75 I .80 .54 .55 .57 .78
4. Self-Control 2.99 0.78 .73 I .74 I .72 I .65 I .69 I .76 .72 .48 .86
5. Respect at School 3.39 0.70 .86 I .86 I .85 I .77 I .85 I .88 .54 .85
6. Respect at Home 3.47 0.59 .78 I .79 I .76 I .63 I .69 I .77 .74
7. General 3.27 0.57 .91 I .92 I .90 I .87 I .90 I .92
5 1. Prosocial Behavior 3.09 0.64 .84 I .84 I .84 I .87 I .85 I .84 .75 .67 .70 .61 .53 .87
2. Honesty 2.98 0.68 .78 I .83 I .77 I .91 I .79 I .80 .60 .68 .65 .56 .87
3. Self-Development 3.39 0.62 .81 I .79 I .74 I .88 I .73 I .81 .51 .56 .51 .78
4. Self-Control 2.80 0.78 .75 I .77 I .72 I .83 I .73 I .77 .64 .46 .83
5. Respect at School 3.24 0.73 .88 I .88 I .86 I .90 I .85 I .90 .53 .82
6. Respect at Home 3.42 0.63 .81 I .83 I .78 I .79 I .75 I .83 .73
7. General 3.15 0.56 .89 I .90 I .88 I .94 I .89 I .89
Notes: SECDS: Social-Emotional and Character Development Scale. General scale is average of the six SECDS individ-ual scales. Alpha for general scale computed using the six SECDS individual scales. Wave 1 - Fall 2004, Grade 3, n ~ 592; Wave 2 - Spring 2005, Grade 3, n ~ 557; Wave 3 - Fall 2005, Grade 4, n ~ 547; Wave 4 - Spring 2006, Grade 4, n ~ 511; Wave 5 - Spring 2007, Grade 5, n ~ 494. aEstimates of internal consistency reported in the following order: Full Sample, Boys, Girls, Caucasian, Black/African American, and Hispanic/Latino. All scale intercorrelations significant,p < .01.
134
scales at wave five (2-week interval) were as follows: Prosocial Behavior = . 76, Honesty = .62, Self-Development = .75, Self-Control = .63, Respect at School= .78, Respect at Home = . 72, General = . 79.
Average intercorrelations among only the SECDS individual scales at each wave ranged from .55 to .63 (see Table 2). At each wave, the strongest correlation was between the Honesty and Prosocial Behavior scales whereas the weakest correlation was between the Respect at Home and the Self-Control scales.
Analysis of Longitudinal Trends for the SE CDS Individual Scales
The repeated measures ANOV A conducted on the SECDS individual scales across the five waves revealed significant effects for wave (F(4, 844) = 23.04, p < .01) and scale (F(5, 1055) = 107.04, p < .01), as well as a significant wave by scale interaction (F(20, 4220) = 5.37, p < .01).We conducted t tests for each SECDS individual scale, including the General scale, at each of the five waves to determine if students with complete data for the SECDS individual scales at all five waves were different from the remaining student sample. The results indicated that (a) for only 3 out of 35 t tests (7 SECDS individual scales x 5 waves) were scores for students with complete data significantly different from those for students with data for some of the five waves, a rate not greater than expected by chance, and (b) students with data at all five waves were not significantly different from those students with data only at wave one on any of the SECDS scores.
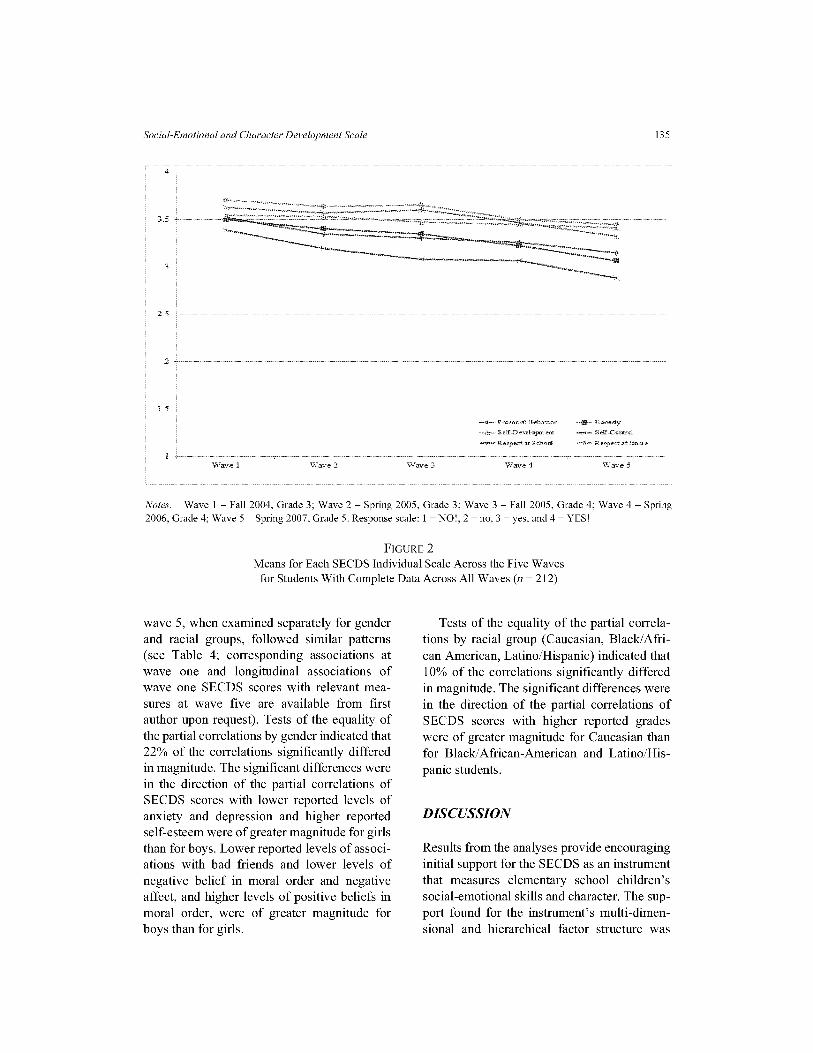
Consistent with the descriptive statistics for SECDS individual scales in Table 2, we observed a developmental level-related pattern of decreasing scores across waves for all scales (see Figure 2). 1 As indicated by the significance of the wave by scale interaction, however, this pattern of scores across scales also varied somewhat across scales. Illustratively, whereas the mean scores for Self-Control and Honesty were only moderately lower than
Journal of Research in Character Education Vol. 9, No. 2, 2013
those for other scales at wave one (i.e., typically less than one-third of a standard deviation), by wave five these differences had grown to a larger margin (i.e., typically more than one-half of a standard deviation). Support for this finding was found in the post hoc pairwise comparisons of the means among the scales indicating that at wave one, three SECDS individual scales (Prosocial Behavior, Honesty, Self-Development) were significantly different from the remaining three SECDS individual scales (Self-Control, Respect at School, Respect at Home), whereas at wave five, all six SECDS individual scales were significantly different from each other. The extent of decline across waves, furthermore, varied across scales, being most marked for Honesty (Cohen's d for correlated data for comparison of wave one and wave five means = .55) and Self-Control (Cohen's d = .53), followed by Prosocial Behavior (Cohen's d = .48), Respect at School (Cohen's d = .41), Respect at Home (Cohen's d = .37), and Self-Development (Cohen's d= .18).
Validity Analyses
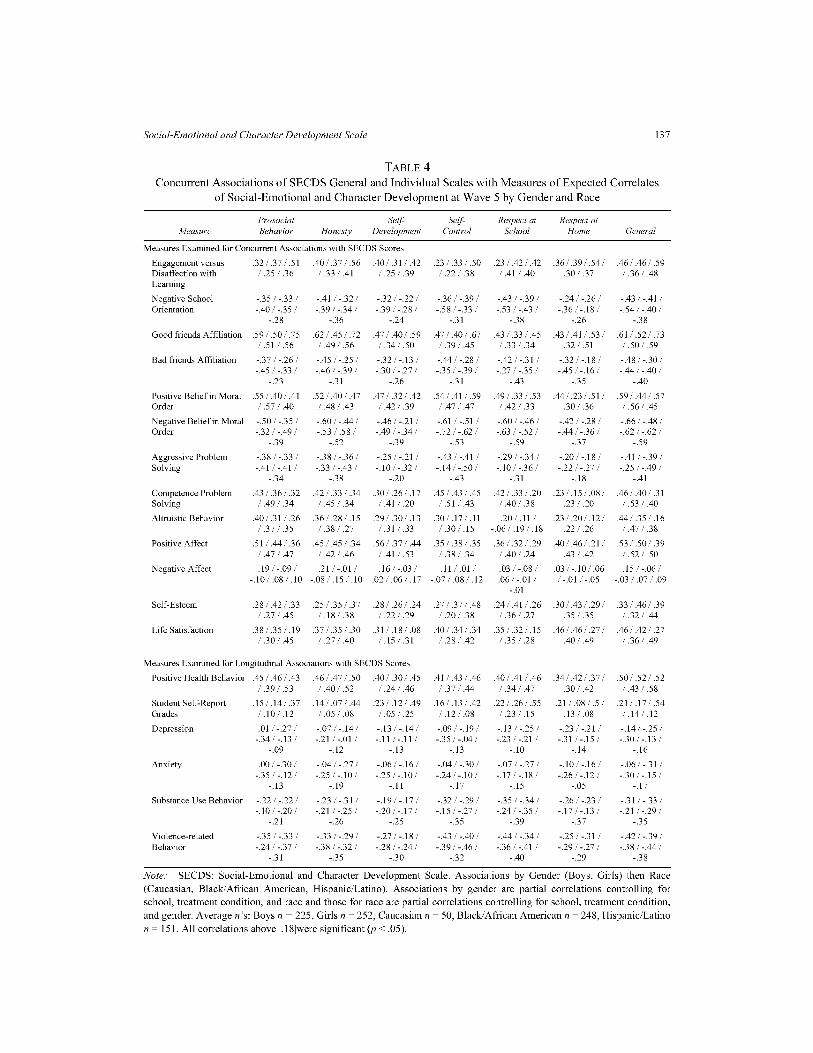
Validity analyses are shown in Table 3. The SECDS individual scales were associated significantly and in expected directions with concurrent measures of anticipated correlates of social-emotional and character development at both wave one and wave five, with the exception of the measure of negative affect. In the longitudinal analyses, the SECDS general scale at wave one also had significant associations in expected directions with outcomes at wave five. SECDS individual scales also had notable longitudinal associations with the same measures. The Self-Development scale had a significant positive association with student self-reported grades, and each of the six individual scales had significant negative associations with the measure of Anxiety and/or at least one of the two measures of risk behav-10rs.
Concurrent associations of SECDS scores with the measures used in validity analyses at
Social-Emotional and Character Development Scale 135
4
3.5
2 5
15
~ P-rc.wc1JI.! B-eha'\'lo1· -m-. Hon.;; sty
Self-De,.10:Iopr.u~ ~Self-Control
""'*""'" Respe-l3tat School Respe·CT at Home
\Vave 1 \.Vave 3
Notes: Wave 1 - Fall 2004, Grade 3; Wave 2 - Spring 2005, Grade 3; Wave 3 - Fall 2005, Grade 4; Wave 4 - Spring 2006, Grade 4; Wave 5 - Spring 2007, Grade 5. Response scale: 1 =NO!, 2 =no, 3 =yes, and 4 =YES!
FIGURE 2 Means for Each SECDS Individual Scale Across the Five Waves
for Students With Complete Data Across All Waves (n = 212)
wave 5, when examined separately for gender and racial groups, followed similar patterns (see Table 4; corresponding associations at wave one and longitudinal associations of wave one SECDS scores with relevant measures at wave five are available from first author upon request). Tests of the equality of the partial correlations by gender indicated that 22% of the correlations significantly differed in magnitude. The significant differences were in the direction of the partial correlations of SECDS scores with lower reported levels of anxiety and depression and higher reported self-esteem were of greater magnitude for girls than for boys. Lower reported levels of associations with bad friends and lower levels of negative belief in moral order and negative affect, and higher levels of positive beliefs in moral order, were of greater magnitude for boys than for girls.
Tests of the equality of the partial correlations by racial group (Caucasian, Black/African American, Latino/Hispanic) indicated that 10% of the correlations significantly differed in magnitude. The significant differences were in the direction of the partial correlations of SECDS scores with higher reported grades were of greater magnitude for Caucasian than for Black/ African-American and Latino/Hispanic students.
DISCUSSION
Results from the analyses provide encouraging initial support for the SECDS as an instrument that measures elementary school children's social-emotional skills and character. The support found for the instrument's multi-dimensional and hierarchical factor structure was
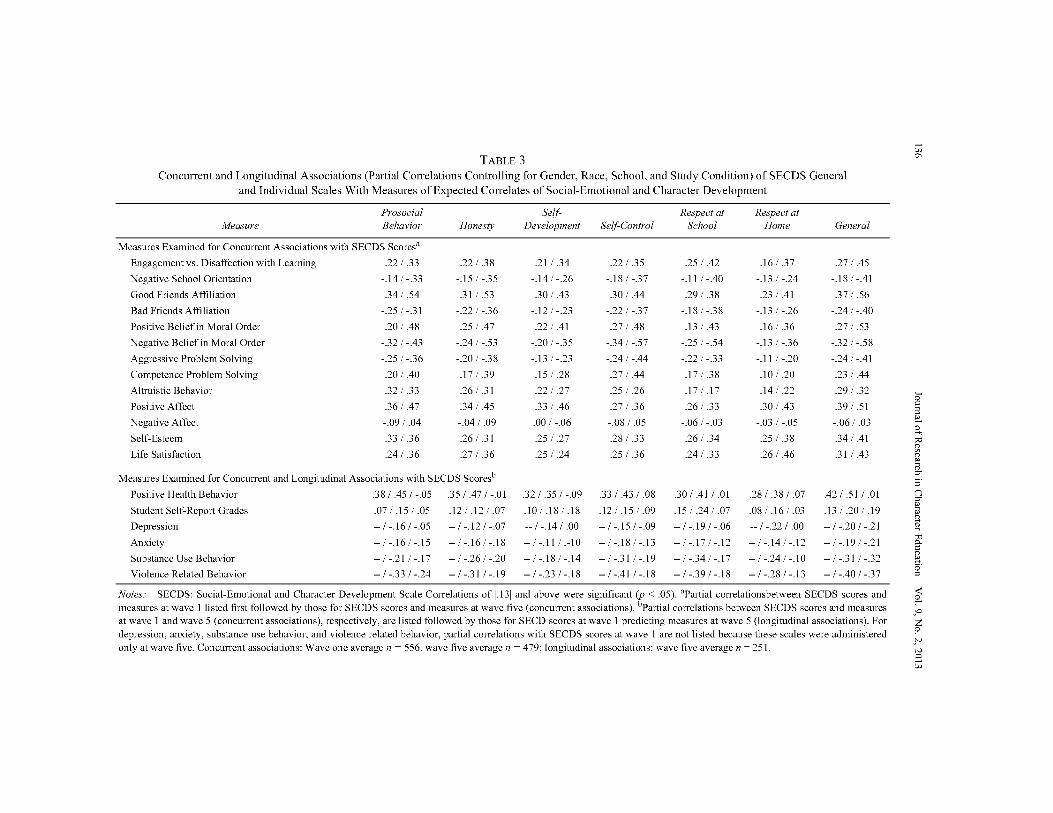
TABLE 3 Concurrent and Longitudinal Associations (Partial Correlations Controlling for Gender, Race, School, and Study Condition) of SECDS General
and Individual Scales With Measures of Expected Correlates of Social-Emotional and Character Development
Prosocial Self- Respect at Respect at Measure Behavior Honesty Development Self-Control School Home General
Measures Examined for Concurrent Associations with SECDS Scores"
Engagement vs. Disaffection with Learning .22 I .33 .22 I .38 .21 I .34 .22 I .35 .25 I .42 .16/ .37 .27 I .45
Negative School Orientation -.14/-.33 -.15/-.35 -.14/-.26 -.18/-.37 -.111-.40 -.13 I -.24 -.18 /-.41
Good Friends Affiliation .34 I .54 .31 I .53 .30 I .43 .30 I .44 .29 I .38 .23 I .41 .37 I .56
Bad Friends Affiliation -.25 I -.31 -.22 I -.36 -.12/-.23 -.22 I -.37 -.18 /-.38 -.13 I -.26 -.24 I -.40
Positive Belief in Moral Order .20 I .48 .25 I .47 .22 I .41 .27 I .48 .13/.43 .16/ .36 .27 I .53
Negative Belief in Moral Order -.32 I -.43 -.24 I -.53 -.20 I -.35 -.34 I -.57 -.25 I -.54 -.13 I -.36 -.32 I -.58
Aggressive Problem Solving -.25 I -.36 -.20 I -.38 -.13 I -.23 -.24 I -.44 -.22 I -.33 -.11 I -.20 -.24 I -.41
Competence Problem Solving .20 I .40 .17/.39 .15 I .28 .27 I .44 .17 I .38 .10 I .20 .23 I .44
Altruistic Behavior .32 I .33 .26 I .31 .22 I .27 .25 I .26 .17 I .17 .14 I .22 .29 I .32
Positive Affect .36 I .47 .34 I .45 .33 I .46 .27 I .36 .26 I .33 .30 I .43 .39 I .51
Negative Affect -.09 I .04 -.04 I .09 .00 I -.06 -.08 I .05 -.06 I -.03 -.03 I -.05 -.06 I .03
Self-Esteem .33 I .36 .26 I .31 .25 I .27 .28 I .33 .26 I .34 .25 I .38 .34/.41
Life Satisfaction .24 I .36 .27 I .36 .25 I .24 .25 I .36 .24 I .33 .26 I .46 .31 I .43
Measures Examined for Concurrent and Longitudinal Associations with SECDS Scoresb
Positive Health Behavior .38 I .45 I -.05 .35 I .47 I -.01 .32 I .35 I -.09 .33 I .43 I .08 .30 I .41 I .01 .28 I .38 I .07 .42 I .51 I .01
Student Self-Report Grades .07/.15/.05 .12 I .12 I .07 .10/.18/.18 .12/.15/.09 .15 I .24 I .07 .08/.16/.03 .13 I .20 I .19
Depression --/ -.16 /-.05 --/ -.12 I -.07 -- I -.14 I .00 --/ -.151-.09 --/-.19/-.06 -- I -.22 I .00 --/ -.20 /-.21
Anxiety --/ -.16 /-.15 --/-.16/-.18 --/ -.11/ .-10 --/ -.18 /-.13 --/-.17/-.12 --/ -.14 /-.12 --/-.19/-.21
Substance Use Behavior --/-.21 /-.17 -- I -.26 I -.20 --/ -.18 /-.14 --/-.31/-.19 --/-.34/-.17 --/ -.24 /-.10 --/-.31 /-.32
Violence Related Behavior -- I -.33 I -.24 -- I -.31 I -.19 --/ -.23 /-.18 --/ -.41/-.18 --/ -.39 /-.18 --/ -.28 /-.13 -- I -.40 I -.37
Notes: SECDS: Social-Emotional and Character Development Scale Correlations of 1-131 and above were significant (p < .05). "Partial correlationsbetween SECDS scores and measures at wave I listed first followed by those for SECDS scores and measures at wave five (concurrent associations). bPartial correlations between SECDS scores and measures at wave I and wave 5 (concurrent associations), respectively, are listed followed by those for SECD scores at wave I predicting measures at wave 5 (longitudinal associations). For depression, anxiety, substance use behavior, and violence related behavior, partial correlations with SECDS scores at wave I are not listed because these scales were administered only at wave five. Concurrent associations: Wave one average n ~ 556, wave five average n ~ 479; longitudinal associations: wave five average n ~ 251.
-w °'
i a 0 ...,,
~ " ~ 5· n """
I ~ ~§
~ ,'-0
z ,:> JV N 0 -w
Social-Emotional and Character Development Scale 137
TABLE 4 Concurrent Associations of SECDS General and Individual Scales with Measures of Expected Correlates
of Social-Emotional and Character Development at Wave 5 by Gender and Race
Prosocial Self- Self- Respect at Respect at Measure Behavior Honesty Development Control School Home General
Measures Examined for Concurrent Associations with SECDS Scores
Engagement versus .32/.37 /.51 .40 I .37 I .56 .401 .31 I .42 .23 I .33 I .50 .23 I .42 I .42 .36/ .39/ .54/ .46 I .46 I .59 Disaffection with I .25 I .36 I .33 I .41 I .25 I .39 I .22 I .38 /.41/.40 .30 I .37 I .36 I .48 Leaming
Negative School -.35 I -.33 I -.41 I -.32 I -.32 I -.22 I -.36 I -.39 I -.43 I -.39 I -.24/ -.26 I -.43 I -.41 I Orientation -.40 I -.35 I -.39 /-.34/ -.39 I -.28 I -.58 I -.33 I -.53 I -.43 I -.36 I -.18 I -.54 I -.40 I
-.28 -.36 -.24 -.31 -.38 -.26 -.38
Good friends Affiliation .59 I .50 I .75 .62 I .45 I .72 .47 I .40 I .59 .47 I .40 I .67 .43 I .33 I .45 .43 I .41 I .53 I .61 I .52 I .73 I .51 I .56 I .49 I .56 I .341 .50 I .39 I .45 I .33 I .34 .32 I .51 I .50 I .59
Bad friends Affiliation -.37 I -.26 I -.45 I -.25 I -.32 I -.13 I -.44/ -.28 I -.42 I -.31 I -.32 I -.18 I -.48 I -.30 I -.45 I -.33 I -.46 I -.39 I -.30/-.27 I -.35 I -.39 I -.27 I -.35 I -.45 I -.16 I -.44 I -.40 I
-.23 -.31 -.26 -.31 -.43 -.35 -.40
Positive Belief in Moral .55 I .40 I .41 .52 I .40 I .47 .47 I .32 I .42 .54 I .41 I .59 .49 I .33 I .53 .44/ .23 I .51 I .59 I .44 I .57 Order I .57 I .40 I .48 I .43 I .42 I .39 /.47/.47 I .42 I .33 .30 I .36 I .56 I .45
Negative Belief in Moral -.50 I -.35 I -.60 I -.44 I -.46 I -.21 I -.61 I -.51 I -.60 I -.46 I -.42 I -.28 I -.66 I -.48 I Order -.32 I -.49 I -.53 I .58 I -.49 I -.34 I -.72 /-.62 I -.63 I -.52 I -.44 I -.36 I -.62 /-.62 I
-.39 -.52 -.39 -.53 -.59 -.37 -.59
Aggressive Problem -.38 I -.33 I -.38 I -.36 I -.25 I -.21 I -.43 I -.41 I -.29 /-.34/ -.201 -.18 I -.41 I -.39 I Solving -.41 I -.41 I -.33 I -.43 I -.10/-.32 I -.14/ -.50/ -.101 -.36 I -.22 /-.27 I -.25 I -.49 I
-.34 -.38 -.20 -.43 -.31 -.18 -.41
Competence Problem .43 I .36 I .32 .42 I .33 I .34 .30/ .26/ .17 .45 I .43 I .45 .42 I .33 I .20 .23 I .15 I .081 .46/ .40/ .31 Solving I .49 I .34 I .45 I .34 I .41 I .20 I .51 I .43 I .401 .38 .23 I .20 I .53 I .40
Altruistic Behavior .40 I .311 .26 .36 I .28 I .15 .291 .301 .13 .30 I .17 I .11 .20 I .11 I .23 I .201 .12/ .44/ .35 I .16 I .37 I .35 I .38 I .27 I .31 I .33 I .30 I .15 -.061 .19/ .18 .22 I .26 I .47 I .38
Positive Affect .51 I .441 .36 .45 I .45 I .34 .56 I .37 I .44 .35 I .38 I .35 .36 I .32 I .29 .401 .461 .21 I .53 I .50 I .39 /.47/.47 I .42 I .46 I .41 I .53 I .38 I .34 I .40 I .24 .43 I .42 I .52 I .50
Negative Affect .19 /-.09 I .21 /-.01 I .16 /-.03 I .11 I .01 I .03 I -.08 I .03 /-.10 I .06 .15 I -.06 I -.10 I .08 /.10 -.08 I .15 I .10 .02 I .06 I .17 -.07 I .08 I .12 .061 -.01 I /-.01 /-.05 -.03 I .07 I .09
-.01
Self-Esteem .28 I .42 I .33 .25 I .35 I .37 .28 I .26 I .24 .27 I .37 I .48 .24 I .411 .26 .30 I .43 I .29 I .33 I .46 I .39 I .27 I .45 I .18 I .38 I .22 I .29 I .20 I .38 I .36 I .27 .35 I .35 I .32 I .44
Life Satisfaction .38 I .35 I .19 .37 I .35 I .30 .31/ .18/ .08 .40 I .34 I .34 .35 I .32 I .15 .46/ .46/ .27 I .46 I .42 I .27 I .30 I .45 I .27 I .40 I .15 I .31 I .28 I .42 I .35 I .28 .40 I .49 I .36 I .49
Measures Examined for Longitudinal Associations with SECDS Scores
Positive Health Behavior .45 I .46 I .43 .46 I .47 I .50 .40 I .30 I .45 .411 .43 I .46 .40 I .411 .46 .34/ .42/ .37 I .50 I .52 I .52 I .39 I .53 I .40 I .52 I .24 I .46 I .37 I .44 I .34 I .47 .30 I .42 I .43 I .58
Student Self-Report .15 I .141 .37 .14/.07 /.44 .23 I .12 I .49 .16 I .13 I .42 .22 I .26 I .55 .21 I .08 I .5 I .21 I .17 I .54 Grades I .IOI .12 I .05 I .08 I .05 I .25 I .12 I .08 I .23 I .15 .13 I .08 I .141 .12
Depression .01 /-.27 I -.07 /-.14/ -.13 I -.141 -.09 I -.19 I -.13 I -.25 I -.23 I -.21 I -.14/ -.25 I -.34/ -.13 I -.21 /-.01 I -.II /-.II/ -.35 I -.041 -.23 I -.21 I -.31 I -.15 I -.30 I -.13 I
-.09 -.12 -.13 -.13 -.10 -.14 -.16
Anxiety .001 -.301 -.04/-.27 I -.061 -.16 I -.04/ -.30/ -.07 /-.27 I -.101 -.16 I -.061 -.31 I -.35 I -.12 I -.251-.101 -.251-.101 -.24/-.10/ -.17 I -.18 I -.26 /-.12 I -.30 I -.15 I
-.13 -.19 -.II -.17 -.15 -.05 -.17
Substance Use Behavior -.221-.221 -.23 I -.31 I -.19/ -.17 I -.32 I -.29 I -.35 I -.34 I -.26 I -.23 I -.31 I -.33 I -.101 -.201 -.21 I -.25 I -.20/-.17 I -.15 I -.27 I -.24 I -.35 I -.17 I -.13 I -.21 /-.29 I
-.21 -.26 -.25 -.35 -.39 -.37 -.35
Violence-related -.35 I -.33 I -.33 I -.29 I -.27 I -.18 I -.43 I -.40 I -.44 I -.34 I -.25 I -.31 I -.42 I -.39 I Behavior -.24/ -.37 I -.38 I -.32 I -.28 /-.24/ -.39 I -.46 I -.36 I -.41 I -.29 /-.27 I -.38 I -.44 I
-.31 -.35 -.30 -.32 -.40 -.29 -.38
Note: SECDS: Social-Emotional and Character Development Scale. Associations by Gender (Boys, Girls) then Race (Caucasian, Black/African American, Hispanic/Latino). Associations by gender are partial correlations controlling for school, treatment condition, and race and those for race are partial correlations controlling for school, treatment condition, and gender. Average n's: Boys n ~ 225, Girls n ~ 252, Caucasian n ~ 50, Black/African American n ~ 248, Hispanic/Latino n ~ 151. All correlations above l.181were significant (p < .05).
138
broadly consistent with prior conceptualizations of SEL and SECD (Denham, 2006, Park & Peterson, 2008; Payton et al., 2000) and, notably, was consistent across waves of assessment that began at a relatively young age (Grade 3) and spanned over three years of development. SECDS general and individual scales aligned with this factor structure demonstrated evidence of both reliability and validity, both for the sample as a whole and for gender and racial demographic groups.
With regard to analyses of the measure's factor structure, the relatively poor fit of the single-factor model suggests that conceptualizing children's social-emotional learning and character development as a unidimensional construct would be an oversimplification. This aspect of our findings is consistent with research that has indicated multidimensionality for other related constructs (e.g., self-concept, self-efficacy) even among younger, elementary school children (Marsh et al., 2006). Perhaps the correlated model did not fit because the intercorrelations among the individual SECDS individual scales were similar and there was no added value for a structural model that simply correlated the individual scales. The multidimensional and secondorder model when viewed together were a better explanation of the variations of SECD, in that, among elementary school children, there were notable differences in the relative levels of the different facets (i.e., individual scales) that comprised SECD, and that the relative consistency in these levels could be accounted for by a single common source of influence.
The reliability analysis indicated that the estimates of internal consistency reliability for the SECDS general and individual scales, with some exceptions, were generally acceptable and consistent across Grades 3 through 5 (waves one through five), gender, and racial groups. The relatively low estimates of reliability for certain SECDS individual scales, and the measures used for the validity analyses, may have contributed to some of the non-significant findings. Some of the lower reliability estimates at Grade 3 (waves one and
Journal of Research in Character Education Vol. 9, No. 2, 2013
two) could possibly be due to the reading level of the instrument, which was slightly higher than Grade 3. The estimates oftest-retest reliability were also acceptable with some exceptions (Honesty and Self-Control scales). The findings supported the robustness of the reliability of the SECDS across different student demographics.
Although support for a multidimensional, hierarchical factor structure of the SECDS was consistent as the study cohort progressed from Grades 3 to 5, there was nonetheless a noteworthy trend of declining scores on all scales, albeit to varying degrees. This finding was consistent with prior research in which measures of behaviors associated with social-emotional and character development have exhibited declines during childhood (Carlo, Crockett, Randall, & Roesch, 2007; Kokko, Tremblay, Lacourse, Nagin, & Vitaro, 2006; Washburn et al., 2011).We also note that in the context of the parent study from which these data were obtained, studies by Lewis et al. (2012) and Washburn et al. (2011) found that (a) scores on the SECDS decreased, and scores from measures of problem behaviors increased during this time frame. These findings suggest that developmentally, it may become more difficult to maintain positive SECD and associated behaviors. Moreover, the pairwise comparison results from the repeated measures ANOV A indicated that there were more scales that were significantly different from each other at wave five than at wave one. This finding suggests that older children were able to discriminate between the different components of SECD. The factors responsible for such trends are not fully understood, but could be associated with advances in the accuracy of children's self-appraisals with age (Denham, Wyatt, Bassett, Echeverria, & Knox, 2009) as well as a tendency for children to face more complex and demanding social-emotional and character challenges as they become older (Washburn et al., 2011). Further research is needed both to further confirm and better understand the apparent trend toward less favorable manifestations of
Social-Emotional and Character Development Scale
social-emotional skills and positive character with age. One useful strategy could be to include measures of SECD from other informants or sources to better understand the role of self-appraisal processes in declines that are evident over time.
It is noteworthy, however, that Positive Action, the SECD-focused intervention implemented by intervention schools involved in the current research, has demonstrated potential both within this trial and others to attenuate a downward trend in student reports of SECD (Lewis et al., 2012; Washburn et al., 2011). Of particular note was that for the present trial these intervention effects were evident on the total score of the SECDS. These results offered support for the ability of the SECDS to be sensitive to effects of school-based interventions focused on promotion of SECD, an important consideration in establishing the utility of any measure within this domain.
The findings from the validity analysis for the outcome variables support the validity of the SECDS. The positive associations between the SECDS and the learning and school orientation variables suggest that students' SECD contributes to academic success. The peer relationships variable was related to the SECDS, which underscored the importance of good social relationships as a contributor of good SECD. The positive associations with the SECDS and the beliefs about society (Moral Order) variables suggested the importance of students' values in forming strong SECD. The SECDS was related to positive problem solving styles, suggesting links between students' ability to make choices and their SECD. The SECDS had moderate associations with measures of Altruistic Behavior, Positive Affect, Self-Esteem and Life Satisfaction. These findings suggested that students with good SECDS had positive outlooks about others, themselves, and their lives. The Negative Affect variable had a non-significant partial correlation, suggesting that different levels of students' SECD did not necessarily mean that students had less negative emotions. On the contrary, having good SECD entailed the sue-
139
cessful management of negative emotions; thus, it may be expected that having good SECD did not necessarily mean that a student would experience less negative emotions. The values of the coefficients were moderate, suggesting that the SECDS was related to, but not equivalent to, these psychological constructs. The findings were similar for waves one (beginning of Grade 3) and five (end of Grade 5), suggesting that they were robust.
The domain-specific factors of the SECDS, that is, the Respect at School and Respect at Home, had lower associations with some of the outcome variables. Some of these lower associations were expected, for example, between Peer Group Affiliation - Good and Bad Friends, and Respect at Home - because the variables asked about two distinct social relationships, peers versus parents. Some of the associations were expected, for example, between Engagement versus Disaffection with Learning and Respect at School, because both variables were related to academics. The findings suggested the importance of including domain-specific factors as part of measuring SECD because students need to demonstrate their SECD within different social contexts. The presence of more fine-grained, context-specific manifestations is an important possibility (e.g., different expressions of honesty at home and at school). We opted, however, not to incorporate this level of specificity into the measure because of our interest in developing a measure that was relatively brief and, thus, suitable for use in a variety of research and applied contexts.
The magnitude of the partial correlations between scores on the SECDS and the variables for the validity analysis varied from small to moderate. As would be expected, the stronger associations generally involved measures of constructs with relatively direct or proximal theoretical relevance to SECD, such as moral values or involvement of friends in positive behaviors, whereas the more weak associations involved measures where this was less the case, such as grades in school.
140
It should be noted that the constructs assessed by the measures included in this study to examine the validity of scores on the SECDS could represent influences on SECD or outcomes influenced by SECD, or both. Future studies could investigate ifthe direction of impacts of SECD and associated variables changes depending on the development level of the student.
The significant associations between the SECDS and some of the outcome variables were encouraging because of their pragmatic implications. The associations with the Positive Health Behavior scale were higher than the other outcome variables. The associations with Student Self-Report Grades, although lower, also had practical implications. This finding suggested that the level of SECD played a role in impacting students' efforts in academic areas. Also encouraging was that the analysis of longitudinal associations indicated that the SECDS general and individual scales, assessed at earlier points in time, could be associated with student outcomes assessed at later points in time. The SECDS individual scales had significant associations in the expected direction with measures of depression, anxiety, frequency of drug use, and violent behaviors. The associations with those measures were somewhat lower than the other outcome variables, suggesting that SECD may have a smaller, but contributing, role in reducing student risk behaviors.
Most of the relationships among the outcome variables with SECDS increased from wave one (beginning of third grade) to wave five (end of fifth grade). This finding could be due in part to the lower reliability of the SECDS individual scales and their associated validity measures at wave one. The validity analysis showed that the domain-specific factors of the SECDS had similar correlations across all the outcomes of SECDS over the five waves, suggesting that while the factors were different at some level, they generally had similar associations with expected outcomes.
Our findings suggested that there might be relatively little loss of information associated
Journal of Research in Character Education Vol. 9, No. 2, 2013
with using only the general scale of the SECDS for many purposes, such as when testing models of potential influences on social-emotional skills and character development or investigating contributions of these skills and behaviors in preventing youth problems. The fit of the second-order factor structure supports the theoretical conceptualizations of SECD (Baumrind, 1998; Ellis, 2009; Park, 2004) that informed the development of the measure, which are consistent with the potential for individual dimensions of SECD to be unified under a single higher-order construct. The score on the SECDS corresponding to this higher-order factor might be understood as an overall orientation of youth to behave in ways that are reflective of social-emotional and character development. Such an orientation could reflect a generalized motivation as well as ability to act in accordance with expectations that are communicated for appropriate and acceptable behavior in school, home, and other contexts as well as a consideration for the needs and welfare of others. One promising direction for future research is to investigate the implications of general tendencies toward high or low levels of SECD in conjunction with profiles of strengths and limitations that youth may exhibit on specific facets of social-emotional skills and character, which clearly could differ significantly across youth who are nonetheless similar in their more general assessed levels of SECD. As in related areas of research, such as self-esteem (DuBois & Tevendale, 1999; Harter, 1999), we expect that there may be greatest utility in approaches that take into account both general and specific facets of SECD. The assessment of both general and specific facets of social-emotional and character development clearly makes the measure well-suited for investigation of this issue.
The results from the examination of the differences among the partial correlations used for the validity analyses yielded some possibilities for investigating how SECD skills and behaviors were associated with outcome variables between genders. Our findings suggested
Social-Emotional and Character Development Scale
that boys and girls had different sources of influence for SECD, and SECD yielded different benefits for boys and girls. There was one pattern that emerged by racial groups, and additional studies could yield meaningful patterns in how student gender or racial group moderates how SECD develops, or how it contributes to outcomes.
It should be noted that the SECD is offered as one of several instruments that measure social-emotional and character development (for a summary of several such instruments and their psychometric properties, see WilsonAhlstrom et al., 2011 ). It is worthwhile to have several validated measures of SECD because no one instrument is likely to be suitable for all student demographics (e.g., different age groups, socioeconomic statuses) nor can a single measure be expected to capture all facets of SECD that may be important for addressing particular research questions. Importantly, the availability of multiple measures ofSECD also provides the opportunity to examine convergence of findings across different instruments, thus facilitating scale validation work as well as development of a robust knowledge base in this area.
Moreover, there are other dimensions of SECD that are of interest (e.g., self-initiative, problem solving skills) thatthis instrument does not assess. Having multiple instruments that measure other SECD dimensions allows researchers to determine the extent to which findings related to SECD are instrument-dependent or generalize across instruments.
Limitations of the Study
This study did not examine the convergent and discriminant associations between the SECDS and other instruments that measure social-emotional learning and character. Future studies could examine the SECDS with other similar instruments (e.g., those listed in Wilson-Ahlstrom et al., 2011) to examine those associations. The validity analyses did not include measures of social desirability as a potential factor in accounting for associations
141
with measures of other constructs. However, to our knowledge, valid measures of social desirability for students at lower elementary grade levels are not available. Thus it might be premature to include such measures to detect the effect of this construct on the validity of students' SECD scores.
The items on the instrument were worded positively. We did not include negatively worded items because of evidence that young children's responses to such items may be influenced by extraneous factors (particularly reading ability), thus comprising their utility (Marsh, 1986). Future versions of the instrument for upper elementary grade levels should consider including such items, however, given their potential value in addressing acquiescent response tendencies. Future versions of the instrument might also explore alternatives to the SECDS 's current 4-point response scale as fewer or additional response options could potentially enhance the measure's reliability or validity.
Because of the shared self-report format of the SECDS and other measures used to investigate the measure's validity in this research, the associations found may be inflated due to shared method variance. Future studies should examine how scores on the SECDS with measures of SECD using alternative reporting formats, such as performance measures, observational ratings, or teacher and parent ratings.
It should be noted that the student sample was predominately minority (African American and Hispanic/Latino) and from low-income areas. The SECDS as a measurement of SECD may not be appropriate for all student populations. Future research can investigate the use of the SECDS for upper grade levels, different racial groups, and different socioeconomic student populations.
SUMMARY
The SECDS appears to be a promising measure of SECD for students in elementary Grades 3 through 5. The factor structure of the
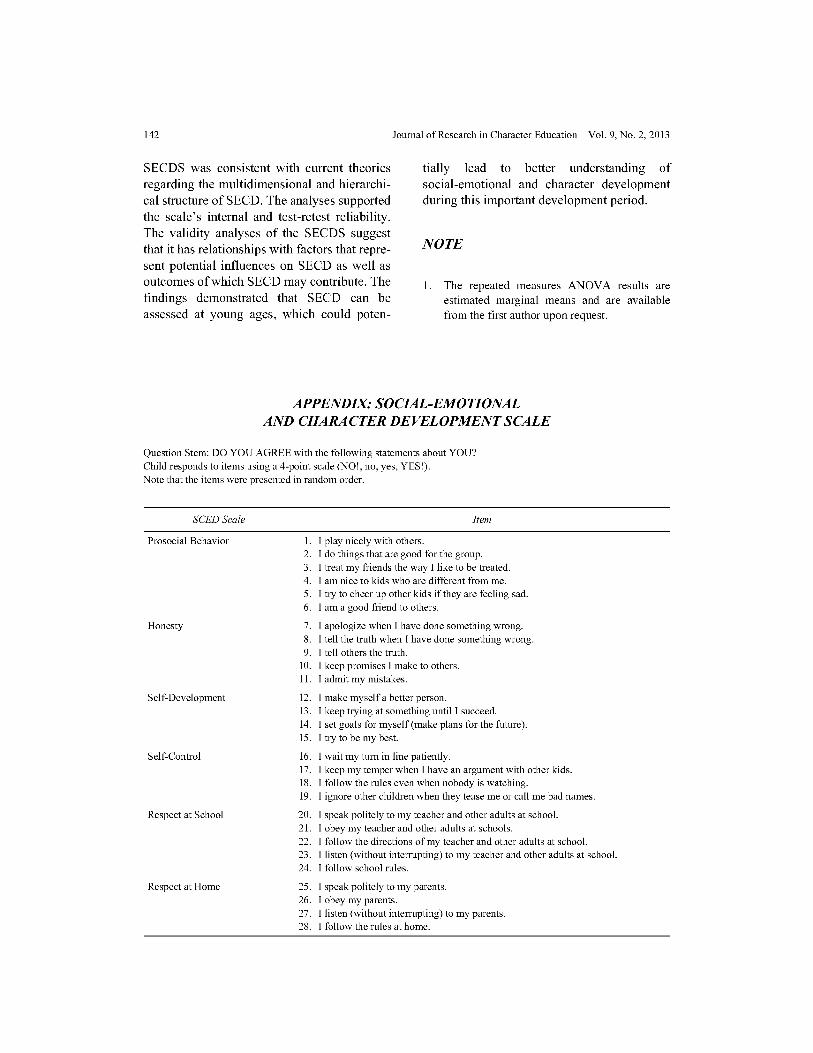
142 Journal of Research in Character Education Vol. 9, No. 2, 2013
SECDS was consistent with current theories regarding the multidimensional and hierarchical structure of SECD. The analyses supported the scale's internal and test-retest reliability. The validity analyses of the SECDS suggest that it has relationships with factors that represent potential influences on SECD as well as outcomes of which SECD may contribute. The findings demonstrated that SECD can be assessed at young ages, which could poten-
tially lead to better understanding of social-emotional and character development during this important development period.
NOTE
1. The repeated measures ANOV A results are
estimated marginal means and are available
from the first author upon request.
APPENDIX: SOCIAL-EMOTIONAL AND CHARACTER DEVELOPMENT SCALE
Question Stem: DO YOU AGREE with the following statements about YOU? Child responds to items using a 4-point scale (NO!, no, yes, YES!). Note that the items were presented in random order.
SCEDScale Item
Prosocial Behavior 1. I play nicely with others. 2. I do things that are good for the group. 3. I treat my friends the way I like to be treated. 4. I am nice to kids who are different from me. 5. I try to cheer up other kids if they are feeling sad. 6. I am a good friend to others.
Honesty 7. I apologize when I have done something wrong. 8. I tell the truth when I have done something wrong. 9. I tell others the truth.
10. I keep promises I make to others. 11. I admit my mistakes.
Self-Development 12. I make myself a better person. 13. I keep trying at something until I succeed. 14. I set goals for myself (make plans for the future). 15. I try to be my best.
Self-Control 16. I wait my turn in line patiently. 17. I keep my temper when I have an argument with other kids. 18. I follow the rules even when nobody is watching. 19. I ignore other children when they tease me or call me bad names.
Respect at School 20. I speak politely to my teacher and other adults at school. 21. I obey my teacher and other adults at schools. 22. I follow the directions of my teacher and other adults at school. 23. I listen (without interrupting) to my teacher and other adults at school. 24. I follow school rules.
Respect at Home 25. I speak politely to my parents. 26. I obey my parents. 27. I listen (without interrupting) to my parents. 28. I follow the rules at home.
Social-Emotional and Character Development Scale
REFERENCES
Aber, J. L., Brown, J. L., Jones, S., & Samples, F. (1995). Adapting measures of children's beliefa, attributions and skills for use in the evaluation of violence prevention projects. Retrieved from http://www.cdc.gov/ncipc/pub-res/pdf/YV I CDC_ YV _ SecIII. pdf
Arthur, M. W., Hawkins, D. J., Catalano, R. F., &
Pollard, J. A. (2000). Item-construct dictionary for the student survey of risk and protective factors and prevalence of alcohol, tobacco, and other drug use. Retrieved from http:// depts.washington.edu/sdrg
Baumrind, D. (1998). Reflections on character and competence. In A. Colby, J. James, & D. Hart (Eds.), Competence and character through life (pp. 1-28). Chicago, IL: University of Chicago Press.
Beets, M. W., Flay, B. R., Vuchinich, S., Snyder, F. J., Acock, A., Li, K. K., ... Dudak, J. (2009). Use of a social and character development program to prevent substance use, violent behaviors, and sexual activity among elementaryschool students in Hawaii. American Journal of Public Health, 99, 1438-1445. doi:l0.2105/ AJPH.2008.142919
Berkowitz, M. W., & Grych, J. H. (2000). Early character development and education. Early Education and Development, 11, 55-72. doi: 10.1177 /0002716203260082
Bierman, K. L., Coie, J. D., Dodge, K. A., Greenberg, M. T., Lochman, J.E., McMahon, R. J., ... Pinderhughes, E. (2010). The effects ofa multiyear universal social-emotional learning program: The role of student and school characteristics. Journal of Consulting and Clinical Psychology, 78, 156-168. doi:l0.1037/ a0018607
Bollen, K. A. (1989). Structural equations with latent variables. New York, NY: Wiley-Intersc1ence.
Bollen, K. A., & Lennox, R. (1991). Conventional wisdom on measurement: A structural equation perspective. Psychological Bulletin, 110, 305-314. doi:l0.1037/0033-2909.110.2.305
Bowers, E. P., Li, Y., Kiely, M. K., Brittian, A., Lerner, J. V., & Lerner, R. M. (2010). The Five Cs model of Positive Youth Development: A longitudinal analysis of confirmatory factor structure and measurement invariance. Journal
143
of Youth and Adolescence, 39, 720-735. doi: 10.1007 /sl 0964-010-9530-9
Brand, S., & Felner, R. D. (1996). Cross-situational inconsistency in behavioral assessments and adaptive patterns of children and youth: The role of ecological congruence across family/school environments. Journal of Community Psychology, 24, 160-174. doi:l0.1002/%28SICI %29 l 520-6629%28l99604%2924:2%3C160:: AID-JCOP6%3E3.0.C0;2-2
Brown, E. C., Low, S., Smith, B. H., & Haggerty, K. P. (2011). Outcomes from a school-randomized controlled trial of Steps to Respect: A bullying prevention program. School Psychology Review, 40, 423-443. doi: 10.1080/00220679809597580
Brown, J. L., & Jones, S. M. (2008). Changing classroom climate and other school micro-contexts to promote children 's social-emotional and academic development: The 4Rs settinglevel study. Unpublished manuscript, Department of Psychology, Fordham University, New York, NY.
Brown, C. H., W. Wang, S. G., Kellam, B. 0., Muthen, H., Petras, P., Toyinbo, J., ... Poduska, N. (2008). Models for testing and evaluating impact in randomized field trials: Intent-to-treat analyses for integrating the perspectives of person, place, and time. Drug and Alcohol Dependence, 95S, S74-Sl04. doi:l0.1016/j.drugalcdep .2007.11.013
Carlo, G., Crockett, L. J., Randall, B. A., & Roesch, S. C. (2007). A latent growth curve analysis of prosocial behavior among rural adolescents. Journal of Research on Adolescence, 17, 301-324. doi: 10. l l l l/j.1532-7795.2007.00524.x
Centers for Disease Control and Prevention. (2004). Methodology of the Youth Risk Behavior Surveillance System, RR-12. Retrieved from Centers for Disease Control and Prevention website: http://www.cdc.gov/HealthyY outh/yrbs/ index.htm
Darlington, R. B. (1990). Regression and linear models. New York, NY: Mcgraw-Hill.
Denham, S. A. (2006). Social-emotional competence as support for school readiness: What is it and how do we assess it? Early Education and Development, 17, 57-89. doi:l0.1207/sl5566 935eedl701 4
Denham, S. A., Wyatt, T. M., Bassett, H. H., Echeverria, D., & Knox, S. S. (2009). Assessing social-emotional development in children from a longitudinal perspective. Journal of Epidemiol-
144 Journal of Research in Character Education Vol. 9, No. 2, 2013
ogy and Community Health, 63, 137-152. doi: 10.1136/jech.2007 .070797
Dishian, T. J., Patterson, G. R., Stoolmiller, M., & Skinner, M. L. (1991). Family, school, and behavioral antecedents to early adolescent involvement with antisocial peers. Developmental Psychology, 27, 172-180. doi:l0.1037/ 0012-1649.27.1.172
DuBois, D. L., Felner, R. D., Brand, S., Phillips, R. S. C., & Lease, A. M. (1996). Early adolescent self-esteem: A developmental-ecological framework and assessment strategy. Journal of Research on Adolescence, 6, 543-579. Retrieved from http://onlinelibrary.wiley.com/journal/ 10.l l l 1/%28ISSN%291532-7795
DuBois, D. L., & Tevendale, H. D. (1999). Self-esteem in childhood and adolescence: Vaccine or epiphenomenon? Applied and Preventive Psychology, 8, 103-117.
Durlak, J. A., Weissberg, R. P., Dymnicki, A. B., Taylor, R. D., & Schellinger, K. B. (2011). The impact of enhancing students' social and emotional learning: A meta-analysis of school-based universal interventions. Child Development, 82, 405-432. doi: 10.l l l 1/j.1467-8624.2010.01564.
Eisenberg, N., Champion, C., & Ma, Y. (2004). Emotion-related regulation: An emerging construct. Merrill-Palmer Quarterly, 50, 236-259. doi: 10.1353/mpq.2004.0016
Eisenberg, N., Hofer, C., & Vaughan, J. (2007). Effortful control and its socioemotional consequences. In J. J. Gross (Ed.), Handbook of emotion regulation (pp. 287-306). New York, NY: Guilford Press.
Elias, M. J. (2009). Social-emotional and character development and academics as a dual focus of educational policy. Educational Policy, 23, 831-846. doi: 10.1177 /0895904808330167
Elias, M. J., & Haynes, N. M. (2008). Social competence, social support, and academic achievement in minority, low-income, urban elementary school children. School Psychology Quarterly, 23, 474-495. doi: 10.1037 /1045-3830.23.4.474
Elias, M. J., Parker, S. J., Kash, V. M.,& Dunkeblau, E. (2007). Social-emotional learning and character and moral education in children: Synergy or fundamental divergence in our schools? Journal of Research in Character Education, 5, 16 7-181. Retrieved from http ://www .infoagepub.com/research-in-charactereducation.html
Elias, M. J., Zins, J.E., Weissberg, R. P., Frey, K. S., Greenberg, M. T., Haynes, N. M., ... Shriver,
T. P. (1997). Promoting social and emotional learning: Guidelines for educators. Alexandria, VA: Association for Supervision and Curriculum Development.
Elliott, D.S., Wilson, W. J., Huizinga, D., Sampson, R. J., Elliott, A., & Rankin, B. (1996). The effects of neighborhood disadvantage on adolescent development. Journal of Research in Crime and Delinquency, 33, 389-426. doi:l0.1177/ 0022427896033004002
Flay, B. R., & Allred, C. G. (2003). Long-term effects of the Positive Action program. American Journal of Health Behavior, 27, S6-S21. doi: 10.5993/AJHB.27. l .s 1.2
Flay, B. R., & Allred, C. G. (2010). The Positive Action Program: Improving academics, behavior and character by teaching comprehensive skills for successful learning and living. In T. Lovat & R. Toomey (Eds.), International handbook on values education and student well-being (pp. 471-501). Dordrecht, The Netherlands: Springer.
Flay, B. R., Allred, C. G., & Ordway, N. (2001). Effects of the Positive Action program on achievement and discipline: Two matched-control comparisons. Prevention Science, 2, 71-89.doi:10.1023/A: 1011591613728
Flay, B. R., Snyder, F, J., & Petraitis, J. (2009). The theory of triadic influence. In R. J. Di Clemente, R. A. Crosby, & M. Kegler (Eds.), Emerging theories in health promotion practice and research (2nd ed., pp. 451-510). San Francisco, CA: Jossey-Bass.
Funk, J., Elliott, R., Bechtoldt, H., Pasold, T., & Tsavoussis, A. (2003). The attitudes toward violence scale. Journal of Interpersonal Violence, 18, 186-196. doi:l0.1177/0886260512447578
Furrer, C., & Skinner, E. (2003). Sense of relatedness as a factor in children's academic engagement and performance. Journal of Educational Psychology, 95, 148-162. doi:l0.1037/0022-0663.95.1.148
Greenberg, M. T., Weissberg, R. P., O'Brien, M. U., Zins, J. E., Fredericks, L., Resnik, H., & Elias, M. J. (2003). School-based prevention: Promoting positive social development through social and emotional learning. American Psychologist, 58, 466-474. doi: 10.1037/0003-066X.58.6-7 .466
Harter, S. (1999). The construction of the self: A developmental perspective. New York, NY: Guilford Press.
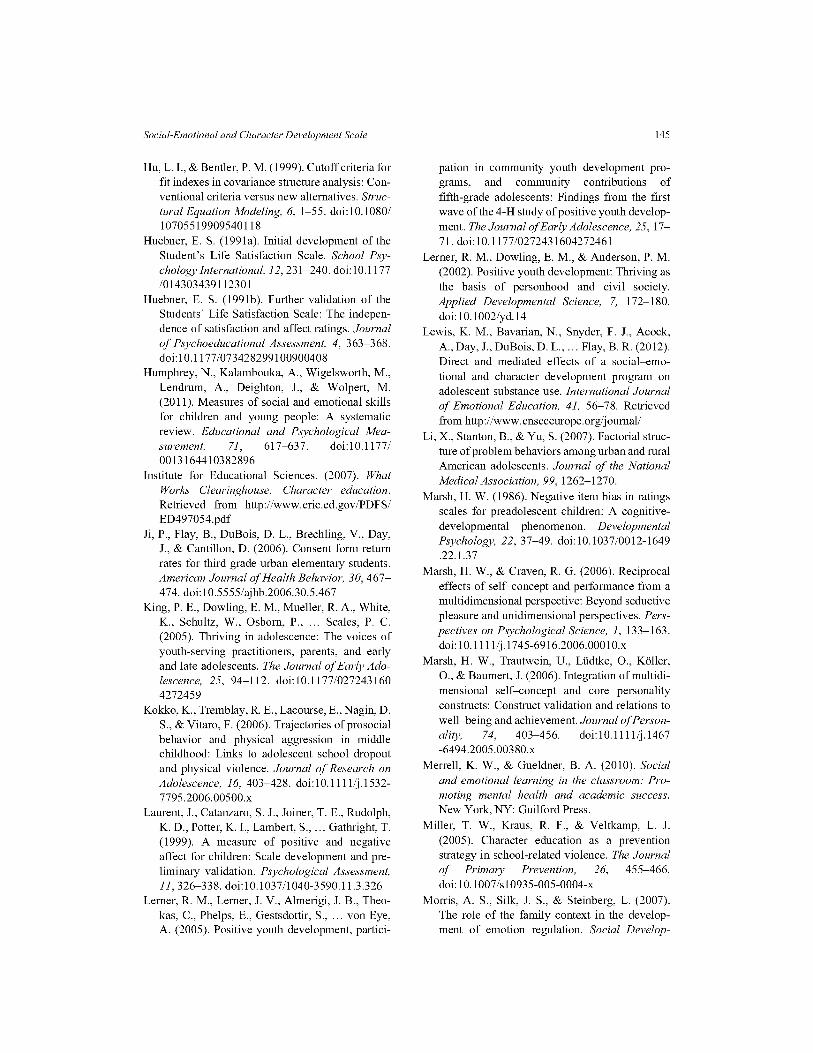
Social-Emotional and Character Development Scale
Hu, L. I., & Bentler, P. M. (1999). Cutoff criteria for fit indexes in covariance structure analysis: Conventional criteria versus new alternatives. Structural Equation Modeling, 6, 1-55. doi:l0.1080/ 10705519909540118
Huebner, E. S. (199la). Initial development of the Student's Life Satisfaction Scale. School Psychology International, 12, 231-240. doi: 10.1177 /014303439112301
Huebner, E. S. (199lb). Further validation of the Students' Life Satisfaction Scale: The independence of satisfaction and affect ratings. Journal of Psychoeducational Assessment, 4, 363-368. doi: 10.1177 /073428299100900408
Humphrey, N., Kalambouka, A., Wigelsworth, M., Lendrum, A., Deighton, J., & Wolpert, M. (2011 ). Measures of social and emotional skills for children and young people: A systematic review. Educational and Psychological Measurement, 71, 617-637. doi: 10.1177 I 0013164410382896
Institute for Educational Sciences. (2007). What Works Clearinghouse: Character education. Retrieved from http://www.eric.ed.gov/PDFS/ ED497054.pdf
Ji, P., Flay, B., DuBois, D. L., Brechling, V., Day, J., & Cantillon, D. (2006). Consent form return rates for third grade urban elementary students. American Journal of Health Behavior, 30, 467-474. doi: 10.5555/ajhb.2006.30.5.467
King, P. E., Dowling, E. M., Mueller, R. A., White, K., Schultz, W., Osborn, P., ... Scales, P. C. (2005). Thriving in adolescence: The voices of youth-serving practitioners, parents, and early and late adolescents. The Journal of Early Adolescence, 25, 94-112. doi:l0.1177/027243160 4272459
Kokko, K., Tremblay, R. E., Lacourse, E., Nagin, D. S., & Vitaro, F. (2006). Trajectories ofprosocial behavior and physical aggression in middle childhood: Links to adolescent school dropout and physical violence. Journal of Research on Adolescence, 16, 403-428. doi: 10. l l l 1/j.1532-7795.2006.00500.x
Laurent, J., Catanzaro, S. J., Joiner, T. E., Rudolph, K. D., Potter, K. I., Lambert, S., ... Gathright, T. (1999). A measure of positive and negative affect for children: Scale development and preliminary validation. Psychological Assessment, 11, 326-338. doi: 10.1037 /1040-3590.11.3.326
Lerner, R. M., Lerner, J. V., Almerigi, J.B., Theokas, C., Phelps, E., Gestsdottir, S., ... von Eye, A. (2005). Positive youth development, partici-
145
pation in community youth development programs, and community contributions of fifth-grade adolescents: Findings from the first wave of the 4-H study of positive youth development. The Journal of Early Adolescence, 25, 17-71. doi: 10.1177 /0272431604272461
Lerner, R. M., Dowling, E. M., & Anderson, P. M. (2002). Positive youth development: Thriving as the basis of personhood and civil society. Applied Developmental Science, 7, 172-180. doi: 10.1002/yd.14
Lewis, K. M., Bavarian, N., Snyder, F. J., Acock, A., Day, J., DuBois, D. L., ... Flay, B. R. (2012). Direct and mediated effects of a social-emotional and character development program on adolescent substance use. International Journal of Emotional Education, 41, 56-78. Retrieved from http://www. enseceurope .org/ journal/
Li, X., Stanton, B., & Yu, S. (2007). Factorial structure of problem behaviors among urban and rural American adolescents. Journal of the National Medical Association, 99, 1262-1270.
Marsh, H. W. (1986). Negative item bias in ratings scales for preadolescent children: A cognitivedevelopmental phenomenon. Developmental Psychology, 22, 37-49. doi:l0.1037/0012-1649 .22.1.37
Marsh, H. W., & Craven, R. G. (2006). Reciprocal effects of self-concept and performance from a multidimensional perspective: Beyond seductive pleasure and unidimensional perspectives. Perspectives on Psychological Science, 1, 133-163. doi: 1O.lll1/j.1745-6916.2006.0001 O.x
Marsh, H. W., Trautwein, U., Ludtke, 0., Koller, 0., & Baumert, J. (2006). Integration of multidimensional self-concept and core personality constructs: Construct validation and relations to well-being and achievement. Journal of Personality, 74, 403-456. doi:l0.1111/j.1467 -6494.2005.00380.x
Merrell, K. W., & Gueldner, B. A. (2010). Social and emotional learning in the classroom: Promoting mental health and academic success. New York, NY: Guilford Press.
Miller, T. W., Kraus, R. F., & Veltkamp, L. J. (2005). Character education as a prevention strategy in school-related violence. The Journal of Primary Prevention, 26, 455-466. doi: 10.1007 /sl 0935-005-0004-x
Morris, A. S., Silk, J. S., & Steinberg, L. (2007). The role of the family context in the development of emotion regulation. Social Develop-
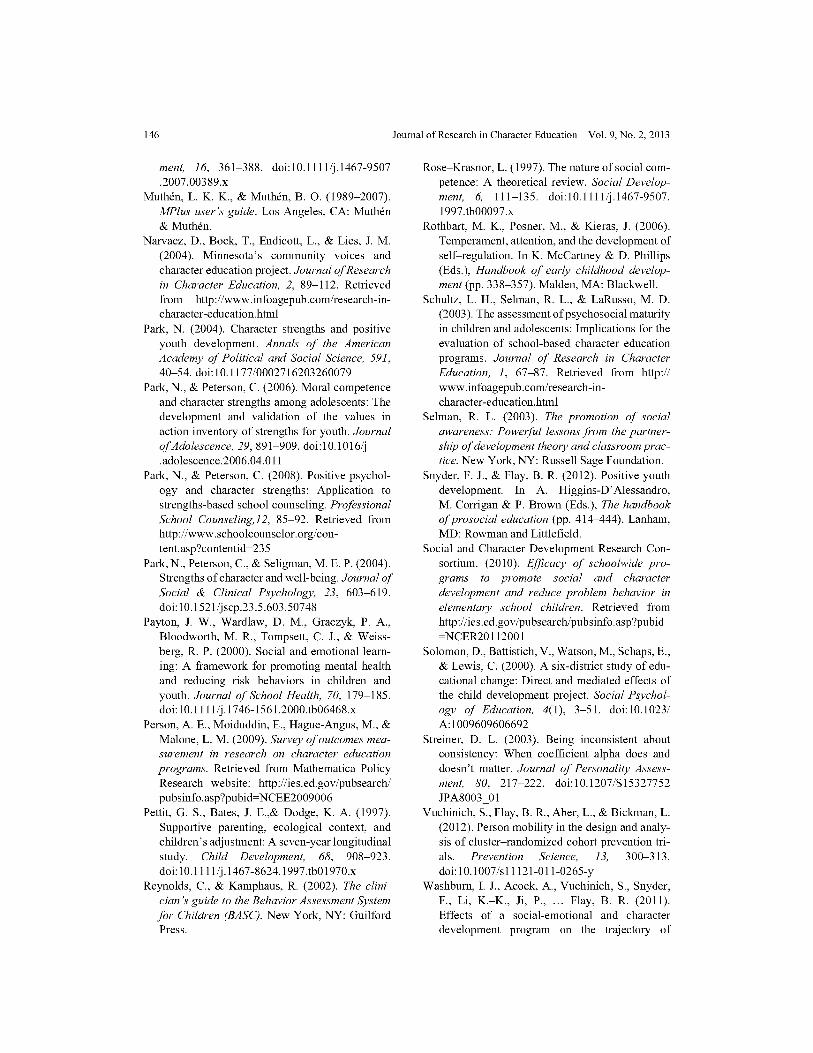
146 Journal of Research in Character Education Vol. 9, No. 2, 2013
ment, 16, 361-388. doi:lO.llll/j.1467-9507 .2007.00389.x
Muthen, L. K. K., & Muthen, B. 0. (1989-2007). MPlus user's guide. Los Angeles, CA: Muthen & Muthen.
Narvaez, D., Bock, T., Endicott, L., & Lies, J. M. (2004). Minnesota's community voices and character education project. Journal of Research in Character Education, 2, 89-112. Retrieved from http://www.infoagepub.com/research-incharacter-education.html
Park, N. (2004). Character strengths and positive youth development. Annals of the American Academy of Political and Social Science, 591, 40-54. doi: 10.1177/0002716203260079
Park, N., & Peterson, C. (2006). Moral competence and character strengths among adolescents: The development and validation of the values in action inventory of strengths for youth. Journal of Adolescence, 29, 891-909. doi:l0.1016/j . adolescence.2006.04.011
Park, N., & Peterson, C. (2008). Positive psychology and character strengths: Application to strengths-based school counseling. Professional School Counseling,12, 85-92. Retrieved from http://www.schoolcounselor.org/ con-tent.asp ?contentid=235
Park, N., Peterson, C., & Seligman, M. E. P. (2004). Strengths of character and well-being. Journal of Social & Clinical Psychology, 23, 603-619. doi: 10. l 521/jscp.23.5.603.50748
Payton, J. W., Wardlaw, D. M., Graczyk, P. A., Bloodworth, M. R., Tompsett, C. J., & Weissberg, R. P. (2000). Social and emotional learning: A framework for promoting mental health and reducing risk behaviors in children and youth. Journal of School Health, 70, 179-185. doi: 10.l l l 1/j.1746-1561.2000.tb06468.x
Person, A. E., Moiduddin, E., Hague-Angus, M., & Malone, L. M. (2009). Survey of outcomes measurement in research on character education programs. Retrieved from Mathematica Policy Research website: http://ies.ed.gov/pubsearch/ pubsinfo.asp?pubid= NCEE2009006
Pettit, G. S., Bates, J. E.,& Dodge, K. A. (1997). Supportive parenting, ecological context, and children's adjustment: A seven-year longitudinal study. Child Development, 68, 908-923. doi: 10. l l l 1/j.1467-8624.1997.tbO1970.x
Reynolds, C., & Kamphaus, R. (2002). The clinician 's guide to the Behavior Assessment System for Children (BASC). New York, NY: Guilford Press.
Rose-Krasnor, L. (1997). The nature of social competence: A theoretical review. Social Development, 6, 111-135. doi:lO.llll/j.1467-9507. 1997. tb00097 .x
Rothbart, M. K., Posner, M., & Kieras, J. (2006). Temperament, attention, and the development of self-regulation. In K. McCartney & D. Phillips (Eds.), Handbook of early childhood development (pp. 338-357). Malden, MA: Blackwell.
Schultz, L. H., Selman, R. L., & LaRusso, M. D. (2003 ). The assessment of psychosocial maturity in children and adolescents: Implications for the evaluation of school-based character education programs. Journal of Research in Character Education, 1, 67-87. Retrieved from http:// www.infoagepub.com/research-incharacter-education.html
Selman, R. L. (2003). The promotion of social awareness: Powerful lessons from the partnership of development theory and classroom practice. New York, NY: Russell Sage Foundation .
Snyder, F. J., & Flay, B. R. (2012). Positive youth development. In A. Higgins-D' Alessandro, M. Corrigan & P. Brown (Eds.), The handbook of prosocial education (pp. 414-444). Lanham, MD: Rowman and Littlefield.
Social and Character Development Research Consortium. (2010). Efficacy of schoolwide programs to promote social and character development and reduce problem behavior in elementary school children. Retrieved from http:/ lies .ed. gov /pubsearch/pubsinfo.asp ?pub id =NCER20112001
Solomon, D., Battistich, V., Watson, M., Schaps, E., & Lewis, C. (2000). A six-district study of educational change: Direct and mediated effects of the child development project. Social Psychology of Education, 4(1), 3-51. doi:l0.1023/ A: 1009609606692
Streiner, D. L. (2003). Being inconsistent about consistency: When coefficient alpha does and doesn't matter. Journal of Personality Assessment, 80, 217-222. doi:l0.1207/Sl5327752 JPA8003 01
Vuchinich, S., Flay, B. R., Aber, L., & Bickman, L. (2012). Person mobility in the design and analysis of cluster-randomized cohort prevention trials. Prevention Science, 13, 300-313. doi: 10.1007 /sl 1121-011-0265-y
Washburn, I. J., Acock, A., Vuchinich, S., Snyder, F., Li, K.-K., Ji, P., ... Flay, B. R. (2011). Effects of a social-emotional and character development program on the trajectory of
Social-Emotional and Character Development Scale
behaviors associated with social-emotional and character development: Findings from three randomized trials. Prevention Science, 12, 314-323. doi:l0.1007/sl 1121-011-0230-9
Weissberg, R. P., & O'Brien, M. U. (2004). What works in school-based social and emotional learning programs for positive youth development. The Annals of the American Academy of Political and Social Science, 591, 86-97. doi: 10.1177 /0002716203260093
Wigelsworth, M., Humphrey, N., Kalambouka, A., & Lendmm, A. (2010). A review of key issues in the measurement of children's social and emotional skills. Educational Psychology in Practice, 26, 173-186. doi:l0.1080/ 02667361003768526
147
Wilson-Ahlstrom, A., Yohalem, N., DuBois, D. L., Ji, P. (2011 ). From soft skills to hard data: Measuring youth program outcomes. Retrieved from The Forum for Youth Investment website: http:/ /www .forumfyi.org/files/Soft_ Skills_ Hard_ Data.pdf
Yu, C. Y. (2002). Evaluating cutoff criteria of model fit indices for latent variable models with binary and continuous outcome (Doctoral dissertation). Retrieved from http://www.statmodel .com/ download/Y udissertation. pdf
Zins, J.E., Weissberg, R. P., Wang, M. C., & Walberg, H. J. (Eds.). (2004). Building academic success on social and emotional learning: What does the research say? New York, NY: Teachers College Press.


![HANGING SCALES/CRANE SCALES - Aviga HFO 159 page 166 1020,-from € Hanging scales/Crane scales Lisa Mayer Product specialist Hanging scales/Crane scales Tel. +49 [0] 7433 9933 - 219](https://img.pdfslide.net/doc/110x75/5afd22507f8b9a68498c727e/hanging-scalescrane-scales-hfo-159-page-166-1020-from-hanging-scalescrane.jpg)