Embed Size (px)
Citation preview

University of South FloridaScholar Commons
Graduate Theses and Dissertations Graduate School
11-6-2014
Social-Emotional Strengths and AcademicOutcomes In Kindergarten StudentsBryan B. BanderUniversity of South Florida, [email protected]
Follow this and additional works at: https://scholarcommons.usf.edu/etd
Part of the Educational Psychology Commons
This Thesis is brought to you for free and open access by the Graduate School at Scholar Commons. It has been accepted for inclusion in GraduateTheses and Dissertations by an authorized administrator of Scholar Commons. For more information, please contact [email protected].
Scholar Commons CitationBander, Bryan B., "Social-Emotional Strengths and Academic Outcomes In Kindergarten Students" (2014). Graduate Theses andDissertations.https://scholarcommons.usf.edu/etd/5448

Social-Emotional Strengths and Academic Outcomes
In Kindergarten Students
by
Bryan B. Bander
A thesis submitted in partial fulfillment of the requirements for the degree of
Education Specialist Department of Educational and Psychological Studies
College of Education University of South Florida
Major Professor: Julia Ogg, Ph.D.
Shannon Suldo, Ph.D. Robert Dedrick, Ph.D.
Date of Approval: November 6, 2014
Keywords: early literacy achievement, early math achievement, kindergarten, social-emotional strengths, strength-based assessment
Copyright © 2014, Bryan B. Bander

ACKNOWLEDGMENTS I would like to express my deepest gratitude to my committee chair, Dr. Julia Ogg, who
has spent countless hours providing me invaluable feedback, assistance, and encouragement in
order to produce high quality research. Without her continued support, this project would not
have been possible. I am extremely grateful for her encouragement and knowledge throughout
this entire process. I would also like to thank my other two committee members, Dr. Shannon
Suldo and Dr. Robert Dedrick for their continued support with this project, and their willingness
to meet and provide feedback whenever needed. I am also extremely grateful for the early
childhood research group, as they provided assistance with the data collection process. Finally, I
am extremely grateful to my family, friends, and colleagues. They have provided me an
abundance of support and encouragement throughout this whole project. They continued to push
me to work harder and to never give up, and for that, I am forever grateful.

i
Table of Contents List of Tables iv Abstract v Chapter I: Introduction 1 Statement of the problem 1 Purpose of the Current Study 4 Definition of Key Terms 5 Early literacy skills 5 Early numeracy skills 5 Social-emotional strengths 5 Social competence 5 Self-regulation 6 Empathy 6 Responsibility 6 Strength-based assessment 6 Research Questions 6 Hypotheses 7 Significance of the Study 9 Chapter II: Review of the Literature 10 Strength-based Assessments 10 Social-Emotional Assets and Resilience 12 Teacher Identification of Key Readiness Skills 13 Links Between Social-Emotional Competence and Positive Outcomes 15 Domains of Social-Emotional Competence 18 Social competence 21 Empathy 24 Self-regulation 27 Responsibility 30 Cross Informant Ratings 33 Summary of the Literature 36 Chapter III: Method 39 Participants 39 Data source 39 Study sample 38 Students 38 Teachers 41 Parents 41 Measures 41 Tests of early literacy 45 Missing number fluency 47
ii
Social Emotional Assets and Resilience Scale – Teacher Short Form (SEARS-T-SF) 48 Parent demographic form 50 Social Emotional Assets and Resilience Scale – Parent (SEARS-P) 50 Data Collection Procedures 51 Data Analyses 55 Preliminary analyses 55 Primary analyses 56 Chapter IV: Results 59 Data Screening 59 Variable Construction 60 SES 60 Early Literacy 60 Early Math Skills 60 SEARS-P Social Competence 60 SEARS-P Self-Regulation/Responsibility 61 SEARS-P Empathy 61 SEARS-P Total 61 SEARS-T Total 61 Screening for Outliers 62 Descriptive Analyses 62 Scale Reliability 63 Correlational Analyses 65 Comparison of U.S. and Canada Data 66 Regression Analyses 75 Research question 1 75 Research question 2 77 Research question 3 78 Research question 4 81 Correlation Analyses 82 Research question 5 82 Z-score for Dependent Correlations Analysis 83 Research question 6 83 Research question 7 83 Chapter V: Discussion 84 Parent Ratings of Social-Emotional Strengths and Academic Outcomes 84 Teacher Ratings of Social-Emotional Strengths and Academic Outcomes 89 Relationship Between Parent and Teacher Ratings of Social-Emotional Strengths 91 Parent and Teacher Ratings of Social-Emotional Strengths as Predictors of Academic Achievement 93 Contributions to the Literature 95 Limitations and Future Directions for Research 97 Implications for School Psychologists 99 References 102 Appendices 112 Appendix A: Parent Demographic Questionnaire 112

iii
Appendix B: Parent Consent Form 115 Appendix C: Verbal Assent Description 118 Appendix D: Teacher Consent Form 119

iv
List of Tables
Table 1. Overlap Between Conceptualizations of Social-emotional Assets 19 Table 2. U.S. School Demographics 42 Table 3. Demographic Features of Student Participants 43 Table 4. Demographic Features of Parent Participants 44
Table 5. Study Assessment Timeline 45
Table 6. Descriptive Statistics for Variables of Interest 64
Table 7. Cronbach’s Alpha (α) for all Measures Utilized in Analyses 65
Table 8. Intercorrelations between Variables 67
Table 9. Descriptive Statistics for U.S. and Canadian Variables of Interest 70 Table 10. Cronbach’s Alpha (α) for all Measures Utilized in Analyses 71
Table 11. Intercorrelations Between Variables for U.S. and Canada 72 Table 12. T-tests for Continuous Variables Between U.S. and Canada Sample 74
Table 13. Summary Analyses for Parent Ratings of Social-Emotional Strengths as Predictors of Early Literacy 77 Table 14. Summary Analyses for Parent Ratings of Social-Emotional Strengths as Predictors of Early Math Skills 79
Table 15. Summary Analyses for Teacher Ratings of Social-Emotional Strengths as Predictors of Early Literacy Skills 80 Table 16. Summary Analyses for Teacher Ratings of Social-Emotional Strengths as Predictors of Early Math Skills 82

v
Abstract
Social-emotional competence has received increased attention as being critical to a
student’s success in the classroom. Social-emotional strengths are multidimensional and include
assets such as social competence, self-regulation, empathy, and responsibility; however, previous
research has not investigated which of these strengths contribute most to a student’s academic
success. Additionally, limited research has investigated the use of multiple informants (e.g.,
parents and teachers) to determine whose perceptions are more predictive of academic
achievement in kindergarten students. This study examined the relationship between social-
emotional strengths, as rated by parents and teachers on the SEARS (Merrell, 2011), and
academic outcomes, using the AIMSweb Tests of Early Literacy (Shinn & Shinn, 2008) and
Missing Number Fluency (Clarke & Shinn, 2004b), in kindergarten students (n = 154). A
moderate, positive relationship between parent and teacher ratings of social-emotional strengths
was obtained. When prior achievement was removed from the regression equation, social
competence, as measured by parents, was the only significant predictor of current achievement in
early literacy. No social-emotional strength, as rated by parents, was a significant predictor of
early math achievement regardless of including or removing prior achievement from the
regression equation. Additionally, teacher-rated total strengths were predictive of current
achievement in reading, when controlling for prior achievement, and for math, when prior
achievement was removed from the equation. Teacher ratings of total strengths were thus found
to be more predictive than parent ratings of academic achievement in reading, but not math.
Implications of findings and suggestions for future research are discussed.

1
Chapter I: Introduction
Statement of the Problem
In the United States there is increasing focus on improving the academic achievement of
all students. With this increased emphasis on improved academic performance, reforms such as
the Common Core State Standards (CCSS) in English/Language Arts and Mathematics have
been developed. As a result of these reforms, academic demands are becoming more rigorous for
young students. With the adoption of the CCSS, students are now being asked to learn more than
90 skills in reading and math, such as to recite letter names, letter sounds, and count to 20, at an
earlier age (Almon & Miller, 2011). As the focus on academic achievement increases, some
early childhood educators are worried about the ability to teach other important developmental
skills, such as appropriate social skills (Zubrzycki, 2011). This is of particular importance given
that past research has demonstrated that teachers believe appropriate social-emotional skills (e.g.,
communicating feeling, working independently, and following rules) are critical for kindergarten
success (Johnson, Gallagher, Cook, & Wong, 1995; Lin, Lawrence, & Gorrell, 2003; Rimm-
Kauffman, Pianta, & Cox, 2000), yet many students lack such skills upon entering kindergarten
(Rimm-Kauffman, et al., 2000). This belief stems from the thought that if students do not possess
the necessary skills to appropriately function in a classroom, they will be unable to successfully
learn the academic curriculum.
Social-emotional strengths are defined as a student’s ability to “manage emotions, care
about others, behave responsibly, and maintain positive interpersonal relationships” (Wilczenski
& Coomey, 2010, p. 1325). Previous research has confirmed beliefs about the importance of

2
social-emotional skills in predicting academic achievement and positive school adjustment
(Denham, 2006; Hair, Halle, Terry-Humen, Lavelle, & Calkins, 2006; Shields et al., 2001).
Students who possess social-emotional competencies, such as relationship skills and problem
solving, tend to be more ready and adjust better to school (Denham, 2006). Moreover, students
with higher social-emotional competence have higher levels of academic achievement
concurrently and in the future (Caprara, Barbaranelli, Pastoralli, Bandura, & Zimbardo, 2000;
Hair et al., 2006; Raver & Knitzer, 2002). Specifically, kindergarten students who have been
rated higher in the domains of social competence (i.e., interpersonal skills) and self-regulation
(i.e., regulating behaviors and emotions) have better academic outcomes in kindergarten, as well
as first and second grade, as compared to their peers who received lower ratings in these domains
(Howse, Lang, Farran, & Boyles, 2003; Ladd, Birch, & Buhs, 1999; O’Neil, Welsh, Parke,
Wang, & Strand, 1997; Shields et al., 2001). Although extensive research has focused on social-
emotional assets such as interpersonal skills, less research has focused on the impact of other
social-emotional strengths, such as empathy and responsible decision making, in kindergarten
students. However, research with older students lends support to the hypothesis that these
domains of social-emotional competence also relate to higher academic outcomes. For example,
in a sample of students between the ages of 8-11 years, Feshbach and Feshbach (1987) reported
that empathy was predictive of higher achievement in reading and spelling for female students.
Given the beliefs held by teachers about the importance of social-emotional skills, and previous
research indicating a positive relationship with academic achievement, additional research is
needed to explore social-emotional strengths in young students. Specifically, with the limited
research on the relationship between responsible decision making and empathy with academic
achievement in kindergarten, future research should include these two constructs.
3
Additional research on student strengths also builds on the movement in the field of
psychology that emphasizes student assets. The field of psychology has traditionally focused on
deficits within a person rather than on their positive characteristics. In the past few decades, the
field has shifted the focus away from solely using a deficit based model to also focusing on
student strengths (Huebner & Gilman, 2003; Seligman & Csikszentmihalyi, 2000). To represent
the importance of measuring both positive and negative characteristics in students, a dual factor
model has been introduced that proposes that students can fall in to one of four categories
(complete mental health, or high subjective well-being and low psychopathology; symptomatic
but content, or high levels of both wellness and psychopathology; vulnerable, or low levels of
both subjective well-being and psychopathology; and troubled, or low levels of wellness and
high levels of psychopathology) as opposed to the two categories (complete mental health and
troubled) proposed by traditional views (Antaramian, Huebner, Hills, & Valois, 2010; Suldo &
Shaffer, 2008). Specifically, this view holds that positive indicators such as life satisfaction can
co-occur with psychopathology rather than being on opposite ends of the continuum (Antaramian
et al., 2010; Suldo & Shaffer, 2008). Additionally, research has shown that students with higher
levels of positive life indicators, such as life satisfaction, have better outcomes in various areas
(e.g., academics, physical health) regardless of their levels of psychopathology (Antaramian et
al., 2010; Suldo & Shaffer, 2008).
It is clear that there is a need to better understand how student strengths relate to
outcomes in young students. As the field of school psychology moves towards a model of
prevention and intervention, focusing on a student’s strengths can then help inform interventions
based on building upon those strengths or competencies (Jimerson, Sharkey, Nyborg, & Furlong,
2004).
4
Purpose of the Current Study
The purpose of the current study was to contribute to a growing literature base and
inform prevention and interventions efforts based on the relationship between kindergarten
students’ social-emotional strengths and achievement in reading and math. Although previous
literature has shown a positive relationship between student social-emotional strengths and
academic achievement, most research has focused on a broad definition of social-emotional
competence, or has focused on only one aspect or domain of social-emotional competence.
Therefore, the current study adds to the literature by using a multidimensional scale measuring
key constructs of social-emotional strengths to determine which, if any, may be more strongly
related to academic achievement. In terms of academic success, most previous research has
focused on broad measures of academic outcomes, such as letter grades and standardized tests, as
opposed to measures that assess key basic early reading and numeracy skills that are sensitive to
growth across the academic year. To address this gap, the current study measured reading and
math outcomes using curriculum-based measures, which provide a more detailed picture of
specific early numeracy and literacy skills (Shinn, 2008).
Additionally, the current study examined the relationship between cross informant ratings
(i.e., parents and teachers) of kindergarten students’ total strengths. Previous studies examining
relationships between kindergarten students’ social-emotional assets and academic achievement
typically have only used one rater (Hair et al., 2006), or have used two raters within the same
setting (teacher and peers; Caprara et al., 2000). Examining ratings by multiple informants across
settings allowed for the examination of the level of agreement between raters and whether parent
or teacher ratings are more predictive of academic outcomes. This could provide insight for
practitioners in considering ratings from multiple sources.

5
Definition of Key Terms
Early literacy skills. Early literacy skills have been defined as critical pre-reading skills,
such as phonemic awareness and phonics (e.g., the ability to name letters, provide the sounds of
letters, and read nonsense words; National Reading Panel, 2000). In the present study, early
literacy skills referred to the student’s fluency in accurately identifying letter names and letter
sounds. Specifically, letter naming and letter sound scores were combined by taking the average
of the two to yield one early literacy score.
Early numeracy skills. Early numeracy skills refer to a set of skills at the early stages of
the development of number sense, including understanding the meaning of numbers, and the
different relationships among numbers (Clarke & Shinn, 2004a). For the current study, early
numeracy skills referred to the student’s fluency in accurately identifying the missing number in
an order of three consecutive numbers.
Social-emotional strengths. Social-emotional strengths are a student’s ability to
“manage their emotions, care about others, behave responsibly, and maintain positive
interpersonal relationships” (Wilczenski & Coomey, 2010, p. 1325). In the present study, the
level of students’ social-emotional strengths was specifically measured in four different domains
(social competence, self-regulation, empathy, and responsibility).
Social competence. Social competence is defined as a student’s “ability to maintain
friendships with his or her peers, engage in effective verbal communication, and feel comfortable
around groups of peers” (Merrell, 2011, p. 3). Some examples of items measuring this construct
include “Makes friends” and “Is comfortable talking to others” and “Is comfortable working in
groups” (Merrell, 2011, p. 59).

6
Self-regulation. Self-regulation is defined as a student’s “self-awareness, metacognition,
interpersonal insight, self-management, and direction” (Merrell, 2011, p. 3). Examples of items
measuring this construct include “Can calm down when upset” and “Stays in control” (Merrell,
2011, p. 59).
Empathy. Empathy is defined as the student’s “ability to understand and relate to others’
situations and feelings” (Merrell, 2011, p. 3). Examples of items measuring empathy include
“Cares what happens” and “Tries to help others” (Merrell, 2011, p. 59).
Responsibility. Responsibility is defined as a student’s “ability to accept responsibility,
behave conscientiously and ability to think before acting” (Merrell, 2011, p. 3). Some examples
of items measuring this construct include “Accepts responsibility” and “I trust her/him” (Merrell,
2011, p. 59).
Strength-based assessment. Strength-based assessments refer to assessments that
measure the emotional and behavioral skills, competencies, and positive characteristics of
students (Cohn, Merrell, Felver-Grant, Tom, & Endrulat, 2009; LeBuffe & Shapiro, 2004).
Research Questions
To investigate the relationship between social-emotional strengths and academic
achievement for kindergarten students, the following research questions were examined:
1. To what extent do parent ratings of students’ social-emotional strengths predict early
literacy skills at the end of kindergarten, while taking into account early literacy
scores at the beginning of kindergarten?
a. Specifically in the domain of social competence?
b. Specifically in the domain of self-regulation/responsibility?
c. Specifically in the domain of empathy?
7
2. To what extent do parent ratings of students’ social-emotional strengths predict early
numeracy skills at the end of kindergarten, while taking into account early math
scores at the beginning of kindergarten?
a. Specifically in the domain of social competence?
b. Specifically in the domain of self-regulation/responsibility?
c. Specifically in the domain of empathy?
3. To what extent do teacher ratings of student’s social-emotional strengths (i.e., total
strengths score) predict early literacy skills at the end of kindergarten, while taking
into account early literacy scores at the beginning of kindergarten?
4. To what extent do teacher ratings of student’s social-emotional strengths (i.e., total
strengths score) predict early numeracy skills at the end of kindergarten, while taking
into account early numeracy scores at the beginning of kindergarten?
5. To what extent are parent ratings of students’ total strength related to teacher ratings
of students’ total strengths?
6. Do parent or teacher ratings of social-emotional strengths better predict kindergarten
student outcomes in early literacy?
7. Do parent or teacher ratings of social-emotional strengths better predict kindergarten
student outcomes in early numeracy?
Hypotheses
Regarding research questions 1 through 4, it was hypothesized that students’ social-
emotional strengths (i.e., social competence, empathy, self-regulation, responsibility) will have a
positive relationship with higher reading and mathematics achievement scores in kindergarten.
This hypothesis is based on previous research that suggests social-emotional strengths are

8
positively related to higher math and achievement scores (Denham et al., 2003; Hair et al., 2006).
In terms of which construct of social-emotional skills will relate more strongly with reading and
math scores, given that more research has been conducted in examining social competence and
self-regulation, as compared to empathy and responsibility, it was hypothesized that social
competence and self-regulation would be more strongly related to academic achievement.
Additionally, given McClelland, Acock, and Morrison’s (2006) line of research, which states that
work-related social-skills (self-regulation, responsibility) were predictive of early academic
achievement but not interpersonal skills, it was hypothesized that self-regulation/responsibility
would have an even stronger relationship than social-competence. Moreover, given the strong
belief held by kindergarten teachers about the importance of social-emotional strengths, it was
hypothesized that the relationship between social-emotional strengths and academic outcomes
would be even stronger in young students as opposed to those found in previous literature on
older students.
Regarding research question 5, it was hypothesized that parent ratings of kindergarten
student total strengths will have a moderate, positive relationship with teacher ratings of
students’ total strengths. This hypothesis was based on previous research suggesting that ratings
of students’ social-emotional functioning by cross informants (specifically parents and teachers)
tend to show a moderate correlation (Crane, Mincic, & Winsler, 2011; Renk & Phares, 2004).
Finally, regarding research questions 6 and 7, it was hypothesized that teacher ratings of social-
emotional strengths will be more predictive of academic outcomes in kindergarten students
compared to parent ratings. This hypothesis is based on previous research that has used teacher
ratings as opposed to parent ratings (Caprara et al., 2000; Hair et al., 2006; O’Neil, Welsh, Parke,
9
Wang, & Strand, 1997), as well as the fact that both the teacher ratings of social-emotional
strengths and academic outcomes occur in the same setting.
Significance of the Study
This study contributes to the literature in several ways. First, it adds to the literature by
including a multidimensional assessment tool to identify which social-emotional competencies
are most strongly related to academic achievement in kindergarten students. The current
literature indicates that a focus on strength-based assessments can inform interventions by
identifying strengths that can be built upon (Jimerson et al., 2004). By examining which social-
emotional competency is most related to academic achievement in kindergarten students,
findings provide insight into which areas may be the most potent in terms of intervention.
Second, few studies have used multiple informants from across settings (e.g., teachers
and parents), and past research has typically only used teachers as raters, or raters from the same
setting (teachers and peers). Therefore, the current study adds to the literature by including
ratings from both teachers and parents, as the past research on parent-teacher agreement has
focused much of its attention on deficit based-assessments. Also the use of multiple informants
adds to the literature by providing data on which informant (parent or teacher) better predicts
student’s outcomes. This information may also help provide more insight into comparing
findings from studies that rely on ratings from one informant. Also by examining which
informant better predicts student outcomes, school psychologists can make better informed
decisions about the assessment of their students, and whose ratings may yield more predictive
results.

10
Chapter II: Literature Review
This chapter begins with a discussion of the literature reviewing the movement away
from a disease or deficit based model in psychology toward a positive psychology model, which
emphasizes the importance of using strength-based assessments. This movement is based on
research that suggests only focusing on psychopathology does not fully represent a child, such
that students who have low levels of psychopathology can also have low levels of positive
indicators, such as life satisfaction (Suldo & Shaffer, 2008). Next, social-emotional assets and
strengths are discussed as they relate to students’ development, followed by descriptions of each
of the four main strengths that will be examined in this study: social competence, self-
regulation, responsibility, and empathy. The importance of these constructs as they relate to
academic achievement will then be discussed. Next research comparing parent and teacher
ratings of social-emotional assets and resilience will be reviewed. Finally, the need for the
current study is discussed.
Strength-Based Assessment
Historically, the field of psychology has focused on an individual’s deficits rather than
focusing on positive attributes. Furthermore, psychology has long focused on ways to heal a
person or solve their problems rather than on the prevention of problems and building of
character strengths (Seligman & Csikszentmihalyi, 2000). Focusing attention on pathology rather
than positive attributes yields the false notion that wellness is simply the absence of disease
symptoms. Within the last twenty years, the field of positive psychology has emerged (Huebner
& Gilman, 2003; Seligman & Csikszentmihalyi, 2000). Research in this area supports the change

11
from focusing solely on healing from the worst things in life to focusing on building positive
traits in life (Seligman, 2002).
Traditional views of mental health place psychopathology and happiness on a continuum,
each represented on opposite ends. Specifically, two groups were identified; those with low
levels of psychopathology and high levels of life satisfaction (complete mental health), and those
with high levels of psychopathology and low level of life satisfaction (troubled). In contrast with
this traditional model of mental health, a dual-factor model proposes that high life satisfaction
can co-occur with psychopathology (Antaramian, Huebner, Hills, & Valois, 2010; Greenspoon &
Saklofske, 2001; Suldo & Shaffer, 2008). This model includes two categories beyond those
described in a traditional model (e.g., complete mental health or troubled). Specifically two
additional categories exist: a person may have both low levels of psychopathology and low levels
of life satisfaction (vulnerable) or high levels of both psychopathology and life-satisfaction
(symptomatic but content). Additionally, these positive characteristics have been shown to be
associated with positive outcomes. More specifically, students with higher ratings of life
satisfaction are more successful academically, and report higher levels of social support
(Antaramian et al., 2010; Suldo & Shaffer, 2008)
Given the empirical evidence that positive qualities and desirable outcomes (i.e.,
academic achievement) have been linked together there is a growing need for assessment tools
that provide information about student strengths (Beaver, 2008; Cohn et al., 2009). Strength-
based assessment is not a novel idea, but as evidence grows about the gaps in solely using
deficit-based assessments, researchers are continuing to seek new methods of assessment (Cohn
et al., 2009). Assessments based on strengths measure skills, competencies, and positive
characteristics (Cohn et al., 2009; LeBuffe & Shapiro, 2004), and can help inform interventions

12
based on building the strengths of students (Jimerson et al., 2004). The rationale for strength-
based assessments is based on four main principles: (1) all children possess strengths, (2) by
focusing on strengths, motivation and behavior improves, (3) a deficiency in a skill is an
opportunity to learn a skill, and (4) families are more likely to be involved in intervention plans
built on strengths (Epstein, Dakan, Oswald, & Yoe, 2001). By focusing on students’ positive
attributes, we move away from the historically used disease focused model in which we wait for
students to fail in order to provide them with the necessary supports to succeed. Rather, a
prevention focused model is emphasized where the focus is on building a student’s strengths in
order to serve as protective factors against challenges (Jimerson et al., 2004; Lebuffe & Shapiro,
2004). As the field of school psychology moves towards focusing our attention on a prevention
model, continuing the use of assessments solely based on weaknesses will not allow us to make
the necessary strides to prevent student’s struggles (Nickerson, 2007). Instead, a perspective
focused on building competencies in students will help our profession move in the direction of
preventing student struggles before they become too severe.
Social-Emotional Assets and Resilience
This section provides relevant information about the importance of measuring one
domain of student strengths: social-emotional competencies. First, the definition of student
strengths and social-emotional competencies will be discussed. Next, evidence to support the
importance of social-emotional assets in young children is provided. This evidence comes from
two lines of research. The first area of research is beliefs held by teachers regarding essential
school-readiness skills. The second line of research comes from evidence demonstrating the
relationship between social-emotional assets and enhanced academic outcomes.
13
Student strengths encompass a variety of skills, including academic, social, emotional,
and behavioral assets. Researchers have recognized the importance of social functioning as being
critical to a student’s success in school, and that social emotional competence is an important
predictor of academic achievement (Diperna & Elliot, 2002). In defining social-emotional
strengths, there has been a wide variety of definitions used. Social-emotional competencies can
be defined as a student’s ability to “manage emotions, care about others, behave responsibly, and
maintain positive interpersonal relationships” (Wilczenski & Coomey, 2010, p. 1325). Such
characteristics include interpersonal skills (positive relationships with peers and adults), social
support, empathy, problem solving, emotional competence and communicating emotions, self-
concept, self-management, social independence, ability to listen and be attentive, and resilience
(Merrell, 2011; Shonkoff & Philips, 2000). Two lines of research have supported the importance
of social emotional assets in young children. The first is that teachers identify these skills as
very important for school readiness, and believe they should be taught in the kindergarten
classroom. The second area of research links social emotional assets to other key desired
outcomes (e.g., achievement).
Teacher Identification of Key Readiness Skills
With the increased emphasis on prevention and early intervention, there has been a focus
on assessing children’s social-emotional behavior at an earlier age (Gagnon, Nagle, &
Nickerson, 2007). In fact, research has indicated that kindergarten teachers believe that social
skills are more important for a child’s development and school readiness than academic skills
(Johnson, Gallagher, Cook, & Wong, 1995; Lin, Lawrence, & Gorrell, 2003; Rimm-Kauffman,
Pianta, & Cox, 2000). Kindergarten teachers have consistently emphasized the importance of
following rules, working independently, playing well with others, communicating their feelings,

14
and demonstrating positive social skills in order to do well (Johnson et al., 1995; Lin et al.,
2003). In a study conducted by Johnson et al. (1995), 176 kindergarten teachers rated various
skills in which they deemed important for kindergarten. Of the 149 skills ranked by the teachers,
22 were identified as being important for the transition to kindergarten. From the 22 identified
skills, those pertaining to independence were rated the highest. In addition, 32%, or 7 of the 22
skills, were categorized in the social domain, and included following classroom rules and
working independently. Additionally, communication skills were rated highly by teachers.
Conversely, teachers did not rate academic readiness skills as greatly important. Only 14%, or 3
of the 22 skills, were categorized in the academic domain.
In a study conducted by Lin et al. (2003), teacher data from the ECLS-K was used to
investigate teacher beliefs about the most important skills for school readiness. Specifically,
teacher beliefs were differentiated by two constructs, academic expectations (e.g., knows
colors/shapes, counts to 20, knows most alphabet, and use pencil/brush) and social expectations
(e.g., finishes task, takes turns/shares, problem solving, not disruptive, sensitive to others, sits
still and alert, knows English, tells needs/thoughts, and follows directions). Results of this study
indicated that teachers are mostly concerned with their students’ social development in terms of
school readiness as opposed to their academic skills. Specifically, of the 13 skills rated as
important by teachers, the top eight skills fell under the social behaviors domain. Conversely,
academic skills occupied four of the five lowest rankings skills as rated by kindergarten teachers.
This research on teachers’ beliefs of important skills kindergarten students must possess
is particularly important as past research has suggested that many students entering school do not
possess the necessary social emotional skills (Rimm-Kauffman, et al., 2000). Specifically,
Rimm-Kauffman et al. (2000) conducted a study with 3,595 kindergarten teachers. They found

15
that over one-third of kindergarten teachers indicated about half of their class, or more, entered
kindergarten with a specific problem, including following directions and working independently.
Of these problems, difficulty following directions was the highest, with about 46% of teachers
reporting half or more of their students possessing this difficulty.
Links Between Social-Emotional Competence and Positive Outcomes
In support of teacher’s assertions that these skills are important, research supports the
notion that social-emotional competence contributes to a student’s school adjustment and school
readiness (Denham, 2006; Hair et al., 2006; Shields et al., 2001). This second line of research
highlighting the importance of social emotional strengths indicates a positive relationship
between social-emotional competencies and academic achievement (Denham et al., 2003; Hair et
al., 2006). Additionally, it has been shown that student social-emotional strengths provide
information that is important above and beyond just understanding their deficits in this area. For
example, aggression, a negative indicator of social-emotional competency, had a concurrent
negative relationship with academic achievement, but did not predict later academic achievement
(Caprara, Barbaranelli, Pastoralli, Bandura, & Zimbardo, 2000), while competencies related to
social competence and emotional and behavioral regulation have been shown to be related to and
predict later higher academic achievement scores (Caprara et al., 2000; Denham, 2006; Elias,
2004; Hair et al., 2006; Raver & Knitzer, 2002).
The following section outlines research supporting the importance of examining the
relationship between social-emotional competence and academic achievement in young students,
and more specifically, kindergarten students. The studies highlighted in this section represent key
studies and findings that examine the relationship between social-emotional strengths and
academic achievement among younger students. In this section, social-emotional competence is

16
broadly defined; however, a more in depth review of the relationships between specific social-
emotional competencies and achievement will be discussed in a later section.
Caprara et al. (2000) conducted a study to examine the relationship between early
prosocial behaviors and student academic achievement over a five year span. A total of 294 third
grade students from Rome, Italy were included in this sample. Measures included self-report
ratings, ratings from their peers, and teacher ratings on their degree of helpfulness, sharing,
kindness, and cooperativeness. Results indicated that students who have higher social-emotional
assets had higher levels of academic achievement. Specifically, findings showed that students’
prosocial behavior (i.e., cooperativeness, kindness, helpfulness, and ability to console) predicted
higher levels of academic achievement, both concurrently and in later grades.
Hair et al. (2006) examined multiple aspects of school readiness, including
social/emotional strengths of kindergarten students and how these patterns predicted first grade
outcomes. Data was used from the Early Childhood Longitudinal Study-Kindergarten class of
1998-1999 (n = 17,219) in which social emotional development was measured by teacher’s
reports of a student’s level of self-control. Findings indicated that language and cognitive skills
are not the only factors that predict later academic success. Even when language and cognitive
abilities were taken in to account, those students with the lowest math and readings scores in first
grade demonstrated below average abilities in social-emotional skills (i.e., self-control) in
kindergarten.
Several narrative reviews in the literature have also addressed the relationship between
social-emotional assets and school readiness. A policy report by Raver and Knitzer (2002)
examined research on the social-emotional development in young students, and how these skills
are related to their school readiness and academic achievement. Specifically, these authors

17
reviewed literature on emotion regulation, social competence, antisocial behaviors, and academic
success. Based on their review of the literature they suggested that there is a connection between
social-emotional competence and academic achievement, such that, social-emotional competence
in the preschool years predicts higher academic achievement in the first grade. Specifically,
young students are more likely to succeed in their transition to school, and have higher academic
outcomes if they possess the ability to relate to their peers and teachers in positive ways, identify
and manage their feelings, and work attentively, cooperatively, and independently.
Denham (2006) also conducted a narrative review of the literature exploring many facets
of social emotional competencies related to school readiness. Specifically, the author reviewed
literature relevant to social relationship skills (e.g., taking turns, seeking help, joining others in
small group), social problem solving (ability to think about social interactions and make
responsible decisions), and emotional and behavioral regulation (controlling, adapting,
inhibiting, and improving one’s emotions and behaviors). Based on her review, Denham
concluded that each competency was related to a student’s school readiness (e.g., readiness to
learn, teachability) and is important to assess for in early childhood. Denham did not provide
information on which domain of social-emotional competence was most strongly associated with
school readiness.
In sum, there is evidence that social-emotional strengths are important in kindergarten
students, and that there is a positive relationship between student’s school readiness and
academic outcomes with social emotional competence in young students. Specifically, studies
have found that students with higher levels of social emotional competence are more ready for
school, adjust better to the school setting, and achieve higher academic success (Denham, 2006;
Hair et al., 2006; Raver & Knitzer, 2002).

18
Domains of Social/Emotional Competence
There are many skills and competencies to consider when exploring social and emotional
development in children. Of the many facets of social and emotional development, Zins,
Bloodworth, Weissberg, and Walberg (2007) identified five core competencies for successful
social and emotional learning. These competencies include self-management, self-awareness,
responsible decision making, relationship management, and social awareness. These
competencies were derived from the five competencies as outlined by the organization the
Collaborative for Academic, Social, and Emotional Learning, also known as CASEL (Zins et al.,
2007). In their discussion of important social skills needed to aid students in becoming
successful learners, Elliot, Roach, and Beddow (2008) highlight the skills of cooperation,
assertion, responsibility, empathy, and self-control (CARES). These social skills, as outlined by
Elliot et al. (2008), include behaviors such as helping others, asking others for information,
communicating with adults, showing concern for others, and responding appropriately to conflict
situations. Additionally, McClelland, Morrison, and Holmes (2000) describe similar social skills,
known as learning-related social skills, but differentiate them in to two subcategories
(interpersonal skills and work-related skills). Interpersonal skills refer to behaviors such as
interacting with others. Work-related social skills include behaviors such as listening,
participating appropriately, and staying on task, which refer to constructs such as independence,
responsibility, self-regulation, and cooperation. Finally, Merrell (2011) identified similar
constructs (social competence, self-regulation, responsibility, and empathy) representing positive
social and emotional skills, which he identified during the development of the Social-Emotional
Assets and Resilience Scales (SEARS). These models are furthered outlined in Table 1 below.
As seen in Table 1, each model consists of similar constructs, which includes self-management,

19
self-regulation, social competence, empathy, and responsible decision making. For example,
each model highlights a construct in which students interact with others in a positive manner,
which can be represented by the construct of social competence.
Table 1
Overlap between Conceptualizations of Social-Emotional Assets
Zins et al. (2007) and CASEL (2003)
Merrell (2011) McClelland et al. (2000)
Elliot et al. (2008)
Relationship management (communication, social engagement, and building relationships)
Social competence (maintain friendships, effective verbal communication)
Interpersonal skills (positive interactions with peers, sharing, cooperation, respect peers)
Cooperation (helping others, sharing materials) Assertion (initiating behaviors, responding to others)
Self-awareness (identifying and recognizing emotions, accurate self-perception) Self-management (impulse control and stress management)
Self-regulation (self-awareness, self-management)
Work-related skills (independence, responsibility, self-regulation, cooperation)
Self-control (responding appropriately to teasing and corrective feedback)
Responsible decision making (problem identification, analysis, and solving; personal, moral, and ethical responsibility)
Responsibility (accepts responsibility, think before acting)
Work-related skills (independence, responsibility, self-regulation, cooperation)
Responsibility (not in young children)
Social awareness (perspective taking, empathy)
Empathy (understand other’s feelings)
Not Included Empathy (not in young children)
For the current study, Merrell’s (2011) framework on social-emotional assets was
adopted, which is further explained in the following sections. Before identifying these four
constructs of social-emotional competencies, Merrell (2011) generated items from existing
assessments that focused on social-emotional strengths. Considering the similarities in the items,
12 clusters were developed. These clusters included friendship skills, empathy, interpersonal

20
skills, social support, problem solving, emotional competence, social maturity, global self-
concept, self-management, social independence, cognitive strategies, and resilience. Merrell
reports that when these clusters were examined more closely there was overlap between the
domains and therefore he conducted a careful examination of each cluster with the purpose of
deleting repetitive items. When examining each cluster, Merrell, along with assistance from his
graduate students, examined the importance of each item to that particular cluster, as well as the
ease and understandability of that item. This step resulted in a total of 54 items to be included in
the measure. Six professionals with expertise in social-emotional development and functioning in
children and adolescents were then asked to serve as the content validation panel, and provided
feedback on ease of understanding each item, each items representation of a key construct, and
the appropriateness for use with a diverse population. This procedure concluded with the
modification of some items, as well as the addition of 10 items, for a total number of 64 items.
Items were then reworded and organized in to four cross informant rating scales (child,
ages 8-12; adolescent, ages 13-18; parent, ages 5-18; and teacher, ages 5-18). After this step, the
number of items decreased for a total ranging between 52 and 54, depending on the measure.
Exploratory factor analyses were then conducted, and the clusters were collapsed to minimize the
item pool to a total of 35 to 41 items (depending on informant). For the parent form, three labels
or domains were identified determined from the commonality of the item content, which
accounted for 48.82% of the variance. Self-regulation/responsibility accounted for 39.00% of the
variance, Social-Competence accounted for 5.86% of the variance, and Empathy accounted for
3.56% of the variance. For the teacher form, four domains or labels were identified, and
accounted for 63.19 % of the variance. The first factor, labeled Responsibility, accounted for
49.88% of the variance. The second factor, Social Competence, accounted for 6.91% of the
21
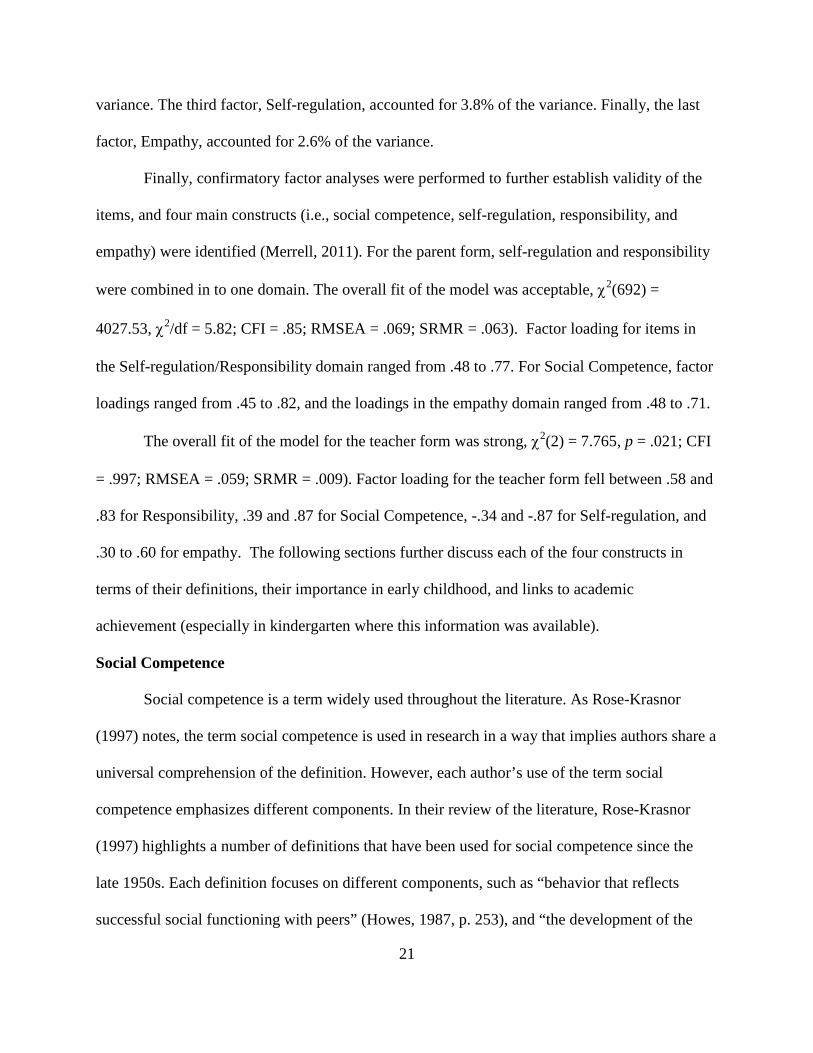
variance. The third factor, Self-regulation, accounted for 3.8% of the variance. Finally, the last
factor, Empathy, accounted for 2.6% of the variance.
Finally, confirmatory factor analyses were performed to further establish validity of the
items, and four main constructs (i.e., social competence, self-regulation, responsibility, and
empathy) were identified (Merrell, 2011). For the parent form, self-regulation and responsibility
were combined in to one domain. The overall fit of the model was acceptable, χ2(692) =
4027.53, χ2/df = 5.82; CFI = .85; RMSEA = .069; SRMR = .063). Factor loading for items in
the Self-regulation/Responsibility domain ranged from .48 to .77. For Social Competence, factor
loadings ranged from .45 to .82, and the loadings in the empathy domain ranged from .48 to .71.
The overall fit of the model for the teacher form was strong, χ2(2) = 7.765, p = .021; CFI
= .997; RMSEA = .059; SRMR = .009). Factor loading for the teacher form fell between .58 and
.83 for Responsibility, .39 and .87 for Social Competence, -.34 and -.87 for Self-regulation, and
.30 to .60 for empathy. The following sections further discuss each of the four constructs in
terms of their definitions, their importance in early childhood, and links to academic
achievement (especially in kindergarten where this information was available).
Social Competence
Social competence is a term widely used throughout the literature. As Rose-Krasnor
(1997) notes, the term social competence is used in research in a way that implies authors share a
universal comprehension of the definition. However, each author’s use of the term social
competence emphasizes different components. In their review of the literature, Rose-Krasnor
(1997) highlights a number of definitions that have been used for social competence since the
late 1950s. Each definition focuses on different components, such as “behavior that reflects
successful social functioning with peers” (Howes, 1987, p. 253), and “the development of the

22
social-cognitive skills and knowledge, including the capacity for emotional control…” (Yeates &
Selman, 1989, p. 66).
Social competence is thus considered to be a multilayered construct (Eisenberg, Fabes, &
Spinrad, 2006; Howes, 1987; Mayr & Ulich, 2009) comprised of elements including emotional
competence (Denham et al, 2003), social behaviors or skills (Rose-Krasnor, 1997), and verbal
communication (Merrell, 2011). One of the most basic definitions of social competence is one’s
“effectiveness in social interaction” (Rose-Krasnor, 1997, p.111). Merrell (2011) expands upon
this basic definition, incorporating all three elements (emotional, social, and verbal competence)
to define social competence as the students’ “ability to maintain friendships with his or her peers,
engage in effective verbal communication, and feel comfortable around groups of peers” (pg. 3).
Mayr and Ulich (2009) describe three social competencies that are emphasized and
relevant to students in school settings with regard to school readiness: assertive behaviors (ability
to say what they want), prosocial behaviors (cooperating with peers), and social
integration/social performance (friendships). Additionally, students with higher social
competence develop better attitudes towards school, and achieve at a higher academic level
(Ladd, Birch, & Buhs, 1999). Specifically, elements of social competence such as positive
interactions with teachers and peers, social skills, and peer acceptance predict academic success
(Izard, et al., 2001; O’Neil, Welsh, Parke, Wang, & Strand, 1997).
Ladd et al. (1999) conducted two separate studies in which they investigated early school
adjustment in kindergarten students. Their studies consisted of 200 and 199 kindergarten
students respectively. Data on student’s behavioral styles, relationships (peer acceptance, number
of best friends, teacher-child relationship), classroom participation, and achievement (e.g.,
matching individual letters and basic math concepts) were collected throughout the kindergarten
23
year. Results indicated that students who formed more positive relationships through successful
interactions (higher social competence) tended to participate more in the classroom, and had
higher achievement scores at the end of the year. Additionally, Ladd et al. (1999) found some
differences between genders. Specifically, the authors found that males displayed more anti-
social behaviors than females, which was associated with lower peer group acceptance.
Therefore, they hypothesized that higher ratings of anti-social ratings in males resulted in lower
ratings of social competence.
O’Neil et al. (1997) conducted a longitudinal study in which they examined how
academic achievement in first and second grade students was related to the student’s social status
during kindergarten, first, and second grade. A total of 345 students were recruited for the study.
Data on the student’s social acceptance were measured by peer-based assessments, and were
collected during their kindergarten, first, and second grade years. Academic achievement was
collected from the student’s report cards in first and second grade, standardized test scores in
second grade, and teacher evaluations in mathematics and language in the first and second
grades. Results indicated that student’s with stable social acceptance (across kindergarten, first,
and second grade) performed better academically in first and second grade as compared to their
peers with high social rejection ratings.
Overall, social competence, or the ability to positively interact with peers and adults, and
maintain friendships, has been shown to be positively related to important academic outcomes
for early elementary students. Specifically, students who enter kindergarten and exhibit higher
levels of social competence are better able to interact with their teachers and peers, as well as
attain higher levels of academic achievement in math and reading concurrently and as they
progress through school (Izard, et al., 2001; Ladd et al., 1999; O’Neil, et al., 1997). Therefore,

24
since social competence is positively related to student’s academic achievement, it is important
for educators to not only focus our attention on student’s acquisition of academic skills, but also
on the development of their skills in positively interacting with others.
Empathy
Another aspect of social-emotional development in children is their ability to put
themselves in the place of others and show respect and compassion for others. The definition of
empathy varies. Eisenberg et al. (2006) define empathy as “an affective response that stems from
the apprehension or comprehension of another’s emotional state or condition, and which is
similar to what the other person is feeling or would be expected to feel” (p. 647). Merrell (2011)
defines empathy as the students’ “ability to empathize others’ situations and feelings” (p. 3).
Although empathy and other characteristics of emotional competence continue to develop
throughout the lifespan, young students (i.e., preschoolers) possess the necessary precursor skills
of empathy in which they can detect their own and other’s emotional states, as well as being able
to speak about them fluently (Denham et al., 2003). When measuring empathy, it is important to
distinguish empathy from other emotional responses such as sympathy, as the two are often
confused with each other. Although sympathy is also a form of perspective taking on emotions, it
generally refers to feeling sorrow or concern for someone who may be in distress rather than
feeling the same emotions as the person in that experience (Eisenberg et al., 2006).
In some cases, empathy has been identified as one aspect under the broader definition of
prosocial behaviors (Eisenberg et al., 2006) and is positively related to social competence
(Caprara, et al., 2000; Spinrad & Eisenberg, 2009) because students who show concern for others
are often seen positively by their peers. Moreover, Spinrad and Eisenberg (2009) suggest that
prosocial behaviors, including empathy, may play an important role in the social success of

25
students. Those who are more prosocial, especially more empathic, tend to be well liked by their
peers and teachers. Therefore, students who are well liked tend to receive more support from
others, and are more engaged in activities, setting them up for more success in the classroom.
A limited number of studies have explicitly investigated the relationship between
empathy and academic achievement. However, given that empathy has been identified as one
aspect of prosocial behavior, research examining the relationship between prosocial behaviors
and academic achievement is relevant. For example, Miles and Stipek (2006) conducted a study
with approximately 400 kindergarten and 1st grade students in which they examined the
relationship between prosocial behaviors and early reading achievement. Prosocial behaviors
were measured using a subscale from the Child Behavior Scale (Ladd & Profilet, 1996).
Specifically, the four items measuring prosocial behaviors included, “helps other children”,
“shows recognition of the feelings of others; is empathetic”, “seems concerned when other
children are distressed”, and “offer help/comfort when others are upset.” Results of their study
indicated a positive relationship between the student’s prosocial behaviors and reading
achievement through the 3rd grade. Although the relationship with the empathy specific items
and achievement was not examined specifically, this study does suggest that scales containing
items related to empathy have a significant relationship with achievement.
Feshbach and Feshbach (1987) conducted a longitudinal study investigating the
relationship between student’s empathy and academic achievement. A total of 76 students
between 10-11 years old, and 67 students between the ages of 8 and 9 years old participated in
the study at time point one. Two years later, at time point two, 40 of the original 8 and 9 year old
students were retested to determine whether empathy predicted later academic success. Empathy
was measured using the Feshbach Audiovisual Measure of Empathy (Feshbach, 1982). This

26
measure consists of a video presentation with 10 two minute vignettes. For each vignette, the
students are asked to circle the emotion they are feeling. Their empathy score is then derived
from their match of their feelings to the feelings of the character in the vignettes. Students
achievement scores were measured using the Wide Range Achievement Test (Jastak & Jastak,
1978), which is a standardized measure yielding scores for math, reading, and spelling. Results
of the study indicated a positive concurrent relationship between empathy and reading
achievement in the 8 and 9 year old group of females, but not for the older group of females, or
either age group of males. Additionally, results indicated ratings of empathy at ages 8-9 were
predictive of academic achievement in reading and spelling for girls two years later. Conversely,
empathy was not predictive of academic achievement in boys.
Additionally, Shields et al. (2001) conducted a study to examine whether emotion
regulation, or the understanding of emotions in self and affective perspective taking, contributed
to preschoolers’ classroom adjustment. Participants of this study included a total of 49 Head
Start children from New England, ranging in age from 3 ½ to 5 years old. Data were collected at
three different time points over the school year: during the first two months of school, winter
months (midway through the school year), and during the last month of school. During time
point one, teacher ratings of students’ emotion regulation, using the Emotion Regulation
Checklist (Shields & Cicchetti, 1997), and behavior problems, using the Preschool Behavior
Questionnaire (Behar & Stringfield, 1974), were collected. At time point two, children’s
emotional understanding (i.e., emotion recognition, self-awareness, emotion coping) was
assessed through interviews with the student (verbal abilities were also assessed to control for
any confounding variables). Lastly, at time point three, teachers’ ratings of student school
adjustment, using the School Adjustment Questionnaire (Shields et al., 2001), and the Emotion

27
Regulation Checklist (ERC; Shields & Cicchetti, 1997) was also collected. Results of this study
indicated that higher levels of emotion regulation at time point one and higher levels of emotion
understanding at time point two predicted better school adjustment at the end of the year.
Therefore, a student’s ability to control their thoughts, emotions has been linked to their
academic success in their classroom, as well as their ability to adapt to the classroom
environment.
In sum, previous research has indicated that prosocial behaviors, including empathy, are
positively related to academic success (Feshbach & Feshbach, 1987; Miles & Stipek, 2006;
Shields et al., 2001). However, much of the research has focused on prosocial behaviors more
broadly, rather than focusing on specific skills such as empathy. Additionally, some researchers
have noted that empathy is less developed in young children (Elliot et al., 2008) making it
unclear how important this skill may be to achievement. However, the limited research on this
topic suggests that empathy may be tied to other important outcomes, like achievement, for at
least some students, in particular females. Given the limited research explicitly investigating the
relationship between empathy and academic achievement, future research is needed.
Self-Regulation
The term self-regulation is synonymous with self-control. Self-regulation has been
defined as “regulating what one does and feels; being disciplined; and controlling one’s appetites
and emotions” (Park, Peterson, & Seligman, 2004, p. 606). Another definition provided for self-
regulation describes it as the student’s “self-awareness, metacognition, interpersonal insight,
self-management, and direction” (Merrell, 2011, pp. 3). Mayr and Ulich (2009) describe self-
regulation as competencies at the cognitive level (e.g., attentiveness), impulse and effortful
control (e.g., wait patiently and listen to others), emotion regulation (e.g., appropriate expression
28
and managing of emotions), and regulation of exploratory behavior (e.g., interest and curiosity).
Therefore, the strength of self-regulation includes a student’s control of their thoughts, emotions,
and behaviors. This is important for students as competencies at the cognitive level contribute to
their ability to be attentive in their classroom, as well as to make the decisions on appropriate
behaviors to display.
Self-regulation has been shown to develop in early childhood, such that within the first
few years of their life, children begin building skills enabling them to control their attention,
behaviors, and emotions (Masten & Coatsworth, 1998). Additionally, such skills continue to
develop as children grow up through various experiences. Therefore, because experiences help
shape the development of self-regulation, a child’s early years provides a perfect opportunity to
build upon such skills (Masten & Coatsworth, 1998). .
Recent research has shown that self-regulation has positive effects on students’ early
academic success and school adjustment. Howse, Lang, Farran, and Boyles (2003) investigated
the impact of self-regulation on early academic achievement. Their longitudinal study of three
years included a total of 127 students between kindergarten and 3rd grade. Of these students, 85
were at-risk kindergarten and 1st graders, scoring below the 28th percentile on the Developmental
Indicators for the Assessment of Learning-Revised (DIAL-R) scale. The students were enrolled
in a Title 1 school, and were eligible for free and reduced lunch. A second group of participants
included 42 students categorized as 1st and 3rd grade students not at risk, and was recruited from
schools that served families of middle and upper-middle socioeconomic status. The authors
assessed student’s self-regulation through the Self-Regulation Test for Children (Kuhl & Kraska,
1993), which is a computerized task investigating a child’s ability to resist distractions, and
sustain focus on the task at hand. Additionally, teachers rated students’ levels self-regulation

29
using the short form of the Instrumental Competence Scale for Young Children, a measure of
student’s motivation and behavioral self-regulation (COMPSCALE; Adler & Lang, 1997). In
terms of achievement, the younger students were assessed using the Test of Early Reading
Ability. Older students took the Peabody Individual Achievement tests for reading (PIAT-R).
Results of this study indicated that, regardless of at-risk status, self-regulation (both from the
teachers report and the student’s performance on the computerized assessment) was found to be a
significant predictor of reading achievement.
Additionally, the study referenced above by Shields et al. (2001) examined whether one
aspect of self-regulation, emotion regulation, contributed to preschoolers’ classroom adjustment.
Students between the ages of 3 ½ and 5 were rated on their level of emotion regulation, behavior,
and early school adjustment by their teachers. Results of this study indicated that higher levels of
emotion regulation at time point one predicted better school adjustment at the end of the year.
Therefore, a student’s ability to control their thoughts, emotions, and behaviors has been linked
to their academic success in the classroom, as well as their ability to adapt to the classroom
environment.
In sum, self-regulation, or the ability to controls one’s emotions and behaviors, has been
widely researched through the years. Specifically, self-regulation has been viewed as a necessary
component that sets the groundwork for building the foundation for resilience in early childhood
(Masten & Coatsworth, 1998). Additionally, research has shown that self-regulation predicts
better school adjustment and later reading achievement in kindergarten students (Howse et al.,
2003; Shields et al., 2001).

30
Responsibility
Although no widely accepted definition for responsibility exists in the literature, there are
similar characteristics evident in the descriptions that have been used. Such characteristics
include identifying, analyzing, and solving a problem, followed by evaluation and reflection in
order to make moral, ethical, and personal decisions (Zins et al., 2007). By following this process
of making responsible decisions, one is able to think before they act, have control over their
actions, and is then held accountable for their actions, as well as the effect on others (Macdonald
& Valdivieso, 2000). In measuring this construct, Merrell (2011) defines responsibility as the
student’s “ability to accept responsibility, behave conscientiously, and ability to think before
acting” (p. 3). Limited research has been conducted investigating the relationship between a
student’s responsibility and academic achievement, especially in kindergarten students. One
possible reason may be that some authors have suggested that responsibility does not develop
until later in childhood (Elliot et al., 2008). Therefore, responsibility has received less attention
in younger students.
The available research exploring the relationship between responsibility and academic
achievement has identified responsibility as a work-related social skill. In addition to
responsibility, work-related social skills also include other social emotional strengths such as
independence, self-regulation, and cooperation (McClelland, Acock, & Morrison, 2006;
McClelland, Morrison, & Holmes, 2000). McClelland et al. (2000) conducted a longitudinal
study in which they examined the relationship between learning related skills, which includes
both work-related social skills and interpersonal skills as subcategories, and academic
achievement with a sample of 295 students beginning in kindergarten and ending in second
grade. The Cooper-Farran Behavioral Rating Scales (Cooper & Farran, 1991) were used to
31
measure these social skills as rated by teachers, and was administered two months after the
beginning of the school year in kindergarten. To assess academic skills, the Peabody Individual
Achievement Test-Revised (PIAT-R) was used for math and reading (Markwardt, 1989), and the
Peabody Picture Vocabulary Test-Revised (PPVT-R) was used to measure students’ receptive
vocabulary skills (Dunn & Dunn, 1981), and were administered during both kindergarten and
second grade. Results of this study indicated that work-related social skills were predictive of
academic achievement at the beginning of kindergarten, after controlling for other important
variables, such as IQ, previous experience in school, ethnicity, and parental education level.
Additionally, these work-related social skills continued to be predictive of academic achievement
two years later, at the end of second grade. Specifically, those with poor work-related skills had
lower achievement scores at the beginning of kindergarten compared to children with higher
work-related skills, and continued to stay behind these students through second grade.
Conversely, interpersonal skills were not predictive of the student’s academic achievement. So
although the specific effects of responsibility cannot be determined in this study, the impact of a
measure that included this factors was an important predictor of concurrent and future academic
performance.
McClelland et al. (2006) conducted a similar longitudinal study with 260 students
beginning in kindergarten and ending in sixth grade. In this study only work-related social skills
were measured, as previous research had indicated interpersonal skills did not predict academic
achievement (McClelland et al., 2000). The work-related social skills were again measured by
the Cooper-Farran Behavioral Rating Scales (Cooper & Farran, 1991), and academic
achievement in math and reading was measured by the Peabody Individual Achievement Test-
Revised (PIAT-R; Markwardt, 1989). Student’s IQ, age, ethnicity, and maternal education level
32
were used as control variables. Results of their study indicate that work-related social skills are
predictive of initial academic achievement scores, as well as growth of academic achievement
scores between kindergarten and second grade. Between third grade and sixth grade, work-
related social skills predicted the initial level of academic achievement in math and reading, such
that those with higher work-related social skills had higher initial academic achievement scores
in math and reading compared to those with lower work-related skills. However, work-related
social skills were not predictive of the growth of the students’ academic achievement in math
and reading between 3rd and 6th grade.
Overall, responsibility and its relationship to academic achievement has not been widely
researched. Work-related social skills, which includes the subcategory of responsibility, in
kindergarten students has been identified as being linked to higher academic achievement
throughout elementary school (McClelland et al., 2006; McClelland et al., 2000). However,
research is lacking in the area of exploring the influence responsibility has on students’ academic
achievement, specifically in kindergarten. Given that previous research has indicated self-
regulation, another factor considered as a work-related skill, is related to academic achievement
(Howse et al., 2003; Shields et al., 2001), it is difficult to determine how much of an influence
responsibility has on academic achievement. Therefore, there is a need for future research to
further explore the relationship of specific work-related learning skills, such as responsibility, to
academic achievement, especially in younger students.
In sum, there are a number of models of social-emotional strengths, many of which
consist of similar constructs. Each model consists of constructs such as self-management, self-
regulation, social competence, responsible decision making, and empathy (CASEL, 2003; Elliot
et al., 2008; Merrell, 2011; Zins et al., 2007). As evidenced in this section, such social-emotional
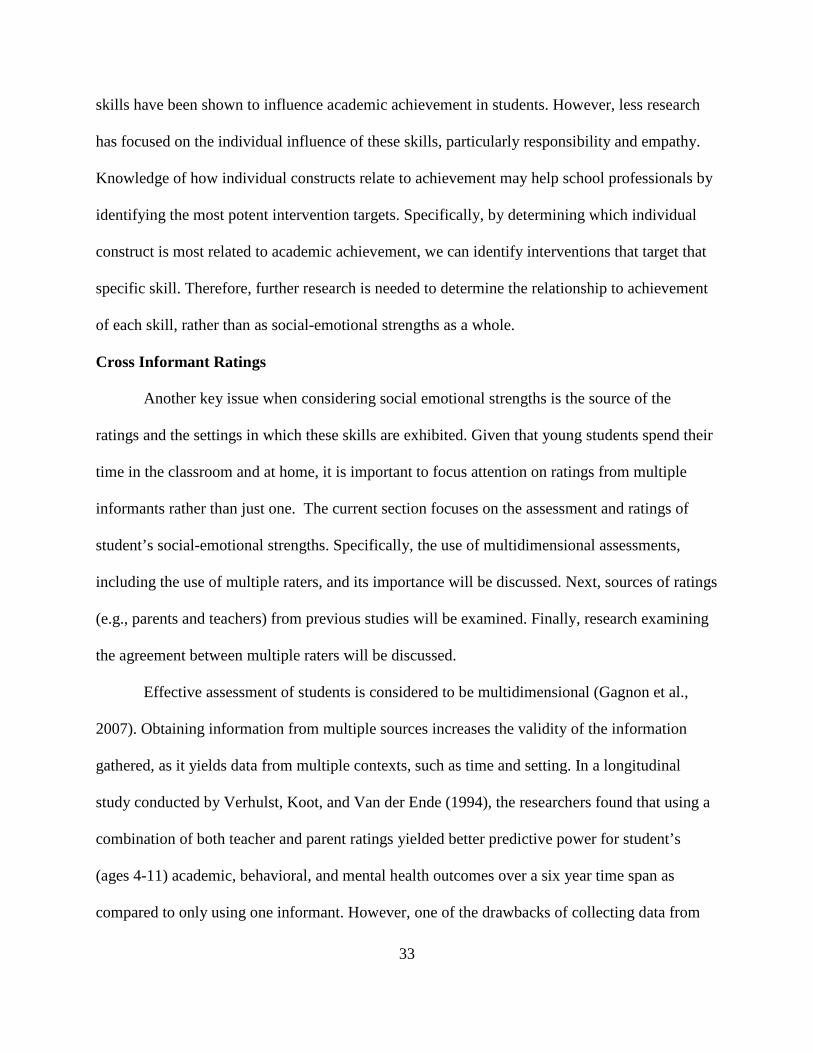
33
skills have been shown to influence academic achievement in students. However, less research
has focused on the individual influence of these skills, particularly responsibility and empathy.
Knowledge of how individual constructs relate to achievement may help school professionals by
identifying the most potent intervention targets. Specifically, by determining which individual
construct is most related to academic achievement, we can identify interventions that target that
specific skill. Therefore, further research is needed to determine the relationship to achievement
of each skill, rather than as social-emotional strengths as a whole.
Cross Informant Ratings
Another key issue when considering social emotional strengths is the source of the
ratings and the settings in which these skills are exhibited. Given that young students spend their
time in the classroom and at home, it is important to focus attention on ratings from multiple
informants rather than just one. The current section focuses on the assessment and ratings of
student’s social-emotional strengths. Specifically, the use of multidimensional assessments,
including the use of multiple raters, and its importance will be discussed. Next, sources of ratings
(e.g., parents and teachers) from previous studies will be examined. Finally, research examining
the agreement between multiple raters will be discussed.
Effective assessment of students is considered to be multidimensional (Gagnon et al.,
2007). Obtaining information from multiple sources increases the validity of the information
gathered, as it yields data from multiple contexts, such as time and setting. In a longitudinal
study conducted by Verhulst, Koot, and Van der Ende (1994), the researchers found that using a
combination of both teacher and parent ratings yielded better predictive power for student’s
(ages 4-11) academic, behavioral, and mental health outcomes over a six year time span as
compared to only using one informant. However, one of the drawbacks of collecting data from
34
multiple sources includes the possibility of conflicting information given that students’ behaviors
often differ depending on the environment in which they are observed and the perspective of the
individuals rating the behavior. Most research is consistent indicating that agreement of ratings
between multiple sources for deficit based assessment tends to be low to moderate (Achenbach,
McConaughy, & Howell, 1987; Gresham, Elliot, Cook, Vance, & Kettler, 2010).
Past research focusing on the relationship between social-emotional strengths and
academic achievement has typically used only one informant in their ratings of social-emotional
competence. Those studies that have used two informants for rating a student’s social-emotional
development included those within the same setting, such as teachers and peers (Caprara, et al.,
2000). For those studies that have included only one informant for the ratings of students’ level
of social-emotional development, the informants used have typically been teachers. For example,
the study conducted by Hair et al. (2006) only used teacher ratings of student’s self-control to
determine the student’s level of social-emotional development. Additionally, studies that have
looked at specific aspects of social emotional development, such as self-regulation and work-
related social skills have only used ratings by teachers. Given the benefits outlined above
regarding using multiple raters, future research should include ratings by multiple informants,
specifically those by teachers and parents. As noted by Verhulst et al. (1994), information
provided by the parents of young children can enhance the validity of assessments.
Less research has been conducted that examine the agreement between multiple
informants for strength based assessments. To investigate this issue, Renk and Phares (2004)
conducted a meta-analysis exploring the relationship between multiple informants on various
ratings of social competence for children and adolescents. A total of 74 studies from the late
1980s to the late 1990s were examined that included ratings from a number of informants (peers,
35
teachers, parents) for students between kindergarten and high school. Of these 74 studies, 16 of
them included the examination of ratings between both parents and teachers. Results of their
meta-analysis showed that ratings between parents and teachers displayed a moderate
correlation, with a mean of .38. Additionally, the authors separated the studies by age group. For
ratings by parents and teachers of early childhood students, the correspondence was moderate in
magnitude, with a mean of .42; however, there was a small number of studies conducted with
young children (n = 3). Renk and Phares (2004) report that these relationships between multiple
informants on scales of social competence were lower than that of ratings of emotional and
behavioral deficits found in previous studies. They concluded that this may be due to the fact that
deficits in students are more significant and bothersome for adult raters making them more
salient than student strengths and competencies. One limitation of this study is that they looked
specifically at social competence, but did not include other key social-emotional domains. Thus,
it is important for future research to examine the relationship of ratings between multiple sources
to determine how they compare using more multidimensional definitions of social-emotional
competence.
Since the publication of the Renk and Phares (2004) meta-analysis, only one study
comparing the ratings of multiple informants on a strengths-based assessment, and more
specifically, the agreement between multiple informants on a multidimensional scale, could be
identified. Crane, Mincic, and Winsler (2011) investigated the agreement between parent and
teacher ratings on a multidimensional rating scale, the Devereux Early Childhood Assessment
(DECA; LeBuffe & Naglieri, 1999), which evaluates social-emotional protective factors in
students between the ages of 2 years old and 5 years old. The sample included the parents’ and
teachers’ of 3- and 4-year old students (n = 7,756) from low income families. Results of their

36
study indicated low to moderate correlations between parent and teacher raters, with correlations
ranging .20 for the Attachment subscale, .24 for Initiative, .26 for Behavioral Concerns, .27 for
Total Protective Factors Score, and .28 for Self-Control.
In sum, gathering information from multiple informants is important to enhance validity
of the information, given that it yields data from multiple contexts. Much of the research
examining the relationship between parent and teacher ratings has focused on deficit based
assessments, which indicates low to moderate relationships (Achenbach, McConaughy, &
Howell, 1987; Gresham et al., 2010). Less research has focused on the relationships between
parent and teacher ratings using a strengths-based assessment. The limited research that is
available yields similar results of low to moderate correlations (Crane et al., 2011; Renk &
Phares, 2004); however, very little research has focused on early childhood specifically,
especially between parent and teachers. Of the 74 studies examined by Renk and Phares (2004),
which focused on one component of social emotional strengths, social competence, only three of
the studies provided effect sizes for parent-teacher ratings of children in early childhood.
Therefore, future research is needed to examine the relationship of cross informant ratings for
strength-based assessments. In addition, while the 74 studies examined by Renk and Phares
(2004) is quite a few, more research is needed that examines multiple components of social-
emotional strengths rather than just one construct to understand if agreement is similar or
different across the different aspects of social-emotional competence.
Summary of the Literature
In sum, there has been an increase in focus on positive psychology in recent years, which
has resulted in a need to reliably assess the strengths of students rather than solely focusing on
their deficits. Specifically, students’ social-emotional strengths have been identified as being

37
essential for a student’s success in school (Diperna & Elliot, 2002), and contribute to students’
adjustment to school (Denham, 2006; Shields et al., 2001). Additionally, research has indicated
that teachers believe it is just as important, and often more important, for students to enter
kindergarten with social-emotional skills as it is for them to enter with academic skills (Johnson
et al., 1995; Lin et al., 2003; Rimm-Kauffman et al., 2000). In terms of academic success,
research has found that students’ with higher levels of social-emotional skills are more likely to
have higher levels of academic achievement (Caprara et al., 2000; Hair et al., 2006; Raver &
Knitzer, 2002). Although research is limited in some areas, the link between social-emotional
strengths and achievement was found across all dimensions of social-emotional strengths. Given
the increasing focus on high stakes testing in our schools, and the push for academic success,
now is an important time to examine other factors that contribute to a student’s academic
achievement. Therefore, the purpose of the current study was to contribute to the literature and
inform prevention and intervention based on the relationship of kindergarten student’s strengths
and their academic outcomes in reading and math.
Although previous research has indicated that social emotional strengths contribute to a
student’s academic success, less has focused on which dimensions of social-emotional
competence contribute most to kindergarten students’ academic achievement. The current study
contributes to the literature by including a multi-dimensional scale in which all strengths were
examined concurrently to determine which social-emotional competencies (rated by parents, as
the use of the short-form teacher measure precludes examination of individual strengths) may be
most strongly associated with early academic achievement in reading and math. Additionally, the
current study controlled for demographic factors, such as gender and SES, as previous studies

38
have indicated each contribute to a student’s academic adjustment and success in kindergarten
(Hair et al., 2006; Howse et al., 2003; Ladd et al., 1999).
Currently, there are only a handful of strength-based multidimensional, multi-informant
rating scales (the DECA and PreBERS), which limit practitioners who are seeking high quality,
psychometrically sound instruments to conduct strength-based assessment for social-emotional
competencies. The current study provides information on a new, multidimensional scale that
assesses social-emotional strengths. Therefore, this study builds upon the limited research with
strength-based assessment, and adds to the validity of the scale by examining cross-informant
ratings from the parent and teacher’s perspective, specifically in younger students. Previous
research has typically used one informant, the teacher, in the rating of social-emotional
competencies. The current study adds to the literature by including both the teacher and parents
as informants

39
Chapter III: Method
The purpose of the current study was to examine the relationships between student social-
emotional strengths and academic outcomes in early literacy and math in kindergarten students.
Specifically, this study examined the relationship between the strengths as rated by the student’s
parents and teachers and the student’s academic outcomes in early literacy and early math.
Additionally, the current study examined the relationship between the ratings of parents and the
ratings of teachers. This study is quantitative in nature, and analyzed data from a secondary
source. The current study analyzed data from a longitudinal study that collected data at three
time points (waves 1-3) across one academic school year. The following chapter describes the
data for the study, the measures, data collection procedures, and analyses.
Participants
Data source. The current study utilized an archival dataset. Data were collected during
the 2011-2012 school year as part of a larger study, which was approved by the Institutional
Review Board (IRB) at the University of South Florida (USF) and the school district IRB,
investigating parent and child factors related to kindergarten school readiness. The principal
investigator for this study was Dr. Julia Ogg. Data were collected from two sites, one in the
southeastern United States and one in Canada. The dataset utilized in the current study includes
data from kindergarten students, their parents, and teachers from both sites. The author of this
study was a member of the research team that collected and entered the data as part of his
participation with the research team led by Dr. Ogg.
40
Study sample. Demographic data for the participating schools in the U.S. are located in
Table 2. Demographic data for participating schools in Canada were not collected. There were a
total of 181 students in the larger study. However, only data from 154 participants were analyzed
in the current study. A more detailed explanation about the decision to use 154 participants is
discussed in the results section. The total number of students in the US sample included 97
participants, and the number from the Canadian sample included 57 students (there was a range
of 2-14 participants from each school at the Canadian site, with a median of 9).
Student participants. All participants were kindergarten students enrolled in a public
elementary school in the Southeastern United States and Canada. Inclusion criteria to be included
in the larger study consisted of:
1. Student must be enrolled in a public kindergarten in a specified district
2. Parents and students must be fluent in English
3. Parent must provide consent for participation
4. Student must live with parent/guardian
5. Student’s teacher must agree to participate.
To ensure parents and students were fluent in English in the Canada sample, only students who
attended an English School Board were allowed to participate. French speaking families are not
allowed to attend these schools. Students were excluded from the study if they repeated
kindergarten. In addition to the inclusion criteria for the larger study, to be included in the
present study, participants had to have data from waves 1 and 3 (the beginning and end of the
school year) and have data on the variables of interest in this study. The demographic data listed
in Table 3 were examined for the student participants meeting the criteria to be included in the
present study. Given that there was a larger than expected range for age of students (60 months

41
to 89 months), age was included as a predictor variable in the regression equation in order to
control for the influence of age on the outcome.
Teacher participants. Kindergarten teachers from the seven participating public schools
in the southeast United States and the seven public schools in Canada participated in the current
study. Teacher participation included recruiting student participants from their classroom and
completing rating scales about participating students at wave 3. All kindergarten teachers from
both sites were female. Aside from gender, demographic data for teachers were not collected.
Parent participants. Parent participation included completing a packet of rating scales
about their involvement in their child’s education and their child’s behavior at waves 1 and 3.
One parent was asked to complete all of the measures, with the exception of one measure not
used in the current study, in which both parents completed it. For the measures used in the
current study, the primary responder for each measure was one of the parents. Descriptive
statistics of the demographic information for all of the parents are listed in Table 4.
Measures
A variety of assessments were given to students, parents, and teachers to assess academic
and social-emotional outcomes. Data for the larger study were collected at three separate time
points, with each window of data collection lasting about two weeks. Only data collected at time
points one (fall 2011) and three (spring 2012) were used for the current study. Although these
time points are considered to be waves one and three for the larger study, for the purpose of the
current study, these data points will be referenced as time point 1 and time point 2. A timeline of
assessments included in the current study is located in Table 5.

42
Table 2
U.S. School Demographics
School A
% (n) School B
% (n) School C
% (n) School D
% (n) School E
% (n) School F
% (n) School G
% (n) Gender Male 52% (476) 53% (467) 53% (204) 50.5% (391) 47% (307) 51% (310) 49% (434) Female 48% (446) 47% (417) 47% (180) 49.5% (384) 53% (345) 49% (296) 51% (441) Number of Students Total 922 884 384 775 652 606 875 Kindergarten 2% (16) 15% (132) 6% (51) 14% (109) 19% (127) 12% (77) 15% (128) Number of students in sample 3.2% (5) 4.5% (7) 8.4% (13) 8.4% (13) 21.4% (33) 6.5% (10) 10.4% (16) Ethnicity American Indian or Alaskan Native
.33% (3) .23% (2) 1% (4) 0% (0) .60% (4) 0% (0) .34% (3)
Asian or Pacific Islander 3% (25) .80% (7) 3% (10) 6% (45) 3% (21) 5% (29) 3% (25) Black, Non-Hispanic 8% (74) 11% (95) 42% (162) 8% (62) 20% (129) 3% (18) 22% (192) Hispanic 22% (206) 34% (298) 28% (106) 45% (347) 16% (105) 13% (79) 28% (246) Multiracial 7% (64) 5% (41) 4% (16) 3% (26) 9% (60) 5% (32) 6% (54) White, Non-Hispanic 60% (550) 50% (441) 22% (86) 38% (295) 51% (333) 74% (448) 41% (355) Free & Reduced Lunch 42% (388) 51% (450) 85% (326) 47% (366) 22% (143) 18%(111) 51% (445)

43
Table 3 Demographic Features of Student Participants
Characteristics U.S. Sample
(n = 97) Canada Sample
(n = 57) Total Sample
(n = 154) Age in Months* 60 0 2 2 62 1 7 8 63 10 3 13 64 4 2 6 65 6 1 7 66 3 3 6 67 12 8 20 68 8 7 15 69 6 5 11 70 5 3 8 71 12 8 20 72 7 1 8 73 10 5 15 74 8 0 8 75 2 0 2 78 1 1 2 82 1 0 1 89 1 0 1 Gender Male 52 33 85 Female 45 24 69 Ethnicity* American Indian or Native Alaskan
1 0 1
Asian 3 1 4 Black or African American/Canadian
9 0 9
Hispanic or Latino 20 0 20 Native Hawaiian or Pacific Islander
0 0 0
White 51 45 96 Multi-Racial 6 5 11 Other 1 5 6 Note. *Some missing data for given variable.

44
Table 4
Demographic Features of Parent Participants
Characteristics U.S. Sample
(n = 97) Canada Sample
(n = 57) Total
(n = 154) Relationship to Child Biological Mother 90 50 140 Biological Father 5 7 12 Other 2 0 2 Ethnicity* American Indian or Native Alaskan
1 0 1
Asian 5 2 7 Black or African American 10 0 10 Hispanic or Latino 20 1 21 Native Hawaiian or Pacific Islander
0 0 0
White 57 47 104 Multi-Racial 0 2 2 Other 0 4 4 Family Income* Less than $5000 0 1 1 $5001 – 10000 6 2 8 $10001 – 20000 3 1 4 $20001 – 30000 8 4 12 $30001 – 40000 14 1 15 $40001 – 50000 9 3 12 $ 50001 – 60000 11 5 16 Over $60000 45 40 85 Maternal Education Level Less than high school 2 2 4 High school or GED 42 8 50 Some college, 2-year college, or Vocational
2 20 22
Bachelor’s degree 3 22 25 Some graduate work 14 2 16 Master’s degree 20 2 22 Doctoral degree 14 1 15 Note. *Some missing data for given variable.
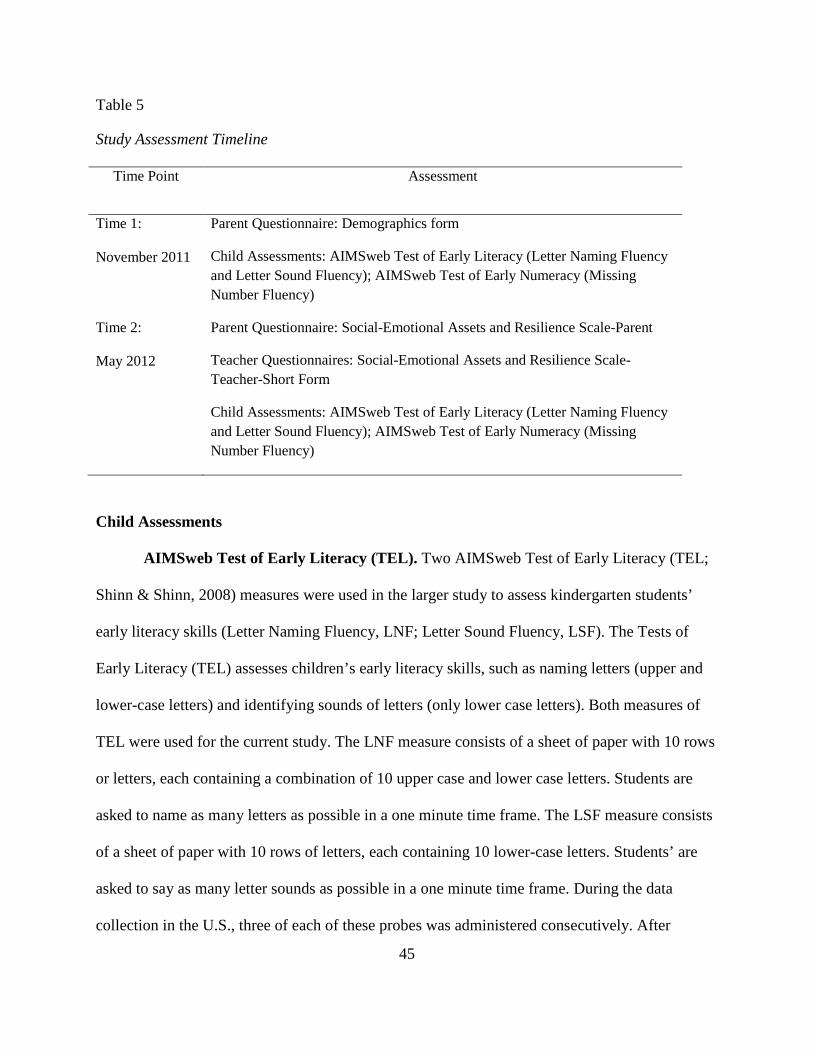
45
Table 5
Study Assessment Timeline
Time Point Assessment
Time 1:
November 2011
Parent Questionnaire: Demographics form
Child Assessments: AIMSweb Test of Early Literacy (Letter Naming Fluency and Letter Sound Fluency); AIMSweb Test of Early Numeracy (Missing Number Fluency)
Time 2:
May 2012
Parent Questionnaire: Social-Emotional Assets and Resilience Scale-Parent
Teacher Questionnaires: Social-Emotional Assets and Resilience Scale-Teacher-Short Form
Child Assessments: AIMSweb Test of Early Literacy (Letter Naming Fluency and Letter Sound Fluency); AIMSweb Test of Early Numeracy (Missing Number Fluency)
Child Assessments
AIMSweb Test of Early Literacy (TEL). Two AIMSweb Test of Early Literacy (TEL;
Shinn & Shinn, 2008) measures were used in the larger study to assess kindergarten students’
early literacy skills (Letter Naming Fluency, LNF; Letter Sound Fluency, LSF). The Tests of
Early Literacy (TEL) assesses children’s early literacy skills, such as naming letters (upper and
lower-case letters) and identifying sounds of letters (only lower case letters). Both measures of
TEL were used for the current study. The LNF measure consists of a sheet of paper with 10 rows
or letters, each containing a combination of 10 upper case and lower case letters. Students are
asked to name as many letters as possible in a one minute time frame. The LSF measure consists
of a sheet of paper with 10 rows of letters, each containing 10 lower-case letters. Students’ are
asked to say as many letter sounds as possible in a one minute time frame. During the data
collection in the U.S., three of each of these probes was administered consecutively. After
46
completion, a score was calculated for each by totaling the number of correct letter names or
sounds verbalized for each probe. The median score from the three probes was used as the final
score for LNF and LSF. Data collection in Canada consisted of administering these probes only
once, so a median score was not used. For the current study, after examining the relationship
between the LNF and LSF probes, the scores of these probes were combined by taking the mean
of the LNF and LSF scores to yield one score for early literacy achievement. In regard to the
difference in number of probes administered at each site, no research was found examining the
use of one probe versus three probes with LNF and LSF. Best practice dictates the use of three
probes, and the median score be taken to indicate a child’s performance because there may be
variability. However, Hintze, Christ, and Keller (2002) examined the utility of a single probe
versus three probes with single skill and multiple skill math CBMs. Results of their study
showed no significant difference between the first probe administered and the other two probes,
F (2, 61) = 984, p = .61, and suggests that using only one probe for single skilled math CBMs
was sufficient to identify the level of students’ performance. This is due to the fact that such
probes only measure a single skill, so there may be less variability within each probe. Therefore,
it is expected that there would be less error and variability in the LNF and LSF probes because
they reflect a single skill as opposed to multiple skills, and that administering only one probe
may be sufficient to identify a student’s level of performance. To explore the reliability of one
probe versus three probes for early literacy, intraclass correlations (ICCs) were computed using
the three probes from the US sample across all three phases. The reliability of the three
administrations was higher (range from .94 to .95 across three phases) than the reliability of
administering one probe (range from .84 to .88); however, all values are acceptable levels of
reliability.

47
Letter Sound Fluency has been shown to have high validity for kindergarten students
(Ritchey, 2008). Ritchey (2008) conducted a study investigating the criterion-related validity of
Letter Sound Fluency with 91 kindergarten students at five different time points. Results of their
study indicated high criterion-related validity using the Word Identification subtest from the
Woodcock Reading Mastery Test-Revised, with coefficients ranging from r = .66 to r = .81
depending on the time point.
Additionally, in a study of related Tests of Early Literacy probes, Elliot, Lee, and
Tollefson (2001) assessed the interrater reliability, test-retest reliability, equivalent forms
reliability, and criterion validity of sound naming fluency, which is an almost identical measure
as letter sound fluency, and letter naming fluency with a group of 75 kindergarten students. Test-
retest reliability was assessed using the second and third testing sessions, two weeks apart, and
yielded a high reliability score for sound naming fluency (r = .83) and letter naming fluency (r =
.90). Additionally, high interrater reliability (r = .82, SNF; r = .94, LNF) and high alternate
forms reliability (r = .82, SNF; r = .80, LNF) were established. Moreover, moderate to high
criterion validity was established using the Woodcock-Johnson Revised Broad Reading and
Woodcock-Johnson Revised Reading skills cluster for SNF (r = .58; r = .72, respectively) and
LNF (r = .63; r = .75, respectively).
Missing Number Fluency (MNF). The missing number fluency probe was designed to
examine a student’s early numeracy skills (AIMSweb; Clarke & Shinn, 2004b). This measure
consists of seven rows, each containing three boxes with a set of two numbers (1 – 10) and a
blank (e.g., 6, ___, 8). The student is asked to correctly identify the missing number. The blank is
randomly placed at the beginning, middle, or end of the set of numbers in order to assess the
student’s fluency in naming the missing number. The student is given one minute to orally

48
identify as many missing numbers as possible, and the examiner marks the answer as either
correct or incorrect on an identical examiners sheet. The students were given a different missing
number probe three times, and a median score of the three probes was used as their fluency
score. For data collected in Canada, probes were only administered once, so a median score was
not calculated. In regard to the use of only one probe versus three probes, no research was found
examining this difference in MNF. As referenced in the above section, it is expected that there
may be less error and variability in the MNF probes as it reflects a single skill as opposed to
multiple skills. Hintze et al. (2002) have suggested that the use of only one probe may be
sufficient for single skills probes. To explore the reliability of one probe versus three probes for
missing number fluency, intraclass correlations (ICCs) were computed using the three probes
from the U.S. sample across all three phases. The reliability of the three administrations was
higher (.93 across three phases) than the reliability of administering one probe (.83); however, all
values were in the acceptable range of reliability.
The Missing Number Fluency probe has demonstrated moderate to high reliability and
validity for kindergarten students (Martinez, Missall, Graney, Aricak, & Clarke, 2009). Martinez
and colleagues (2009) assessed the alternate form reliability and test-retest reliability two weeks
following the second administration of the probes during spring of the school year. High
reliability was demonstrated for test-retest (r = .89) and alternate form (r = .79). Additionally,
moderate correlations were found for concurrent validity (r = .47) and predictive validity (r =
.36) with the Stanford 10 Achievement Test (SAT-10) math subtest.
Teacher Measure
The Social-Emotional Assets and Resilience Scales-Teacher-Short Form (SEARS-T-
SF). The SEARS teacher report is designed to be completed by classroom teachers or other

49
educators who know the student well enough to assess a student’s social-emotional strengths in
the school setting (Merrell, 2011). The SEARS-T can be used with students in grades
Kindergarten – 12th grade. Separate norms have been derived for students in K-6th grade, and
students in 7th-12th grade. However, the specific number of kindergarten students included in this
sample is not specified in the manual.
The short form includes 12 items that are believed to best represent the four general
constructs measures by the full length measure (social competence, self-regulation,
responsibility, and empathy), and include at least two items representing each of the four main
constructs. Examples of questions on the SEARS-T short form includes “Makes friends easily”
(social competence), “Understands how other people feel” (empathy), “Knows how to identify
and change negative thoughts” (self-regulation), and “I trust her/him” (responsibility). This short
form yields a total strengths score, but does not give a breakdown of students’ scores by each
construct. This form was designed to take approximately two minutes. Teachers answer each
question on an ordinal scale (i.e., N for never, S for sometimes, O for often, and A for almost
always) depending on how each item relates to the student in the last three to six months.
Responses are then scored 1 – 4 for data entry, with higher scores indicating higher levels of
strengths being identified in the student.
The SEARS-T Short Form demonstrated high test-retest reliability over a two week
period (r = .90, Doerner, Kaye, Nese, Merrell, & Romer, 2011; r = .90, Merrell, 2011) and high
internal consistency (α = .93, Doerner et al., 2011; α = .93, Merrell, 2011). Additionally, the
SEARS-T Short Form demonstrated moderate to high convergent validity with the Social Skills
Rating Scales (r = .67 - .72, Doerner et al., 2011; r = .79, Merrell, 2011) and the School Social
Behavior Scales (r = .88, Doerner et al., 2011; r = .88, Merrell, 2011). Moreover, high

50
correlations were found between the SEARS-T Short Form and the SEARS-T Long Form (r =
.98).
Parent Measures
Demographic form. One parent completed a demographic form (see Appendix A) which
was comprised of 16 questions regarding their relationship to the student, ethnicity, level of
education, and family income. The items utilized for the current study include family income and
education level of the mother, which was used as a combined variable to determine the student’s
socioeconomic status. Specifically, these items were summed, to yield a range of scores from 2-
15, with higher scores representing higher student SES, and lower scores representing lower
student SES. Part of this demographic form also asked parents to provide demographic
information about their child including gender, age, and race/ethnicity.
The Social-Emotional Assets and Resilience Scales-Parent (SEARS-P). The SEARS
parent report is designed to be completed by parents, guardians, or other home-based caregivers
of children and adolescents to assess a student’s social-emotional strengths in the home setting
(Merrell, 2011). The SEARS-P can be used with students in Kindergarten – 12th grade.
The full length form used in the present study includes 39 items that load onto three
separate scales. These scales include Social Competence (10 items), Self-
Regulation/Responsibility (22 items), and Empathy (7 items). Examples of questions on the
SEARS-P include “Other kids ask him/her to hang out” (Social Competence), “Thinks before
he/she acts” (Self-Regulation/Responsibility), and “Feels sorry for other people when bad things
happen to them” (Empathy). This form was designed to take approximately 10 - 12 minutes to
fill out, and parents answer each question on an ordinal scale (i.e., N for never, S for sometimes,
O for often, and A for almost always) depending on how each item relates to their child in the

51
last three to six months. Individual item responses were transformed to scores ranging from 1 – 4
for data entry, with higher scores indicating greater strengths being identified in the student.
The SEARS-P form has demonstrated strong interrater reliability (Merrell, Felver-Gant,
Tom, 2011) among mothers and fathers of students (r = .72, Total; .71, Self-
Regulation/Responsibility; .68, Social Competence; .65, Empathy; significance at p < .001), as
well as high reliability for tests of internal consistency (r = .96, Total; .95, Self-
regulation/Responsibility; .89 Social Competence; and .96, Empathy). Additionally, this form
has demonstrated high test-retest reliability (r = .93, Total; .92, Self-Regulation/Responsibility;
.88, Social Competence; .90, Empathy) over a two week period (Merrell, 2011).
Moderate to strong convergent validity was demonstrated with parent reports on the
Social Skills Rating Scales, using the Cooperation, Assertion, Responsibility, and Self-Control
subscales, as well as the Total Score (r = .42 - .74; Merrell et al., 2011) for students in
kindergarten through 6th grade. Additionally, strong convergent validity was also established
using the Peer Relations and Self-Management/Compliance subscales, and the Total Score on the
Home and Community Social Behavior Scales (r = .51 - .87; Merrell et al., 2011) with students
in kindergarten through 6th grade. The specific number of kindergarten students included in this
sample is not specified in the manual.
Procedures
Recruitment of participants in the U.S. The PI for the larger study sent an e-mail
through the Director of Psychological Services to all school psychologists in a large, urban
district requesting them to recruit kindergarten teachers for this study. Kindergarten teachers
were recruited for the study from their respective school psychologists. After teachers
volunteered to participate in the study, the PI conducted a meeting at each school to discuss the
52
nature of the study, the requirements for participation, and the incentives they would receive
(i.e., a $10 gift card for each student packet completed). If the teachers agreed to participate, two
copies of the consent form were then sent home with students (see Appendix B). Parents were
instructed to sign and return one copy of the consent form, and keep one copy for their records.
Students were given small incentives (e.g., sticker or small toy) for returning signed consent
forms to their teachers.
Recruitment of participants in Canada. The PI for the larger study first met with
school principals. If the principal was interested in participating, they then met with the
kindergarten teachers from their school. For those teachers who were interested, the PI met with
them to discuss the study, requirements for participation, and plan the next steps. Two copies of
the child consent form were distributed to students in their classrooms. Parents were instructed to
keep one consent form for their own records, and to sign and return one copy of the consent
form.
Data entry. Data were entered into an Excel spreadsheet by members of the research
team. Ten percent of the data were checked for any entry errors by randomly selecting 10% of
the code numbers. The PI, who did not participate in the first round of data entry, compared the
data entered to questionnaire responses. There was a high level of accuracy, which ranged from
97.4% to 100% across participants and measures.
Student Assessments
To ensure the competence of each research team member’s ability to administer the direct
measures with the students, each member of the team was required to attend a training session on
the measures being administered in the study. The appropriate procedures for collecting the data
were also covered at this training. Additionally, each member had to conduct a practice

53
administration with the PI and another student to ensure each member had demonstrated 100%
on the administration integrity checklist for each measure. If the student did not demonstrate
100% on the checklists, they completed as many follow-up sessions as necessary to ensure that
each member demonstrated 100% accuracy on the checklist for each measure prior to data
collection with student participants.
Individual student data were collected by members of the research team during
November 2011 (time point 1), February 2012 (time point 2), and May 2012 (time point 3). For
the current study, only student data from waves one and three were used for data analyses, and
will be referenced as time point 1 and time point 2. Student assessment probes were
counterbalanced in order to control for order effects, resulting in six different versions of the
assessment packets to be administered. The assessment procedures were conducted as followed:
1. One at a time, kindergarten students were asked to accompany a member of the
research team to a quiet area in the school (e.g., hallway, library).
2. Assessment materials (i.e., timer, probes, clipboards) were set up while also
establishing rapport with the student.
3. A verbal assent script (see Appendix C) was read aloud informing the student they
could choose to not participate in the study, or quit at any time.
4. Assessments were conducted orally in order of the stapled packets (lasting about 20-
30 minutes).
5. Probes were scored immediately upon completion of the assessment.
6. The student was given a small incentive for completing the assessments (e.g., eraser,
sticker, pencil, etc.)
7. The student was returned to his or her classroom.

54
Parent Surveys
Parents who provided consent for their child to participate in the study were given a
packet of surveys during time point 1 (November 2011) and time point 3 (May 2012). The
demographic form used in the current study was collected at time point 1, while the SEARS-P
form was collected at time point 3. Only one parent (mother or father) filled out the survey,
yielding one rating. Parents were provided with contact information for the PI if they had
questions related to the rating scales. They were asked to complete the packet within a specific
time frame, and return them to the schools in sealed envelopes. The research team also made
themselves available at the schools on specific dates if parents needed assistance or had
questions in completing their packets. Parents were also given the option of returning the packets
directly to research team members. Upon completion of the scales, the PI and other members
picked up the packets from the schools, and incentives were sent home for each parent in a
sealed envelope. Specifically, the parents were given a $10 gift card for completion of the
surveys at each time point. Finally, forms were sent home to the parents for them to sign and
return to the school, informing the PI that they had received the incentive.
Teacher Surveys
Informed consent (see Appendix D) was also collected from all teachers agreeing to
participate in the study prior to administration of the teacher survey. Teachers who gave consent
were provided with a packet of surveys during time point 3 (May 2012) which contained the
SEARS-T short form. Teachers were given a specific time frame to complete the scales. The
teachers were provided with the PI’s contact information in case they had questions related to the
rating scales. Upon completion, the PI and other members picked up the packets from the school,

55
and teachers received a $10 gift card for each student packet completed. Teachers completed
from between 3 and 10 surveys (M = 6, SD = 1.74).
Analyses
Statistical analyses were conducted in order to screen the data and to answer each of the
research questions in the current study.
Preliminary analyses. Means, standard deviations, and additional descriptive data (e.g.,
range, skew, kurtosis) were calculated for each of the key variables including: academic
achievement (i.e., LNF, LSF, MNF), SEARS-T scores, and SEARS-P Total and subscale scores.
Cronbach’s alpha was calculated for the subscales of the SEARS-P and SEARS-T short form to
assess internal consistency with this specific sample. Additionally, these alphas were compared
across the United States and Canadian sample to determine any differences among each
subsample. A correlation matrix was calculated to determine the strength and direction of the
relationships between each variable in the study. In addition, due to the fact that data were
collected at two sites, one in the U.S. and one in Canada, several factors were considered in the
determination of whether the data from both sites should be combined. For example, correlations
for the Canadian sample, U.S. sample, and the combined sample were examined. Additionally, a
series of independent samples t-tests were conducted to calculate mean differences across sites to
determine if there was a discrepancy between subsample variables (e.g., parent and teacher
ratings of the SEARS, student academic data, and demographic data). These factors, in
consideration with other strengths and weaknesses of using both databases, were used to
determine whether data from both the U.S. and Canadian samples would be combined for further
analysis.

56
Primary analyses. Following the preliminary analyses, inferential analyses were
conducted to answer each of the seven research questions in the current study.
1. To what extent do parent ratings of students’ social-emotional strengths predict early
literacy skills (i.e., LNF and LSF) at the end of kindergarten, while taking into
account scores at the beginning of kindergarten?
a. Specifically in the domain of social competence?
b. Specifically in the domain of self-regulation/responsibility?
c. Specifically in the domain of empathy?
2. To what extent do parent ratings of students’ social-emotional strengths predict early
math skills (i.e., MNF) at the end of kindergarten, while taking into account scores at
the beginning of kindergarten?
a. Specifically in the domain of social competence?
b. Specifically in the domain of self-regulation/responsibility?
c. Specifically in the domain of empathy?
To determine which domains of social-emotional strengths are most predictive of early
literacy and early math outcomes at the end of kindergarten, research questions 1 and 2 were
answered by conducting simultaneous multiple regression analyses, one for early literacy skills
and one for early math skills. Simultaneous multiple regressions allowed for the examination of
how each domain of social-emotional strengths related to each of the outcome variables (reading
and math) while controlling for the influence of the other domains of social-emotional strengths.
Additionally, the initial level of achievement for both reading and math (e.g., Math Time 1), age,
gender, and SES were entered as predictor variables to control for the influence of prior
academic achievement, age, gender, and SES on the outcome.

57
3. To what extent do teacher ratings of student’s social-emotional strengths (i.e., total
strengths score) predict early literacy skills (i.e., LNF and LSF) at the end of
kindergarten, while taking into account scores at the beginning of kindergarten?
4. To what extent do teacher ratings of student’s social-emotional strengths (i.e., total
strengths score) predict early math skills (i.e., MNF) at the end of kindergarten, while
taking into account scores at the beginning of kindergarten?
To answer research questions 3 and 4, two linear regressions were conducted to
determine the extent at which the total social-emotional strengths score of kindergarten students
predicts early literacy and early math outcomes at the end of kindergarten. A linear regression
allowed for the examination of whether total strengths, as rated by the student’s teacher,
influences each of the outcome variables (i.e., math and reading) while controlling for prior
academic achievement (i.e., Math Time 1), age, gender, and SES
5. To what extent are parent ratings of students’ total strength related to teacher ratings
of students’ total strengths?
To answer research question 5, Pearson product-moment correlations between the
parents’ and teachers’ ratings were computed for the SEARS-P total score and SEARS-T short
form total score to determine the strength and direction of the relationship.
6. Do parent or teacher ratings of social-emotional strengths better predict
kindergarten student outcomes in early literacy?
7. Do parent or teacher ratings of social-emotional strengths better predict
kindergarten student outcomes in early numeracy?
To answer research questions 6 and 7, a z-score for dependent correlations with one
variable in common was computed using the following procedure. Correlation coefficients

58
between social-emotional strengths and academic outcomes (e.g., reading, math) were obtained
for both parent and teacher raters, separately. Additionally, the correlation coefficient between
parent and teacher SEARS ratings were obtained. These correlation coefficients were then
transformed into z scores using the Transformation of r to z table. Next, the asymptotic
covariances were computed using the following formulas:
���,�� � ����,�� (1)
����,�� � ���1 ��� ��� � �� �������1 ��� ��� ���� (2)
and
���,�� � �� 3�����,��� � ���,������������ � ���,��/�1 �����1 ����. (3)
The final step was to calculate an asymptotic z-test using the following formula: ��� � ��� 3� �
�� �� ����2 2"� ��,��� #��. (4)
This z-score was then compared to the critical value of ±1.96 to determine if it was statistically
significant, meaning that the strength of the correlation between social emotional strengths and
academic outcomes are significantly different between parents and teachers.
59
Chapter IV: Results
This chapter contains the results of the analyses conducted in order to answer the research
questions. First, data screening procedures and variable construction will be discussed. Next,
results of the preliminary analyses and descriptive statistics will be discussed. Correlations
among all of the variables will then be reported. Finally, results from the analyses used to answer
the research questions (regression analyses and z-score for dependent correlations analysis) will
be reported.
Data Screening
A total of 181 cases were examined to determine if they met the criteria for inclusion to
be analyzed for this study. Of these 181 cases, 16 participants were missing academic
achievement data (e.g., early literacy and early math), leaving a total of 165 participants. Ten
cases were excluded from the data set due to missing data on the child’s gender since gender is
one of the control variables. One additional participant was excluded for missing both parent and
teacher SEARS data, leaving a total sample size of 154. From this sample size, an additional 38
participants were missing parent SEARS data, and three participants were missing teacher
SEARS data. Of the 38 participants missing parent SEARS data, 35 of them did not return the
measure. The other three participants were excluded from the study because they did not
complete the minimum number of items necessary for scoring on a given subscale. In the
interest of preserving a larger sample size, these cases were still included for analyses, yielding a
sample size of 116 for research questions 1 and 2 (e.g., questions related to parent data), and a
sample size of 151 for research questions 3 and 4 (questions related to teacher data). For research

60
questions 5, 6, and 7, a sample yielding 113 participants was used, as sample totals need to be
identical in order to determine significant differences between parent and teacher ratings of
social-emotional strengths.
Variable Construction
The analyses for the current study included eight variables of interest: SES, early
literacy, early math skills, SEARS-P Total, SEARS-P Social Competence, SEARS-P Self-
Regulation/Responsibility, SEARS-P Empathy, and SEARS-T Total. The construction of each
variable is described below.
SES. One variable was constructed to yield a score for SES. This was done by taking the
mean of the two scores of maternal level of education and family income. For two cases,
maternal level of education was not available, so the father’s level of education was used instead.
Early Literacy Skills. The median score for Letter Name Fluency and Letter Sound
Fluency for data from the United States, and the single data point from time point 3 for these
measures from Canada were used to construct the early literacy variable. The averages of these
two scores (LNF and LSF) was used to yield one early literacy score.
Early Math Skills. The median score for the Missing Number fluency for data from the
United States, and the single data point from time point 3 for Missing Number Fluency from
Canada was used to construct the early math skills variable.
SEARS-P Social Competence. Items from the SEARS-P were used to construct the
Social Competence variable. This score was calculated by summing the 10 Social Competence
items from the SEARS-P form. Participants must have completed nine of the 10 items (90%) in
order to calculate Social Competence score. If only one item was missing, that item was replaced
with the most frequent response in that subscale (Merrell, 2011).

61
SEARS-P Self-Regulation/Responsibility. Items from the SEARS-P were used to
construct the Self-Regulation/Responsibility variables. This score was calculated by summing 22
of the items from the SEARS-P form. In order to calculate this variable, participants must have
completed at least 20 of the 22 items (91%). As outlined in the SEARS manual (Merrell, 2011),
in order to replace any missing items, the frequency of responses were tallied for this subscale,
and the most frequent response was used.
SEARS-P Empathy. Items from the SEARS-P were used to calculate the Empathy
subscale for the SEARS. In order to calculate this variable, seven of the items were summed
from the SEARS-P form. Participants must have completed at least six of the seven (86%) items
in this subscale to reliably calculate this variable. As instructed by the SEARS manual (Merrell,
2011), when only one item was missing, it was replaced with the most frequent response in this
subscale.
SEARS-P Total. All items from the SEARS-P were used to construct SEARS-P Total
score variable. This variable was calculated by summing all of the items together. If one of the
subscales from the SEARS-P (i.e., social competence, self-regulation/responsibility, and
empathy) could not be calculated due to too many missing items (as described above), then the
total score could also not be calculated, and therefore, was excluded from the data set.
SEARS-T Total. All of the items on the SEARS-T-Short Form were used in constructing
the Total Score variable. To calculate this variable, all items were summed. All participants must
have completed at least 11 of the 12 items (92%) on the SEARS-T-Short Form to reliably
calculate this score. Per the manual instructions, if participants were missing more than one item,
they were excluded from the data set.

62
Screening for Outliers
The data set was also screened for any outliers using IBM SPSS 22.0. The minimum and
maximum values for all of the variables of interest were first examined in order to determine if
they fell outside of the expected values. None of these scores fell outside of the acceptable
ranges. Next, univariate outliers were assessed by creating z scores for each of the variables of
interest. No z scores fell outside the accepted range of 3.3, and thus, no univariate outliers were
detected. Finally, data were screened to determine the presence of any multivariate outliers using
Mahalanobis distances. No multivariate outliers were detected.
Descriptive Analyses
Descriptive statistics for the data set are presented in Table 6. Univariate normality was
assessed using the skewness and kurtosis values calculated for each variable of interest. All
scores for each variable of interest demonstrated approximate normal distributions as each
obtained value for skewness and kurtosis fell between -1.0 and +1.0. Additionally, the averages
of the academic data utilized in the current study were similar to the means and standard
deviations from the national samples for the AIMSweb norms (Pearson, 2012). In terms of the
data utilized in the current study for students’ social-emotional strengths, the means for each of
the strengths fell between the 38th and 60th percentile according to the norms published in the
SEARS manual. More specifically, the mean total strengths score as rated by teachers falls in the
60th percentile according to normative data. For strengths rated by parents, the mean score for
social competence falls in the 53rd percentile according to normative data, which is the highest
percentile from the data in the current study. The mean score for self-regulation/responsibility
was the lowest percentile according to normative data from the manual, and falls in the 38th
percentile.

63
During time point 1, the means and standard deviations for all of the academic data were
higher than the AIMSweb norms. However, this was to be expected given that data were
collected later in the fall than typical. The mean Letter Naming Fluency score in the fall was
36.67 with a standard deviation of 17.04 for the current study. The national AIMSweb norm
averages were 22 with a standard deviation of 16. For Letter Sound Fluency, the average of the
current study was 25.08 with a standard deviation of 14.44, while the national AIMSweb
averages was 9 with a standard deviation of 16. Finally, for math, Missing Number Fluency, the
average for the current study was 11.60 with a standard deviation of 5.69. The AIMSweb
national norm average was 6 with a standard deviation of 6.
The academic data for time point 2 were consistent with the AIMSweb national norms in
both reading and math. For Letter Naming Fluency, the average for the current study was slightly
lower [49.84 (18.03)] as compared to the AIMSweb national average which was 52 with a
standard deviation of 18. For Letter Sound Fluency, the average and standard deviation was
39.23 and 16.87 respectively for the current study. The AIMSweb national average norms were
39 and a standard deviation of 16. Finally, the Missing Number Fluency average for the current
study was 15.34 with a standard deviation of 5.06, which is consistent with AIMSweb national
norms [15 (16)].
Scale Reliability
Cronbach’s alpha was calculated in order to determine the internal consistency for each
of the measures used in the following analyses. The Cronbach’s alpha for each of the subscales
of the SEARS fell above .80, and the strengths total score was above .90. Cronbach’s alpha for
each scale of interest is located in Table 7. Overall, the internal consistency for each of the scales
was good to excellent (Pallant, 2013).

64
Table 6
Descriptive Statistics for Variables of Interest
Variable N Minimum Maximum M (SD) Skew Kurtosis
Reading (LNF)
Time 1 154 0 83 36.67 17.04 0.04 -0.34
Time 2 154 0 90 49.84 18.03 -0.14 -0.31
Reading (LSF)
Time 1 154 0 61 25.08 14.44 0.26 -0.56
Time 2 154 0 83 39.23 16.87 0.22 -0.40
Early Literacy
Time 1 154 0 71.50 30.88 14.91 0.16 -0.52
Time 2 154 0 83.50 44.54 16.68 0.002 -0.41
Math (MNF)
Time 1 154 0 21 11.60 5.69 -0.19 -0.66
Time 2 154 0 21 15.34 5.06 -0.72 -0.28
SEARS-T
Total Score 151 8 36 23.35 7.65 -0.17 -0.95
SEARS-P
Total Score 116 25 116 70.13 18.46 0.32 -0.05
Social- Competence
116 8 30 21.54 5.19 -0.26 -0.60
Self-Regulation/ Responsibility
116 10 65 34.16 11.68 0.53 0.10
Empathy 116 6 21 14.42 3.76 -0.16 -0.70
Note. Time 1 = Beginning of year; Time 2 = End of Year; LNF = Letter Naming Fluency; LSF = Letter Sound Fluency; MNF = Missing Number Fluency.

65
Table 7
Cronbach’s Alpha (α) for all Measures Utilized in Analyses
Scale Number of Items Cronbach’s Alpha (α)
SEARS-P
Total 39 .96
Social Competence 10 .88
Self-Regulation/Responsibility 22 .95
Empathy 7 .83
SEARS-T-SF
Total 12 .93
Note. SEARS-P = Social Emotional Assets and Resilience Scales Parent form; SEARS-T-SF = Social Emotional Assets and Resilience Scales Teacher short form. Correlational Analyses
Pearson product-moment correlations for all continuous variables of interest are
presented in Table 8. Teacher’s total ratings of social-emotional strengths were significantly
positively associated with all areas of academic achievement. Most notably, there was a
moderate, positive correlation between teacher total strengths ratings and early literacy (e.g.,
LNF and LSF combined score) at time point three (r = .38, p < .01) and a small, positive
correlation with early math skills at time point three (r = .20, p < .01), indicating that higher
teacher ratings of social-emotional strengths are related to higher early literacy and early math
skills. There was also a small, positive correlation between parent ratings of social-emotional
strengths and early literacy at time point three (r = .21; p < .05), but were not significantly
related to early math skills (r = .07). Therefore, higher parent ratings of student social emotional
strengths were associated with higher academic achievement in early literacy, but not in early

66
math skills. In terms of specific social-emotional skills, there was a small, positive correlation
between social competence and early literacy skills at time point three (r = .26; p < .01), but not
with early math skills at time point three. Additionally, neither parent ratings of self-
regulation/responsibility nor empathy were significantly related to early literacy (r = .16 and r =
.17, respectively) or early math skills (r = .04 and r = .13, respectively) at time point three. This
indicates that higher parent ratings of social competence were associated with early literacy skills
at time point three, but this association was very weak with early math skills at time point three.
Moreover, self-regulation and empathy were not associated with either early literacy or early
math skills at time point three.
Comparison of United States and Canadian Data
Before further analyses were conducted to investigate each research question, a series of
preliminary analyses were run to compare sites (i.e., U.S. and Canada) to explore any
differences. These analyses were used to determine if the total data set should be combined into
one, or if the Canadian data set should be removed.
Descriptive Analyses Across Sites
Descriptive statistics for the U.S. and Canadian data sets are presented in Table 9.
Univariate normality was assessed using the skewness and kurtosis values calculated for each
variable of interest. All values, with the exception of Letter Sound Fluency at time point three
(skewness = 1.10; kurtosis = 2.09) and Missing Number Fluency at time point three (kurtosis = -
1.02) for the Canadian data set fell between -1.0 and + 1.0, indicating approximate normal
distribution scores for each variable.

67
Table 8
Intercorrelations between Variables
1 2 3 4 5 6 7 8 9 10 11 12 13 14 15 16 1. Age 1
2. Gender -.02 1
3. SES -.04 .05 1
4. Reading (LNF; Time 1)
.27** .16* .11 1
5. Reading (LNF; Time 2)
.29** .16* .04 .81** 1
6. Reading (LSF; Time 1)
.31** .16 .15 .79** .72** 1
7. Reading (LSF; Time 2)
.31** .09 .03 .72** .83** .77** 1
8. Early Literacy (Time 1)
.30** .17* .14 .96** .81** .94** .78** 1
9. Early Literacy (Time 2)
.31** .13 .04 .80** .96** .78** .95** .83** 1
10. Math (MNF; Time 1)
.22** -.03 .15 .59** .51** .55** .40** .61** .48** 1
11. Math (MNF; Time 2)
.28** -.01 .04 .48** .54** .48** .46** .51** .52** .68** 1
Note. ** p < .01, *p < .05. Gender (1 = Male; 2 = Female); Time 1 = Beginning of year; Time 2 = End of Year; LNF = Letter Naming Fluency; LSF = Letter Sound Fluency; MNF = Missing Number Fluency.

68
Table 8 (Continued)
Note. ** p < .01, *p < .05. Male = 1; Female = 2; Time 1 = Beginning of year; Time 2 = End of Year; LNF = Letter Naming Fluency; LSF = Letter Sound Fluency; MNF = Missing Number Fluency.
1 2 3 4 5 6 7 8 9 10 11 12 13 14 15 16
12. SEARS-T Total
.25** .30** .09 .37** .42** .26** .30** .33** .38** .31** .20* 1
13. SEARS-P Total
.14 .32** .09 .11 .20* .16 .20* .14 .21* .02 .07 .47** 1
14. Social
Competence
.05 .15 .15 .17 .25** .21* .24** .20* .26** .07 .08 .38* .80** 1
15. Self-
Regulation/ Resp.
.17 .35** .06 .07 .16 .12 .16 .10 .16 -.02 .04 .45** .86** .64** 1
16. Empathy
.11 .29** .05 .08 .17 .13 .16 .11 .17 .07 .13 .37** .82** .57** .72** 1

69
Although Letter Sound Fluency skewness and kurtosis and Missing Number Fluency kurtosis for
the Canadian data set at time point three exceeded the stringent criterion of plus or minus one,
these values fall within the range of plus or minus three, which is an acceptable range according
to Tabachnick and Fidell (2013).
Scale Reliability Across Samples
Cronbach’s alpha was calculated in order to determine the internal consistency for each
of the measures at each site used in the proceeding analyses. The Cronbach’s alphas for each of
the subscales at each site fell above .70, and the Cronbach’s alpha for the total strengths score at
each site was above .90. Cronbach’s alpha for each scale of interest for the U.S. and Canadian
data sets are located in Table 10. Overall, each of the Cronbach’s alphas fell in the range of
acceptable to excellent (Pallant, 2013).
Correlational Analyses
Pearson product-moment correlations for all continuous variables of interest for each site
(i.e., U.S. and Canada) are presented in Table 11. As can be seen in Table 11, correlations
coefficients between the two sites (U.S. and Canada) do differ. However, using the z-scores for
two independent samples formula,
z%&'� (�- (�* �
+�- , - �+�-,
, (1)
it was determined that there were no significant differences between the correlation coefficients
between the two sites.
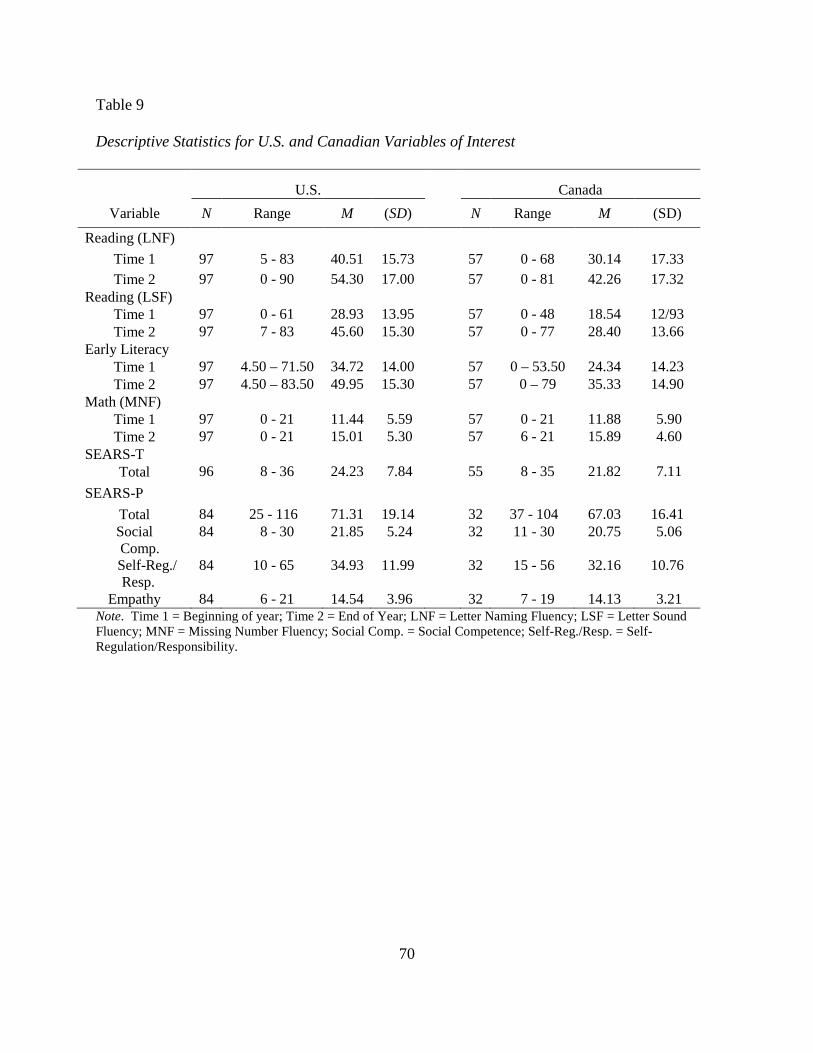
70
Table 9
Descriptive Statistics for U.S. and Canadian Variables of Interest
U.S.
Canada
Variable N Range M (SD) N Range M (SD)
Reading (LNF)
Time 1 97 5 - 83 40.51 15.73 57 0 - 68 30.14 17.33 Time 2 97 0 - 90 54.30 17.00 57 0 - 81 42.26 17.32
Reading (LSF) Time 1 97 0 - 61 28.93 13.95 57 0 - 48 18.54 12/93 Time 2 97 7 - 83 45.60 15.30 57 0 - 77 28.40 13.66
Early Literacy Time 1 97 4.50 – 71.50 34.72 14.00 57 0 – 53.50 24.34 14.23 Time 2 97 4.50 – 83.50 49.95 15.30 57 0 – 79 35.33 14.90
Math (MNF) Time 1 97 0 - 21 11.44 5.59 57 0 - 21 11.88 5.90 Time 2 97 0 - 21 15.01 5.30 57 6 - 21 15.89 4.60
SEARS-T Total 96 8 - 36 24.23 7.84 55 8 - 35 21.82 7.11
SEARS-P
Total 84 25 - 116 71.31 19.14 32 37 - 104 67.03 16.41 Social
Comp. 84 8 - 30 21.85 5.24 32 11 - 30 20.75 5.06
Self-Reg./ Resp.
84 10 - 65 34.93 11.99 32 15 - 56 32.16 10.76
Empathy 84 6 - 21 14.54 3.96 32 7 - 19 14.13 3.21 Note. Time 1 = Beginning of year; Time 2 = End of Year; LNF = Letter Naming Fluency; LSF = Letter Sound Fluency; MNF = Missing Number Fluency; Social Comp. = Social Competence; Self-Reg./Resp. = Self-Regulation/Responsibility.

71
Table 10
Cronbach’s Alpha (α) for all Measures Utilized in Analyses
Scale Number
of Items
Cronbach’s
Alpha (α)
(U.S)
Cronbach’s
Alpha (α)
(Canada)
SEARS-P
Total 39 .96 .95
Social Competence 10 .88 .86
Self-Regulation/ Responsibility
22 .95 .95
Empathy 7 .85 .78
SEARS-T-SF
Total 12 .93 .92
Note. SEARS-P = Social Emotional Assets and Resilience Scales Parent form; SEARS-T-SF = Social Emotional Assets and Resilience Scales Teacher short form.
Independent Sample t-Test Analyses Across Samples
To further investigate any significant differences between the U.S. and Canadian
samples, a series of independent t-tests were conducted on all continuous variables of interest.
Results of these t-tests are presented in Table 12. There were no significant differences between
social-emotional ratings by parents or teachers for the U.S. and Canadian samples. Additionally,
there were no significant differences for early math achievement between sample sites.
Conversely, there were significant differences in scores for Letter Naming Fluency, Letter Sound
Fluency, as well as the early literacy combined score. On each of these variables, the U.S.
sample scored significantly higher on the early literacy measures than the Canadian sample.
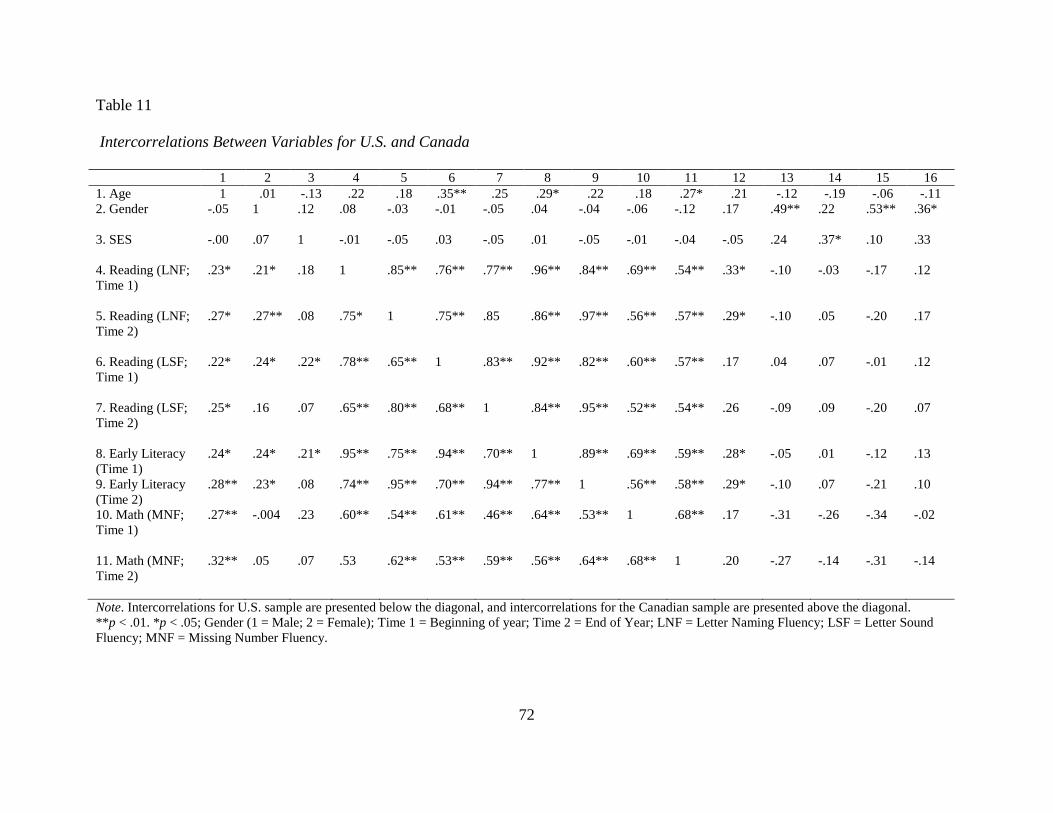
72
Table 11
Intercorrelations Between Variables for U.S. and Canada
1 2 3 4 5 6 7 8 9 10 11 12 13 14 15 16 1. Age 1 .01 -.13 .22 .18 .35** .25 .29* .22 .18 .27* .21 -.12 -.19 -.06 -.11 2. Gender -.05 1 .12 .08 -.03 -.01 -.05 .04 -.04 -.06 -.12 .17 .49** .22 .53** .36*
3. SES -.00 .07 1 -.01 -.05 .03 -.05 .01 -.05 -.01 -.04 -.05 .24 .37* .10 .33
4. Reading (LNF; Time 1)
.23* .21* .18 1 .85** .76** .77** .96** .84** .69** .54** .33* -.10 -.03 -.17 .12
5. Reading (LNF; Time 2)
.27* .27** .08 .75* 1 .75** .85 .86** .97** .56** .57** .29* -.10 .05 -.20 .17
6. Reading (LSF; Time 1)
.22* .24* .22* .78** .65** 1 .83** .92** .82** .60** .57** .17 .04 .07 -.01 .12
7. Reading (LSF; Time 2)
.25* .16 .07 .65** .80** .68** 1 .84** .95** .52** .54** .26 -.09 .09 -.20 .07
8. Early Literacy (Time 1)
.24* .24* .21* .95** .75** .94** .70** 1 .89** .69** .59** .28* -.05 .01 -.12 .13
9. Early Literacy (Time 2)
.28** .23* .08 .74** .95** .70** .94** .77** 1 .56** .58** .29* -.10 .07 -.21 .10
10. Math (MNF; Time 1)
.27** -.004 .23 .60** .54** .61** .46** .64** .53** 1 .68** .17 -.31 -.26 -.34 -.02
11. Math (MNF; Time 2)
.32** .05 .07 .53 .62** .53** .59** .56** .64** .68** 1 .20 -.27 -.14 -.31 -.14
Note. Intercorrelations for U.S. sample are presented below the diagonal, and intercorrelations for the Canadian sample are presented above the diagonal. ** p < .01. *p < .05; Gender (1 = Male; 2 = Female); Time 1 = Beginning of year; Time 2 = End of Year; LNF = Letter Naming Fluency; LSF = Letter Sound Fluency; MNF = Missing Number Fluency.

73
Table 11 (Continued)
Note. Intercorrelations for U.S. sample are presented below the diagonal, and intercorrelations for the Canadian sample are presented above the diagonal. ** p < .01. *p < .05; Gender (1 = Male; 2 = Female); Time 1 = Beginning of year; Time 2 = End of Year; LNF = Letter Naming Fluency; LSF = Letter Sound Fluency; MNF = Missing Number Fluency.
1 2 3 4 5 6 7 8 9 10 11 12 13 14 15
12. SEARS-T Total
.24* .36** .15 .35** .45** .24* .26* .32** .38** .40** .23* 1 .39* .36 .32 .40*
13. SEARS-P Total
.19 .27* .07 .17 .28* .17 .23* .18 .27* .15 .19 .49** 1 .77** .93** .79**
14. Social Competence
.10 .12 .10 .24* .31** .24* .26* .25* .30** .21 .17 .38** .81** 1 .51** .63**
15. Self-Regulation/ Resp.
.21 .28** .07 .14 .25* .13 .20 .15 .24* .11 .16 .49** .97** .68** 1 .61**
16. Empathy
.15 .27* -.01 .06 .18 .12 .17 .09 .19 .11 .21 .36** .83** .56** .75** 1

74
Table 12
Independent Samples T-tests for Continuous Variables Between U.S. and Canada Samples
Sample Site
U.S. M (SD)
Canada M (SD)
T p
SES 5.23 (1.55) 5.24 (1.28) -0.04 .97
SEARS-P Total 71.31 (1.55) 67.03 (1.28) 1.12 .27
Social Comp. 21.85 (5.24) 20.75 (5.06) 1.02 .31
Self-Reg./Resp. 34.93 (11.99) 32.16 (10.76) 1.14 .26
Empathy 14.54 (3.96) 14.13 (3.21) .52 .60
SEARS-T Total 24.23 (7.84) 21.82 (7.11) 1.88 .06
LNF Time 1 40.51 (15.73) 30.14 (17.33) 3.80*** .00
LNF Time 2 54.30 (16.99) 42.26 (17.32) 4.21*** .00
LSF Time 1 28.93 (13.95) 18.54 (12.03) 4.58*** .00
LSF Time 2 45.60 (15.30) 28.40 (13.66) 7.00*** .00
Early Literacy Time 1 34.72 (14.00) 24.34 (14.23) 4.41*** .00
Early Literacy Time 2 49.95 (15.30) 35.33 (14.90) 5.78*** .00
MNF Time 1 11.44 (5.59) 11.88 (5.90) -.46 .65
MNF Time 2 15.01 (5.30) 15.89 (4.60) -1.05 .30
Note. *** p < .001. Standard deviations appear in parentheses besides means. LNF = Letter Name Fluency; LSF = Letter Sound Fluency; Early Literacy = Early literacy combined score using mean of Letter Name Fluency and Letter Sound Fluency; MNF = Missing Number Fluency; Time 1 = Beginning of school year; Time 2 = End of school year.
After conducting the preliminary analyses, it was determined to combine both the U.S
and Canadian data sets to yield one sample. This decision was made due to the fact that no
significant differences were observed between correlation coefficients between both sites, good
75
reliability was found for each of the scales measuring the variables of interest for both sites, as
well as minimal differences between the continuous variables of interest. Significant mean
differences only exist for the early literacy variables between sites.
Regression Analyses
Following the preliminary analyses described above, multiple regression analyses were
conducted to answer four of the research questions for this study.
Assumptions. Prior to conducting multiple regression analyses, a number of
assumptions must be considered. First, a certain sample size is required for multiple regression
analyses. It is suggested that researchers use the equation: N > 50 + 8m to calculate a minimum
sample size, where m stands for the number of independent variables (Tabachnick & Fidell,
2013). Each analysis included between four and six independent variables, which yield a
minimum sample size between 82 and 98. The present sample ranged from 116 to 151, which
meets this criterion.
Second, multiple regression analyses assume normal distribution of variables. As
referenced earlier, the skewness and kurtosis for all variables of interest fell within the
acceptable range of -1.0 to +1.0. Thus, the assumption of normality was not violated.
Finally, multiple regression analyses are sensitive to multicollinearity and singularity.
The independent variables of interest are not highly correlated (see Table 8), nor is any variable a
combination of other independent variables. Therefore, the assumptions of multicollinearity and
singularity are not violated.
Research question one. In order to determine the extent to which parent ratings of
students’ social-emotional strengths predict early literacy skills at the end of kindergarten, a
multiple regression was conducted with early literacy skills as the dependent variable, and social

76
competence, self-regulation, empathy, age in months, student’s gender, SES, and prior academic
achievement (e.g., early literacy at time point one) as the independent variables (model 1). An
alpha level of .05 was used to determine statistical significance. Overall, the model was
significant, F(6, 109) = 30.36, p < .001, and accounted for 67% of the variance in early literacy.
With all variables included in the model, only previous academic achievement (as measured by
early literacy time point 1) was significant β = .76, p < .001, indicating that only prior academic
achievement significantly predicted current academic achievement in early literacy.
Given that previous literature has identified prior academic achievement as a strong
predictor of current academic achievement, further analyses were conducted without this variable
included in the model (model 2). The second model was analyzed using early literacy skills at
time point 2 as the dependent variable, and social competence, self-regulation/responsibility,
empathy, student’s age in months, student’s gender, and SES as the independent variables. This
was done to determine if specific domains of social-emotional strengths, as rated by parents,
predict current academic achievement without controlling for prior academic achievement. The
results of this model demonstrated that student’s age in months was the strongest predictor of
early literacy achievement at the end of kindergarten (β = .35, p < .001). Additionally, results
from the second model revealed that the social-emotional strengths explained only 8% of the
variance in academic achievement, which was not significant, F(5, 110) = 1.88, p = .10.
However, social competence was found to make a statistically unique contribution (β = .27, p <
.05) to the equation. This indicates that for every one unit increase in social competence, we can
expect an increase of .30 in the reading fluency score. For a summary of results of both models,
see Table 13.

77
Table 13
Summary Analyses for Parent Ratings of Social-Emotional Strengths as Predictors of Early
Literacy
Model 1 Model 2
Variable B (SE) β B (SE) β Social Comp. .28 (.23) .09 .91 (.34) .30*
Self-Reg./Resp. -.00 (.12) -.00 -.21 (.19) -.15
Empathy .16 (.35) .04 .04 (.52) .01
Age .37 (.23) .10 1.34 (.33) .35***
Gender -.61 (1.97) -.02 .63 (2.86) .20*
SES -.78 (.62) -.08 .57 (.92) .05
Early Literacy 1 .85 (.07) .76***
R2 .67 .22
F 30.36*** 5.14***
Note. *p < .05. ***p < .001. Gender (1 = Male; 2 = Female); Social Comp. = Social Competence; Self-Reg/Resp. = Self-Regulation/Responsibility; Early Literacy 1 = Early literacy achievement at beginning of the year
Research question two. In order to determine the extent to which parent ratings of
students’ social-emotional strengths predict early math skills at the end of kindergarten, a
multiple regression was conducted with early math skills as the dependent variable, and social
competence, self-regulation, empathy, student’s age, student’s gender, SES, and prior academic
achievement (e.g., early math at time point one) as the independent variables (model 1). An
alpha level of .05 was used to determine statistical significance. Overall, the model was
significant, F (6, 109) = 13.00, p < .001, and accounted for 46% of the variance in early math
skills. With all variables in the model, only previous academic achievement (as measured by
missing number fluency time point 1) was statistically significant β = .63, p < .001, indicating

78
that only prior academic achievement significantly predicted current academic achievement in
early math skills.
As previously stated, prior academic achievement has been shown to be a strong
predictor of current academic achievement. Therefore, further analyses were conducted without
prior academic achievement included as a predictor. In model 2, analyses were conducted with
early math skills at time point 2 as the dependent variable, and social competence, self-
regulation/responsibility, empathy, student’s age, student’s gender, and SES as the dependent
variables. Overall, the model was statistically significant, F(5, 110) = 2.82, p < .01, with an
explained variance of only 14%. In this model, no construct of social-emotional strengths as
rated by parents made a unique contribution to the model. However, results of the analyses
revealed that student’s age made a statistically significant contribution to the model (β = .34, p
< .001) For a summary of both regression analyses, see Table 14.
Research question three. In order to determine the extent to which teacher ratings of
students’ social-emotional strengths predict early literacy skills at the end of kindergarten, a
multiple regression was conducted with early literacy skills as the dependent variable, and
teacher social-emotional strengths total score, student’s age, student’s gender, SES, and prior
academic achievement (e.g., early literacy at time point one) as the independent variables (model
1). An alpha level of .05 was used to determine statistical significance. Overall, the model was
statistically significant, F(4, 146) = 69.91, p <. 001, and accounted for 71% of the variance in
early literacy. With all variables included in the model, previous academic achievement
contributed the most and was statistically significant β = .80, p < .001.
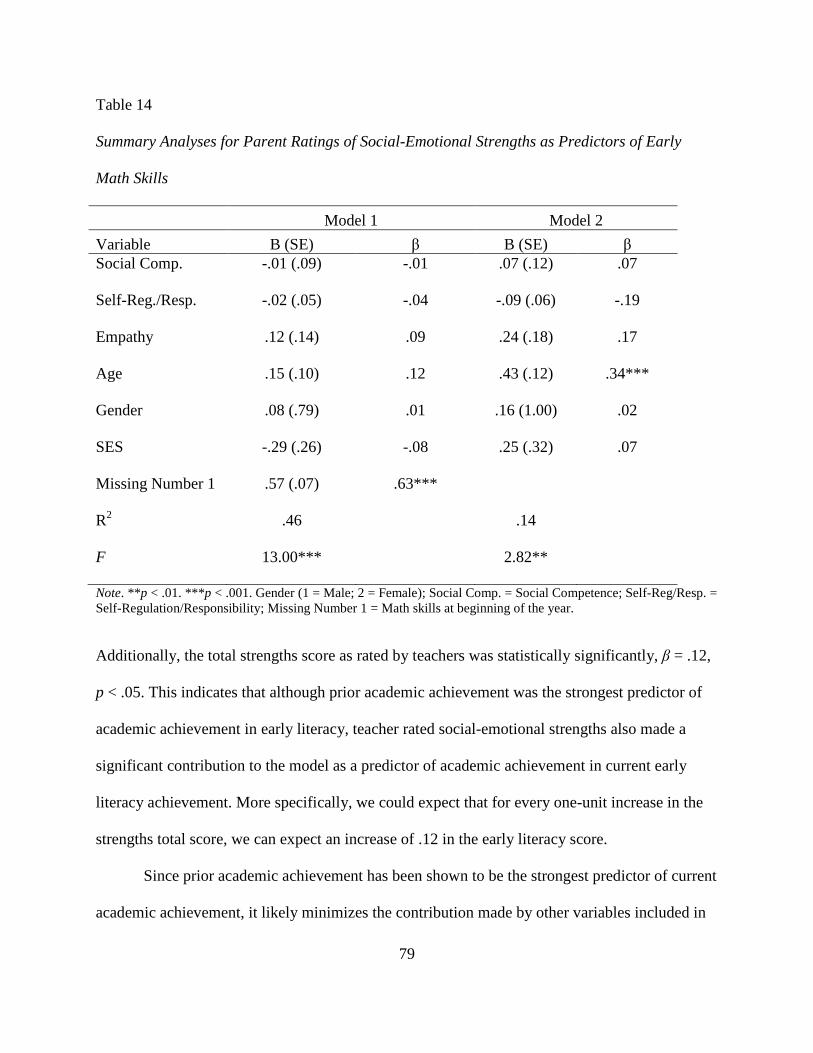
79
Table 14
Summary Analyses for Parent Ratings of Social-Emotional Strengths as Predictors of Early
Math Skills
Model 1 Model 2
Variable B (SE) β B (SE) β Social Comp. -.01 (.09) -.01 .07 (.12) .07
Self-Reg./Resp. -.02 (.05) -.04 -.09 (.06) -.19
Empathy .12 (.14) .09 .24 (.18) .17
Age .15 (.10) .12 .43 (.12) .34***
Gender .08 (.79) .01 .16 (1.00) .02
SES -.29 (.26) -.08 .25 (.32) .07
Missing Number 1 .57 (.07) .63***
R2 .46 .14
F 13.00*** 2.82**
Note. ** p < .01. ***p < .001. Gender (1 = Male; 2 = Female); Social Comp. = Social Competence; Self-Reg/Resp. = Self-Regulation/Responsibility; Missing Number 1 = Math skills at beginning of the year.
Additionally, the total strengths score as rated by teachers was statistically significantly, β = .12,
p < .05. This indicates that although prior academic achievement was the strongest predictor of
academic achievement in early literacy, teacher rated social-emotional strengths also made a
significant contribution to the model as a predictor of academic achievement in current early
literacy achievement. More specifically, we could expect that for every one-unit increase in the
strengths total score, we can expect an increase of .12 in the early literacy score.
Since prior academic achievement has been shown to be the strongest predictor of current
academic achievement, it likely minimizes the contribution made by other variables included in

80
the regression equation. Therefore, less stringent analyses were again conducted excluding prior
achievement in the regression equation in order to better determine the unique contribution made
by teacher rated social-emotional strengths. The second model was analyzed using early literacy
skills at time point 1 as the dependent variable, and strengths total score, student’s age, student’s
gender, and SES as the independent variable. Overall, the model explained 19% of the explained
variance in early literacy, and was statistically significant F(3, 147) = 8.25, p <. 001. When
excluding prior achievement, teacher rated total strengths was statistically significant β = .28, p <
.01, and was the strongest predictor of current academic achievement. Additionally, student’s age
was statistically significant (β = .23, p < .01). A summary of results from both regression
analyses is presented in Table 15.
Table 15
Summary Analyses for Teacher Ratings of Social-Emotional Strengths as Predictors of Early
Literacy Skills
Model 1 Model 2
Variable B (SE) β B (SE) β Strengths Total Score
.26 (.11) .12* .62 (.18) .28**
Age .13 (.18) .03 .91 (.30) .23**
Gender -.67 (1.60) -.02 2.33 (2.65) .07
SES -1.07 (.53) -.09 .25 (.88) .02
Early Literacy 1 .90 (.06) .80***
R2 .71 .19
F 69.91*** 8.25***
Note. *p < .05 ** p < .01. ***p < .001. Gender (1 = Male; 2 = Female. Early Literacy 1 = Early literacy achievement at the beginning of the year.
81
Research question four. In order to determine the extent to which teacher ratings of
students’ social-emotional strengths predict early math skills at the end of kindergarten, a
multiple regression was conducted with early math skills as the dependent variable, and teacher
social-emotional strengths total score, student’s age, student’s gender, SES, and prior academic
achievement (e.g., Missing Number Fluency at time point one) as the independent variables
(model 1). An alpha level of .05 was used to determine statistical significance. Overall, these
variables explained 47% of the variance in early math skills, and the model was statistically
significant, F(4, 146) = 25.35, p < .001. With all variables included, prior academic achievement
was significant β = .69, p < .001, indicating that prior academic achievement was the strongest
predictor of current academic achievement in early math skills. Additionally, student’s age was
statistically significant (β = .14, p < .05).
As referenced earlier, since previous literature indicates prior academic achievement as a
strong predictor of current academic achievement, a second regression analyses was conducted
without the inclusion of prior academic achievement as a predictor. The second model was
analyzed using early math skills at time point 2 as the dependent variable, and strengths total
score, student’s age, student’s gender, and SES as the independent variables. Overall, the model
explained 9% of the variance in early math skills, which was statistically significant, F(3, 147) =
3.61, p < .01. In this second model, students’ total strengths score as rated by teachers was not
significant, indicating that it did not predict students’ current achievement in early math skills at
the end of kindergarten. However, student’s age was statistically significant (β = .24, p < .01),
indicating that it was the only significant predictor of current achievement in math skills at the
end of kindergarten For a summary of further results from the regression analyses, see Table 16.

82
Table 16
Summary Analyses for Teacher Ratings of Social-Emotional Strengths as Predictors of Early
Math Skills
Model 1 Model 2
Variable B (SE) β B (SE) β Strengths Total Score
-.03 (.05) -.05 .09 (.06) .13
Age .17 (.08) .14* .28 (.10) .24**
Gender .40 (.66) .04 -.36 (.85) -.04
SES -.22 (.22) -.06 .17 (.28) .05
Missing Number 1 .60 (.06) .66***
R2 .47 .09
F 25.35*** 3.61**
Note. *p < .05. **p < .01. ***p < .001. Gender (1 = Male; 2 = Female); Missing Number 1 = Early math skills at beginning of the year.
Correlation Analyses
Research question five. In order to determine the relationship between parent ratings of
students’ total social-emotional strengths and teacher ratings of students’ social-emotional
strengths, Pearson product-moment correlations were conducted. As referenced in the correlation
matrix above, there was a moderate, positive correlation between the two variables, r = .47, p <
.01. This indicates that high ratings of social-emotional strengths as rated by parents are
associated with high ratings of social-emotional strengths by teachers (see Table 8).

83
Z-score for Dependent Correlations Analysis
Research question six. To determine whether parent or teacher ratings of students’
social-emotional strengths are more predictive of early literacy skills, z scores for two dependent
correlations were computed. The correlations used for the analyses include the correlation
between parents ratings of social-emotional strengths and early literacy skills (r = .21, p < .05),
teacher ratings of social-emotional strengths and early literacy skills (r = .39, p < .01), and parent
and teacher ratings of social-emotional strengths (r = .47, p < .01). An alpha level of .05 and a
critical level of z = ± 1.96 was used to determine statistical significance. Results of this analysis
were significant (z = - 2.03, p < .05), which indicates a statistically significant difference
between the correlations of parent and teacher ratings of students’ social-emotional strengths and
early literacy skills. Specifically, teachers’ ratings of social-emotional strengths were more
predictive of early literacy achievement than parent ratings of social-emotional strengths.
Research question seven. In order to determine whether parent or teacher ratings of
students’ social-emotional strengths are more predictive of early math skills, z scores for two
dependent correlations were conducted. The correlations used for the analyses include the
correlation between parents ratings of social-emotional strengths and early math skills (r = .07, p
= .47), teacher ratings of social-emotional strengths and early math skills (r = .23, p < .05), and
parent and teacher ratings of social-emotional strengths (r = .47, p < .01). An alpha level of .05
and a critical level of z = ± 1.96 was used to determine statistical significance. Results of this
analysis were not significant (z = -1.69, p = .09), indicating that there is no statistically
significant difference between parent and teacher ratings of social-emotional strengths and early
math skills.
84
Chapter V: Discussion
The purpose of the current study was to investigate the association between parent and
teacher-rated social-emotional strengths and academic achievement (e.g., early literacy and
math) in kindergarten students. This line of research is important, as no study currently
examines the relationship between social-emotional strengths and current academic achievement
in kindergarten students using a multidimensional, strength-based assessment. To address this
purpose, the current study had four goals. First, it examined if parent ratings of social-emotional
strengths predicted early academic achievement outcomes in both early literacy and early math
skills. More specifically, the current study aimed to identify which, if any, parent rated social-
emotional strength was most predictive of early academic achievement. Second, the current
study examined if teacher rated social-emotional strengths predicted academic achievement in
early literacy and early math skills. Third, it aimed to determine the relationship between parent
rated social-emotional strengths and teacher rated social-emotional strengths. Finally, the current
study aimed to examine whether teacher or parent ratings of social-emotional strengths better
predicted early literacy and numeracy skills. In the following sections, results from the current
study will be discussed, as well as contributions to the literature, limitations of the study, future
directions for research, and implications for school psychologists.
Parent Ratings of Social-Emotional Strengths and Academic Outcomes
Results of the current study demonstrated that none of the domains of social-emotional
strengths (e.g., social competence, self-regulation/responsibility, empathy) as rated by parents
predicted early literacy scores in kindergarten, when controlling for other variables (e.g., prior

85
achievement, age, gender, SES). When including every variable in the analyses (i.e., prior
achievement, age, gender, SES, social competence, self-regulation/responsibility, empathy),
together they accounted for 66% of the variance in early literacy. Individually, only prior
academic achievement predicted early literacy, which was contrary to what was hypothesized, as
it was expected that social-emotional strengths would predict current achievement, given that
past research has demonstrated a link (Caprara et al., 2000; Feshbach & Feshbach, 1987; Howse
et al., 2003; McClelland et al., 2000; McClelland, 2006). However, given that prior achievement
is likely to be the strongest predictor of current achievement, less stringent analyses were also
run without prior achievement included. When prior achievement was removed from the
equation, social-emotional strengths (and the control variables of age, gender and SES) only
accounted for 22% of the variability in early literacy skills, with social competence being the
only significant predictor of the social-emotional strengths. This is consistent with the hypothesis
that either social competence or self-regulation contributes to early literacy more so than other
domains of social-emotional strengths.
One possible reason that social competence was most predictive of early literacy
achievement in the current study is that students with higher levels of social competence may be
more apt to ask for help when needed, or be more willing to work with other students. These
results are consistent with findings by Ladd et al. (1998), which indicated that students with
higher levels of social competence participated more in class and were more successful
academically. This highlights the importance of positive social interactions with others for
academic outcomes. Furthermore, Ladd et al. (1998) have discussed the idea that students with
positive social interactions tend to cultivate social benefits and positive outcomes, such as
helping others, or sharing access to outcomes. Therefore, students who have higher ratings of

86
social competence may be more willing, or better developed, to work with other students and
their teachers. Specifically, social competence may be a particularly important asset for academic
achievement because strong social skills may allow the student to advocate for themselves, ask
for help appropriately, and work collaboratively with their peers on academic work.
In contrast, the findings in the current study were contrary to the findings of McClelland
et al. (2000), in which they found work-related skills (self-regulation, responsibility,
independence, and cooperation) to be significant predictors of academic achievement, but
interpersonal skills (positive interactions with peer, sharing, cooperation) were not significantly
related to academic achievement. It is important to note that McClelland et al. (2000) used
teachers as raters, rather than parents. Additionally, McClelland et al.’s (2000) definition of
work-related skills also includes independence and cooperation, which differs from the definition
of the construct of self-regulation/responsibility as defined by Merrell (2011) on the SEARS.
This difference in definitions suggest that there is some overlap in the construct measured for
self-regulation/responsibility by both McClelland et al. (2000) and Merrell (2011), but that they
also measure some distinct information. These differences in definitions may be one explanation
for the contrary results of McClelland et al.’s (2000) finding that work-related skills were more
predictive, and the current study’s finding that social competence was more predictive.
As an additional factor related to how measurement of strengths could have related to the
outcomes, it is also important to note that the SEARS is targeted for students between the ages of
5 and 18. Conversely, the Cooper-Farran Behavioral Rating Scale, used in the study by
McClelland et al. (2000), was developed specifically for the kindergarten population. The scale
was developed from interviews with kindergarten teachers, and focuses solely on kindergarten
entry (Cooper & Farran, 1988). Given that the SEARS focuses on a more diverse age group, the
87
language of the measure may be less applicable to kindergarten students compared to the
Cooper-Farran scale. This is particularly true for the responsibility items such as “Accept
responsibility” and is “Trusted.”. Therefore, if some of the items, especially those on the self-
regulation/responsibility subscale, are less applicable to younger students, this may have
impacted the results of the current study in such a way that the self-regulation/responsibility
subscale on the SEARS may not be as predictive of academic outcomes, while the self-
regulation/responsibility subscale of the Cooper-Farran Behavioral Rating Scale was.
Another reason why social competence, but not self-regulation/responsibility and
empathy may not have positively predicted achievement is that some authors have suggested that
these skills are not evident, or developed, in the kindergarten population (Elliot et al., 2008).
Therefore, the items pertaining to responsibility on the SEARS may be more applicable or
appropriate for older students rather than younger students.
In terms of the relationship between social-emotional competence, as rated by parents,
and early math skills, results of the current study demonstrated that none of the domains of
social-emotional strengths as rated by parents were significant predictors of early math skills.
These results were consistent when controlling for previous academic achievement in math and
when excluding prior academic achievement from the regression equation. When including
previous achievement in math, the variables (i.e., social competence, self-
regulation/responsibility, empathy, prior achievement, age, gender, and SES) accounted for 46%
of the variability in math scores, with prior academic achievement contributing a statistically
significant amount of variance. With prior achievement removed, social-emotional strengths (and
the control variables age, gender and SES) only accounted for 14% of the variability in early
math achievement, with age being the only statistically significant predictor of current

88
achievement in early math skills at the end of kindergarten. These results were contrary to what
was hypothesized, as previous literature has shown social-emotional strengths to predict
academic achievement in math (Hair et al., 2006; Howse et al., 2003; Ladd et al., 1999).
One possible reason for these contrary findings may be due to the use of different raters.
As previously mentioned, most studies have focused on raters within the academic environment
(i.e., teachers and peers; Caprara et al., 2000; Hair et al., 2006; Howse et al., 2003) rather than
parents. One possibility for this discrepancy between parent raters and those within the
academic setting may be that teachers may have better insight in to which behaviors are related
to academic success, which will be explored in more depth in a later section. This is important
because as school psychologists, we need to make educated decisions on who can provide the
most salient ratings when assessing students.
One other possibility regarding why social emotional strengths were not predictive of
current math achievement could be that these strengths do not have an immediate effect on
achievement, but rather their benefits show up later. Supporting this point, previous literature has
demonstrated the impact of social-emotional strengths on later academic achievement (Hair et
al., 2006; Ladd et al., 1999; Miles & Stipek, 2006, O’Neil et al., 1997). More specifically, these
studies measure social-emotional development in kindergarten, but examine their effects on
achievement at a later time point, such as between the 1st and 3rd grade. Conversely, the current
study examined the effect of social-emotional competence on concurrent academic achievement.
Given that previous literature has indicated social-emotional competencies are predictive of later
academic achievement, the benefits of strong social-emotional competencies may be more
evident as the student gets older. One reason this may be true could be that a students get older,

89
they continue to increase their social-emotional competence, and begin to better apply these
skills to their academic work.
Teacher Ratings of Social-Emotional Strengths and Early Academic Outcomes
A second objective of the current study was to examine if teacher ratings of social-
emotional strengths predicted academic achievement in early literacy and early math skills.
Results of the current study demonstrated that the full model, including social-emotional total
strengths, prior academic achievement, age, gender, and SES, accounted for 71% of the
variability in current early literacy achievement. Prior academic achievement was the strongest
predictor of current early literacy scores. However, as expected, teacher rated social-emotional
strengths was also a statistically significant predictor of current early literacy achievement, but
accounted for only 1% of the variance. The fact that social-emotional strengths predicted current
academic achievement in early literacy suggests that social-emotional strengths do play an
important role in kindergarten students academic functioning, even when considering previous
achievement. This is consistent with previous literature that suggests social-emotional strengths
are predictive of reading achievement (Caprara et al., 2000; McClelland et al., 2000; McClelland,
2006). However, social-emotional strengths were not separated into specific domains, so it
cannot be determined which social-emotional strength predicts current academic functioning in
early literacy over and above the others. Therefore, future research could examine teacher ratings
of specific social-emotional strengths to determine if one predicts better academic outcomes over
the others.
In terms of math achievement, teacher ratings of social-emotional strengths were
examined to determine if they were predictive of current early math skills. Results of the current
study demonstrated that social-emotional strengths as rated by teachers were not significant
90
predictors of early math skills whether previous academic achievement was controlled for or not.
When all variables were included, the model explained 47% of the variability in early math
scores. However, when excluding previous early math skills from the equation, the variables
explained 9% of the variability in early math skills. Age was the only statistically significant
predictor of current early math achievement at the end of kindergarten.. This finding was
contrary with previous literature that indicates teacher-rated social-emotional outcomes predict
math achievement (Caprara et al., 2000; Feshbach & Feshbach, 1987; Howse et al., 2003;
McClelland et al., 2000; McClelland, 2006).
Although these results were expected for early literacy based on previous literature that
show social-emotional strengths predict academic achievement, there are some differences
within the current study that allow it to further contribute to this body of research. Previous
studies have typically focused on one specific domain of social-emotional development, such as
prosocial behaviors (Caprara et al., 2000), social-competence (Ladd et al., 1999), empathy
(Feshbach & Feshbach, 1987), and self-regulation (Howse et al., 2003; Shields et al., 2001). In
contrast, the assessment used in the current study involves a more comprehensive definition of
social-emotional strengths, as it includes four generally accepted constructs of social-emotional
competence rather than just one. By including these four empirically-derived domains this study
yields results that suggest that overall social-emotional competence is important to academic
achievement outcomes. This is important as one possibility is that overall strengths in these areas
are important and strengths in one domain could possibly make up for weaknesses in another
area. This is an important area of research for future studies.
In addition to the use of a total strengths score, which uses ratings of multiple social-
emotional strengths, the current study used an assessment tool with slightly different definitions

91
for each social-emotional strength. Although previous literature has focused on similar constructs
(i.e., social competence, self-regulation, empathy, and responsibility), their definitions of each
are inconsistent. More specifically, McClelland et al. (2000) included independence and
cooperation in their definition of work-related skills, which is slightly different than the
definition for the construct self-regulation/responsibility given by the SEARS (Merrell, 2011).
Moreover, Zins et al. (2007) and CASEL (2003) include the building of relationships or
relationship management, while Merrell (2011) discusses maintaining of friendships for the
construct of social-competence. Therefore, although the constructs measured for social-
emotional competence are similar, the actual definitions used vary across studies. There is a
need for future research in this field to use more standard definitions of constructs to ensure that
accurate comparisons across studies can be made.
As previously stated, one possibility why social-emotional strengths were not predictive
of current math achievement could be that these strengths do not have an immediate effect on
achievement. Rather, their benefit may be more evident later, similar to the results of previous
studies in which they demonstrated the impact of social-emotional strengths on later academic
achievement (Hair et al., 2006; Ladd et al., 1999; Miles & Stipek, 2006, O’Neil et al., 1997).
Further discussion on why social-emotional strengths were predictive of current early literacy
achievement but not early math achievement is presented later in this chapter.
Relationship Between Parent and Teacher Ratings of Social-Emotional Strengths
A third aim of the current study was to determine the relationship between parent and
teacher ratings of social-emotional strengths for kindergarten students. As expected, results of
the current study demonstrated that there was a moderate, positive relationship between parent
and teacher ratings (r = .47). This is consistent with previous literature that indicates cross

92
informant raters (specifically parents and teachers) tend to show a moderate correlation (Crane et
al., 2011; Renk & Phares, 2004). Although research has consistently demonstrated that cross
informant raters show a low to moderate correlation, most previous research has focused on
deficit-based assessments. In fact, only one study has investigated the agreement between parent
and teacher ratings on a strength-based, multidimensional rating scale, which indicated similar
findings of a moderate, positive correlation (Crane et al., 2011). Therefore, the current study
contributes to the limited literature base about the association between cross informant raters on
multidimensional, strength-based assessments. Moreover, this strengthens the argument that
agreement of cross informant raters for strength-based assessments is consistent or even more
consistent than for deficit-based assessments.
It is also important to note that while a positive, moderate relationship between parents
and teachers indicate they may both contribute somewhat overlapping, but also distinct
information about student competence, there are some differences in their ratings. One likely
reason is that parents and teachers observe children in different environments. This is important,
as parents and teachers may be observing different behaviors. For example, a student may
communicate differently with parents or family members than they would with teachers or other
peers. Additionally, a teacher may observe students interacting with their peers more so than
parents do, so they would potentially be able to rate a child based on more social interactions
with peers than parents would be able to. Moreover, teachers may be better able to rate a
student’s social-emotional strengths based on their ability to complete school work. More
specifically, when measuring self-regulation, a teacher may be able to provide information on
how students regulate or manage themselves when completing assignments, as they complete
more work at school as compared to at home. This may be especially true for kindergarten
93
students, as they typically have less homework at this age as compared to older students,
resulting in parents having fewer opportunities to see their child engaged in academic work.
Lastly, teachers in general have more students to compare a child to when providing ratings, and
therefore may have a more clear understanding of what represents typical behavior.
Parent and Teacher Ratings of Social-Emotional Strengths as Predictors of Academic
Achievement
The final objective of the current study was to examine if parent or teacher ratings of
social-emotional strengths were more predictive of academic achievement in early literacy and
early math skills for kindergarten students. This is important to consider given that collecting
ratings from multiple informants can be difficult at times. Therefore, a decision often needs to be
made about who can provide the most salient ratings of social-emotional strengths for students.
As expected, teachers’ ratings of social-emotional strengths were more predictive of early
literacy achievement than parent ratings of social-emotional strengths. This was not surprising
given that previous research has focused on the use of teacher ratings as opposed to parent
ratings (Caprara et al., 2000; Hair et al., 2006; O’Neil, et al., 1997), as well as the fact that
teachers likely have more insight in academic achievement, and behaviors related to academic
achievement. Therefore, they may be better able to determine those behaviors that set the child
up for academic success, whereas a parent may focus on a different set of behaviors such as
those that help the child get along with their family. This finding is important because if it is
difficult to collect multiple ratings of students’ social-emotional strengths, teacher ratings are
likely to yield information that better predicts early literacy outcomes.
In contrast to the early literacy findings, results of the current study demonstrated that
there were no significant difference between parent and teacher ratings of social-emotional
94
strengths related to early math achievement. Therefore, neither parent nor teacher ratings of
social-emotional strengths are more strongly associated with early math achievement in
kindergarten students. These results are contrary to what was hypothesized based on the
available literature. It was expected that teacher ratings would be more predictive or early
academic achievement given that previous literature has focused on teacher ratings (Caprara et
al., 2000; Hair et al., 2006; O’Neil et al., 1997), as well as the fact that both the teacher ratings of
social-emotional strengths and early math achievement occur in the same setting and teachers
may have better insight in to the behaviors that promote academic success.
It is important to note that, while there was no significant differences related to early
math achievement, there was a significant difference related to early literacy between the
predictability of parent and teacher ratings of social-emotional strengths. Additionally, similar
results were found for the predictability of social-emotional strengths on early literacy and early
math achievement, in which social-emotional strengths did predict current achievement in early
literacy, but did not predict current achievement in early math skills. One reason for this may be
that some of the social-emotional strengths include communication. Social competence, for
example, is a multilayered construct (Eisenberg, Fabes, & Spinrad, 2006; Howes, 1987; Mayr &
Ulich, 2009) that includes the component of verbal communication (Merrell, 2011). Given that
these social-emotional strengths include verbal communication components, they may be better
related to reading skills, as they also require more verbal components than math. Math skills may
require less verbalization, and are more black and white in terms of what is correct and incorrect.
Therefore, this level of communication and language in both reading and social-emotional
strengths, but not in math, may have contributed to the differences in predictability of social-
emotional strengths and academic achievement.

95
Contributions to the Literature
The current study contributes to the existing literature on social-emotional strengths and
academic outcomes in kindergarten given that no study has specifically looked at the relationship
between social-emotional strengths and current academic achievement using a multidimensional,
strength-based assessment. Given that previous research has demonstrated a relationship between
these skills and academic achievement (current and future achievement; Caprara et al., 2000;
Feshbach & Feshbach, 1987; Howse et al., 2003; McClelland et al., 2000; McClelland, 2006), it
is important to examine the relationship between each of the constructs of social-emotional
strengths and academic achievement to determine which, if any, are better predictors of
academic success. The current study showed that social competence in particular was very
important. Therefore, it may be beneficial to focus more attention on increasing kindergarten
students’ social-competence as compared to other social-emotional strengths. Additionally,
although the individual constructs were not explored with teachers, the fact that a
comprehensive, empirically derived scale of social emotional strengths was used indicates that
overall strengths in these areas are also important, as strengths in one area might make up for
weaknesses in others.
Additionally, the current study contributes to the existing literature on the use of multiple
informants across settings as raters of social-emotional strengths. This is important, as past
research has focused mostly on the use of one informant (teachers), or raters from the same
setting (teachers and peers). It is important to note that previous studies have utilized measures in
which including multiple informants (teachers and parents) would be possible, but only teacher
data was collected or utilized. For example, in the study conducted by Hair et al. (2006), social
emotional development was measured by a students’ level of self-control. This was assessed
96
using the Social Rating Scales (SRS). In the original ECLS study, both parent and teacher
information was collected using the SRS, but Hair et al. (2006) utilized only the teacher data.
Additionally, currently only one study has examined the relationship between multiple
informants across settings using a multidimensional, strength-based assessment (Crane et al.,
2011), which found a positive, moderate relationship. This study validates the findings from the
Crane et al. (2011) study. The current study also adds to this literature by utilizing a sample of
students in kindergarten, which is slightly older than the preschool age students used by Crane et
al. (2011). Lastly, the current study adds to this literature as it used a different measure than that
of Crane et al. (2011) to measure social-emotional strengths.
No study has examined if parent or teacher ratings of social-emotional strengths using a
multi-dimensional, strength-based assessment are more predictive of academic success. In the
current study, the use of multiple informants allowed for the direct comparison of which
informants’ ratings of social-emotional strengths are most predictive of academic achievement in
kindergarten students. Of particular importance, the current study showed that teacher ratings of
social-emotional strengths are more predictive of academic achievement in early literacy.
However, no difference was observed between raters for achievement in early math skills. It will
be important for future research to determine if there are real differences between academic
areas, or if these were artifacts of the measures used, as discussed above.
The current study also contributes to the literature by using a more diverse sample than
has been previously used in other studies. Of the studies that focus on social-emotional
development, only one study utilized a larger sample, representative of the kindergarten
population across the country (Hair et al., 2006). However, the study by Hair et al. (2006) only
included student participants from the US. The current study incorporated participants from two

97
countries, the US and Canada, representing a more diverse population. The use of a more
geographically diverse sample helps to add to the generalizability of social-emotional strengths
predicting current early academic achievement in kindergarten students.
Additionally, the current study contributes to the literature on this topic by including
academic measures that are more sensitive to growth across the academic year. Most of the
previous research has focused on broad measures of academic outcomes, such as letter grades
and standardized tests, as opposed to measures that assess key basic early reading and math
skills. Therefore, the current study adds to the literature base by assessing reading and math
outcomes using curriculum-based measures, which provided a more detailed picture of specific
early numeracy and literacy skills (Shinn, 2008).
Finally, this study contributes to the literature on this topic as very few studies have
utilized or examined the validity and reliability of the Social Emotional Assets and Resilience
Scales (SEARS; Merrell, 2011). A search of the current literature base revealed that there are
four published studies and two dissertations that review the SEARS or utilize the SEARS in
measuring social-emotional strengths in students. However, none of these studies review the
reliability or validity of the SEARS solely in the kindergarten population. Additionally, the
literature currently available only includes authors involved in the development of the
assessment tool. The current study provides justification for SEARS to be a reliable tool when
measuring students’ social-emotional strengths given that it showed good to excellent internal
consistency.
Limitations and Future Directions for Research
Although these findings contribute to the current literature on this topic, there are a
number of limitations that need to be considered when interpreting results. The sample included

98
in the current study is considered to be a convenience sample, in which the director of
psychological services was used to recruit schools and students. School psychologists may have
felt some pressure to participate in the study as they were recruited from their supervisor.
Additionally, schools that have an important difference on an unmeasured variable (e.g., higher
academic achievement, differing levels of parent involvement, teachers more interested in
teacher involvement) may have been more willing to participate than other schools in the district.
Therefore, the results may not be generalizable to the entire kindergarten population.
A second limitation to the current study is that the data utilized are nested data. Intraclass
correlation coefficients (ICC) were examined to ascertain the extent of this limitation. The
intraclass correlation analyses that were conducted were relatively high. Specifically, the SEARS
ratings were clustered by teachers, yielding an ICC of .145, and by schools (using parent SEARS
ratings) yielding an ICC of .112. This indicates a high level of variance could be contributed to
factors at different levels of the ecological system, such as school or teacher characteristics.
Moreover, the relatively small sample size may have resulted in some of the unexpected
findings. To address these limitations, further research studies should utilize a larger sample size,
which would allow for the use of multilevel modeling, which is more appropriate for nested data.
Another limitation to the study is that the teacher rating forms were brief. The use of the
SEARS-T short form is another potential limitation to the study design. Using a short form
potentially leaves out components of certain domains that may significantly affect outcomes.
However, the full scale score and the short form score were found to be highly related with a
correlation of .98 (Merrell, 2011). Additionally, the use of a short form only allowed for the
comparison of the total strengths score between raters (i.e., parent and teachers) versus individual
dimensions of student strengths. Therefore, comparisons could not be made between individual

99
domains of social-emotional strengths. This is important given that teachers’ ratings of total
strengths for kindergarten students significantly predicted early literacy achievement, as well as
the fact that teacher ratings were more predictive of academic achievement in early literacy
compared to parents. Thus, future research should further examine the relationship between
academic achievement and individual social-emotional strengths as rated by teachers to
determine which, if any, are more predictive.
Implications for School Psychologists
The findings from the current study yield multiple implications for school psychologists.
First, the indication that social-emotional strengths as a whole are related to current academic
achievement, specifically early literacy, has implications for building upon these skills in
kindergarten students. Although prior academic achievement is a better predictor of academic
success, it is important to note that not all kindergarten students may attend preschool or have a
formal education before entering kindergarten. Therefore, utilizing a strength-based assessment
measuring students’ social-emotional strengths can be helpful. More specifically, building upon
their social-emotional strengths in children may have added benefits of positive academic
outcomes.
Additionally, findings from this study indicate that it may be beneficial to build
kindergarten students’ social-emotional strengths to promote academic success, which is
consistent with teacher beliefs that social-emotional skills and strengths are just as important, if
not more important than academic skills (Johnson, Gallagher, Cook, & Wong, 1995; Lin,
Lawrence, & Gorrell, 2003; Rimm-Kauffman, Pianta, & Cox, 2000). Moreover, those programs
that target building social-emotional strengths may not only impact those skills, but may also
impact students’ academic success. This is important, as it serves as a justification for using time
100
in the classroom, or other resources, to implement programs focused on building students’
social-emotional strengths. There are a number of programs that exist targeting the development
of social-emotional skills. For example, the Second Step and Strong Kids programs focus on
increasing the social-emotional competence of students, and could be incorporated in to the
students’ curriculum. Additionally, while focusing on increasing kindergarten students’ social-
emotional strengths as a whole is important, findings from the current study suggest it may be
most important to focus on social competence. Given that social competence was more
predictive of early literacy achievement in kindergarten students than other social-emotional
strengths, choosing a curriculum that focuses on increasing social competence would be critical.
Moreover, if a teacher, school, or district is worried about the amount of time needed to focus on
increasing students’ social-emotional strengths, the current study would suggest that it would
then be most important to focus that limited amount of time on specifically increasing social
competence in kindergarten students.
The current study also has implications about who may be best suited to rate kindergarten
students’ social-emotional strengths. There was a positive, moderate relationship between parent
and teacher raters, indicating that they are similar, but there are some differences between them.
More specifically, teacher ratings were found to be more predictive for early literacy skills, while
there was no difference for early math achievement. Although previous research has indicated
that the use of both parent and teacher ratings yield better predictive power for students’
academic, behavioral, and health outcomes as compared to using one informant (Verhulst et al.,
1994), there will undoubtedly be times when it is difficult to collect both ratings. Therefore,
school psychologist can make an informed decision that since teacher ratings are more predictive
of academic achievement, then teacher ratings may be preferred.

101
In conclusion, the present study determined that social-emotional strengths are
significantly related to current academic achievement in kindergarten students. The only
exception to that finding was that of parent ratings of social-emotional strengths not being
predictive of early math achievement in kindergarten students. Additionally, the current study
demonstrated that teacher ratings of social-emotional strengths were more predictive than parent-
ratings of early literacy skills. Taken together, these results show that teachers may offer more
meaningful ratings for social-emotional strengths in kindergarten students. This result could
potentially be beneficial, as teachers are often easier to access for school psychologists. Findings
from this study provide further insight in to the importance of measuring social-emotional
strengths in kindergarten students. It also provides further evidence on the importance of
implementing social-emotional programs or curriculum in to the education of our students. This
is important as this study provides information that such program may not only increase a
student’s social-emotional competence, but that it also may yield positive results in terms of a
student’s academic achievement.

102
References
Achenbach, T. M., McConaughy, S. H., & Howell, C. T. (1987). Child/adolescent behavioral
and emotional problems: Implications of cross-informant correlations for situational
specificity. Psychological Bulletin, 101(2), 213-232.
doi: 10.1037/0033-2909.101.2.213
Adler, F., & Lange, G. (1997). Children’s mastery orientations and school achievement in the
elementary grades. Poster presented at the biennial meetings of the Society for Research
in Child Development, Washington, D.C.
Almon, J., & Miller, E. (2011). The crisis in early education: A research-based case for more
play and less pressure. College Park, MD: Alliance for Childhood.
Antaramian, S. P., Huebner, S., Hills, K. J., Valois, R. F. (2010). A dual-factor model of mental
health: Toward a more comprehensive understanding of youth functioning. American
Journal of Orthopsychiatry, 80(4), 463-472. doi: 10.1111/j.1939-0025.2010.01049.x
Beaver, B. R. (2008). A positive approach to children’s internalizing problems. Professional
Psychology, Research and Practice, 39(2), 129-136.
Behar, L., & Stringfield, S. (1974). A behavior rating scale for the preschool child.
Developmental Psychology, 10(5), 601-610. doi : 10.1037/0735-7028.39.2.129
Caprara, G. V., Barbaranelli, C., Pastorelli, C., Bandura, A., & Zimbardo, P. G. (2000). Prosocial
foundations of children’s academic achievement. Psychological Science, 11(4), 302 –
306. doi: 10.1111/1467-9280.00260

103
Clarke, B. & Shinn, M. (2004a). A preliminary investigation into the identification and
development of early mathematics curriculum-based measurement. School Psychology
Review, 33(2), 234-248.
Clarke, B., & Shinn, M. (2004b). Tests of Early Numeracy. AIMSweb. NCS Pearson, Inc.
Cohn, B, Merrell, K.W., Felver-Grant, J., Tom, K., & Endrulat, N.R., (2009). Strength-based
assessment of social and emotional functioning: SEARS-C and SEARS-A. In Meeting of
the National Association of School Psychologists, Boston. 2009.
Collaborative for Academic, Social, and Emotional Learning, (2003). Safe and sound: An
educational leader’s guide to evidence based social and emotional learning programs.
Chicago: University of Illinois at Chicago.
Cooper, D.H., & Farran, D.C. (1988). Behavioral risk factors in kindergarten. Early Childhood
Research Quarterly, 3(1), 1-19. doi: 10.1016/0885-2006(88)90026-9
Cooper, D.H., & Farran, D.C. (1991). The Cooper-Farran Behavioral Rating Scales. Brandon,
VT: Clinical Psychology Publishing Co., Inc.
Crane, J., Mincic, M. S., & Winsler, A. (2011). Parent-teacher agreement and reliability on the
devereux early childhood assessment (DECA) in English and Spanish for ethnically
diverse children living in poverty. Early Education and Development 22(3), 520-547. doi:
10.1080/10409289.2011.565722
Denham, S. A. (2006). Social-emotional competence as support for school readiness: What is it,
and how do we assess it? Early Education and Development, 17(1), 57 – 89. doi:
10.1207/s15566935eed1701_4
104
Denham, S. A., Blair, K.A., DeMulder, E., Levitas, J., Sawyer, K., Auerbach-Major, S., &
Queenan, P. (2003). Preschool emotional competence: Pathway to social competence?
Child Development, 74(1), 238 – 256. doi: 10.1111/1467-8624.00533
DiPerna, J. C., & Elliott, S. N. (2002). Promoting academic enablers to improve student
achievement: An introduction to the mini-series. School Psychology Review, 31(3), 293 –
297.
Doerner, E., Kaye, N., Nese, R., Merrell, K., & Romer, N. (2011). The social-emotional assets
and resilience scales short forms: Reliability and validity. Poster presented at the annual
convention of the National Association of School Psychologists, San Francisco, CA.
Dunn, L. M. & Dunn, L. M. (1981). Peabody Picture Vocabulary Test – Revised. Circle Pines,
MN: American Guidance Service.
Eisenberg, N., Fabes, R.A., & Spinrad, T.L. (2006). Prosocial development. In R. Lerner, W.
Damon (Eds.). Handbook of child psychology. (pp. 646-718). Hoboken, NJ, US: John
Wiley.
Elias, M. J. (2004). The connection between social-emotional learning and learning disabilities:
Implications for intervention. Learning Disability Quarterly, 27(1), 53-63. doi:
10.2307/1593632
Elliot, S. N., Roach, A. T., & Beddow III, P. A. (2008). Best practices in preschool social skills
training. In A. Thomas, & J. Grimes, (Eds). Best practices in school psychology – V.
Bethesda, MD: The National Association of School Psychologists.
Elliott, J., Lee, S. W., & Tollefson, N. (2001). A reliability and validity study of the Dynamic
Indicators of Basic Early Literacy Skills-Modified. School Psychology Review, 30, 33–
49.

105
Epstein, M. H., Dakan, E., Oswald, D. P., & Yoe, J. T. (2001). Using strengths-based data to
evaluate children's mental health programs. In M. Hernandez, S. Hodges, (Eds.).
Developing outcome strategies in children’s mental health. Systems of care for children’s
mental health. (pp. 153-166). Baltimore, MD, US: Paul H Brooks Publishing.
Feshbach, N. D. (1982). Sex differences in empathy and social behavior in children. In N.
Eisenberg (Eds.), The development of prosocial behavior (pp. 315-338). New York:
Academic Press.
Feshbach, N. D., & Feshbach, S. (1987). Affective processes and academic achievement. Child
Development, 58(5), 1335-1347. doi: 10.2307/1130625.
Gagnon, S. G., Nagle, R. J., & Nickerson, A. B. (2007). Parent and teacher ratings of peer
interactive play and social-emotional development of preschool children at risk. Journal
of Early Intervention, 29(3), 228 – 242. doi: 10.1177/105381510702900303
Greenspoon, P. J., & Saklofske, D. H. (2001). Toward an integration of subjective well-being
and psychopathology. Social Indicators Research, 54, 81, 108. doi:
10.1023/A:1007219227883
Gresham , F. M., Elliot, S. N., Cook., C. R., Vance, M. J., & Kettler, R. (2010). Cross informant
agreement for ratings for social skill and problem behavior ratings: An investigation of
the social skills improvement system-rating scales. Psychological Assessment, 22(1),
157-166. doi: 10.1037/a0018124
Hair, E., Halle, T., Terry-Humen, E., Lavelle, B., Calkins, J. (2006). Children’s school readiness
in the ECLS-K: Predictions to academic, health, and social outcomes in first grade. Early
Childhood Research Quarterly, 21, 431 – 454. doi: 10.1016/j.ecresq.2006.09.005

106
Hintze, J. M., Christ, T. J., & Keller L. A. (2002). The generalizability of CBM survey-level
mathematics assessments: Just how many samples do we need? School Psychology
Review, 31(4), 514 – 528.
Howes, C. (1987). Social competence with peers in young children: Developmental sequences.
Developmental Review, 7, 252 – 272. doi: 10.1016/0273-2297(87)90014-1
Howse, R. B., Lange, G., Farran, D. C., & Boyles C. D. (2003). Motivation and self-regulation as
predictors of achievement in economically disadvantaged young children. The Journal of
Experimental Education, 71(2), 151-174. doi: 10.1080/00220970309602061
Huebner, E.S., & Gilman, S. (2003). Toward a focus on positive psychology in school
psychology. School Psychology Quarterly, 18(2), 99-102. doi:
10.1521/scpq.18.2.99.21862
Izard, C., Fine, S., Shultz, D., Mostow, A., Ackerman, B., & Youngstrom, E. (2001). Emotion
knowledge as a predictor of social behavior and academic competence in children at risk.
Psychological Science, 12(1), 18 – 23. doi: 10.1111/1467-9280.00304
Jastak, J. F., & Jastak, S. (1978). Wide Range Achievement Test Manual. Los Angeles: Western
Psychological Services.
Jimerson, S.R., Sharkey, J.D., Nyborg, V., Furlong, M.J. (2004). Strength-based assessment and
school psychology: A summary and synthesis. The California School Psychologist, 9, 9-
19. doi: 10.1007/BF03340903
Johnson, L.J., Gallagher, R. J., Cook, M., & Wong, P. (1995). Critical skills for kindergarten:
Perceptions from kindergarten teachers. Journal of Early Intervention, 19(4), 315 – 349.
doi: 10.1177/105381519501900406
107
Kuhl, J., & Kraska, K. (1993). Self-regulation: Psychometric properties of a computer-aided
instrument. German Journal of Psychology, 17(1), 11-24.
Ladd, G. W., Birch, S. H., & Buhs, E. S. (1999). Children’s social and scholastic lives in
kindergarten: Related spheres of influence? Child Development, 70(6), 1373 – 1400.
Ladd, G. W., & Profilet, S. M. (1996). The child behavior scale: A teacher-report measure of
young children’s aggressive, withdrawn, and prosocial behaviors. Developmental
Psychology, 32, 1008-1024. doi: 10.1037/0012-1649.32.6.1008
Lebuffe, P. A., & Naglieri, J. A. (1999). Devereux Early Childhood Assessment: User’s Guide.
Lewisville, NC: Kaplan Press.
LeBuffe, P.A., Shapiro, V.B. (2004). Lending “strength” to the assessment of preschool social-
emotional health. The California School Psychologist, 9, 51-61.
Lin, H., Lawrence, F. R., & Gorrell, J. (2003). Kindergarten teacher’s views of childrens’
readiness for school. Early Childhood Research Quarterly, 18(2), 225 – 237. doi:
10.1016/S0885-2006(03)00028-0
MacDonald, G. B., & Valdivieso, R. (2001). Measuring deficits and assets: How we track youth
development now, and how we should track it. In P. L. Benson & K. J. Pittman (Eds)
Trends in Youth Development (pp. 155-186). Springer US.
Markwardt, F. (1989). Peabody Individual Achievement Test-Revised. Circle Pines, MN:
American Guidance Service.
Martinez, R. S., Missall, K. N., Graney, S. B., Aricak, O. T., & Clarke, B. (2009). Technical
adequacy of early numeracy curriculum-based measurement in kindergarten. Assessment
for Effective Intervention, 34(2), 116-125. doi: 10.1177/1534508408326204

108
Masten, A. S., & Coatsworth, J. D. (1998). The development of competence in favorable and
unfavorable environments. American Psychologist, 53(2), 205-220. doi: 10.1037/0003-
066X.53.2.205
Mayr, T., & Ulich, M. (2009): Social-emotional well-being and resilience of children in early
childhood settings – PERIK: an empirically based observation scale for practitioners.
Early Years: An International Journal of Research and Development, 29(1), 45-57. doi:
10.1080/09575140802636290
McClelland, M. M., Acock, A. C., & Morrison, F. J. (2006). The impact of kindergarten
learning-related skills on academic trajectories at the end of elementary school. Early
Childhood Research Quarterly, 21(4), 471-490. doi: 10.1016/j.ecresq.2006.09.003
McClelland, M. M., Morrison, F. J., & Holmes, D. H. (2000). Children at-risk for early academic
problems: The role of learning-related social skills. Early Childhood Research Quarterly,
15, 307–329. doi: 10.1016/S0885-2006(00)00069-7
Merrell, K. W. (2011). Social-emotional assets and resilience scales (SEARS). Lutz, FL:
Psychological Assessment Resources.
Merrell, K. W., Felver-Gant, J. C., Tom., K. M. (2011). Development and validation of a parent
report measure for assessing social-emotional competencies of children and adolescents.
Journal of Child and Family Studies, 20(4), 529-540. doi: 10.1007/s10826-010-9425-0
Miles, S. B., & Stipek, D. (2006). Contemporaneous and longitudinal associations between
social behavior and literacy achievement in a sample of low-income elementary school
children. Child Development, 77(1), 103-117. doi: 10.1111/j.1467-8624.2006.00859.x

109
National Governors Association Center for Best Practices, Council of Chief State School
Officers (2010). Common Core State Standards. Washington D.C.: National Governors
Association Center for Best Practices, Council of Chief State School Officers.
National Reading Panel (2000). Teaching children to read: An evidence-based assessment of the
scientific research literature on reading and its implications for reading instructions.
National Institute of Child Health and Human Development, National Institutes of
Health.
Nickerson, A., B. (2007). The use and importance of strength-based assessment. School
Psychology Forum: Research in Practice, 2(1), 15-25
O’Neil, R., Welsh, M., Parke, R. D., Wang, S., & Strand, C. (1997). A longitudinal assessment
of the academic correlates of early peer acceptance and rejection. Journal of Clinical
Child Psychology, 26(3), 290 – 303. doi: 10.1207/s15374424jccp2603_8
Pallant, J. (2013). SPSS survival manual: A step by step guide to data analysis using IBM SPSS
(5th ed.). New York: NY: McGraw-Hill.
Park, N, Peterson, C, and Seligman, M. E. (2004). Strengths of character and well-being. Journal
of Social and Clinical Psychology, 23(5), 603-619. doi: 10.1521/jscp.23.5.603.50748
Raver, C. C., & Knitzer, J. (2002). Ready to enter: What research tells policymakers about
strategies to promote social and emotional school readiness among three- and four-year-
olds. New York: National Center for Children in Poverty.
Renk, K., Phares, V. (2004). Cross-informant ratings of social competence in children and
adolescents. Clinical Psychology Review, 24, 239-254. doi: 10.1016/j.cpr.2004.01.004

110
Rimm-Kaufman, S. E., Pianta, R. C., & Cox, M. J. (2000). Teachers’ judgments of problems in
the transition to kindergarten. Early Childhood Research Quarterly, 15(2), 147 – 166.
doi: 10.1016/S0885-2006(00)00049-1
Ritchey, K. D. (2008). Assessing letter sound knowledge: A comparison of letter sound fluency
and nonsense word fluency. Exceptional Children, 74(4), 487-506.
Rose-Krasnor, B. (1997). The nature of social competence: A theoretical review. Social
Development, 6, 111-135. doi: 10.1111/j.1467-9507.1997.tb00097.x
Seligman, M.E.P. (2002). Positive psychology, positive prevention, and positive therapy. In C.R.
Snyder & S. J. Lopez (Eds.), Handbook of positive psychology (pp. 3-9). New York:
Oxford University Press.
Seligman, M.E.P., & Csikszentmihalyi, M. (2000). Positive psychology: An introduction.
American Psychologist, 55, 5-14. doi: 10.1037//0003-066X.55.1.5
Shields, A., & Cicchetti, D. (1997). Emotion regulation in school-aged children: The
development of a new criterion Q-sort scale. Developmental Psychology, 33(6), 906-916.
doi: 10.1037/0012-1649.33.6.906
Shields, A., Dickstein, S, Seifer, R, Giusti, L, Maagee, K. D., & Spritz, B. (2001). Emotional
competence and early school adjustment: A study of preschoolers at risk. Early
Education and Development, 12(1), 73- 96. doi: 10.1207/s15566935eed1201_5
Shinn, M. R. (2008). Best practices in using curriculum-based measurement in a problem-solving
model. In A. Thomas, & J. Grimes, (Eds). Best practices in school psychology – V.
Bethesda, MD: The National Association of School Psychologists.
Shinn & Shinn. (2008) Test of Early Literacy. AIMSweb. NCS Pearson, Inc.

111
Shonkoff, J. P., & Philips, D. A. (Eds.). (2000). From neurons to neighborhoods: The science of
early-childhood development. Washington, D.C.: National Academy Press.
Spinrad, T., & Eisenberg, N. (2010). Empathy, prosocial behavior, and positive development in
schools. In M J. Furlong, R. Gilman, & S. Huebner (Eds.), Handbook of positive
psychology in schools (119-129). Routledge.
Suldo, S. M., & Shaffer, E. J., (2008). Looking beyond psychopathology: The dual factor model
of mental health in youth. School Psychology Review, 37, 52 – 68.
Verhulst, F. C., Koot, H. M., Van der Ende, J. (1994). Differential predictive value of parents’
and teachers’ reports of children’s problem behaviors: A longitudinal study. Journal of
Abnormal Child Psychology, 22(5), 531-546.
Wilczenski, F L., & Coomey, S. M., (2008). Best practices in service-learning: Enhancing the
social/emotional and academic competence of all students. In A. Thomas, & J. Grimes,
(Eds). Best practices in school psychology – V. Bethesda, MD: The National Association
of School Psychologists.
Yeates, K. O., & Selman, R. L. (1989). Social competence in the schools: Toward an integrative
developmental model for intervention. Developmental Review, 9, 64 – 100. doi:
10.1016/0273-2297(89)90024-5
Zins, J. E., Bloodworth, M. R., WeissbergR. P., & Wahlberg, H. J., (2007). The scientific base
linking social and emotional learning to school success. Journal of Educational and
Psychological Consultation, 17(2-3), 191-210. doi: 10.1080/10474410701413145
Zubrzycki, J. (2011). Common core poses challenges for preschools. Education Week, 31(3).
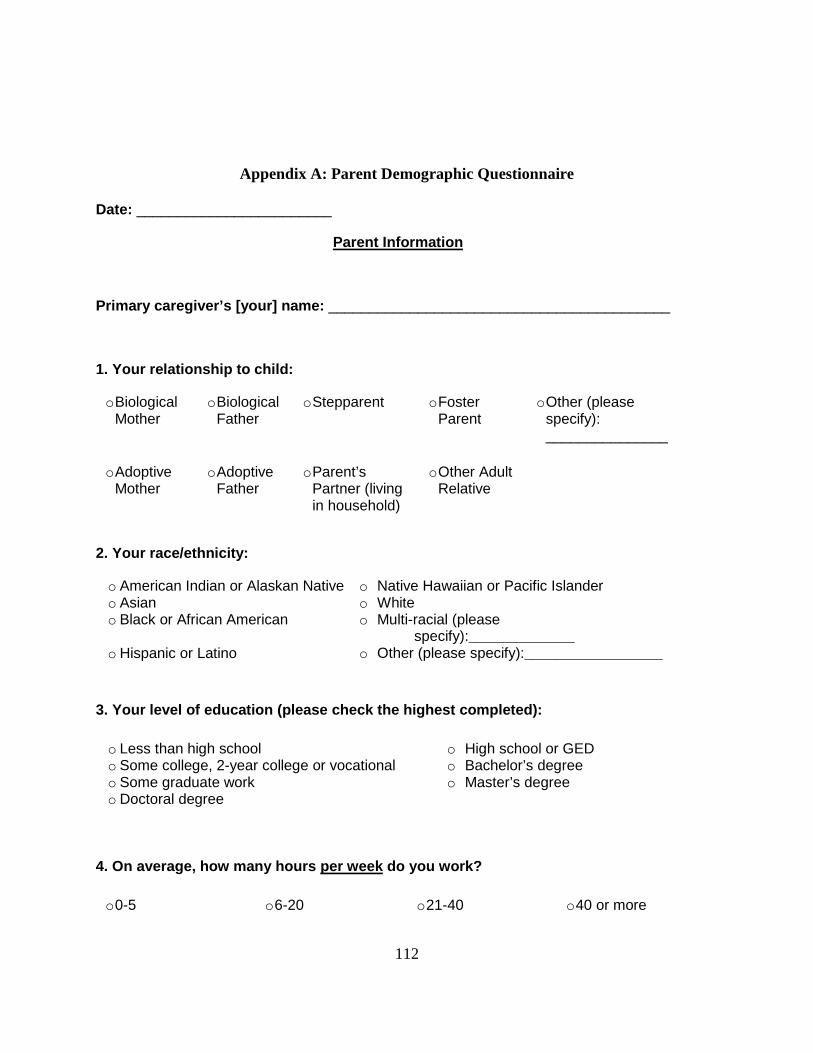
112
Appendix A: Parent Demographic Questionnaire
Date: ________________________
Parent Information
Primary caregiver’s [your] name: __________________________________________
1. Your relationship to child:
o Biological Mother
o Biological Father
o Stepparent o Foster Parent
o Other (please specify): _______________
o Adoptive Mother
o Adoptive Father
o Parent’s Partner (living in household)
o Other Adult Relative
2. Your race/ethnicity:
o American Indian or Alaskan Native o Native Hawaiian or Pacific Islander o Asian o White o Black or African American o Multi-racial (please
specify):_____________ o Hispanic or Latino o Other (please specify):_________________
3. Your level of education (please check the highes t completed):
o Less than high school o High school or GED o Some college, 2-year college or vocational o Bachelor’s degree o Some graduate work o Master’s degree o Doctoral degree
4. On average, how many hours per week do you work?
o 0-5 o 6-20 o 21-40 o 40 or more

113
5. Number of adults in the home who care for childr en (including you): ___________
6. What is your marital status?
o Single, never married o Separated o Divorced o Married o Living together as if married o Widowed
*If Single, never married, please skip to number 10.
Spouse/Partner’s name: _____________________________________________________
7. Spouse/Partner’s relationship to child:
o Biological Mother
o Biological Father
o Stepparent o Foster Parent o Other (please specify)
_______________
o Adoptive Mother
o Adoptive Father
o Parent’s Partner (living in household)
o Other Adult Relative
8. Your spouse/partner’s level of education (please check the highest completed):
o Less than high school o High school or GED o Some college, 2-year college or vocational o Bachelor’s degree o Some graduate work o Master’s degree o Doctoral degree
9. On average, how many hours per week does your spouse/partner work?
o 0-5 o 6-20 o 21-40 o 40 or more
10. What is the primary language spoken in your hom e?
o English o Spanish o French o Vietnamese o Chinese o Korean o Russian o Other (please specify):_________________
11. Family income per year (check one):
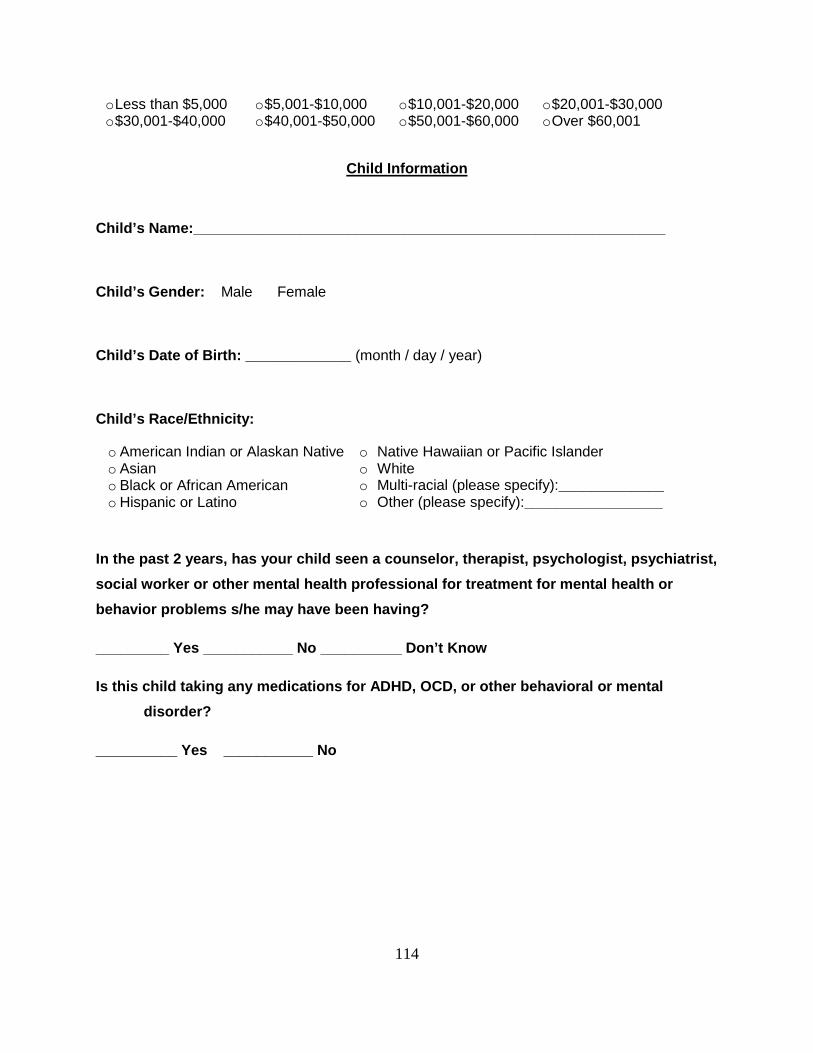
114
o Less than $5,000 o $5,001-$10,000 o $10,001-$20,000 o $20,001-$30,000 o $30,001-$40,000 o $40,001-$50,000 o $50,001-$60,000 o Over $60,001
Child Information
Child’s Name:______________________________________ ____________________
Child’s Gender: Male Female
Child’s Date of Birth: _____________ (month / day / year)
Child’s Race/Ethnicity:
o American Indian or Alaskan Native o Native Hawaiian or Pacific Islander o Asian o White o Black or African American o Multi-racial (please specify):_____________ o Hispanic or Latino o Other (please specify):_________________
In the past 2 years, has your child seen a counselo r, therapist, psychologist, psychiatrist,
social worker or other mental health professional f or treatment for mental health or
behavior problems s/he may have been having?
_________ Yes ___________ No __________ Don’t Know
Is this child taking any medications for ADHD, OCD, or other behavioral or mental
disorder?
__________ Yes ___________ No

115
Appendix B: Parent Consent Form
Dear Parent or Legal Guardian: This letter provides information about a research study that will be conducted at your school by investigators from the University of South Florida. Our goal in conducting the study is to examine child and family factors that help children start school ready to learn. The title of the study is “Predictors of Kindergarten Success: The Roles of Parental Involvement, Child Behavior, and Academic Skills and Enablers” (USF IRB # Pro 4196). � Who We Are: Dr. Julia Ogg, an Assistant Professor in the College of Education at the University of
South Florida (USF), is the Primary Investigator for this study which will be conducted in conjunction
with the Early Childhood Research Group at USF.
� Why We are Requesting You and Your Child’s Participation: This study is being conducted as part of
a project entitled, “Predictors of Kindergarten Success: The Roles of Parental Involvement, Child
Behavior, and Academic Skills and Enablers.” You and your child are being asked to participate
because your child is starting kindergarten in Hillsborough County Public Schools.
� Why You and Your Child Should Participate: We need to learn more about how parents can help
their children start school ready to learn. This study will help us determine how to help parents
support their child’s development as it relates to getting ready to start school. In addition, you will
receive a $10 gift card in the fall for completing a packet of questionnaires and a $10 gift card in the
spring for completing another packet of questionnaires. Your child will receive a small incentive
(e.g., sticker, pencil) for participating in the study. � What Participation Requires: If you consent to participate in the study, you will be asked to fill-out
questionnaires regarding your involvement with school, activities you do with your child at home, your parenting practices, and your child’s behavior two times during the school year: once when you agree to participate (September), and again at the end of the school year (April or May). The packet of questionnaires will take you approximately 50-60 minutes to complete. Your child will be required to complete short assessments of their academic skills three times throughout the school year: once when you agree to participate (September), once around January or February, and again in April or May. These assessments will be completed during the school day at your child’s school and will take approximately 5-10 minutes. Your child’s teacher will also be asked to complete questionnaires about your child’s behavior and their interactions with you regarding your child’s education.
� Please Note: Your decision to participate and to allow your child to participate in this research study
is completely voluntary. You are free to allow your child to participate in this research study or to
withdraw him or her at any time. Your decision to participate, not to participate, or to withdraw
participation at any point during the study will in no way affect your child’s student status, his or her
grades, or your relationship with your child’s school, USF, or any other party.

116
� Confidentiality of You and Your Child’s Responses: The risks to you and your child for participating in
this research are considered minimal. Your privacy and research records will be kept confidential to
the extent of the law. Authorized research personnel, employees of the Department of Health and
Human Services, the USF Institutional Review Board and its staff, and other individuals acting on
behalf of USF may inspect the records from this research project, but your individual responses will
not be shared with school system personnel or anyone other than us. Your questionnaires and your
child’s completed assessments will be assigned a code number to protect the confidentiality of
responses. Only we will have access to the locked file cabinet kept by the Primary Investigator that
will contain: 1) all records linking code numbers to participants’ names, and 2) all information
gathered from assessments and surveys. All records from the study (completed surveys,
assessments) will be destroyed in five years. � What We’ll Do With You and Your Child’s Responses: We plan to use the information from this study
to inform what parenting and child factors help children be ready to start school. The results of this
study may be published. However, the data obtained from you or your child will be combined with
data from other people in the publication. The published results will not include your name or any
other information that would in any way personally identify you or your child. � Questions? If you have any questions about this research study, please contact Julia Ogg at (813)
974-9698. If you have questions about your child’s rights as a person who is taking part in a research
study, you may contact a member of the Division of Research Integrity and Compliance of the USF at
(813) 974-5638. � Want to Participate? To indicate your consent to participate and to have your child participate in
this study, please sign the consent form at the bottom of this page. Sincerely,
Julia Ogg, Ph.D., NCSP
Assistant Professor
School Psychology Program
University of South Florida
---------------------------------------------------------------------------------------------------------------------
Consent for Parent and Child to Take Part in this Research Study
I freely give my permission to let my child take part in this study. I also consent to participate in this
study. I understand that this is research. I have received a copy of this letter and consent form for my
records. ____________________________________ ______________________________
Printed name of child Date
___________________________________ ______________________________
Signature of parent taking part in the study Printed name of parent

117
Statement of Person Obtaining Informed Consent
I certify that participants have been provided with an informed consent form that has been approved by
the University of South Florida’s Institutional Review Board and that explains the nature, demands, risks,
and benefits involved in participating in this study. I further certify that a phone number has been
provided in the event of additional questions.
_____________________________ _____________________ _____________
Signature of person Printed name of person Date
obtaining consent obtaining consent

118
Appendix C: Verbal Assent Description
Verbal Description of Study
When meeting with the child, you will say the following:
“We are doing a study to learn about how kids get ready for kindergarten. We are asking you to help
because we want to learn more about what kids need to know to do well in school. Your parent has said
that it is ok for you to work with me today.
I am going to ask you to do a few activities with me that will let us know which letters, sounds, and
numbers you’ve learned. You will receive a [small prize] for working with me today.
You can ask me questions about the study at any time. If you decide at any time that you want to stop,
just let me know. No one will be upset if you want to stop.”

119
Appendix D: Teacher Consent Form
Dear Teacher: This letter provides information about a research study that will be conducted at your school by investigators from the University of South Florida. Our goal in conducting the study is to examine child and family-level factors that help children start school ready to learn. The title of the study is Predictors of Kindergarten Success: The Roles of Parental Involvement, Child Behavior, and Academic Skills and Enablers (USF IRB # Pro 4196). � Who We Are: Dr. Julia Ogg, an Assistant Professor in the College of Education at the University of
South Florida (USF), is the Primary Investigator for this study which will be conducted in conjunction
with the Early Childhood Research Group at USF.
� Why We are Requesting Your Participation: This study is being conducted as part of a project
entitled, “Predictors of Kindergarten Success: The Roles of Parental Involvement, Child Behavior,
and Academic Skills and Enablers.” You are being asked to participate because you are the teacher
for at least one student who is participating in the study.
� Why You Should Participate: We need to learn more about how parents can help their children be
ready to start school. This study will help us determine how to help parents support their child’s
development as it relates to getting ready to start school. You will receive a $10 gift card for
completing a packet of questionnaires for each student in your classroom who is participating in the
study. You will be asked to complete this[these] packet[s] during the spring of 2012. You will be
asked to complete a packet for each child in your classroom who is participating in the study. You
will receive a gift card for each packet upon your completion of the packets. � What Participation Requires: If you consent to participate in the study, you will be asked to fill-out a
packet of questionnaires for each child in your classroom that is participating in the study in April or May 2012. These questionnaires will ask about the academic skills and behaviors of the child, classroom behaviors, your interactions with the child’s parents, and your general classroom practices. The packet of questionnaires will take you approximately 40 minutes to complete for each child.
� Please Note: Your decision to participate in this research study is completely voluntary. You are free
to participate in this research study or to withdraw at any time. Your decision to participate, not to
participate, or to withdraw participation at any point during the study will in no way affect your
relationship with your school, USF, or any other party. � Confidentiality of Your Responses: The risks to you for participating in this research are considered
minimal. Your research records will be kept confidential to the extent of the law. Authorized
research personnel, employees of the Department of Health and Human Services, the USF
Institutional Review Board and its staff, and other individuals acting on behalf of USF may inspect
the records from this research project, but your individual responses will not be shared with school
120
system personnel, the child’s parents, or anyone other than us. Your completed assessments will be
assigned a code number to protect the confidentiality of your responses. Only we will have access to
the locked file cabinet kept by the Primary Investigator that will contain: 1) all records linking code
numbers to participants’ names, and 2) all information gathered from assessments and surveys. All
records from the study (completed surveys, assessments) will be destroyed in five years.
� What We’ll Do With Your Responses: We plan to use the information from this study to inform what
parenting and child factors help children start school ready to learn. The results of this study may be
published. However, the data obtained from you will be combined with data from other people in
the publication. The published results will not include your name or any other information that
would in any way personally identify you. � Questions? If you have any questions about this research study, please contact Julia Ogg at (813)
974-9698. If you have questions about your rights as a person who is taking part in a research study,
you may contact a member of the Division of Research Integrity and Compliance of the USF at (813)
974-5638. � Want to Participate? To indicate your consent to participate in this study, please sign the consent
form at the bottom of this page. Sincerely, Julia Ogg, Ph.D., NCSP
Assistant Professor
School Psychology Program
University of South Florida
Consent to Take Part in this Research Study
I freely give my permission to take part in this study. I understand that this is research. I have received a
copy of this letter and consent form for my records. ____________________________________ ______________________________
Signature of teacher taking part in the study Date
___________________________________
Printed name of teacher
Statement of Person Obtaining Informed Consent
I certify that participants have been provided with an informed consent form that has been approved by
the University of South Florida’s Institutional Review Board and that explains the nature, demands, risks,
and benefits involved in participating in this study. I further certify that a phone number has been
provided in the event of additional questions.
_____________________________ _____________________ _____________
Signature of person Printed name of person Date
obtaining consent obtaining consent