Embed Size (px)
Citation preview

I am particularly grateful to Professor Dr. Marco Meneguzzo, Dean Dr. Brian Nickerson, and Professor
Alex Murdock for their guidance and advice on this work; the participants and discussants of the ProDoc session of
the 2009 Swiss Public Administration Network conference for their useful feedback; Monica Bommarito for her
support during my time at the University of Lugano; Wilson Center graduate student aid Anna-Kay Sinclair for her
research assistance; and Keywan Rasekhschaffe for his useful insights, keen intuition, and invaluable support. All
errors are my own.
SOCIAL ENTERPRISE:
INNOVATION OR MISSION DISTRACTION?
REBECCA TEKULA, PH.D.
Pace University
Helene and Grant Wilson Center for Social Entrepreneurship
163 William Street, 21st Floor
New York, NY 10038
Tel: (212) 346-1028
Fax: (914) 989-8038

Tekula: Page 2
ABSTRACT
This study examines the relationship between unrelated business income (UBI) and
program-related expenditure of human service nonprofit organizations based in New York
County. The results of my analysis do not indicate a positive relationship between unrelated
business income and programmatic expenditure. These findings are in accordance with cross-
subsidy theories of diversification in which internal budgeting allocates funds to divisions with
few investment opportunities (ailing enterprises of nonprofits) while failing to channel funds to
those with ample investment opportunities (effective, efficient programs that attract public and
private funding).

Tekula: Page 3
INTRODUCTION
“Increased resources bring added outputs, but at the cost of the distraction of the
nonprofit from its declared mission.” Burton Weisbrod, 1988
In 1988, when Burton Weisbrod hypothesized that as nonprofits branch out from their
central mission the quality of their principal tax-exempt activities would decline, the terms
“social entrepreneurship” and “social enterprise” were not part of the popular discourse. Since
then, the work of Bill Drayton (2002), Charles Leadbeater (1997), David Bornstein (2004), and
Gregory Dees (1998) have further shaped the way academics and practitioners think about social
entrepreneurship, social enterprise and sustainable income in nonprofit organizations. The
central argument of many of their theories is that charitable or socially beneficial activities will
be longer lasting and have a more penetrating effect when these activities are either married with
or fully integrated into a model generating earned income.
The Drayton-Leadbeater-Bornstein-Dees paradigm has significant impact in a growing
sector of the global economy. The nonprofit sector plays an increasingly important role in the
provision of vital services in fields such as healthcare, social service, and education. The size of
the U.S. nonprofit sector has increased rapidly from approximately 12,000 registered
organizations in 1940 to over 1.5 million today, and the aggregate book value of assets, as
reported by nonprofit organizations which filed IRS information returns for tax year 2008, was
over $4 trillion, or 8.9% of U.S. GDP (Urban Institute, 2009).
Background of Enterprising Behaviors of Nonprofits
Tekula: Page 4
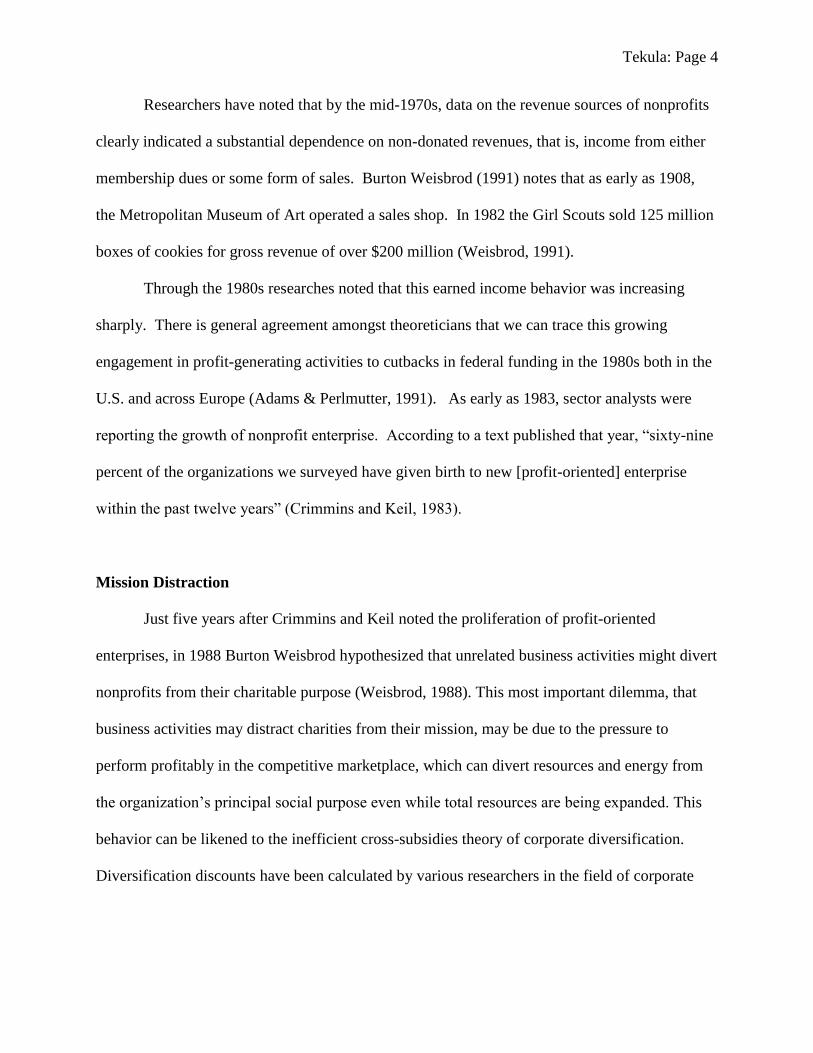
Researchers have noted that by the mid-1970s, data on the revenue sources of nonprofits
clearly indicated a substantial dependence on non-donated revenues, that is, income from either
membership dues or some form of sales. Burton Weisbrod (1991) notes that as early as 1908,
the Metropolitan Museum of Art operated a sales shop. In 1982 the Girl Scouts sold 125 million
boxes of cookies for gross revenue of over $200 million (Weisbrod, 1991).
Through the 1980s researches noted that this earned income behavior was increasing
sharply. There is general agreement amongst theoreticians that we can trace this growing
engagement in profit-generating activities to cutbacks in federal funding in the 1980s both in the
U.S. and across Europe (Adams & Perlmutter, 1991). As early as 1983, sector analysts were
reporting the growth of nonprofit enterprise. According to a text published that year, “sixty-nine
percent of the organizations we surveyed have given birth to new [profit-oriented] enterprise
within the past twelve years” (Crimmins and Keil, 1983).
Mission Distraction
Just five years after Crimmins and Keil noted the proliferation of profit-oriented
enterprises, in 1988 Burton Weisbrod hypothesized that unrelated business activities might divert
nonprofits from their charitable purpose (Weisbrod, 1988). This most important dilemma, that
business activities may distract charities from their mission, may be due to the pressure to
perform profitably in the competitive marketplace, which can divert resources and energy from
the organization’s principal social purpose even while total resources are being expanded. This
behavior can be likened to the inefficient cross-subsidies theory of corporate diversification.
Diversification discounts have been calculated by various researchers in the field of corporate

Tekula: Page 5
finance. Findings estimate that the subsidization of poorly performing segments contributes to
value losses between 13 percent and 15 percent (Berger & Ofek, 1995).
Human Service Nonprofits
Amongst all public charities, human service organizations can be considered the closest
to the traditional definition of charity, in that they provide essential services, especially for those
who are least able to help themselves (USDHHS, 2009). Human service is an area considered
inappropriate for profit making (Groenbjerg, 2001; Guo, 2006). Yet following with overall
trends in the nonprofit sector in recent decades, human service nonprofit organizations have
notably increased their earned income behaviors, tripling this type of income in the years 1995 to
2005 (IRS BMF, 2007)
Nonprofit charitable organizations are generally exempt from paying state and local taxes
on property used “primarily” for the organization’s exempt purpose; and nonprofits are exempt
from federal and state corporate income taxes on income from activities that, even if commercial,
are deemed to be substantially related to the organization’s primary exempt purpose (Cordes &
Weisbrod, 1998). However, in addition to this exempt income, a growing number of tax-exempt
organizations have begun to earn an increasing amount of “unrelated business income” (UBI)
from commercial and other activities that are not substantially related to their tax-exempt
missions and is thus subject to Federal taxation. Income is defined as UBI if it is produced from
an activity that is conducted on a regular basis and is not directly related to an organization’s tax-
exempt mission: the fact that the income may be used for furthering an organization’s exempt
purposes does not alter the definition and therefore any profits from these activities are taxed at
regular corporate or trust income tax rates (Riley, 2002). Current theoreticians of social

Tekula: Page 6
enterprise and social entrepreneurship would term this type of revenue generation by a nonprofit
an “external” model of social enterprise (Alter, 2007).
Until now the possible consequences of social enterprise on programmatic activities has
remained speculative; hard evidence from large sample empirical studies does not exist. Previous
authors have conjectured that an increase in financial dependence on market sales relative to
donations will diminish the contribution of some nonprofits to social welfare (Weisbrod, 1988).
Still, myriad philanthropists and private foundations, as well as government agencies, purport the
benefits of “sustainable” earned income for nonprofit organizations without the benefit of an in-
depth analysis of the effects of earned income on programmatic output. Closer study of the
impact of enterprising activities on program activities is necessary and long-overdue.
Unanswered questions which I hope to address with the present study include: What is the
relationship between unrelated business income (external social enterprise) and program
expenditure? What is the relationship between financial distress factors of organizations and
their enterprising behavior? In other words, do financially weak organizations become more
enterprising, and vice versa? I also attempt to address the issue of causality by relating future
changes in enterprising behavior and program expenditure to lagged explanatory factors.
Tekula: Page 7
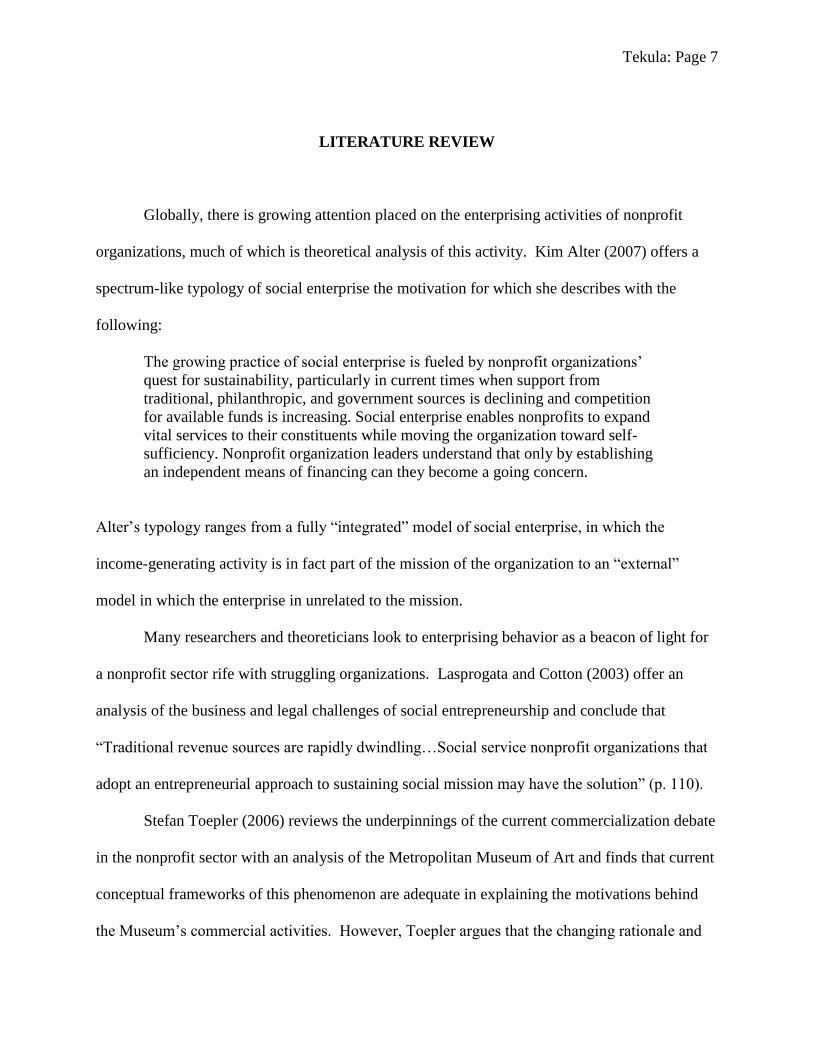
LITERATURE REVIEW
Globally, there is growing attention placed on the enterprising activities of nonprofit
organizations, much of which is theoretical analysis of this activity. Kim Alter (2007) offers a
spectrum-like typology of social enterprise the motivation for which she describes with the
following:
The growing practice of social enterprise is fueled by nonprofit organizations’
quest for sustainability, particularly in current times when support from
traditional, philanthropic, and government sources is declining and competition
for available funds is increasing. Social enterprise enables nonprofits to expand
vital services to their constituents while moving the organization toward self-
sufficiency. Nonprofit organization leaders understand that only by establishing
an independent means of financing can they become a going concern.
Alter’s typology ranges from a fully “integrated” model of social enterprise, in which the
income-generating activity is in fact part of the mission of the organization to an “external”
model in which the enterprise in unrelated to the mission.
Many researchers and theoreticians look to enterprising behavior as a beacon of light for
a nonprofit sector rife with struggling organizations. Lasprogata and Cotton (2003) offer an
analysis of the business and legal challenges of social entrepreneurship and conclude that
“Traditional revenue sources are rapidly dwindling…Social service nonprofit organizations that
adopt an entrepreneurial approach to sustaining social mission may have the solution” (p. 110).
Stefan Toepler (2006) reviews the underpinnings of the current commercialization debate
in the nonprofit sector with an analysis of the Metropolitan Museum of Art and finds that current
conceptual frameworks of this phenomenon are adequate in explaining the motivations behind
the Museum’s commercial activities. However, Toepler argues that the changing rationale and

Tekula: Page 8
the economic fortunes of these enterprising activities highlights the need for a better
understanding of the effects and consequences of commercial activity by nonprofit organizations
which is increased by the push for growth of enterprising behavior by these organizations.
Foster and Bradach (2005) argue that the enthusiasm for business which reached a height
during the 1990’s has had a profound impact on nonprofits. Yet they hypothesize that launching
and running enterprising ventures consumes scarce management resources and dilutes an
organization’s focus on its social programs and caution that executives of nonprofit organizations
should not be encouraged to “search for a holy grail of earned income in the marketplace” for
fear of harming “society itself, which depends for its well-being on a vibrant and mission-driven
nonprofit sector (p. 100).
J. Gregory Dees (2004) cautions that we must not consider nonprofit business ventures as
a panacea: “Nonprofit leaders should not jump on this bandwagon without understanding and
addressing the challenges, costs, and risks of taking the ride…In some cases, the financial
benefits will not be worth the hidden costs to the organization” (p. 4).
Several studies have endeavored to uncover the impact of such behavior on the mission-
related output of nonprofit organizations. For example, in the face of commercialism, blood
transfusion services deteriorated (Titmuss, 1971), and nonprofit organizations that were
successful in their enterprising activities shifted their emphasis toward a more affluent client
base (Adams & Perlmutter, 1991; Weisbrod, 2004). Salamon (1995) examined the impact of
income source on client focus and found that revenue from fees are negatively correlated with
poverty focus.
More recently, Baorong Guo (2006) conducted an analysis of self-reported survey data of
67 nonprofits which considered themselves to be “venturing” (from a larger sample of 519).

Tekula: Page 9
Guo found that as commercial revenue increases in human service nonprofits, donative revenues
decrease. More relevant to my analysis, Guo finds that commercial revenues “do not make a
significant contribution” on the organizations mission and service delivery.
Pierre-Emmanuel LY (2006) analyzed data on 74 UK-based international NGOs to
determine if NGOs treat donated and earned income as perfect substitutes. LY found that while
donated and earned income have a positive and significant effect on charitable expenditure, the
effect of earned income is significantly less than that of donations.
Outside of the literature on social enterprising behavior and nonprofit earned income, we
can also look to the finance literature for information on the allocations of resources between
divisions of a diversified firm. In fact, Rajan, Servaes and Zingales (2000) were able to find
evidence consistent with their hypothesis that when diversity in resources and opportunities
increases in a firm, resources can flow toward the most inefficient division, leading to more
inefficient investment and less valuable firms.
Overall, there have been very mixed reviews and theories of the impact of enterprising
behaviors on the programmatic output of nonprofit organizations. While early work to explore
the impact of enterprising behavior on nonprofits did uncover evidence of a mission shift to less
necessary services, a large focus in the literature has been on touting the strengths of earned
income as a sustainability strategy for nonprofit organizations. Still, many researchers have
concluded that there is a distinct and growing need for a better understanding of the effects and
consequences of commercial activity by nonprofits organizations. But until now, empirical
analysis with a large random sample of nonprofit organizations does not exist in the literature.
Learning from the work of Rajan, et. al., the current analysis endeavors to uncover possible

Tekula: Page 10
similar inefficient investment or cross-subsidy in the allocations of resources in nonprofit
organizations.

Tekula: Page 11
METHODOLOGY
My analysis focuses on addressing the following questions:
(1) What is the relationship between unrelated business income (external
social enterprise) and program expenditure?
(2) What is the relationship between financial distress factors of
organizations and their enterprising behavior?
Specification 1:
My main regression is Specification 1. This regression directly relates the variable
programmatic expenditure as a proportion of total expenditure (PE) to the unrelated business
income as a proportion of total income (UBI_RATIO) and organization size as proxied by total
revenue. The motivation for this model is to explore the relationship between unrelated business
activities, as a percentage of total income, to the contemporaneous and future programmatic
focus. The program expenditure to total expenditure ratio is a commonly used indication of the
potential return on investment for a funder. This ratio represents the amount of a dollar invested
(donated) that will be spent on the programmatic mission of the organization. Total revenue is
introduced in this specification as a control variable.
TRRATIOUBIPE 21 _

Tekula: Page 12
Specification 2
Specification 2 introduces the dependent variable of change in the ratio of program expenditure
to total expenditure and size as proxied by total revenue. While it is often difficult to relate or
predict changes in a variable (here, change in programmatic spending as a proportion of total
spending), with this specification I attempt to draw out the relationship between changes in
unrelated business activity and the change in program focus.
Specification 3
Specification 3 introduces contemporaneous proportion of unrelated business income as the
dependent variable, as related to the value of liabilities-to-assets ratio (LIAB_RATIO) for the
previous organizational year. The motivation for this specification is to uncover the relationship
between organizational distress (LIAB_RATIO) and unrelated business income. Total revenue is
again introduced as a control variable.
Sample and Data
I consider unrelated business income as the sum of Lines 104b and 104d of the IRS Form
990. The lines represent, respectively, taxable unrelated business income and income tax-
excluded by sections 512, 513, and 514 of the tax code. This data, as with the data for each of
my variables, is collected from the IRS Business Master Files and the IRS Statistics of Income
and assumed to be an accurate proxy for the unrelated business activities of the given
TRRATIOUBIPE 21 _
TRRATIOLIABRATIOUBI 21 __

Tekula: Page 13
organizations. I further consider the programmatic expenditure of these organizations to be an
accurate proxy for the relative level of their programmatic activity. Of course we cannot look at
market value of nonprofits, but the output of social goods can be proxied by the expenditure on
social goods (program expenditure).
I test my hypothesis empirically using a sample of nonprofit human service organizations
operating within New York County, which has the same boundaries as the Borough of
Manhattan and is reported in the IRS Business Masters Files as those organizations with the five-
digit Federal Information Processing Standard (FIPS) code 36061. In order to ensure a high level
of homogeneity, I focus on a relatively specific yet large population of organization: human
service nonprofits operating in Manhattan. In addition to offering a homogeneous sample,
human service organizations are often considered the most closely related to the idea of charity,
and are addressing the most visceral needs of the neediest groups of people.
My data are from IRS Form 990 samples drawn by the Statistics of Income (SOI)
Division of the United States Internal Revenue Service, for the six years 2000 to 2005, inclusive.
The Form 990 includes detailed data on each registered nonprofit organization’s revenue,
expenses, assets and liabilities. The SOI samples include all nonprofits that are exempt from
taxation under section 510 ( c ) (3) of the Internal Revenue Code (donations to these
organizations are tax-deductible on personal income tax returns) and that have assets of at least
$10 million, as well as a smaller sample of small organizations. While the number of registered
nonprofits organizations in the U.S with assets of over $10 million represents only 5% of all
nonprofit organizations filing form 990 US Tax Returns (including 990EZ and 990PF), this
group represents 81.5% of total reported revenues and 89.5% of total reported assets for the
sector. From these samples, I drew upon only those in the Human Services division of the

Tekula: Page 14
industry: those classified as within the National Taxonomy of Exempt Organizations (NTEE)
classification system Major Group code “HU”. The final sample represents 700 organizational
years, and covers 2000 to 2005, inclusive.
Characteristics of Sample Nonprofits
Table 1 displays distributions for the characteristics of the sample, including all
explanatory variables used in the regression analysis. The values listed are means of values for
each organization, computed using sums for all years that the organization appears in the sample.
Total expenses values are derived from the value listed as such on the tax return for each
organizational year, for each organization. Program service expenses are also listed as such on
the tax return. Program spending ratio is the proportion of program service expenses to total
expenses. Total revenue includes direct and indirect contributions, government support, revenue
from program services, membership dues, investment revenue, and both related and unrelated
business income. Unrelated business income the sum of Lines 104b and 104d of the IRS Form
990. The lines represent, respectively, taxable unrelated business income and income tax-
excluded by sections 512, 513, and 514 of the tax code. Total assets include cash, savings,
receivables (accounts, pledges, grants, loans, and notes), inventories, prepaid expenses, deferred
charges, investments, land, buildings and equipment. Total liabilities include accounts payable,
accrued expenses, grants payable, deferred revenue, loans, tax-exempt bond liabilities,
mortgages and notes payable.

Tekula: Page 15

Tekula: Page 16
The average expenses for these organizations is $19,176,503. Program services make up
an average of 82.2% of total expenses, at an average $16,647,579. Mean total revenue is
$20,306,188, with an average of $1,325,121 in unrelated business income. The assets of these
organizations are substantial, averaging $42,402,251, with mean liabilities of $19,342,615.
Pearson Correlation Coefficients
Table 2 reports mean cross-sectional correlations for the period 2000 through 2005
(inclusive). Reported correlations are average correlation coefficients across the six years in the
sample. Pearson correlations are presented in the table with corresponding p-values in italics
below.

Tekula: Page 17

Tekula: Page 18
Not surprisingly, the proxy for size (total revenue) is positively correlated with program
spending ratio. Clearly economies of scale would contribute to this finding. Also noteworthy is
the result that total revenue and unrelated business income ratio are strongly correlated, which
indicates that larger organizations are more likely to earn a high proportion of unrelated income.
Regression Analysis
I follow the methodology first proposed by Fama and Macbeth (1973), which continues
to be considered an appropriate and fairly simple approach to analyzing panel data. For each
year, and for each specification of my three models, I conduct cross-sectional regressions and
record the slopes (coefficients). The final coefficients are the time series averages for each of the
cross-sectional slopes. The t-statistic is computed using the time series standard deviation.
Intuitively, it is natural to judge the accuracy of a coefficient by its variation. This approach very
directly uses the time series variation to assess the significance of coefficients. The method was
devised for asset pricing tests, but in this case we face a similar problem of correlated errors in
the cross-sectional dimension.

Tekula: Page 19
RESULTS
Regression Analysis
The next few tables report the results of estimating each of my three specifications for the
six cross-sectional regressions for the years 2000 to 2005, inclusive. Mean coefficients are
means of the six estimates. The t-statistics are computed in the manner of Fama and Macbeth
(1973). The indicated “t-statistic” value in each of the following tables represents the results
from the test on whether or not the coefficients are statistically different from zero. Generally, a
coefficient with a t-stat of ≥1.96 or ≤-1.96 (95% confidence level) indicates that the coefficient is
significantly different from zero. In other words, at ±1.96, there is a 5% chance that the
coefficient is not different from zero.
Table 3 presents the main result of my analysis, Specification 1. In this table, PE
represents the program expenditure to total expenditure ratio. UBI_Ratio is the unrelated
business income as a proportion of total income. TR is Total Revenue.
Specification 1:
TRRATIOUBIPE 21 _
The proportion of unrelated business income (“external” enterprising behavior) is significantly
negatively related to program expenditure ratio. As hypothesized, the internal capital markets of
Table 3: Specification 1
1 2 adjr2
coefficient -0.173 0.064 0.047
tstat (-7.24) (5.68)

Tekula: Page 20
nonprofit firms seem to follow that of for-profit firms in that diversification leads to value loss as
proxied by programmatic expenditure. What can be inferred from my findings is that this
particular type of external enterprising behavior is associated with less value in the programmatic
output of human service nonprofits.
Table 4 presents my next model, Specification 2. ∆PE represents a ratio of the current PE
to the previous period’s PE. UBI is the unrelated business income as a proportion of total
income. ∆UBI_RATIO is the logarithmic change in the proportion of current UBI to the previous
period’s proportion of UBI. TR is total revenue.
Specification 2:
TRRATIOUBIPE 21 _
Here, when considering change in program spending ratio, unrelated business income
remains negatively, but insignificantly associated.
Table 5 details my third and final model, in which UBI _RATIO is the unrelated business
income as a proportion of total income. LIAB_RATIO is the ratio of liabilities to assets. TR is
the total revenue.
Table 4: Specification 2
1 2 adjr2
coefficient -0.13 0.485 0.0065
tstat (-1.19) (0.823)

Tekula: Page 21
Specification 3:
TRRATIOLIABRATIOUBI 21 __
Results from this model suggest that UBI is significantly and negatively related to
organizational distress as proxied by liability-to-asset ratio. This serves as evidence that
nonprofit organizations follow for-profit firms in their diversification behaviors in that
financially stronger (weaker) nonprofits are more likely to have a higher (lower) proportion of
unrelated earned income. In other words, it appears that larger firms are more likely to source
diversified revenues in the form of unrelated business income.
Table 5: Specification 3
1 2 adjr2
coefficient -0.146 -0.001 0.11
tstat (-23.08) (-6.30)

Tekula: Page 22
CONCLUSION
Until now the possible consequences of social enterprise on the programmatic activities
of nonprofit organizations has remained speculative; hard evidence from large sample empirical
studies did not exist. Previous authors have conjectured that an increase in financial dependence
on market sales will diminish the contribution of some nonprofits to social welfare (Weisbrod,
1998). Still, myriad philanthropists, associations and now federal and local governments are
supporting the social enterprise movement with growing fervor, and without the benefit of an in-
depth analysis on the relationship between earned income and programmatic output: closer
study of the impact of enterprising activities on program activities has been necessary and long-
overdue.
My findings are in accordance with cross-subsidy theories of diversification in which
internal budgeting allocates funds to divisions with few investment opportunities (ailing
enterprises of nonprofits) while failing to channel funds to those with ample investment
opportunities (effective, efficient programs). While this research is a first step toward
identifying the factors associated with earned income behavior in nonprofit organizations, there
is much work to be done in this area. My analysis focused clearly on unrelated business income,
which social enterprise scholars and practitioners would consider an “external” funding model in
which the source of funds is not related to the exempt mission of the organization. A large-
sample empirical analysis of the relationship between proportion of programmatic expenditure
and related or “internal” earned income would also be beneficial to the current body of literature.
It also would be useful to identify failures of unrelated business ventures in order to identify

Tekula: Page 23
potential risk factors and begin to understand potential indicators of future success (failure) of
these activities.
Furthermore, in order to create a clear distinction between “charitable” and “business”
activities, I identified human service organizations as the target of my analysis. Much work
could be done in areas of the arts, healthcare, and education which have also experienced growth
in the area of earned income.
Clearly more thought and research must be invested in this area and caution must be
given in popularizing and glorifying the unproven benefits of unrelated or external enterprising
activities on the very organizations that have become important service providers for society’s
neediest individuals.
From a broad perspective, this works has an overarching motivation: myriad
philanthropists, associations and now federal and local governments support with a growing
fervor the social enterprise movement and the use of business practices and measures in the
nonprofit sector, but without the benefit of much analysis on the appropriateness or the success
of these practices and the programmatic output of these vital public service providers.
Continuing exploration and critique of the applicability of business practices in the nonprofit
sector is unarguably important not only for health of the nonprofit sector, but for the well-being
of the general public which has come to rely so heavily on these organizations for human and
social services.

Tekula: Page 24
REFERENCES
Adams, C. & Perlmutter, F. 1991. Commercial venturing and the transformation of America’s
voluntary welfare agencies. Nonprofit and Voluntary Sector Quarterly, 20(1): 25-38.
Alter, K. 2007. Social Enterprise Typology. Washington, DC: Virtue Ventures.
Arnsberger, P., Ludlum, M. , & Riley, M. 2007. IRS Statistics of Income: Current research in
the nonprofit sector. Washington, DC: Internal Revenue Service.
Berger, P. G. & Ofek, E. 1995. Diversification’s effect on firm value. Journal of Financial
Economics, 37: 39-45.
Bornstein, D. 2004. How to change the world: Social entrepreneurs and the power of new
ideas. New York, NY: Oxford University Press.
Cordes, J. A. & Weisbrod, B. A. 1998. Differential taxation of nonprofits and the
commercialization of nonprofit revenues. Journal of Policy Analysis and Management, 17(2):
195-214.
Council of Better Business Bureaus. 1982. Philanthropic advisory services: Standards for
charitable solicitations. Arlington AV: CBBB-PAS.
Crimmins, J. C. & Keil, M. 1983. Enterprise in the nonprofit sector. Washington, DC: Partners
for Livable Places.
Dees, J. G. 1998. The meaning of “social entrepreneurship”. Durham, NC: Duke University.

Tekula: Page 25
Dees, J. G. 2004. Putting nonprofit business ventures in perspective. In S. Oster, C. Massarsky,
& S. Beinhacker (Eds.), Generating and sustaining nonprofit earned income: A guide to
successful enterprise strategies: 1-18. San Francisco, CA: Jossey-Bass.
Drayton, W. 2002. The citizen sector: becoming as entrepreneurial and competitive as business.
California Management Review, 44(3): 122-132.
Fama, E. F. & Macbeth, J. D. 1973. Risk, return, and equilibrium: Empirical tests. Journal of
Political Economy, 81(3): 607-636.
Fama. E. F. & Jensen, M. C. 1983. Agency problems and the theory of the firm. Journal of
Political Economy, 88(2), 327-350.
Foster, W. & Bradach, J. 2005. Should nonprofits seek profits? Harvard Business Review,
83(2): 92-100.
Frumkin, P. & Kim, M. T. 2001. Strategic positioning and the financing of nonprofit
organizations: Is efficiency rewarded in the contributions marketplace? Public Administration
Review, 61(3): 266-275.
Groenbjerg, K. A. 2001. The U.S. nonprofit human service sector: A creeping revolution.
Nonprofit and Voluntary Sector Quarterly, 30(2): 276-297.
Hansmann, H.B. 1980. The role of nonprofit enterprise. The Yale Law Journal, 89: 835-98.
Hansmann, H. B. 1989. Unfair competition and the unrelated business income tax. Virginia Law
Review, 75: 605-35.

Tekula: Page 26
Independent Sector. http://www.independentsector.org/PDFs/npemployment.pdf; Retrieved on
June 1, 2009.
Internal Revenue Service. 2004. Testimony: Charitable giving problems and best practices. IR-
2004-81, June 22, 2004.
James, E. & Rose-Ackerman, S. 1986. The nonprofit enterprise in market economies. New
York: Harwood Press.
Lasprogata, G. A. & Cotton, M. N. 2003. Contemplating “enterprise”: The business and legal
challenges of social entrepreneurship. American Business Law Journal, 41(1): 68-112.
Leadbeater, C. 1996. The rise of the social entrepreneur, London, UK: Demos.
Luksetich, W. 2008. Government funding and nonprofit organizations. Nonprofit and
Voluntary Sector Quarterly, 37: 434-442.
Milgrom, P. & Roberts, J. 1992. Economics, organization and management. United States:
Prentice Hall
National Center for Charitable Statistics. www.nccs.urban.org; Retrieved on June 3, 2009.
Oster, S. 1995. Strategic management for nonprofit organizations. New York: Oxford
University Press.
Riley, M. 1995. Exempt Organization Business Income Tax Returns, 1991. Internal Revenue
Service Statistics of Income Bulletin, 14(4): 38-63.

Tekula: Page 27
Riley, M. 2002. Unrelated business income tax returns, 1998. Internal Revenue Service
Statistics of Income Bulletin, 21(4): 187-215.
Salamon, L. M. 1995. Partners in public service: Government-nonprofit relations in the
modern welfare state. Baltimore, MD: Johns Hopkins University Press.
Schiff, J. & Weisbrod, B. 1993. Competition between for-profit and non-profit organizations in
commercial markets. In A. Ben-Ner & B. Gui (Eds.), The nonprofit sector in the mixed
economy 127-148. Ann Arbor, MI: University of Michigan Press.
Simon, J. G. 1987. The tax treatment of nonprofit organizations: A review of federal and state
policies. In Walter W. Powell (Ed.) The nonprofit sector: A research handbook. 67-98. New
Haven, CT: Yale University Press.
Smith, S.R., 2003. Social services. In L. Salaman (Ed.), The state of nonprofit America.
Washington, D.C.: Brookings Institution Press and Aspen Institute Press.
Titmuss, R. M. 1971. The gift relationship: From human blood to social policy. New York,
NY: Pantheon.
Toepler, S. 2006. Caveat venditor? Museum merchandising, nonprofit commercialization, and
the case of the Metropolitan Museum in New York. Voluntas, 17: 99-113.
United States Department of Health and Human Services. HHS.gov; http://www.hhs.gov/about/;
Retrieved on May, 13, 2009.
Urban Institute; The National Center for Charitable Statistics; http://nccsdataweb.urban.org/;
Retrieved on April 2, 2009.

Tekula: Page 28
Weisbrod B.A. & Schlesinger, M. 1986. Public, private, nonprofit ownership and the response
to asymmetric information: The case of nursing homes. In S. Rose-Ackerman (Ed.) The
Economics of Nonprofit Institutions: Studies in Structure and Policy, 133-151. Oxford: Oxford
University Press.
Weisbrod, B. A. 1988. The nonprofit economy. Cambridge, MA and London: Harvard
University Press.
Weisbrod, B. A. 2004. The pitfalls of profits. Stanford Social Innovation Review, 2(3): 40-47.
Weisbrod, B. A. (Ed.). 1998. To profit or not to profit: The commercial transformation of the
nonprofit sector. New York: Cambridge University Press.
Weitzman, M. S. & Lampkin, L. M. 2002. The new nonprofit almanac and Desk Reference.
New York: Jossey-Bass, Table 1.1. at 4-5.

Tekula: Page 29
BIOGRAPHICAL SKETCH
Rebecca Tekula, PhD, MPA, MBA
Rebecca Tekula, PhD, is the Executive Director of the Helene and Grant Wilson Center for Social
Entrepreneurship, an institute of Pace University aiming to serve students and nonprofit
organizations towards the goal of more effective and efficient nonprofit management practices.
Dr. Tekula completed her PhD in Economics at the University of Lugano, Switzerland. She earned
her BA at Vassar College, her MPA from Pace University, and her MBA from the University of
Oxford. She has an extensive background in New York City philanthropy and across the nonprofit
sector.