Embed Size (px)
Citation preview
88
Social Environment Effects on Health and Aging
Integrating Epidemiologic and DemographicApproaches and Perspectives
TERESA E. SEEMAN
a
AND EILEEN CRIMMINS
b
a
Division of Geriatrics, School of Medicine, University of California, Los Angeles, California, USA
b
Andrus Gerontology Center, University of Southern California, Los Angeles, California, USA
A
BSTRACT
: This paper provides an overview of epidemiological and demo-graphic research linking social characteristics of both individuals and commu-nities to differences in both morbidity and mortality risks. Evidence ispresented linking three broad aspects of the social environment to health—thenetwork of personal social relationships within which most of us live our lives,individual socioeconomic status (SES), and community-level social character-istics. Large and consistent bodies of literature from both epidemiology anddemography provide clear evidence for the generally health-promoting effectsof personal social relationships and SES. The bulk of the evidence relates tomortality although both fields have begun to examine other health outcomes,including aspects of physical and cognitive functioning as well as disease out-comes. A smaller but growing body of community-level data, reflecting boththe socioeconomic/resource characteristics of these broader communities and,more specifically, social features of these environments, also point to healthimpacts from these more macro level social environment characteristics. Muchremains to be elucidated, however, concerning the actual mechanisms throughwhich something as complex and multifaceted as SES “gets under the skin.”This necessarily includes consideration of external characteristics of the envi-ronments (both physical and sociocultural) where people live and work, andindividual characteristics, as well as possible interactions between these in pro-ducing the observed SES gradients in health and mortality. These questionsconcerning links between social environment conditions and health may be aparticularly fruitful area of future collaboration, drawing on the shared inter-est of demographers and epidemiologists in understanding how different socialconditions promote variation in distributions of better versus worse health out-comes within a population.
K
EYWORDS
: social environment effects; health; aging; biopsychosocial model
Address for correspondence: Dr. Teresa Seeman, Division of Geriatrics, UCLA School ofMedicine, 10945 Le Conte Ave., Suite 2339, Los Angeles, CA 90095-1687, USA. Voice: 310-825-8253; fax: 310-794-2199.
89SEEMAN & CRIMMINS: SOCIAL ENVIRONMENT EFFECTS
INTRODUCTION
The past 30 years has witnessed a surge of research interest in the health effectsof the social environment. In truth, however, this might more accurately be classifiedas a
resurgence
of such interest inasmuch as philosophies of disease susceptibilityhave included consideration of the social environment as far back as Hippocrates
1
and up through the seminal work of Emile Durkheim in the late 1800s demonstratingthe significant impact of social integration on suicide risk.
2
With the advent of
germtheory
in the nineteenth century, however, interest in the role of the social environ-ment declined as health research focused largely on the identification of specific bio-logical
agents
or risk factors for disease causation.
1
The inability of these morebiologically focused models to explain population distributions of disease and mor-tality has served as a stimulus for a broader search for explanatory factors—resultingin reconsideration of the potential importance of the social environment.
That the social environment should be a potentially influential factor in determin-ing population distributions of health and mortality is rendered all the more plausibleby the fact that man has evolved as a social animal, living in groups for some twomillion years.
3
The survival advantages incurred with the formation of groups pointto the importance of ties with others in man’s evolution. Social bonds were powerfuladaptive mechanisms, “facilitating such biologically important activities as the pro-tection and upbringing of offspring, hunting, making shelter and collaborating indefense against predators and hostile others.”
4
Such social ties were (and are) sourc-es for many of the material, informational and emotional goods needed to functionadaptively in the surrounding social and physical/material world, providing thingsthat may either be unobtainable without such social interaction, or which could onlybe independently obtained at much greater psychological or material cost.
5
Exten-sive sociological and anthropological research documents the central importance ofthe social environment to attitudes and behaviors. There has been substantialresearch, for example, on the impact of family setting for child development,
6
theconsequences of the work environment for personality and cognitive performance,
7
the relevance of neighborhood subcultures for delinquency,
8
and the significant ofsocial networks for political life and community cohesion.
9
Within this context,extending the realm of
outcomes
influenced by the social environment to health out-comes was not such a great leap.
In this paper, we examine evidence linking three broad aspects of the social envi-ronment to health. First, we examine the network of personal social relationshipswithin which most of us live our lives, including ties with our parents, children, otherrelatives, close friends, other social contacts at work, and other social groups towhich we may belong. Second, moving to a somewhat broader perspective, we exam-ine evidence linking individuals’ socioeconomic status (SES) to their health andwell-being, with particular attention to the ways in which SES relates to a range ofother exposures and experiences likely to affect health risks. Finally, we consider thequestion of community-level social characteristics and their potential impact on thehealth risks of those exposed to differing sociocultural/socioeconomic environments.
In presenting this evidence, we elected to provide a more global overview ofavailable evidence, rather than focusing exclusively on evidence pertaining to olderage groups, because so much of the evidence linking aspects of the social environ-
90 ANNALS NEW YORK ACADEMY OF SCIENCES
ment to health shows consistent relationships across the life-span, particularlythrough adulthood. Where relevant, we do highlight particular evidence showingeffects of the social environment among older adults. However, patterns of associa-tion highlighted in this paper have been demonstrated, not only among more middle-aged adults, but also among those of older age (e.g., 70 and above). The overall “takehome message” from this paper should be that these effects appear to be widespreadand life-long.
In the concluding section, we discuss similarities and differences in epidemiolog-ical and demographic approaches to questions relating the social environment tohealth and aging, with specific attention to potential points of fruitful collaborationin future research—collaborations that could provide greater insight into the likelypopulation-level effects of efforts to promote health through interventions targetedat individual and/or community-level features of the social environment.
PEOPLE AND THEIR SOCIAL NETWORKS
The latest surge of interest in the social environment as a contributor to healthand illness dates largely from the latter half of the twentieth century and such semi-nal articles as John Cassel’s “The Contribution of the Social Environment to HostResistance”.
10
In this article, Cassel reviewed animal and human research illustrat-ing the importance of social integration to health, and the negative health conse-quences that can be seen to result from a lack of social contacts.
Since that time, two broad aspects of the social environment have most frequentlybeen studied in relation to health outcomes. Structural features of the social environ-ment have largely been studied in terms of the number of social relationships thatpeople have (i.e., their level of social integration); structural analyses have alsoexamined the impact of specific types of relationships (e.g., being married). Morequalitative aspects of the social environment have also been studied, largely underthe rubric of
social support.
In contrast to measures of social network structuralcharacteristics that typically involve counts of existing ties, research on more func-tional characteristics of the network typically includes measurement of the relationalcontent of social interactions (e.g., amount of emotional and/or instrumental supportthat is provided).
Mortality
To date, the association between greater social integration and lower mortality riskis perhaps the best documented of the social environment–health relationships, begin-ning with Durkheim’s renowned treatise on suicide
2
and continuing with the exten-sive epidemiologic and demographic research of the past 25 years.
11–13
F
IGURE
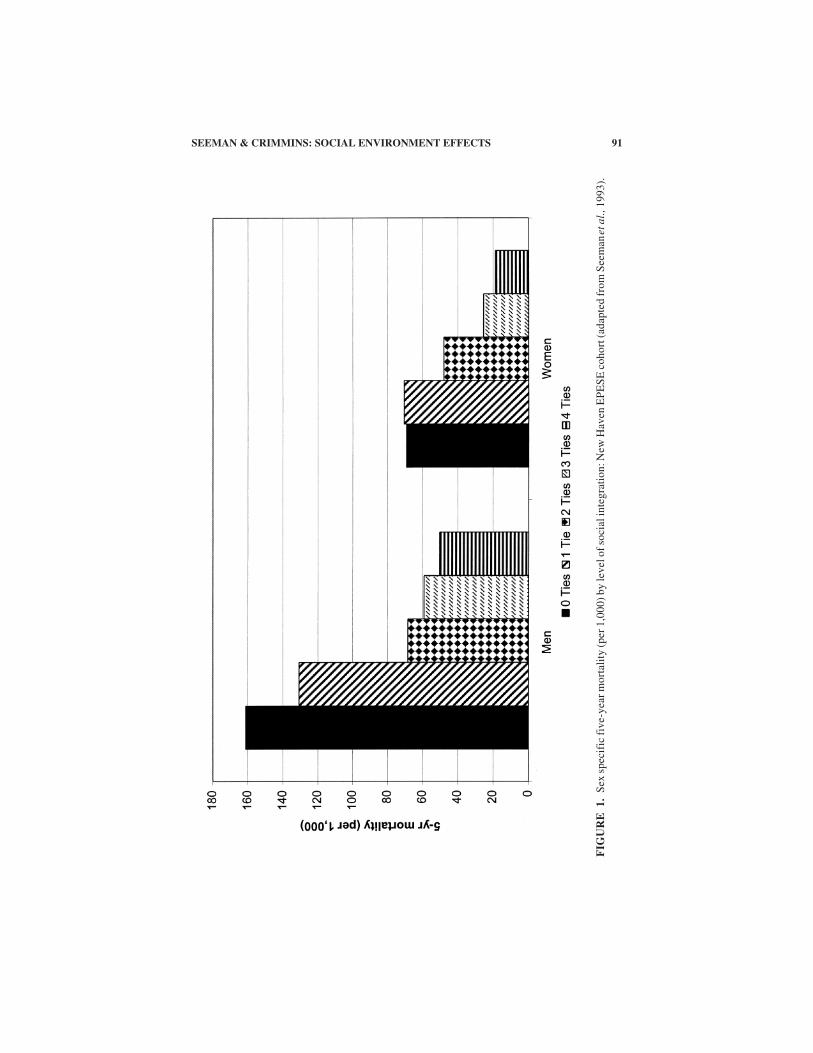
1presents data on five-year mortality from the New Haven cohort of the EstablishedPopulations for the Epidemiological Study of the Elderly, illustrating the general pat-tern of the findings from various longitudinal, community-based studies. As shown,decreasing levels of social integration (measured by a summary index reflecting tieswith a spouse, close friends and relatives, and participation in church and other typesof groups) are associated with increasing mortality.
14
91SEEMAN & CRIMMINS: SOCIAL ENVIRONMENT EFFECTS
FIG
UR
E1.
Sex
spe
cifi
c fi
ve-y
ear m
orta
lity
(per
1,0
00) b
y le
vel o
f soc
ial i
nteg
rati
on: N
ew H
aven
EP
ES
E c
ohor
t (ad
apte
d fr
om S
eem
an et
al.,
199
3).
92 ANNALS NEW YORK ACADEMY OF SCIENCES
Analyses of other community-based, prospective studies,
15
as well as resultsfrom a nationally representative sample of Americans
13
have provided further evi-dence for the protective effects of social integration with respect to longevity. Anumber of community studies from Europe have shown similar patterns.
15
Morbidity
Relationships between social integration and more intermediate health outcomeshave also been documented, including incidence and prognosis for both physical andmental health outcomes.
15,16
Available data on relationships between social ties andmorbidity most frequently relate to cardiovascular disease, with particular attentionto coronary heart disease (CHD) and stroke.
With respect to disease incidence, a longitudinal, community-based study byOrth-Gomer and colleagues in Sweden, examining a cohort of men (aged 50 at theinception of the study), found a significant protective effect of social integration withrespect to incidence of CHD (defined as either nonfatal MI or death attributed toCHD in those found to be free from heart disease at the baseline examination).
17
Ina study of members of a health maintenance organization, Vogt and colleagues
18
alsofound a protective effect of social integration (as indexed by the scope or range ofdifferent types of ties): those reporting a wider
range of social ties
experiencedsignificantly lower 15-year incidence of MI (based on medical record review), againindependent of standard CHD risk factors. However, there were no significant asso-ciations with incidence of other disease outcomes such as hypertension, stroke, andcancer. Other studies, such as the Japanese–American study in Hawaii, have notfound significant effects of overall social integration (based on marital status, tieswith children and parents, social activities with coworkers, and group memberships)with respect to incidence of heart disease (based on examination and review of med-ical records).
19
One possible reason for the lack of a consistent association between level ofsocial integration and incidence of CHD is suggested by findings from a study ofIsraeli men where those reporting higher levels of family problems were found to beat significantly increased risk of developing angina.
20
As these latter data highlight,and as is discussed further below, greater social integration, to the extent that it isaccompanied by greater interpersonal conflict or other interpersonal problems, maynot be uniformly associated with health benefits, including reduced risk of heart dis-ease (or other health outcomes).
With respect to disease severity, several studies of patients undergoing coronaryangiography have examined possible associations between social integration andextent of coronary atherosclerosis. In one study of 161 angiography patients, noassociation was found between level of social integration (based on marital status,ties with close friends/relatives, and group memberships) and the extent of coronaryatherosclerosis (CAD).
21
However, a significant, inverse association was foundbetween levels of instrumental support provided by others and reduced CAD. A sec-ond study
22
also found a significant, inverse association between levels of emotionalsupport and extent of CAD (particularly among Type A patients). Thus, althoughstructural features of social integration (as indexed by social ties with others) do notappear to be associated with disease severity, qualitative features, such as levels of
93SEEMAN & CRIMMINS: SOCIAL ENVIRONMENT EFFECTS
social support, do exhibit a negative association with disease severity—more supportbeing associated with less CAD.
Perhaps the strongest evidence linking social integration and support to morbidityrelates to the evidence of beneficial effects with respect to recovery from CVDevents such as MI and/or stroke. Beginning with the reports of Ruberman
et al.
23
from the B-HAT trial and continuing with reports from Williams
et al.
24
and Case
etal.
,
25
more socially isolated individuals have been shown to experience greater mor-tality post-MI. A study by Berkman
et al.
,
26
also examining survival post-MI, pro-vides evidence suggesting that levels of emotional support may be one importantreason why social isolation conveys greater mortality risk in post-MI patients. Emo-tional support was measured prospective to the actual MI since all subjects were partof the longitudinal EPESE study in New Haven, CT. MIs were identified throughhospital monitoring for all cohort members, with chart review to confirm MI diag-noses. In multivariate logistic analyses, controlling for age, severity of MI, and othercomorbidity, subjects reporting no sources of emotional support experienced nearlythree-fold greater six-month mortality than those reporting one or more sources.
Analyses of data on incidence and recovery from stroke from the New HavenEPESE study have shown a similar pattern of associations between social integrationand incidence versus recovery from stroke. As in the previous study of MIs, strokesamong cohort members were identified through hospital monitoring for all cohortmembers. Level of social integration was not a significant predictor of incidentstroke in this older cohort, although the direction of the effect was toward increasedincidence among the less socially integrated.
27
By contrast, poststroke recovery wasrelated to prestroke level of social integration.
28
As in the case of the Berkman
et al.
26
study of post-MI recovery, several studies have also found that levels of emo-tional support post-stroke are predictive of better recovery,
15
suggesting that greateravailable emotional support may be one reason that increased social integration pre-dicts better functional status post-stroke.
Research examining relationships between social ties and overall level of physi-cal functioning has largely focused on the positive or protective effects of networkstructural characteristics (e.g., network size and marital status). Marital status, forexample, has been identified as a protective factor in some,
29,30
but not all,
31
studiesof physical functioning. Measures of social network size have more consistentlyindicated a protective effect with respect to physical disability.
15,32
Indirect evidenceof the role of social ties in the etiology of physical disability is also suggested by evi-dence of protective effects of social ties with respect to two important outcomes ofdisability: institutionalization and mortality.
15
Most recently, effects of social ties on cognitive aging has also been a focus ofresearch. Several recent studies have demonstrated significant protective effects ofsocial integration with respect to lower risk for dementia.
33,34
In both studies, olderadults reporting greater numbers of social ties and social engagement at baselinewere less likely to exhibit incident dementia or cognitive impairment during follow-up (for follow-up periods ranging from 3 to 12 years). Analyses from the MacArthurStudy of Successful Aging, focusing on a more selected, high functioning cohort ofolder adults, and looking at characteristics of the social environment as predictors ofcognitive decline (rather than impairment or dementia) suggest that levels of social
94 ANNALS NEW YORK ACADEMY OF SCIENCES
support (specifically emotional support) may be more strongly related to earlier stag-es of cognitive decline.
35
Mental Health/Distress
The effects, both positive and negative, of family and friends on mental healthhave been extensively documented.
36
Studies of the impact of social ties on risk ofdepression, for example, have generally found protective effects associated withgreater social integration, particularly since this is reflected by the presence of pri-mary ties with spouse, children, and/or supportive significant others.
37
Marital dis-ruption, either through bereavement or marriage dissolution, has been associatedwith increased risks for psychological distress.
38,39
Losing your spouse—notthrough death, but through their cognitive impairment—has also been shown toresult in increased risk for depression.
40
The latter data also shed light on potentialreasons for this effect—among other things, increasing levels of cognitive impair-ment of one’s spouse result in dramatic decreases in the availability of emotionalsupport from this important source; this effect is particularly strong for husbands ofcognitively impaired wives. The broader family/friend environment (i.e., children,close relatives, and friends) can, however, compensate for this loss of spouse sup-port, serving as a modifier of the link between the wife’s cognitive impairment andthe husband’s risk of depression. Where the family/friend environment is perceivedto provide adequate instrumental, emotional, and/or financial support, the husband’srisk of depression is not increased.
Negative Health Effects of Social Relationships
Although the vast majority of the social epidemiological and social psychologicalresearch on health has focused on the hypothesized benefits of social ties, and in par-ticular, on the postulated benefits of the emotional and instrumental support such tiesprovide,
16
social exchange theorists and others have long argued that social relation-ships are frequently characterized by costs as well as benefits.
41,42
Such costs cantake the form of requests/demands for assistance, criticism, or other forms of inter-personal conflict.
43
More specifically, whereas the positive health effects of socialties have been hypothesized to result from their ability to enhance the individual’sself-esteem, sense of belonging, and efficacy or mastery through positive, supportiveactions,
44
social ties can also be sources of demands, conflict, embarrassment, envy,disappointment, and devaluation as well as serving as models for risky or unhealthfulbehaviors.
45,46
Furthermore, the fact that supportive and nonsupportive aspects ofsocial relations appear to be only weakly correlated
46,47
indicates that these are tworelatively independent domains of social experience and that both need to be consid-ered to understand the influence of family and other social ties on health.
The mental health consequences of social relationships characterized by morenegative qualities has received considerable attention from health psychologists.Social relationships characterized as intrusive, demanding, critical, sources of con-flict or
non-supportive
have been shown to predict increased depression and/ordecreased well-being in older adults
45
and others.
46,48,49
Research has also shownthat the failure of the family/friend environment to provide anticipated or expectedsupport can result in increased psychological distress.
50
Indeed, negative and/or
95SEEMAN & CRIMMINS: SOCIAL ENVIRONMENT EFFECTS
non-supportive social interactions have been reported as one of the major (and moredistressing) sources of daily stress
51
and evidence suggests that negative qualities ofrelationships may have stronger impacts on affect and mental health than positivequalities.
45
Interestingly, although both men and women report more supportive than nega-tive social interactions, women have been found to report relatively more negativeinteractions with non-discretionary, family/kin ties.
46
Such negative interactions,especially when they involve a spouse or close friends, have been shown to be morestrongly predictive of psychological distress than similar interactions with more dis-tant social relations.
48
Negative interactions with close social relations also appearto have stronger effects on psychological distress than supportive interactions, espe-cially among women, who appear to be more emotionally responsive to such nega-tive interactions.
52
Qualitatively negative aspects of social relationships have also been related tophysical health outcomes. Poor marital quality appears to be particularly potent inthis regard, having been shown to predict increased risk of angina
20
and greaterreported physical illness;
53
declines in marital satisfaction have also been related todeclines in reported health status.
54
Poorer marital quality and chronic family stressassociated with caring for family members with Alzheimer’s disease have also beenshown to predict poorer immune function;
55,56
and, perceived lack of support fromfamily and others has been related to elevations in serum cholesterol and illnesssymptoms.
57
The literature on recovery from, or coping with, illness also reveals that family/friend “assistance” in coping with illness and/or disability can result in unintendednegative outcomes such as increased reports of dependency and disability.
58
Recentanalyses of data from the MacArthur Study of Successful Aging provide similar evi-dence of the potential for negative effects on physical health.
59
In these analyses pre-dicting onset of activities of daily living (ADL) disability in a cohort of older menand women, higher baseline levels of instrumental assistance are associated with
increased
risk of new ADL disability during a two-year follow-up among the men,independent of baseline levels of physical functioning.
Pathways for Social Effects on Health
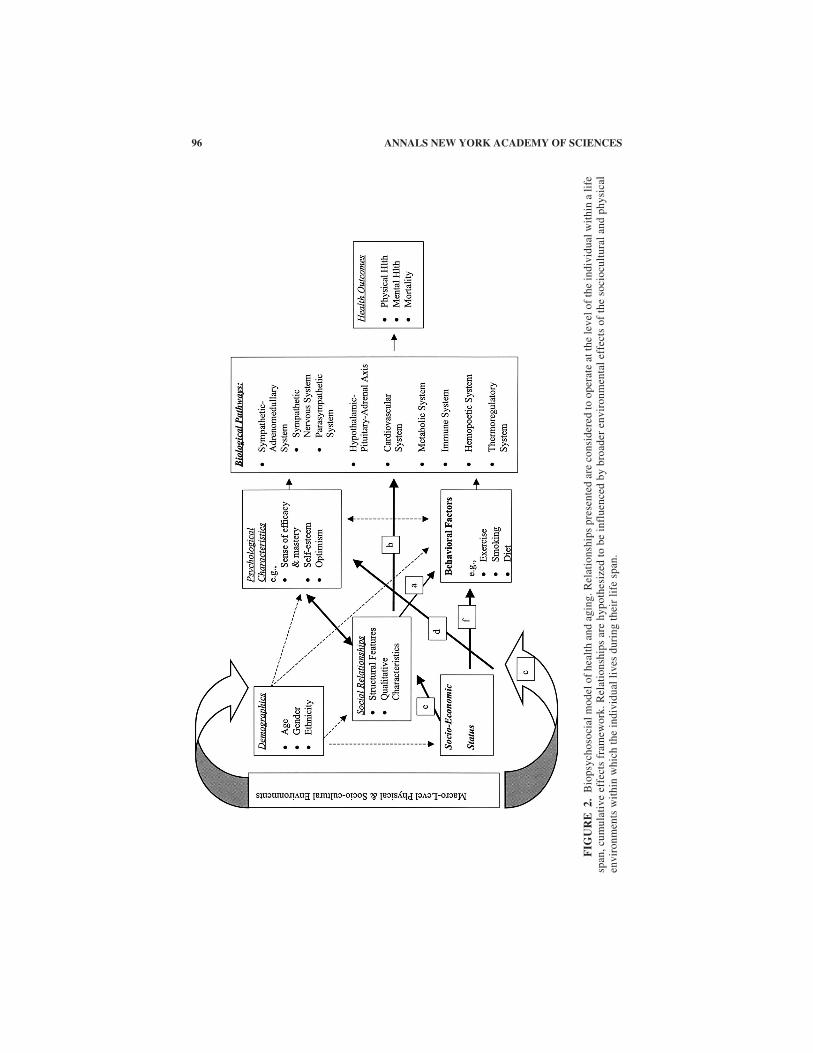
Although evidence linking social integration to decreased risks for morbidity andmortality continues to grow rapidly, important questions remain concerning the pre-cise mechanisms or pathways through which the social environment influenceshealth outcomes. Various pathways have been hypothesized as possible avenuesthrough which the family/friend social environment affects health outcomes. Thesepathways include social environment influences on psychological and behavioralfactors that are known to impact on health and longevity as well as more direct socialenvironment influences on physiology (see F
IGURE
2). The following section reviewsevidence linking characteristics of the social environment to these various possiblepathways and the potential for positive and/or negative social effects on behavior andphysiology.
96 ANNALS NEW YORK ACADEMY OF SCIENCES
FIG
UR
E2.
Bio
psyc
hoso
cial
mod
el o
f he
alth
and
agi
ng. R
elat
ions
hips
pre
sent
ed a
re c
onsi
dere
d to
ope
rate
at t
he le
vel o
f th
e in
divi
dual
wit
hin
a li
fesp
an, c
umul
ativ
e ef
fect
s fr
amew
ork.
Rel
atio
nshi
ps a
re h
ypot
hesi
zed
to b
e in
flue
nced
by
broa
der
envi
ronm
enta
l eff
ects
of
the
soci
ocul
tura
l and
phy
sica
len
viro
nmen
ts w
ithi
n w
hich
the
indi
vidu
al li
ves
duri
ng th
eir
life
spa
n.
97SEEMAN & CRIMMINS: SOCIAL ENVIRONMENT EFFECTS
Health Behaviors (Pathway a, Figure 2)
As both behavioral role models and sources of information and cultural norms,social ties have been shown to influence both the likelihood that particular behaviorswill be adopted as well as the likelihood of behavior change. Early in life, familyenvironments are a primary learning environment for children, having the potentialto teach healthful or non-healthful behaviors. For example, children of smokers aremore likely to smoke,
60
those with obese parents are more likely to become obesethemselves,
61
and those with problem drinkers for parents are more susceptibleto alcoholism.
62
Among adolescents, adoption of detrimental behaviors, such assmoking,
63
alcohol and other substance abuse has been shown to be importantlylinked to peer group norms.
64
Among adults, similar peer group effects continue to be seen with respect to thepersistence of healthful and non-healthful behaviors. On the positive side, marriageand friendship ties are frequently associated with greater preventive health behavior,including less smoking and drinking,
13
and more cancer screening.
15,65,66
Social tiesmore generally have been shown to predict greater preventive health behavior andmore successful risk reduction efforts such as reducing dietary fat, exercising, andsmoking cessation;
11,67–69
and, for older adults, better nutrition
70
and increased useof mammography.
71
Family/friend environments, however, also carry the potential for encouragingmore detrimental health behaviors, such as problem drinking,
72
worse control ofdiabetes,
73,74
and less successful risk reduction efforts.
75
Spouse pairs, for example,show concordance for smoking, drinking, and level of physical exercise.
76
Heavierdrinking has also been shown to be associated with greater social activity,
77
withproblem drinkers reporting a higher prevalence of fellow drinkers in their social net-works.
78
The presence of other smokers in one’s social network has been associatedwith greater relapse in efforts to quit.
63
Studies among gay men also indicate thatengaging in risky behavior, such as unprotected anal intercourse, is related toperceptions that one’s friends and social contacts engage in such behavior.
79
Thefamily/friend environment can also present more direct health threats in the form, forexample, of second-hand smoke exposure from living with a smoker
80
or physicalviolence.81
Compliance and non-compliance with preventive and/or therapeutic medical reg-imens have each been linked to the presence of more social ties.82 Indeed, althoughsignificant others, such as a spouse or other family members, can be particularlyimportant as models of appropriate behavior and normative influences, as well asexerting more direct control over dietary or medical regimens, they can also serve asmodels of inappropriate or non-normative behaviors83 or as sources of discord anddissuasion regarding compliance behavior.84 Such factors may explain why menwith larger social networks were found to exhibit poorer control of their diabetes(e.g., significant increases in glycosylated hemoglobin, cholesterol and triglyceridesand similar trends for glucose and weight) at 18-month follow-up.73
Physiological Mechanisms (Pathway b, Figure 2)
The question of possible, direct links between family/friend environment andphysiology is one that continues to intrigue researchers, particularly in light of the
98 ANNALS NEW YORK ACADEMY OF SCIENCES
fact that social ties remain significant predictors of morbidity and mortality in theirown right, independent of any associations with health behaviors.11,21
The idea that social relationships influence physiology is congruent with a broad-er, evolutionary perspective of human physiology and its susceptibility to modula-tion by external social factors.3 The basic premise is that, like other social animals,human physiologic homeostasis and ultimate health status, are influenced not onlyby the physical environment, but also by the social environment. As reviewed in See-man and McEwen,85 there is a growing body of evidence for such links in both ani-mal and human populations. In both cases, the data highlight not only the biologicalimpacts of such social ties but also the dual nature of these impacts: the presence ofmore positive, supportive relationships is associated with lower levels of cardiovas-cular and neuroendocrine activation, whereas more conflictual and non-supportiverelationships appear to heighten physiological reactivity.
The effects of the family environment begin at the earliest ages. Secure attach-ment between infant and mother has been shown to predict lower stress response (asindexed by salivary cortisol) to new or strange situations.86 A broader range of socialinfluences has also been demonstrated even at these early ages. Gunnar et al,87 in astudy of adrenocortical responses to separation, demonstrated that cortisol responseswere attenuated in the presence of a “warm, responsive and interactive” caregiver,much like the effects of a “supportive confederate” or friend in studies of adultsdiscussed below.85 Among adults, community-based population studies provideevidence for associations between higher reported levels of support from closefriends and family and better physiologic profiles, including lower heart rate andsystolic blood pressure, lower serum cholesterol, and lower urinary catecholaminesand cortisol.85 Data from smaller experimental studies, where aspects of the socialenvironment are manipulated, provide even stronger evidence that social contactor support can attenuate (or exacerbate) physiologic stress responses as indexed bycardiovascular, autonomic, and hypothalamic–pituitary–adrenal (HPA) axis respon-ses. Presence of a friend, for example, has been shown to decrease cardiovascularstress responses to challenging tasks, such as mental arithmetic, concept formation,and mirror-tracing tasks.88,89 As in the studies of infants discussed above, studiesalso suggest a broader range of social influences than simply family or significantothers, showing that the presence of supportive strangers is also associated withattenuated systolic and diastolic blood pressure responses when asked to complete achallenging task.90,91
Negative physiologic effects of social relationships on neuroendocrine and/orcardiovascular activity have also been documented. In the case of marital interaction,spousal interactions characterized by greater hostility and conflict have been shownto elicit greater cardiovascular and neuroendocrine reactivity.92,93 More generally,experimental studies have shown that individuals exhibit increased cardiovascularand neuroendocrine reactivity when exposed to non-supportive social conditions,such as interpersonal challenge or hostility.85 Gerin et al.,90 for example, found apattern of greater blood pressure response when subjects participated in a discussionwhere others disagreed with the subject. Interestingly, blood pressure levels werehalved if one other person shifted to agreement with the subject.
A number of studies have also indicated that social relationships can have bothpositive and negative impacts on immune function.94 This research has shown that
99SEEMAN & CRIMMINS: SOCIAL ENVIRONMENT EFFECTS
for both men and women, those who were not married exhibited poorer immunefunction, as indexed by increased Epstein Barr virus antibodies. Among those whoare married, the quality of the marital bond has been shown to be important, withthose reporting less attachment to their relationship exhibiting lower immune func-tion, and negative behavior during marital conflict has been shown to downregulateimmune function.94 More generally, levels of social support have been found torelate positively to immune function95 and to impact on patterns of change over time.A recent study by Theorell et al.,96 for example, found that among HIV-infectedmen, those reporting lower levels of emotional support from family and/or friendsexhibited more rapid decline in CD4 counts during a five-year follow-up.
Summary
The above data clearly indicate that the network of personal social relationshipswithin which an individual lives his or her life impacts on a wide range of health out-comes, from lifestyle risk factors through morbidity risks to actual mortality risks.These social environment effects appear to operate through multiple pathways, withevidence for direct effects on physiologic parameters as well as more indirect effectson attitudes and behaviors. Importantly, the health effects of one’s social relation-ships can be positive (i.e., health promoting) or negative (i.e., health damaging). Itis not surprising that our social relationships should have such widespread effects.As discussed earlier, man has evolved as a social animal and, as such, appears to be“tuned in” to the others in his world. In light of this, it should not be surprising tofind that the quality of our interactions with others has profound effects on our psy-chological, behavioral, and physiologic functioning.
SOCIOECONOMIC STATUS AND HEALTH
In addition to the personal, social relationships that we have with others, a broad-er social environment that influences our life experiences, and our health and well-being, is that occasioned by our relative social and economic status within the largersociety in which we live. Socioeconomic status (SES) is traditionally measured interms of indicators, such as education, income, and occupation. By these criteria, anextensive and extraordinarily consistent body of evidence has accumulated docu-menting the negative health outcomes associated with lower SES.13,97–101 LowerSES, for example, has been related to higher prevalence and incidence of mostchronic and infectious diseases,98,99,102 and, for exceptions such as breast or prostatecancer, where higher incidence is found among higher SES groups, survival is none-theless worse among lower SES groups.98
An inverse association between SES and mental distress/disorder has also beenextensively documented.98,99 Lower SES has been associated with higher incidenceand prevalence of both major depression and depressive symptoms,97 as well as withincreased prevalence of more general psychological symptomatology.103,104 Indeed,lower SES has been related to higher rates of nearly all major causes of morbidityand mortality both across populations and over time.98,100 Evidence suggestsfurther that SES differentials in morbidity and mortality may be widening ratherthan narrowing.100,105–108
100 ANNALS NEW YORK ACADEMY OF SCIENCES
This enduring and ubiquitous association between SES and health/longevitytends to elicit interpretations that focus on the obvious detrimental effects of depri-vation and difficult circumstances at lower SES (e.g., poverty, living and workingconditions). However, the data actually suggest that the association is more linearthan threshold, with a gradient of increasingly better health outcomes as one mountsthe SES continuum,97 although data from both the US and Britain suggest thatthe slope may flatten somewhat at higher SES levels.105,109 The fact that the relation-ship takes the form of a linear gradient, rather than showing a threshold effect of“poverty”, clearly indicates that a comprehensive explanation for the association ofSES with health and mortality will involve more than the obvious factors of inade-quate financial resources or poor/dangerous living conditions associated with actualpoverty. Any final explanation will have to account, not only for the higher morbidityand mortality among the poorest segments of society, but also for the relatively high-er morbidity and mortality in the middle ranges as compared with the upper rangesof SES.
Another feature of note concerning SES differentials in adult health is the age-related variation in this association, with the greatest SES differentials in healthand mortality seen in the 40–65 age range.109 This finding suggests that the effectsof SES are, to some extent, the result of a cumulative process beginning in earlychildhood,110,111 which produces differentials in health/mortality only with increas-ing exposure and increasing biological vulnerability. Thus, differentials are general-ly smaller prior to middle-age and are again reduced after age 65 where the impactof more general age-related increases in morbidity and mortality is likely to result inhigher rates even for those living in more favored SES circumstances. This patternof data suggests that SES effects on health result largely from a cumulative process,with lower SES resulting in what might be called “premature” aging, with attendantincreased risks for nearly all types of negative health outcomes. Data on the effectsof cumulative economic hardship (i.e., years with income below 200% of the povertylevel) also point to increased risks for a range of poor outcomes, including poorerphysical, psychological, and cognitive functioning.112 Indeed, although SES differ-entials in health and mortality may be greatest in late middle age, these same SESdifferentials in health risks persist into old age. Income and education continue to beassociated with differential morbidity and mortality among older adults.32
Although a variety of possible explanations for these social inequalities in healthhave been offered, including artifact of measurement and natural or social selection,113
current opinion favors the view that social inequalities are real and little affectedby selection.100 Rather, SES-related differences in material/structural conditionsare seen as contributing importantly to observed differentials both directly (e.g., viapollution or unsanitary conditions) and through indirect effects on cultural/behavioralpractices.100 Current discussions of SES gradients in health have been cast most fre-quently in terms of parallel gradients in: (1). chronic and acute stressors (at both theindividual and broader environmental level), (2). coping resources, and (3). health hab-its and other lifestyle characteristics. In the following sections, we review evidence forthe possible role of these factors as intervening pathways through which SES results ina gradient of health and mortality.
101SEEMAN & CRIMMINS: SOCIAL ENVIRONMENT EFFECTS
Chronic (and Acute) Stress (Pathway c, Figure 2)
Differential exposure to both chronic and acute stressors constitutes one of theforemost factors postulated to contribute to observed health differentials by SES.Increased risks for poor health outcomes associated with lower SES are hypothe-sized to result from the relatively greater exposure to environmental stress in lowerSES environments, including: (1) a physical environment characterized by crime,crowding, poor physical amenities, and greater exposure to physical hazards such asindustrial and hazardous wastes;114 (2) a financial/occupational environment charac-terized by inadequate and/or unpredictable resources, nonexistent or little job secu-rity or personal autonomy;7,101 and (3) a sociocultural environment characterized bydiscrimination and impoverished social and psychological resources (e.g., fewersociopolitical resources, individual perceptions of powerlessness, alienation, lack ofself-esteem).98,99,101 Recent evidence from a community-based survey115 providesfurther support for the view that SES differentials in mental health are at least par-tially explained by differential exposure to stressful life events. Using occupationalprestige level as their index of SES, Turner et al.115 found the expected associationsbetween lower occupational prestige levels and increased depressive symptomatol-ogy as well as between lower occupational prestige and greater exposure to stressfullife events. However, in multivariate analyses, the differential stress exposure byoccupational prestige levels was found to account for 38% of the initial bivariateassociation between occupational prestige and depressive symptoms.
Evidence for such SES-related differentials in exposure to stressors, particularlychronic stressors, is abundant, with lower SES individuals consistently reportingmore chronic and acute stressors.115,116 Analyses by McLeod and Kessler,117 usingdata from five epidemiologic surveys, indicate that this increased exposure to stres-sors cuts across life domains (i.e., it is not confined to events related to financialissues but includes more events related to health and one’s social network as well).Kessler and colleagues116,117 have also demonstrated the synergistic effects of suchstress exposure in the context of lower SES, showing that, in addition to their morefrequent exposure to stressful events, lower SES individuals exhibit greater negativeimpact of such events on psychological functioning. These findings parallel thosefrom other studies examining SES differences in mental health outcomes for indi-viduals exposed to similar levels or intensities of stressful experience that also showgreater vulnerability among lower SES groups.118
Further contributing to the chronic stress of lower SES status are neighborhoodcharacteristics such as police-documented higher crime rates119 as well as greaterperceived threat of crime and more local problems,120 more refused services (e.g.,taxi, credit, and ambulance),120 and poorer transportation services and recreationalfacilities.119 Lower SES neighborhoods have also been associated with greater expo-sure to physical hazards such as air and water pollutants, hazardous wastes, pesti-cides and industrial chemicals.121
Clearly, lower SES status (especially if, as is generally the case, it is accompaniedby residence in a lower SES neighborhood) is more likely to result in increased expo-sure to chronic and acute stressors stemming from physical, economic, and socialcharacteristics of the environment. The potential mediating pathways from suchexposure to increased disease susceptibility are suggested by findings that chronicstress, as indexed by residence in higher population-density areas, is associated not
102 ANNALS NEW YORK ACADEMY OF SCIENCES
only with increased reports of stress but with increased biochemical indices of stresssuch as urinary excretion of norepinephrine and epinephrine.122 The immediate andlong-term health consequences of the greater stress exposure of lower SES individ-uals is illustrated by two sets of findings. The first relates to immediate consequencesin terms of pregnancy outcomes where greater prenatal stress has been associatedwith lower birthweight.123 The second set of findings relates such differential prena-tal exposures to longer-term health consequences. Barker has proposed that adultdifferentials in health and mortality are influenced by biological programmingoccurring in utero or early infancy,124 suggesting, for example, that lower SES mayexert an impact prenatally, not only on ultimate birth weight (a known correlate ofinfant health outcomes), but on future adult health outcomes as well.
Psychological Resources (Pathway d, Figure 2)
The association of lower SES with reduced coping resources has also been sug-gested as a contributor to the observed health differentials. Indeed, reduced copingresources may serve to heighten the impact of the chronic and acute stressors dis-cussed above (e.g., contributing to the pattern of greater impact of such stressors inlower SES groups).125 Lower SES, for example, has been related to a number ofcharacteristics that have been found to serve as risk factors for health or as modera-tors of the relationship between stressful experiences and health outcomes includinglower optimism,99 lower self-esteem and feelings of self-worth,126,127 lower self-efficacy beliefs,128 and a weaker sense of control,129 and greater fatalism.103 The lat-ter two characteristics in particular are thought to play important roles in facilitatingand promoting coping efforts.103,129 Higher SES, in the form of more education andgreater occupational autonomy, as also been shown to foster development of morepositive self-perceptions and greater cognitive flexibility (characteristics that influ-ence coping resources and responses).7 Pearlin and Schooler126 also documenteducation-related differentials in the coping strategies used to deal with life events,with the less educated using relatively less effective strategies.
Exacerbating such individual psychological vulnerabilities, lower SES individu-als also tend to have fewer social resources to call on for support and assistance incoping with events (e.g., fewer social ties and less support, and less contact withmore formal social institutions such as religious or other groups)130–132 (Pathway ein FIG. 2). The connections and interactions between various SES-related pathwaysto disease are further suggested by evidence indicating that chronic and acute stres-sors such as financial strain and fear of crime (that are more commonly found in low-er SES environments) tend to foster a distrust of others, which can promote greaterrelative social isolation.133 The potential importance of both social and psychologi-cal resources as mediators of the greater stress exposure in lower SES environmentsis suggested by a study of SES (indexed by occupational status) and psychologicalvulnerability to stressful life events. In this study, Turner and Noh134 found evidencefor a buffering effect of both social support and a sense of control on the relationshipbetween lower occupational status and vulnerability to life events—among womenwith high social support and stronger feelings of personal control, the relationshipbetween lower status and vulnerability to life events disappeared. Notwithstandingsuch buffering effects of social and psychological factors, evidence on the costs ofcoping135 suggests that the greater exposure to chronic and acute stressors of lower
103SEEMAN & CRIMMINS: SOCIAL ENVIRONMENT EFFECTS
SES individuals may nonetheless exact a cumulatively greater toll, even for thosewith good coping skills.
Health Behaviors (Pathway f, Figure 2)
Lower SES is also associated with a higher prevalence of unhealthful lifestylecharacteristics, including less exercise, more smoking and alcohol consumption, andpoorer diets.98,114 Indeed, national survey data indicate that lower SES is associatedwith a relative disadvantage on every risk factor considered13,99—a finding that iscorroborated by other community-based surveys from Alameda County in Californiaand Kuopio, Finland.136 The important influence of broader environmental charac-teristics on these patterns of behaviors is suggested by findings from MacIntyre andcolleagues documenting that lower SES neighborhoods in Glasgow are character-ized not only by fewer recreational facilities and poorer transportation service (e.g.,to facilitate access to other areas)119,137 and by less availability and higher cost forfoods recommended for health-promotion.138,139 Parallel data have also been report-ed for the US.140 These data may also help to explain why lower SES groups havebeen less likely to adopt widely promulgated recommendations for exercise andhealthy diets.97,137
Not surprisingly, in light of the behavioral data outlined above, an SES gradient inother known biological risk factors for major chronic diseases such as CHD has alsobeen documented (e.g., higher cholesterol, more obesity, and hypertension).131,141
Importantly, although much of the early research on CHD and its risk factors focusedon these associations among men, more recent research documents a similar SES gra-dient for CHD risk factors among women.131,141
Medical Care
Differential access to quality health care is another factor generally thought tocontribute to observed SES differences in health and mortality. Indeed, data fromEngland and the US indicate that despite universal health insurance in the former andfederally-funded programs such as Medicaid and Medicare in the latter, lower SESindividuals continue to have access to less extensive and lower quality medicalresources.101,119 However, recent reviews have suggest that there are several reasonsto believe that differential access to medical care is not the primary, or perhaps evena major contributor, to observed SES differentials in health and mortality.97,101 Forexample, health and mortality data from countries such as Britain, where universalhealth insurance has been available for some time, nonetheless continue to the“traditional” SES gradient in health and mortality and, indeed, show evidence for awidening of the social class differences.142 In addition, the inverse relationshipbetween SES and mortality is seen, not only for causes of death amenable to medicalcare, but for causes not amenable to medical care as well,143,144 suggesting againthat differentials in medical care, though a possible contributory factor, are unlikelyto play a definitive role in the SES gradient in health. SES differentials in access toand quality of medical care remain, however, one of what are clearly a multiplicityof sources of SES-related “health disadvantage”.119
104 ANNALS NEW YORK ACADEMY OF SCIENCES
Summary
To date, the documented association between lower SES and negative health out-comes has generated considerable research and policy interest, but our explanationsfor and understanding of this relationship remain incomplete. Research has shownthat the association can be accounted for in part by differences in health behaviors,psychological, and social factors, but even the most complex multivariable analysesleave a significant, unexplained variance in outcomes across the SES gradient.128,145
Clearly, much remains to be elucidated regarding the actual mechanisms throughwhich something as complex and multifaceted as SES “gets under the skin”. Thiswill necessarily include consideration of external characteristics of the environments(both physical and sociocultural) where people live and work, and individual char-acteristics as well as possible interactions between these in producing the observedSES gradients in health and mortality.
Of particular significance in this matrix of factors may be those reflecting theindividual’s social and psychological environment. Evidence clearly points to theimportance of such factors in considering the greater resilience of some adults andchildren in the face of hardship—hardship which is itself usually largely groundedin their lower SES. Those exhibiting better developmental and health outcomesdespite the hazards of lower SES are quite routinely found to be characterized by bet-ter social and psychological resources (e.g., social support and sense of control,134
as well as supportive/positive adult role models146) that appear to buffer against theexpected negative outcomes usually associated with their lower SES environments.
Whatever the relative importance of differing factors to the SES–health gradient,the ultimate picture of the SES-health relationship will be one in which SES exertsits effects on health via multiple potential pathways with the specific individual-levelpathways depending on specifics of both the environment (e.g., physical, economic,and sociocultural factors) and the individual (e.g., genetic, social, psychological, andeconomic factors). Two known features of the SES-health relationship already pointto such a multiplicity of potential pathways. First, there is the remarkable consisten-cy of the observed association, irrespective of the various indicators of SES (e.g.,income, education, or occupation as well as more multidimensional indices).147 Sec-ond, there is the remarkable stability of SES-related differentials in mortality thathave remained largely constant in the face of shifting patterns of disease and risk fac-tors, including most notably the shift from predominantly infectious to chronic dis-eases and their very different risk factors. Such consistencies, despite shiftingmeasurement of SES and shifting disease patterns, suggest the availability of multi-ple pathways through which SES-related variables influence health and well-being—it is these pathways that need to be fleshed out in any comprehensive explan-atory model.
It is important to note that the foregoing discussion of SES and health has focusedalmost exclusively on how SES, broadly conceived, affects the individual—that is,how does one’s experience of social and/or economic status within the larger societyimpact on one’s health and well-being. There are two further features of the SESenvironment, however, that deserve special note. The first relates to the multidimen-sionality of the SES environment; the second relates to the broader societal contextin which these different SES environments are embedded.
105SEEMAN & CRIMMINS: SOCIAL ENVIRONMENT EFFECTS
Here, we have focused on SES as broadly defined rather than considering a moredetailed evaluation of the relative contributions of various dimensions of SES (e.g.,income, education, and occupation) to health outcomes. Although each of these hasbeen shown to demonstrate the general, inverse SES gradient, these dimensions aswell as other aspects of the SES environment are likely play importantly differenti-ated roles in the genesis of different health outcomes—an area of potential impor-tance for research on the multiple pathways through which SES affects on health.
In addition to this multidimensionality, it is important to note the broader contex-tual features of what might best be characterized as a gradient of SES environments.These environments are not generated, nor do they persist, in isolation from eachother or from the surrounding socioeconomic order. Rather, there are broader socio-economic and political forces that importantly shape and maintain these socio-economic environments (i.e., what have been termed the “upstream determinants” ofsuch environments).148,149 These forces are likely to factor importantly in anysuccessful effort to understand and ameliorate the progressively worse health out-comes found as one moves down the SES gradient. It is to these upstream, moreglobal environments that we turn our attention now, examining the growing bodyof research focusing on relationships between broader community-level social andeconomic characteristics in relation to the health outcomes of those living in suchenvironments.
COMMUNITY LEVEL SOCIOECONOMIC EFFECTS ON HEALTH
The broader socioeconomic environment within which people live out their indi-vidual lives has become a focus of increasing research interest over the past decade.Here, we present evidence from two major streams this research—one focusing onthe socioeconomic resource characteristics of these broader communities and theother on more specifically social features of these environments.
Community SES Characteristics
Analyses of US census-tract level data have shown consistent effects of area-levelSES characteristics on the health experience of inhabitants: those living in lowerSES neighborhoods experience higher mortality.150–152 Significantly, this area-leveleffect appears to compound that of individual-level SES. In analyses that includeboth area-level and individual-level data on SES, where area-level SES (i.e., censustract or neighborhood) has been shown to have a significant effect on health and mor-tality, independent of the effects of individual-level SES.153,154 As indicated alreadyin the discussion of chronic stress exposure among lower SES groups, some of thecommunity-level environmental factors likely to be contributing to these observedarea-level effects include neighborhood characteristics such as police-documentedhigher crime rates119 as well as greater perceived threat of crime and more localproblems,120 more refused services (e.g., taxi, credit, and ambulance),120 and poorertransportation services and recreational facilities, as well as higher costs for healthyfoods119,140,155—the latter perhaps contributing to observed differences in diet156
and other health behaviors.157,158 Lower SES neighborhoods have also been associ-ated with greater exposure to physical hazards, such as air and water pollutants,
106 ANNALS NEW YORK ACADEMY OF SCIENCES
hazardous wastes, pesticides, and industrial chemicals.121 More recently, communi-ty differences in what has been referred to as social capital have become a focus ofconsiderable research interest.
Community Social Capital
The term social capital refers to the cooperative network of social relationshipsbetween citizens (or members of any defined community or group) that facilities col-lective action for mutual benefit and problem resolution.159 As such, social capitalis a community or group level characteristic rather than an individual-level charac-teristic. Communities characterized by high social capital include such features ashigh levels of interpersonal trust and norms of reciprocity and mutual aid.159,160
Such communities have been found to benefit from more effective government,160
lower crime and delinquency,161,162 and better health outcomes including lowermortality163 and better self-rated health status.164 Kawachi et al.163 used state leveldata from the US to demonstrate a strong negative relationship between mortalityrates and levels of social capital (measured in terms of levels of trust, perceived rec-iprocity, and membership in various types of groups or associations)—those areaswith the highest reported levels of social capital showing lower mortality rates;Kawachi et al.164 have also shown a similar pattern of association with self-ratedhealth status. Some postulated mechanisms for these observed health effects ofsocial capital include such things as community promotion of health behaviors(through diffusion of information, stronger norms for healthy behaviors, and exert-ing social control over deviant health-related behavior) and greater community suc-cess in acquiring and maintaining health-related services and amenities.164,165
Community Inequalities
In addition to this interest in varying community-level social characteristics, thepotential health consequences of relative socioeconomic inequalities across and with-in various communities have become a focus of considerable research and debate.Income inequality (i.e., the relative distribution of wealth within a community, vari-ously defined in terms of metropolitan areas,166 states,167,168 or countries169,170 hasbeen found to correlate with differential health outcomes, particularly mortality—communities characterized by greater inequality also showing higher mortalityrates.149,166–171 Greater income inequality has also been related to poorer self-ratedhealth172 as well as higher rates of disability, higher percentages of low birth weightbabies, and greater prevalence of smoking and sedentary life-styles.158,167 The poten-tial importance of such findings is further underscored by the fact that the US leadsthe industrialized countries in terms of the extent of such income inequality, and thetrends in the US are toward greater inequality.173
The growing evidence linking income inequality to various health outcomes hasled to a considerable debate regarding the reasons or pathways for these healtheffects of income equality. The two most vigorously debated positions can be char-acterized (grossly) as reflecting on one side a greater emphasis on differences inmaterial conditions, whereas the other puts greater emphasis on differences in thenature of social relationships.174,175 As proposed by Kaplan, Lynch and colleagues,income inequality has its broadest and most invidious impact on health through its
107SEEMAN & CRIMMINS: SOCIAL ENVIRONMENT EFFECTS
association with poorer material conditions and greater disinvestment in human andsocial capital (e.g., lower spending on education, unemployment, transportation, andother public services).149,167,175 Others such as Wilkinson, and Kawachi and col-leagues, have postulated that the primary pathways through which income inequalityimpact health are through its association with poorer psychosocial conditions.174,176
Here, the emphasis is on the nature of social relations (and the psychological conse-quences of such relations) in communities characterized by greater income inequal-ity. In such communities, particularly among those at the bottom of the incomedistribution, there is postulated to be an erosion of the social fabric (reducing socialcapital) and more negative social comparison processes resulting from the greaterpower and status differentials associated with the income differentials.174,176
Support for this position comes from evidence that more inegalitarian societies andcommunities are characterized by lower levels of interpersonal trust and civic par-ticipation, greater hostility, and sense of competition.176–178 As William Julius Wil-son points out in The Truly Disadvantaged, the worst of these socially isolatingeffects are frequently seen among the “underclass” (i.e., those in inner-city commu-nities characterized by extremes of poverty) where there is a “lack of contact orof sustained interaction with the individuals or institutions that represent main-stream society.179 The lower social capital in communities with greater income ine-quality has been hypothesized to contribute to the increased mortality rates in suchcommunities.163
Summary of Community Level Evidence
Research on community/area-level characteristics as risk factors for health out-comes of residents provide intriguing evidence for such “environmental” effects onhealth risks. One important caveat however, is that to date there has not been a greatdeal of research that tests for the impact of such community-level effects net of indi-vidual-level characteristics. Thus, it is not yet completely clear to what degree com-munity-level SES or social capital impact on health net of the individual’s own SESor level of social integration. Available evidence does suggest that there are area-lev-el effects net of individual SES,152,171,172 but further research is warranted.180,181
Also, the relative importance of material versus social conditions remains a topic ofhot debate.
Evidence that area/community-level characteristics have significant independenteffects on health has important public health implications. As the history of epide-miology and public health intervention clearly documents, some of the most effica-cious interventions were those targeted not at changing individuals, but rather atchanging unhealthy environmental conditions that generated health risks for thoseliving in them.182–184 Indeed, this has led many to argue that interventions targetingindividuals (e.g, to get them to stop smoking, exercise more, eat a more healthfuldiet, or cope more effectively) hold much less promise of altering health risks at apopulation level because they do not address the broader environmental forces gen-erating the risks (e.g., availability of cigarettes and fatty foods, lack of easily acces-sible recreational/exercise facilities, and presence of chronic stressors). A policytargeting these broader, environmental sources of health risk would be akin to earli-er, highly successful public health efforts to reduce water-borne diseases throughwholesale water treatment.184 It is only through understanding both the pathways
108 ANNALS NEW YORK ACADEMY OF SCIENCES
through which the unhealthy effects of lower SES environments get under the skin(the micro processes of individual effects) as well as understanding the broader,upstream forces that help to generate and maintain these environments (the macroprocesses) that we will arrive at a more complete understanding of the sources ofsocioeconomic differentials in health and well-being and, with this knowledge, hopeto achieve a modicum of success in reducing them.
CONCLUSIONS
This paper provides an overview of epidemiological and demographic researchlinking social characteristics of both individuals and communities to differences inboth morbidity and mortality risks. Large and consistent bodies of literature fromeach discipline provide clear evidence for the generally health promoting effects ofsocial ties. In both fields, the bulk of the evidence relates to mortality though bothfields have begun to examine other health outcomes, including aspects of physicaland cognitive functioning,35,107,185,186 as well as disease outcomes.15,102,187 Despitethese general similarities, there are some interesting differences in the epidemiolog-ical and demographic approaches to the question of social environment effects onhealth.
First, demography has tended to focus on specific types of social ties, particularlymarital status.188–191 By contrast, over the past 30 years, epidemiologists havefocused more and more on broader indices of social integration including ties withfriends and other relatives, as well as group memberships.192,193
Second, the differing disciplinary traditions of demography and epidemiologyhave lead to differing approaches to the modeling of social effects on health. Epide-miology, with its historical interest in the identification of factors that explain thepopulation distribution of a given health outcome, has approached the question ofsocial effects through multivariate modeling that asks whether such social factorsprovide additional explanatory information, independent of other known risk fac-tors. As a result, epidemiological analyses of social effects on health have includeda broad array of other demographic variables (e.g., age, gender, ethnicity, education,and income) as well as health behavior variables (smoking, diet, and exercise) and,depending on the health outcome in question, other measures of health status, suchas the presence of other diseases known to influence the outcome in question (e.g.,hypertension, diabetes, and other chronic conditions for analyses of mortality). Bycontrast, demographic analyses of social effects on health have largely focused onmodels that incorporate other demographic factors but are less likely to include thesame range of health status and health behavior variables seen in epidemiologicmodels.
Third, whereas epidemiological analyses focus on estimating the relative risk for agiven outcome associated with differences in social environment exposures (e.g., rel-ative risk of mortality associated with social isolation), demographers have been inter-ested in differential rates of mortality and other health problems in populations andspecific population subgroups.194,195 More recently demographers have emphasizedsocial environmental effects on life expectancy196 and healthy life expectancy.107
109SEEMAN & CRIMMINS: SOCIAL ENVIRONMENT EFFECTS
Consideration of these disciplinary differences in research approaches to under-standing the role of the social environment in health outcomes suggests interestingpossibilities with respect to potentially valuable collaborative efforts. One avenue,exemplified in our own developing collaborative program of research, would be tointegrate the more comprehensive risk factor modeling characteristic of epidemio-logical analyses with demographic models of population level burdens of diseaseand/or mortality. Such integrative efforts, for example, might take risk estimatesassociated with social factors from comprehensive epidemiological models andapply these estimates in demographic models to provide estimates of population-level burdens of disease, disability, or mortality under different social conditions.Similar methodologies could be used to provide more accurate estimates of thepotential impact of interventions to change social characteristics (or other factors)(i.e., using risk estimates from epidemiological models as input to demographic pop-ulation models). Models of this type have been developed to examine the effectsof risk factors for heart disease on population levels and trends of cardiovasculardisease.197 Such models also are the basis of the WHO Burden of Diseaseapproach.198
The shared interests of epidemiologists and demographers in understandingpopulation-level distributions of health provides a common base from which tolaunch potential collaborative efforts that take advantage of the strengths of each dis-cipline—the more comprehensive risk factor approach of epidemiologists to model-ing health risks and the more developed modeling approach to estimation ofpopulation characteristics of demographers.199,200 Questions regarding linksbetween social environment conditions and health may be a particularly fruitfularea of future collaboration, drawing on the shared interests of demographers andepidemiologists in understanding how different social conditions promote variationin distributions of better versus worse health outcomes within a population.
ACKNOWLEDGMENTS
Work on this manuscript was supported by grants from the NIH (AG-17056, AG-11235, AG-17265, and AG-16661) and by the MacArthur Research Networks onSuccessful Aging and on Socio-Economic Status and Health through grants from theJohn D. and Catherine T. MacArthur Foundation.
REFERENCES
1. DUBOS, R. 1959. Mirage of Health. Harper & Brothers, New York.2. DURKHEIM, E. 1955. Suicide. Free Press, New York.3. ALCOCK, J. 1983. Animal Behavior: An Evolutionary Approach. Sinauer, Boston.4. HENDERSON, S. 1980. A development in social psychiatry: the systematic study of
social bonds. J. Nerv. Mental Dis. 168: 63–69.5. BAUMEISTER, R.F. & M. R. LEARY. 1995. The need to belong: desire for interpersonal
attachments as a fundamental human motivation. Psychol. Bull. 117: 497–529.6. BAUMRIND, D. 1991. Parenting styles and adolescent development. In Encyclopedia of
Adolescence. R. Lerner & A.C. Peterson, Eds.: 746–758. Garland, New York.7. KOHN, M. L. & C. SCHOOLER. 1983. Work and personality: an inquiry into the impact
of social stratification. Ablex, Norwood.
110 ANNALS NEW YORK ACADEMY OF SCIENCES
8. JESSOR, R., A. COLBY & R. A. SHWEDER. 1996. Ethnography and human development.University of Chicago Press, Chicago.
9. BELLAH, R.N., et al. 1985. Habits of the heart: individualism and commitment inAmerican life. Harper & Row, New York.
10. CASSEL, J. 1976. The contribution of the social environment to host resistance. Ameri-can J. Epidemiol. 104: 107–123.
11. HOUSE J.S., K.R. LANDIS & D. UMBERSON. 1988. Social relationships and health. Sci-ence 241: 540–545.
12. BERKMAN, L.F. 1995. The role of social relations in health promotion. Psychosom.Med. 57: 245–254.
13. ROGERS, R.G., R.A. HUMMER & C.B. NAM. 2000. Living and dying in the USA. Aca-demic Press, San Diego.
14. SEEMAN, T.E., et al. 1993. Intercommunity variations in the association between socialties and mortality in the elderly: a comparative analysis of three communities. Ann.Epidemiol. 3: 325–335.
15. SEEMAN T.E. 1996. Social Ties and Health. Ann. Epidemiol. 6: 442–451.16. COHEN, S. & S.L. SYME, Eds. 1985. Social Support and Health. Academic Press, New
York.17. ORTH-GOMER, K., A. ROSENGREN & L. WILHELMSEN. 1993. Lack of social support and
incidence of coronary heart disease in middle-aged Swedish men. Psychosom. Med.55: 37–43.
18. VOGT, T.M., et al. 1992. Social networks as predictors of ischemic heart disease, can-cer, stroke and hypertension: incidence, survival and mortality. J. Clin. Epidemiol.45: 659–666.
19. REED, D., et al. 1983. Social networks and coronary heart disease among Japanese menin Hawaii. Am. J. Epidemiol. 117: 384–396.
20. MEDALIE, J.H. & U. GOLDBOURT. 1976. Angina pectoris among 10,000 men II: psycho-social and other risk factors as evidences by a multivariate analysis of a five-yearincidence study. Am. J. Med. 60: 910–921.
21. SEEMAN, T.E. & S.L. SYME. 1987. Social networks and coronary artery disease: a com-parative analysis of network structural and support characteristics. Psychosom. Med.49: 341–354.
22. BLUMENTHAL, J.A., et al. 1987. Social support, type A behavior, and coronary arterydisease. Psychosom. Med. 49: 331–340.
23. RUBERMAN, W., et al. 1984. Psychosocial influences on mortality after myocardial inf-arction. NEJM 311: 552–559.
24. WILLIAMS, R.B., et al. 1992. Prognostic importance of social and economic resourcesamong medically treated patients with angiographically documented coronary arterydisease. JAMA 267: 520–524.
25. CASE, R.B., et al. 1992. Living alone after myocardial infarction: impact on prognosis.JAMA 267: 515–519.
26. BERKMAN, L.F., L. LEO-SUMMERS & R. HORWITZ. 1992. Emotional support and sur-vival after myocardial infarction: a prospective, population-based study of the eld-erly. Ann. Intern. Med. 117: 1003–1009.
27. COLANTONIO, A., S.V. KASL & A.M. OSTFELD. 1992. Depressive symptoms and otherpsychosocial factors as predictors of stroke in the elderly. Am. J. Epidemiol. 136:884–894.
28. COLANTONIO, A., et al. 1993. Psychosocial predictors of stroke outcomes in an earlypopulation. J. Gerontol. 48: S261–S268.
29. MOR, V., et al. 1989. Risk of functional decline among well elders. J. Clin. Epidemiol.42: 895–904.
30. PALMORE, E.B., J.B. NOWLIN & H.S. WANG. 1985. Predictors of function among theold-old: a 10-year follow-up. J. Gerontol. 40: 244–250.
31. ROOS, N.P. & B. HAVENS. 1991. Predictors of successful aging: a twelve-year study ofManitoba elderly. Am. J. Public Health 81: 63–68.
32. SEEMAN, T.E. 1994. Successful aging: reconceptualizing the aging process from amore positive perspective. Fact. Res. Gerontol. 8: 3–15.
111SEEMAN & CRIMMINS: SOCIAL ENVIRONMENT EFFECTS
33. BASSUK, S.S., T.A. GLASS & L.F. BERKMAN. 1999. Social disengagement and incidentcognitive decline in community-dwelling elderly persons. Ann. Intern. Med. 131:165–173.
34. FRATIGLIONI, L., et al. 2000. Influence of social network on occurrence of dementia: acommunity-based longitudinal study. Lancet 355: 1315–1319.
35. SEEMAN, T.E., et al. 2001. Social Environment Characteristics and Patterns of Cogni-tive Aging: MacArthur Studies of Successful Aging Health Psychology. 20: 243–255.
36. GEORGE, L.K. 1989. Stress, social support, and depression over the life-course. InAging, Stress, Social Support, and Health. K. Markides & C. Cooper, Eds.: 241–267.Wiley, London.
37. GEORGE, L.K. 1990. Social structure, social processes, and social-psychological states.In Handbook of Aging and the Social Sciences, 3rd edit. R.H. Binstock & L.K.George, Eds.: 186–204. Academic Press, San Diego.
38. ASELTINE, R.G. & R.C. KESSLER. 1993. Marital disruption and depression in a commu-nity sample. JHSB 34: 237–251.
39. OXMAN, T.E., et al. 1992. Social support and depressive symptoms in the elderly. Am.J. Epidemiol. 135: 356–368.
40. MORITZ D.J., S.V. KASL & L.F. BERKMAN. 1989. The health impact of living with acognitively impaired elderly spouse: depressive symptoms and social functioning. J.Gerontol. 44: S17–S27.
41. THIBAUT, J. & KELLY H.H. 1959. The Social Psychology of Groups. John Wiley &Sons, New York.
42. WELLMAN, B. 1985. From social support to social network. In Social Support: Theory,Research, and Applications. I.G. Sarason & B.R. Sarason, Eds.: 205–224. MartinusNijhoff, Dordrecht.
43. KESSLER, R.C., J.D. MCLEOD & E. WETHINGTON. 1985. The costs of caring: a perspec-tive on the relationship between sex and psychological distress. In Social Support:Theory, Research and Applications. I.G. Sarason & B.R. Sarason, Eds.: 491–506.Martinus Nijhoff, Dordrecht.
44. ANTONUCCI, T.C. & J.S. JACKSON. 1987. Social support, interpersonal efficacy, andhealth: a life course perspective. In Handbook of Clinical Gerontology. L.L.Carstensen & B.A. Edelstein, Eds.: 291–311. Pergamom Press, New York.
45. ROOK, K.S. 1984. The negative side of social interaction: impact on psychologicalwell-being. J. Pers. Soc. Psychol. 46: 1097–1108.
46. SCHUSTER, T.L., R.C. KESSLER & R.H. ASELTINE, JR. 1990. Supportive interactions,negative interactions, and depressed mood. Am. J. Community Psychol. 18: 423–438.
47. FINCH, J.F., et al. 1989. Positive and negative social ties among older adults: measure-ment models and the prediction of psychological distress and well-being. Am. J.Community Psychol. 17: 585–605.
48. ABBEY, A., D.J. ABRAMIS & R.D. CAPLAN. 1985. Effects of different sources of socialsupport and social conflict on emotional well-being. Basic Appl. Socl. Psychol. 6:111–129.
49. BURG, M.M. & T.E. SEEMAN. 1994. Families and health: the negative side of socialties. Ann. Behav. Med. 16: 109–115.
50. BROWN, G.W. & T.O. HARRIS, Eds. 1989. Life Events and Illness. Guilford, NewYork.
51. BOLGER, K.E., et al. 1995. Psychosocial adjustment among children experiencing per-sistent and intermittent family economic hardship. Child Dev. 66: 1107–1129.
52. WETHINGTON, E., J.D. MCLEOD & R.C. KESSLER. 1987. The importance of life eventsin explaining sex differences in psychological distress. In Gender and Stress. R.C.Barnett, L.B. Biener & G.K. Baruch, Eds.: 144–156. Basic Books, New York.
53. COYNE, J.C. & A. DELONGIS. 1986. Going beyond social support: the role of socialrelationships in adaptation. J. Consult. Clin. Psychol. 54: 454–460.
54. LEVENSON, R.W. & J.M. GOTTMAN. 1985. Physiological and affective predictors ofchange in relationship satisfaction. J. Pers. Soc. Psychol. 49: 85–94.
112 ANNALS NEW YORK ACADEMY OF SCIENCES
55. KIECOLT-GLASER J.K., et al. 1987. Chronic stress and immunity in family caregivers ofAlzheimer’s disease victims. Psychosom. Med. 49: 523–535.
56. KIECOLT-GLASER, J.K., et al. 1988. Marital discord and immunity in males. Psycho-som. Med. 50: 213–229.
57. GORE, S. 1978. The effect of social support in moderating the health consequences ofunemployment. J. Health Soc. Behav. 19: 157–165.
58. DIMATTEO, M.R. & R. HAYS. 1981. Social support and life stress. In Social Networksand Social Support. B.H. Gottlieb, Ed.: 117–148. Sage Publications, Beverly Hills.
59. SEEMAN, T.E., M.L. BRUCE & G. MCAVAY. 1996. Social network characteristics andonset ADL disability: MacArthur studies on successful aging. J. Gerontol. 51B:S191–S200.
60. LEVENTHAL, H. & P.D. CLEARY. 1980. The smoking problem: a review of the researchand theory in behavioral modification. Psychol. Bull. 88: 370–405.
61. STUNKARD, A.J. 1979. The example of obesity. In Behavioral Medicine: Theory andPractice. O.F. Pomerleau & J.P. Brady, Eds.: 279–298. Williams & Wilkins, Balti-more.
62. MOOS, R.K., R.C. CRONKITE & S.W. FINNEY. 1982. A conceptual framework for alco-holism treatment evaluation. In Encyclopedic Handbook of Alcoholism. E.M. Patti-son & E. Kaufman, Eds.: 1120–1139. Gardner, New York.
63. COHEN, S., et al. 1988. Social support interventions for smoking cessation. In Marshal-ing Social Support: Formats, Precesses, and Effects. B.H. Gottlieb, Ed.: 211–240.Sage Publications, Beverly Hills.
64. JESSOR, R., J.E. DONOVAN & F.M. COSTA. 1991. Beyond Adolescence Problem Behav-ior and Young Adult Development. Cambridge University Press, New York.
65. KANG, S.H., J.R. BLOOM & P.S. ROMANO. 1994. Cancer screening among African-American women: their use of tests and social support. Am. J. Public Health 84:101–103.
66. SUAREZ, L., et al. 1994. Effect of social networks on cancer-screening behavior ofolder Mexican American women. J. Natl. Cancer Inst. 86: 775–779.
67. BOVBJERG, V.E., et al. 1995. Spouse support and long-term adherence to lipid-lower-ing diets. Am. J. Epidemiol. 141: 451–460.
68. DUNCAN, T.E. & E. MCAULEY. 1993. Social support and efficacy cognitions in exer-cise adherence: a latent growth curve analysis. J. Behav. Med. 16: 199–218.
69. SEEMAN, M., T.E. SEEMAN & M. SAYLES. 1985. Social networks and health: a longitu-dinal study of social support and health. Soc. Psychol. Q. 48: 237–248.
70. FRONGILLO, E.A. JR., et al. 1992. Characteristics related to elderly persons’ not eatingfor 1 or more days: implications for meal programs. Am. J. Public Health 82: 600–602.
71. KANG, S.H. & J.R. BLOOM. 1993. Social support and cancer screening among olderblack Americans. J. Natl. Cancer Inst. 85: 737–742.
72. SEEMAN, M., A. SEEMAN & A. BUDROS. 1988. Powerlessness, work, and community: alongitudinal study of alienation and alcohol use. J. Health Soc. Behav. 29: 185–198.
73. KAPLAN, R.M, M.W. CHADWICK & L.E. SCHIMMEL. 1985. Social learning interventionto promote metabolic control in Type I diabetes mellitus: pilot experiment results.Diabetes Care 8: 152–155.
74. KAPLAN, R.M. & S.L. HARTWELL. 1987. Differential effects of social support andsocial network on physiological and social outcomes in men and women with TypeII Diabetes Mellitus. Health Psychol. 6: 387–398.
75. MURRAY, R.P., et al. 1995. Social support for smoking cessation and abstinence. LungHealth Stud. 20: 159–170.
76. VENTERS, M.H., et al. 1984. Spouse concordance of smoking patterns: the Minnesotaheart survey. Am. J. Epidemiol. 120: 608–616.
77. SEEMAN, M. & C.S. ANDERSON. 1983. Alienation and alcohol: the role of work, mas-tery, and community in drinking behavior. Am. Sociol. Rev. 48: 60–77.
78. HOBFOLL, S.E. 1985. Limitations of social support in the stress process. In Social Sup-port: Theory, Research, and Applications. I.G. Sarason & B.R. Sarason, Eds.: 391–414. Martinus Nijhoff Publishers, Dordrecht.
113SEEMAN & CRIMMINS: SOCIAL ENVIRONMENT EFFECTS
79. MCKUSICK, L., et al. 1990. Longitudinal predictors of reductions in unprotected analintercourse among gay men in San Francisco: the AIDS behavioral research project.Am. J. Public Health 80: 978–983.
80. EMMONS, K.M., S.K. HAMMOND & D.B. ABRAMS. 1994. Smoking at home: the impactof smoking cessation on nonsmokers’ exposure to environmental tobacco smoke.Health Psychol. 13: 516–520.
81. MERCY, J.A. & L.E. SALTZMAN. 1989. Fatal violence among spouses in the UnitedStates, 1976–1985. Am. J. Public Health 79(5): 595–599.
82. LEVY, R.L. 1983. Social support and compliance: a selective review and critique oftreatment integrity and outcome measurement. Soc. Sci. Med. 17: 1329–1338.
83. BECKER, M.H. & L.W. GREEN. 1975. A family approach to compliance with medicaltreatment. Int. J. Health Educ. Soc. Sci. Med. 18: 173–182.
84. STRICKLAND, R., J. ALSTON & J. DAVIDSON. 1981. The negative influence of familieson compliance. Hosp. Commun. Psychiatry 32: 349–350.
85. SEEMAN, T.E. & B.S. MCEWEN. 1996. Social Environment characteristics and neu-roendocrine function: the impact of social ties and support on neuroendocrine regu-lation. Psychosom. Med. 58: 459–471.
86. HERTSGAARD, L., et al. 1995. Adrenocortical responses to the strange situation ininfants with disorganized/disoriented attachment relationships. Child Dev. 66: 1100–1106.
87. GUNNAR, M.R., et al. 1992. The stressfulness of separation among nine-month-oldinfants: effects of social context variables and infant temperament. Child Dev. 63:290–303.
88. EDENS, J.L., K.T. LARKIN & J.L. ABEL. 1992. The effect of social support and physi-cal touch on cardiovascular reactions to mental stress. J. Psychosom. Res. 36: 371–382.
89. KAMARCK, T.W., S.B. MANUCK & J.R. JENNINGS. 1990. Social support reduces car-diovascular reactivity to psychological challenge: a laboratory model. Psychosom.Med. 52: 42–58.
90. GERIN, W., et al. 1992. Social support in social interaction: a moderator of cardiovas-cular reactivity. Psychosom. Med. 54: 324–336.
91. LEPORE, S.J., K.A. MATA-ALLEN & G.W. EVANS. 1993. Social support lowers cardio-vascular reactivity to an acute stressor. Psychosom. Med. 55: 518–524.
92. BROWN, P.C. & T.W. SMITH. 1992. Social influence, marriage, and the heart: cardio-vascular consequences of interpersonal control in husbands and wives. Health Psy-chol. 11: 88–96.
93. KIECOLT-GLASER, J.K., et al. 1993. Negative behavior during marital conflict is asso-ciated with immunological down-regulation. Psychosom. Med. 55: 395–409.
94. KIECOLT-GLASER, J.K. & R. GLASER. 1991. Stress and immune function in humans. InPsychoneuroimmunology, 2nd edit. R. Ader, D.L. Felten & N. Cohen, Eds.: 849–867. Academic Press, New York.
95. THOMAS, P.D., J.M. GOODWIN & J.S. GOODWIN. 1985. Effect of social support onstress-related changes in cholesterol level, uric acid level, and immune function in anelderly sample. Am. J. Psych. 142: 735–737.
96. THEORELL, T., et al. 1995. Social support and the development of immune function inhuman immunodeficiency virus infection. Psychosom. Med. 57: 32–36.
97. ADLER, N.E., et al. 1993. Socioeconomic inequalities in health: no easy solution.JAMA 269: 3140–3145.
98. ADLER, N.E., et al. 1994. Socioeconomic status and health: the challenge of the gra-dient. Am. Psychol. 49: 15–24.
99. PINCUS, T. & L.F. CALLAHAN. 1995. What explains the association between socioeco-nomic status and health: primarily access to medical care or mind-body variables? J.Mind-Body Health 11: 4–36.
100. MACINTYRE, S. 1997. The black report and beyond: what are the issues? Soc. Sci.Med. 44: 723–745.
101. WILLIAMS, D.R. 1990. Socioeconomic differentials in health: a review and redirec-tion. Soc. Psychol. Quarterly 53: 81–99.
114 ANNALS NEW YORK ACADEMY OF SCIENCES
102. HAYWARD, M.D., et al. 2001. The significance of socioeconomic status in explainingthe race gap in chronic health conditions. Am. Sociol. Rev. 65: 910–930.
103. WHEATON, B. 1980. The sociogenesis of psychological disorder: an attributional the-ory. J. Health Soc. Behav. 21: 100–124.
104. DOWDALL, G.W. & M.B. MEUDELL. 1982. Alternative conceptions of class and statusand symptoms of psychological distress. Int. J. Health Serv. 12: 131–149.
105. PAPPAS, G., et al. 1993. The increasing disparity in mortality between socioeconomicgroups in the United States, 1960 and 1986. N. Engl. J. Med. 329: 103–109.
106. PRESTON, S. & I. ELO. 1995. Are educational differentials in adult mortality increas-ing in the United States? J. Aging Health 7: 476–496.
107. CRIMMINS, E.M. & Y. SAITO. 2001. Trends in disability-free life expectancy in theUnited States, 1970–1990: gender, racial, and educational differences. Soc. Sci.Med. 52: 1629–1641.
108. SCHALICK, L.M., et al. 2000. The widening gap in death rates among income groupsin the United States from 1967 to 1986. Int. J. Health Serv. 30: 13–26.
109. HOUSE, J.S., et al. 1990. Age, socioeconomic status, and health. Milbank Quarterly,68: 383–411.
110. BLACKWELL, D.L., M.D. HAYWARD & E.M. CRIMMINS. 2001. Does childhood healthaffect chronic morbidity in later life? Soc. Sci. Med. 52: 1269–1284.
111. ELO, I.T. & S.H. PRESTON. 1996. Educational differentials in mortality: United States,1979–1985. Soc. Sci. Med. 42: 47–57.
112. LYNCH, J.W., G.A. KAPLAN & S.J. SHEMA. 1997. Cumulative impact of sustained eco-nomic hardship on physical, cognitive, psychological, and social functioning. N.Engl. J. Med. 337: 1889–1895.
113. BLACK, D., et al. 1988. Inequalities in Health: the Black Report. Penguin, London.114. WILLIAMS, D.R. & C. COLLINS. 1995. US socioeconomic and racial differences in
health: patterns and explanations. Annu. Rev. Sociol. 21: 349–386.115. TURNER, R.J., B. WHEATON & D.A. LLOYD. 1995. The epidemiology of social stress.
Am. Sociol. Rev. 60: 104–125.116. KESSLER, R.C. & P.D. CLEARY. 1980. Social class and psychological distress. Am.
Sociol. Rev. 45: 463–478.117. MCLEOD, J.D. & R.C. KESSLER. 1990. Socioeconomic status differences in vulnera-
bility to undesirable life events. J. Health Soc. Behav. 31: 162–172.118. THOITS, P.A. 1995. Stress, coping, and social support processes: where are we? What
next? J. Health Soc. Behav. (Extra issue): 53–79.119. MACINTYRE, S., S. MACIVER & A. SOOMANS. 1993. Area, class and health: should we
be focusing on places or people? J. Soc. Policy 22: 213–234.120. SOOMAN, A. & S. MACINTYRE. 1995. Health and perceptions of the local environment
in socially contrasting neighbourhoods in Glasgow. J. Health Place 1: 15–26.121. CALNAN, M. & B. JOHNSON. 1985. Health, health risks and inequalities: an explor-
atory study of women’s perceptions. Sociol. Health Illness 7: 55–75.122. FLEMING, I., et al. 1987. Chronic stress as a factor in physiologic reactivity to chal-
lenge. Health Psychol. 6(3): 221–237.123. LOBEL, M., C. DUNKEL-SCHETTER & S.C. SCRIMSHAW. 1992. Prenatal maternal stress
and prematurity: a prospective study of socioeconomically disadvantaged women.Health Psychol. 11: 32–40.
124. BARKER, D. 1994. Mothers, Babies and Disease in Later Life. BMJ Publications,London.
125. KESSLER, R.C., et al. 1995. Social psychology and health. In Sociological Perspec-tives on Social Psychology. K. Cook, F. Fine & J.S. House, Eds.: 548–570. Allyn &Bacon, Boston.
126. PEARLIN, L.I. & C. SCHOOLER. 1978. The structure of coping. J. Health Soc. Behav.19: 2–21.
127. TURNER, R.J. & P. ROSZELL. 1994. Psychosocial resources and the stress process. InStress and Mental Health: Contemporary Issues and Prospects for the Future. W.R.Avison & I.H. Gotlib, Eds.: 179–210. Plenum, New York.
115SEEMAN & CRIMMINS: SOCIAL ENVIRONMENT EFFECTS
128. HOUSE, J.S., et al. 1992. Social stratification, age, and health. In Aging, HealthBehaviors, and Health Outcomes. K.W. Schaie, D. Blazer & J.S. House, Eds.: 1–32.Hillsdale, New Jersey.
129. MIROWSKY, J. & C. E. ROSS. 1986. Social patterns of distress. Annu. Rev. Sociol. 12:23–45.
130. BERKMAN, L.F. & L. BRESLOW. 1983. Health and ways of living. Oxford UniversityPress, New York.
131. MATTHEWS, K.A., et al. 1989. Educational attainment and behavioral and biologicrisk factors for coronary heart disease in middle-aged women. Am. J. Epidemiol.129: 1132–1144.
132. TURNER, R.J. & F. MARINO. 1994. Social support and social structure: a descriptiveepidemiology. J. Health Soc. Behav. 31: 193–212.
133. KRAUSE, N. 1992. Stress and isolation form close ties in later life. J. Gerontol. 46:S183–S194.
134. TURNER, R.J. & S. NOH. 1983. Class and psychological vulnerability among women:the significance of social support and personal control. J. Health Soc. Behav. 24: 2–15.
135. COHEN, S. 1980. Aftereffects of stress in human performance and social behavior: areview of research and theory. Psychol. Bull. 88: 82–108.
136. LYNCH, J.W., G.A. KAPLAN & J.T. SALONEN. 1997. Why do poor people behavepoorly? Variation in adult health behaviours and psychosocial characteristics bystages of the socioeconomic lifecourse. Soc. Sci. Med. 44: 809–819.
137. MACINTYRE, S. 2000. The social patterning of exercise behaviours: the role of per-sonal and local resources. Br. J. Sports Med. 34: 6.
138. SOOMAN, A. & J. TAGGART. 1992. Price and Availability of a section of basic fooditems in two localities in Glasgow City. MRC Medical Sociology Working PaperNo. Glasgow.
139. SOOMAN, A., S. MACINTYRE & A. ANDERSON. 1993. Scotland’s health—a more diffi-cult challenge for some? The price and availability of healthy foods in socially con-trasting localities in the West of Scotland. Health Bull. 51: 276–284.
140. TROUTT, D.D. 1993. The thin red line: how the poor still pay more. West CoastRegional Office, Consumers Union of U.S. San Francisco, CA.
141. WINKLEBY, M.A., S.P. FORTMANN & D.C. BARRETT. 1990. Social class disparities inrisk factors for disease: eight-year prevalence patterns by level of education. Prev.Med. 19: 1–12.
142. WILKINSON, R.G., Ed. 1986. Class and Health: Research and Longitudinal Data.Tavistock, London.
143. MARMOT, M.G., M.J. SHIPLEY & G. ROSE. 1984. Inequalities in death—specificexplanations of a general pattern? Lancet 1: 1003–1006.
144. WOOLHANDLER, S., et al. 1985. Medical care and mortality: racial differences in pre-ventable death. Int. J. Health Serv. 15: 1–11.
145. LYNCH, J.W., et al. 1996. Do known risk factors explain the relationship betweensocioeconomic status, risk of all-cause mortality, cardiovascular mortality and acutemyocardial infarction? Am. J. Epidemiol. 144: 934–942.
146. WERNER, E. 1990. Protective factors and individual resilience. In Handbook of EarlyChildhood Interventions. S.J. Meisels & J.P. Shonkoff, Eds. Harvard UniversityPress, Cambridge.
147. LIBERATOS, P., B.G. LINK & J.L. KELSEY. 1988. The measurement of social class inepidemiology. Epidemiol. Rev. 10: 87–121.
148. KAPLAN, G.A. 1995. Where do shared pathways lead? Some reflections on a researchagenda. Psychosom. Med. 57: 208–212.
149. LYNCH, J.W., G.D. SMITH, G.A. KAPLAN & J.S. HOUSE. 2000. Income inequality andmortality: importance to health of individual income, psychosocial environment, ormaterial conditions. BMJ 320: 1200–1204.
150. ANDERSON, R.T., et al. 1996. Mortality effects of community socioeconomic status.Epidemiology 8: 42–47.
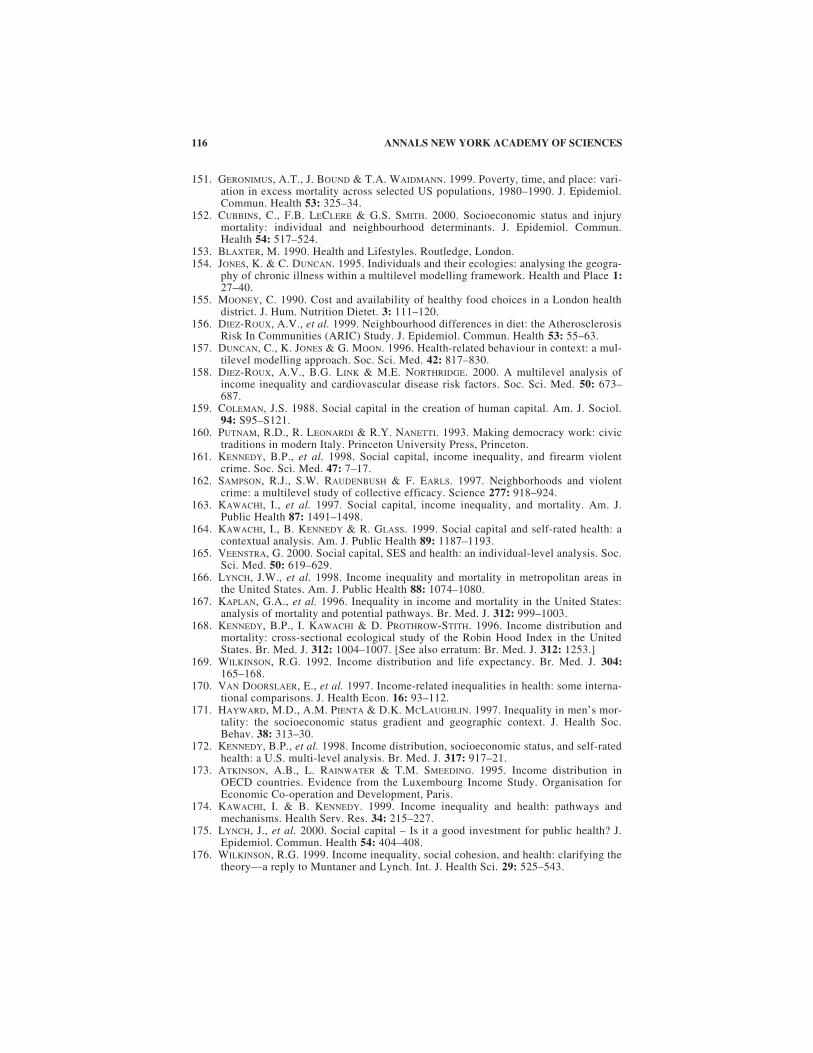
116 ANNALS NEW YORK ACADEMY OF SCIENCES
151. GERONIMUS, A.T., J. BOUND & T.A. WAIDMANN. 1999. Poverty, time, and place: vari-ation in excess mortality across selected US populations, 1980–1990. J. Epidemiol.Commun. Health 53: 325–34.
152. CUBBINS, C., F.B. LECLERE & G.S. SMITH. 2000. Socioeconomic status and injurymortality: individual and neighbourhood determinants. J. Epidemiol. Commun.Health 54: 517–524.
153. BLAXTER, M. 1990. Health and Lifestyles. Routledge, London.154. JONES, K. & C. DUNCAN. 1995. Individuals and their ecologies: analysing the geogra-
phy of chronic illness within a multilevel modelling framework. Health and Place 1:27–40.
155. MOONEY, C. 1990. Cost and availability of healthy food choices in a London healthdistrict. J. Hum. Nutrition Dietet. 3: 111–120.
156. DIEZ-ROUX, A.V., et al. 1999. Neighbourhood differences in diet: the AtherosclerosisRisk In Communities (ARIC) Study. J. Epidemiol. Commun. Health 53: 55–63.
157. DUNCAN, C., K. JONES & G. MOON. 1996. Health-related behaviour in context: a mul-tilevel modelling approach. Soc. Sci. Med. 42: 817–830.
158. DIEZ-ROUX, A.V., B.G. LINK & M.E. NORTHRIDGE. 2000. A multilevel analysis ofincome inequality and cardiovascular disease risk factors. Soc. Sci. Med. 50: 673–687.
159. COLEMAN, J.S. 1988. Social capital in the creation of human capital. Am. J. Sociol.94: S95–S121.
160. PUTNAM, R.D., R. LEONARDI & R.Y. NANETTI. 1993. Making democracy work: civictraditions in modern Italy. Princeton University Press, Princeton.
161. KENNEDY, B.P., et al. 1998. Social capital, income inequality, and firearm violentcrime. Soc. Sci. Med. 47: 7–17.
162. SAMPSON, R.J., S.W. RAUDENBUSH & F. EARLS. 1997. Neighborhoods and violentcrime: a multilevel study of collective efficacy. Science 277: 918–924.
163. KAWACHI, I., et al. 1997. Social capital, income inequality, and mortality. Am. J.Public Health 87: 1491–1498.
164. KAWACHI, I., B. KENNEDY & R. GLASS. 1999. Social capital and self-rated health: acontextual analysis. Am. J. Public Health 89: 1187–1193.
165. VEENSTRA, G. 2000. Social capital, SES and health: an individual-level analysis. Soc.Sci. Med. 50: 619–629.
166. LYNCH, J.W., et al. 1998. Income inequality and mortality in metropolitan areas inthe United States. Am. J. Public Health 88: 1074–1080.
167. KAPLAN, G.A., et al. 1996. Inequality in income and mortality in the United States:analysis of mortality and potential pathways. Br. Med. J. 312: 999–1003.
168. KENNEDY, B.P., I. KAWACHI & D. PROTHROW-STITH. 1996. Income distribution andmortality: cross-sectional ecological study of the Robin Hood Index in the UnitedStates. Br. Med. J. 312: 1004–1007. [See also erratum: Br. Med. J. 312: 1253.]
169. WILKINSON, R.G. 1992. Income distribution and life expectancy. Br. Med. J. 304:165–168.
170. VAN DOORSLAER, E., et al. 1997. Income-related inequalities in health: some interna-tional comparisons. J. Health Econ. 16: 93–112.
171. HAYWARD, M.D., A.M. PIENTA & D.K. MCLAUGHLIN. 1997. Inequality in men’s mor-tality: the socioeconomic status gradient and geographic context. J. Health Soc.Behav. 38: 313–30.
172. KENNEDY, B.P., et al. 1998. Income distribution, socioeconomic status, and self-ratedhealth: a U.S. multi-level analysis. Br. Med. J. 317: 917–21.
173. ATKINSON, A.B., L. RAINWATER & T.M. SMEEDING. 1995. Income distribution inOECD countries. Evidence from the Luxembourg Income Study. Organisation forEconomic Co-operation and Development, Paris.
174. KAWACHI, I. & B. KENNEDY. 1999. Income inequality and health: pathways andmechanisms. Health Serv. Res. 34: 215–227.
175. LYNCH, J., et al. 2000. Social capital – Is it a good investment for public health? J.Epidemiol. Commun. Health 54: 404–408.
176. WILKINSON, R.G. 1999. Income inequality, social cohesion, and health: clarifying thetheory—a reply to Muntaner and Lynch. Int. J. Health Sci. 29: 525–543.
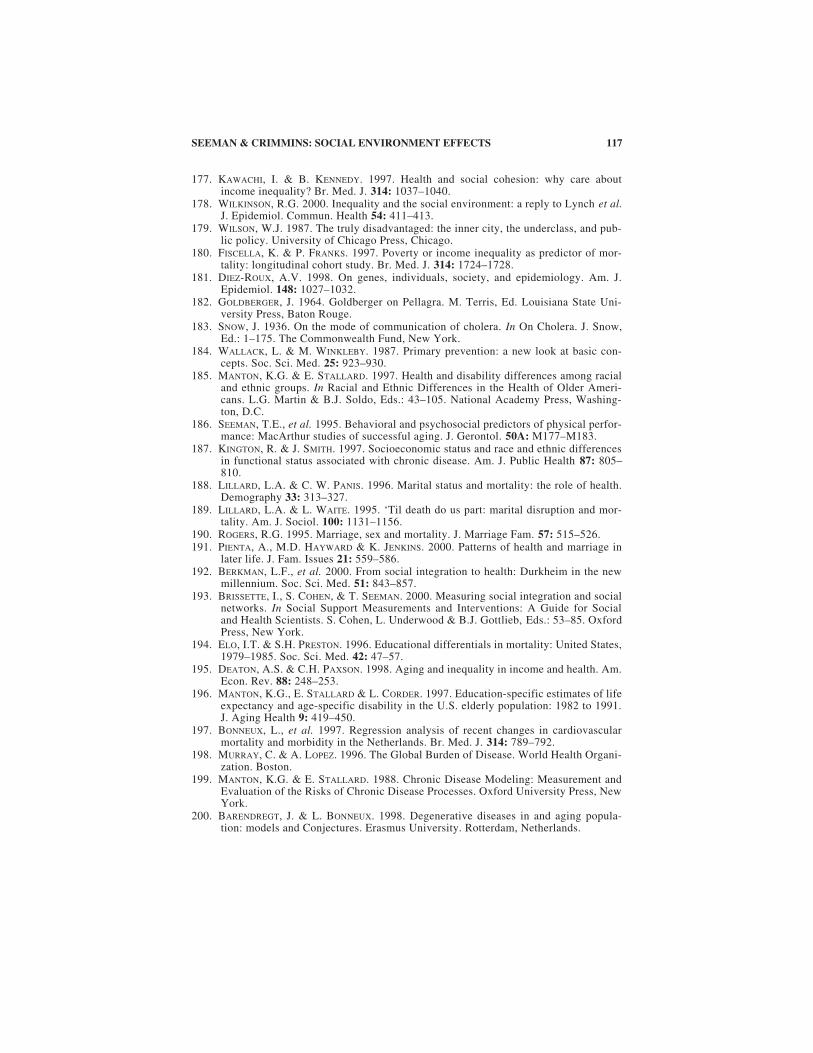
117SEEMAN & CRIMMINS: SOCIAL ENVIRONMENT EFFECTS
177. KAWACHI, I. & B. KENNEDY. 1997. Health and social cohesion: why care aboutincome inequality? Br. Med. J. 314: 1037–1040.
178. WILKINSON, R.G. 2000. Inequality and the social environment: a reply to Lynch et al.J. Epidemiol. Commun. Health 54: 411–413.
179. WILSON, W.J. 1987. The truly disadvantaged: the inner city, the underclass, and pub-lic policy. University of Chicago Press, Chicago.
180. FISCELLA, K. & P. FRANKS. 1997. Poverty or income inequality as predictor of mor-tality: longitudinal cohort study. Br. Med. J. 314: 1724–1728.
181. DIEZ-ROUX, A.V. 1998. On genes, individuals, society, and epidemiology. Am. J.Epidemiol. 148: 1027–1032.
182. GOLDBERGER, J. 1964. Goldberger on Pellagra. M. Terris, Ed. Louisiana State Uni-versity Press, Baton Rouge.
183. SNOW, J. 1936. On the mode of communication of cholera. In On Cholera. J. Snow,Ed.: 1–175. The Commonwealth Fund, New York.
184. WALLACK, L. & M. WINKLEBY. 1987. Primary prevention: a new look at basic con-cepts. Soc. Sci. Med. 25: 923–930.
185. MANTON, K.G. & E. STALLARD. 1997. Health and disability differences among racialand ethnic groups. In Racial and Ethnic Differences in the Health of Older Ameri-cans. L.G. Martin & B.J. Soldo, Eds.: 43–105. National Academy Press, Washing-ton, D.C.
186. SEEMAN, T.E., et al. 1995. Behavioral and psychosocial predictors of physical perfor-mance: MacArthur studies of successful aging. J. Gerontol. 50A: M177–M183.
187. KINGTON, R. & J. SMITH. 1997. Socioeconomic status and race and ethnic differencesin functional status associated with chronic disease. Am. J. Public Health 87: 805–810.
188. LILLARD, L.A. & C. W. PANIS. 1996. Marital status and mortality: the role of health.Demography 33: 313–327.
189. LILLARD, L.A. & L. WAITE. 1995. ‘Til death do us part: marital disruption and mor-tality. Am. J. Sociol. 100: 1131–1156.
190. ROGERS, R.G. 1995. Marriage, sex and mortality. J. Marriage Fam. 57: 515–526.191. PIENTA, A., M.D. HAYWARD & K. JENKINS. 2000. Patterns of health and marriage in
later life. J. Fam. Issues 21: 559–586.192. BERKMAN, L.F., et al. 2000. From social integration to health: Durkheim in the new
millennium. Soc. Sci. Med. 51: 843–857.193. BRISSETTE, I., S. COHEN, & T. SEEMAN. 2000. Measuring social integration and social
networks. In Social Support Measurements and Interventions: A Guide for Socialand Health Scientists. S. Cohen, L. Underwood & B.J. Gottlieb, Eds.: 53–85. OxfordPress, New York.
194. ELO, I.T. & S.H. PRESTON. 1996. Educational differentials in mortality: United States,1979–1985. Soc. Sci. Med. 42: 47–57.
195. DEATON, A.S. & C.H. PAXSON. 1998. Aging and inequality in income and health. Am.Econ. Rev. 88: 248–253.
196. MANTON, K.G., E. STALLARD & L. CORDER. 1997. Education-specific estimates of lifeexpectancy and age-specific disability in the U.S. elderly population: 1982 to 1991.J. Aging Health 9: 419–450.
197. BONNEUX, L., et al. 1997. Regression analysis of recent changes in cardiovascularmortality and morbidity in the Netherlands. Br. Med. J. 314: 789–792.
198. MURRAY, C. & A. LOPEZ. 1996. The Global Burden of Disease. World Health Organi-zation. Boston.
199. MANTON, K.G. & E. STALLARD. 1988. Chronic Disease Modeling: Measurement andEvaluation of the Risks of Chronic Disease Processes. Oxford University Press, NewYork.
200. BARENDREGT, J. & L. BONNEUX. 1998. Degenerative diseases in and aging popula-tion: models and Conjectures. Erasmus University. Rotterdam, Netherlands.