Embed Size (px)
Citation preview
Social Heterogeneity, Political Competition, and
Redistributive Demands:
The role of programmatic linkages
Kent FreezeDuke [email protected]
Abstract
This paper examines in greater detail the influence of ethnic heterogeneity on pref-erences for government-led redistribution of income. I find that ethnic heterogeneitydoes not always influence support for or against redistribution, even when large incomedifferences may exist between ethnic groups. Instead, support for redistribution willonly become a function of ethnic heterogeneity when there are incentives for partiesto link the issue of redistribution with social identity. These incentives are more likelyto arise when parties compete programmatically over the issue of redistribution. Inorder to remain electorally viable, right-wing parties must link redistribution with eth-nic identities in order to prevent citizens from voting solely on the basis of individualpocketbook concerns. I find that it is generally in countries with highly programmaticlinkages over redistribution where ethnic identity has an important effect on attitudesfor redistribution.
This paper is based on a dataset collected under the auspices of the project “Political Ac-countability in Democratic Party Competition and Economic Governance”, implementedby a political science research group at Duke University (Principal Investigator: HerbertKitschelt, Department of Political Science). We gratefully acknowledge funding for the datacollection by the World Bank, the Chilean Science Foundation (research grant directed byJuan Pablo Luna and David Altman, Catholic University of Chile), and Duke University.Data analysis and conclusions of this paper are the sole responsibility of its author.
1
Introduction
During the 2010 national election in Sweden, the anti-immigrant Swedish Democrats pre-
pared a controversial campaign ad, that was in the end pulled from TV for fear it would
break Swedish hate speech laws1. The ad depicted an elderly Swedish pensioner hobbling
toward a government benefits desk in an effort to receive her pension. Suddenly a horde of
burqa-clad women burst on to the scene, rushing toward the desk while pushing strollers and
elbowing past the elderly Swedish woman. The ad ended with a mutually-exclusive choice
posited toward the Swedish electorate: vote for pensions or for immigration. The message of
the ad was a clear one: if immigration was allowed to continue, social spending would flow
to non-Swedes.
The ad was an effective one, generating significant amount of controversy in the media
(and later going viral online), and attracting attention to the Swedish Democrats campaign
(which for the first time broke through the 4% threshold necessary for representation in the
Swedish parliament). The ad effectively tied together the issue of social spending with that
of ethnic identity, with the clear message that social benefits were primarily going to recent
(and fecund) immigrants who would take social spending “away” from real Swedes.
The central contention of this paper is that the nature of democratic political competition
in a country, in conjunction with between-ethnicity inequality, can create incentives for
some politicians to use an “ethnic” frame with regards to social spending. Specifically,
the likelihood that politicians will tie ethnicity to social spending via ethnic frames will
rise as democratic competition in a country becomes increasingly programmatic. As ethnic
framing becomes more prominent, a greater between–group divergence in preferences for
redistribution is seen.
1The ad can be viewed at: http://www.youtube.com/watch?v=AYavOiI-8uY
2
Ethnic Frames
The usage of ethnic frames with regards to social spending are not unique to the Swedish
Democrats. There is a rich literature in the United States on how ethnic frames have shaped
public opinion on welfare spending. Several scholars have noted that welfare spending in
the United States has been “racialized” by both the media (Gilens 1999); (Neubeck and
Cazenave 2001) and politicians (Quadagno 1994); (Winter 2008), with welfare in America
having a black face. Although the United States has a long and sad history of poor race rela-
tions, Gilens (1999) notes that the racialization of welfare is a relatively recent phenomenon,
beginning primarily in the 1960s. Prior to then, he notes that poverty and welfare tended to
be associated with whites, specifically whites residing primarily in Appalachia. The racial-
ization of welfare, argued Gilens, occurred as a backlash against the civil rights movement to
the point that social spending in the United States today is seen in racial terms. Some stud-
ies have suggested that the United States has lower social spending because the American
population is more heterogenous than other (primarily European) countries (Alesina and
Glaeser 2004); (Alesina, Baqir and Easterly 1999). In these studies, ethnic heterogeneity
is assumed to lower demand for redistribution, and therefore overall public spending. As
heterogeneity increases and social spending becomes more concentrated among a particular
ethnic group, support for such spending among other ethnicities will decrease.
While it seems clear that welfare and racial identity are intimately connected in the
United States, how well does the logic above extend to other countries? The focus on the
single country makes it difficult to know whether the American case is typical or exceptional.
Are other countries with heterogeneous populations also susceptible to similar appeals linking
social spending with ethnic identity? To put it another way, does ethnic identity necessarily
shape preferences for redistribution in heterogenous societies, or are other factors necessary
to link social spending with ethnicity?
3
Social identity has often been assumed to drive preferences for redistribution, but evi-
dence to date has been limited to either randomized experiments (Klor and Shayo 2010), or
the United States (Luttmer 2001) and have not yet been adequately tested on a cross-national
scale. The results in this paper suggest that social heterogeneity does not necessarily drive
preferences for redistribution–in many countries, social heterogeneity, even when accompa-
nied by large gaps in income between different ethnicities, may not lead to comparable gaps
in support for redistribution. Instead, interethnic differences in support for redistribution
are primarily driven by the nature of how political elites interact with the electorate. Explic-
itly linking ethnic identities to social spending is a politically costly act that may constrain
the behavior of politicians – that is, politicians face tradeoffs in the potential frames they
may use. It is not possible for a party to be “all things to all people” and parties may not
always find it electorally advantageous to link ethnic identities to social spending. In some
countries, politicians have a clear incentive to link redistributive spending to social identity,
whereas in other countries, ethnicity is not linked to the issue of redistribution. Drawing on
data from the cross-national ESS and LAPOP surveys, I come to the conclusion that strong
ethnic differences in support for distribution among different ethnicities is a phenomenon
that tends to only be found in countries where political competition tends to be highly pro-
grammatic over economic issues. In these countries, stronger incentives exist for political
elites to frame social spending in a manner that links it to ethnic identity.
Social Identity and Support for Redistribution
According to social identity theory, individuals who have self-identified with a particular so-
cial group will also adopt many of the norms and behaviors of that group (Tajfel and Turner
1979). This insight has been extended to attitudes towards redistribution, by assuming that
individuals will begin to adopt the attitudes for redistribution that the prototypical group
4
member has – relatively wealthier social groups should tend to oppose redistribution that
will predominantly help members of poorer groups. Luttmer (2001), examining metropoli-
tan localities in the United States, finds that support for welfare spending decreased as the
share of recipients receiving welfare spending from a different race increased. This provides
evidence for what Luttmer terms as “interpersonal preferences”, namely preferences that are
developed not only by one’s own characteristics, but also by the characteristics of other indi-
viduals in the population (pg. 500). With greater levels of social identification, support for
redistribution should, therefore, be determined by the relative standing of the predominant
social groupings found in society.
Baldwin and Huber (2010) extend this theoretical argument by examining the role of
between-group inequality on aggregate social spending. They make an important contribu-
tion by recognizing that the ethnolinguistic fractionalization (ELF) index commonly used in
cross–national studies does not contain any information on the relative differences between
the ethnicities found in a society. When examining the role of between group inequality
(BGI), they find that it serves a stronger predictor of public goods provision than other
commonly used fractionalization scores.
The social identity approach contrasts sharply with the median-voter logic, formulated
by Romer (1975) and Meltzer and Richard (1981), which has often served as a starting point
examining preferences for redistribution, and has been central in models linking inequality
to various macro outcomes (as in Acemoglu and Robinson (2006)). The advantage of the
median voter model lies in its simplicity. To generate a prediction of preferences for redistri-
bution, one only needs to know an individual’s income status relative to the mean of society.
Unfortunately, evidence for the median-voter model is mixed. While micro-evidence within
a single country-year supports the role of income in preferences for redistribution (Corneo
and Gruner (2002) and Cusack, Iversen and Rehm (2006)), the theory appears to perform
much worse in explaining changes in inequality over time, or between different countries
5
(Kenworthy and McCall (2008) and the “Robin Hood Paradox” coined by Lindert (1991)).
It is reasonable to assume that other, societal-level factors such as social groups may poten-
tially play a role in preferences for redistribution. For example, Dion and Birchfield (2010)
find that income does not predict support for redistribution in poor countries or in countries
with high levels of income inequality.
For many individuals in a population, the preferences for redistribution predicted by both
the median voter model and the social identity model will likely be similar: for example,
wealthier members of society will also tend to be found in wealthier social identity groupings,
resulting in little conflict between their self-interested preferences and those of their social
group. However, poorer members of wealthier social groups will experience a conflict be-
tween their economic self interest and those of their ethnic identity. When these individuals
develop preferences for redistribution in line with their social identity, aggregate support for
redistribution will be lower than predicted by the median voter model (Shayo 2009).
Unresolved by these studies is the question of when ethnic identities will become salient
to individuals evaluating the issue of vertical redistribution. The assumption is that social
identity will tend to shape how individual perceptions of redistribution, but it is unclear why
ethnic identity will always tend to trump an individual’s class-based identity, or any other
potential dimension of the redistribution issue. Individuals may have a strong ethnic identity,
but they may not necessarily translate that identity into an “interpersonal preference” for or
against redistribution. Some evidence of this is shown below in Figure 1, in which I examine
whether or not social identity does actually influence aggregate preferences for redistribution.
Using data from the 2008 wave of the European Social Survey (ESS) and and the 2008 Latin
American Public Opinion Project (LAPOP) surveys, I plot average support for redistribution
(on a scale from 0 to 4, with 4 indicating greater support for government led redistribution)
against the ethnolinguistic fractionalization (ELF) score from Fearon (2003). There is no
obvious relationship between ELF and average support for redistribution, with a very slight
6
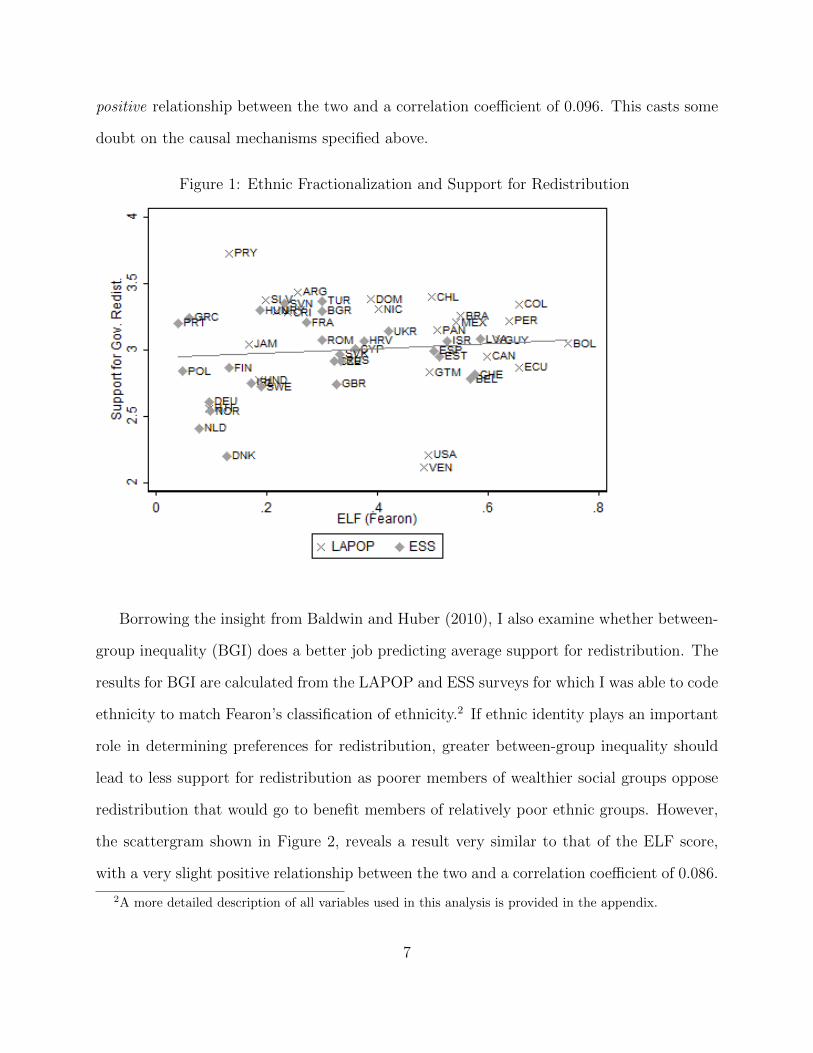
positive relationship between the two and a correlation coefficient of 0.096. This casts some
doubt on the causal mechanisms specified above.
Figure 1: Ethnic Fractionalization and Support for Redistribution
Borrowing the insight from Baldwin and Huber (2010), I also examine whether between-
group inequality (BGI) does a better job predicting average support for redistribution. The
results for BGI are calculated from the LAPOP and ESS surveys for which I was able to code
ethnicity to match Fearon’s classification of ethnicity.2 If ethnic identity plays an important
role in determining preferences for redistribution, greater between-group inequality should
lead to less support for redistribution as poorer members of wealthier social groups oppose
redistribution that would go to benefit members of relatively poor ethnic groups. However,
the scattergram shown in Figure 2, reveals a result very similar to that of the ELF score,
with a very slight positive relationship between the two and a correlation coefficient of 0.086.
2A more detailed description of all variables used in this analysis is provided in the appendix.
7
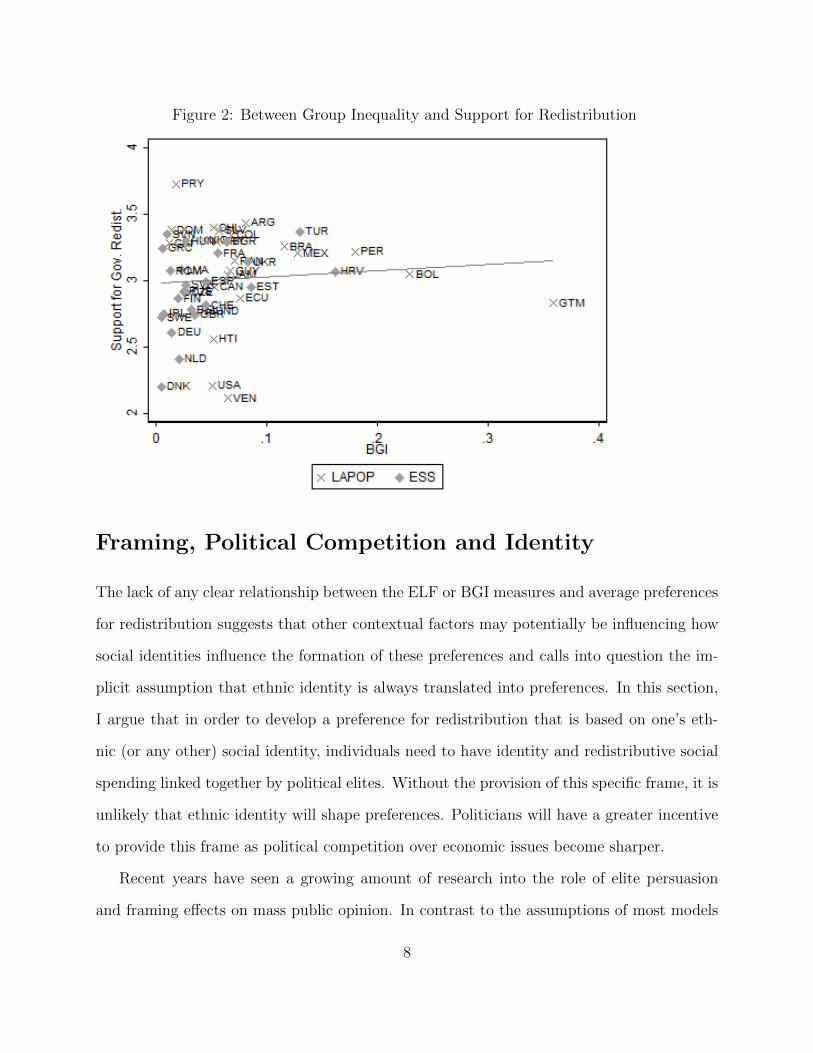
Figure 2: Between Group Inequality and Support for Redistribution
Framing, Political Competition and Identity
The lack of any clear relationship between the ELF or BGI measures and average preferences
for redistribution suggests that other contextual factors may potentially be influencing how
social identities influence the formation of these preferences and calls into question the im-
plicit assumption that ethnic identity is always translated into preferences. In this section,
I argue that in order to develop a preference for redistribution that is based on one’s eth-
nic (or any other) social identity, individuals need to have identity and redistributive social
spending linked together by political elites. Without the provision of this specific frame, it is
unlikely that ethnic identity will shape preferences. Politicians will have a greater incentive
to provide this frame as political competition over economic issues become sharper.
Recent years have seen a growing amount of research into the role of elite persuasion
and framing effects on mass public opinion. In contrast to the assumptions of most models
8
of representation, this literature argues political actors are not simply waiting to take cues
from an already informed public possessing concrete preferences, but are actively engaged
in shaping and molding preferences through the creative use of frames. Individuals rely
on the efforts of political elites in order to form opinions regarding a complex political
environment. As Zaller (1992) argued, “When elites uphold a clear picture of what should
be done, the public tends to see events from that point of view, with the most politically
attentive members of the public most likely to adopt the elite position. When elites divide,
members of the public tend to follow the elites sharing their general ideological or partisan
predisposition...” (pg. 8–9). How an individual views inequality will therefore be strongly
influenced by the nature of elite discourse on the issue, with politically informed individuals
tending to adopt the positions of those elites with whom they identify.
In considering how individuals interpret frames, I borrow from Nelson and Oxley (1999),
who discuss how certain frames adjust the weights individuals assign to different consider-
ations of issues in what Chong and Druckman (2007) term the “conventional expectancy
model of an individual’s attitude.” According to this model, an individual may have a va-
riety of different beliefs around each political issue, which all have the ability to affect how
individuals view that issue and the formation of preferences for or against that issue. For the
issues of economic inequality and the need for a government role for redistribution, while an
individual may consider how redistribution affects their ethnic standing, how redistribution
will affect their own pocketbook, the role excessive inequality may have on crime rates or
inequality of opportunity. In the end, whether or not an individual supports redistribution
will depend on the cumulative sum of the weights they ascribe to the different dimensions
of redistribution. The weights that individuals will assign to the different dimensions of
redistribution will not always be constant, either, and can potentially be influenced by oth-
ers. Political elites, for example, may engage in strategic attempts to shift the weights that
individuals assign to the different aspects of government spending (Sniderman and Theri-
9
ault 2004). In some circumstances, politicians may find it advantageous to emphasize social
identities with regard to social spending, but not in others.
Less well understood, however, is the question of when elites will have incentives to use
a particular frame. Specifically, when can it be expected for political elites to frame social
spending in terms of ethnic identity? When will political elites prompt the group–based
comparison necessary to generate between–group differences in support for redistribution?
In this paper, I focus on the nature of political competition in a country, arguing that an
increasingly programmatic political context will increase the incentives for political elites,
especially on the economic right, to frame social spending in terms of ethnic identity. As
this framing continues forward, I expect to observe greater polarization in support for re-
distribution along ethnic lines, with poorer ethnic groups exhibiting greater support for
redistribution than members of wealthier ethnic groups.
Politicians may employ a wide variety of different appeals to voters to curry political sup-
port among the electorate. Politicians will use the linkage mechanism(s) which will provide
them with the greatest probability of electoral success. The different linkage mechanisms as
shown in Figure 3 include charismatic, clientelistic, and programmatic linkages, as well as
partisan attachment and valence-based appeals.
Party ID is a linkage mechanism in which voters possess an affective attachment to
a particular party, and has been identified as a critical tool to explain American voting
behavior by Campbell et al. (1960). Politicians using this linkage mechanism will emphasize
a party’s history, and voters will also tend to be extremely stable in their support for a
particular party even as policies may shift.
In contrast to these affective attachments between candidates and citizens, voters may
also choose politicians based on the policy positions offered by the candidates. This assump-
tion underlies Downsian models of voting behavior - politicians (or parties) offer policies on
which the electorate then votes, with individuals choosing the politicians offering policy clos-
10
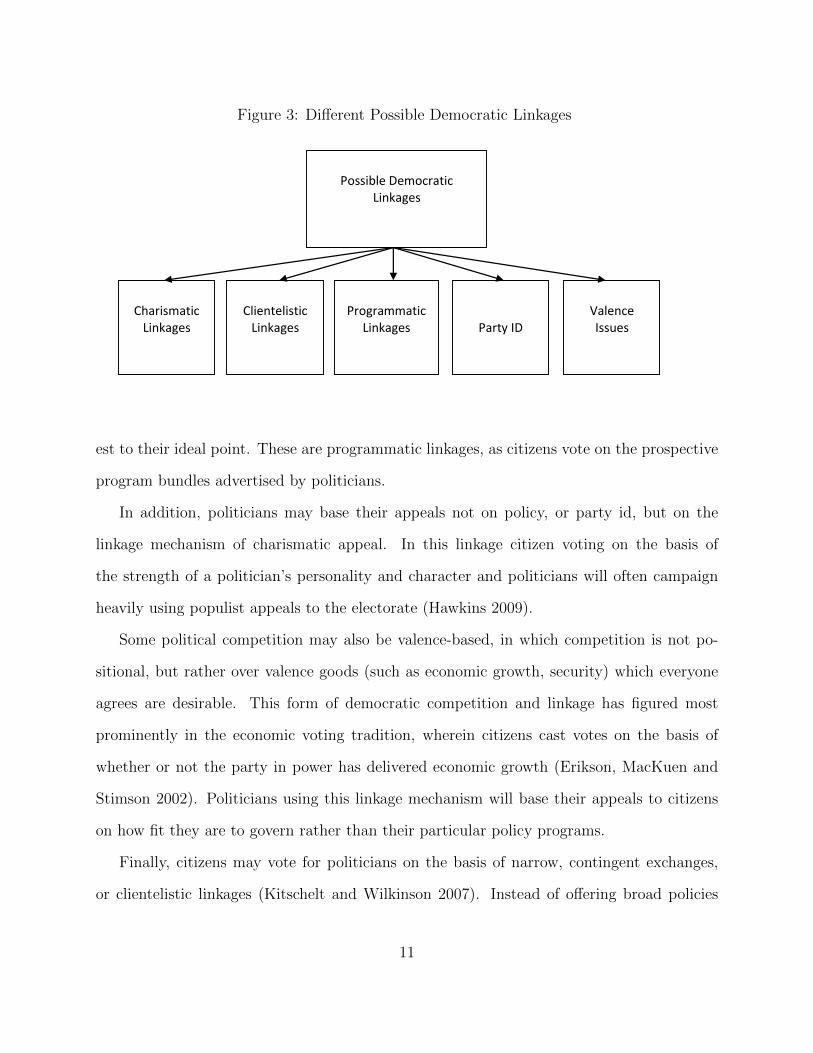
Figure 3: Different Possible Democratic Linkages
Possible Democratic Linkages
Programmatic
Linkages
Clientelistic
Linkages
Charismatic
Linkages
Party ID
Valence Issues
est to their ideal point. These are programmatic linkages, as citizens vote on the prospective
program bundles advertised by politicians.
In addition, politicians may base their appeals not on policy, or party id, but on the
linkage mechanism of charismatic appeal. In this linkage citizen voting on the basis of
the strength of a politician’s personality and character and politicians will often campaign
heavily using populist appeals to the electorate (Hawkins 2009).
Some political competition may also be valence-based, in which competition is not po-
sitional, but rather over valence goods (such as economic growth, security) which everyone
agrees are desirable. This form of democratic competition and linkage has figured most
prominently in the economic voting tradition, wherein citizens cast votes on the basis of
whether or not the party in power has delivered economic growth (Erikson, MacKuen and
Stimson 2002). Politicians using this linkage mechanism will base their appeals to citizens
on how fit they are to govern rather than their particular policy programs.
Finally, citizens may vote for politicians on the basis of narrow, contingent exchanges,
or clientelistic linkages (Kitschelt and Wilkinson 2007). Instead of offering broad policies
11
benefiting large groups of citizens as found in programmatic linkages, these linkages involve
a direct private exchange between party and a voter. In exchange for electoral support, the
voter receives some private good (such as food, cash, preferential access to government ben-
efits such as housing, etc.). Given the difficulty enforcing clientelistic exchanges, significant
local party organization is needed to monitor voters. Eventually this can potentially give
rise to long-term clientelistic relationships between politicians and citizens.
Politicians are usually unable to employ all linkages with the electorate because there
may be tradeoffs between the different mechanisms (Kitschelt 2000). Usage of a clientelistic
linkage makes it more difficult for a party to use a programmatic linkage. Simply put,
parties cannot become all things to all people – while they may creatively use certain forms
of appeals and frames with voters, it is impossible to mix and match all linkage strategies
to a heterogenous population.
I argue that when politicians primarily use crisp, programmatic policy appeals to the
electorate, especially over redistribution and economic policy, there exists a strong incentive
for some politicians, especially on the right, to emphasize social identities in an effort to
link ethnic identities with social spending. In a situation where programmatic linkages on
the redistribution issue are strongly emphasized, with politicians offering clear positions on
redistribution to the electorate, and the electorate voting on the basis of those positions,
leftist parties will tend to win elections if individuals only evaluate one’s pocketbook. This
is a result which follows from the standard median-voter model of redistribution: if citizens
vote purely on the basis of individual economic concerns, economic policy will be determined
by the median-voter who will have an income below the mean in the country and benefit
from redistribution. Left parties will tend to be dominant in a polity where programmatic
politics is only on redistributive issues.
In order to be electorally viable in a highly programmatic party system, therefore, right-
wing parties must change the weighting of different individuals assign to different aspects of
12
redistribution away from individual pocketbook issues. In countries with a more heteroge-
nous population, programmatic politics will result in an incentive for right-wing parties to
emphasize social identities, especially with regard to social spending and to open up new
dimensions of political competition as a “wedge issue” (Hillygus and Shields 2008) designed
to peel off support from leftist parties. In an ethnically divided society, as competition
becomes more programmatic, I expect there to be greater differences in support for redis-
tribution by ethnic group to result. However, if political competition is not programmatic
but clientelistic, or based on any other non-policy-based appeal (charisma of leader, party
id, etc.) then politicians will lack incentives to link ethnic, religious, or linguistic cleavages
to the redistribution issue in the hopes of electoral gain.
To be clear, this does not mean that ethnicity will be unimportant in non-programmatic
countries. For example, ethnicity may play an important role in facilitating the success-
ful spread of clientelistic networks (Lemarchand 1972); (Kolev and Wang 2010). Political
competition may even increase the salience of ethnicity, causing more individuals to identify
with their ethnic group (Eifert, Miguel and Posner 2010). However, I am arguing that ethnic
identities are more likely to be linked to the issue of redistribution when there are program-
matic politics over the redistribution issue. In short, when politicians compete over the issue
of redistribution, individual citizens will be more likely to view the issue in how it relates to
their social identity group, rather than their own pocketbook or any other possible aspect of
redistribution. Between group differences in support for redistribution should become larger
when citizens are voting for broad–based policy, as opposed to narrow, contingent private
goods.
13
Data Sources
Data on preferences for redistribution come primarily from two cross-national surveys: the
2008 wave of the ESS and the 2008 LAPOP surveys. All variables used in this analysis are
described in complete detail in Appendix A, but it is useful to discuss two of the most impor-
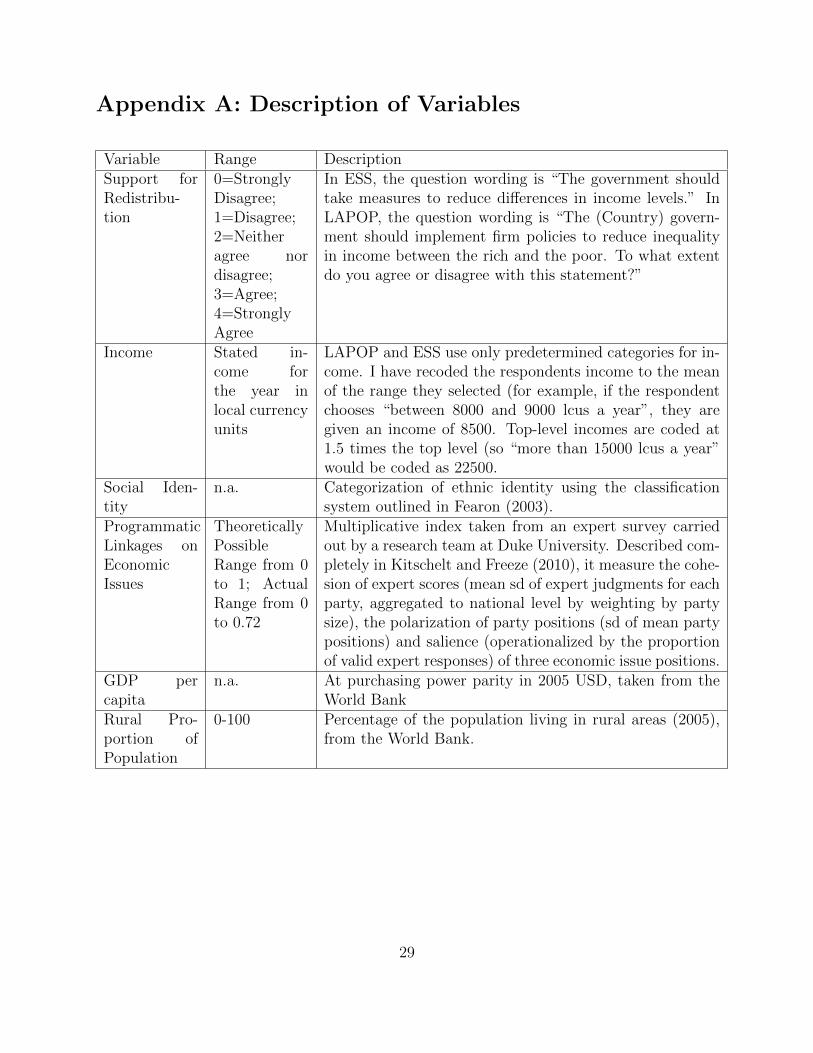
tant variables used. The first variable is preferences for government-led redistribution. The
ESS asks respondents to give their opinion on the following statement: “The government
should take measures to reduce differences in income levels.” In the LAPOP survey, respon-
dents are asked to give their assessment on whether “The government should implement firm
policies to reduce inequality of income between the rich and the poor.” Both the ESS and
LAPOP use a 5-point scale in response to the question, with a value of 0 indicating strong
disapproval of government redistribution, and 4 indicating strong support of government-
led redistribution. The distinction between government-led redistribution, as opposed to a
general observation on inequality, is an important one, especially when preferences for such
redistribution are a function of the nature of political competition in the society.3 An in-
dividual could potentially feel that inequality is too high in a country, but disagree that
the government should be involved in reducing it. They may feel reductions are better ac-
complished through private charity, or simply that the potential costs of government-led
redistribution outweigh the benefits.
Ethnicity is coded following the classification system outlined in Fearon (2003). While
there are a myriad of different possible identities an individual may have, the Fearon clas-
sification of ethnicities attempts to identify how the average individual would answer the
question “what are the main ethnic (or racial or ascriptive) groups in this country?” (pg.
195). The Fearon classification does not always map neatly into ethnic/racial categories that
are included in LAPOP and the ESS. Coding of this category was somewhat tricky for the
3Studies that use data from the World Values Survey, for example, have this flaw.
14
ESS, as there is not a direct “ethnicity” question, but rather is coded through a series of
questions on language spoken at home, religion, region, immigrant status, country of birth,
country of birth for father and mother, and whether the respondent is a member of an ethnic
minority. While I am confident that most groups are coded accurately, there are some groups
which are greatly underrepresented in my coding scheme4. Because of these potential issues,
I only include countries for which I am able to correctly classify at least 85% of respondents
into one of the ethnicities included under the Fearon classification.5
Data on the nature of democratic linkages between politicians and citizens comes from a
recent cross-national expert survey run by a research team based at Duke University, with
Herbert Kitschelt as principal investigator6. This survey was carried out in 80 countries
around the world which have had some measure of democratic political competition. In
each survey, around 10–15 scholars and 2–3 journalists were asked questions relating to the
structure, policy positions and different policy appeals employed of the major parties in each
country. The primary measure that I use in this paper is an index of programmatic compe-
tition over economic issues. It is constructed as a multiplicative index of three attributes of
programmatic competition developed out of the survey: the cohesion of expert judgments of
party positions (indicating less disagreement among experts regarding party positions, and
thus “crisper” policy stances by politicians), the polarization of party mean scores on eco-
nomic issues (indicating that parties stake out distinct policies positions), and the salience
of the issue (operationalized by the proportion of valid expert responses for the policy). This
4This applies especially to members of ethnic minorities whose native tongue has been marginalized, andwho are not recent immigrants. Examples include Roma groups, Bretons in France, or the Romansh inSwitzerland
5The following 45 countries are included in the analyses of this paper: Argentina, Belgium, Bolivia, Brazil,Bulgaria, Canada, Chile, Colombia, Costa Rica, Croatia, Czech Republic, Denmark, Dominican Republic,Ecuador, El Salvador, Estonia, Finland, France, Germany, Greece, Guatemala, Honduras, Hungary, Ireland,Jamaica, Latvia, Mexico, Netherlands, Nicaragua, Panama, Paraguay, Peru, Romania, Russian Federation,Slovakia, Slovenia, Spain, Sweden, Switzerland, Turkey, Ukraine, United Kingdom, United States, Uruguay,Venezuela.
6A full description of the project can found online at http://www.duke.edu/ web/democracy/index.htmlas well as in Kitschelt et al. (2009)
15
measure is developed and explained in greater detail in Kitschelt and Freeze (2010).
Measuring Heterogeneity of Preferences across Social
Groups
The dependent variable I calculate is a concentration index of preferences across different
ethnic groups. Concentration indices have been prominently used in public health research,
examining how various health outcomes (such as infant mortality, immunizations or access to
health care) are distributed across an income spectrum (see for example Kakwani, Wagstaff
and Van Doorslaer (1997) and Van Doorslaer et al. (1997)). The concentration index has
also been used to calculate measures of tax progressivity, such as that proposed by Kakwani
(1977).
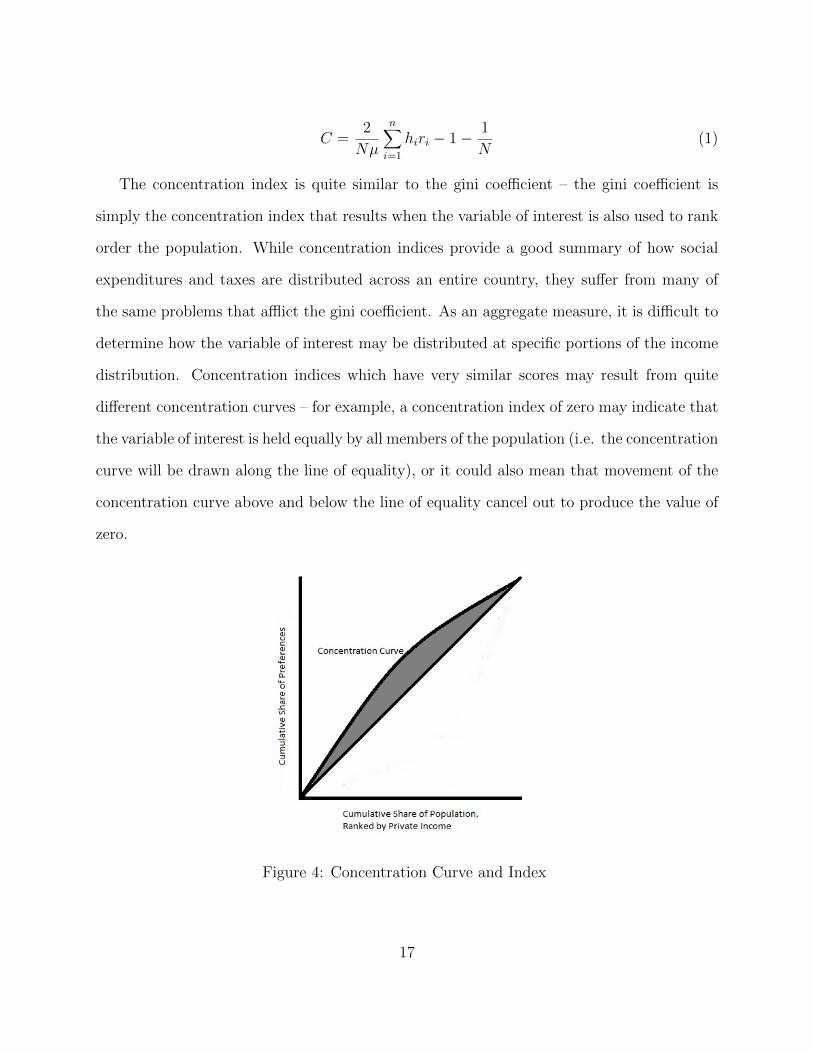
Concentration indices are based on the concentration curve, a graphical representation of
which is shown in Figure 4. Similar to the Lorenz Curve used to calculate the gini coefficient,
the concentration curve graphically illustrates the cumulative share of some variable held by
the cumulative share of the population (ranked by income). The value of the concentration
index is equal to one minus twice the area under the concentration curve. Values of the
concentration index can range from -1 to +1, with lower values indicating a greater concen-
tration of the variable of interest among the poor. A concentration index with a value of -1
indicates that the variable of interest is completely held/received by the poorest member of
society, while +1 indicates it is completely held/received by the wealthiest member of soci-
ety. To calculate a concentration index using discrete data such as I do with ethnic groups,
equation 1 is used (O’Donnell et al. (2008), pg. 96).7
7The computation of the concentration index, was also greatly assisted by the Stata code provided byO’Donnell et al. (2008), pg. 101
16
C =2
Nµ
n∑i=1
hiri − 1 − 1
N(1)
The concentration index is quite similar to the gini coefficient – the gini coefficient is
simply the concentration index that results when the variable of interest is also used to rank
order the population. While concentration indices provide a good summary of how social
expenditures and taxes are distributed across an entire country, they suffer from many of
the same problems that afflict the gini coefficient. As an aggregate measure, it is difficult to
determine how the variable of interest may be distributed at specific portions of the income
distribution. Concentration indices which have very similar scores may result from quite
different concentration curves – for example, a concentration index of zero may indicate that
the variable of interest is held equally by all members of the population (i.e. the concentration
curve will be drawn along the line of equality), or it could also mean that movement of the
concentration curve above and below the line of equality cancel out to produce the value of
zero.
Figure 4: Concentration Curve and Index
17
The concentration index that I calculate measures the degree to which preferences for
redistribution are concentrated among poorer ethnic groups. To calculate it, I first obtain
the average support for redistribution for each ethnic group in a country. Mean support for
redistribution in a group (on a scale of one to three) ranges from 1.76 (whites in the United
States) to 3.97 (indigenous population in Paraguay). Because the calculation of between
group inequality of preferences requires at least two ethnic groups, I restrict ethnically ho-
mogenous countries from the analysis. Using the formula from equation 1, and weighting
by group size from the Fearon classification system, I obtain a measure of between group
concentration of preferences. If a country’s concentration index is negative, it indicates that
poorer ethnic groups tend to have greater support for redistribution than wealthier ethnic
groups.
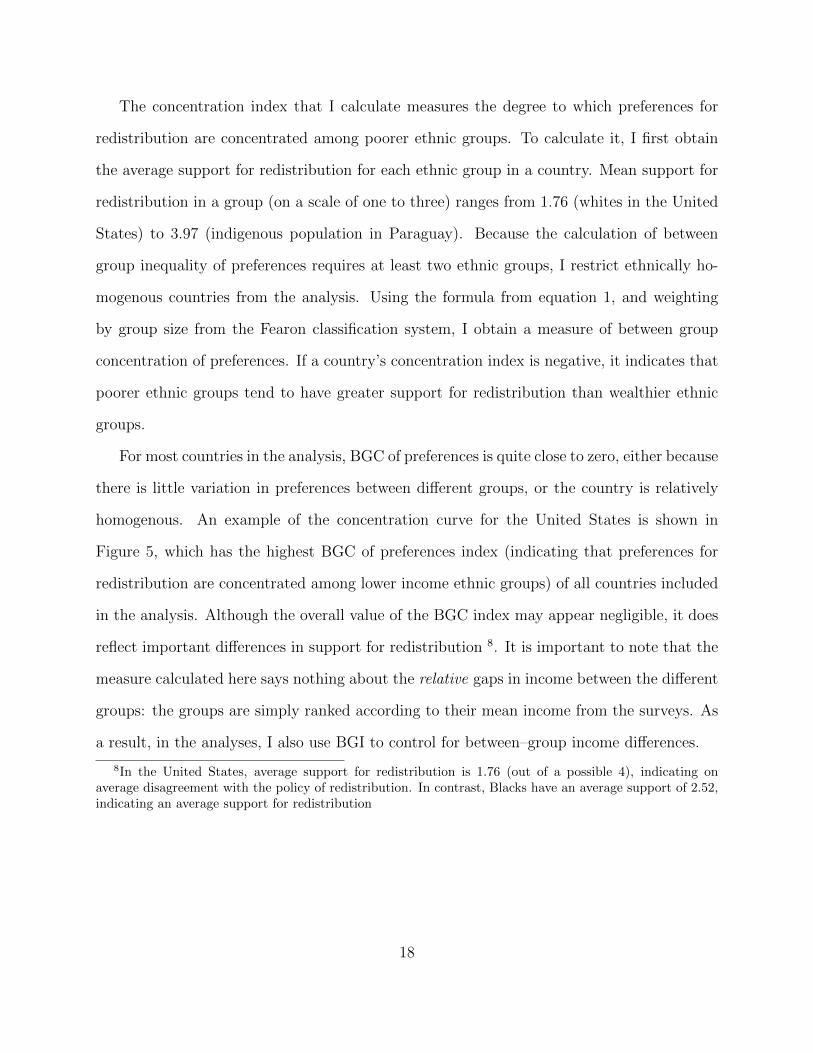
For most countries in the analysis, BGC of preferences is quite close to zero, either because
there is little variation in preferences between different groups, or the country is relatively
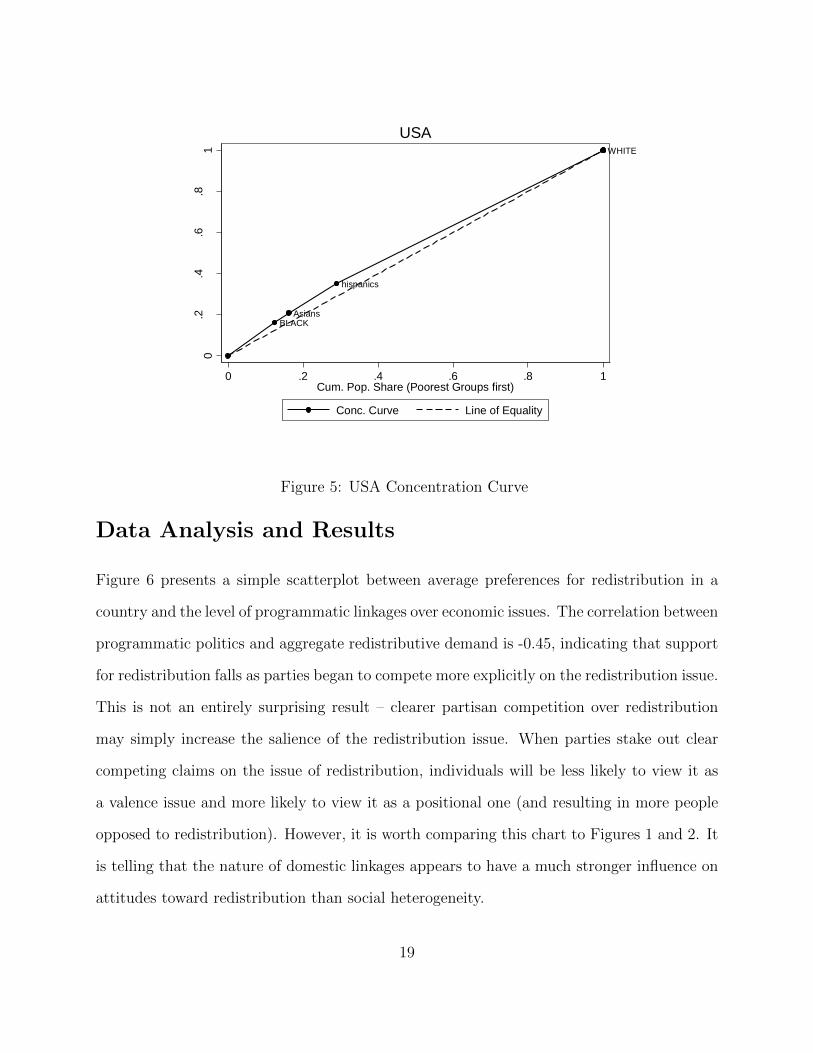
homogenous. An example of the concentration curve for the United States is shown in
Figure 5, which has the highest BGC of preferences index (indicating that preferences for
redistribution are concentrated among lower income ethnic groups) of all countries included
in the analysis. Although the overall value of the BGC index may appear negligible, it does
reflect important differences in support for redistribution 8. It is important to note that the
measure calculated here says nothing about the relative gaps in income between the different
groups: the groups are simply ranked according to their mean income from the surveys. As
a result, in the analyses, I also use BGI to control for between–group income differences.
8In the United States, average support for redistribution is 1.76 (out of a possible 4), indicating onaverage disagreement with the policy of redistribution. In contrast, Blacks have an average support of 2.52,indicating an average support for redistribution
18
BLACKAsians
hispanics
WHITE
0.2
.4.6
.81
Cu
m. P
ref. S
ha
re
0 .2 .4 .6 .8 1Cum. Pop. Share (Poorest Groups first)
Conc. Curve Line of Equality
USA
Figure 5: USA Concentration Curve
Data Analysis and Results
Figure 6 presents a simple scatterplot between average preferences for redistribution in a
country and the level of programmatic linkages over economic issues. The correlation between
programmatic politics and aggregate redistributive demand is -0.45, indicating that support
for redistribution falls as parties began to compete more explicitly on the redistribution issue.
This is not an entirely surprising result – clearer partisan competition over redistribution
may simply increase the salience of the redistribution issue. When parties stake out clear
competing claims on the issue of redistribution, individuals will be less likely to view it as
a valence issue and more likely to view it as a positional one (and resulting in more people
opposed to redistribution). However, it is worth comparing this chart to Figures 1 and 2. It
is telling that the nature of domestic linkages appears to have a much stronger influence on
attitudes toward redistribution than social heterogeneity.
19
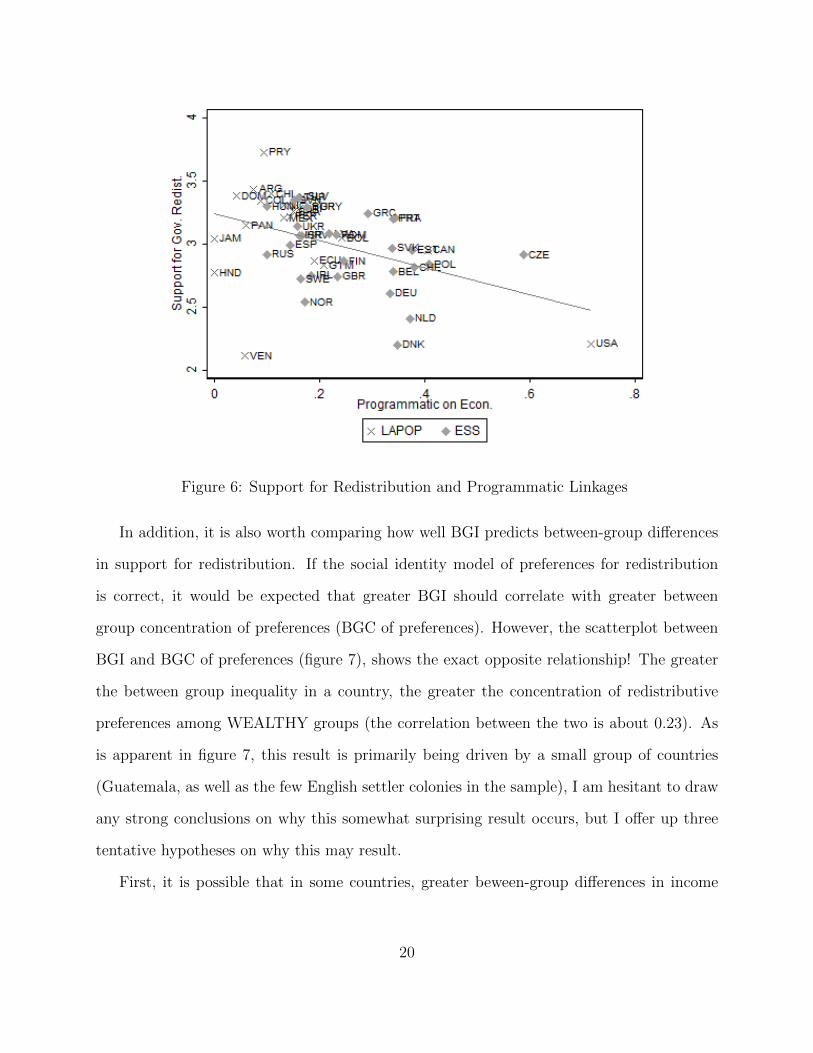
Figure 6: Support for Redistribution and Programmatic Linkages
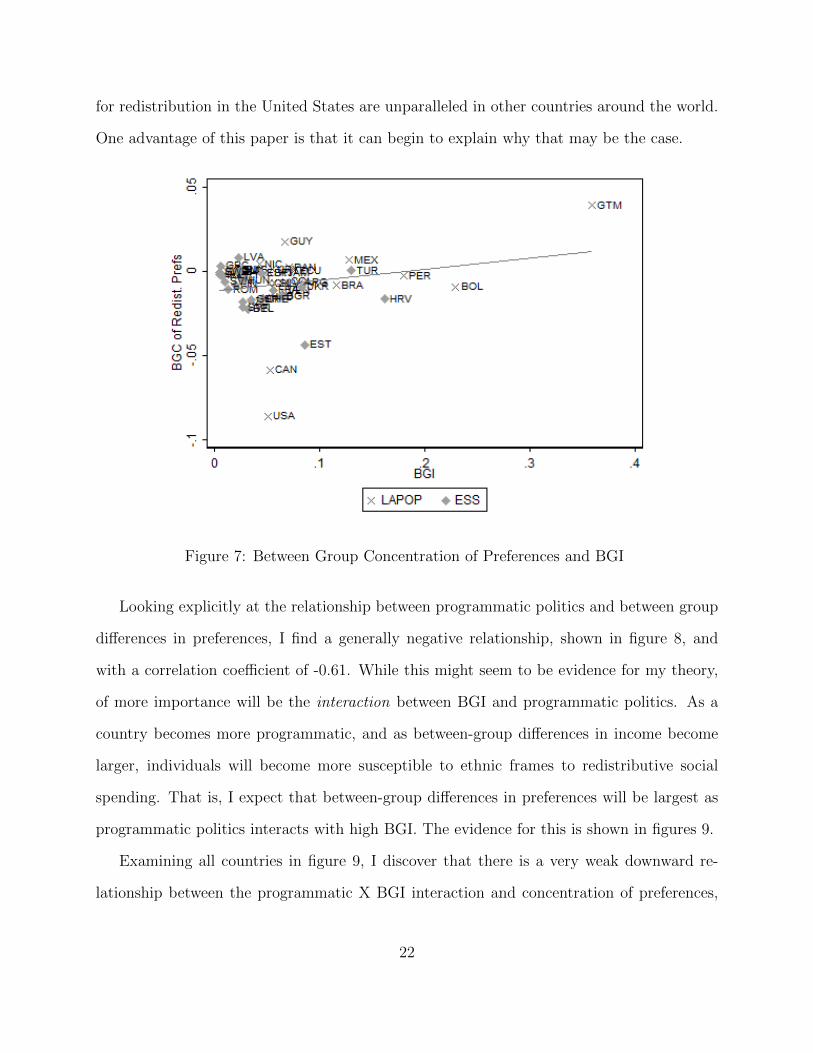
In addition, it is also worth comparing how well BGI predicts between-group differences
in support for redistribution. If the social identity model of preferences for redistribution
is correct, it would be expected that greater BGI should correlate with greater between
group concentration of preferences (BGC of preferences). However, the scatterplot between
BGI and BGC of preferences (figure 7), shows the exact opposite relationship! The greater
the between group inequality in a country, the greater the concentration of redistributive
preferences among WEALTHY groups (the correlation between the two is about 0.23). As
is apparent in figure 7, this result is primarily being driven by a small group of countries
(Guatemala, as well as the few English settler colonies in the sample), I am hesitant to draw
any strong conclusions on why this somewhat surprising result occurs, but I offer up three
tentative hypotheses on why this may result.
First, it is possible that in some countries, greater beween-group differences in income
20
are associated with many other factors that are crucial for the development of preferences
for redistribution. As a first step, individuals need to actually observe inequality and feel
that it is unjust (Sen 2000). Differences in knowledge of, or access to information about
inequality may make it so that poorer groups actually possess less knowledge of inequality.
One possible reason why countries such as Guatemala have a positive concentration of pref-
erences (indicating greater demand for redistribution among wealthier ethnic groups) is that
wealthier ethnic groups tend to be urban, where income gaps are made more stark through
the proximity of wealthy and poor and individuals possess greater information than in the
countryside (Majumdar, Mani and Mukand 2004).
A second possibility is that individuals in some ethnicities may be performing within-
group comparisons, as opposed to between-group comparisons. This possibility is suggested
in the social psychology literature on relative deprivation (Runciman 1966), where individu-
als become more likely to compare themselves with those with whom they share important
characteristics. If inequality is lower among poorer ethnic groups than in wealthier income
groups, within-group comparisons of income will likely lead to greater support for redistri-
bution among the wealthier income groups.
A final possibility is that members of wealthier ethnic groups may be weighting alter-
native aspects of redistribution beyond pocketbook or even ethnic dimensions: for example,
members of wealthy ethnic groups may be more concerned with the effect of inequality on
crime. This could potentially be of greater salience in certain countries that have had growth
in criminal activity in recent years, and may have some relevance for the somewhat puzzling
result in Guatemala.
It is also of interest to note that among the countries included in the analysis, the United
States exhibits by far the greatest divide between different ethnic groups in terms of support
for redistribution. On one hand, this may seem to support the “American Exceptionalism” of
the theory linking social identities to redistribution attitudes – the racial divides in support
21
for redistribution in the United States are unparalleled in other countries around the world.
One advantage of this paper is that it can begin to explain why that may be the case.
Figure 7: Between Group Concentration of Preferences and BGI
Looking explicitly at the relationship between programmatic politics and between group
differences in preferences, I find a generally negative relationship, shown in figure 8, and
with a correlation coefficient of -0.61. While this might seem to be evidence for my theory,
of more importance will be the interaction between BGI and programmatic politics. As a
country becomes more programmatic, and as between-group differences in income become
larger, individuals will become more susceptible to ethnic frames to redistributive social
spending. That is, I expect that between-group differences in preferences will be largest as
programmatic politics interacts with high BGI. The evidence for this is shown in figures 9.
Examining all countries in figure 9, I discover that there is a very weak downward re-
lationship between the programmatic X BGI interaction and concentration of preferences,
22
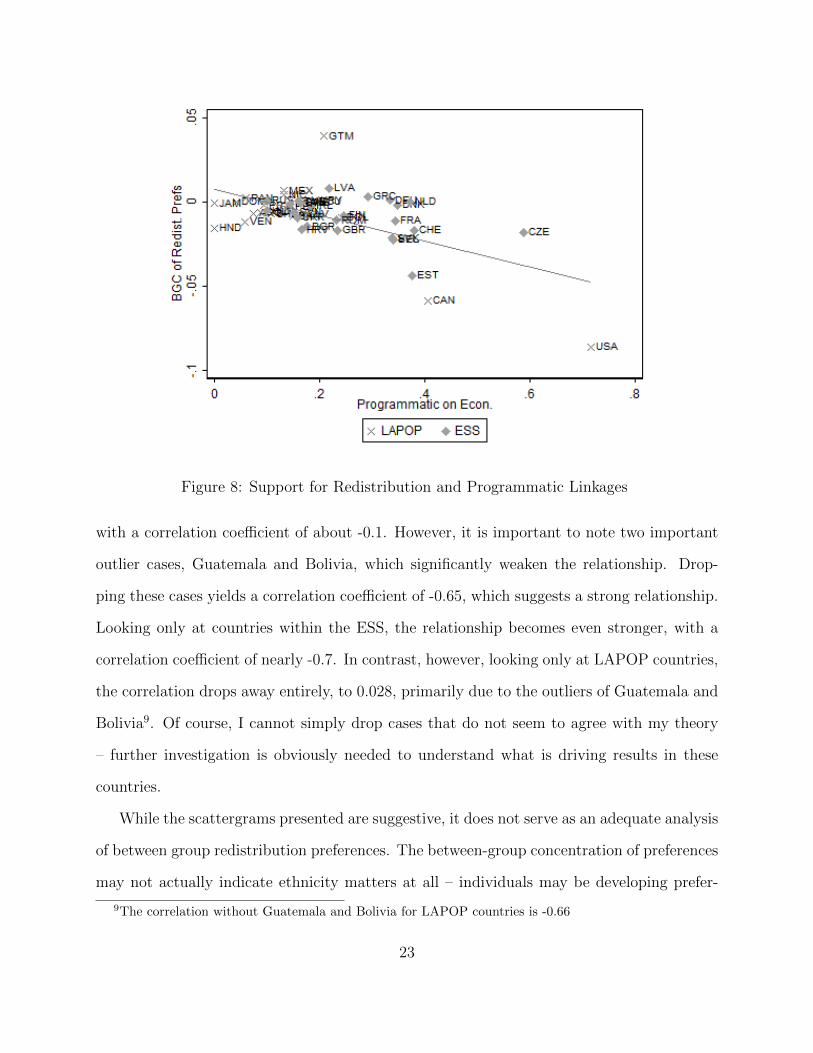
Figure 8: Support for Redistribution and Programmatic Linkages
with a correlation coefficient of about -0.1. However, it is important to note two important
outlier cases, Guatemala and Bolivia, which significantly weaken the relationship. Drop-
ping these cases yields a correlation coefficient of -0.65, which suggests a strong relationship.
Looking only at countries within the ESS, the relationship becomes even stronger, with a
correlation coefficient of nearly -0.7. In contrast, however, looking only at LAPOP countries,
the correlation drops away entirely, to 0.028, primarily due to the outliers of Guatemala and
Bolivia9. Of course, I cannot simply drop cases that do not seem to agree with my theory
– further investigation is obviously needed to understand what is driving results in these
countries.
While the scattergrams presented are suggestive, it does not serve as an adequate analysis
of between group redistribution preferences. The between-group concentration of preferences
may not actually indicate ethnicity matters at all – individuals may be developing prefer-
9The correlation without Guatemala and Bolivia for LAPOP countries is -0.66
23
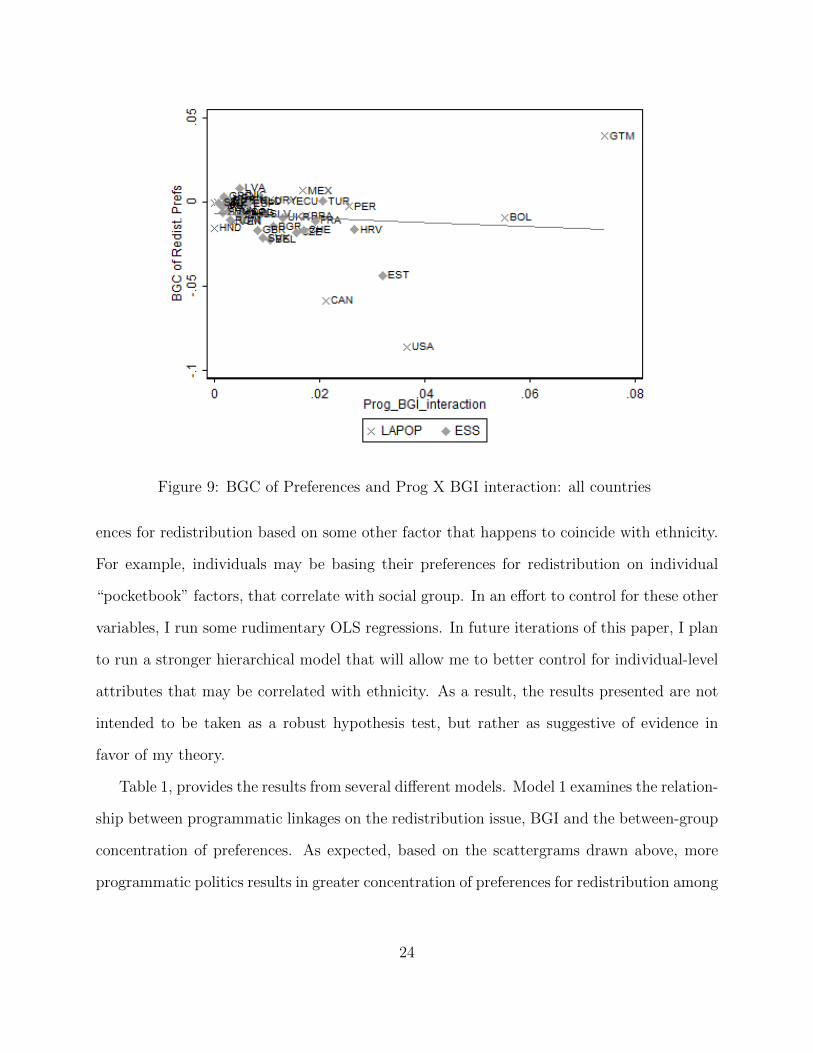
Figure 9: BGC of Preferences and Prog X BGI interaction: all countries
ences for redistribution based on some other factor that happens to coincide with ethnicity.
For example, individuals may be basing their preferences for redistribution on individual
“pocketbook” factors, that correlate with social group. In an effort to control for these other
variables, I run some rudimentary OLS regressions. In future iterations of this paper, I plan
to run a stronger hierarchical model that will allow me to better control for individual-level
attributes that may be correlated with ethnicity. As a result, the results presented are not
intended to be taken as a robust hypothesis test, but rather as suggestive of evidence in
favor of my theory.
Table 1, provides the results from several different models. Model 1 examines the relation-
ship between programmatic linkages on the redistribution issue, BGI and the between-group
concentration of preferences. As expected, based on the scattergrams drawn above, more
programmatic politics results in greater concentration of preferences for redistribution among
24
poorer ethnic groups, while BGI reduces it, although the cofficient on BGI is not significant.
In model 2, I add the interaction term between programmatic politics and BGI. As expected,
this has a negative effect, but is only marginally significant at the 0.1 level. In Models 3
and 4, I run the same regression as in model 2, but split the sample by survey, following the
results suggested by the scattergram in figure 9. Model 3 is only using LAPOP countries,
while Model 4 only takes ESS countries. As can be seen, the results match my theory much
more strongly in Model 4 (That is, the interaction term is strongly significant in the expected
direction).
I run Models 5 and 6 on all countries, adding in a handful of other control-variables.
In model 5, I add the control of GDP per capita at PPP – this measure is very highly
correlated with programmatic politics, with programmatic countries also having a higher
level of economic development and a correlation coefficient of 0.57 among the countries in this
sample. Despite this multicollinearity, the interaction term remains marginally significant
at the 0.1 level. In model 6, I add the rural proportion of the population. The reason I
chose this control is because it could potentially have some explanatory power behind the
outlier status of Guatemala and Bolivia. With an ethnic minority concentrated in rural
areas, members of that minority could be performing between–group comparisons or have
less information on inequality (that is, the gaps in income found in the urban core are much
less salient or obvious to them), that in turn results in lower demand for redistribution. Of
course, the rough aggregate measure I employ here does not get at the ethnic concentration
in rural or urban areas, and as a result it is a crude control10. The addition of this control
does not significantly adjust the primary results of the model, although it does move the
interaction term to the cusp of statistical significance at the 0.05 level.
10In future iterations of this project, I hope to include a more appropriate control developed from theLAPOP and ESS surveys themselves
25
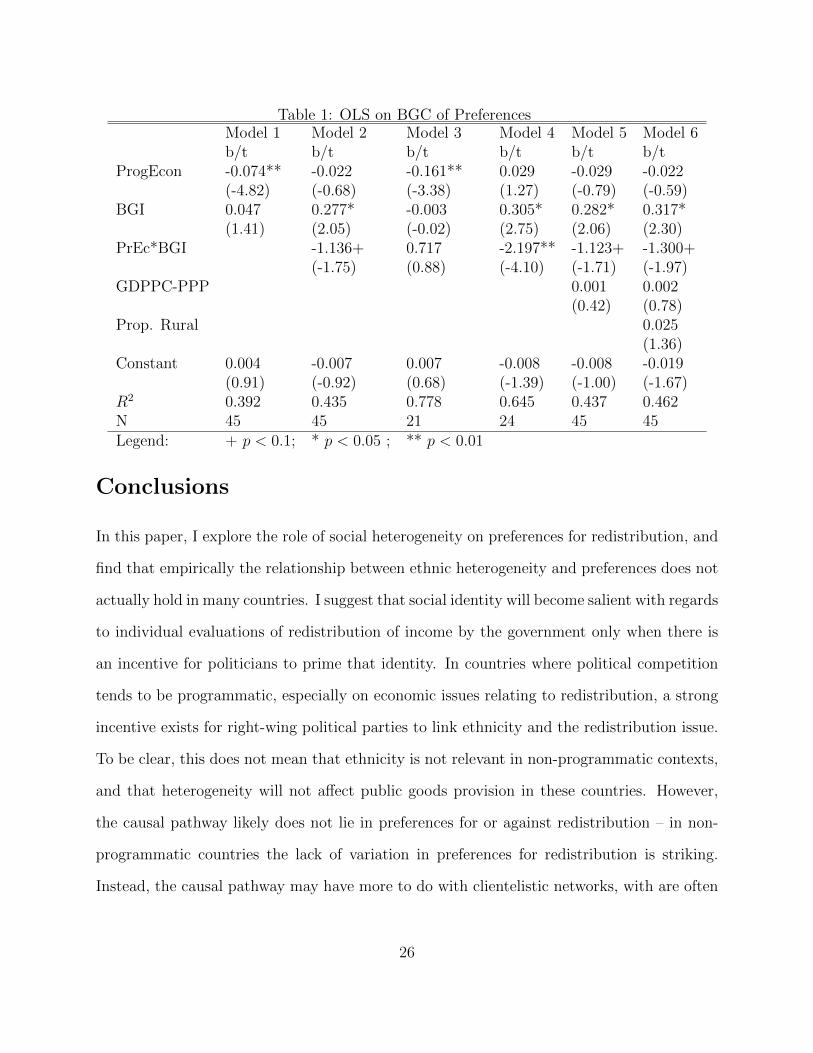
Table 1: OLS on BGC of PreferencesModel 1 Model 2 Model 3 Model 4 Model 5 Model 6b/t b/t b/t b/t b/t b/t
ProgEcon -0.074** -0.022 -0.161** 0.029 -0.029 -0.022(-4.82) (-0.68) (-3.38) (1.27) (-0.79) (-0.59)
BGI 0.047 0.277* -0.003 0.305* 0.282* 0.317*(1.41) (2.05) (-0.02) (2.75) (2.06) (2.30)
PrEc*BGI -1.136+ 0.717 -2.197** -1.123+ -1.300+(-1.75) (0.88) (-4.10) (-1.71) (-1.97)
GDPPC-PPP 0.001 0.002(0.42) (0.78)
Prop. Rural 0.025(1.36)
Constant 0.004 -0.007 0.007 -0.008 -0.008 -0.019(0.91) (-0.92) (0.68) (-1.39) (-1.00) (-1.67)
R2 0.392 0.435 0.778 0.645 0.437 0.462N 45 45 21 24 45 45Legend: + p < 0.1; * p < 0.05 ; ** p < 0.01
Conclusions
In this paper, I explore the role of social heterogeneity on preferences for redistribution, and
find that empirically the relationship between ethnic heterogeneity and preferences does not
actually hold in many countries. I suggest that social identity will become salient with regards
to individual evaluations of redistribution of income by the government only when there is
an incentive for politicians to prime that identity. In countries where political competition
tends to be programmatic, especially on economic issues relating to redistribution, a strong
incentive exists for right-wing political parties to link ethnicity and the redistribution issue.
To be clear, this does not mean that ethnicity is not relevant in non-programmatic contexts,
and that heterogeneity will not affect public goods provision in these countries. However,
the causal pathway likely does not lie in preferences for or against redistribution – in non-
programmatic countries the lack of variation in preferences for redistribution is striking.
Instead, the causal pathway may have more to do with clientelistic networks, with are often
26
assisted by ethnic groups, and will reduce public good provision.
Finally, this paper is able to extend the logic of many studies in the United States which
examine the “racialization” of welfare to other countries and regions. Although the United
States remains distinctive in this analysis, exhibiting the largest between–group differences
in support for redistribution, the comparative analysis here provides some insight into why
the United States is so distinctive. Many other countries in the analysis exhibit BGI that
is on par with (and higher) than that found in the United States, including much of Latin
America, Turkey, Estonia, Croatia and Ukraine. However, none of these countries come close
to the between–group differences in support for redistribution that are found in the United
States. The reason for “American Exceptionalism” can be seen in the contrasting nature of
democratic linkages between these other countries and the United States – the United States
has highly programmatic linkages over economic policy.
Moreover, the argument helps to explain why welfare has become “racialized” in the
United States over time. As Gilens (1999) noted, in the 1960s the face of welfare was white,
not black. Although portrayed as a backlash against the civil rights movement, another
possibility may be that the left had begun to link more successfully with the poor on the
issue of redistribution, creating clear political incentives to change the face of welfare to
become African–American. Bartels (2008) noted that “over the past half- century economic
status has become more important, not less important, in structuring the presidential voting
behavior of white Americans” (pg. 73), noting a slight rise in the number of poor whites
supporting the Democratic party (and a greater decline in wealthy whites). Although we
do not have access to the counterfactual world in which welfare was never racialized, it
seems likely that poor whites would have exhibited even greater support for the left in the
United States had the issue remained focussed entirely on the economic dimension. Instead
of a situation where poor white Americans are being enticed by alternative issue dimensions
(such as race or religious issues) away from the economic dimension (Frank 2004), it is
27

precisely because of the importance of the economic dimension that political elites have an
incentive to “racialize” welfare spending.
28
Appendix A: Description of Variables
Variable Range DescriptionSupport forRedistribu-tion
0=StronglyDisagree;1=Disagree;2=Neitheragree nordisagree;3=Agree;4=StronglyAgree
In ESS, the question wording is “The government shouldtake measures to reduce differences in income levels.” InLAPOP, the question wording is “The (Country) govern-ment should implement firm policies to reduce inequalityin income between the rich and the poor. To what extentdo you agree or disagree with this statement?”
Income Stated in-come forthe year inlocal currencyunits
LAPOP and ESS use only predetermined categories for in-come. I have recoded the respondents income to the meanof the range they selected (for example, if the respondentchooses “between 8000 and 9000 lcus a year”, they aregiven an income of 8500. Top-level incomes are coded at1.5 times the top level (so “more than 15000 lcus a year”would be coded as 22500.
Social Iden-tity
n.a. Categorization of ethnic identity using the classificationsystem outlined in Fearon (2003).
ProgrammaticLinkages onEconomicIssues
TheoreticallyPossibleRange from 0to 1; ActualRange from 0to 0.72
Multiplicative index taken from an expert survey carriedout by a research team at Duke University. Described com-pletely in Kitschelt and Freeze (2010), it measure the cohe-sion of expert scores (mean sd of expert judgments for eachparty, aggregated to national level by weighting by partysize), the polarization of party positions (sd of mean partypositions) and salience (operationalized by the proportionof valid expert responses) of three economic issue positions.
GDP percapita
n.a. At purchasing power parity in 2005 USD, taken from theWorld Bank
Rural Pro-portion ofPopulation
0-100 Percentage of the population living in rural areas (2005),from the World Bank.
29
References
Acemoglu, D. and J. Robinson. 2006. Economic Origins of Dictatorship and Democracy,
2006. Cambridge University Press.
Alesina, A. and E.L. Glaeser. 2004. Fighting poverty in the US and Europe: A world of
difference. Oxford University Press, USA.
Alesina, A., R. Baqir and W. Easterly. 1999. “Public goods and ethnic divisions.” Quarterly
Journal of Economics 114(4):1243–1284.
Baldwin, K. and J.D. Huber. 2010. “Economic versus Cultural Differences: Forms of Ethnic
Diversity and Public Goods Provision.” American Political Science Review 104(4):644–
662.
Bartels, L.M. 2008. Unequal democracy: the political economy of the new gilded age. Prince-
ton University Press.
Campbell, Angus, Philip E. Converse, Warren E. Miller and Donald E. Stokes. 1960. The
American Voter. New York: Wiley.
Chong, D. and J.N. Druckman. 2007. “Framing theory.” Annual Review of Political Science
10:103–126.
Corneo, G. and H.P. Gruner. 2002. “Individual preferences for political redistribution.”
Journal of Public Economics 83(1):83–107.
Cusack, T., T. Iversen and P. Rehm. 2006. “Risks at work: The demand and supply sides
of government redistribution.” Oxford Review of Economic Policy 22(3):365.
Dion, M.L. and V. Birchfield. 2010. “Economic Development, Income Inequality, and Pref-
erences for Redistribution1.” International Studies Quarterly 54(2):315–334.
30
Eifert, B., E. Miguel and D.N. Posner. 2010. “Political competition and ethnic identification
in Africa.” American Journal of Political Science 54(2):494–510.
Erikson, Robert S., Michael B. MacKuen and James A. Stimson. 2002. The Macro Polity.
New York: Cambridge University Press.
Fearon, J.D. 2003. “Ethnic and Cultural Diversity by Country.” Journal of Economic Growth
8(2):195–222.
Frank, Thomas. 2004. What’s the matter with Kansas?: how conservatives won the heart of
America. New York: Henry Holt and Company.
Gilens, M. 1999. Why Americans hate welfare: Race, media, and the politics of antipoverty
policy. University of Chicago Press.
Hawkins, K.A. 2009. “Is Chavez Populist?: Measuring Populist Discourse in Comparative
Perspective.” Comparative Political Studies 42(8):1040.
Hillygus, D.S. and T.G. Shields. 2008. The persuadable voter: wedge issues in presidential
campaigns. Princeton Univ Pr.
Kakwani, N., A. Wagstaff and E. Van Doorslaer. 1997. “Socioeconomic inequalities in health:
Measurement, computation, and statistical inference.” Journal of econometrics 77(1):87–
103.
Kakwani, N.C. 1977. “Measurement of tax progressivity: an international comparison.” The
Economic Journal 87(345):71–80.
Kenworthy, L. and L. McCall. 2008. “Inequality, Public Opinion and Redistribution.” Socio-
Economic Review 6(1):35.
31
Kitschelt, H. 2000. “Linkages between citizens and politicians in democratic polities.” Com-
parative Political Studies 33(6-7):845.
Kitschelt, H., K. Freeze, K. Kolev and Y.T. Wang. 2009. “Measuring Democratic Account-
ability: An initial report on an emerging data set.” revista deficiencia Politica 29(3):741–
773.
Kitschelt, H. and S. Wilkinson. 2007. Patrons, clients, and policies: patterns of democratic
accountability and political competition. Cambridge Univ Pr.
Kitschelt, Herbert and Kent Freeze. 2010. Programmatic Party System Structuration: De-
veloping and Comparing Cross-National and Cross-Party Measures with a New Global
Data Set. APSA Annual Meeting, Washington, DC.
Klor, E.F. and M. Shayo. 2010. “Social Identity and Preferences Over Redistribution.”
Journal of Public Economics 94(3-4):269–278.
Kolev, Kiril and Yiting Wang. 2010. Ethnic Group Divisions and Clientelism. APSA Annual
Meeting, Washington, DC.
Lemarchand, R. 1972. “Political clientelism and ethnicity in tropical Africa: Competing
solidarities in nation-building.” The American Political Science Review 66(1):68–90.
Lindert, P.H. 1991. Toward a Comparative History of Income and Wealth Inequality. In
Income Distribution in Historical Perspective, ed. H. Kaelble and M Thomas. Cambridge
Univ Pr pp. 212–231.
Luttmer, E.F.P. 2001. “Group loyalty and the taste for redistribution.” Journal of Political
Economy 109(3).
Majumdar, S., A. Mani and S.W. Mukand. 2004. “Politics, information and the urban bias.”
Journal of Development Economics 75(1):137–165.
32
Meltzer, A.H. and S.F. Richard. 1981. “A Rational Theory of the Size of Government.”
Journal of Political Economy 89(5):914.
Nelson, T.E. and Z.M. Oxley. 1999. “Issue framing effects on belief importance and opinion.”
The Journal of Politics 61(04):1040–1067.
Neubeck, K.J. and N.A. Cazenave. 2001. Welfare Racism: Playing the Race Card against
America’s Poor. Routledge.
O’Donnell, O., E. Van Doorsslaer, A. Wagstaff and M. Lindelow. 2008. Analyzing health
equity using household survey data: a guide to techniques and their implementation. World
Bank Publications.
Quadagno, J. 1994. The Color of Welfare: How Racism Undermined the War on Poverty.
Oxford University Press, Inc.
Romer, T. 1975. “Individual welfare, majority voting, and the properties of a linear income
tax.” Journal of Public Economics 4(2):163–185.
Runciman, W.G. 1966. Relative deprivation and social justice: A study of attitudes to social
inequality in twentieth-century England. University of California Press.
Sen, Amartya. 2000. Handbook of Income Distribution, vol. 1. Amsterdam: Elsevier Science
chapter Social Justice and the Distribution of Income, pp. 59–85.
Shayo, M. 2009. “A model of social identity with an application to political economy: Nation,
class, and redistribution.” American Political Science Review 103(02):147–174.
Sniderman, Paul and Sean Theriault. 2004. The structure of political argument and the logic
of issue framing. In Studies in public opinion: Attitudes, nonattitudes, measurement error,
and change, ed. Willem Saris an Paul Sniderman. Princeton University Press pp. 133–65.
33
Tajfel, H. and J.C. Turner. 1979. An integrative theory of intergroup conflict. In The social
psychology of intergroup relations, ed. Henri Tajfel. Brooks/Cole pp. 33–47.
Van Doorslaer, E., A. Wagstaff, H. Bleichrodt, S. Calonge, U.G. Gerdtham, M. Gerfin,
J. Geurts, L. Gross, U. Hakkinen, R.E. Leu, Owen O’Donnelll, Carole Propper, Frank
Puffer, Marisol Rodriguez, Gun Sundberg and Olaf Winkelhake. 1997. “Income-related
inequalities in health: Some international comparisons.” Journal of Health Economics
16(1):93–112.
Winter, N.J.G. 2008. Dangerous frames: How ideas about race and gender shape public
opinion. University of Chicago Press.
Zaller, J. 1992. The nature and origins of mass opinion. Cambridge University Press.
34