Embed Size (px)
Citation preview

1
Project Number: TA 6291 Final Report November 2009
Social Impact Assessment of Public Transport in Cities: An approach for people involved in the planning, design, and implementation of public transport systems Annex D: Worked Examples for the SIA Approach
Dr. Marie Thynell, University of Gothenburg, Sweden
Dr. Anvita Arora, Director & CEO, Innovative Transport Solutions (iTrans) Pvt. Ltd, TBIU, IIT, Delhi, India
Sophie Punte Executive Director, Clean Air Initiative for Asian Cities (CAI-Asia) Center
This report was prepared as part of the Sustainable Urban Mobility in Asia (SUMA) program. The SUMA program was supported by the Asian Development Bank through a grant from the Swedish International Development Cooperation Agency. SUMA was implemented by the Clean Air Initiative for Asian Cities Center (www.cleanairnet.org/caiasia), in partnership with EMBARQ – the World Resources Institute Center for Sustainable Transport (http://embarq.wri.org), GTZ Sustainable Urban Transport Project ( www.sutp.org), Interface for Cycling Expertise (www.cycling.nl), Institute for Transportation and Development Policy (www.itdp.org), and United Nations Center for Regional Development (www.uncrd.or.jp/est).
Final Consultants’ Report
2
Copyright ©2009. Thynell, M., Arora, A., Punte, S. Social Impact Assessment of Public Transport in Cities: An approach for people involved in the planning, design, and implementation of public transport systems”. ADB/CAI-Asia Center Final Consultants’ Report under TA 6291. Pasig City, Philippines. This publication may be reproduced in whole or in part in any form for educational or non-profit purposes without special permission from the copyright holder, provided acknowledgment of the source is made. The authors would appreciate receiving a copy of any publication that uses this publication as a source. No use of this publication may be made for resale or for any other commercial purpose whatsoever, without prior permission in writing from the authors. Disclaimer The views expressed in this publication are those of the authors, and do not necessarily reflect the views of the Asian Development Bank and the CAI-Asia Center. Neither the Asian Development Bank nor the CAI-Asia Center guarantees the accuracy of the information included in this publication or accept responsibility for consequence of their use.

Worked Examples for the SIA Approach of Public Transport Projects in Cities
3
INTRODUCTION
This report on social impact assessment (SIA) has been developed for practitioners involved in the planning, design and implementation of public transport systems, specifically bus rapid transit (BRT) systems, light rail, and metro. The SIA approach will help to inform policy and decision-makers on how to better integrate social considerations into public transport projects in cities, with a particular focus on cities in developing Asian countries.
The SIA approach consists of 7 steps as shown in the figure below and is based on the environmental impact assessment (EIA) process and existing SIA guidelines. This document is Annex D to the report and provides worked examples for several steps and tasks of the SIA Approach, mostly taken from Delhi Metro and Delhi Bus Rapid Transit System (BRTS). This document should be read in conjunction with the main SIA report that describes each step and task of the SIA Approach in detail. The development of the SIA Approach and the worked examples was funded by Sida and ADB through the Sustainable Urban Mobility in Asia (SUMA) program.
STEP 1: SCOPINGa) Define the public transport projectb) Identify relevant government policies and plansc) Prepare terms of reference for the SIA
STEP 2: ANALYSISa) Determine profile of key interest groupb) Identify and prioritize key social issuesc) Determine indicators for selected social issuesd) Collect data to predict the impactse) Analyze results
STEP 3: MITIGATIONa) Identify possible mitigation measuresb) Determine the feasibility of mitigation measuresc) Propose and prioritize mitigation measuresd) Propose compensation measures
STEP 4: REPORTINGa) Prepare draft report “SIA Statement”b) Review and discuss draft reportc) Prepare final draft report
STEP 5: DECISION-MAKINGa) Send final report to authorized decision-makersb) Discuss report and make amendments if neededc) Take decision and make public announcement
STEP 6: MONITORING & MANAGINGa) Implement the monitoring and management planb) Conduct an independent evaluation
STEP 7: PUBLIC CONSULTATION
a) Identify potential beneficiaries and other affected groups
b) Decide on approach for public consultation including assessment methods
c) Hold the public consultationd) Incorporate results from public
consultation in relevant SIA steps
Worked Examples for the SIA Approach of Public Transport Projects in Cities
4
Overview of Worked Examples provided for steps and tasks of the SIA Approach STEP TASK WORKED EXAMPLE Step 1. Scoping a) Define the public transport project Scope and Plan of the Delhi Metro Rail
Project b) Identify relevant government policies
and plans Policies and agencies influencing the Delhi BRT
c) Prepare terms of reference for the SIA Generic TOR for Poverty and Social Analysis by ADB
Step 2. Assessment
a) Determine profile of key interest groups
Interest groups affected by the Delhi Metro
d) Identify and prioritize key social issues The transport and urban poverty discourse b) Determine indicators for select social
issues Defining and measuring Accessibility, Mobility and Socio-economic Well being - the development of indicators
c) Collect data to predicting the impacts Survey Methodology and Design d) Analyze results Estimating the value of indicators
developed and the change for impact of metro rail
Step 3. Mitigation a) Identify possible mitigation measures b) Determine the feasibility of mitigation
measures c) Prioritize and select proposed
mitigation measures d) Propose compensation measures
Policy recommendations and mitigation measures at the Mexico Urban Transport Transformation Project
Step 4. Reporting a) Prepare draft report b) Review and discussion of the draft
report c) Prepare final draft report
Table of Contents of the SIA report of the Boggo Road Busway
Step 5. Decision-making
a) Send final report to authorized decision-makers
b) Discuss report and make amendments if needed
c) Take decisions and make public announcement
Access Audit of the Delhi BRT
Step 6. Monitoring and managing
a) Implement the monitoring and management plan
b) Conduct an Independent evaluation
Completion and Evaluation Guidelines by ADB for transport projects
Step 7. Public consultation (cutting across all other steps)
a) Identify potential beneficiaries and other affected groups
b) Decide the approach for public consultation including assessment methods
c) Hold the public consultation d) Revise the report based on feedback
received
Community Participation, Grievance Redressal Mechanism and details of Public Hearing for Pimpri Chinchwad BRT resettlement Plan, India

Worked Examples for the SIA Approach of Public Transport Projects in Cities
5
Step 1. Scoping Task a. Define the public transport project Title Scope and Plan of the Delhi Metro Rail Project Reference www.delhimetrorail.com , described in Arora and Tiwari 2007 Description The Delhi metro rail was first proposed by the Central Road Research Institute (CRRI,
1970) to meet the projected travel demand for 1981. It was incorporated by the Delhi Development Authority (DDA) in its Master plan for Delhi for 2001 (DDA, 1990) as a part of a recommended multimodal transport system for Delhi. The Urban Arts Commission suggested some modifications to the proposal of DDA and recommended for the development of the existing Ring Railway with three radial underground MRT corridors. RITES (1990) recommended for three-component system comprising of Rail corridors, Metro corridors and dedicated bus way totaling to 184.5 Km and further addition of 14 km increased to 198.5 km. The total network contains 16 sections to be implemented in phases based on passenger kilometer carried per kilometer length of each section.
Although the metro rail was conceived as a part of a multimodal transport system, for its implementation, an independent body called the Delhi Metro Rail Corporation was constituted. For the first phase, 64% of the total funds (total cost INR 1057 billion) were solicited from Japan Bank for International Corporation (JBIC) and the remainder from the Government of India (14%) and the Government of National Capital Territory of Delhi (14%); with 3% to be generated from property development. The first phase has a network of 62.1 Km and the second phase is proposed to have network of 121.11 Km in length (illustrated in figure 1). The estimated number of originating passengers per day in the year 2011 for Phase I and Phase II corridors is 2.6 million.
Figure 1: Proposed alignments for Phase I and II of the Metro Rail

Worked Examples for the SIA Approach of Public Transport Projects in Cities
Source: website http://www.mapsofindia.com/maps/delhi/delhi-metro-map.html
The first phase, completed in November 2006, covers a distance 62.16 km with 59 stations. It was constructed at a cost of INR1057 billion. It expected ridership is 1.5 million passengers per day. In July 2005, after completion of 50% of the project, the ridership was 0.37 million passengers per day. Details of the project, including the kind of facilities for commuters, are available on the DMRC website http://www.delhimetrorail.com
The first phase has three lines – the Shahadra-Rithala line, The Central Secratariat-Vishvavidyalaya line and the Indraprastha-Dwarka line. A section of the first line – the Shahadra to Tri-nagar1 (later Inderlok) corridor of the first phase, with 18 stations – has been taken as a case study (figure 2). This line cuts across varying land-uses and some important land marks in the city. Shahadra metro station is located in conjunction with an intercity railway station and is surrounded by middle and low income residential areas. This residential character continues till Shastri Park station after which the line crosses the Yamuna River and enters the main city of Delhi. The Kashmere Gate station is located in conjunction with an Interstate Bus Terminus (ISBT) and is the change station for the second metro line too. Tis Hazari station serves important landuses like the district courts, hospitals and office/commercial areas. After Pul Bangesh up to Tri nagar (Inderlok), the character of the land use is again low income residential areas.
Figure 2: Alignment of the existing metro line with case-study line
Source: http://www.delhiindia.com/wiki-Delhi_Metro
1 This part of the line was operational when the survey was conducted in 2004; the Inderlok-Rithala part of the line became operational subsequently.
Case Study Route
Elevated Route
Worked Examples for the SIA Approach of Public Transport Projects in Cities
7
Step 1. Scoping
Task b. Identify relevant government policies and plans Title Policies and agencies influencing the Delhi BRT Reference Description The BRT in Delhi is instituted, affected and controlled by a multiple agencies at the
National and City Levels. These are briefly described below: At the National Level:
The Jawaharlal Nehru Urban Renewal Mission (JNNURM) Mission Statement: The aim is to encourage reforms and fast track planned development of identified cities. Focus is to be on efficiency in urban infrastructure and service delivery mechanisms, community participation, and accountability of ULBs/ Parastatal agencies towards citizens.
Scope of the Mission: The Mission shall comprise two Sub- Missions, namely: (1) Sub-Mission for Urban Infrastructure and Governance: The main thrust of the Sub-Mission will be on infrastructure projects relating to water supply and sanitation, sewerage, solid waste management, road network, urban transport and redevelopment of old city areas with a view to upgrading infrastructure therein, shifting industrial and commercial establishments to conforming areas, etc. (2) Sub-Mission for Basic Services to the Urban Poor: The main thrust of the Sub-Mission will be on integrated development of slums through projects for providing shelter, basic services and other related civic amenities with a view to providing utilities to the urban poor.
Strategy of the Mission: The objectives of the Mission shall be met through the adoption of the following strategy:
1. Preparing City Development Plan: Every city will be expected to formulate a City Development Plan (CDP) indicating policies, programmes and strategies, and financing plans.
2. Preparing Projects: The CDP would facilitate identification of projects. The Urban Local Bodies (ULBs) / parastatal agencies will be required to prepare Detailed Project Reports (DPRs) for undertaking projects in the identified spheres.
3. Release and Leveraging of Funds: It is expected that the JNNURM assistance would serve to catalyse the flow of investment into the urban infrastructure sector across the country. Funds from the Central and State Government will flow directly to the nodal agency designated by the State, as grants-in-aid.
4. Incorporating Private Sector Efficiencies: through Public Private Partnership (PPP) arrangements.
The National Urban Transport Policy (NUTP) prioritizes investments in public transport. As per the directives of the GOI- MOUD- UT – the various proposals for urban transport being prepared under JNNURM should comply with NUTP in order to be eligible for Central Govt. funding. The focus of NUTP is on the following strategies :
Worked Examples for the SIA Approach of Public Transport Projects in Cities
8
1. Equitable allocation of road space – with people as focus 2. Priority to the use of Public Transport 3. Integrated public transport systems 4. Priority to non motorised transport 5. Promote multilevel parking complexes 6. Create public awareness
At the City Level:
Delhi City Development Plan (CDP) priorities and projects have been identified based on above guidelines of NUTP. Projects have been identified based on strategies as given below (in order of priority) 1. Provision of safe and efficient public transport system 2. Encouraging the use of non-motorised modes of passenger transport 3. Equitable use of space on road and priority to pedestrians 4. Efficient use of existing infrastructure – removal of impediments –
including enhancement of road infrastructure and provision of efficient parking facilities
5. Redevelopment of Connaught Place and Walled City as special areas 6. Development of goods and passenger terminals on the basis of
directional needs 7. Enhancement of Road Infrastructure 8. Awareness and enforcement drives The first Priority is given to Public Transport and the BRT, LRT and Metro have been budgeted as projects under it.
Master Plan for Delhi (MPD) 2021: The Delhi Development Authority (DDA) is responsible for the preparation of the Master Plan for Delhi (MPD) and the MPD2021 identifies corridor of Public transport for Delhi Metro and BRT and proposes land-use development in the city.
Multiple Land Owning Agencies: Land in the City is owned by Municipal Corporation of Delhi (MCD), Public Works Department (PWD), New Delhi Municipal Corporation (NDMC), and the Cantonment Board. Both BRT and Metro lines pass through different areas so coordination with all is important.
Competitive Transport Systems: The Delhi Metro Rail is built and operated
by Delhi Metro Rail Corporation (DMRC) which has part stake of National Government and Government of Delhi. The Delhi BRT is operated by Delhi Integrated Mass Transit System (DIMTS); but the buses belong to the Delhi Transport Corporation (DTC). This creates system problems.
Other Infrastructure/agencies on road: Both Delhi Metro and Delhi BRT have
to coordinate with agencies like the BSES (electricity), MCD (sewerage, drainage, water supply), Delhi Traffic Police. Several conflicts come to fore with the multiplicity of agencies and sometimes the compromises made affect the users adversely. For example, The Delhi BRT system design had no free vehicular left turns (turning only on signals) to allow pedestrians to cross safely. However, the Delhi Traffic Police was against that as they felt it would reduce the vehicular throughput at junctions. So the safety of pedestrians was compromised to make car movement efficient.
Worked Examples for the SIA Approach of Public Transport Projects in Cities
9
Step 1. Scoping
Task c. Prepare terms of reference for the SIA Title Generic TOR for Poverty and Social Analysis by ADB Reference http://www.adb.org/Documents/Handbooks/social-
analysis/Appendixes.pdf#page=11 Description The consultant (e.g., social development specialist) will have a postgraduate degree in
relevant social science discipline. He or she will act as a principal adviser to the government and A DB team on social issues in the proposed project and will ensure that the policies/investments being developed for the project are socially inclusive, equitable, and sustainable; and consistent with relevant A DB policies and strategies. He or she will have work experience in the developing member country (DMC) and at least 10 years experience in designing and/or implementing social components of development projects, preferably with work experience in the sector concerned. Appropriate local language skills are desirable. Specifically, the consultant will:
(i) conduct poverty and social impact assessments of the proposed project in accordance with ADB’s Poverty Handbook (2006) and Handbook on Social Analysis (2007).
(ii) identify how the proposed project relates to national priorities as identified in the national poverty reduction strategy [or other national development plan], A DB’s country poverty analysis, and sectors identified as priorities in ADB’s CPS;
(iii) conduct an assessment of whether the benefits of the project will flow primarily to poor/ nonpoor consumers and whether any poor or vulnerable groups will be excluded;
(iv) provide recommendation on how to make the project design more pro-poor, socially inclusive and sustainable, and to deal effectively with significant issues related to participation, gender, involuntary resettlement, indigenous or vulnerable people, labor, affordability, HIV/AIDS transmission or human trafficking, or other social risks, including the need to prepare any action or mitigation plans or other measures;
(v) assist the team leader to (a) identify key stakeholders (including both men and women within poor and vulnerable groups) and their project-related interests, (b) identify possible barriers to their participation in and benefit from the project, and (c) suggest possible strategies to address the concerns of these stakeholders. Help the team leader to identify factors affecting project risks and viability.
(vi) propose measures to ensure that the project is in compliance with national labor laws (e.g., minimum wage, equal pay, safe working conditions, social security contributions) and international core labor standards (including freedom of association, nondiscrimination and equal pay, and prohibitions of forced and child labor);
(vii) identify any other potential social risks associated with the project, such as risks of increased HIV/AIDS transmission or human trafficking in some project components, and prepare appropriate mitigation plans or other measures during implementation phase;
(viii) provide assistance to the team leader in preparing the poverty and social analysis report, preliminary design and monitoring framework for the project, memorandum of understanding (or aide memoire) of the mission, and any other documentation related to the mission; and
(ix) in coordination with other team members as required, assist in determining benefit streams for economic evaluations of subprojects–both qualitative and
Worked Examples for the SIA Approach of Public Transport Projects in Cities
10
quantitative.
The consultant will produce:
(i) social analysis appendix for the project preparatory technical assistance main report covering demographic, economic and socioeconomic conditions and trends; and identifying the extent, dimensions, trends of poverty in the project area, and relevance of these issues to the project design;
(ii) summary of poverty reduction and social strategy (SPRSS ) as a core appendix for RR P and any action or mitigation plans or other measures as appropriate, in accordance with the Handbook on Social Analysis (2007); and
(iii) TOR s for social and/or poverty analysis for the project implementation, focusing on relevant issues such as participation, gender, labor, affordability, and other social risks identified through the first poverty and social analysis.
Remarks
Worked Examples for the SIA Approach of Public Transport Projects in Cities
11
Step 2. Assessment
Task a. Determine profile of key interest groups Title Interest groups affected by the Delhi Metro Reference Arora A. and Tiwari G., 2007 Description For the specific case of the Delhi Metro the following target groups were identified:
Poor Households affected by the Metro line: To study the impact of a new transport project on the urban poor, the Delhi Metro Rail has been taken up as a case study. The urban poor are, for the purpose of this study, were people living in low-income settlements in Delhi. To study the impact of Delhi Metro rail on low-incomes two categories of low-income households have been considered – those living in the vicinity (within 1 km) of the metro stations, and those relocated due to the construction of the metro. The elements of profiling the target group are illustrated by the attached questionnaires. The interest of the SEIA study is to understand the change in the profiles after the introduction of the metro and questions are framed accordingly (refer appendix).
Users and Non-users of the Metro system: Since the Metro is an urban transport project, the people who use it are also an interest group, as are the people who did not make the shift from the bus to metro on parallel routes. The elements of profiling the target group are illustrated by the attached questionnaires. The objective of the study was to understand difference in the profile of the metro users and the bus users and questions are framed accordingly (refer appendix).
People around the stations: Since the metro station is in an urban space, there is an impact on the people around the stations. An observation of the activities also profiles the interest groups of hawkers, rickshaw pullers, auto-rickshaw drivers etc in that area. The observation based study in this case highlighted the following things:
o The frequency of trains is high and travel time of journeys is low. Fare is higher than the parallel bus services
o The passenger services and information systems inside the stations are good with provisions for the disabled
o Informal commerce like hawkers are excluded from the system by design and enforcement, though formal kiosks and other commerce is designed with the system
o Paratransit services are integrated by design in the form of auto-rickshaw stands and cycle-rickshaw stands but cycle-rickshaws are not allowed to stand near the stations.
o Bus-stops in the vicinity of metro stations have been demolished but buses still stop there creating chaos
o Even though the line connects interstate transport like the Shahadra Rail terminal and the Interstate Bus Terminus, Kashmere gate, persons carrying luggage are explicitly banned from using the system.
Worked Examples for the SIA Approach of Public Transport Projects in Cities
12
Step 2. Assessment
Task b. Identify and prioritize key social issues Title The transport and urban poverty discourse Reference Arora A., 2007, Socio-Economic Impact Assessment (SEIA) Methodology For Urban
Transport Projects:Impact Of Delhi Metro On The Urban Poor, Unpublished PhD dissertation,Department of Civil Engineering, Indian Institute of Technology, Delhi
Description Transport policies and projects have implicit or explicit agendas of improving quality of life, especially of the poor. However understanding the linkage between transport and poverty is a complex issue due to several reasons.
1. The conceptualization of poverty is difficult.
a. For ease of reference and coherence in global assessments, development agencies often employ quantitative measures of poverty, such as those setting a threshold of one or two dollars a day.
b. Specific indicators relating to certain economic and social factors (such as infant mortality and literacy rates) are also employed. But many aspects of poverty, some of which are crucial to a human rights analysis, are not reflected in the statistical indicators.
c. Poverty is a multidimensional phenomenon, encompassing inability to satisfy basic needs, lack of control over resources, lack of education and skill, poor health, malnutrition, lack of shelter, poor access to water and sanitation, vulnerability to trauma.
d. Economic deprivation – lack of income – is a standard feature of most definitions of poverty. But this in itself does not take account of the myriad of social, cultural and political aspects of the phenomenon. Poverty is not only deprivation of economic or material resources but a violation of human dignity too.
2. The second concern is that tracing the poverty impacts of transport interventions is complex because transport is an intermediate service – transport improvements reduce poverty not through increased consumption of transport per se but through improving the quality and security of access to work, markets, and services, and through release of scarce resources for consumption and production. Development activities in other sectors can increase demands on the transport infrastructure. Conversely, improved transport infrastructure can facilitate development in other sectors too. For example, well-staffed health clinics have little impact on poor people who cannot get to the clinics and vice versa. Due to this interrelationship however, isolating the impact of improved transport infrastructure from the other development activities in the region becomes a complicated task.
The Transport and Poverty Discourse
Decisions on transport investment can easily overlook needs and concerns of poor groups especially in low income countries, where the resources are limited and there are several competing projects in both the physical and social infrastructure sectors that make decisions of resource allocation difficult. For example, the costs imposed on non-motorized transport, such as pedestrians falling victim to motor vehicle traffic accidents are overlooked in the cost-benefit estimation of increasing speeds or

Worked Examples for the SIA Approach of Public Transport Projects in Cities
13
capacities of roads. Experience demonstrates that broad-based participation by affected groups/stakeholders in decision-making can ensure that the benefits of transport improvements reach poor people. Empowerment of local communities,
through consultation, participation, and ownership of local infrastructure, is also crucial for the social and financial sustainability of transport improvements (Gannon, et al, 2001).
1. The Efficiency vs Equity debate
Good transport policy contributes to poverty reduction by enhancing efficiency and equity (Gannon, et al, 2001). Every policy intervention has both efficiency and distributional impacts. In that sense the two are not separable. Nonetheless, many governments take some actions in the transport sector primarily for efficiency reasons (major infrastructure investments, service deregulation) and some primarily for equity reasons (fare controls, subsidy of unprofitable services). While equity in general is good for efficiency, some equity oriented transport interventions have adverse consequences on efficiency (deficit financing arrangements).
Transport policy must therefore explicitly address the distributional effects of efficiency interventions, and vice versa. Transport policies and strategies need to pursue a combination of interventions to meet national poverty reduction goals. For example, facilitating bicycle transport in urban areas is a pro-poor, cost-effective and environmentally sound intervention. Improving the management of road agencies and putting maintenance financing on a sustainable basis is sound business and holds enormous benefits for poor people both in terms of improved access and employment opportunities. Reforming loss-making transport agencies and providing more reliable services benefit those who rely on public transport. Interventions that are primarily oriented towards efficiency should address equity issues, and interventions that are targeted at poor people should be done in an efficient way (be guided by “least-cost”).
Economic efficiency is important because many transport investments involve large capital investment. At the same time, sound management of transport assets (for example, ensuring roads, bridges and tracks are maintained in good condition) is generally more important than new investment, and hence a crucial element of this principle. The same applies to non-physical interventions, such as regulatory reform and private sector participation, which facilitate low cost services and use of non-motorized transport (NMT).
But a narrow economic efficiency focus helps the rich more than the poor (and may actually harm people living in poverty). For example, an efficiency-focus leads to a bias towards “strategic” infrastructure, higher-speed, longer-distance links and projects that “save time” for motor vehicle users. This is at the expense of pedestrian and non-motorized vehicle (NMV) facilities. Enhancements and projects that enhance local, low-speed accessibility have a much greater direct positive impact upon the lives of the poor (Dimitriou, 1993). This bias is partly because of inherent anti-poor features of standard project assessment techniques and because of distorted pricing regimes which often feature indirect or hidden subsidies that favor the private motorized modes of transport that are used most intensively by the highest income groups. There has been a long and concerted attack on narrow economic approaches in the development literature. For example, the United Nations Development Program (UNDP) has concluded that the relationships between development and economic growth are highly indirect. As UNDP (2007) states, “the real challenge is
Worked Examples for the SIA Approach of Public Transport Projects in Cities
14
how to transform economic growth into human development. The key issue is the nature of growth and the redistributive mechanism associated to make that the increase in income is transformed into increased prosperity for everybody in society.” All of these arguments point to the need for a much greater emphasis on the basic access and mobility needs and travel patterns of the poor themselves.
2. Access and Livelihood needs of the urban poor
Improvements in transport infrastructure may accrue different level of benefits to different sections of society and it is their socio-economic status that defines the absorptive capacity of a people; i.e. the ability to benefit from a development project. However, the need assessment of various socio-economic groups, especially the poor, is a difficult task. To determine how the transport sector can best help reduce poverty, one must first understand the basic needs of poor people and the extent to which transport is required to meet those needs. This is not an easy task – poor people are themselves a diverse group within a country, even within a community, and their specific needs vary substantially. Knowledge of the transport conditions poor people confront, and how these conditions interact with other factors (for example, residential location and income earning prospects of poor people), is typically modest, especially for urban areas. So too is an understanding of how poor people perceive their transport problems.
Urban transport interacts with employment issues for the poor in two main ways: indirectly by providing access to employment opportunities and directly through employment of low-income people in the transport sector. The relative immobility of the urban poor, especially poor women is a central fact in their lives and severely limits their employment options. It has already been mentioned above that the poor must trade-off the time and cost required to access livelihood opportunities against security and quality of housing.
Employment in the transport sector for the poor can be in both transport infrastructure construction and in transport services. There is now widespread recognition of the benefits for employment of the poor of the promotion of labour-intensive techniques for transport infrastructure building and this could be pursued to a greater extent in urban areas than it has so far (Gannon et al, 1997). According to Gallagher (1992), informal sector transport services, such as jitneys, pedicabs and cycle rickshaws (and associated industries), employ especially large numbers of low-income people in certain Asian cities, particularly in South Asia. Policies regarding these modes thus have an impact on the poor as customers, as operators and as employees. The issues involved may be complex. There has been a great deal of debate over what policies should be adopted towards the various ‘non-corporate’ transport modes, such as jitneys and pedicabs. However, focusing on poverty issues, it is widely agreed that reducing barriers to the informal supply of both passenger and goods transport will be a ‘pro-poor’ policy (Gannon et al, 1997; UNDP 1998).
3. The Gender Bias
Understanding of gender issues in the transport context is of vital relevance, since women are estimated to account for 70% of those living in poverty worldwide (UNDP, 1995). The growing literature on women and transport has also clearly shown that they tend to have different travel needs deriving from the multiple tasks they must perform in their households and in their communities (Greico et al, 1997). Low-income women tend also to be less mobile than men in the same socio-economic

Worked Examples for the SIA Approach of Public Transport Projects in Cities
15
groups. They are more dependent on walking and tend to have less access to any bicycles or motorcycles in a household. Social restrictions hinder women’s mobility in many cultures (Gopalan, 1998). Efforts to increase the mobility of poor women may face stiff resistance from those who feel threatened or offended by such direct empowerment of women (UNDP 1998). Sexual harassment on streets and on public transport is also an issue. Since many more women than men are the care-givers of frail-elderly people, people with disabilities and of children, the transport problems of these disadvantaged groups also impact disproportionately on women. Poverty, of course, compounds each of these disadvantages.
To adequately integrate gender analysis into sector programmes one must consider both the implications of sector policies for men and women but it is also the implications of gender relations for sector level analysis and policy options. Rather than looking at women solely as targets or sector beneficiaries, it is important to examine the ways in which gender relations, gendered norms, and gender imbalances affect the performance, priorities and impacts of the transport sector. This involves recognizing that the transport needs of men and women can be different; that men and women have different capabilities to participate in the design and delivery of services; and that the institutions which design, deliver and evaluate sector programs operate according to rules and norms which are gendered, that is they normally function in ways which prioritize men’s needs and viewpoints over those of women. Looking at a sector as a gendered structure highlights the ways in which seemingly “gender neutral” institutions may in fact be gender-biased and may unwittingly overburden the economy of social reproduction. The negative feedbacks to social reproduction can have negative implications for the commercially oriented market economy and, ultimately, undermine the overall effectiveness of sectoral investment. This analysis is developed with an examination of the macro, meso and micro dimensions of the sector (Elson et al 1999).
Gender bias can result when there is a failure to recognize that the same service delivers different benefits to men and women. For example, the poorest households are often located on the edges of urban centers where public transport services are infrequent. In Delhi, for example, the relocation of squatter communities to the outer periphery of the city has been especially damaging to women’s ability to earn a living. Female unemployment in the new squatter camps rose by 27% compared to 5% for men (Moser et al, 1987, cited in Alling et al 1997).
The household is treated as an undifferentiated unit, despite evidence of significant gender-based differences in control over income, command over resources and patterns of expenditure (Alderman, et al, 1995) where it has been shown that women are more likely than men to devote extra resources to the improvement of family welfare (Dwyer and Bruce, 1988).
Transport pricing strategies, which are based on total household income, fail to recognize that women and men within the same household do not have the same access to household income and women may spend a larger proportion of their discretionary income on transport than men. Hence strategies which fail to recognize gender differences within the household may lead to unexpected outcomes (Alling et al 1997). Cutting expenditure, and implementing user charges, on transport and social sector programs often means that women don’t have access to transport services, either because they can’t afford them, or they are not available. Yet they must continue to provide care in the household to maintain the health nutrition and
Worked Examples for the SIA Approach of Public Transport Projects in Cities
16
education levels of their children. The invisible costs of transport sector reform could be measured if a wider range of indicators were used which include the increased pressure on women’s and girl’s time in the household.
Household surveys might attempt to estimate time spent by men and women in different reproductive2 activities; the number of households with school age children, disaggregated by gender, working in the home. Within the family, men and women co-exist in a mixture of conflicting and shared interests, and decisions are made as a consequence of intra-household bargaining. It is important not to assume that everyone’s view can be included in consultations with the head of a unit, or only the male members (Elson 1999).
Different work schedules of men and women are linked to their different responsibilities in the productive and reproductive economies. Because transport design and delivery fails to recognize reproductive work, it is assumed demand for transport revolves around the working day of men (who do not have to integrate the needs of the household into their working day in the same way that women do). Transport schedules of women are often more complex than those of men. Women often make shorter journeys, with multiple stops (Greico at al, 1997), so timing is crucial. As a consequence the scheduling of transport services is not suited to the travel patterns of women, who often make journeys at off-peak times, often with multiple purposes (dropping or collecting children from school on the way to work, for example). Women spend more time traveling because they combine reproductive and productive responsibilities in the way they organize their day.
4. Health Impacts of Transport
Environmental protection is an essential part of the task of improving the quality of life of all people, including poor groups. But there are sometimes tensions between poverty reduction, transport and environmental objectives, which must be recognized and addressed. Enforcing higher vehicle standards (such as Euro 2 engine requirements in Delhi) may be ineffective because of the absence of the technical capability of maintaining the more sophisticated electronics of the modern engine. And even when the vehicles can be maintained, their extra sophistication increases costs and fares.
Current transport policies are the key determinant of the global burden of disease (WHO, 2002, cited in Dora 2007). According to Dora (2007, pg 2), “road accidents cause 1.2 million deaths worldwide and urban air pollution is estimated to cause around 800 thousand deaths in urban areas every year (65% of which are in Asia). Transport is also the root cause of physical inactivity, which causes 1.9 million deaths every year, of noise pollution, of climate change and psycho-social wellbeing.”
a) Air Pollution
2 The productive sphere of activities refers to the production of goods and services for consumption and trade. This work is visible and economically valued although work carried out by women even in the productive sphere is often undervalued relative to men’s work. Reproductive work encompasses all activities that maintain and care for the household and its members. The nature, intensity and scope of women’s reproductive work are rarely taken into consideration, are not reflected in official data and remain unpaid work (Amgalan and Oyunchimeg, 2003).

Worked Examples for the SIA Approach of Public Transport Projects in Cities
17
Dense Asian cities of all levels of income tend to have rather low use of energy per capita in transport and the related parameter of CO2 emissions per capita from transport (Kenworthy, et al, 1997). They, however, face severe problems with local air pollution and other local impacts of traffic (greater than those in most American or European cities). This is despite rather low levels of motorization and vehicle use per person in Asian cities. These local impacts effect the urban poor particularly severely, since they are the least able to avoid or seek protection from them (UNDP 1998). These impacts are unambiguously perpetrated upon the poor primarily by the actions of higher income groups.
b) Noise pollution
According to WHO, 2007, “road traffic is the main source of exposure to noise. About 65% of the European population (450 million) is exposed to noise levels exceeding 55 dB(A) Leq over 24 hours. Children chronically exposed to loud noise show impairments in the acquisition of reading skills, attention and problem-solving ability”.
According to Nirjar et al (2003), more than 55% of the total noise in our environment is due to vehicular noise. The noise levels are showing an alarming rise and in fact the levels exceed the prescribed levels in most of the areas.
c) Road Safety
Road accidents disproportionately affect poor groups. In developing countries, where many people do not have access to motorized vehicles, more than 50 percent of road accident victims (injuries and fatalities) are pedestrians, motorcyclists, bicyclists and other non-motorized vehicles (NMV) occupants. Hence, poor people are among the most vulnerable road users. They have no choice but to rely on the type of motorized transport services they can afford. These are usually old, ill maintained vehicles and poor people are crammed onto the beds of trucks and pick-ups.
Often without insurance, poor households disproportionately suffer economically from traffic accidents. In addition, the transport services which poor people use are often underinsured if insured at all. This is one important cause of the human tragedy in which traffic accidents result. A non-poor family can become poor almost overnight if the breadwinner is killed or disabled. The situation can be even worse for a poor household. Survivors of traffic accidents frequently suffer physical and/or psychological damage that remains with them for the rest of their lives.
It is important that measures that are supposed to improve the safety of vulnerable road users do not unduly restrict their mobility or discourage walking or cycling (Adams, 1985, cited in Barter 1999). The over-use of pedestrian bridges and tunnels in Asian cities is an example. These so-called “pedestrian facilities” speed up motorized traffic but they make life much more difficult for pedestrians and curtail the mobility of people with disabilities, non-motorized vehicles and hand-carts. They also often actually increase the risk of accidents since in most cases many pedestrians will continue to cross at road level.
d) Security and Crime
Transport issues overlap with urban safety and crime prevention also in several
Worked Examples for the SIA Approach of Public Transport Projects in Cities
18
ways. Bicycle theft is barrier to cycling by the poor who fear the loss of what is to them a very valuable asset (Barter 1998). Lack of effective enforcement of road rules designed to protect vulnerable road users’ leads to aggressive driving that is a form of violence directed primarily against the poor. Crime and harassment on public transport vehicles, and while waiting for public transport, is a problem in many cities, especially for women, to the extent of preventing them from using buses in some cases. Poor street lighting effects low-income areas more than higher income areas and contributes to poor road safety as well as curtailing the after-dark movements of many people (especially women) for fear of crime. Heavy traffic on a street can cause it to become desolate and devoid of pedestrians or of informal surveillance, increasing the risk and fear of crime. Inappropriate pedestrian facilities, such as desolate pedestrian tunnels or overhead bridges, can become havens for attackers. Conversely, an obsession with security against crime can create an urban environment full of fences and walls which make for long circuitous routes for pedestrians (for example, when they are forced to walk around a long perimeter to reach the single security-gated entrance of a condominium or office complex).
5. The Shelter-transport-livelihood link
The intimate interconnections between urban transport and land-use patterns are well-known though there has been surprisingly little analysis of the connections with poverty (which are somewhat complex). Common features of the land-use patterns of large low-income cities in Asia include: high urban densities (usually well above 150 persons per hectare) despite a generally low-rise built fabric; intense mixing of different land uses at a fine scale, especially in inner areas; low-income settlements interspersed or mixed with other land-uses throughout the urban area; a high proportion of jobs (in both secondary and tertiary sectors) located in the central and inner areas of the city; however, within this inner area jobs are often relatively dispersed with no intense concentrations of employment (Barter, 1998).
Such land-use features developed in response to the requirements of transport systems dominated by non-motorized transport, buses, and jitneys. They also developed in ways that tended to minimize the need for expensive motorized travel. For example, high densities and intense mixing of land uses allow for many daily trips to be very short and thus able to be made by foot or by non-motorized vehicle. Once a city grows too large to be served primarily by non-motorized transport, a relatively centralized pattern of employment maintains a potential to support plentiful bus and jitney service (although for various reasons this potential is not always realized). Although there are some problems associated with high levels of crowding, such an urban form is apparently in many ways intrinsically pro-poor, in the absence of significant numbers of private cars.
However, a number of trends associated with motorization (and other factors) have begun to undermine the pro-poor features of many large Asian cities (and have created other transport-related problems). As upper and middle-income earners have acquired private vehicles, real estate developers increasingly locate new developments to be easily accessible by private vehicle, even if this leaves them inaccessible by public transport and non-motorized transport. To the extent that high-speed, high-capacity roads have been built, they have tended to encourage haphazard development in long corridors, resulting in longer trip distances for residents of such areas. Although Asian cites have spread out to some extent as they
Worked Examples for the SIA Approach of Public Transport Projects in Cities
19
have motorized, this is a slow process and most still retain high urban densities, especially in their inner areas. High-density cities are unsuited to high rates of private car use and inevitably have low levels of road capacity. Congestion has therefore become serious even at low levels of motorization. The rise of private vehicular traffic has decreased bus speeds and service levels drastically and made non-motorized transport dangerous and difficult. Travel for the poor has thus become slower and more difficult even as other economic and planning forces have caused many of them to be displaced from central informal settlements to more peripheral locations (Immers et al, 1993)
Many economic development programs completely miss the link between housing location, livelihoods of the poor and transport. Access to affordable transport is one of the most important factors in determining livelihoods for the urban poor. A survey by SPARC in central Bombay of pavement dwellers showed that 80% walked to work. Their choice came down to: “they were willing to live in congested dwellings without safety or security just so they could walk to work” (Gopalan, 1998). Other studies have found similarly very limited mobility by the urban poor. Some of the urban poor have to make a different trade-off by accepting long travel distances from a peripheral location in order to obtain affordable but secure housing. For some this trade-off is forced on them, since in many cases relocation sites (after evictions) are often in remote locations that take little or no account of access issues (Fernandes, 1998).
Clearly, expanding the level of mobility that is affordable to the urban poor would expand their range of shelter options. A general increase in mobility allows a city to spread out, which can potentially allow a drop in housing prices and which may therefore also benefit the urban poor. However, it was seen above that an increase in the motorized mobility of higher-income groups can actually decrease accessibility by the poor by undermining non-motorized and public transport and by dispersing their destinations. This suggests that if attempts to achieve greater mobility in low-income cities are to help the poor then they must not focus on private vehicles. In fact, they must actively restrain private vehicle use.
There are additional connections between transport and shelter issues. Unrealistically high standards and requirements for transport infrastructure in new developments (such as minimum road width standards and minimum parking supply requirements) significantly raise the cost, taking them beyond the reach of the poor.
Toleration of a vibrant informal sector also reduces the need to travel in many Asian cities by allowing many goods to be sold by mobile vendors, thus reducing the need for household shopping trips. Vendors who use non-motorized vehicles are often themselves poor and will be directly benefited by improvements to the street environment for NMVs.
Finally, transport projects themselves have become an important cause of relocations. Transport is the largest cause of resettlement in the World Bank’s portfolio of projects. Transport-related resettlements and evictions affect the poor in disproportionate numbers because low-income settlements naturally tend to be identified as low-cost, “easily cleared” alignments for new transport routes (Gannon et al, 1997; UNDP, 1998).
Worked Examples for the SIA Approach of Public Transport Projects in Cities
20
Step 2. Assessment
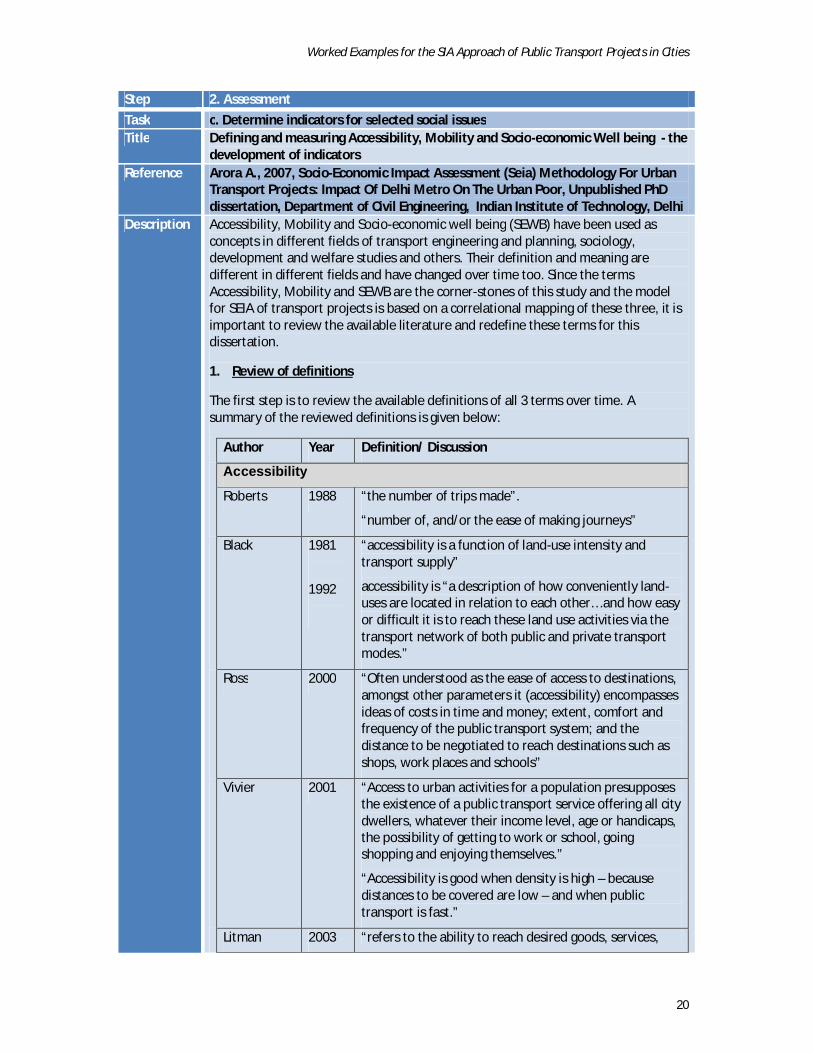
Task c. Determine indicators for selected social issues Title Defining and measuring Accessibility, Mobility and Socio-economic Well being - the
development of indicators Reference Arora A., 2007, Socio-Economic Impact Assessment (Seia) Methodology For Urban
Transport Projects: Impact Of Delhi Metro On The Urban Poor, Unpublished PhD dissertation, Department of Civil Engineering, Indian Institute of Technology, Delhi
Description Accessibility, Mobility and Socio-economic well being (SEWB) have been used as concepts in different fields of transport engineering and planning, sociology, development and welfare studies and others. Their definition and meaning are different in different fields and have changed over time too. Since the terms Accessibility, Mobility and SEWB are the corner-stones of this study and the model for SEIA of transport projects is based on a correlational mapping of these three, it is important to review the available literature and redefine these terms for this dissertation.
1. Review of definitions
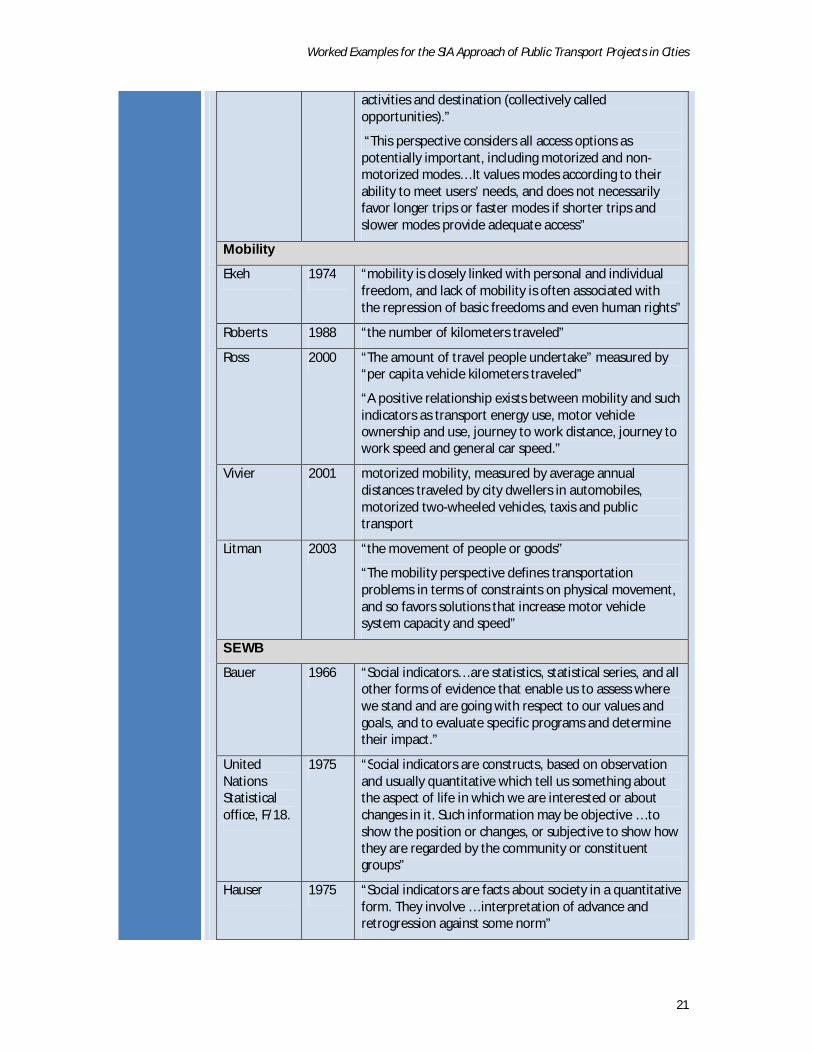
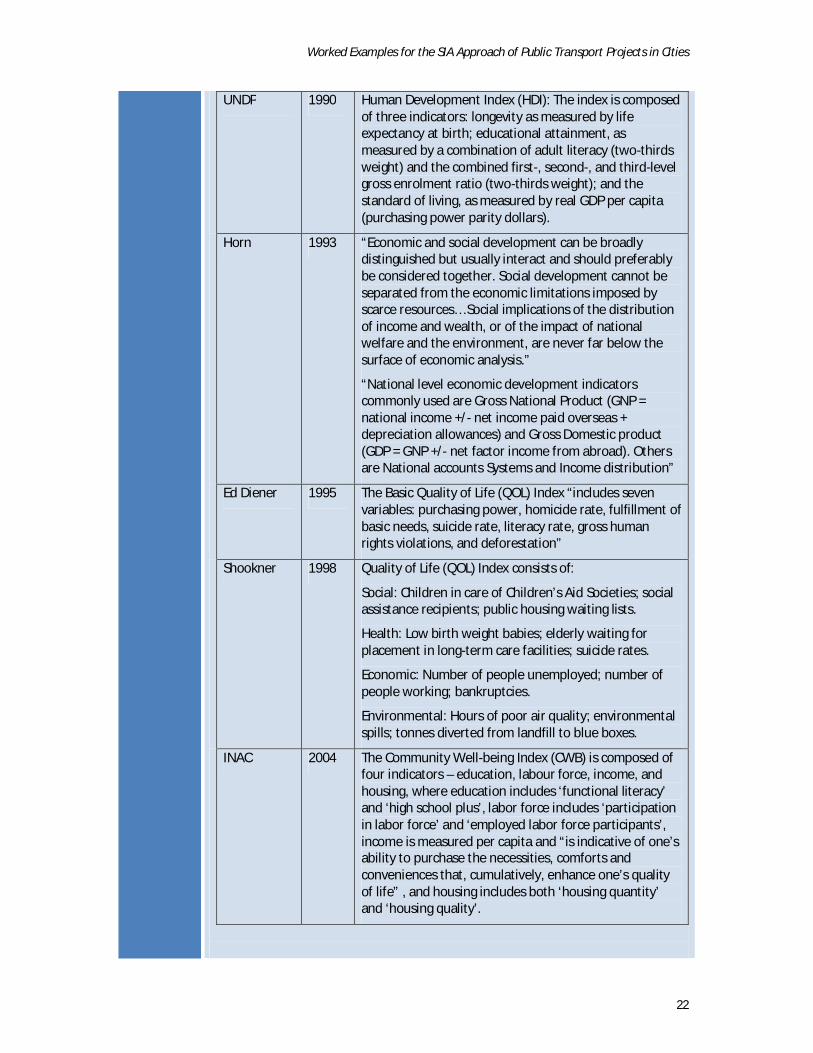
The first step is to review the available definitions of all 3 terms over time. A summary of the reviewed definitions is given below:
Author Year Definition/ Discussion
Accessibility
Roberts 1988 “the number of trips made”.
“number of, and/or the ease of making journeys”
Black 1981
1992
“accessibility is a function of land-use intensity and transport supply”
accessibility is “a description of how conveniently land-uses are located in relation to each other… and how easy or difficult it is to reach these land use activities via the transport network of both public and private transport modes.”
Ross 2000 “Often understood as the ease of access to destinations, amongst other parameters it (accessibility) encompasses ideas of costs in time and money; extent, comfort and frequency of the public transport system; and the distance to be negotiated to reach destinations such as shops, work places and schools”
Vivier 2001 “Access to urban activities for a population presupposes the existence of a public transport service offering all city dwellers, whatever their income level, age or handicaps, the possibility of getting to work or school, going shopping and enjoying themselves.”
“Accessibility is good when density is high – because distances to be covered are low – and when public transport is fast.”
Litman 2003 “refers to the ability to reach desired goods, services,
Worked Examples for the SIA Approach of Public Transport Projects in Cities
21
activities and destination (collectively called opportunities).”
“This perspective considers all access options as potentially important, including motorized and non-motorized modes… It values modes according to their ability to meet users’ needs, and does not necessarily favor longer trips or faster modes if shorter trips and slower modes provide adequate access”
Mobility
Ekeh 1974 “mobility is closely linked with personal and individual freedom, and lack of mobility is often associated with the repression of basic freedoms and even human rights”
Roberts 1988 “the number of kilometers traveled”
Ross 2000 “The amount of travel people undertake” measured by “per capita vehicle kilometers traveled”
“A positive relationship exists between mobility and such indicators as transport energy use, motor vehicle ownership and use, journey to work distance, journey to work speed and general car speed.”
Vivier 2001 motorized mobility, measured by average annual distances traveled by city dwellers in automobiles, motorized two-wheeled vehicles, taxis and public transport
Litman 2003 “the movement of people or goods”
“The mobility perspective defines transportation problems in terms of constraints on physical movement, and so favors solutions that increase motor vehicle system capacity and speed”
SEWB
Bauer 1966 “Social indicators… are statistics, statistical series, and all other forms of evidence that enable us to assess where we stand and are going with respect to our values and goals, and to evaluate specific programs and determine their impact.”
United Nations Statistical office, F/18.
1975 “Social indicators are constructs, based on observation and usually quantitative which tell us something about the aspect of life in which we are interested or about changes in it. Such information may be objective … to show the position or changes, or subjective to show how they are regarded by the community or constituent groups”
Hauser 1975 “Social indicators are facts about society in a quantitative form. They involve … interpretation of advance and retrogression against some norm”
Worked Examples for the SIA Approach of Public Transport Projects in Cities
22
UNDP 1990 Human Development Index (HDI): The index is composed of three indicators: longevity as measured by life expectancy at birth; educational attainment, as measured by a combination of adult literacy (two-thirds weight) and the combined first-, second-, and third-level gross enrolment ratio (two-thirds weight); and the standard of living, as measured by real GDP per capita (purchasing power parity dollars).
Horn 1993 “Economic and social development can be broadly distinguished but usually interact and should preferably be considered together. Social development cannot be separated from the economic limitations imposed by scarce resources… Social implications of the distribution of income and wealth, or of the impact of national welfare and the environment, are never far below the surface of economic analysis.”
“National level economic development indicators commonly used are Gross National Product (GNP = national income +/- net income paid overseas + depreciation allowances) and Gross Domestic product (GDP = GNP +/- net factor income from abroad). Others are National accounts Systems and Income distribution”
Ed Diener 1995 The Basic Quality of Life (QOL) Index “includes seven variables: purchasing power, homicide rate, fulfillment of basic needs, suicide rate, literacy rate, gross human rights violations, and deforestation”
Shookner 1998 Quality of Life (QOL) Index consists of:
Social: Children in care of Children’s Aid Societies; social assistance recipients; public housing waiting lists.
Health: Low birth weight babies; elderly waiting for placement in long-term care facilities; suicide rates.
Economic: Number of people unemployed; number of people working; bankruptcies.
Environmental: Hours of poor air quality; environmental spills; tonnes diverted from landfill to blue boxes.
INAC 2004 The Community Well-being Index (CWB) is composed of four indicators – education, labour force, income, and housing, where education includes ‘functional literacy’ and ‘high school plus’, labor force includes ‘participation in labor force’ and ‘employed labor force participants’, income is measured per capita and “is indicative of one’s ability to purchase the necessities, comforts and conveniences that, cumulatively, enhance one’s quality of life” , and housing includes both ‘housing quantity’ and ‘housing quality’.
Worked Examples for the SIA Approach of Public Transport Projects in Cities
23
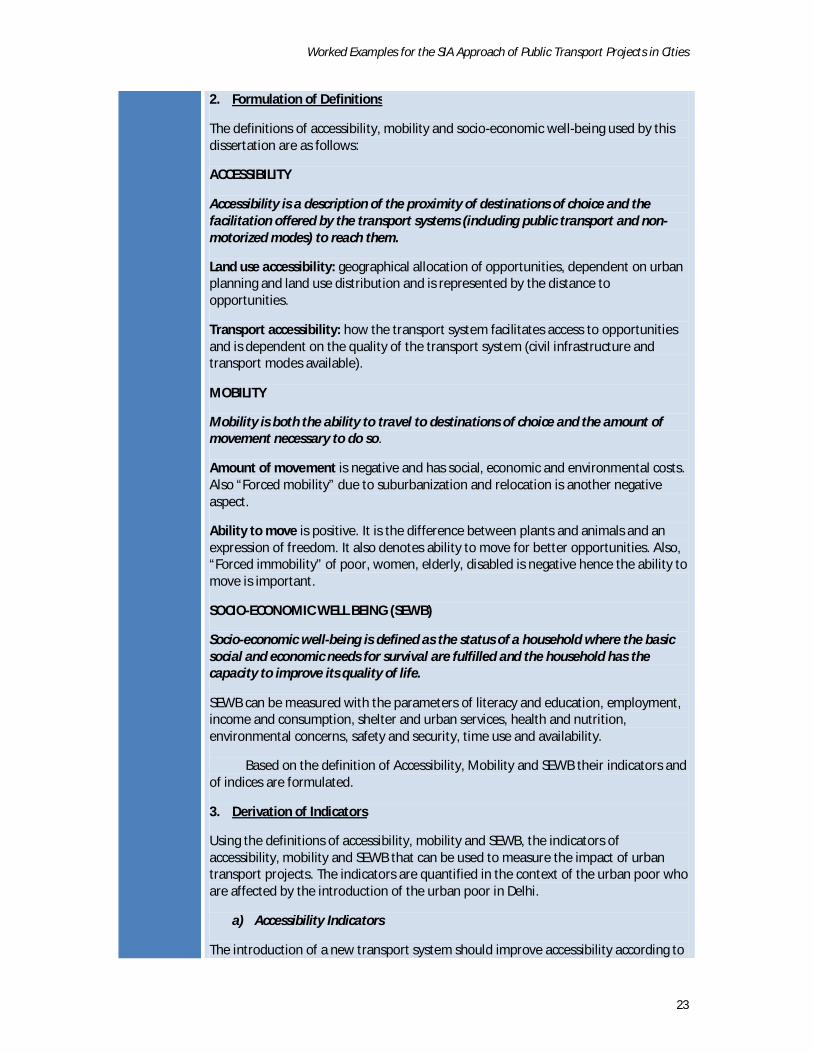
2. Formulation of Definitions
The definitions of accessibility, mobility and socio-economic well-being used by this dissertation are as follows:
ACCESSIBILITY
Accessibility is a description of the proximity of destinations of choice and the facilitation offered by the transport systems (including public transport and non-motorized modes) to reach them.
Land use accessibility: geographical allocation of opportunities, dependent on urban planning and land use distribution and is represented by the distance to opportunities.
Transport accessibility: how the transport system facilitates access to opportunities and is dependent on the quality of the transport system (civil infrastructure and transport modes available).
MOBILITY
Mobility is both the ability to travel to destinations of choice and the amount of movement necessary to do so.
Amount of movement is negative and has social, economic and environmental costs. Also “Forced mobility” due to suburbanization and relocation is another negative aspect.
Ability to move is positive. It is the difference between plants and animals and an expression of freedom. It also denotes ability to move for better opportunities. Also, “Forced immobility” of poor, women, elderly, disabled is negative hence the ability to move is important.
SOCIO-ECONOMIC WELL BEING (SEWB)
Socio-economic well-being is defined as the status of a household where the basic social and economic needs for survival are fulfilled and the household has the capacity to improve its quality of life.
SEWB can be measured with the parameters of literacy and education, employment, income and consumption, shelter and urban services, health and nutrition, environmental concerns, safety and security, time use and availability.
Based on the definition of Accessibility, Mobility and SEWB their indicators and of indices are formulated.
3. Derivation of Indicators
Using the definitions of accessibility, mobility and SEWB, the indicators of accessibility, mobility and SEWB that can be used to measure the impact of urban transport projects. The indicators are quantified in the context of the urban poor who are affected by the introduction of the urban poor in Delhi.
a) Accessibility Indicators
The introduction of a new transport system should improve accessibility according to

Worked Examples for the SIA Approach of Public Transport Projects in Cities
24
the first hypothesis. According to the definition given , “accessibility is a description of the proximity of destinations of choice and the facilitation offered by the transport systems (including public transport and non-motorized modes) to reach them”. Using the second component of the definition, the accessibility provided by Metro rail as a new public transport system needs to be assessed and compared to the existing bus system. The indicators developed to assess and compare Public Transport Accessibility (APT) are based on:
Daily travel characteristics: total distance, time and cost of travel per day Ratio of access and egress trips versus the main line haul (MLH) trips: this
ratio describes how accessible the public transport system is to the commuter, that is, to use the public transport system, how does the commuter reach the stop/station, and on disembarking, how does s/he reaches the destination – the number of access trips, distance of access trips, time and cost.
Ratio of vehicular access trip distance versus pedestrian access trip distance: this indicator defines the accessibility of the public transport system by foot; if the ratio is high that implies that there is a distance, cost and, in case of motorized access trips, a pollution factor associated with using the transport system.
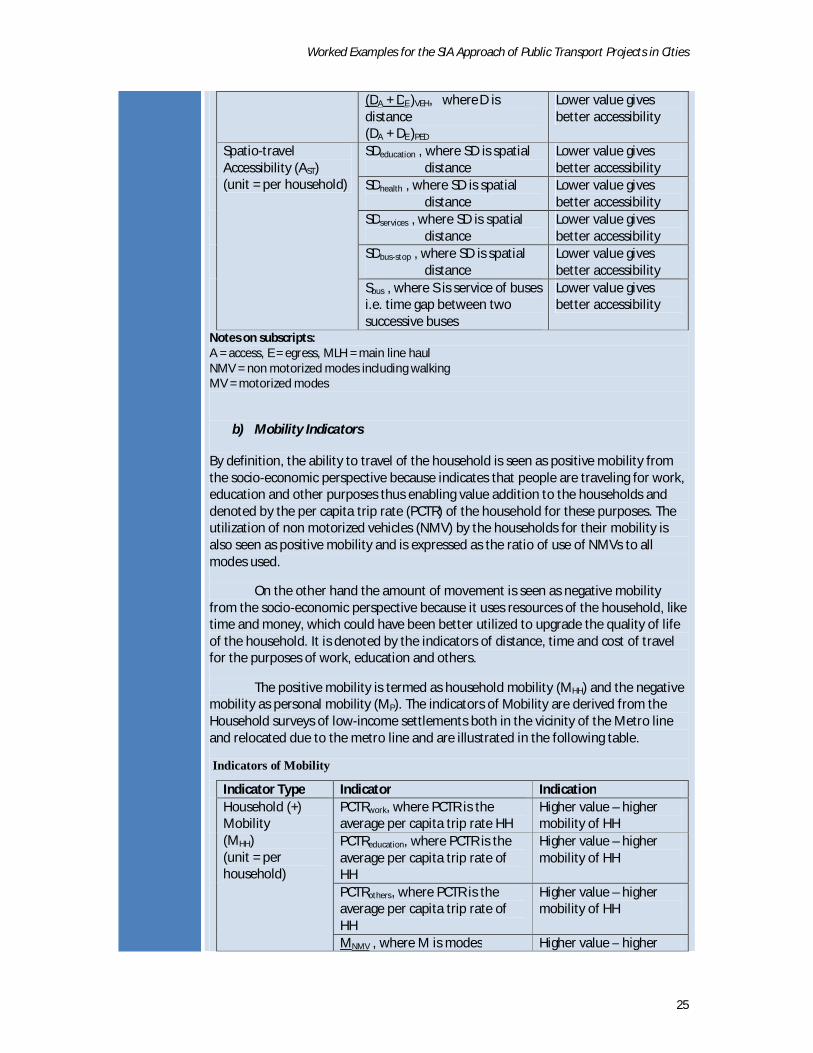
The first component of the definition of accessibility “proximity to destination of choice” is a land-use description of a household and has been labeled as Spatio-Travel Accessibility (AST) by this dissertation. This is described by the distance to educational services, health services and other urban services like vegetable markets, daily need shops and larger shopping areas. It is also described by the accessibility to the public transport system – distance to the bus stop, frequency of bus services.
The indicators of accessibility are derived from 2 sets of database.
1. The Public Transport Accessibility (APT) is measured from the commuter survey data of Bus users and Metro users.
2. The Spatio-Travel Accessibility (AST) is derived from Household surveys (both in low-income settlements located in the vicinity of the Metro line, and low-income settlements relocated due to metro line.
Indictors of Accessibility
Indicator Type Indicator Indication Public Transport Accessibility (APT) (unit = per user)
Dtotal, where D is distance Lower value gives better accessibility
Ttotal, where T is time Lower value gives better accessibility
Ctotal, where C is cost Lower value gives better accessibility
NA + NE , where N is no. of trips NMLH
Lower value gives better accessibility
DA + DE , where D is distance DMLH
Lower value gives better accessibility
TA + TE , where T is time TMLH
Lower value gives better accessibility
CA + CE , where C is cost CMLH
Lower value gives better accessibility
Worked Examples for the SIA Approach of Public Transport Projects in Cities
25
(DA + DE )VEH, where D is distance (DA + DE )PED
Lower value gives better accessibility
Spatio-travel Accessibility (AST) (unit = per household)
SDeducation , where SD is spatial distance
Lower value gives better accessibility
SDhealth , where SD is spatial distance
Lower value gives better accessibility
SDservices , where SD is spatial distance
Lower value gives better accessibility
SDbus-stop , where SD is spatial distance
Lower value gives better accessibility
Sbus , where S is service of buses i.e. time gap between two successive buses
Lower value gives better accessibility
Notes on subscripts: A = access, E = egress, MLH = main line haul NMV = non motorized modes including walking MV = motorized modes
b) Mobility Indicators
By definition, the ability to travel of the household is seen as positive mobility from the socio-economic perspective because indicates that people are traveling for work, education and other purposes thus enabling value addition to the households and denoted by the per capita trip rate (PCTR) of the household for these purposes. The utilization of non motorized vehicles (NMV) by the households for their mobility is also seen as positive mobility and is expressed as the ratio of use of NMVs to all modes used.
On the other hand the amount of movement is seen as negative mobility from the socio-economic perspective because it uses resources of the household, like time and money, which could have been better utilized to upgrade the quality of life of the household. It is denoted by the indicators of distance, time and cost of travel for the purposes of work, education and others.
The positive mobility is termed as household mobility (MHH) and the negative mobility as personal mobility (MP). The indicators of Mobility are derived from the Household surveys of low-income settlements both in the vicinity of the Metro line and relocated due to the metro line and are illustrated in the following table.
Indicators of Mobility
Indicator Type Indicator Indication Household (+) Mobility (MHH) (unit = per household)
PCTRwork, where PCTR is the average per capita trip rate HH
Higher value – higher mobility of HH
PCTReducation, where PCTR is the average per capita trip rate of HH
Higher value – higher mobility of HH
PCTRothers, where PCTR is the average per capita trip rate of HH
Higher value – higher mobility of HH
MNMV , where M is modes Higher value – higher
Worked Examples for the SIA Approach of Public Transport Projects in Cities
26
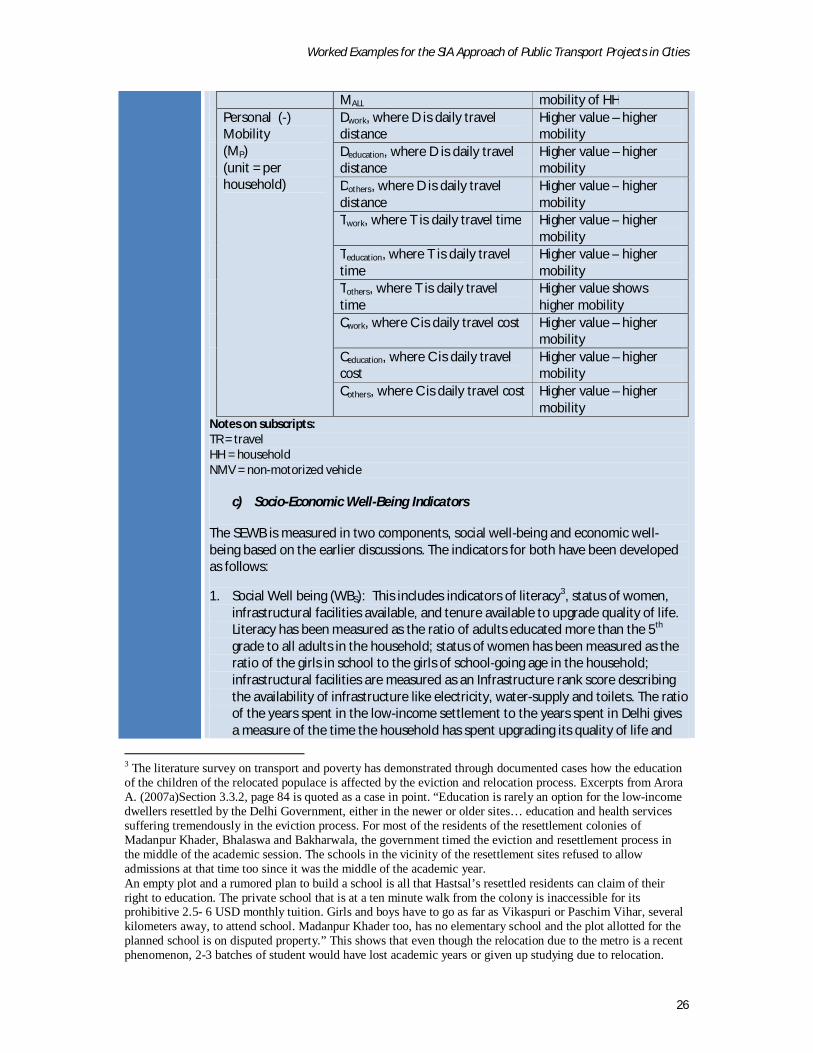
MALL mobility of HH Personal (-) Mobility (MP) (unit = per household)
Dwork, where D is daily travel distance
Higher value – higher mobility
Deducation, where D is daily travel distance
Higher value – higher mobility
Dothers, where D is daily travel distance
Higher value – higher mobility
Twork, where T is daily travel time Higher value – higher mobility
Teducation, where T is daily travel time
Higher value – higher mobility
Tothers, where T is daily travel time
Higher value shows higher mobility
Cwork, where C is daily travel cost Higher value – higher mobility
Ceducation, where C is daily travel cost
Higher value – higher mobility
Cothers, where C is daily travel cost Higher value – higher mobility
Notes on subscripts: TR = travel HH = household NMV = non-motorized vehicle
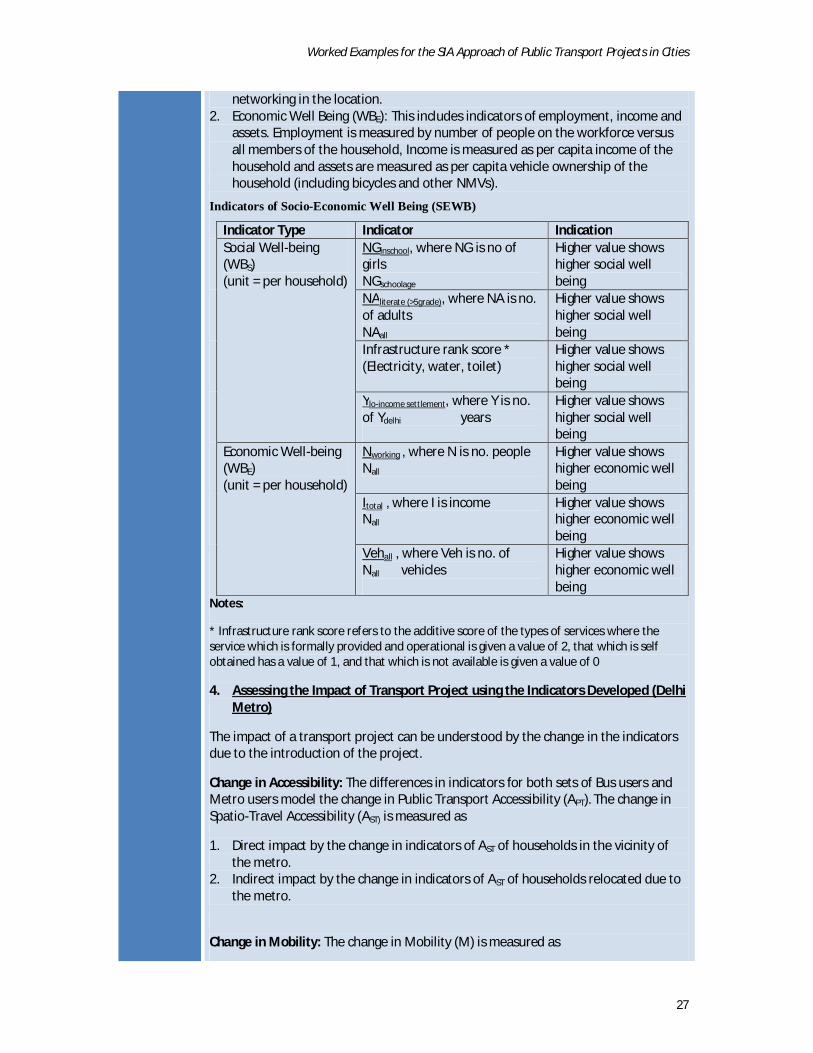
c) Socio-Economic Well-Being Indicators
The SEWB is measured in two components, social well-being and economic well-being based on the earlier discussions. The indicators for both have been developed as follows:
1. Social Well being (WBS): This includes indicators of literacy3, status of women, infrastructural facilities available, and tenure available to upgrade quality of life. Literacy has been measured as the ratio of adults educated more than the 5th grade to all adults in the household; status of women has been measured as the ratio of the girls in school to the girls of school-going age in the household; infrastructural facilities are measured as an Infrastructure rank score describing the availability of infrastructure like electricity, water-supply and toilets. The ratio of the years spent in the low-income settlement to the years spent in Delhi gives a measure of the time the household has spent upgrading its quality of life and
3 The literature survey on transport and poverty has demonstrated through documented cases how the education of the children of the relocated populace is affected by the eviction and relocation process. Excerpts from Arora A. (2007a)Section 3.3.2, page 84 is quoted as a case in point. “Education is rarely an option for the low-income dwellers resettled by the Delhi Government, either in the newer or older sites… education and health services suffering tremendously in the eviction process. For most of the residents of the resettlement colonies of Madanpur Khader, Bhalaswa and Bakharwala, the government timed the eviction and resettlement process in the middle of the academic session. The schools in the vicinity of the resettlement sites refused to allow admissions at that time too since it was the middle of the academic year. An empty plot and a rumored plan to build a school is all that Hastsal’s resettled residents can claim of their right to education. The private school that is at a ten minute walk from the colony is inaccessible for its prohibitive 2.5- 6 USD monthly tuition. Girls and boys have to go as far as Vikaspuri or Paschim Vihar, several kilometers away, to attend school. Madanpur Khader too, has no elementary school and the plot allotted for the planned school is on disputed property.” This shows that even though the relocation due to the metro is a recent phenomenon, 2-3 batches of student would have lost academic years or given up studying due to relocation.
Worked Examples for the SIA Approach of Public Transport Projects in Cities
27
networking in the location. 2. Economic Well Being (WBE): This includes indicators of employment, income and
assets. Employment is measured by number of people on the workforce versus all members of the household, Income is measured as per capita income of the household and assets are measured as per capita vehicle ownership of the household (including bicycles and other NMVs).
Indicators of Socio-Economic Well Being (SEWB)
Indicator Type Indicator Indication Social Well-being (WBS) (unit = per household)
NGinschool, where NG is no of girls NGschoolage
Higher value shows higher social well being
NAliterate (>5grade), where NA is no. of adults NAall
Higher value shows higher social well being
Infrastructure rank score * (Electricity, water, toilet)
Higher value shows higher social well being
Ylo-income settlement, where Y is no. of Ydelhi years
Higher value shows higher social well being
Economic Well-being (WBE) (unit = per household)
Nworking , where N is no. people Nall
Higher value shows higher economic well being
Itotal , where I is income Nall
Higher value shows higher economic well being
Vehall , where Veh is no. of Nall vehicles
Higher value shows higher economic well being
Notes:
* Infrastructure rank score refers to the additive score of the types of services where the service which is formally provided and operational is given a value of 2, that which is self obtained has a value of 1, and that which is not available is given a value of 0
4. Assessing the Impact of Transport Project using the Indicators Developed (Delhi Metro)
The impact of a transport project can be understood by the change in the indicators due to the introduction of the project.
Change in Accessibility: The differences in indicators for both sets of Bus users and Metro users model the change in Public Transport Accessibility (APT). The change in Spatio-Travel Accessibility (AST) is measured as
1. Direct impact by the change in indicators of AST of households in the vicinity of the metro.
2. Indirect impact by the change in indicators of AST of households relocated due to the metro.
Change in Mobility: The change in Mobility (M) is measured as
Worked Examples for the SIA Approach of Public Transport Projects in Cities
28
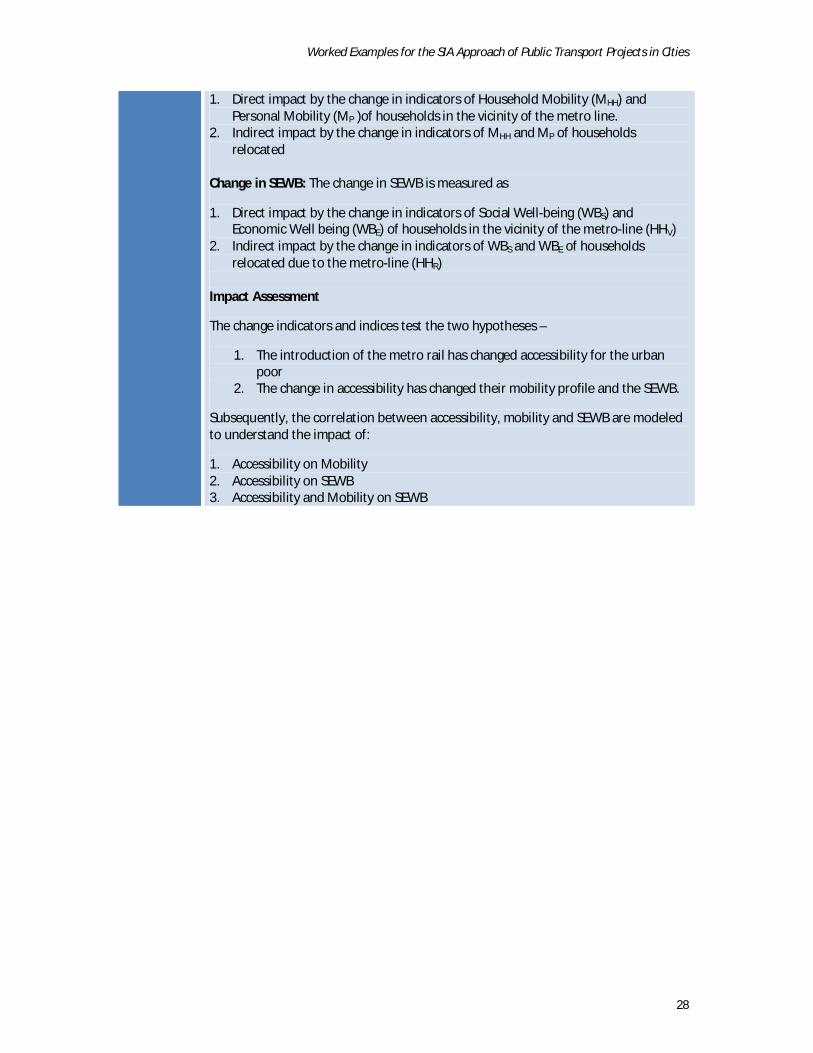
1. Direct impact by the change in indicators of Household Mobility (MHH) and Personal Mobility (MP )of households in the vicinity of the metro line.
2. Indirect impact by the change in indicators of MHH and MP of households relocated
Change in SEWB: The change in SEWB is measured as
1. Direct impact by the change in indicators of Social Well-being (WBS) and Economic Well being (WBE) of households in the vicinity of the metro-line (HHV)
2. Indirect impact by the change in indicators of WBS and WBE of households relocated due to the metro-line (HHR)
Impact Assessment
The change indicators and indices test the two hypotheses –
1. The introduction of the metro rail has changed accessibility for the urban poor
2. The change in accessibility has changed their mobility profile and the SEWB.
Subsequently, the correlation between accessibility, mobility and SEWB are modeled to understand the impact of:
1. Accessibility on Mobility 2. Accessibility on SEWB 3. Accessibility and Mobility on SEWB

Worked Examples for the SIA Approach of Public Transport Projects in Cities
29
Step 2. Assessment
Task d. Collect data to predict the impacts Title Survey Methodology and Design Reference Arora A., 2007, Socio-Economic Impact Assessment (Seia) Methodology For Urban
Transport Projects: Impact Of Delhi Metro On The Urban Poor, Unpublished PhD dissertation, Department of Civil Engineering, Indian Institute of Technology, Delhi
Description The field surveys were conducted for the case-study in the year 2004 over a period of 4 months. The following steps were followed: 1. Determine the objective of the surveys The objective of case study was to understand 2 aspects of the transportation system
a) What is the difference in the travel profile of metro and bus users on the same corridor?
b) What is the impact of the system on the urban poor? 2. Survey design
a) Commuter Surveys: A survey of users of the metro rail was conducted at the stations. To validate the survey, a counterpart set of interviews was conducted of the non-users of the metro by interviewing the commuters at the bus-stops nearest to the metro stations.
b) Household Surveys: At the conceptual level this thesis identifies impacts at two levels – direct and indirect. Direct impact would refer to a change in the travel patterns due to introduction of the Metro and any resulting change in the socio-economic profile of the low-income settlements around the metro. Indirect impact would refer to change in travel patterns and socio-economic profiles as a side effect of the installation of the system – in this case eviction and relocation of the urban poor. For this purpose 2 low-income settlements along the metro line were selected to study change in travel and socio-economic profiles of poor households due to the introduction of the metro; and 1 resettlement colony was selected where the households relocated due to the construction of the metro were resettled by the government agencies.
3. Deciding the sample size
a) For commuters: User Surveys: 12 or more at each station to total of approximately 216 people Non-user surveys: 12 or more at each station to total to approximately 216
people b) For Households affected: Low-incomes near metro: 10% of total number of households at both sites
selected Low-incomes relocated due to metro: 10% of total number of households
relocated due to metro 4. Identifying Survey Locations
a) All 18 stations along the Shahadra-Rithala line of the 1st phase of the Metro for both user and non-user surveys.
b) Low-incomes near metro: Rajiv Gandhi colony in Kailash Nagar low-income and Shahid Sukhdev Nagar low-income in Wazirpur Industrial area near the Shastri Park and Keshavpuram stations at both ends of the metro line. Low-incomes relocated due to metro: Metro Vihar in Holambikalan resettlement colony beyond Narela and Bawana areas on the North-West corner of Delhi.
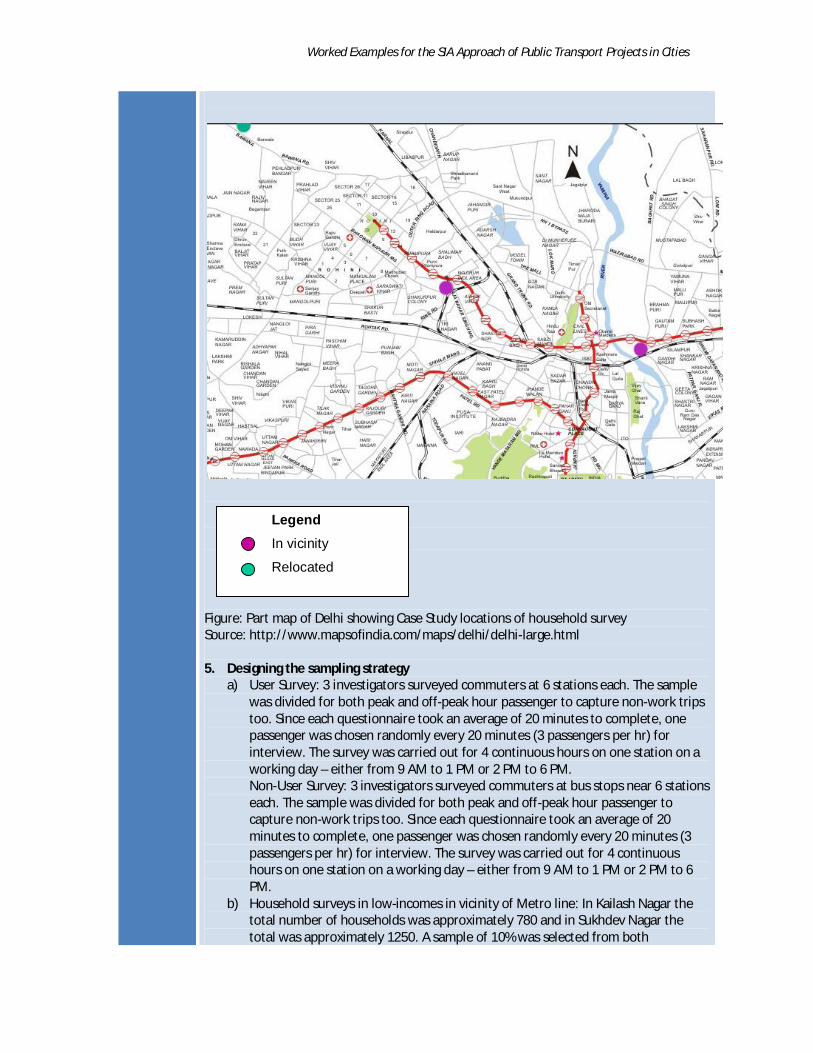
Worked Examples for the SIA Approach of Public Transport Projects in Cities
Figure: Part map of Delhi showing Case Study locations of household survey Source: http://www.mapsofindia.com/maps/delhi/delhi-large.html 5. Designing the sampling strategy
a) User Survey: 3 investigators surveyed commuters at 6 stations each. The sample was divided for both peak and off-peak hour passenger to capture non-work trips too. Since each questionnaire took an average of 20 minutes to complete, one passenger was chosen randomly every 20 minutes (3 passengers per hr) for interview. The survey was carried out for 4 continuous hours on one station on a working day – either from 9 AM to 1 PM or 2 PM to 6 PM. Non-User Survey: 3 investigators surveyed commuters at bus stops near 6 stations each. The sample was divided for both peak and off-peak hour passenger to capture non-work trips too. Since each questionnaire took an average of 20 minutes to complete, one passenger was chosen randomly every 20 minutes (3 passengers per hr) for interview. The survey was carried out for 4 continuous hours on one station on a working day – either from 9 AM to 1 PM or 2 PM to 6 PM.
b) Household surveys in low-incomes in vicinity of Metro line: In Kailash Nagar the total number of households was approximately 780 and in Sukhdev Nagar the total was approximately 1250. A sample of 10% was selected from both
Legend In vicinity
Relocated

Worked Examples for the SIA Approach of Public Transport Projects in Cities
31
settlements. The choice of the households was based on the respondents’ willingness to answer the survey with the proviso that the sample was evenly distributed throughout the site. Household surveys in resettlement site: In Metro Vihar the total number of households living here were approximately 2010 though 3000 plots had been allocated. A sample of 10% was selected from the inhabited households. The choice of the households was based on the respondents’ willingness to answer the survey with the proviso that the sample was evenly distributed throughout the site.
6. Designing the Questionnaire The information needed in the interviews was both quantitative and qualitative to understand the depth of the concerns. Accordingly, the questions designed were of both the close-ended and open-ended type. In the definition of McBurney (2002) a close-ended question is one that limits the respondents to certain alternatives and an open-ended question is one that the respondents answer on their own. Using open-ended questions makes it more likely that the questionnaire will discover something not anticipated by its designers, but they are harder to code and analyze for a large sample so were used sparingly. Also, for some questions the open-ended questions in the pilot survey were made close-ended depended on the types of answers of the respondents. The following points were kept in mind while designing the questionnaire to avoid problems at the data analysis stage:
Address a single issue per item: Each item addressed only a single question and did so in a clear and unambiguous manner.
Avoid bias: The next consideration was to write the question in such a way that it would not bias the result.
Make alternatives clear: There was a particular need to write close-ended questions in such a way that the options were distinctly different from one another and they covered all possibilities – the answers needed to be mutually exclusive and exhaustive. By definition (McBurney, 2002) categories are mutually exclusive if no individual case could belong to more than one category at a time; and for the categories to be exhaustive, all cases must fall into one of the alternatives.
Beware of the social desirability tendency: According to McBurney, 2002, bias often enters when the respondents perceive on alternative as more socially acceptable than the other – a phenomenon called social desirability. The questionnaire avoided this problem by wording questions so that each alternative appeared equally socially desirable.
Determine the format of the item: the formats of the answers were pre-decided to avoid confusion during the administration of the survey. This included the units, numerical / alpha numeric, tick the right item etc.
Sequence the items: Care was taken in sequencing the items in the questionnaires since answers to some questions could have been biased if they were to come after some others.
Determine how the data will be analyzed: Data entry and analysis techniques, including the software to be used were considered during the construction of the questionnaire.
Also, as a policy decision, for questionnaires the answers were not pre-coded. This was to ensure that errors do not arise due to incorrect entry during filling out the questionnaires and data entry. This policy had the disadvantage of making the post-entry coding work tedious and time consuming but had the advantage of being error free and giving more
Worked Examples for the SIA Approach of Public Transport Projects in Cities
32
options at the analysis stage. The questionnaires were translated in Hindi before administration of the survey and the translation checked rigorously against the original. This was done to avoid loss of meaning by surveyors due to impromptu translation on site. The questionnaires used are reproduced in Annexure A in English. 7. Administration of survey The questionnaire was administered as personal (face-to-face) interviews. This method had the advantage that the interviewers could establish a rapport with the people being interviewed and direct the attention of the respondents to the material. They were able to notice when the respondents seemed to misunderstand the question and explain its meaning. They could probe for more complete answers when the respondents answered in a manner that did not fully respond to the question. This was the only realistic option for the household interviews in low-income settlements. In fact, the survey team paid several preliminary visits to the sites and had informal discussions with some key people before starting the survey so that the respondents would be willing to answer correctly and comprehensively. The main disadvantage of this method was that sometimes the respondent could have told the interviewer what they wanted to hear however this was largely circumvented by pre-established rapport and cross-questioning.
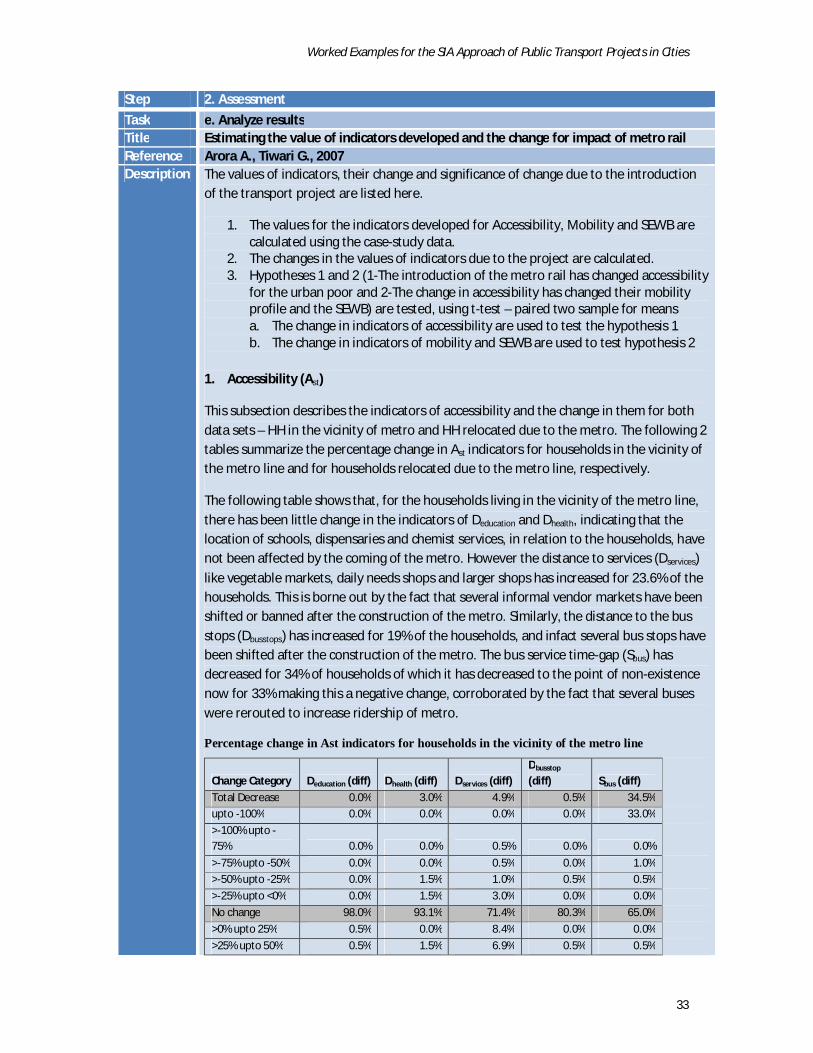
Worked Examples for the SIA Approach of Public Transport Projects in Cities
33
Step 2. Assessment
Task e. Analyze results Title Estimating the value of indicators developed and the change for impact of metro rail Reference Arora A., Tiwari G., 2007 Description The values of indicators, their change and significance of change due to the introduction
of the transport project are listed here.
1. The values for the indicators developed for Accessibility, Mobility and SEWB are calculated using the case-study data.
2. The changes in the values of indicators due to the project are calculated. 3. Hypotheses 1 and 2 (1-The introduction of the metro rail has changed accessibility
for the urban poor and 2-The change in accessibility has changed their mobility profile and the SEWB) are tested, using t-test – paired two sample for means a. The change in indicators of accessibility are used to test the hypothesis 1 b. The change in indicators of mobility and SEWB are used to test hypothesis 2
1. Accessibility (Ast)
This subsection describes the indicators of accessibility and the change in them for both data sets – HH in the vicinity of metro and HH relocated due to the metro. The following 2 tables summarize the percentage change in Ast indicators for households in the vicinity of the metro line and for households relocated due to the metro line, respectively.
The following table shows that, for the households living in the vicinity of the metro line, there has been little change in the indicators of Deducation and Dhealth, indicating that the location of schools, dispensaries and chemist services, in relation to the households, have not been affected by the coming of the metro. However the distance to services (Dservices)
like vegetable markets, daily needs shops and larger shops has increased for 23.6% of the households. This is borne out by the fact that several informal vendor markets have been shifted or banned after the construction of the metro. Similarly, the distance to the bus stops (Dbusstops) has increased for 19% of the households, and infact several bus stops have been shifted after the construction of the metro. The bus service time-gap (Sbus) has decreased for 34% of households of which it has decreased to the point of non-existence now for 33% making this a negative change, corroborated by the fact that several buses were rerouted to increase ridership of metro.
Percentage change in Ast indicators for households in the vicinity of the metro line
Change Category Deducation (diff) Dhealth (diff) Dservices (diff) Dbusstop (diff) Sbus (diff)
Total Decrease 0.0% 3.0% 4.9% 0.5% 34.5% upto -100% 0.0% 0.0% 0.0% 0.0% 33.0%
>-100% upto -75% 0.0% 0.0% 0.5% 0.0% 0.0%
>-75% upto -50% 0.0% 0.0% 0.5% 0.0% 1.0% >-50% upto -25% 0.0% 1.5% 1.0% 0.5% 0.5%
>-25% upto <0% 0.0% 1.5% 3.0% 0.0% 0.0%
No change 98.0% 93.1% 71.4% 80.3% 65.0%
>0% upto 25% 0.5% 0.0% 8.4% 0.0% 0.0%
>25% upto 50% 0.5% 1.5% 6.9% 0.5% 0.5%
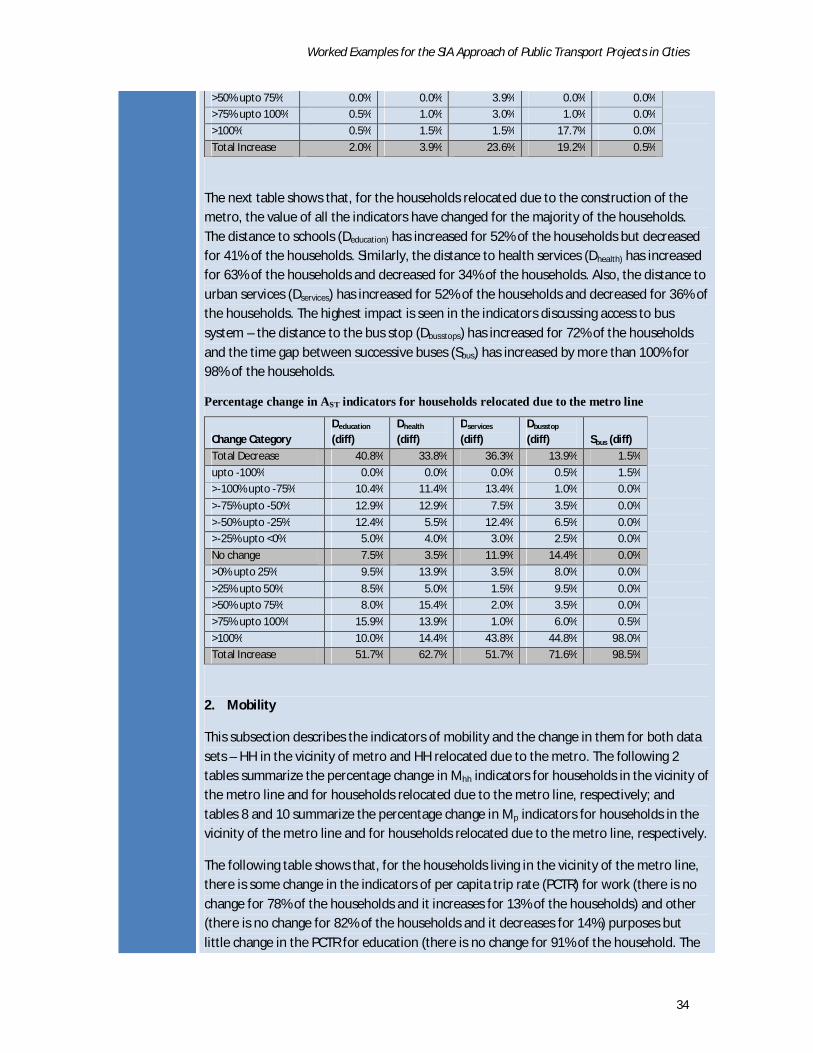
Worked Examples for the SIA Approach of Public Transport Projects in Cities
34
>50% upto 75% 0.0% 0.0% 3.9% 0.0% 0.0% >75% upto 100% 0.5% 1.0% 3.0% 1.0% 0.0%
>100% 0.5% 1.5% 1.5% 17.7% 0.0%
Total Increase 2.0% 3.9% 23.6% 19.2% 0.5%
The next table shows that, for the households relocated due to the construction of the metro, the value of all the indicators have changed for the majority of the households. The distance to schools (Deducation) has increased for 52% of the households but decreased for 41% of the households. Similarly, the distance to health services (Dhealth) has increased for 63% of the households and decreased for 34% of the households. Also, the distance to urban services (Dservices) has increased for 52% of the households and decreased for 36% of the households. The highest impact is seen in the indicators discussing access to bus system – the distance to the bus stop (Dbusstops) has increased for 72% of the households and the time gap between successive buses (Sbus) has increased by more than 100% for 98% of the households.
Percentage change in AST indicators for households relocated due to the metro line
Change Category Deducation (diff)
Dhealth (diff)
Dservices (diff)
Dbusstop (diff) Sbus (diff)
Total Decrease 40.8% 33.8% 36.3% 13.9% 1.5%
upto -100% 0.0% 0.0% 0.0% 0.5% 1.5% >-100% upto -75% 10.4% 11.4% 13.4% 1.0% 0.0%
>-75% upto -50% 12.9% 12.9% 7.5% 3.5% 0.0%
>-50% upto -25% 12.4% 5.5% 12.4% 6.5% 0.0% >-25% upto <0% 5.0% 4.0% 3.0% 2.5% 0.0%
No change 7.5% 3.5% 11.9% 14.4% 0.0%
>0% upto 25% 9.5% 13.9% 3.5% 8.0% 0.0%
>25% upto 50% 8.5% 5.0% 1.5% 9.5% 0.0% >50% upto 75% 8.0% 15.4% 2.0% 3.5% 0.0%
>75% upto 100% 15.9% 13.9% 1.0% 6.0% 0.5%
>100% 10.0% 14.4% 43.8% 44.8% 98.0% Total Increase 51.7% 62.7% 51.7% 71.6% 98.5%
2. Mobility
This subsection describes the indicators of mobility and the change in them for both data sets – HH in the vicinity of metro and HH relocated due to the metro. The following 2 tables summarize the percentage change in Mhh indicators for households in the vicinity of the metro line and for households relocated due to the metro line, respectively; and tables 8 and 10 summarize the percentage change in Mp indicators for households in the vicinity of the metro line and for households relocated due to the metro line, respectively.
The following table shows that, for the households living in the vicinity of the metro line, there is some change in the indicators of per capita trip rate (PCTR) for work (there is no change for 78% of the households and it increases for 13% of the households) and other (there is no change for 82% of the households and it decreases for 14%) purposes but little change in the PCTR for education (there is no change for 91% of the household. The
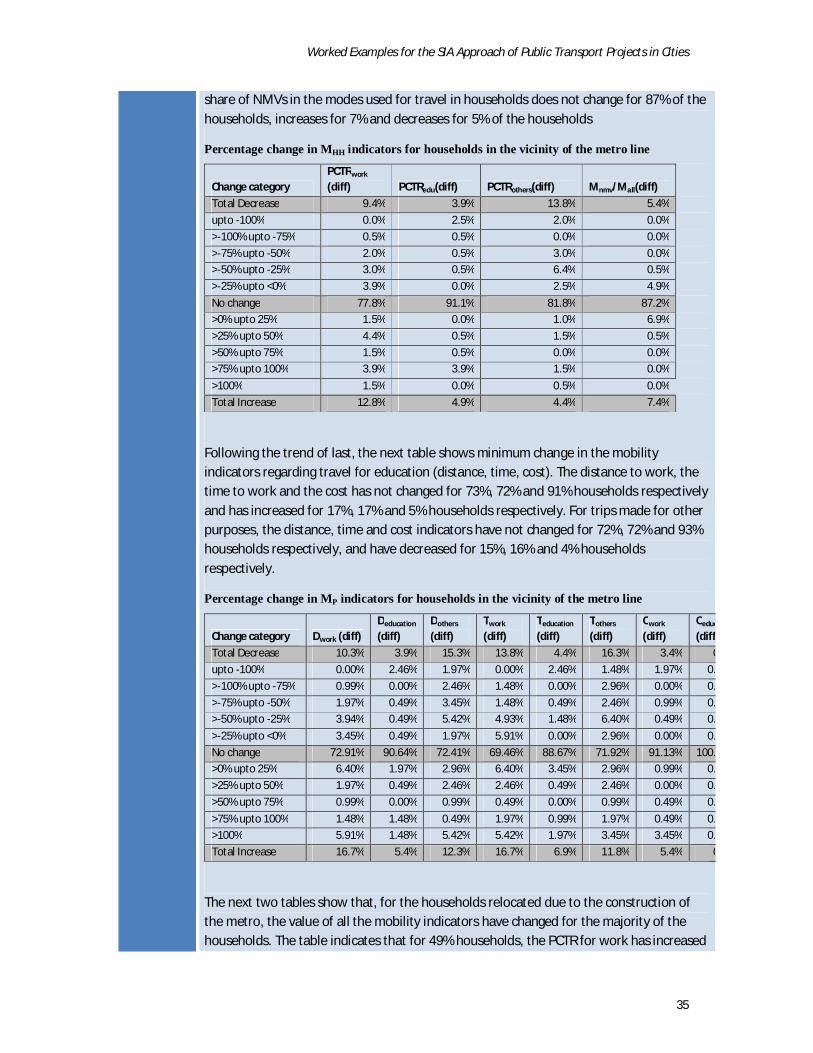
Worked Examples for the SIA Approach of Public Transport Projects in Cities
35
share of NMVs in the modes used for travel in households does not change for 87% of the households, increases for 7% and decreases for 5% of the households
Percentage change in MHH indicators for households in the vicinity of the metro line
Change category PCTRwork (diff) PCTRedu(diff) PCTRothers(diff) Mnmv/Mall(diff)
Total Decrease 9.4% 3.9% 13.8% 5.4%
upto -100% 0.0% 2.5% 2.0% 0.0%
>-100% upto -75% 0.5% 0.5% 0.0% 0.0%
>-75% upto -50% 2.0% 0.5% 3.0% 0.0% >-50% upto -25% 3.0% 0.5% 6.4% 0.5%
>-25% upto <0% 3.9% 0.0% 2.5% 4.9%
No change 77.8% 91.1% 81.8% 87.2% >0% upto 25% 1.5% 0.0% 1.0% 6.9%
>25% upto 50% 4.4% 0.5% 1.5% 0.5%
>50% upto 75% 1.5% 0.5% 0.0% 0.0% >75% upto 100% 3.9% 3.9% 1.5% 0.0%
>100% 1.5% 0.0% 0.5% 0.0%
Total Increase 12.8% 4.9% 4.4% 7.4%
Following the trend of last, the next table shows minimum change in the mobility indicators regarding travel for education (distance, time, cost). The distance to work, the time to work and the cost has not changed for 73%, 72% and 91% households respectively and has increased for 17%, 17% and 5% households respectively. For trips made for other purposes, the distance, time and cost indicators have not changed for 72%, 72% and 93% households respectively, and have decreased for 15%, 16% and 4% households respectively.
Percentage change in MP indicators for households in the vicinity of the metro line
Change category Dwork (diff) Deducation (diff)
Dothers (diff)
Twork (diff)
Teducation (diff)
Tothers (diff)
Cwork (diff)
Ceducation
(diff)
Total Decrease 10.3% 3.9% 15.3% 13.8% 4.4% 16.3% 3.4% 0.0%
upto -100% 0.00% 2.46% 1.97% 0.00% 2.46% 1.48% 1.97% 0.00%
>-100% upto -75% 0.99% 0.00% 2.46% 1.48% 0.00% 2.96% 0.00% 0.00%
>-75% upto -50% 1.97% 0.49% 3.45% 1.48% 0.49% 2.46% 0.99% 0.00%>-50% upto -25% 3.94% 0.49% 5.42% 4.93% 1.48% 6.40% 0.49% 0.00%
>-25% upto <0% 3.45% 0.49% 1.97% 5.91% 0.00% 2.96% 0.00% 0.00%
No change 72.91% 90.64% 72.41% 69.46% 88.67% 71.92% 91.13% 100.00%>0% upto 25% 6.40% 1.97% 2.96% 6.40% 3.45% 2.96% 0.99% 0.00%
>25% upto 50% 1.97% 0.49% 2.46% 2.46% 0.49% 2.46% 0.00% 0.00%
>50% upto 75% 0.99% 0.00% 0.99% 0.49% 0.00% 0.99% 0.49% 0.00%
>75% upto 100% 1.48% 1.48% 0.49% 1.97% 0.99% 1.97% 0.49% 0.00%>100% 5.91% 1.48% 5.42% 5.42% 1.97% 3.45% 3.45% 0.00%
Total Increase 16.7% 5.4% 12.3% 16.7% 6.9% 11.8% 5.4% 0.0%
The next two tables show that, for the households relocated due to the construction of the metro, the value of all the mobility indicators have changed for the majority of the households. The table indicates that for 49% households, the PCTR for work has increased
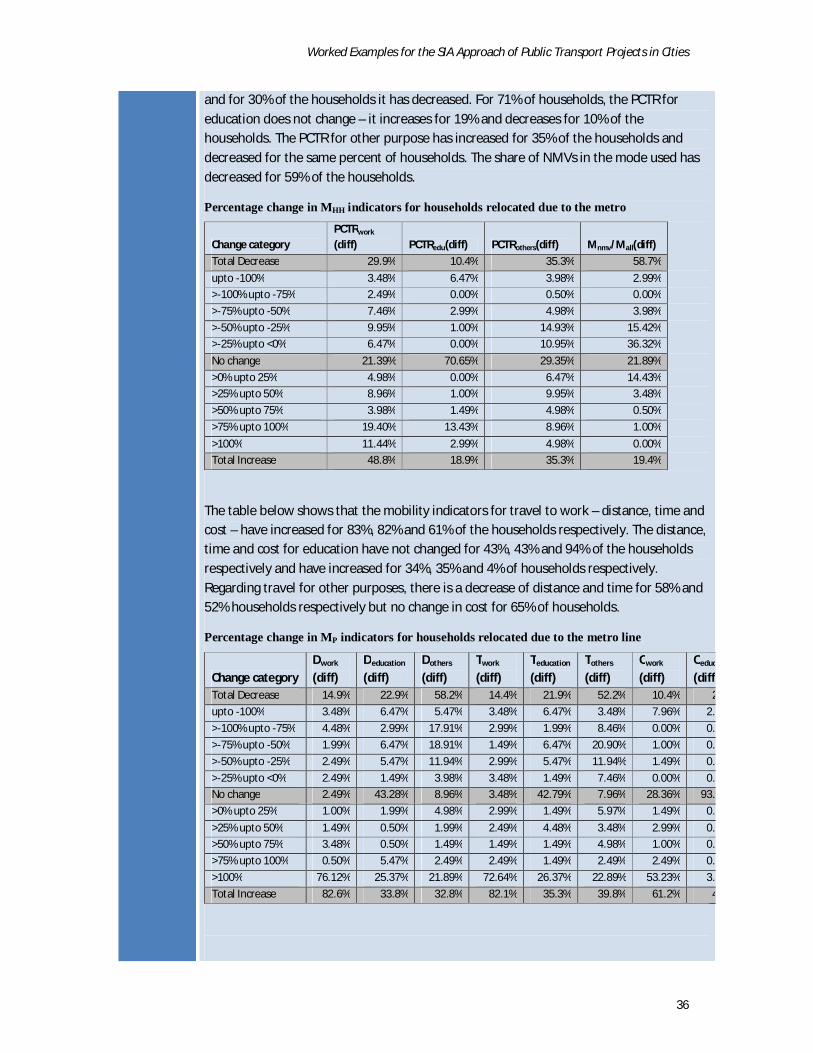
Worked Examples for the SIA Approach of Public Transport Projects in Cities
36
and for 30% of the households it has decreased. For 71% of households, the PCTR for education does not change – it increases for 19% and decreases for 10% of the households. The PCTR for other purpose has increased for 35% of the households and decreased for the same percent of households. The share of NMVs in the mode used has decreased for 59% of the households.
Percentage change in MHH indicators for households relocated due to the metro
Change category PCTRwork (diff) PCTRedu(diff) PCTRothers(diff) Mnmv/Mall(diff)
Total Decrease 29.9% 10.4% 35.3% 58.7%
upto -100% 3.48% 6.47% 3.98% 2.99% >-100% upto -75% 2.49% 0.00% 0.50% 0.00%
>-75% upto -50% 7.46% 2.99% 4.98% 3.98%
>-50% upto -25% 9.95% 1.00% 14.93% 15.42% >-25% upto <0% 6.47% 0.00% 10.95% 36.32%
No change 21.39% 70.65% 29.35% 21.89%
>0% upto 25% 4.98% 0.00% 6.47% 14.43% >25% upto 50% 8.96% 1.00% 9.95% 3.48%
>50% upto 75% 3.98% 1.49% 4.98% 0.50%
>75% upto 100% 19.40% 13.43% 8.96% 1.00%
>100% 11.44% 2.99% 4.98% 0.00% Total Increase 48.8% 18.9% 35.3% 19.4%
The table below shows that the mobility indicators for travel to work – distance, time and cost – have increased for 83%, 82% and 61% of the households respectively. The distance, time and cost for education have not changed for 43%, 43% and 94% of the households respectively and have increased for 34%, 35% and 4% of households respectively. Regarding travel for other purposes, there is a decrease of distance and time for 58% and 52% households respectively but no change in cost for 65% of households.
Percentage change in MP indicators for households relocated due to the metro line
Change category Dwork (diff)
Deducation (diff)
Dothers (diff)
Twork (diff)
Teducation (diff)
Tothers (diff)
Cwork (diff)
Ceducation
(diff)Total Decrease 14.9% 22.9% 58.2% 14.4% 21.9% 52.2% 10.4% 2.5%
upto -100% 3.48% 6.47% 5.47% 3.48% 6.47% 3.48% 7.96% 2.49%
>-100% upto -75% 4.48% 2.99% 17.91% 2.99% 1.99% 8.46% 0.00% 0.00%
>-75% upto -50% 1.99% 6.47% 18.91% 1.49% 6.47% 20.90% 1.00% 0.00%
>-50% upto -25% 2.49% 5.47% 11.94% 2.99% 5.47% 11.94% 1.49% 0.00%
>-25% upto <0% 2.49% 1.49% 3.98% 3.48% 1.49% 7.46% 0.00% 0.00%No change 2.49% 43.28% 8.96% 3.48% 42.79% 7.96% 28.36% 93.53%
>0% upto 25% 1.00% 1.99% 4.98% 2.99% 1.49% 5.97% 1.49% 0.00%
>25% upto 50% 1.49% 0.50% 1.99% 2.49% 4.48% 3.48% 2.99% 0.00%>50% upto 75% 3.48% 0.50% 1.49% 1.49% 1.49% 4.98% 1.00% 0.00%
>75% upto 100% 0.50% 5.47% 2.49% 2.49% 1.49% 2.49% 2.49% 0.00%
>100% 76.12% 25.37% 21.89% 72.64% 26.37% 22.89% 53.23% 3.98%
Total Increase 82.6% 33.8% 32.8% 82.1% 35.3% 39.8% 61.2% 4.0%
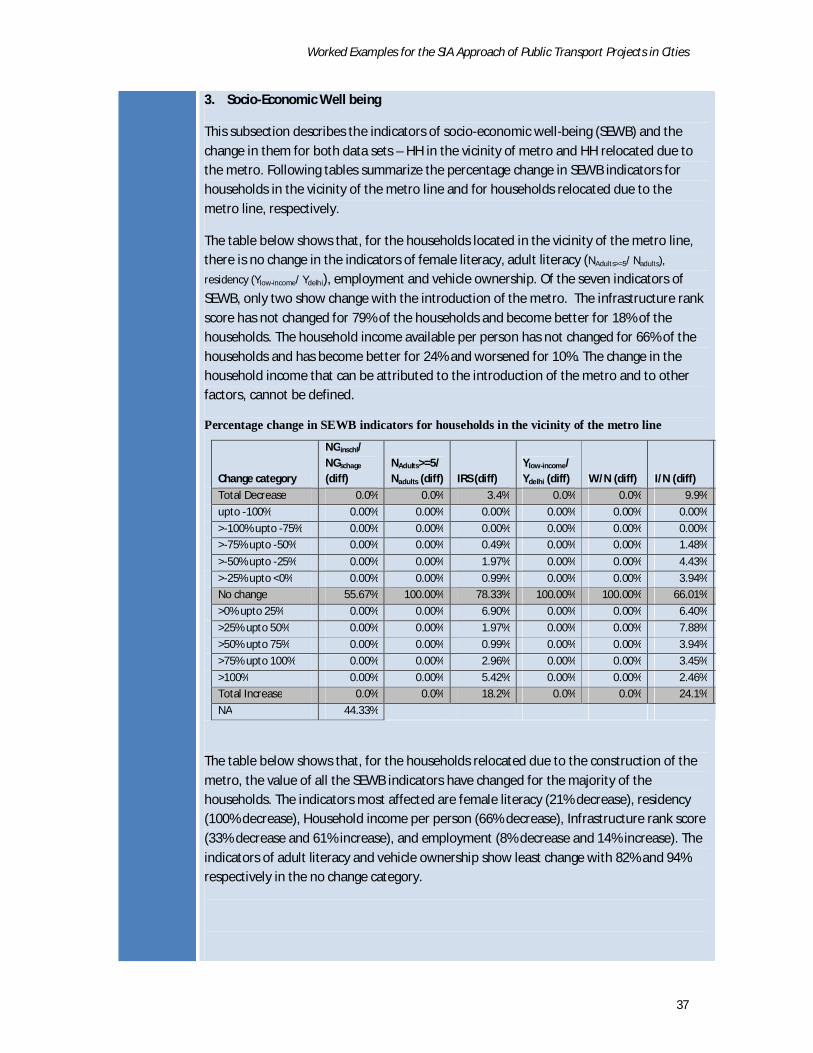
Worked Examples for the SIA Approach of Public Transport Projects in Cities
37
3. Socio-Economic Well being
This subsection describes the indicators of socio-economic well-being (SEWB) and the change in them for both data sets – HH in the vicinity of metro and HH relocated due to the metro. Following tables summarize the percentage change in SEWB indicators for households in the vicinity of the metro line and for households relocated due to the metro line, respectively.
The table below shows that, for the households located in the vicinity of the metro line, there is no change in the indicators of female literacy, adult literacy (NAdults>=5/ Nadults),
residency (Ylow-income/ Ydelhi), employment and vehicle ownership. Of the seven indicators of SEWB, only two show change with the introduction of the metro. The infrastructure rank score has not changed for 79% of the households and become better for 18% of the households. The household income available per person has not changed for 66% of the households and has become better for 24% and worsened for 10%. The change in the household income that can be attributed to the introduction of the metro and to other factors, cannot be defined.
Percentage change in SEWB indicators for households in the vicinity of the metro line
Change category
NGinschl/ NGschage (diff)
NAdults>=5/ Nadults (diff) IRS (diff)
Ylow-income/ Ydelhi (diff) W/N (diff) I/N (diff)
Total Decrease 0.0% 0.0% 3.4% 0.0% 0.0% 9.9%
upto -100% 0.00% 0.00% 0.00% 0.00% 0.00% 0.00%
>-100% upto -75% 0.00% 0.00% 0.00% 0.00% 0.00% 0.00% >-75% upto -50% 0.00% 0.00% 0.49% 0.00% 0.00% 1.48%
>-50% upto -25% 0.00% 0.00% 1.97% 0.00% 0.00% 4.43%
>-25% upto <0% 0.00% 0.00% 0.99% 0.00% 0.00% 3.94% No change 55.67% 100.00% 78.33% 100.00% 100.00% 66.01%
>0% upto 25% 0.00% 0.00% 6.90% 0.00% 0.00% 6.40%
>25% upto 50% 0.00% 0.00% 1.97% 0.00% 0.00% 7.88%
>50% upto 75% 0.00% 0.00% 0.99% 0.00% 0.00% 3.94%
>75% upto 100% 0.00% 0.00% 2.96% 0.00% 0.00% 3.45%
>100% 0.00% 0.00% 5.42% 0.00% 0.00% 2.46% Total Increase 0.0% 0.0% 18.2% 0.0% 0.0% 24.1%
NA 44.33%
The table below shows that, for the households relocated due to the construction of the metro, the value of all the SEWB indicators have changed for the majority of the households. The indicators most affected are female literacy (21% decrease), residency (100% decrease), Household income per person (66% decrease), Infrastructure rank score (33% decrease and 61% increase), and employment (8% decrease and 14% increase). The indicators of adult literacy and vehicle ownership show least change with 82% and 94% respectively in the no change category.

Worked Examples for the SIA Approach of Public Transport Projects in Cities
38
Percentage change in SEWB indicators for households relocated due to the metro line
Change category
NGinschl/ NGschage (diff)
NAdults>=5/ Nadults (diff) IRS (diff)
Ylow-income/ Ydelhi (diff) W/N (diff) I/N (diff)
Total Decrease 20.9% 3.5% 32.8% 100.0% 8.0% 65.7% upto -100% 14.93% 0.00% 0.00% 0.00% 0.50% 0.00%
>-100% upto -75% 0.50% 0.00% 0.00% 98.51% 0.00% 0.50%
>-75% upto -50% 3.48% 0.50% 4.48% 1.49% 5.97% 18.91% >-50% upto -25% 1.99% 0.50% 4.98% 0.00% 1.00% 31.34%
>-25% upto <0% 0.00% 2.49% 23.38% 0.00% 0.50% 14.93%
No change 41.79% 82.09% 5.97% 0.00% 78.11% 19.40% >0% upto 25% 0.00% 1.99% 50.75% 0.00% 0.00% 2.49%
>25% upto 50% 0.00% 5.97% 0.50% 0.00% 0.00% 3.98%
>50% upto 75% 0.00% 0.50% 5.47% 0.00% 0.50% 4.48% >75% upto 100% 4.48% 5.97% 0.00% 0.00% 11.44% 1.49%
>100% 0.00% 0.00% 4.48% 0.00% 1.99% 2.49%
Total Increase 4.5% 14.4% 61.2% 0.0% 13.9% 14.9%
NA 32.84%
4. Testing the hypotheses
Hypotheses 1 and 2, are tested for all the indicators, using t-tests – paired two-sample for means and the results are summarized in the following table. The results show that:
1. For the households living in the vicinity of the metro line there has been significant change in the accessibility provided by the bus transport system, and the status of the physical infrastructure;
2. For the households relocated due to the metro line there has been significant change in the accessibility to urban services and the frequency of bus services amongst the accessibility indicators, use of NMVs and the work trip profile amongst the mobility indicators, and all indicators of SEWB except employment.
Significance of change in indicators due to introduction of metro
No. Type of Indicators
Indicators Significance of change for HH in metro vicinity
Significance of change for HH relocated
At 5% confidence level
At 1% confidence level
At 5% confidence level
At 1% confidence level
1 Accessibility Deducation Not significant Not significant Not significant Not significant2 Dhealth Not significant Not significant Not significant Not significant3 Dservices Not significant Not significant Significant Significant 4 Dbusstop Significant Significant Significant Not significant5 Sbus Significant Significant Significant Significant 6 Mobility PCTRwork Not significant Not significant Not significant Not significant7 PCTRedu Not significant Not significant Not significant Not significant8 PCTRothers Not significant Not significant Not significant Not significant9 Mnmv/Mall Not significant Not significant Significant Significant 10 Dwork Not significant Not significant Significant Significant 11 Deducation Not significant Not significant Significant Not significant12 Dothers Significant Not significant Not significant Not significant13 Twork Not significant Not significant Significant Significant 14 Teducation Not significant Not significant Significant Significant 15 Tothers Significant Not significant Not significant Not significant16 Cwork Not significant Not significant Significant Significant 17 Ceducation Not significant Not significant Not significant Not significant
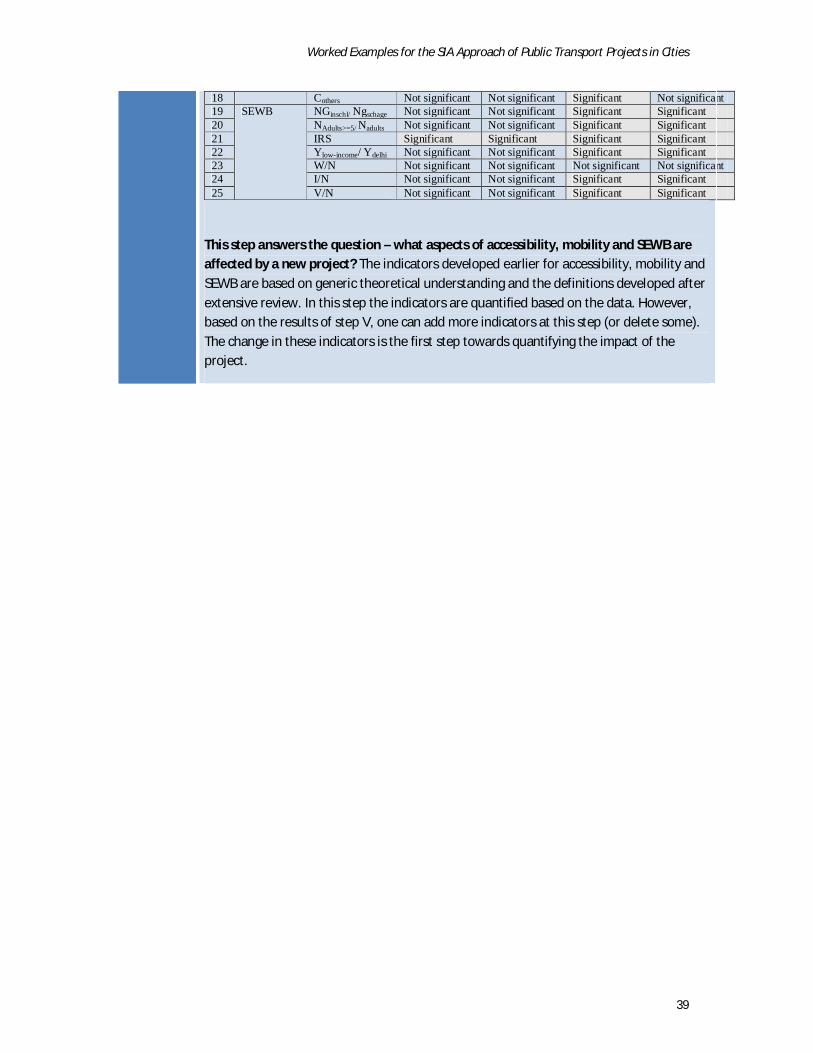
Worked Examples for the SIA Approach of Public Transport Projects in Cities
39
18 Cothers Not significant Not significant Significant Not significant 19 SEWB NGinschl/ Ngschage Not significant Not significant Significant Significant 20 NAdults>=5/ Nadults Not significant Not significant Significant Significant 21 IRS Significant Significant Significant Significant 22 Ylow-income/ Ydelhi Not significant Not significant Significant Significant 23 W/N Not significant Not significant Not significant Not significant 24 I/N Not significant Not significant Significant Significant 25 V/N Not significant Not significant Significant Significant
This step answers the question – what aspects of accessibility, mobility and SEWB are affected by a new project? The indicators developed earlier for accessibility, mobility and SEWB are based on generic theoretical understanding and the definitions developed after extensive review. In this step the indicators are quantified based on the data. However, based on the results of step V, one can add more indicators at this step (or delete some). The change in these indicators is the first step towards quantifying the impact of the project.
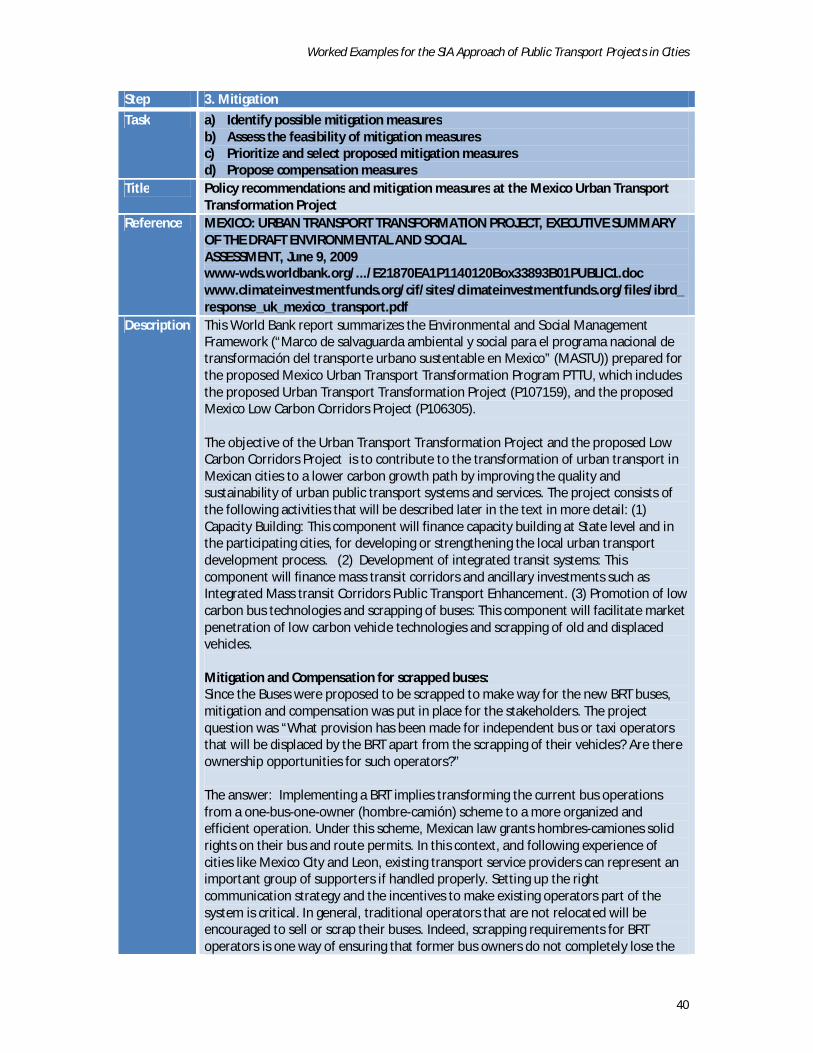
Worked Examples for the SIA Approach of Public Transport Projects in Cities
40
Step 3. Mitigation
Task a) Identify possible mitigation measures b) Assess the feasibility of mitigation measures c) Prioritize and select proposed mitigation measures d) Propose compensation measures
Title Policy recommendations and mitigation measures at the Mexico Urban Transport Transformation Project
Reference MEXICO: URBAN TRANSPORT TRANSFORMATION PROJECT, EXECUTIVE SUMMARY OF THE DRAFT ENVIRONMENTAL AND SOCIAL ASSESSMENT, June 9, 2009 www-wds.worldbank.org/.../E21870EA1P1140120Box33893B01PUBLIC1.doc www.climateinvestmentfunds.org/cif/sites/climateinvestmentfunds.org/files/ibrd_response_uk_mexico_transport.pdf
Description This World Bank report summarizes the Environmental and Social Management Framework (“Marco de salvaguarda ambiental y social para el programa nacional de transformación del transporte urbano sustentable en Mexico” (MASTU)) prepared for the proposed Mexico Urban Transport Transformation Program PTTU, which includes the proposed Urban Transport Transformation Project (P107159), and the proposed Mexico Low Carbon Corridors Project (P106305). The objective of the Urban Transport Transformation Project and the proposed Low Carbon Corridors Project is to contribute to the transformation of urban transport in Mexican cities to a lower carbon growth path by improving the quality and sustainability of urban public transport systems and services. The project consists of the following activities that will be described later in the text in more detail: (1) Capacity Building: This component will finance capacity building at State level and in the participating cities, for developing or strengthening the local urban transport development process. (2) Development of integrated transit systems: This component will finance mass transit corridors and ancillary investments such as Integrated Mass transit Corridors Public Transport Enhancement. (3) Promotion of low carbon bus technologies and scrapping of buses: This component will facilitate market penetration of low carbon vehicle technologies and scrapping of old and displaced vehicles. Mitigation and Compensation for scrapped buses: Since the Buses were proposed to be scrapped to make way for the new BRT buses, mitigation and compensation was put in place for the stakeholders. The project question was “What provision has been made for independent bus or taxi operators that will be displaced by the BRT apart from the scrapping of their vehicles? Are there ownership opportunities for such operators?” The answer: Implementing a BRT implies transforming the current bus operations from a one-bus-one-owner (hombre-camión) scheme to a more organized and efficient operation. Under this scheme, Mexican law grants hombres-camiones solid rights on their bus and route permits. In this context, and following experience of cities like Mexico City and Leon, existing transport service providers can represent an important group of supporters if handled properly. Setting up the right communication strategy and the incentives to make existing operators part of the system is critical. In general, traditional operators that are not relocated will be encouraged to sell or scrap their buses. Indeed, scrapping requirements for BRT operators is one way of ensuring that former bus owners do not completely lose the

Worked Examples for the SIA Approach of Public Transport Projects in Cities
41
value of their vehicle asset, given that new investors will have to buy these. The compensation they receive for the old vehicle will help them to gather the necessary capital to become shareholders of the new operating company. Additionally, scrapping allows for avoiding leakage and locking emission reductions. Besides competing to win the BRT concessions, existing operators can also be relocated to other routes that feed the system, reenter the sector under new types of jobs generated (e.g. drivers, security staff, fare collection staff), or pursue new business opportunities through the creation of small enterprises to provide services linked to the new system. Cities such as Mexico City and León have introduced mechanisms to help the existing owners transition to the new scheme. The transition’s impact has been mitigated through compensation such as: (i) support for capitalization and credits to finance the acquisition of new buses; (ii) distribution of dividends to the hombres-camiones now dubbed shareholders, as a result of higher efficiency and economies of scale of the BRT; and (iii) increased work stability and benefits such as life insurance, health services, and retirement plans.
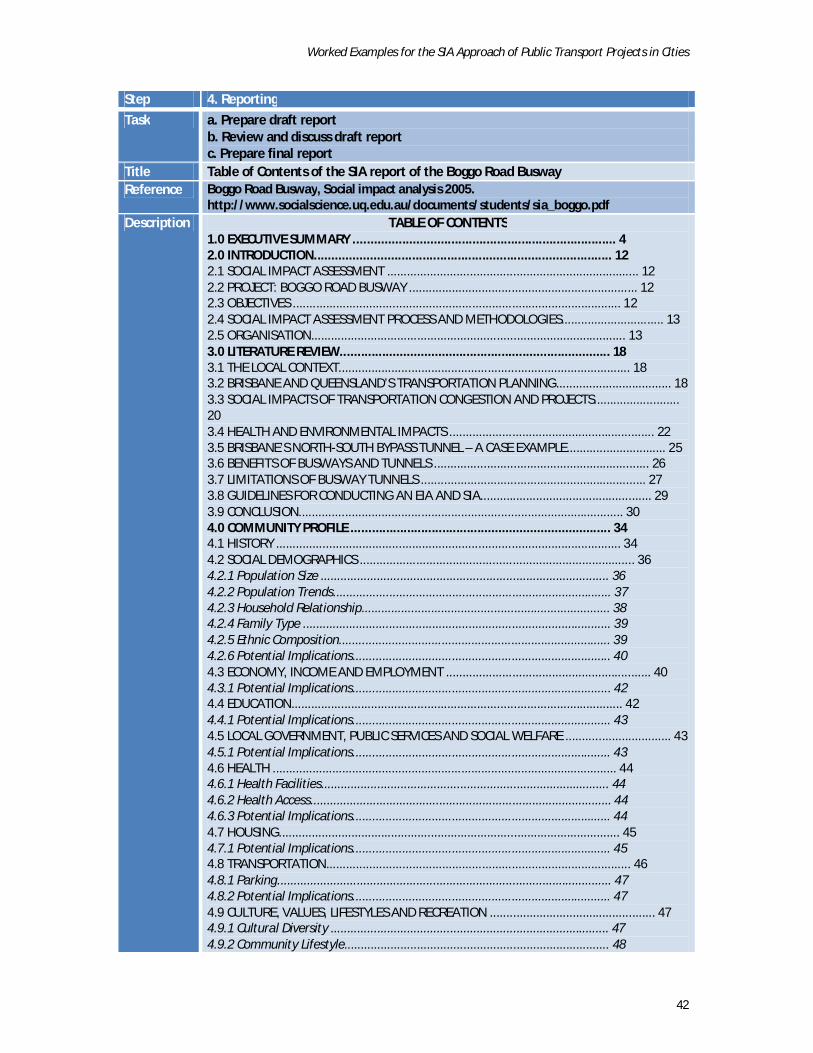
Worked Examples for the SIA Approach of Public Transport Projects in Cities
42
Step 4. Reporting
Task a. Prepare draft report b. Review and discuss draft report c. Prepare final report
Title Table of Contents of the SIA report of the Boggo Road Busway Reference Boggo Road Busway, Social impact analysis 2005.
http://www.socialscience.uq.edu.au/documents/students/sia_boggo.pdf Description TABLE OF CONTENTS
1.0 EXECUTIVE SUMMARY ........................................................................... 4 2.0 INTRODUCTION..................................................................................... 12 2.1 SOCIAL IMPACT ASSESSMENT ............................................................................ 12 2.2 PROJECT: BOGGO ROAD BUSWAY ..................................................................... 12 2.3 OBJECTIVES ................................................................................................... 12 2.4 SOCIAL IMPACT ASSESSMENT PROCESS AND METHODOLOGIES............................... 13 2.5 ORGANISATION............................................................................................... 13 3.0 LITERATURE REVIEW............................................................................. 18 3.1 THE LOCAL CONTEXT........................................................................................ 18 3.2 BRISBANE AND QUEENSLAND’S TRANSPORTATION PLANNING................................... 18 3.3 SOCIAL IMPACTS OF TRANSPORTATION CONGESTION AND PROJECTS.......................... 20 3.4 HEALTH AND ENVIRONMENTAL IMPACTS .............................................................. 22 3.5 BRISBANE’S NORTH-SOUTH BYPASS TUNNEL – A CASE EXAMPLE.............................. 25 3.6 BENEFITS OF BUSWAYS AND TUNNELS ................................................................. 26 3.7 LIMITATIONS OF BUSWAY TUNNELS .................................................................... 27 3.8 GUIDELINES FOR CONDUCTING AN EIA AND SIA.................................................... 29 3.9 CONCLUSION.................................................................................................. 30 4.0 COMMUNITY PROFILE .......................................................................... 34 4.1 HISTORY ........................................................................................................ 34 4.2 SOCIAL DEMOGRAPHICS ................................................................................... 36 4.2.1 Population Size ....................................................................................... 36 4.2.2 Population Trends.................................................................................... 37 4.2.3 Household Relationship........................................................................... 38 4.2.4 Family Type ............................................................................................. 39 4.2.5 Ethnic Composition.................................................................................. 39 4.2.6 Potential Implications.............................................................................. 40 4.3 ECONOMY, INCOME AND EMPLOYMENT .............................................................. 40 4.3.1 Potential Implications.............................................................................. 42 4.4 EDUCATION.................................................................................................... 42 4.4.1 Potential Implications.............................................................................. 43 4.5 LOCAL GOVERNMENT, PUBLIC SERVICES AND SOCIAL WELFARE ................................ 43 4.5.1 Potential Implications.............................................................................. 43 4.6 HEALTH ........................................................................................................ 44 4.6.1 Health Facilities....................................................................................... 44 4.6.2 Health Access........................................................................................... 44 4.6.3 Potential Implications.............................................................................. 44 4.7 HOUSING....................................................................................................... 45 4.7.1 Potential Implications.............................................................................. 45 4.8 TRANSPORTATION............................................................................................ 46 4.8.1 Parking..................................................................................................... 47 4.8.2 Potential Implications.............................................................................. 47 4.9 CULTURE, VALUES, LIFESTYLES AND RECREATION .................................................. 47 4.9.1 Cultural Diversity .................................................................................... 47 4.9.2 Community Lifestyle................................................................................ 48
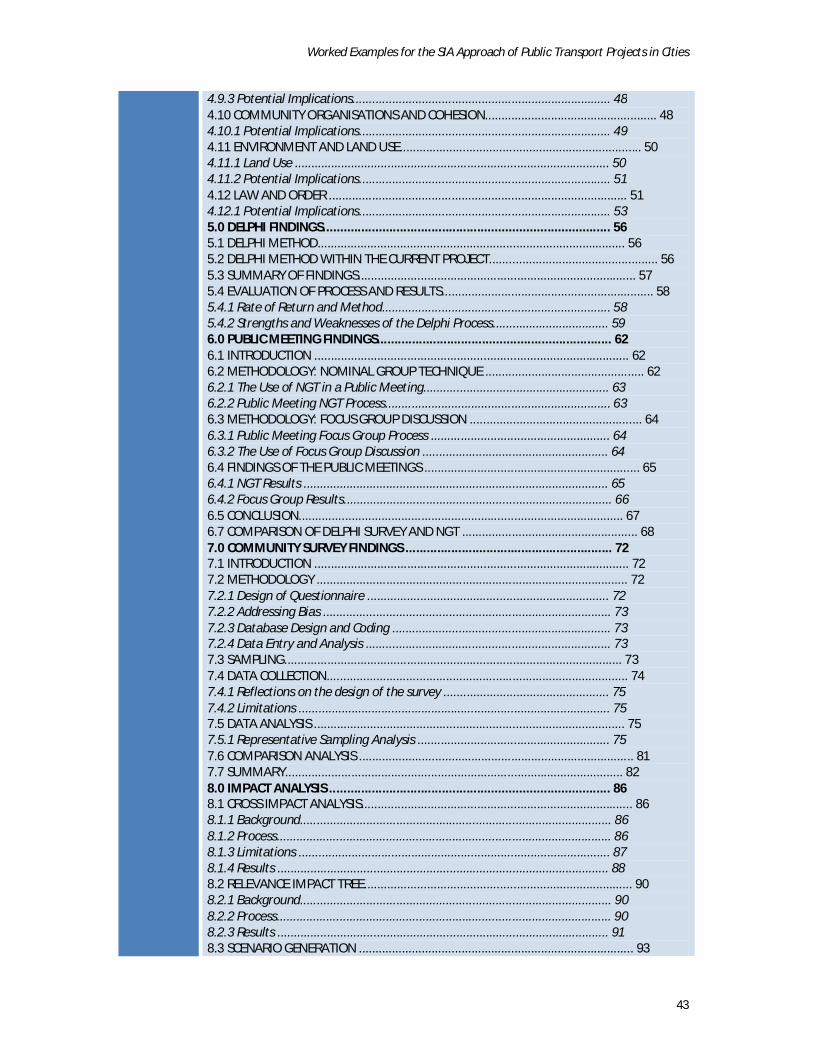
Worked Examples for the SIA Approach of Public Transport Projects in Cities
43
4.9.3 Potential Implications.............................................................................. 48 4.10 COMMUNITY ORGANISATIONS AND COHESION.................................................... 48 4.10.1 Potential Implications............................................................................ 49 4.11 ENVIRONMENT AND LAND USE......................................................................... 50 4.11.1 Land Use ............................................................................................... 50 4.11.2 Potential Implications............................................................................ 51 4.12 LAW AND ORDER .......................................................................................... 51 4.12.1 Potential Implications............................................................................ 53 5.0 DELPHI FINDINGS.................................................................................. 56 5.1 DELPHI METHOD............................................................................................. 56 5.2 DELPHI METHOD WITHIN THE CURRENT PROJECT................................................... 56 5.3 SUMMARY OF FINDINGS.................................................................................... 57 5.4 EVALUATION OF PROCESS AND RESULTS................................................................ 58 5.4.1 Rate of Return and Method..................................................................... 58 5.4.2 Strengths and Weaknesses of the Delphi Process................................... 59 6.0 PUBLIC MEETING FINDINGS................................................................... 62 6.1 INTRODUCTION ............................................................................................... 62 6.2 METHODOLOGY: NOMINAL GROUP TECHNIQUE ................................................ 62 6.2.1 The Use of NGT in a Public Meeting........................................................ 63 6.2.2 Public Meeting NGT Process.................................................................... 63 6.3 METHODOLOGY: FOCUS GROUP DISCUSSION .................................................... 64 6.3.1 Public Meeting Focus Group Process ...................................................... 64 6.3.2 The Use of Focus Group Discussion ........................................................ 64 6.4 FINDINGS OF THE PUBLIC MEETINGS ................................................................. 65 6.4.1 NGT Results ............................................................................................ 65 6.4.2 Focus Group Results................................................................................. 66 6.5 CONCLUSION.................................................................................................. 67 6.7 COMPARISON OF DELPHI SURVEY AND NGT ..................................................... 68 7.0 COMMUNITY SURVEY FINDINGS ........................................................... 72 7.1 INTRODUCTION ............................................................................................... 72 7.2 METHODOLOGY .............................................................................................. 72 7.2.1 Design of Questionnaire ......................................................................... 72 7.2.2 Addressing Bias ....................................................................................... 73 7.2.3 Database Design and Coding .................................................................. 73 7.2.4 Data Entry and Analysis .......................................................................... 73 7.3 SAMPLING...................................................................................................... 73 7.4 DATA COLLECTION........................................................................................... 74 7.4.1 Reflections on the design of the survey .................................................. 75 7.4.2 Limitations .............................................................................................. 75 7.5 DATA ANALYSIS .............................................................................................. 75 7.5.1 Representative Sampling Analysis .......................................................... 75 7.6 COMPARISON ANALYSIS ................................................................................... 81 7.7 SUMMARY...................................................................................................... 82 8.0 IMPACT ANALYSIS ................................................................................ 86 8.1 CROSS IMPACT ANALYSIS.................................................................................. 86 8.1.1 Background.............................................................................................. 86 8.1.2 Process..................................................................................................... 86 8.1.3 Limitations .............................................................................................. 87 8.1.4 Results .................................................................................................... 88 8.2 RELEVANCE IMPACT TREE................................................................................. 90 8.2.1 Background.............................................................................................. 90 8.2.2 Process..................................................................................................... 90 8.2.3 Results .................................................................................................... 91 8.3 SCENARIO GENERATION ................................................................................... 93
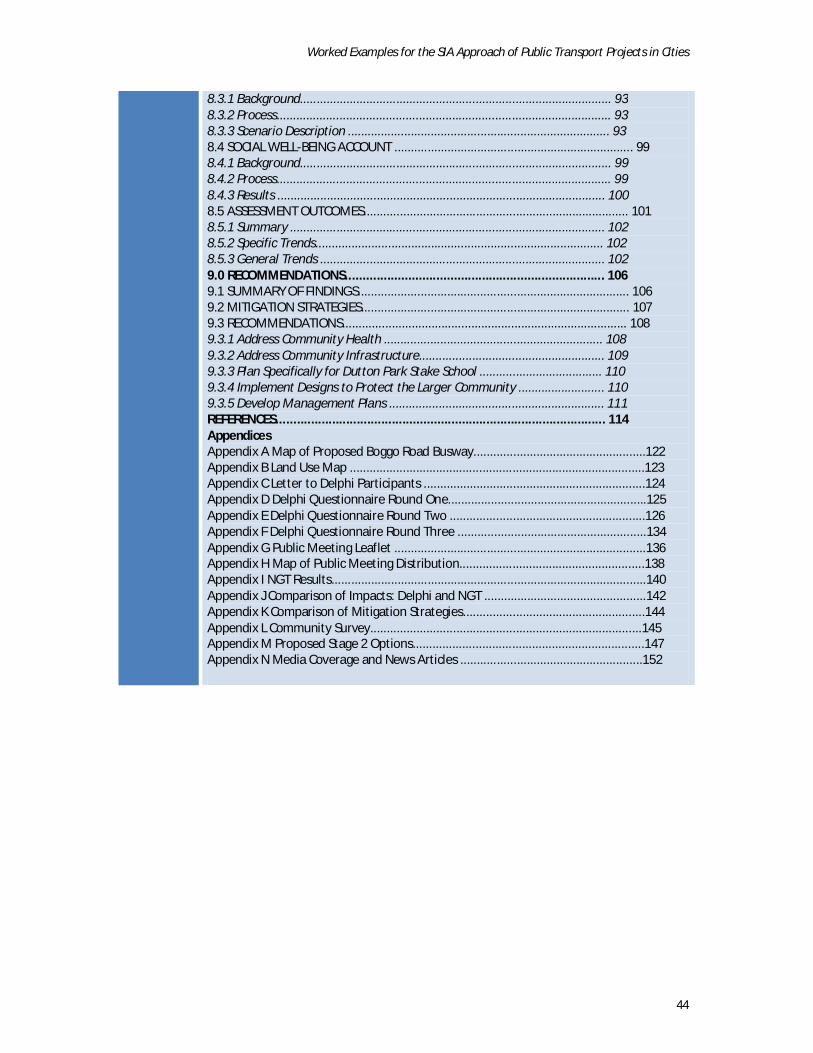
Worked Examples for the SIA Approach of Public Transport Projects in Cities
44
8.3.1 Background.............................................................................................. 93 8.3.2 Process..................................................................................................... 93 8.3.3 Scenario Description ............................................................................... 93 8.4 SOCIAL WELL-BEING ACCOUNT ........................................................................ 99 8.4.1 Background.............................................................................................. 99 8.4.2 Process..................................................................................................... 99 8.4.3 Results ................................................................................................... 100 8.5 ASSESSMENT OUTCOMES................................................................................ 101 8.5.1 Summary ............................................................................................... 102 8.5.2 Specific Trends....................................................................................... 102 8.5.3 General Trends ...................................................................................... 102 9.0 RECOMMENDATIONS.......................................................................... 106 9.1 SUMMARY OF FINDINGS.................................................................................. 106 9.2 MITIGATION STRATEGIES................................................................................. 107 9.3 RECOMMENDATIONS...................................................................................... 108 9.3.1 Address Community Health .................................................................. 108 9.3.2 Address Community Infrastructure........................................................ 109 9.3.3 Plan Specifically for Dutton Park Stake School ..................................... 110 9.3.4 Implement Designs to Protect the Larger Community .......................... 110 9.3.5 Develop Management Plans ................................................................. 111 REFERENCES.............................................................................................. 114 Appendices Appendix A Map of Proposed Boggo Road Busway....................................................122 Appendix B Land Use Map .........................................................................................123 Appendix C Letter to Delphi Participants ...................................................................124 Appendix D Delphi Questionnaire Round One............................................................125 Appendix E Delphi Questionnaire Round Two ...........................................................126 Appendix F Delphi Questionnaire Round Three .........................................................134 Appendix G Public Meeting Leaflet ............................................................................136 Appendix H Map of Public Meeting Distribution........................................................138 Appendix I NGT Results...............................................................................................140 Appendix J Comparison of Impacts: Delphi and NGT .................................................142 Appendix K Comparison of Mitigation Strategies.......................................................144 Appendix L Community Survey..................................................................................145 Appendix M Proposed Stage 2 Options......................................................................147 Appendix N Media Coverage and News Articles .......................................................152
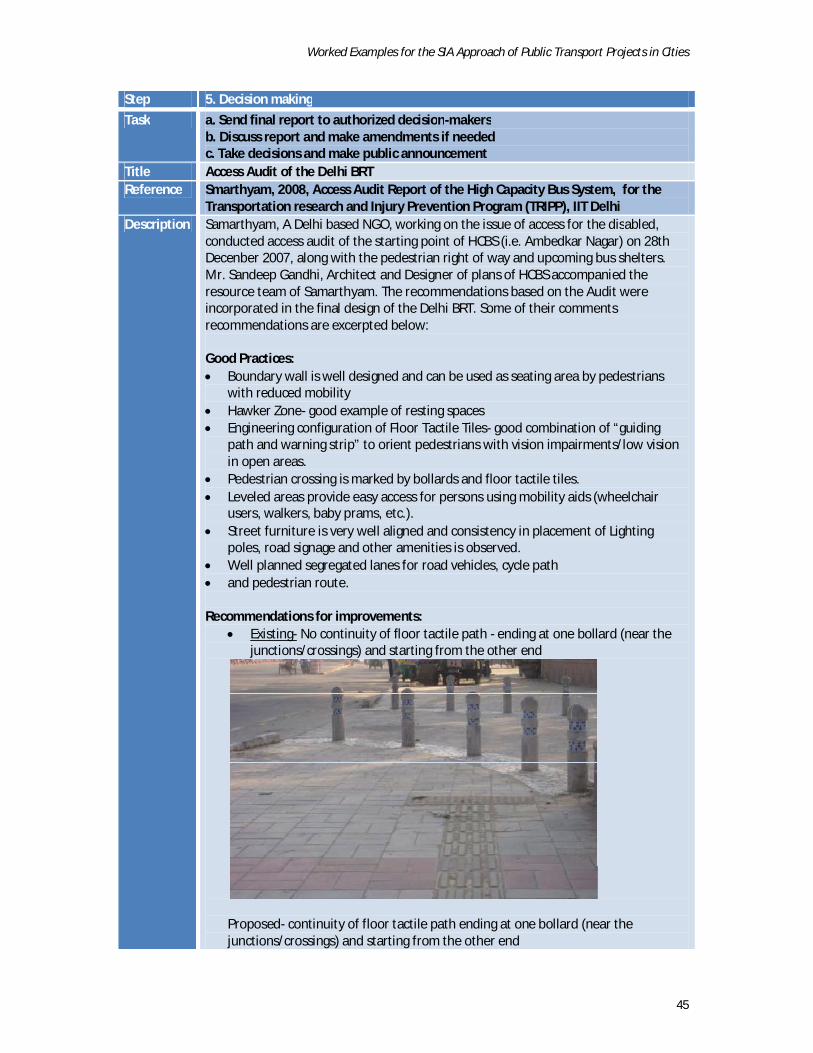
Worked Examples for the SIA Approach of Public Transport Projects in Cities
45
Step 5. Decision making
Task a. Send final report to authorized decision-makers b. Discuss report and make amendments if needed c. Take decisions and make public announcement
Title Access Audit of the Delhi BRT Reference Smarthyam, 2008, Access Audit Report of the High Capacity Bus System, for the
Transportation research and Injury Prevention Program (TRIPP), IIT Delhi Description Samarthyam, A Delhi based NGO, working on the issue of access for the disabled,
conducted access audit of the starting point of HCBS (i.e. Ambedkar Nagar) on 28th Decenber 2007, along with the pedestrian right of way and upcoming bus shelters. Mr. Sandeep Gandhi, Architect and Designer of plans of HCBS accompanied the resource team of Samarthyam. The recommendations based on the Audit were incorporated in the final design of the Delhi BRT. Some of their comments recommendations are excerpted below: Good Practices: Boundary wall is well designed and can be used as seating area by pedestrians
with reduced mobility Hawker Zone- good example of resting spaces Engineering configuration of Floor Tactile Tiles- good combination of “guiding
path and warning strip” to orient pedestrians with vision impairments/low vision in open areas.
Pedestrian crossing is marked by bollards and floor tactile tiles. Leveled areas provide easy access for persons using mobility aids (wheelchair
users, walkers, baby prams, etc.). Street furniture is very well aligned and consistency in placement of Lighting
poles, road signage and other amenities is observed. Well planned segregated lanes for road vehicles, cycle path and pedestrian route. Recommendations for improvements:
Existing- No continuity of floor tactile path - ending at one bollard (near the junctions/crossings) and starting from the other end
Proposed- continuity of floor tactile path ending at one bollard (near the junctions/crossings) and starting from the other end
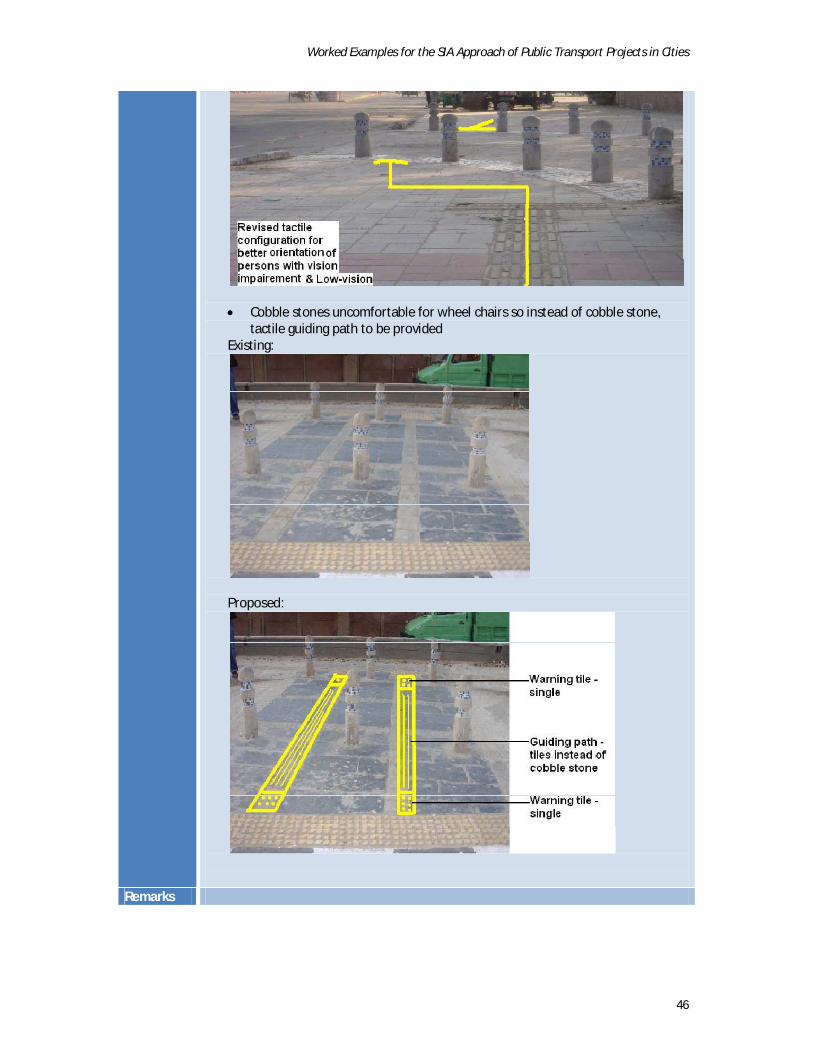
Worked Examples for the SIA Approach of Public Transport Projects in Cities
46
Cobble stones uncomfortable for wheel chairs so instead of cobble stone, tactile guiding path to be provided
Existing:
Proposed:
Remarks

Worked Examples for the SIA Approach of Public Transport Projects in Cities
47
Step 6. Monitoring and managing
Task a. Implement the monitoring and management plan b. Conduct an independent evaluation
Title Completion and Evaluation Guidelines by ADB for transport projects Reference http://www.adb.org/Documents/Books/Transport-Projects-Social-
Analysis/Transport-Social-Analysis.pdf Description Completion and Evaluation
Project completion reports are prepared by ADB staff 12–14 months after completing a project to summarize lessons learned. The reports generally include the following social analysis for transport sector projects: assessment of the quality and depth of the process of stakeholder engagement, and its key achievements; assessment of the extent to which stakeholders continued to influence project progress during construction and operation, and their levels of satisfaction; assessment of the extent to which social plans and measures have been implemented and financed, identifying any problems encountered; assessment of whether such social plans and measures achieved their objectives; assessment of the extent to which specified groups participated and benefited (for example, local laborers and suppliers, women, the poor, the elderly, and the disabled); assessment of the extent to which the executing and implementing agencies were able to support stakeholder engagement, social plans, and measures as specified in the design; identification of social risks to project success and sustainability in the future; identification of any outstanding remedial action needed; and identification of lessons learned for future projects.
Worked Examples for the SIA Approach of Public Transport Projects in Cities
48
Step 7. Public consultation
Task a. Identify potential beneficiaries and other affected groups b. Decide on approach for public consultation including assessment methods c. Hold the public consultation d. Incorporate results from public consultation in relevant SIA steps
Title Community Participation, Grievance Redressal Mechanism and details of Public Hearing for Pimpri Chinchwad BRT resettlement Plan, India
Reference India - Sustainable Urban Transport Project : Resettlement action plan for the proposed Bus Rapid Transit System Project in Pimpri Chinchwad, Maharashtra, India http://www-wds.worldbank.org/external/default/ main?pagePK=64193027&piPK=64187937&theSitePK=523679&menuPK=64187510&searchMenuPK=64187511&cid=3001&entityID=000334955_20090609032111
Description Introduction Participation of the stakeholders in the process of development has a vital significance. Participation helps in smooth implementation and effective monitoring of the developmental activities. For any development need driven approach will be adopted rather than imposed development approach. In this view sustained efforts will be made to generate needs of development. For this process social education at various levels will be imparted so that convincing people about proposed development becomes easier. Once the people are convinced the community-based action will get instituted. After providing sufficient motivation and encouraging people for the development, people will come forward with their own problems to get appropriate solutions. This process is very gradual but significant for smooth implementation of involuntary replacement. In this process the Pimpri Chinchwad Municipal Corporation (PCMC )will come to know the dynamics of the community and its dimensions, which are closely associated with development process. Community resistance is an inherent aspect in any development process. There is a resistance for two main reasons.
1. Probably the people are not aware about the benefits they will gain from the development at individual level and at community level and
2. People are worried about the losses. Due to these reasons people are often anxious. To dilute this anxiety community based efforts will be needed which is the part and parcel of development in the proposed project. Consultation and Participation Mechanism For public consultation and participation the key persons in the family will be taken into confidence about the proposed project. This will help to reduce inherent resistance. It is proposed to conduct public redressal mechanism. In the first stage a committee will be instituted, which will represent PCMC officials, public representatives and local people. Through this committee the problems and grievances of the local people will be resolved. For the proposed project PCMC has already appealed to the people for their comments in local newspaper and organized the public hearing. In the process of public hearing it is expected that people will come with their own perception and will get clarification if there is some wrong understanding of miss information. Consultative Process

Worked Examples for the SIA Approach of Public Transport Projects in Cities
49
At the outset of every stage of planning, all the stakeholders will be taken into consideration and given due status. To implement the approved plan, land is the basic commodity. It is important to know the ownership of land that is being affected by the Development Plan (DP) under the roads and reservations categories. It is necessary to mark the plans on ground. In order to reduce negative impacts on people who already own lands in the region, it is decided to undertake the marking exercise before the plan is finalized so that people will be aware of the roads and reservations of the DP in their owned lands. Since people are aware of DP details, they would undertake construction activities keeping the DP and DCR's in mind. PCMC has taken initiative the process of voluntary surrender of land by affected people. Compensation schemes include monetary compensation, additional FSI (Floor Space Index) and Transferable Development Right (TDR). This will help to save considerable amount of time, is in the interest of development projects. The concerned landowners also get the required compensation at an early in this process. This situation needs high degree of involvement and participation of the people, rather than just enforcement of the rules and bylaws. In order to address this aspect, PCMC holds a Gramsabha as frequently as required where the officials visit the villages and initiate a dialogue with them, and appraising them on the importance and advantages of the projects, compensations, bylaws and clarifying any misconceptions. They are also informed about the benefits that can be accrued by them in the long term and the various options of compensation that can be availed. Accordingly, the Gramsabhas were conducted in a corodial and peaceful environment. These meetings become very effective as the local representative of respective local areas invariably supports from them. Their role in convincing the people and at the same time in putting forth the demands and expectations of the people before the administration is very vital in conveying the project details and the benefits of infrastructure projects. The Proposed Arrangement for Consultation and participation To get the active participation of the community at various levels, it is proposed to constitute various committees at community level. These committees will resolve the difference of opinions or grievances if any. It will also help to solve the difficulties at local level. In this task, professional social workers will be appointed and residential community volunteers will assist them. These communities will mainly help to expedite the process of problem solving and bringing the excluded population in the main stream of decision-making at community level. The following committees and their structure is proposed:
1. Apex Committee will consist of commissioner, Mayor and standing committee chairman. Monitoring committee will assist this and it will consist of competent authority, public representatives, representatives of PAP, social workers, consultants etc. At root level committee will be constituted and will consist of public representatives, social workers, RCV, Opinion Leaders etc.
2. Documentation Committee 3. Financial matter related committee 4. Following, feedback, sustainability 5. Social Audit Committee
Worked Examples for the SIA Approach of Public Transport Projects in Cities
50
6. Quality Control Committee 7. Income Generation and Livelihood Resource Restoration Advisory Committee 8. Conflict Resolution Committee 9. Social Action Committee 10. Legal Aid Committee
The community consultation and their issues in the project In the BRT corridor, consultations from various levels have a special significance. This consultation is needed for smooth implementation of the project. Main task is acquisition of land where structures are already built to vacate the land is a complex process. With the mutual understanding help and co-operation acquisition of land will be undertaken. As per the rehabilitation policy of World Bank, the population, which will suffer by this project, should be rehabilitated with adequate means. To adhere to these policies, the PAP who will lose their land or house or livelihood resource of employment will be given due compensation along with various options to restore their condition as before. However the structures, which are illegal or unauthorized, may create the problem in implementation process. However to address their problem, local level committees as shown in the above chart will take care of PAP. Therefore it is proposed to conduct the meetings at root level continuously so that the PAP will have direct access as per their convenience at community level. Follow up community consultation and participation A continuous follow up will be done on the difficulties placed by PAP in front of concerned committee. Due consideration will be given to expedite the matter which they feel highly significant. As it is associated and linked with local people their problems are expected to solve at an early stage which will help in smooth implementation of the project. In this task some of the NGOs working in slum areas will be deployed in getting active and voluntary participation of the community in development process. Indeed social education, community organization and motivation will be taken on top priority basis. The interaction of NGO, CBO and expert will help to create awareness among the people. This committee will also advise on various issues raised by the people so that without comprising the intensity of the problems of the PAP it will be solved at early stage as per schedule. Institutional Framework for Grievance Redressal PCMC has well-established arrangement for grievance redressal. The stakeholders or any citizen can place their complaints with concerned officials or they can place the complaints with commissioner. The provision is made to solve the difficulties and the problems within a weeks' period. At every Ward Office, Complain Box in kept, which is being opened every week and complains are sent to respective departments. PCMC has already appointed the Public Relation Officer, who takes care of complains placed by the citizens. As regard to the BRT project, the competent authority is also working as a social officer who is assisted by 3-4 Professional Social Workers. He will take care of complaints of the respective citizens. In the BRT Corridor, for consultation and participation, community will be taken into confidence about the proposed project and the resettlement policy with the help of Professional Social Workers, Opinion Leaders and Community Development Volunteers. However, it is already going on and will be continued till the competition of BRT work.
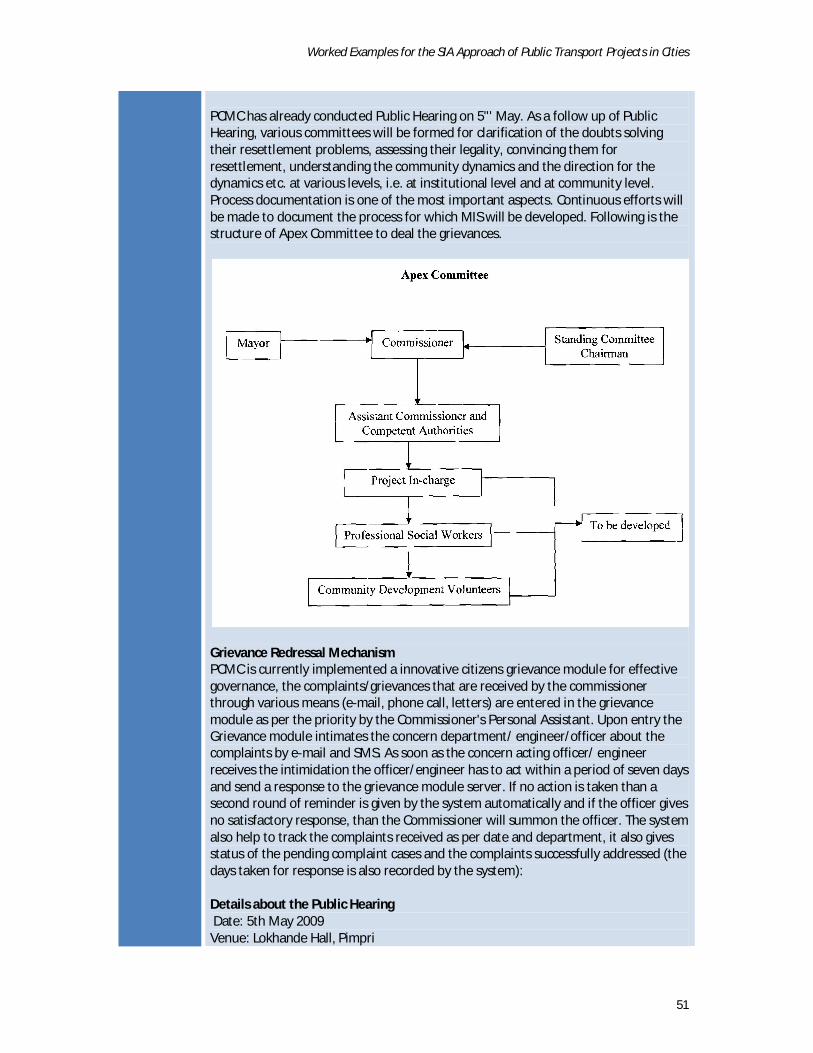
Worked Examples for the SIA Approach of Public Transport Projects in Cities
51
PCMC has already conducted Public Hearing on 5"' May. As a follow up of Public Hearing, various committees will be formed for clarification of the doubts solving their resettlement problems, assessing their legality, convincing them for resettlement, understanding the community dynamics and the direction for the dynamics etc. at various levels, i.e. at institutional level and at community level. Process documentation is one of the most important aspects. Continuous efforts will be made to document the process for which MIS will be developed. Following is the structure of Apex Committee to deal the grievances.
Grievance Redressal Mechanism PCMC is currently implemented a innovative citizens grievance module for effective governance, the complaints/grievances that are received by the commissioner through various means (e-mail, phone call, letters) are entered in the grievance module as per the priority by the Commissioner's Personal Assistant. Upon entry the Grievance module intimates the concern department/ engineer/officer about the complaints by e-mail and SMS. As soon as the concern acting officer/ engineer receives the intimidation the officer/engineer has to act within a period of seven days and send a response to the grievance module server. If no action is taken than a second round of reminder is given by the system automatically and if the officer gives no satisfactory response, than the Commissioner will summon the officer. The system also help to track the complaints received as per date and department, it also gives status of the pending complaint cases and the complaints successfully addressed (the days taken for response is also recorded by the system): Details about the Public Hearing Date: 5th May 2009 Venue: Lokhande Hall, Pimpri
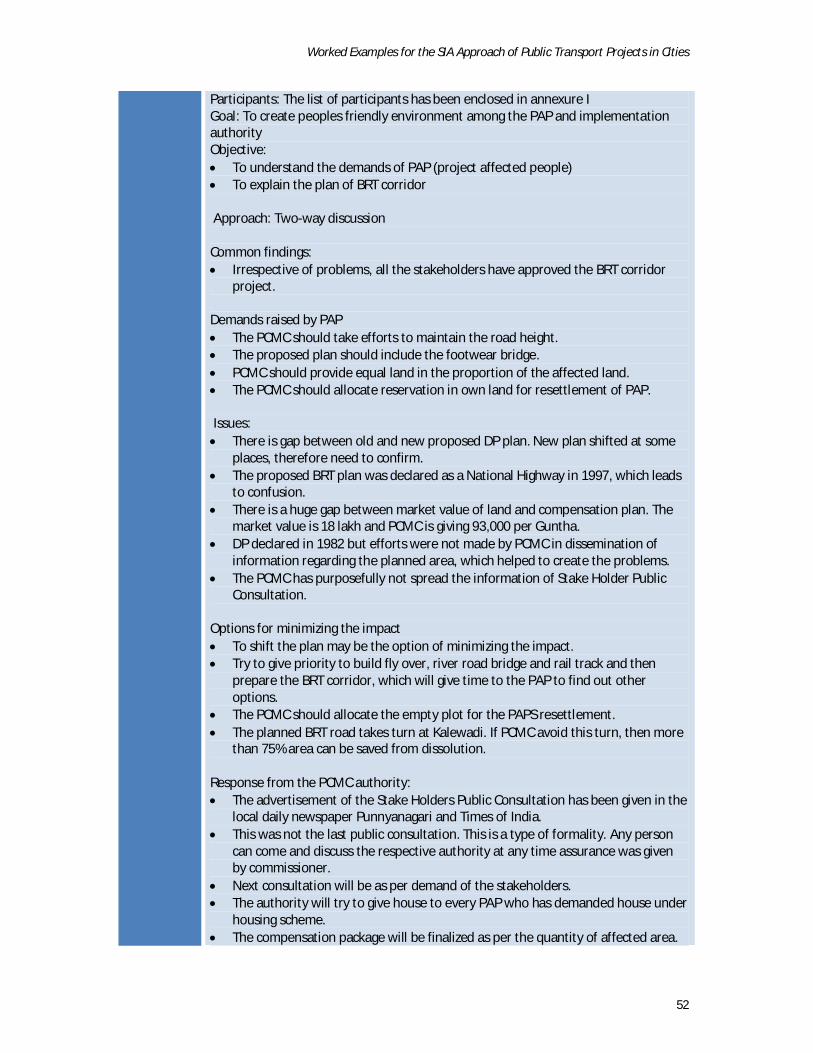
Worked Examples for the SIA Approach of Public Transport Projects in Cities
52
Participants: The list of participants has been enclosed in annexure I Goal: To create peoples friendly environment among the PAP and implementation authority Objective: To understand the demands of PAP (project affected people) To explain the plan of BRT corridor Approach: Two-way discussion Common findings: Irrespective of problems, all the stakeholders have approved the BRT corridor
project. Demands raised by PAP The PCMC should take efforts to maintain the road height. The proposed plan should include the footwear bridge. PCMC should provide equal land in the proportion of the affected land. The PCMC should allocate reservation in own land for resettlement of PAP. Issues: There is gap between old and new proposed DP plan. New plan shifted at some
places, therefore need to confirm. The proposed BRT plan was declared as a National Highway in 1997, which leads
to confusion. There is a huge gap between market value of land and compensation plan. The
market value is 18 lakh and PCMC is giving 93,000 per Guntha. DP declared in 1982 but efforts were not made by PCMC in dissemination of
information regarding the planned area, which helped to create the problems. The PCMC has purposefully not spread the information of Stake Holder Public
Consultation. Options for minimizing the impact To shift the plan may be the option of minimizing the impact. Try to give priority to build fly over, river road bridge and rail track and then
prepare the BRT corridor, which will give time to the PAP to find out other options.
The PCMC should allocate the empty plot for the PAPS resettlement. The planned BRT road takes turn at Kalewadi. If PCMC avoid this turn, then more
than 75% area can be saved from dissolution. Response from the PCMC authority: The advertisement of the Stake Holders Public Consultation has been given in the
local daily newspaper Punnyanagari and Times of India. This was not the last public consultation. This is a type of formality. Any person
can come and discuss the respective authority at any time assurance was given by commissioner.
Next consultation will be as per demand of the stakeholders. The authority will try to give house to every PAP who has demanded house under
housing scheme. The compensation package will be finalized as per the quantity of affected area.
Worked Examples for the SIA Approach of Public Transport Projects in Cities
53
To shift the DP or road is not technically feasible. The authority will cross check the old and new plan and the place where it
shifted. Own observations: The planned activity of Stake Holder Public Consultation of BRT Corridor Project
was a good initiative of PCMC, which was planned as per section 6 (2) of "The Rehabilitation and Resettlement Bill 2007."
PAP point of view: There is a need to study the proposed plan. There is a huge gap between the ways, which they have selected to putting the
demand. They don't have unity. There is a need to study the related policies, programmes and legislation. PCMC point of view: PCMC authority has not clear about the proposed plan. Therefore they fail to give
the satisfactory answer of raised questions by PAP or own the trust of people.