Embed Size (px)
Citation preview
CHAPTER
Social Infrastructure, Employment and Human Development
09
The economic performance of a country goes beyond increases in Gross Domestic Product and Per Capita Incomes and encompasses enhancement of opportunities and improvement in social infrastructure such as education, health, housing and housing amenities; levels of employment and employability of the nationals, proportion and number of poor; is reflected by individual indices such as enrolment and literacy ratios, mortality rates, spread of immunisation, control of major diseases; access to safe drinking water and toilets and captured by an aggregate human development index, which needs to be calculated annually state-wise. All this economic development has to be in an inclusive manner covering the deprived/marginal sections including women and all states.
9.2 Social infrastructure with its positive externalities has a significant role in the economic development of a country. It is empirically proven and widely recognized that education and health impact the growth of an economy. Investing in human capital by way of education, skill development, training and provision of health care facilities enhances the productivity of the workforce and welfare of the population. In India, the proportion of economically active population (15-59 years) has increased from 57.7 per cent to 63.3 per cent during 1991 to 2013, as per Sample Registration System (SRS) data for 2013. If India has to reap the benefits of this ‘demographic dividend’ in the years ahead, it is imperative that investments in social infrastructure are made in appropriate measure to achieve the desired educational and health outcomes. India has to evolve a multi-pronged strategy with focus on bridging the gaps in access to social infrastructure through appropriate use of innovative technologies for enhancement of human potential for
productive employment in various sectors and for improving the quality of life.
Trends in social secTor expendiTure
9.3 As a proportion of the Gross Domestic Product (GDP), expenditure on education has hovered around 3 per cent during 2008-09 to 2014-15. Similarly, there has not been any significant change in the expenditure on health as a proportion of GDP and it has remained stagnant at less than 2 per cent during the same period. During 2013-14, out of the total expenditure on social services, 11.6 per cent was spent on education, while 4.6 per cent was spent on health (Table 9.1).
9.4 At the state level, in 2013-14, the total state capital expenditure on education was R110,894 million. Of this, Tamil Nadu had the highest share in the expenditure of about 12 per cent, followed by Uttar Pradesh with a share of 8.67 per cent and Gujarat with 6.67 per cent. However, in terms of per student expenditure, Sikkim and Goa spent more than R2000, while Tamil Nadu spent about R726. States such as
193Social Infrastructure, Employment and Human Development
Table 9.1: Trends in Social Services Expenditure by Government (Centre and States)Item/ Year 2008-09 2009-10 2010-11 2011-12 2012-13 2013-14 2014-15
RE2015-16
BE
As percentage to GDP
Total Expenditure 28.4 28.6 27.6 27.4 27.0 26.2 28.1 27.0Expenditure on social services
6.8 6.9 6.8 6.6 6.6 6.5 7.0 6.7
of which: i) Education 2.9 3.0 3.1 3.1 3.1 3.0 3.1 3.0ii) Health 1.3 1.4 1.3 1.2 1.3 1.2 1.3 1.3iii) Others 2.6 2.5 2.4 2.2 2.2 2.3 2.6 2.4
As percentage to total expenditure
Expenditure on social services
23.8 24.1 24.7 24.0 24.4 24.8 24.9 24.9
of which: i) Education 10.1 10.6 11.4 11.4 11.6 11.6 10.9 11.2ii) Health 4.6 4.8 4.7 4.6 4.7 4.6 4.8 4.9iii) Others 9.0 8.7 8.6 8.0 8.2 8.6 9.1 8.9
As percentage to social services
i) Education 42.6 44.1 46.1 47.7 47.5 46.7 44.0 44.9ii) Health 19.5 19.7 19.0 19.0 19.1 18.6 19.3 19.5iii) Others 37.9 36.1 34.9 33.3 33.4 34.7 36.7 35.6
Source: Budget Documents of Union and State Governments.
Notes: 1. Social services includes, education, sports, art and culture; medical and public health, family welfare; water supply and sanitation; housing; urban development; welfare of Scheduled Castes (SC), Scheduled Tribes (ST) and Other Backward Castes (OBC); labour and labour welfare; and social security and welfare, nutrition, relief on account of natural calamities.
2. Expenditure on 'Education' pertains to expenditure on 'Education, Sports, Arts and Culture'.
3. Expenditure on 'Health' includes expenditure on 'Medical and Public Health', 'Family Welfare' and 'Water Supply and Sanitation'.
4. Data for states from 2013-14 onwards is provisional and pertain to budgets of 25 state governments.
5. GDP data from 2011-12 is based on new base year 2011-12.
Rajasthan and Madhya Pradesh spent as little as R37 and R40 per student respectively.
9.5 Though the expenditure on social sectors in India has not reflected an increasing trend, an increase in expenditure per-se may not always guarantee appropriate outcomes and achievements. The efficiency of expenditure incurred so far can be assessed by the performance of social sectors through various social indicators. An overall assessment of social sector expenditures in terms of achievements shows that wide gaps still exist in educational and health outcomes and there
is need for substantial improvement and the need to remove inequalities in India.
educaTional challenges
9.6 The trends in enrolment reflect a decline in the percentage of enrolment in government schools in rural areas, from 72.9 per cent in 2007 to 63.1 per cent in 2014, as per the Annual Status of Education Report (ASER) 2014. This decline is partly made up by private schools which have registered an increase in enrolment from 20.2 per cent in 2007 to 30.7 per cent in 2014. In addition to the need to increase the percentage of enrolment substantially to
194 Economic Survey 2015-16
achieve universalization of education, concerns about the decline in enrolment in government schools need to be identified and addressed. Decline in enrolment in government schools and some shift to private schools might be largely related to the poor quality of education offered in government schools, since it is free or offered for a nominal fee.
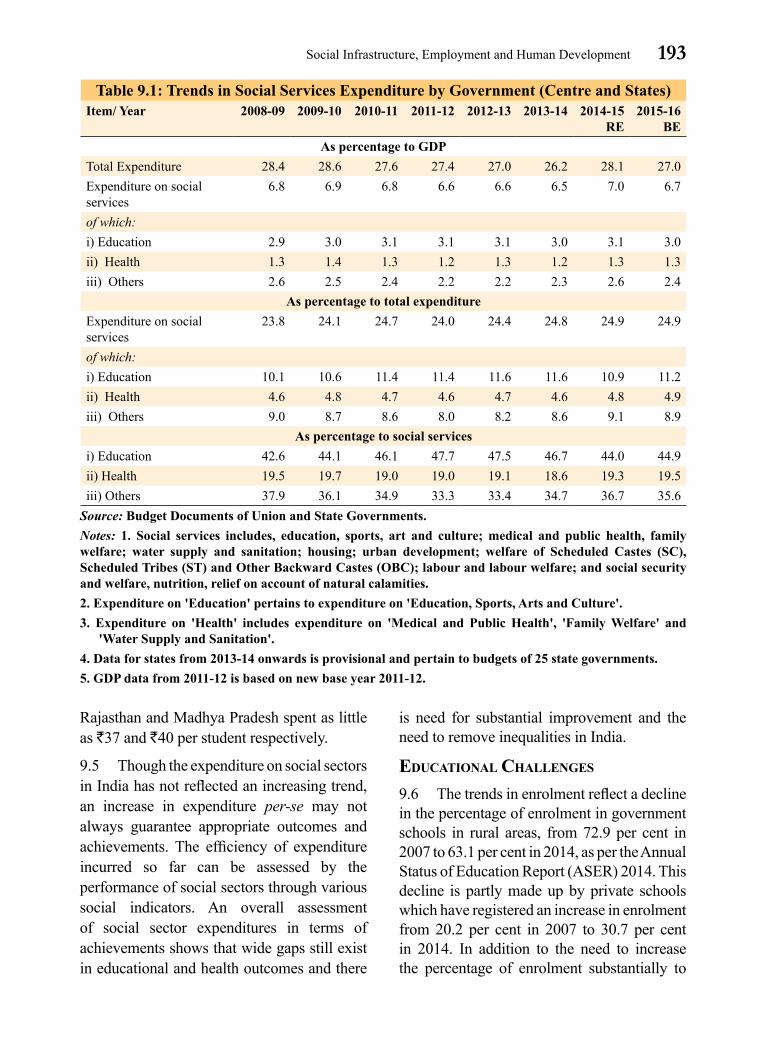
9.7 According to ASER 2014, there is a sharp decline in the number of children in standard V who can read a textbook of standard II in both government and private schools. In Government schools, the decline is from 56.7 per cent in 2007 to 42.2 per cent in 2014, and the percentage of children who can do division in standard V has declined from 41 per cent in 2007 to 20.7 per cent in 2014 in rural areas. In the case of standard V children in private schools who can read a standard II textbook, the decline is from 69 per cent in 2007 to 62.5 per cent in 2014. The percentage of children who can do division in standard V has declined from 49.4 per cent in 2007 to 39.3 per cent in 2014 in private schools. The decline in educational outcomes in private schools warrants equal attention since there is
an increase in the share of private providers of schooling and education across India.
9.8 The all India and State-wise enrolment and reading outcomes in rural areas (Figure 9.1) show that in Himachal Pradesh, Maharashtra, Tamil Nadu and Andhra Pradesh, the reading outcomes of standard V children in both government and private schools are good and there is relatively less divergence between the two. The reading outcomes for standard V children in Government schools are low in Jammu and Kashmir, Uttar Pradesh, Madhya Pradesh and Assam.
9.9 The quality of education determines the quality of human capital and a lot more effort needs to be made to improve the spread of education in India through enrolment and by improving the quality of education in both government and private schools.
9.10 A related issue is professional qualification and training received by the teachers. According to the latest report by the Unified-District Information System for Education (U-DISE) on ‘School Education in India’, for the country as whole, only 79 per
Source: ASER 2014.

195Social Infrastructure, Employment and Human Development
cent of teachers are professionally qualified (Table 9.2). For the higher secondary level, the percentage of qualified teachers is around 69 per cent. There is need to increase the percentage of qualified teachers and also the training of both qualified and under-qualified teachers.
9.11 Table 9.3 gives the Gender Parity Index (GPI) at various levels of school education. The data shows an improvement in girls education, with parity having been achieved between girls and boys at all levels of education, except higher education in the case of total and Scheduled Caste (SC) students. In the case of Scheduled Tribe (ST) students, parity between girls and boys has not been achieved across all levels of school and higher education. There is
Table 9.2: Professionally Trained Teachers and Pupil-Teacher Ratio in
India, 2014-15
Class levelProfessionally
qualified teachers (%)
PTR
Primary only 73.18 24Upper primary only 76.18 17Secondary only 77.88 27Higher secondary only 69.73 38All teachers 2014-15 79.03 naAll teachers 2013-14 78.12 na
Source: U-DISE, 2014 -15, School Education in India.
Notes: PTR - Pupil-Teacher Ratio; na- Not applicable.
Table 9.3: GPI at All Levels of Education, 2013-14 (Provisional)Level Total SC STPrimary (I to V) 1.03 1.01 0.98Upper primary (VI to VIII) 1.06 1.04 0.99Elementary (I to VIII) 1.04 1.05 0.98Secondary (IX to X) 1.00 1.00 0.99Senior secondary (XI- XII) 1.00 1.03 0.94Class I to XII 1.03 1.02 0.98Higher education* 0.89 0.89 0.79
Source: Educational Statistics at a Glance 2014, MHRD.
Notes: * For the year 2012-13; GPI is the ratio of the female-to-male values of a given indicator. A GPI of 1 indicates parity between sexes.
need to bridge the gender disparity in higher education among total and SC students and, at all levels of education for ST students.
9.12 Taking into account the gender bias which is inherent across most sections of society, a ‘Digital Gender Atlas for Advancing Girl’s Education in India’ was launched on International Women’s Day in March 2015. The tool has been developed in partnership with the United Nations Children’s Fund (UNICEF) to help identify low-performing geographic pockets for girls, particularly from marginalized groups. It provides comparative analysis of individual gender-related indicators over the years. The Gender Atlas is available on the Ministry of Human Resource Development’s website.
9.13 The Government’s endeavour to build an inclusive society aims to provide education to underprivileged, vulnerable and marginalized people such as SCs, STs, Other Backward Classes (OBC) including Minorities and other Economically Backward Classes through various programmes of education. A number of scholarship schemes to encourage enrolment and learning levels among different groups are in operation. National Scholarship Portal, a single window system for various types of scholarship schemes administered by different Ministries/Departments (like Pre-matric from Class I to X, Post-matric from XI to Ph.D. and Merit-

196 Economic Survey 2015-16
cum-Means for technical and professional courses), has been introduced under Direct Benefit Transfer (DBT) mode. During 2015-16, about 90 lakh Minority students are to be benefited under the Pre-matric, Post-matric and Merit-cum-Means scholarship schemes, while about 23.21 lakh SC students benefited under Pre-matric, 56.30 lakh under Post-matric and 3354 under the Rajiv Gandhi National Fellowship including the Top Class Education scholarship scheme are to be assisted.
employmenT
9.14 Comprehensive data on employment and unemployment for the country as a whole is available with large lags. Employment growth in the organized sector, public and private combined, increased by 2.0 per cent in 2012 over 2011, as against a growth of 1.0 per cent in 2011 over 2010. The annual growth rate for the private sector was 4.5 per cent in 2012 against a growth of 5.6 per cent in 2011; whereas the public sector registered a marginal growth of 0.4 per cent in 2012 against a decline of 1.8 per cent in 2011.
Table 9.4: Employment in the Organized Sector (as on 31 March)
Sector Employment (in lakh) Percentage change
2010 2011 2012 2011/2010 2012/2011
Public 178.62 175.48 176.09 (-)1.8 0.4Private 108.46 114.52 119.70 5.6 4.5Total 287.08 289.99 295.79 1.0 2.0Women 58.59 59.54 60.54 1.6 1.7
Source: Directorate General of Employment, Ministry of Labour and Employment.
The share of women in organized sector employment was around 20 per cent over the three years (Table 9.4).
9.15 According to the fourth Annual Employment-Unemployment Survey conducted by the Labour Bureau during the period January 2014 to July 2014, the Labour Force Participation Rate (LFPR) (usual principal status) is 52.5 for all persons (Table 9.5). The LFPR for rural areas at 54.7 is greater than that for urban areas at 47.2. The LFPR for women is significantly lower than that for males in both rural and urban areas. The Worker Population Ratio (WPR) reflects a similar pattern, with women having lower participation rate in comparison to men in both rural and urban areas. As per Census 2011 also, the workforce participation rates for females trails behind that for males.
9.16 The Unemployment Rate (UR) for persons aged 15 years and above according to Usual Principal Status (UPS) is 4.7 per cent in rural areas and 5.5 per cent in urban areas. The total UR reported is 4.9 per cent (Table 9.5). The Labour Bureau
Table 9.5: LFPR, WPR and UR for Persons Aged 15 Years (in per cent)
ParameterRural Urban Total
Male Female Persons Male Female Persons Male Female Persons
LFPR 74.7 29.1 54.7 73.8 18.5 47.2 74.4 25.8 52.5WPR 71.6 27.2 52.1 70.9 16.2 44.6 71.4 23.8 44.9UR 4.2 6.4 4.7 3.9 12.4 5.5 4.1 7.7 4.9
Source: Fourth Annual Employment-Unemployment Survey 2013-14, Labour Bureau.
Notes: LFPR is labour force participation rate; WPR is worker-population ratio; UR is unemployment rate; UPS is usual principal status.
197Social Infrastructure, Employment and Human Development
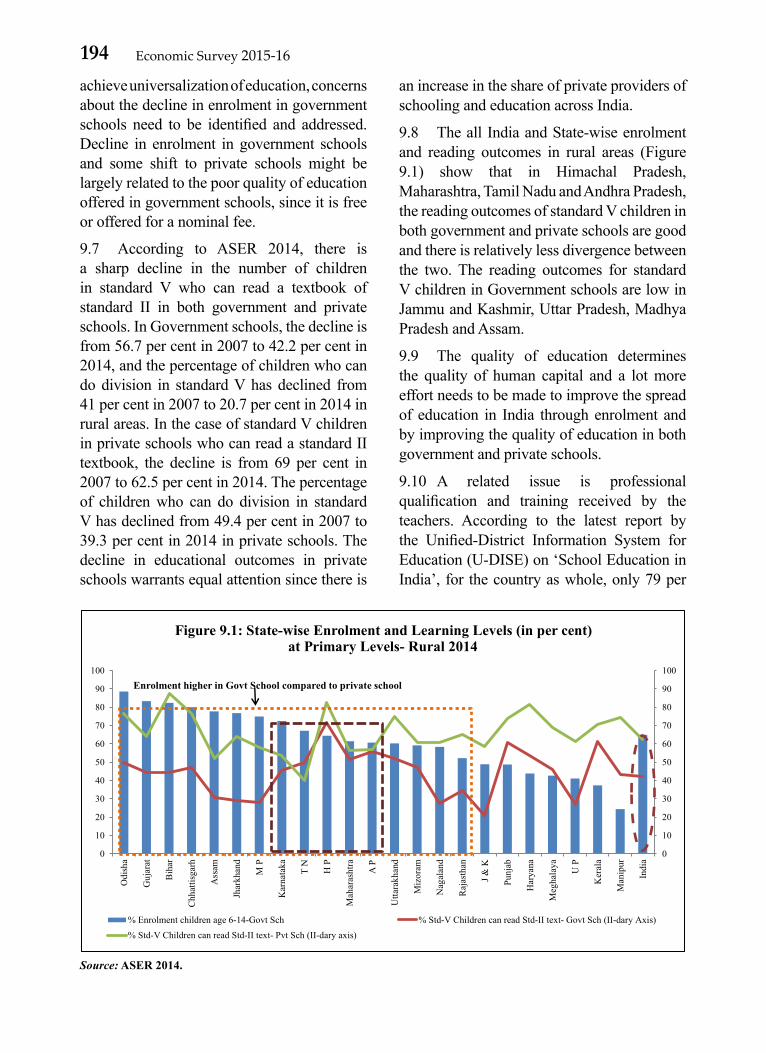
survey figures are much higher than the all-India unemployment rates arrived at by the National Sample Survey Office (NSSO, 2011-12), which reported URs of 2.3 per cent for rural areas, 3.8 per cent for urban areas and 2.7 per cent for India as a whole. The URs varied widely across States as can be seen in Figure 9.2.
9.17 The Government is keen to address the issue of low female LFPR and WPR and has launched various legislation based schemes and other programmes/schemes where the emphasis is on female participation. For example, the Mahatma Gandhi National Rural Employment Guarantee Act (MGNREGA), guaranteeing at least 100 days of employment to every household in rural areas has been enacted with a stipulation of one-third participation by women. During the current financial year (as on 1 January 2016), about 3.63 crore households have been provided employment of 134.96 crore person days under MGNREGA. Of the above person days, 76.81 crore person days (57 per cent) were availed of by women. The participation by women under the MGNREGA has been more than the stipulated 33 per cent since its inception. Similarly, the National Rural Livelihoods Mission (NRLM), a restructured version of the Swarnajayanti Gram Swarozgar
Source: NSSO 2011-12.
Yojana (SGSY), has been in operation since 3 June 2011. It aims at organizing all rural poor households and nurturing and supporting them till they come out of abject poverty, by organizing one woman member from each household into affinity-based women Self-Help Groups (SHG) and their federations at village and higher levels by 2024-25. The mission has covered 1.7 lakh villages and mobilized around 24.61 lakh SHGs, of which 8.3 lakh are new.
9.18 The Quarterly Survey Report of the Labour Bureau is based on a sample of selected labour-intensive industries and export-oriented sectors, which since 2009 have been sampled on a regular basis to assess the effect of economic slowdown on employment in India. As per the latest Quarterly Quick Employment Survey Report of the Labour Bureau, the overall estimated employment in all the selected sectors has shown a net addition of 37.67 lakh (persons) starting from the first survey (October 2008 to December 2008) till the 26th survey (April 2015 to June 2015). Box.9.1 shows employment generated in eight select industries.
9.19 A notable aspect of the employment situation in India is the large share of informal employment and growth in informal
198 Economic Survey 2015-16
employment in the organized sector. The share of informal employment in the organized sector increased from 48 per cent to 54.6 per cent in 2004-5 to 2011-12. Its share in total employment remained above 90 per cent throughout this period. While growth and economic development ought to ensure adequate livelihood security and decent working conditions, the growth in informal employment and its heterogeneity have to be given due consideration to achieve the stated development objectives. In order to bring compliance in the system, catalyze job creation and ensure ease of doing business while safeguarding safety, health and social security of all workers in both the organized and unorganized sectors,
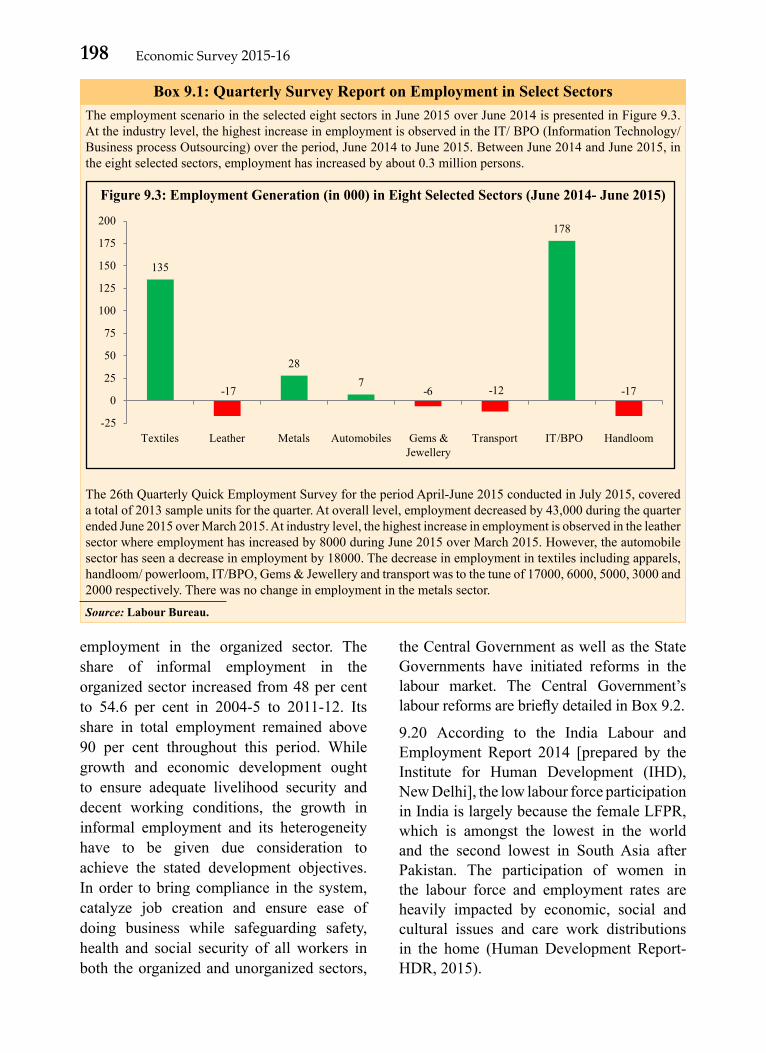
Box 9.1: Quarterly Survey Report on Employment in Select Sectors
The employment scenario in the selected eight sectors in June 2015 over June 2014 is presented in Figure 9.3. At the industry level, the highest increase in employment is observed in the IT/ BPO (Information Technology/ Business process Outsourcing) over the period, June 2014 to June 2015. Between June 2014 and June 2015, in the eight selected sectors, employment has increased by about 0.3 million persons.
The 26th Quarterly Quick Employment Survey for the period April-June 2015 conducted in July 2015, covered a total of 2013 sample units for the quarter. At overall level, employment decreased by 43,000 during the quarter ended June 2015 over March 2015. At industry level, the highest increase in employment is observed in the leather sector where employment has increased by 8000 during June 2015 over March 2015. However, the automobile sector has seen a decrease in employment by 18000. The decrease in employment in textiles including apparels, handloom/ powerloom, IT/BPO, Gems & Jewellery and transport was to the tune of 17000, 6000, 5000, 3000 and 2000 respectively. There was no change in employment in the metals sector.
Source: Labour Bureau.
the Central Government as well as the State Governments have initiated reforms in the labour market. The Central Government’s labour reforms are briefly detailed in Box 9.2.
9.20 According to the India Labour and Employment Report 2014 [prepared by the Institute for Human Development (IHD), New Delhi], the low labour force participation in India is largely because the female LFPR, which is amongst the lowest in the world and the second lowest in South Asia after Pakistan. The participation of women in the labour force and employment rates are heavily impacted by economic, social and cultural issues and care work distributions in the home (Human Development Report-HDR, 2015).
199Social Infrastructure, Employment and Human Development
Box 9.2: Labour Reforms
The Payment of Bonus (Amendment) Act 2015: The Payment of Bonus (Amendment) Act 2015 received the assent of the President on 31 December 2015. The eligibility for bonus payment as defined under section 2 (13) of the Payment of Bonus Act 1965 has been increased from R10,000 to R21,000 per month. Section 12 of the principal Act states that the calculation of bonus with respect to certain employees where the salary or wage of an employee exceeds R7000 (or the minimum wage for the scheduled employment as fixed by the appropriate government, whichever is higher) shall be paid per month, the bonus payable to such employee under section 10 or, as the case may be, under section 11, shall be calculated as if his/her salary or wage were R7000 per month (or the minimum wage for the scheduled employment as fixed by the appropriate government, whichever is higher).
National Career Services Portal: The Government is mandated to maintain a free employment service for its citizens. This is now being transformed with the launch of the National Career Service (NCS) Portal on 20 July 2015. The NCS is envisaged as a digital portal that will provide a nationwide online platform for job seekers and employers for job matching in a dynamic, efficient and responsive manner. As of 31 December 2015, approximately 3.58 crore job seekers, 9 lakh employers and 27,000 skill providers are registered on the portal. The Government has also approved the establishment of 60 model career centers and these are likely to become functional during 2016-17.
Shram Suvidha Portal: The features of the Shram Suvidha Portal launched by the Government are: unique Labour Identification Number (LIN) to units/ establishments registered on it (the unique LIN has been issued to 9,70,242 units as on 14th February, 2016); transparent labour inspection scheme; unified annual returns under nine central acts and unified electronic challan-cum-return for filling of monthly contribution with Employees Provident Fund Organization (EPFO) & Employee State Insurance Corporation (ESIC).
Universal Account Number: As part of the Pandit Deen Dayal Upadhyay Shramev Jayate Karyakram, portability feature has been launched through the Universal Account Number (UAN) by EPFO. So far, a total of 6,13,25,767 workers have already been provided UANs.
Source: Ministry of Labour and Employment.
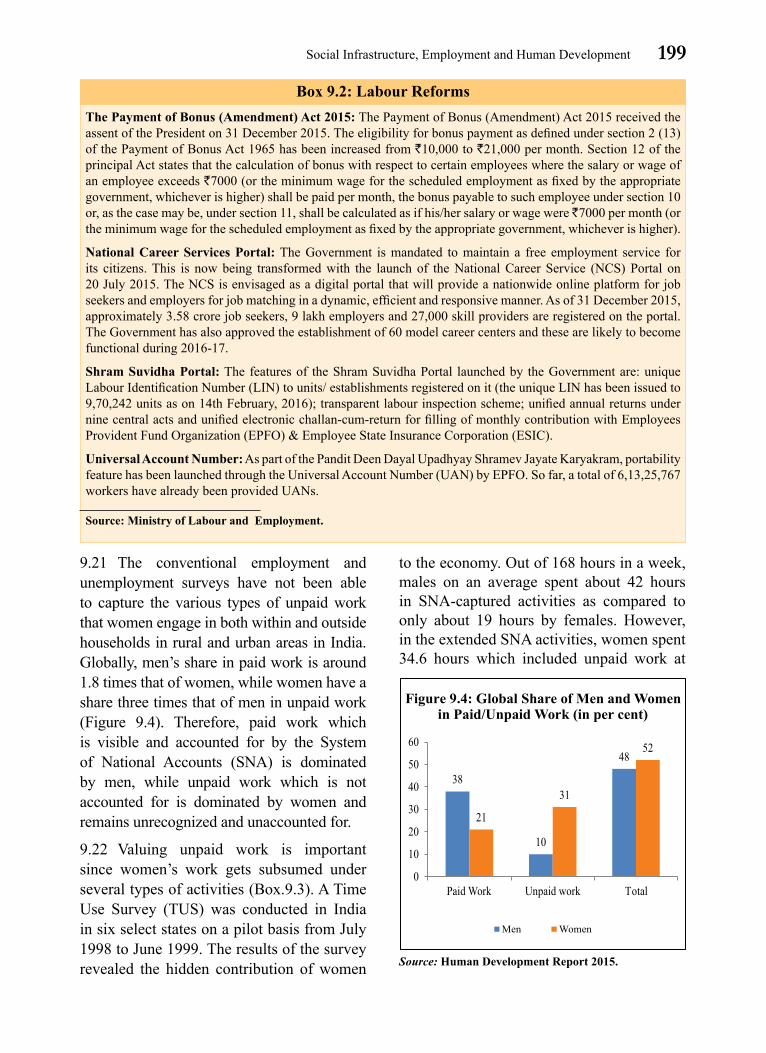
9.21 The conventional employment and unemployment surveys have not been able to capture the various types of unpaid work that women engage in both within and outside households in rural and urban areas in India. Globally, men’s share in paid work is around 1.8 times that of women, while women have a share three times that of men in unpaid work (Figure 9.4). Therefore, paid work which is visible and accounted for by the System of National Accounts (SNA) is dominated by men, while unpaid work which is not accounted for is dominated by women and remains unrecognized and unaccounted for.
9.22 Valuing unpaid work is important since women’s work gets subsumed under several types of activities (Box.9.3). A Time Use Survey (TUS) was conducted in India in six select states on a pilot basis from July 1998 to June 1999. The results of the survey revealed the hidden contribution of women
to the economy. Out of 168 hours in a week, males on an average spent about 42 hours in SNA-captured activities as compared to only about 19 hours by females. However, in the extended SNA activities, women spent 34.6 hours which included unpaid work at
Source: Human Development Report 2015.
200 Economic Survey 2015-16
home and outside, as opposed to only about 3.6 hours by men. The declining female participation rates in conventional surveys are largely explained by the high share of women in unpaid work. Based on the findings of the pilot TUS, the National Classification of Activities for Time Use Studies (NCATUS), which also provides a classification of unpaid activities that is crucial for capturing the various activities of women in the economy, has been developed.
9.23 Accordingly, the Ministry of Statistics & Programme Implementation (MOSPI) has conducted a pilot TUS in the states of Bihar
Box. 9.3: Capturing Women’s Participation in Work: Unearthing the Potential of TUS Statistics
Paid/Unpaid work activities identified by the TUS 1998-1999
The TUS classification was based on the grouping of activities under the following three broad categories:SNA activities
• Primary production activities• Secondary activities• Trade, business and services Extended SNA activities
• Household maintenance, management and shopping for own household• Care for children, the sick, elderly and disabled for own household • Community service and help to other householdsNon-SNA activities
• Learning• Social and cultural activities, mass media, etc.• Personal care and self-maintenanceNCATUS 2013
The NCATUS classifies activities into five groups: • Economic activities of the self-employed, job workers and outworkers/home-based workers, i.e. those in the
SNA 1993 production boundary• Activities for which remuneration is in the form of cash or in kind• Economic activities covered under SNA 1993 but not covered under Indian System of National Accounts
(ISNA), like processing farm produce for home consumption, or not reckoned as economic activity under Employment and Unemployment Surveys (EUSs) like free collection of minor forest products for home consumption
• Activities relating to domestic work and family care, which fall within the general production boundary but are outside the production boundary of SNA 1993
• Activities relating to personal care and self-maintenance.
Source: Based on the TUS July 1998- June 1999 and NCATUS 2013.
and Gujarat in 2013 to test the NCATUS. The findings of this pilot will form the basis of extending TUS to all states. To design gender-sensitive policies for employment and to make women’s and men’s work visible, TUS is a crucial statistical tool which will provide profile of work in unpaid forms in the country.
Child Labour
9.24 A multi-pronged strategy which comprises statutory and legislative measures, rehabilitation of children withdrawn from work through specific schemes and universal
201Social Infrastructure, Employment and Human Development
elementary education supplemented with economic rehabilitation of their families by way of convergence with existing programmes and schemes is required to tackle the problem of child labour. The National Child Labour Project (NCLP) Scheme was launched as a project-based intervention under which children rescued/withdrawn from work in the age group of 9-14 years are enrolled in NCLP special training centers, where they are provided bridge education, vocational training, midday meal, stipend, health care, etc., before being mainstreamed into formal education system. Children in the age group of 5-8 years are directly linked to the formal education system through close coordination with the Sarva Shiksha Abhiyaan (SSA). Complete prohibition on employment of children below 14 years along with linking the age of prohibition with the age under the Right of Children to Free and Compulsory Education Act 2009, and stricter punishment for employers contravening the provisions have been proposed as amendment to the Child Labour (Prohibition & Regulation) Act, 1986.
Skills Gap and Employment
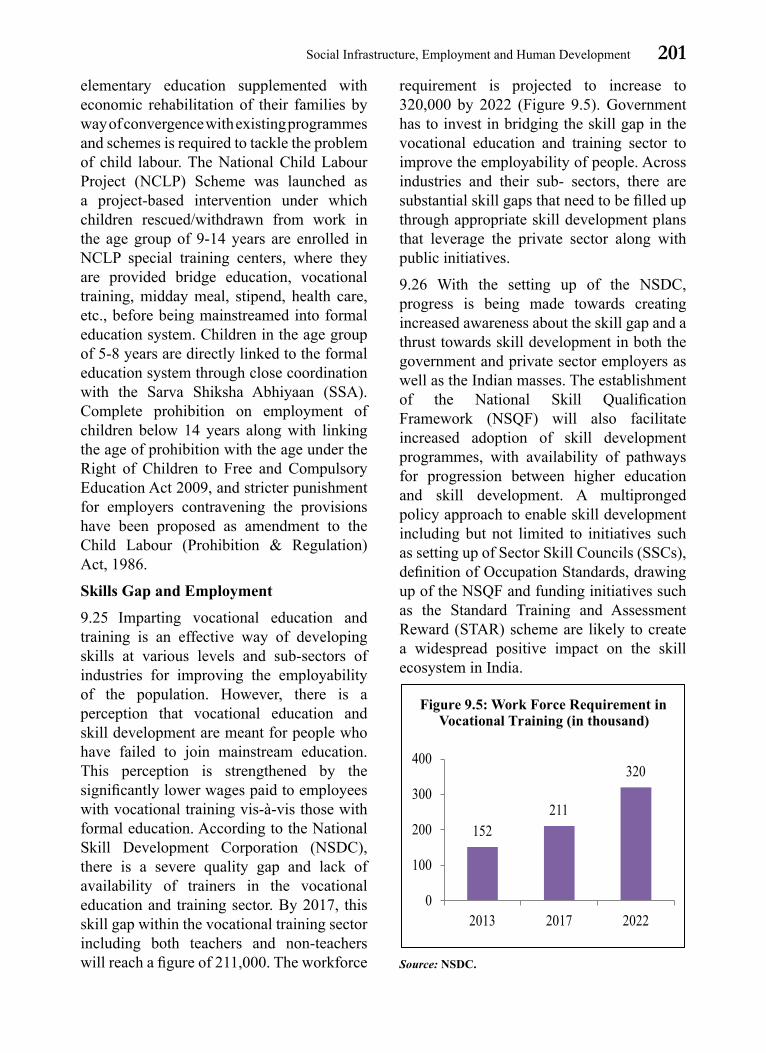
9.25 Imparting vocational education and training is an effective way of developing skills at various levels and sub-sectors of industries for improving the employability of the population. However, there is a perception that vocational education and skill development are meant for people who have failed to join mainstream education. This perception is strengthened by the significantly lower wages paid to employees with vocational training vis-à-vis those with formal education. According to the National Skill Development Corporation (NSDC), there is a severe quality gap and lack of availability of trainers in the vocational education and training sector. By 2017, this skill gap within the vocational training sector including both teachers and non-teachers will reach a figure of 211,000. The workforce
requirement is projected to increase to 320,000 by 2022 (Figure 9.5). Government has to invest in bridging the skill gap in the vocational education and training sector to improve the employability of people. Across industries and their sub- sectors, there are substantial skill gaps that need to be filled up through appropriate skill development plans that leverage the private sector along with public initiatives.
9.26 With the setting up of the NSDC, progress is being made towards creating increased awareness about the skill gap and a thrust towards skill development in both the government and private sector employers as well as the Indian masses. The establishment of the National Skill Qualification Framework (NSQF) will also facilitate increased adoption of skill development programmes, with availability of pathways for progression between higher education and skill development. A multipronged policy approach to enable skill development including but not limited to initiatives such as setting up of Sector Skill Councils (SSCs), definition of Occupation Standards, drawing up of the NSQF and funding initiatives such as the Standard Training and Assessment Reward (STAR) scheme are likely to create a widespread positive impact on the skill ecosystem in India.
Source: NSDC.
202 Economic Survey 2015-16
9.27 The SSCs as autonomous industry-led bodies through the NSDC create National Occupational Standards (NOSs) and Qualification Packs (QP) for each job role in the sector, develop competency frameworks, conduct training of trainers, conduct skill gap studies and assess through independent agencies and certify trainees on the curriculum aligned to NOSs developed by them. Till date, 38 SSCs have been approved and they have created 1433 QPs and 6819 NOSs.
9.28 Under the Pradhan Mantri Kaushal Vikas Yojana (PMKVY), which targets offering 24 lakh Indian youth meaningful, industry-relevant, skill-based training and a government certification on successful completion of training along with assessment to help them secure a job for a better future, 5.32 lakh persons have already been enrolled. Of this number, 4.38 lakh have successfully completed training throughout India. The actual success of this initiative can be gauged by the number of trained personnel being employed, which also needs to be measured and periodically reported.
9.29 In addition, the Deen Dayal Upadhyaya Grameen Kaushalya Yojana (DDU-GKY), a placement-linked skill development scheme for rural youth who are poor, as a skilling component of the NRLM has also been launched. During 2015-16, against a target of skilling 1.78 lakhs candidates under the DDU-GKY, a total of 1.75 lakh have been trained and 0.60 lakh placed till November 2015.
9.30 With a view to increasing the scope of employability among differently-abled persons, the Government has launched a National Action Plan (NAP) for skill training which will establish a network of skill-training providers led by training partners from government and non-government sectors including vocational rehabilitation centres. The plan has a target of skilling 5 lakh
differently-abled persons in next three years. Plans are also on the anvil to extend the NAP with an online skill-training platform with a target of 5 lakh every year.
9.31 The National Policy on Skill Development and Entrepreneurship 2015 aims to ensure ‘Skilling on a large Scale at a Speed with high Standards and promote a culture of innovation based entrepreneurship to ensure sustainable livelihoods’. Accordingly, a Policy Implementation Unit (PIU) will identify all the stakeholders involved and flag the actionable points to the responsible agency. Given that India has one of the youngest populations in the world, there is immense potential for overseas employment opportunities for skilled persons from India. The process of mapping such opportunities through the NSDC is also in progress.
Towards a healThy india
9.32 Providing accessible, affordable and equitable quality health care, especially to the marginalized and vulnerable sections of the population is one of the key objectives of the Government. There are innumerable challenges to the delivery of efficient health services in India, given the paucity of resources and the plethora of requirements in the health sector. Population health is also significantly influenced by social and environmental determinants such as age at marriage, nutrition, pollution, access to potable water and hygienic sanitation facilities.
9.33 The Indian health sector has a mix of both public and private providers of health services. The private sector and the quality of care provided is variable, ranging from informal providers (quacks) to individually run nursing homes to large polyclinics and multiplex hospitals. The regulation for cost and quality of care is largely absent in most of the states. In the case of public sector, the health services are delivered through a network of health facilities including

203Social Infrastructure, Employment and Human Development
ASHA (a volunteer health worker) at the community level, Health Sub-Center (HSC), Primary Health Centres (PHCs), Community Health Centres (CHCs), District Hospitals, Government Medical College Hospitals and the state and central government assisted ESI hospitals and dispensaries. Outreach and community level services are provided through coordination between ASHA, Anganwadi Workers (AWW) and the Auxiliary Nurse Midwife (ANM) at the HSC.
9.34 The data on health by the NSSO, ‘Key Indicators of social consumption in India: Health’, 2015, 71st Round (January –June 2014) throws some interesting findings. The private sector continues to play a significant role in the provision of outpatient and hospitalized care. However, it also points that there has been a nearly two-fold jump in the institutional deliveries since the last such survey. Further, over 60 per cent of all institutional deliveries are in the public sector and the Out of Pocket expenditures for childbirth in the public sector is about one-tenth that in the private sector. This is largely a result of sustained strengthening of health systems targeted towards maternal and child healthcare through programmes such as Janani Suraksha Yojana (JSY) and Janani Shishu Suraksha Karyakram (JSSK). This is also reflected in 50 per cent sharper decline in MMR in the country as compared to global average rate of decline from the baseline of MDG of 1990.
9.35 As regards non-hospitalised care, the Survey points that as compared to the 60th round where 22 per cent sought health care in the public system, there was a small but significant shift in rural areas, with 28.3 per cent of care being provided by public sector. However, the share of public providers in treatment of non-hospitalised patients is very low at 11.5 per cent at HSC, PHC including ASHAs and ANMs. This percentage is even lower for urban areas where the public provisioning of primary health care has been
largely absent. This reflects confinement of primary care to selective primary care limited to Reproductive and Child Health (RCH) services. The National Urban Health Mission (NUHM) launched over a year back is trying to address the issue of inadequacy of public provisioning of primary health care in urban areas.
9.36 NSSO (2015), reports that the average medical expenditure for treatment (excluding child birth) per hospitalized case if treated in private hospital was about four times than that of public hospital during January-June 2014. On an average, R25,850 was spent for treatment per hospitalized case by people in the private facilities as against R6,120 in the public health facilities. The average total medical and other related non-medical expenditure per hospitalization in rural and urban areas are R16,956 and R26,455 respectively. The average total medical expenditure for non- hospitalized treatment per ailing person in rural and urban areas is R509 and R639 respectively. These expenditures reflect the challenges that India faces in the provision of affordable and accessible health care to the population. The NSSO also reports that coverage by government-funded insurance schemes has risen to 13.1 per cent of rural India and 12 per cent of urban population.
Health in India: Select Indicators
9.37 As per Census 2011, the share of children (0-6 years) accounts for 13.6 per cent of the total population in the country. An estimated 26 million children are born every year in India. Under five, mortality has declined from 126 in 1990 to 49 in 2013, much faster than global rate of decline during the same period. Immunization is one of the thrust areas of the child health programme of the Government to achieve Goal 4 of Millennium Development Goals (MDGs) of reducing the child mortality.
9.38 According to the National Family

204 Economic Survey 2015-16
Health Surveys, the immunization coverage has improved substantially since NFHS-1, when only 36 percent of children were fully vaccinated and 30 percent had not been vaccinated at all. The full immunization coverage improved to 44 per cent as per NFHS-3. As per the latest survey, NFHS-4, only health indicators for 13 States and 2 UTs are available. Selected indicators of the 12 states are given in Table 9.6. As per NFHS-4, the percentage of children fully immunized in the age group (12-23 months) is above 80 per cent in Sikkim and West Bengal. All the 12 states have more than 50 per cent children fully immunized. The percentage of children who are fully immunized is lower in urban areas compared to rural areas in majority of the States (Table 9.6), indicating that although the private sector is more wide spread in urban areas, the availability of preventive health care is through the public health system, which needs strengthening in urban areas.
9.39 High-risk patients like children and pregnant women do require special
preventive healthcare services. Targeting coverage of all those children by 2020 who are either unvaccinated, or are partially vaccinated against seven vaccine-preventable diseases which include diphtheria, whooping cough, tetanus, polio, tuberculosis, measles and hepatitis B, Mission Indradhanush was launched in December 2014. In addition, vaccination against Japanese Encephalitis and Haemophilus influenza type B will be provided in selected districts/states of the country. Pregnant women are also to be immunized against tetanus. Since the launch of the programme, three rounds have been conducted with the aim of covering 201 high focus districts in the first phase, accounting for nearly 50 per cent of all unvaccinated or partially vaccinated children in the country. The progress so far has been coverage of 352 districts of the country with 20.8 lakh children and 5.8 lakh pregnant women immunized in the first phase, 17.2 lakh children and 5.1 lakh pregnant women immunized in the second phase and 17 lakh children and 4.8 lakh pregnant women immunized in the third
Table 9.6: Full Immunization of Children, age 12-23 months (in per cent)
StateNFHS-3 NFHS-4
Rural Urban Total Rural Urban Total
Andhra Pradesh 42.9 51.2 46.0 67.2 60.4 65.3Bihar 31.1 45.6 32.8 61.9 59.7 61.7Haryana 60.3 (82.2) 65.3 65.1 57.0 62.2Karnataka 52.2 59.6 55.0 64.8 59.8 62.6Madhya Pradesh 31.5 68.7 40.3 50.2 63.0 53.6Meghalaya 32.6 33.8 32.9 58.5 81.4 61.5Sikkim 66.7 (85.4) 69.6 83.7 (81.4) 83.0Tamil Nadu 83.7 77.8 80.9 66.8 73.3 69.7Telangana - - - 68.3 67.8 68.1Tripura 47.9 * 49.7 51.2 64.2 54.5Uttarakhand 57.4 67.2 60.0 58.2 56.5 57.7West Bengal 62.8 70.3 64.3 87.1 77.7 84.4
Source: NFHS-4 and NFHS-3.
Notes: Andhra Pradesh was undivided during NFHS- 3; Figures in parenthesis are based on 25-49 unweighted cases;
* Based on fewer than 25 unweighted cases.
205Social Infrastructure, Employment and Human Development
phase of Mission Indradhanush. All services available under national programmes are free to all and universally accessed with fairly good rates of coverage. Thus, India has one of the largest programmes of publicly financed ART drugs for HIV anywhere in the world. All drugs and diagnostics in all vector borne disease programmes, tuberculosis, leprosy, including rapid diagnostic kits and third generation anti-microbicidals are free and so are insecticide treated bed nets.
9.40 Further, under the Rashtriya Bal Swasthya Karyakram (RBSK), support is being provided to States/UTs for child health screening and early intervention services through early detection and early management of common health conditions.
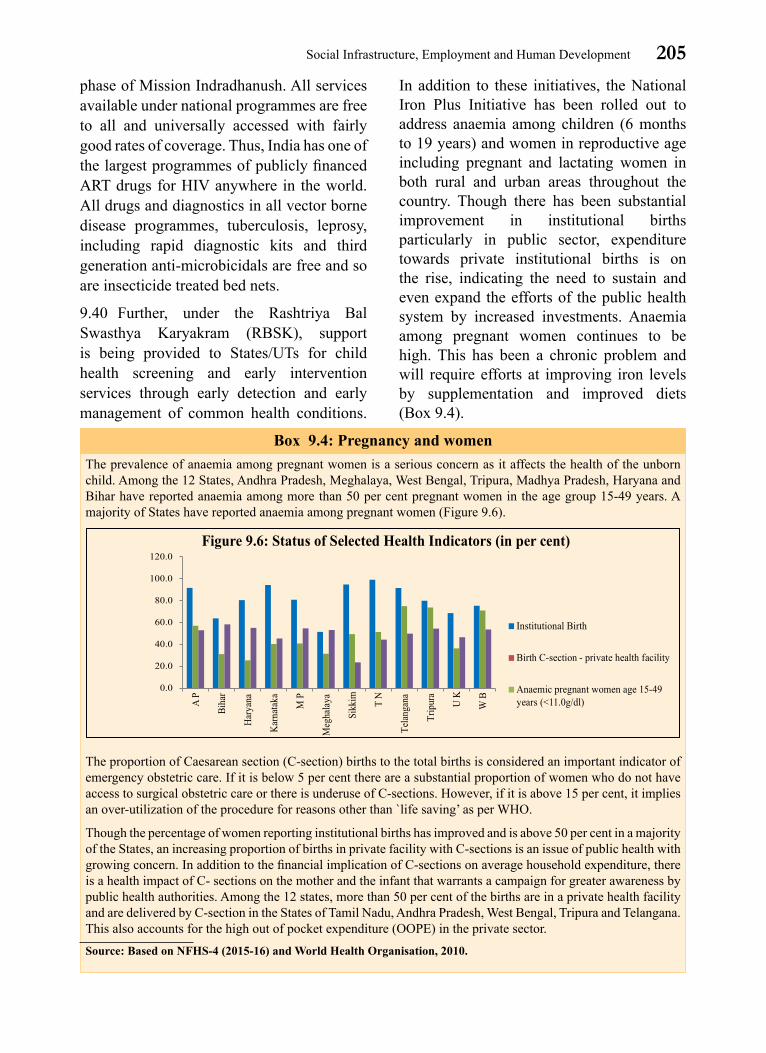
In addition to these initiatives, the National Iron Plus Initiative has been rolled out to address anaemia among children (6 months to 19 years) and women in reproductive age including pregnant and lactating women in both rural and urban areas throughout the country. Though there has been substantial improvement in institutional births particularly in public sector, expenditure towards private institutional births is on the rise, indicating the need to sustain and even expand the efforts of the public health system by increased investments. Anaemia among pregnant women continues to be high. This has been a chronic problem and will require efforts at improving iron levels by supplementation and improved diets (Box 9.4).
Box 9.4: Pregnancy and women
The prevalence of anaemia among pregnant women is a serious concern as it affects the health of the unborn child. Among the 12 States, Andhra Pradesh, Meghalaya, West Bengal, Tripura, Madhya Pradesh, Haryana and Bihar have reported anaemia among more than 50 per cent pregnant women in the age group 15-49 years. A majority of States have reported anaemia among pregnant women (Figure 9.6).
The proportion of Caesarean section (C-section) births to the total births is considered an important indicator of emergency obstetric care. If it is below 5 per cent there are a substantial proportion of women who do not have access to surgical obstetric care or there is underuse of C-sections. However, if it is above 15 per cent, it implies an over-utilization of the procedure for reasons other than `life saving’ as per WHO.
Though the percentage of women reporting institutional births has improved and is above 50 per cent in a majority of the States, an increasing proportion of births in private facility with C-sections is an issue of public health with growing concern. In addition to the financial implication of C-sections on average household expenditure, there is a health impact of C- sections on the mother and the infant that warrants a campaign for greater awareness by public health authorities. Among the 12 states, more than 50 per cent of the births are in a private health facility and are delivered by C-section in the States of Tamil Nadu, Andhra Pradesh, West Bengal, Tripura and Telangana. This also accounts for the high out of pocket expenditure (OOPE) in the private sector.
Source: Based on NFHS-4 (2015-16) and World Health Organisation, 2010.

206 Economic Survey 2015-16
Table 9.7: Universal Health Coverage (UHC) Index values (in per cent) for Select Countries
Country Year ImmunizationDiarrhoea treatment
Inpatient admission
Impoverish-ment
UHC
Brazil 1998 67.6 44.1 92.3 94.1 82.0 2006 67.6 43.0 85.9 93.6 81.6India 1998 26.0 10.3 71.6 85.2 51.6
2006 34.5 22.1 71.6 83.7 56.9
Indonesia 2000 49.4 49.7 27.9 93.4 47.3 2009 59.5 48.2 27.9 93.1 47.0Philippines 1998 68.5 23.0 64.7 95.7 66.2 2008 72.6 54.3 64.7 95.0 75.2South Africa 1997 61.7 53.0 96.6 95.9 78.8 2003 61.7 53.0 96.6 96.7 79.3Vietnam 1997 46.7 45.2 86.7 84.6 57.8 2008 30.6 65.9 86.7 66.1 61.1
Source: World Bank Group Policy Research Working Paper 7470 on Measuring Progress Towards Universal Health Coverage--With an Application to 24 Developing Countries, November, 2015.
9.41 With limited resources and competing demands in the health sector, it is essential that Government to prioritize expenditure. As preventive health care has always been a priority area because of its long-term societal benefits, Government has taken several steps in the direction of preventive health care to reduce the burden of diseases in India. Some of the important programmes aimed at investigation/screening and treatment cover Malaria; Kala-azar, Filaria, Dengue; Japanese Encephalitis and Chikungunya; detection and treatment for Tuberculosis including MDR-TB; detection and treatment for Leprosy; detection, treatment and counselling for HIV/AIDs; and cataract surgery for blindness control.
9.42 Considering the rising incidence of Non-Communicable Diseases (NCDs), the Government of India has initiated an integrated National Programme for Prevention and Control of Cancers, Diabetes, Cardiovascular Diseases and Stroke (NPCDCS) jointly by the Ministry of Health and Family Welfare and Ministry of AYUSH (Ayurveda, Yoga, Unani, Siddha and Homeopathy) on pilot basis in six districts.
UHC Index
9.43 The Universal Health Coverage (UHC) index has been developed by the World Bank to measure the progress made in health sectors in select countries of the World. India ranks 143 among 190 countries in terms of per capita expenditure on health ($146 PPP in 2011). It has 157th position according to per capita government spending on health which is just about $44 PPP. India’s performance on the indicator on treatment of diarrhoea needs improvement in terms of enhancing the coverage (Table 9.7). The impoverishment indicator reflects the financial risk protection coverage, with a higher percentage reflecting better coverage.
Health Sector Schemes and Human Resource Shortfalls in the Sector
9.44 Various initiatives under the National Health Mission (NHM), which subsume the National Rural Health Mission (NRHM) for rural areas and the NUHM for urban areas with a population of more than 30,000, have been taken up for providing free health care through a nationwide network of public health facilities like CHCs, PHCs and Sub-Centres
207Social Infrastructure, Employment and Human Development
(SCs) in both rural and urban areas. The NHM has enabled significant improvement in creation of new facilities and infrastructure and improved availability of drugs. It has facilitated comprehensive health care and improved quality of life of children through early detection. Besides continuing support to existing interventions, initiatives such as 'RBSK' and `Rashtriya Kishor Swasthya Karyakram’ (RKSK) have been launched in 2013 and 2014 respectively under the NHM to provide comprehensive health care. Since drugs constitute the bulk of OOPE, the Government of India has intensified efforts for provision of free essential drugs in public health facilities under the NHM Free Drugs Initiative. ‘Jan Aushadhi Scheme’ for providing quality generic medicines at affordable prices in collaboration with the State Governments has also been launched.
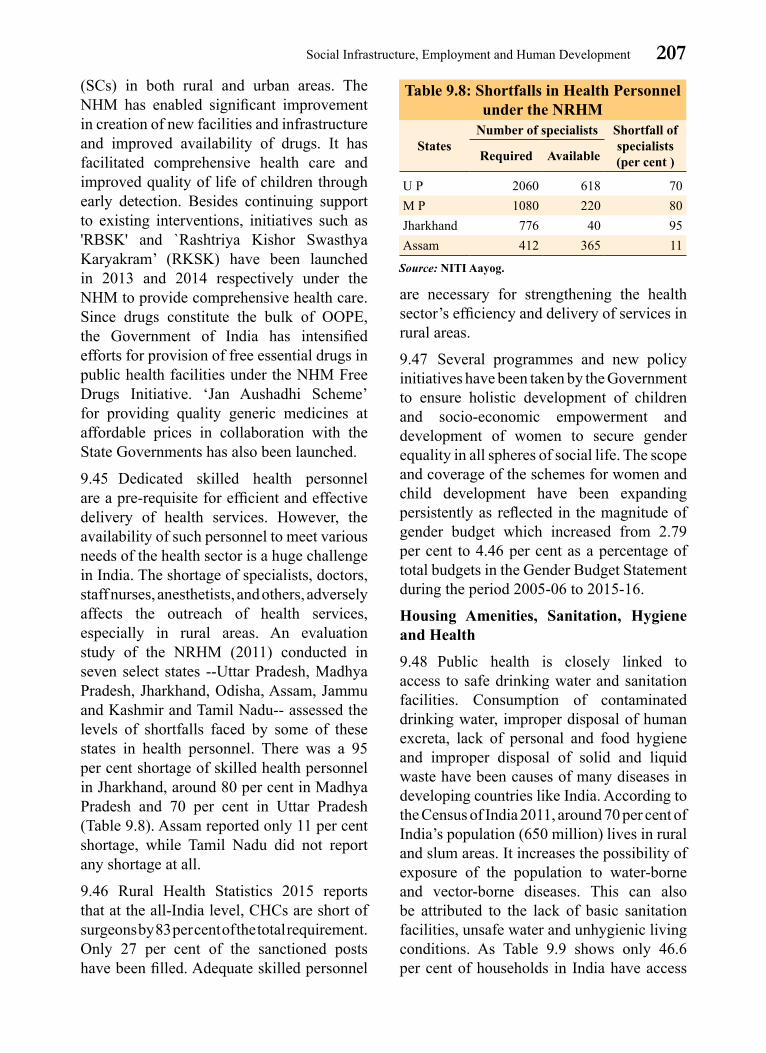
9.45 Dedicated skilled health personnel are a pre-requisite for efficient and effective delivery of health services. However, the availability of such personnel to meet various needs of the health sector is a huge challenge in India. The shortage of specialists, doctors, staff nurses, anesthetists, and others, adversely affects the outreach of health services, especially in rural areas. An evaluation study of the NRHM (2011) conducted in seven select states --Uttar Pradesh, Madhya Pradesh, Jharkhand, Odisha, Assam, Jammu and Kashmir and Tamil Nadu-- assessed the levels of shortfalls faced by some of these states in health personnel. There was a 95 per cent shortage of skilled health personnel in Jharkhand, around 80 per cent in Madhya Pradesh and 70 per cent in Uttar Pradesh (Table 9.8). Assam reported only 11 per cent shortage, while Tamil Nadu did not report any shortage at all.
9.46 Rural Health Statistics 2015 reports that at the all-India level, CHCs are short of surgeons by 83 per cent of the total requirement. Only 27 per cent of the sanctioned posts have been filled. Adequate skilled personnel
are necessary for strengthening the health sector’s efficiency and delivery of services in rural areas.
9.47 Several programmes and new policy initiatives have been taken by the Government to ensure holistic development of children and socio-economic empowerment and development of women to secure gender equality in all spheres of social life. The scope and coverage of the schemes for women and child development have been expanding persistently as reflected in the magnitude of gender budget which increased from 2.79 per cent to 4.46 per cent as a percentage of total budgets in the Gender Budget Statement during the period 2005-06 to 2015-16.
Housing Amenities, Sanitation, Hygiene and Health
9.48 Public health is closely linked to access to safe drinking water and sanitation facilities. Consumption of contaminated drinking water, improper disposal of human excreta, lack of personal and food hygiene and improper disposal of solid and liquid waste have been causes of many diseases in developing countries like India. According to the Census of India 2011, around 70 per cent of India’s population (650 million) lives in rural and slum areas. It increases the possibility of exposure of the population to water-borne and vector-borne diseases. This can also be attributed to the lack of basic sanitation facilities, unsafe water and unhygienic living conditions. As Table 9.9 shows only 46.6 per cent of households in India have access
Table 9.8: Shortfalls in Health Personnel under the NRHM
StatesNumber of specialists Shortfall of
specialists(per cent )Required Available
U P 2060 618 70 M P 1080 220 80 Jharkhand 776 40 95 Assam 412 365 11
Source: NITI Aayog.

208 Economic Survey 2015-16
Table 9.9: State-wise Distribution of Households with Access to Amenities 2011 (in per cent)
StatesDrinking water
facilitiesLatrine facilities
Tap water Within the premises Within the premises
Andhra Pradesh 69.9 43.2 49.6Arunachal Pradesh 65.5 41.1 62.0Assam 10.5 54.8 64.9Bihar 4.4 50.1 23.1
Chhattisgarh 20.7 19.0 24.6
Goa 85.4 79.7 79.7Gujarat 69.0 64.0 57.4Haryana 68.8 66.5 68.6Himachal Pradesh 89.5 55.5 69.1Jammu & Kashmir 63.9 48.2 51.2Jharkhand 12.9 23.2 22.0
Karnataka 66.1 44.5 51.2Kerala 29.3 77.7 95.2
Madhya Pradesh 23.4 23.9 28.8Maharashtra 67.9 59.4 53.1Manipur 38.6 16.1 89.3
Meghalaya 39.3 24.1 62.9Mizoram 58.7 31.2 91.9
Nagaland 47.2 29.3 76.5Odisha 13.8 22.4 22.0
Punjab 51.0 85.9 79.3Rajasthan 40.6 35.0 35.0Sikkim 85.3 52.6 87.2
Tamil Nadu 79.8 34.9 48.3Tripura 33.2 37.1 86.0
Uttar Pradesh 27.3 51.9 35.7Uttarakhand 68.2 58.3 65.8West Bengal 25.4 38.6 58.9INDIA 43.5 46.6 46.9
Source: Census 2011.
Note: Figures in ‘red’ relate to less than 25 per cent; Figures in green relate to more than 80 per cent.
to drinking water within their premises. A far lower, 43.5 per cent of households have access to tap water. Similarly, less than 50 per cent households have latrine facilities within the household premises.
9.49 The disparity across states in terms of access to household amenities like tap water and latrine facilities is sharp. While access and coverage of latrine facilities is as high as 95 per cent in Kerala, 91 per cent in Mizoram
and 89 percent in Manipur, less than 25 per cent of households have access to latrine facilities within the household premises in Bihar, Chhattisgarh, Jharkhand and Odisha (Table 9.9).
9.50 As per Census 2011, Bihar (77), Chhattisgarh (75), Jharkhand (78) and Odisha (78) are states with more than 75 per cent households having no latrine facilities at all. In this context, the Swachh Bharat

209Social Infrastructure, Employment and Human Development
Table 9.10: State-wise Poverty Situation in 2011-12 (in per cent)Population below poverty line
Rural poverty Urban poverty Total poverty
Less than 10 Goa, Punjab, Himachal Pradesh, Kerala, Sikkim
Goa, Sikkim, Himachal Pradesh, J&K, Mizoram, Kerala, Andhra Pradesh, Tamil Nadu, Meghalaya, Maharashtra, Punjab, Tripura
Goa, Kerala, Himachal Pradesh, Sikkim, Punjab, Andhra Pradesh
10 to 20 Andhra Pradesh, Haryana, Meghalaya, Rajasthan, J&K, Nagaland, Tripura, Tamil Nadu, Uttarakhand
Gujarat, Haryana, Uttarakhand, Rajasthan, West Bengal, Karnataka, Nagaland, Odisha
J&K, Haryana, Uttarakhand, Tamil Nadu, Meghalaya, Tripura, Rajasthan, Gujarat, Maharashtra, Nagaland, West Bengal
20 to 30 Gujarat, West Bengal, Maharashtra, Karnataka
Arunachal Pradesh, Assam, Madhya Pradesh, Chhattisgarh, Jharkhand, Uttar Pradesh
Mizoram, Karnataka, Uttar Pradesh
30 to 40 Arunachal Pradesh, Manipur, Madhya Pradesh, Assam, Uttar Pradesh, Bihar, Odisha, Mizoram,
Bihar, Manipur Madhya Pradesh, Assam, Odisha, Bihar, Arunachal Pradesh, Manipur, Jharkhand, Chhattisgarh
Above 40 Jharkhand, Chhattisgarh
Source: Based on NITI Aayog estimates, 2011-12.
Mission (Gramin) is accelerating efforts to achieve universal sanitation coverage and eliminate open defecation in India by 2 October 2019. It also aims to promote better hygiene amongst the population and improve cleanliness by initiating Solid and Liquid Waste Management (SLWM) projects in villages, towns and cities.
9.51 The progress in sanitation has witnessed a spurt since the launch of the Swachh Bharat Mission. In its first year, i.e. from 2 October 2014 to 2 October 2015, 88 lakh toilets were constructed, against an expected outcome of 60 lakhs. More than 122 lakh toilets have already been constructed in rural areas so far under the mission. Sanitation coverage, which stood at 40.60 per cent as per NSSO data, has risen to around 48.8 per cent as on 31 December 2015. The Swachh Bharat Mission will begin to show intended results if the constructed toilets are maintained after construction and also utilized by the beneficiaries.
9.52 In order to improve availability of drinking water in rural areas, the National Rural Drinking Water Programme (NRDWP) initiated a new project supported by the World Bank, the ‘Rural Water Supply and Sanitation Project–Low Income States’ with a total cost of R 6000 crore. The project aims to provide safe, 24 x 7 piped drinking water supply to 7.8 million rural population in four low-income States--Assam, Bihar, Uttar Pradesh and Jharkhand--that have the lowest piped water supply and sanitation facilities. As on 31 December 2015, the project has implemented 275 single and multi-village piped drinking water supply schemes through the decentralized delivery mechanism of empowered Gram Panchayat Water and Sanitation Committees.
poverTy
9.53 Poverty estimates based on the Tendulkar Committee methodology using household consumption expenditure survey data collected by the NSSO in its 68th round
210 Economic Survey 2015-16
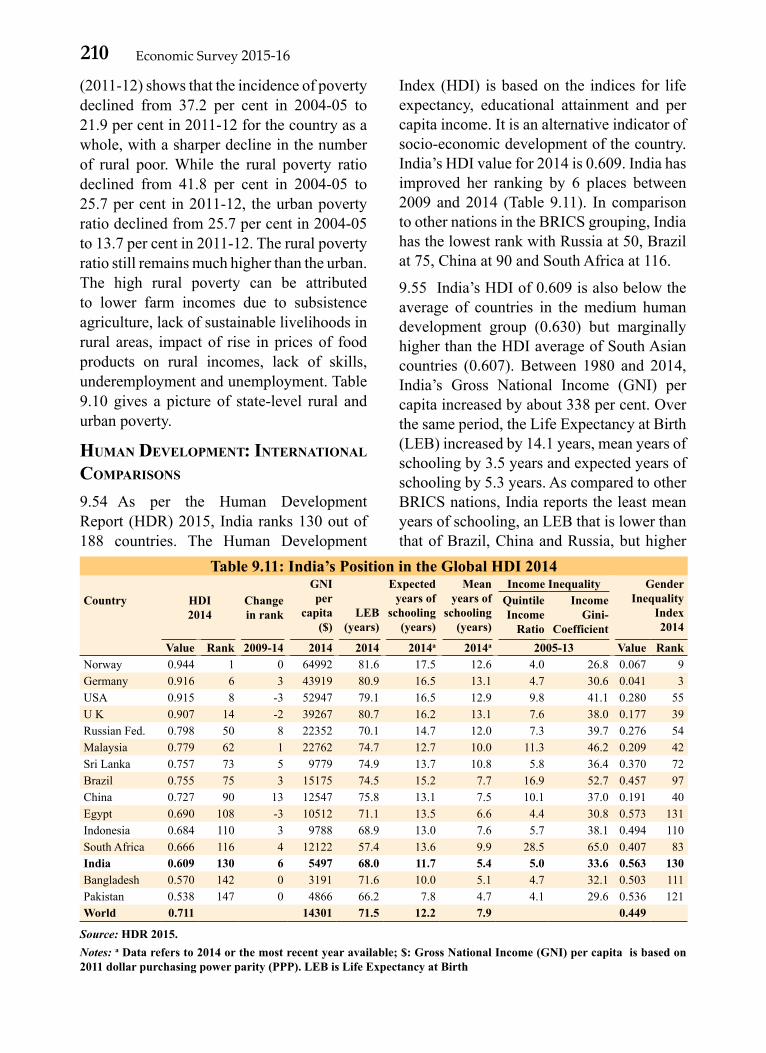
Table 9.11: India’s Position in the Global HDI 2014
Country
HDI 2014
Change in rank
GNI per
capita ($)
LEB (years)
Expected years of
schooling (years)
Mean years of
schooling (years)
Income Inequality Gender Inequality
Index 2014
Quintile Income
Ratio
Income Gini-
Coefficient
Value Rank 2009-14 2014 2014 2014a 2014a 2005-13 Value Rank
Norway 0.944 1 0 64992 81.6 17.5 12.6 4.0 26.8 0.067 9Germany 0.916 6 3 43919 80.9 16.5 13.1 4.7 30.6 0.041 3USA 0.915 8 -3 52947 79.1 16.5 12.9 9.8 41.1 0.280 55U K 0.907 14 -2 39267 80.7 16.2 13.1 7.6 38.0 0.177 39Russian Fed. 0.798 50 8 22352 70.1 14.7 12.0 7.3 39.7 0.276 54Malaysia 0.779 62 1 22762 74.7 12.7 10.0 11.3 46.2 0.209 42Sri Lanka 0.757 73 5 9779 74.9 13.7 10.8 5.8 36.4 0.370 72Brazil 0.755 75 3 15175 74.5 15.2 7.7 16.9 52.7 0.457 97China 0.727 90 13 12547 75.8 13.1 7.5 10.1 37.0 0.191 40Egypt 0.690 108 -3 10512 71.1 13.5 6.6 4.4 30.8 0.573 131Indonesia 0.684 110 3 9788 68.9 13.0 7.6 5.7 38.1 0.494 110South Africa 0.666 116 4 12122 57.4 13.6 9.9 28.5 65.0 0.407 83India 0.609 130 6 5497 68.0 11.7 5.4 5.0 33.6 0.563 130
Bangladesh 0.570 142 0 3191 71.6 10.0 5.1 4.7 32.1 0.503 111Pakistan 0.538 147 0 4866 66.2 7.8 4.7 4.1 29.6 0.536 121World 0.711 14301 71.5 12.2 7.9 0.449
Source: HDR 2015.
Notes: a Data refers to 2014 or the most recent year available; $: Gross National Income (GNI) per capita is based on 2011 dollar purchasing power parity (PPP). LEB is Life Expectancy at Birth
(2011-12) shows that the incidence of poverty declined from 37.2 per cent in 2004-05 to 21.9 per cent in 2011-12 for the country as a whole, with a sharper decline in the number of rural poor. While the rural poverty ratio declined from 41.8 per cent in 2004-05 to 25.7 per cent in 2011-12, the urban poverty ratio declined from 25.7 per cent in 2004-05 to 13.7 per cent in 2011-12. The rural poverty ratio still remains much higher than the urban. The high rural poverty can be attributed to lower farm incomes due to subsistence agriculture, lack of sustainable livelihoods in rural areas, impact of rise in prices of food products on rural incomes, lack of skills, underemployment and unemployment. Table 9.10 gives a picture of state-level rural and urban poverty.
human developmenT: inTernaTional comparisons
9.54 As per the Human Development Report (HDR) 2015, India ranks 130 out of 188 countries. The Human Development
Index (HDI) is based on the indices for life expectancy, educational attainment and per capita income. It is an alternative indicator of socio-economic development of the country. India’s HDI value for 2014 is 0.609. India has improved her ranking by 6 places between 2009 and 2014 (Table 9.11). In comparison to other nations in the BRICS grouping, India has the lowest rank with Russia at 50, Brazil at 75, China at 90 and South Africa at 116.
9.55 India’s HDI of 0.609 is also below the average of countries in the medium human development group (0.630) but marginally higher than the HDI average of South Asian countries (0.607). Between 1980 and 2014, India’s Gross National Income (GNI) per capita increased by about 338 per cent. Over the same period, the Life Expectancy at Birth (LEB) increased by 14.1 years, mean years of schooling by 3.5 years and expected years of schooling by 5.3 years. As compared to other BRICS nations, India reports the least mean years of schooling, an LEB that is lower than that of Brazil, China and Russia, but higher
211Social Infrastructure, Employment and Human Development
Table 9.12: HDI Component Indices of Select Countries 2014 and 1980
Country
HDI 2014 HDI 1980
LEB (years)
Expected years of
schooling (years)a
Mean years of
schooling (years)a
GNI per capita($)
HDI Value
LEB (years)
Expected years of
schooling (years)
Mean years of
schooling (years)
GNI per capita($)
HDI Value
Russian Fed. 70.1 14.7 12.0 22352 0.798 67.3 12.2 7.1Sri Lanka 74.9 13.7 10.8 9779 0.757 68.2 10.0 7.1 2562 0.571 Brazil 74.5 15.2 7.7 15175 0.755 62.0 9.9 2.5 10457 0.547China 75.8 13.1 7.5 12547 0.727 66.5 8.4 3.9 758 0.430South Africa^ 57.4 13.6 9.9 12122 0.666 56.9 11.1 4.8 9756 0.569India 68.0 11.7 5.4 5,497 0.609 53.9 6.4 1.9 1255 0.362Bangladesh 71.6 10.0 5.1 3191 0.570 53.5 4.9 2.0 1148 0.338Pakistan 66.2 7.8 4.7 4866 0.538 57.0 3.7 1.8 2437 0.353
Source: HDR 2015.Notes: a Data refers to 2014 or the most recent year available; $: Gross National Income (GNI) per capita is based on 2011 dollar purchasing power parity (PPP); ^ In respect of South Africa, data for 1980 is based on HDR 2014.
Table 9.13: GDI Component Indices of Select Countries 2014
Country
GDI HDI ValueLEB
(years)Expected years
of schoolingMean years of
schoolingGNI
per capita in($)
Value Group
2014 2014 2014a 2014a 2014 2014
Female Male Female Male Female Male Female Male Female Male Female Male
Sri Lanka 0.948 3 0.730 0.769 78.2 71.5 14.2 13.3 10.7 10.9 5452 14307China 0.943 3 0.705 0.747 77.3 74.3 13.2 12.9 6.9 8.2 10128 14795India 0.795 5 0.525 0.660 69.5 66.6 11.3 11.8 3.6 7.2 2116 8656
Bangladesh 0.917 4 0.541 0.590 72.9 70.4 10.3 9.7 4.5 5.5 2278 4083Pakistan 0.726 5 0.436 0.601 67.2 65.3 7.0 8.5 3.1 6.2 1450 8100
Source: HDR 2015.
Notes: Countries are categorized into five Groups based on their absolute deviations of HDI values between men and women. Group 5 represents low equality of HDI values between men and women with above 10 per cent absolute deviations. a Data refers to 2014 or the most recent year available; $: Gross National Income (GNI) per capita is based on 2011 dollar purchasing power parity (PPP).
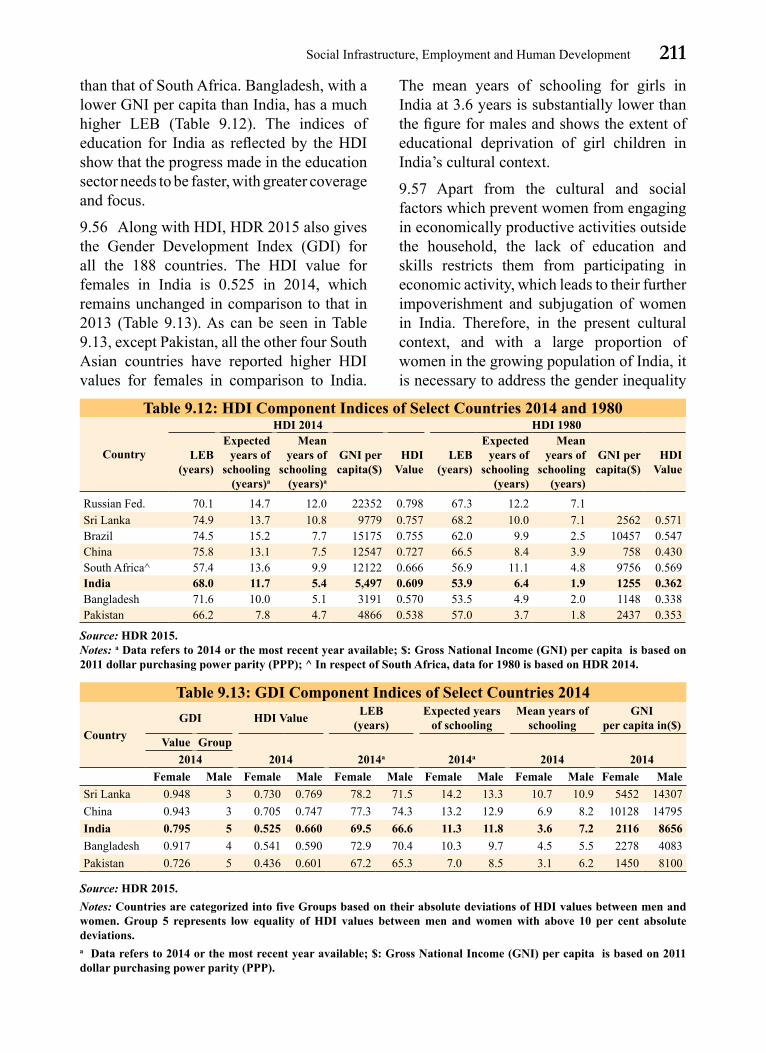
than that of South Africa. Bangladesh, with a lower GNI per capita than India, has a much higher LEB (Table 9.12). The indices of education for India as reflected by the HDI show that the progress made in the education sector needs to be faster, with greater coverage and focus.
9.56 Along with HDI, HDR 2015 also gives the Gender Development Index (GDI) for all the 188 countries. The HDI value for females in India is 0.525 in 2014, which remains unchanged in comparison to that in 2013 (Table 9.13). As can be seen in Table 9.13, except Pakistan, all the other four South Asian countries have reported higher HDI values for females in comparison to India.
The mean years of schooling for girls in India at 3.6 years is substantially lower than the figure for males and shows the extent of educational deprivation of girl children in India’s cultural context.
9.57 Apart from the cultural and social factors which prevent women from engaging in economically productive activities outside the household, the lack of education and skills restricts them from participating in economic activity, which leads to their further impoverishment and subjugation of women in India. Therefore, in the present cultural context, and with a large proportion of women in the growing population of India, it is necessary to address the gender inequality

212 Economic Survey 2015-16
that is pervasive in education, health and other socio-economic spheres in India.
gender issues
9.58 Gender discrimination in India, which is embedded in the social fabric, continues in most spheres such as access to education, to social and economic opportunities. The reliance on a legal system to offer gender equality and justice, has not built in a time dimension in the dispensation of justice. Further, dependence on schemes and programmes with inadequate coverage, outlays, inefficiencies and leakages in the delivery mechanism, the social, economic and legal condition of women shows inadequate improvement in terms of several indicators. Gender discrimination in India starts from the womb with sex determination tests and abortion of the female foetuses, discrimination in terms of nutrition offered to the girl child, the length and type of schooling the girl child avails of vis-à-vis her male siblings, inadequate or lack of access to higher education, discrimination in opportunities of employment and wages paid and unequal share in inheritance.
9.59 Society and the Government has relied on the legal route to address each of these discriminations, without matching changes in the social fabric or role model set by leaders in society from all spheres. The legal route suffers from several shortcomings, especially in terms of time taken for dispensation of justice. For each of the above discrimination, there is a law so all acts of discrimination are illegal, however, compliance requires a lot more to be done.
9.60 As per the status of disposal of cases involving ‘Crimes against Women’ taken up by Courts of Law reported by the National Crime Records Bureau (NCRB) in 2013, out of 38,901 'Dowry death’ cases registered, only 13.6 per cent of cases have been tried, out of which only 4.4 per cent cases have resulted in convictions. The deterrent effect
of conviction under a law is nullified by the slow disposal of cases and low conviction rates in crimes against women like ‘Dowry death’.
9.61 A social problem can to a large extent be addressed by overall economic improvement, since there would be more for the family and the female members of the household will be less deprived of the basic rights to education, health and other needs. Additionally, the pathways to direct economic empowerment of women require education, skill development and employment of women in productive spheres of activity.
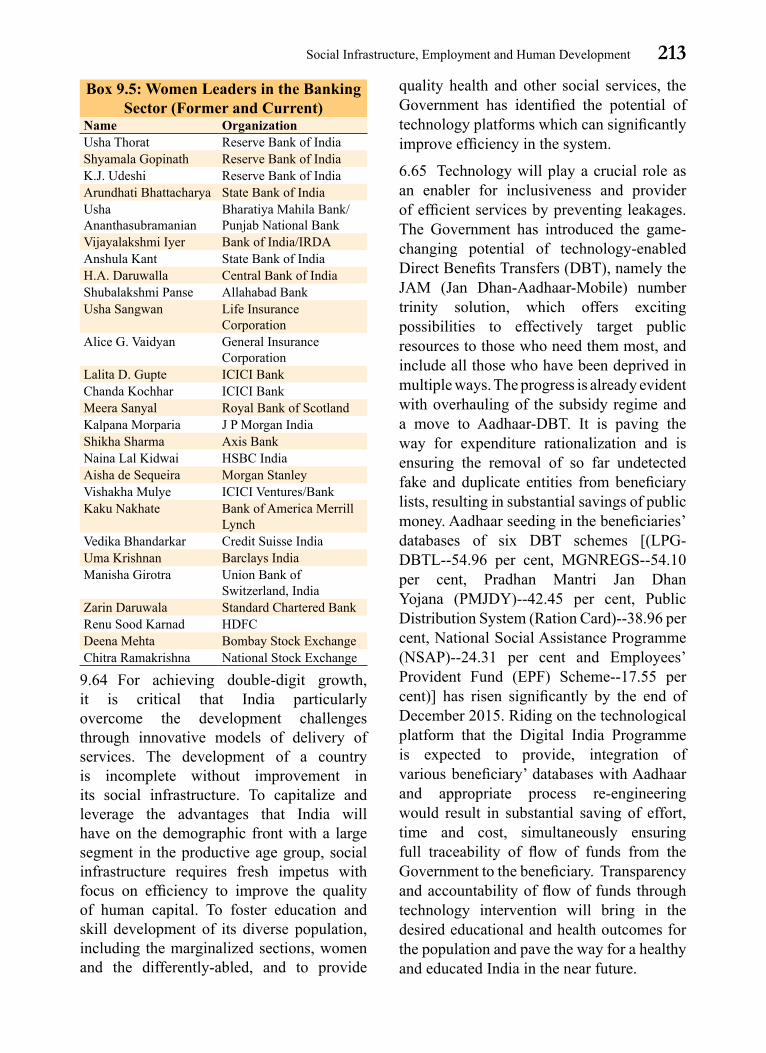
9.62 Women are still positioned outside the ambit of economic empowerment and financial inclusion. In 2012, only 24.2 per cent of females had accounts in scheduled commercial banks as per the ‘Basic Statistical Returns of Scheduled Commercial Banks’. In rural areas, the percentage of women with bank accounts was 25.5 per cent and in urban areas 23.6 per cent. By 2014, the per cent of women with bank accounts reached only 27.5 per cent at the all India level, and in rural areas it was 26.9 per cent. In urban areas, the per cent of women with bank accounts was 27.2 per cent. Even in metropolitan areas only 29.7 per cent women have accounts with scheduled commercial banks. However, despite the socio-cultural milieu and in respect of access to banking services in India, achievements made by women in the financial sector are remarkable (Box 9.5).
conclusion
9.63 There is a need to improve the quality of education provided in schools to arrest and reverse the decline in enrolment in government schools and improve the educational outcomes in both public and private schools. An important contributor to improvement in the quality of education would be an increase in the percentage of qualified teachers.
213Social Infrastructure, Employment and Human Development
Box 9.5: Women Leaders in the Banking Sector (Former and Current)
Name OrganizationUsha Thorat Reserve Bank of IndiaShyamala Gopinath Reserve Bank of IndiaK.J. Udeshi Reserve Bank of IndiaArundhati Bhattacharya State Bank of IndiaUsha Ananthasubramanian
Bharatiya Mahila Bank/ Punjab National Bank
Vijayalakshmi Iyer Bank of India/IRDAAnshula Kant State Bank of IndiaH.A. Daruwalla Central Bank of India Shubalakshmi Panse Allahabad BankUsha Sangwan Life Insurance
CorporationAlice G. Vaidyan General Insurance
CorporationLalita D. Gupte ICICI BankChanda Kochhar ICICI BankMeera Sanyal Royal Bank of ScotlandKalpana Morparia J P Morgan IndiaShikha Sharma Axis BankNaina Lal Kidwai HSBC IndiaAisha de Sequeira Morgan StanleyVishakha Mulye ICICI Ventures/BankKaku Nakhate Bank of America Merrill
LynchVedika Bhandarkar Credit Suisse IndiaUma Krishnan Barclays IndiaManisha Girotra Union Bank of
Switzerland, India Zarin Daruwala Standard Chartered Bank Renu Sood Karnad HDFCDeena Mehta Bombay Stock ExchangeChitra Ramakrishna National Stock Exchange
9.64 For achieving double-digit growth, it is critical that India particularly overcome the development challenges through innovative models of delivery of services. The development of a country is incomplete without improvement in its social infrastructure. To capitalize and leverage the advantages that India will have on the demographic front with a large segment in the productive age group, social infrastructure requires fresh impetus with focus on efficiency to improve the quality of human capital. To foster education and skill development of its diverse population, including the marginalized sections, women and the differently-abled, and to provide
quality health and other social services, the Government has identified the potential of technology platforms which can significantly improve efficiency in the system.
6.65 Technology will play a crucial role as an enabler for inclusiveness and provider of efficient services by preventing leakages. The Government has introduced the game-changing potential of technology-enabled Direct Benefits Transfers (DBT), namely the JAM (Jan Dhan-Aadhaar-Mobile) number trinity solution, which offers exciting possibilities to effectively target public resources to those who need them most, and include all those who have been deprived in multiple ways. The progress is already evident with overhauling of the subsidy regime and a move to Aadhaar-DBT. It is paving the way for expenditure rationalization and is ensuring the removal of so far undetected fake and duplicate entities from beneficiary lists, resulting in substantial savings of public money. Aadhaar seeding in the beneficiaries’ databases of six DBT schemes [(LPG-DBTL--54.96 per cent, MGNREGS--54.10 per cent, Pradhan Mantri Jan Dhan Yojana (PMJDY)--42.45 per cent, Public Distribution System (Ration Card)--38.96 per cent, National Social Assistance Programme (NSAP)--24.31 per cent and Employees’ Provident Fund (EPF) Scheme--17.55 per cent)] has risen significantly by the end of December 2015. Riding on the technological platform that the Digital India Programme is expected to provide, integration of various beneficiary’ databases with Aadhaar and appropriate process re-engineering would result in substantial saving of effort, time and cost, simultaneously ensuring full traceability of flow of funds from the Government to the beneficiary. Transparency and accountability of flow of funds through technology intervention will bring in the desired educational and health outcomes for the population and pave the way for a healthy and educated India in the near future.