Embed Size (px)
Citation preview
WP 15/17
Social interactions in inappropriate behavior for
childbirth services: theory and evidence from the Italian
hospital sector
Calogero Guccio & Domenico Lisi
September 2015
http://www.york.ac.uk/economics/postgrad/herc/hedg/wps/
1
Social interactions in inappropriate behavior for childbirth services:
Theory and evidence from the Italian hospital sector
Calogero Guccio, Domenico Lisi*
Department of Economics and Business, University of Catania
Abstract
Empirical evidence supports the conjecture that social interactions among agents can
produce both positive and negative effects. We build on this literature by exploring the role of
social interactions in the hospital sector using the large incidence of cesarean sections,
usually considered an inappropriate outcome in the childbirth service. In doing so, we lay out
a simple model of hospitals’ behavior where the effect of peers’ behavior emerges simply by
sharing the same institutional authority responsible for auditing inappropriate behavior. In
this setting, enforcement congestion induces a peer effect among hospitals that could make
inappropriate behaviors more likely. Then, using the risk-adjusted cesarean section rate of a
large panel of Italian hospitals, we empirically investigate whether the behavior of each
hospital is affected by the behavior of hospitals within the same region, after controlling for
demand, supply, and financial factors. In particular, our empirical test employs both peer
effects estimate and the spatial econometric approach, exploiting the panel dimension of our
data. Both estimates show a significant and strong presence of peer effects among hospitals.
We interpret this evidence as a presence of constraint interactions within the hospital sector,
which has important implications for healthcare policies against inappropriateness.
JEL Classification: I11, C31
Keywords: social interactions, peer effects, cesarean section, spatial econometrics.
* Corresponding author: Department of Economics and Business, University of Catania, Corso Italia 55, 95129 Catania, Italy. E-mail
address: [email protected]. Domenico Lisi gratefully acknowledges financial support by the European Commission within the Seventh
Framework Programme (FP7) for the "International Research Project on Financing Quality in Healthcare". The usual disclaimer applies.
2
1. Introduction
Over the past several decades, the role of social interactions has become increasingly
important in economic discussions. Even if the origin of social interactions can be found in
the sociological literature (Crane, 1991; Mayer, 1991), by now it is acknowledged that the
interaction among agents can produce both positive and negative effects. For instance,
economic literature in education investigates the positive effects on students’ outcomes of the
interaction with classmates (Epple and Romano, 1998, 2011; Sacerdote, 2001; Zimmerman,
2003). Similarly, in health economics literature Apouey and Picone (2014) show the existence
of social interactions for malaria preventive behaviors. On the other hand, negative effects of
interaction have been found in crime (Glaeser et al., 1996), tax evasion (Galbiati and Zanella,
2012) and health behavior (Trogdon et al., 2008; Auld, 2011).
In this study, we explore the role of social interactions in inappropriate behavior in
hospitals. More specifically, we first derive a model of hospitals’ behavior where the effect of
peers’ behavior emerges simply by sharing the same institutional authority responsible for
auditing inappropriate behavior. In particular, the enforcement congestion generated by the
audit system induces a peer effect among hospitals that could make inappropriate behaviors
more likely. Then, we test our predictions using the risk-adjusted cesarean section rate in a
large panel of Italian hospitals for the period 2007–2012 as a case study. Our focus on this
form of social interaction in the Italian hospital sector, as opposed to others such as social
norms and trust, reflects the institutional setting of the Italian NHS, which is characterized by
a high degree of decentralization at the regional level1. In fact, each region is responsible for
its healthcare services and cannot afford to prosecute inappropriate behavior in all hospitals
within the region; therefore, inappropriate behavior of hospitals within a region makes the
open road to the inappropriate behavior of their peers.
Since our empirical test aims to ascertain whether being “surrounded” by other hospitals
who are more likely to use (inappropriate) medical procedures has an impact on hospitals’
behavior, focusing on cesarean sections seems particularly appropriate. The recent worldwide
upward trend in cesarean rates (OECD, 2011) has drawn the attention of both scholars and
1 The Italian NHS is an especially interesting case for testing our hypothesis, as decentralization processes have
made the Regional Health Authorities the main institutional authorities for each hospital and, in particular, the
third-party payers for the health services provided. Moreover, not only Italy exhibits one of the highest cesarean
rates among the OECD countries but, as a result of the high decentralization, great variation exists across regions
both in the regulation and in the delivery of childbirth services (e.g., Francese et al., 2014; Cavalieri et al., 2014).
3
policymakers, raising concern about the clinical appropriateness of some cesarean deliveries2.
Furthermore, cesarean section rates exhibit an extraordinarily high variation among regions
(Grant, 2005; Baicker et al., 2006), even after adjusting for risk factors. In Italy, about 38% of
all child deliveries are performed via cesarean section, a percentage well beyond the WHO
(1985) recommended level of 15%. In this regard, among others3, a recent national report by
the Italian Ministry of Health concluded that 43% of the cesarean sections executed in 2010
appeared unjustified, based on information in the patients’ discharge records.
Along with clinical factors, many explanations for high cesarean rates have been
explored in the literature, including maternal age (Abdul-Rahim et al., 2009), physicians’
perceptions of the safety of the procedure (Hopkins, 2000; Kabakian-Khasholian et al., 2007),
“defensive medicine” (Dubay et al., 1999; Grant and McInnes, 2004), social and cultural
factors (Lo, 2003; Hsu et al., 2008). However, together these factors do not account for the
majority of the observed variation. For this reason, many studies have investigated the
hypothesis that providers are motivated by financial incentives in their choice of child
delivery method, finding that they play a significant role in explaining cesarean section rates
(Gruber et al., 1999; Grant, 2009). With regard to Italy, Cavalieri et al. (2014) find that
whenever the regional reimbursement policy favors cesarean sections, providers have an
incentive to shift deliveries to the more highly reimbursed cesarean procedure.
Indeed, the problem of financial incentives motivating inappropriate behavior in
hospitals is not specific to cesarean sections, rather it is a more general problem associated
with the tariff systems4. Therefore, many NHSs have tried to combine the tariff system with
some form of auditing to combat the unintended consequences of tariff mechanisms (Busse et
al., 2011). Nonetheless, while diverting considerable human and financial resources, audit
systems do not seem to be effective in stemming inappropriate behavior in health systems
(Lomas et al., 1991; Ivers et al., 2012), especially in medical procedures in the gray area of
medicine (Chandra et al., 2011), such as childbirth medical services.
In our empirical analysis, we first perform a traditional peer effect estimate, really close
to our model of hospitals’ behavior. As will be shown, our empirical test is a particularly
fortune case of peer effects analysis, since our non-linear model does not suffer from the
2 In particular, in absence of specific therapeutic reasons, the alternative vaginal delivery is generally considered
a more appropriate treatment (e.g., Althabe et al., 2006; Betrán et al., 2007; Belizán et al., 2007). Moreover,
medically unjustified cesarean deliveries have implications not only for patients but also for the overall society,
as they impose a financial burden on the system, while diverting resources from other public services. 3 See e.g., Fortino et al. (2002), Rusticali and Di Virgilio (2010).
4 For a recent discussion on the typical incentives, both desirable and undesirable, associated with the tariff
systems, see e.g. Cots et al. (2011).
4
“reflection problem” of linear-in-mean models (Manski, 1993; Brock and Durlauf, 2007;
Blume et al., 2011). Finally, we conduct the more recent (but less microfounded) spatial
econometric analysis, where the spatial weights matrix is based again on the sharing of the
same institutional authorities, in line with a few contributions claiming the primary
importance of institutions respect to geography (Rodrik et al., 2004; Arbia et al., 2009; Atella
et al., 2014). Both estimates show a significant and strong presence of peer effects among
hospitals, with important implications for healthcare policies against inappropriateness.
The remainder of the paper is structured as follows. In Section 2, we describe our model
of hospitals’ behavior and derive the main implication in terms of peer effects. In Section 3,
we describe our data, along with the Italian hospital system. The empirical strategy is
presented in Section 4, followed by our results in Section 5. Finally, Section 6 concludes with
a discussion on the implications for healthcare policies against inappropriateness.
2. The model
In this section we lay out a model of hospitals’ behavior where the effect of peers’
behavior emerges by sharing the same institutional authority. In this study, hospitals choose
between two competing treatments (i.e., vaginal and cesarean section) for each patient, which
will result in the hospital’s cesarean section rate. Following previous studies on hospital
behavior (Ellis and McGuire, 1986; Chandra et al., 2011), we assume that hospitals select
treatments to maximize their objective function. Therefore, the resulting cesarean section rate
might not be “appropriate” for the overall healthcare system.
Consider a population of N risk neutral hospitals i = 1, 2, …, N, distributed across R
institutional health authorities r = 1, 2, …, R, each of size . The health authorities are the
reference third-party payers for the health services provided by each hospital, as well as being
responsible for the “appropriateness” of the healthcare system in each group r. However, they
operate under a stringent budget constraint, implying that only a fraction of hospitals in each r
can be audited by the reference health authority (RHA).
For each patient, hospitals choose between two competing treatments , where 0 is
usually considered the most appropriate treatment in the absence of specific therapeutic
5
reasons5. Each treatment produces a different benefit for patients, according to patient’s
characteristics . In particular, the utility of patient k from the two treatments is given by6:
(1)
(2)
where the error terms capture the heterogeneity in the benefits of each treatment to that
patient, and follow a standard extreme value distribution . On the other hand,
each treatment implies a different cost , according to the patient’s characteristics
and the hospital’s characteristics .
If hospital i chooses the appropriate treatment for patient k, it chooses 1 over 0 provided
that the improved benefit compensates for the increased costs, that is:
–
–
– (3)
where we have exploited the fact that
. The parameter in
(3) is usually called the value of life and captures the trade-off made by the third-party payer
(RHA) between improved benefit and increased costs (Murphy and Topel, 2006). Equation
(3) represents the probability for patient k of receiving treatment 1 in hospital i. Therefore,
integrating (3) over the distribution of patient’s characteristics produces the
appropriate cesarean section rate of hospital i:
–
–
(4)
However, hospitals select treatments to maximize their objective function. Following
previous studies (McGuire and Pauly, 1991; Chandra et al., 2011), while hospitals consider
the benefit for patients, they also consider the financial incentives associated with the two
treatments. In particular, the welfare for hospital i from providing the two treatments to
patient k are given by:
(5)
(6)
5 As we discussed above, in our specific case the vaginal birth, in absence of specific therapeutic reasons, is
usually considered the more appropriate treatment (e.g., Althabe et al., 2006; Betrán et al., 2007; Belizán et al.,
2007), not only for medical but also for economic reasons. 6 Notice that we are implicitly assuming that patients do not pay any price for the health service they get; or,
alternatively, they pay exactly the same price regardless the treatment, which is essentially the Italian case.
6
where reflects the relative importance of patient benefit respect to financial aspects,
capture the expected revenues from the two treatments as a function of fees, and denote
other contextual factors affecting hospitals in each group r. Specifically, whenever hospitals
claim for treatment 0 (usually considered the most appropriate), they always receive the
established fee,
. In contrast, when hospitals claim for treatment 1, what they
receive depends on being audited by the RHA. In particular, when hospital i is not audited, it
receives for each claim. Instead, when hospital i is audited, it receives a reduction in fee
proportional to the “inappropriate” claims. Therefore, the expected revenue from a treatment
1, in each group r, is given by:
(7)
where is the probability for hospital i of being audited by the RHA for group r.
Reasonably, if hospital i claims an appropriate share of treatment 1 (i.e.,
)7,
according to (7) it does not receive any reduction in fees. Instead, if
, then
hospital i might be subject to a reduction if audited.
As noted earlier, each RHA operates under a stringent budget constraint, implying that
each hospital is audited only with some positive probability. However, the probability of
being audited is not completely random, as the behavior of hospitals provides information to
the RHAs. For the sake of simplicity, we assume the following linear specification, which
captures the effect of hospitals’ behavior within the group r on hospital i’s audit probability:
(8)
The first term of (8) is the random probability of being audited, equal to the fraction of
hospitals the health authority r can afford to audit, with . The other terms
capture the idea that RHAs infer the probability of inappropriate claims from hospitals’
behavior (i.e., from ) and, accordingly, shift their audit resources to more suspicious
hospitals. Indeed, we do not want to model explicitly the way in which RHAs estimate the
probability of inappropriate claims, as it might differ across r. Nonetheless, it is reasonable to
assume that higher is the amount of claims for treatment 1, higher is the estimated probability
of inappropriate claims, that is:
(9)
7 Since
(that is, caesarean section fees are higher than vaginal fees), there should be no
incentive for hospitals to claim
, as the profit associated with cesarean sections is usually higher
than that associated with vaginal delivery. Certainly, this is the case for hospitals in the Italian NHS (e.g.,
Francese et al., 2014; Cavalieri et al., 2014).
7
Interestingly, as long as
, (9) it is enough to imply that:
(10)
(11)
Therefore, when other hospitals within the same group become more suspicious for the RHA,
this reduces hospital i’s probability of being audited and, in turn, increases the expected value
of a marginal inappropriate claim. In other words, the last term of (8) represents the effect of
peers’ behavior on the other hospitals sharing the same RHA.
In contrast to (3), hospital i chooses treatment 1 over treatment 0 for patient k provided
that , that is:
(12)
where and
.
Then, integrating (12) over the distribution of patient’s characteristics , we obtain:
(13)
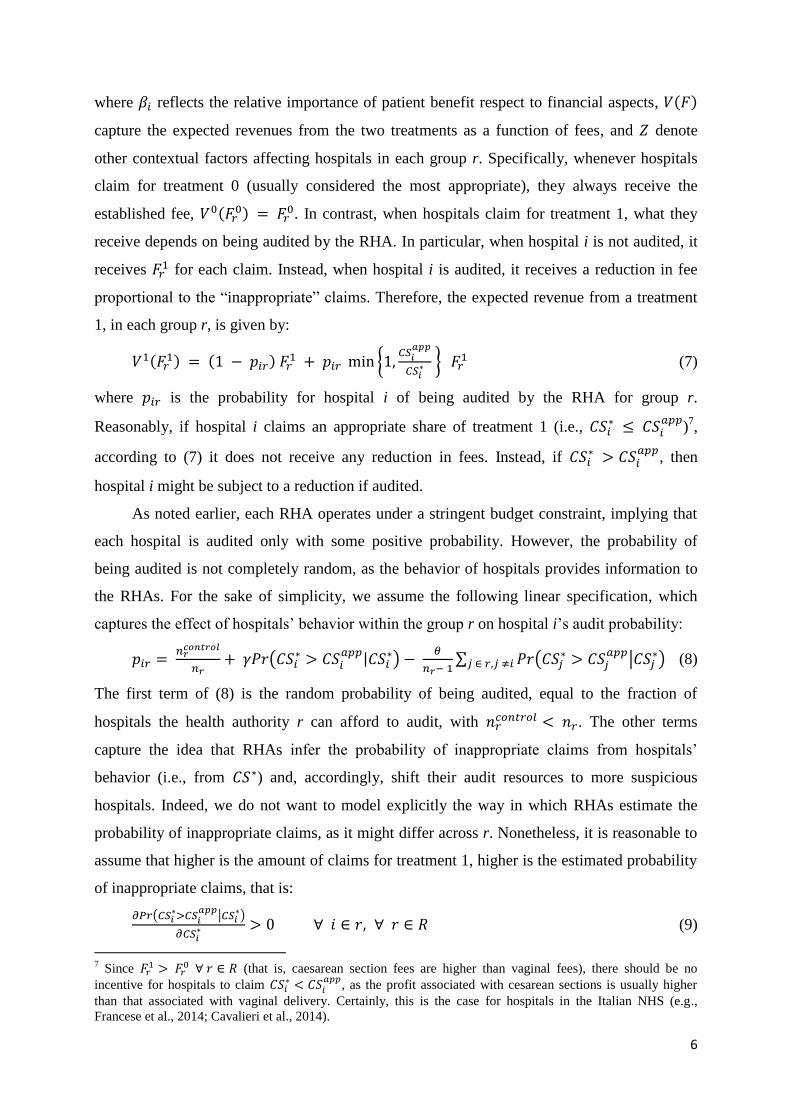
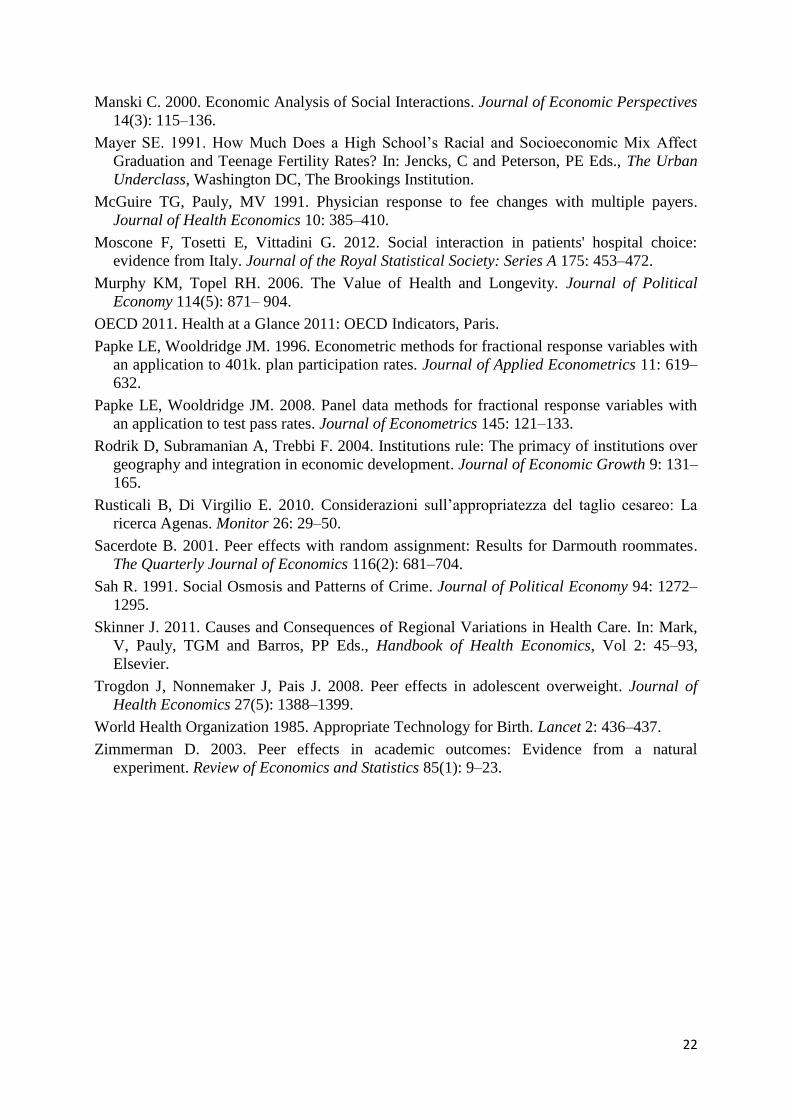
Note that (13) represents the hospital i’s reaction function (as a fixed point), because it tells us
the optimal cesarean section rate as a function of all other hospitals’ (within r) cesarean
section rates. Interestingly, from (10) we have that:
(14)
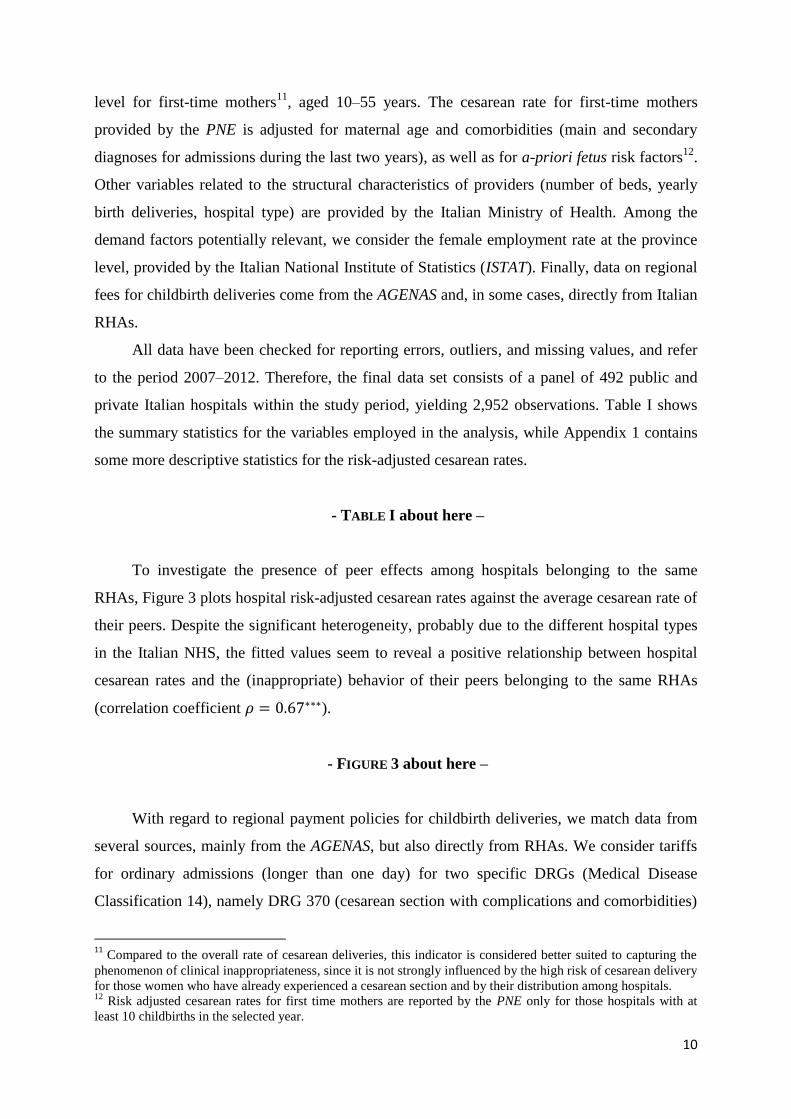
Therefore, as shown in Figure 1, (13) gives a unique best response:
- FIGURE 1 about here –
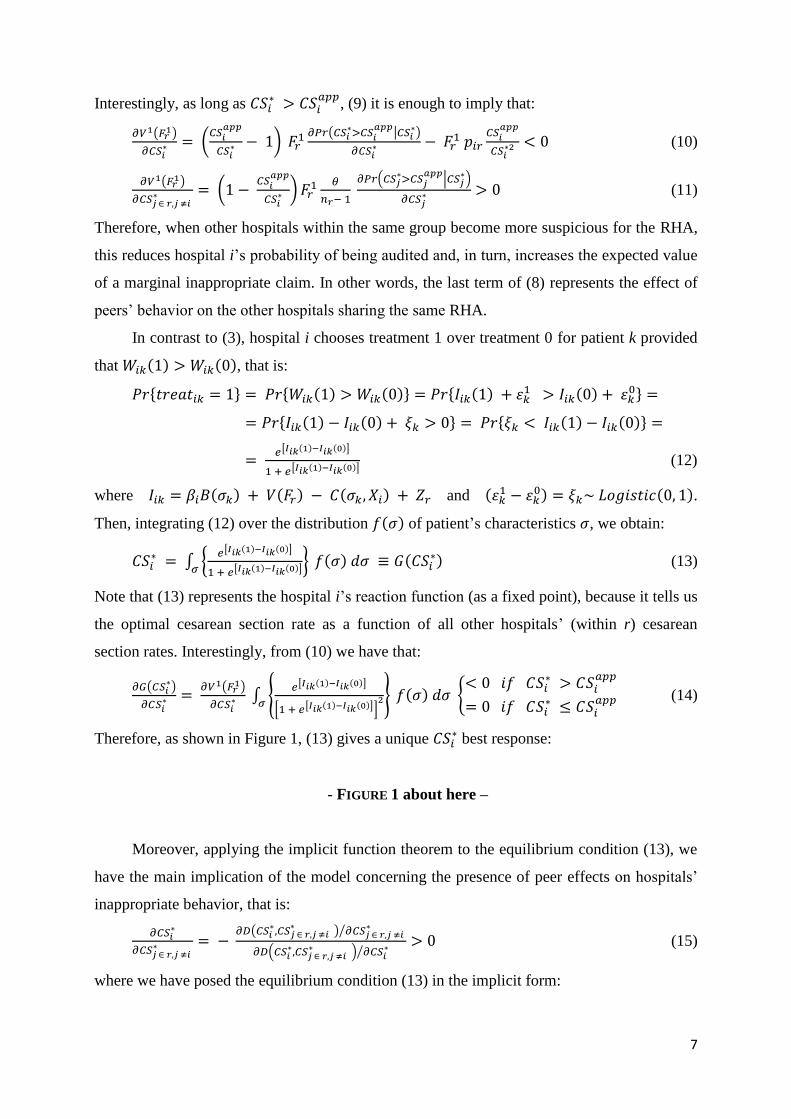
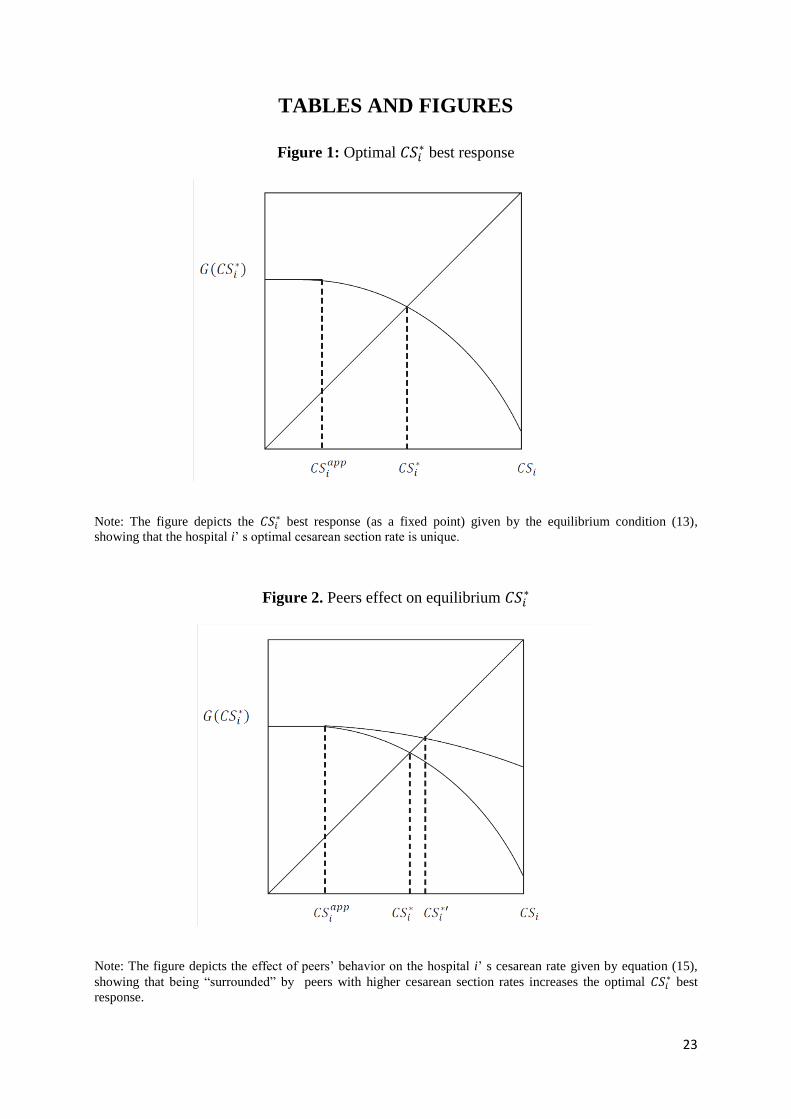
Moreover, applying the implicit function theorem to the equilibrium condition (13), we
have the main implication of the model concerning the presence of peer effects on hospitals’
inappropriate behavior, that is:
(15)
where we have posed the equilibrium condition (13) in the implicit form:
8
(16)
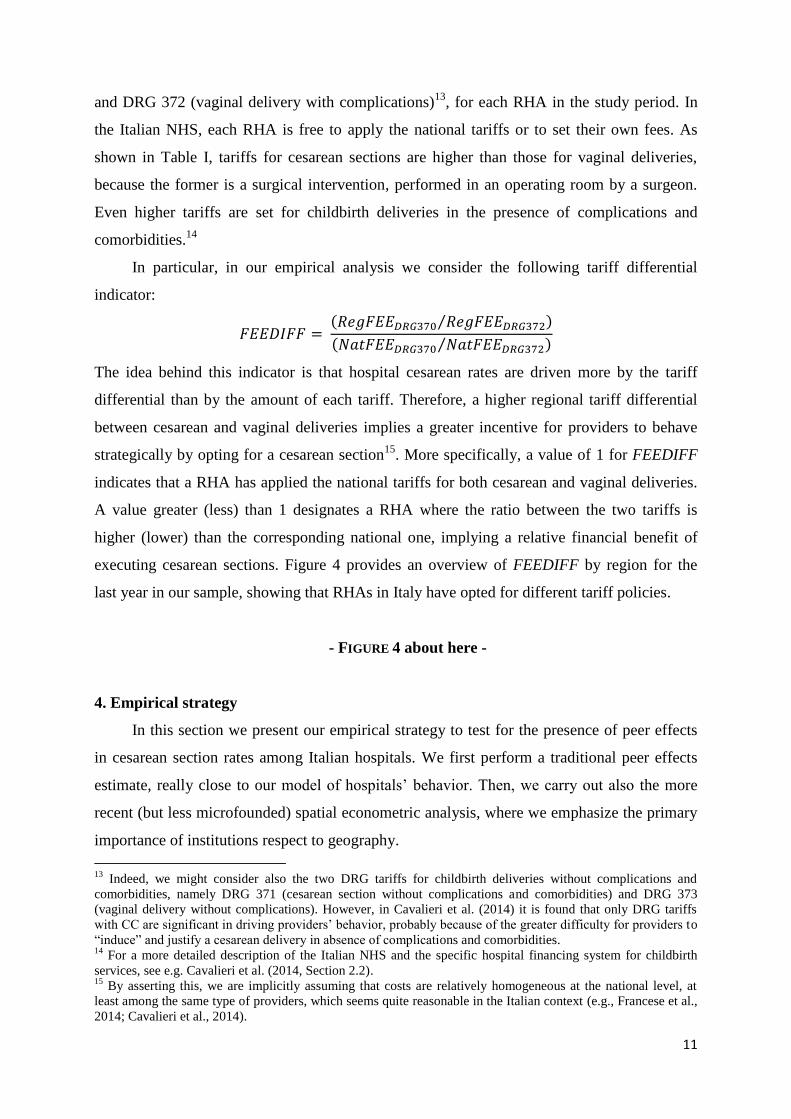
Figure 2 shows the effect of peers’ behavior on hospital i’s cesarean section rate.
- FIGURE 2 about here –
The main intuition behind (15) is that, once other hospitals within r exhibit higher cesarean
section rates, they become relatively more suspicious for the RHA, which accordingly focuses
on them. In other words, peers with higher cesarean section rates reduce the hospital’s
probability of being audited, which increases the expected value of inappropriate claims.
Regardless the extent of peer effects8, the model has a unique Nash equilibrium (as a
fixed point) with many interesting empirical implications. Firstly, the inappropriate behavior
of hospitals and, in particular, cesarean rates should be spatially correlated according to the
sharing of the same institutional authority rather than the geographic distance among peers.
Indeed, this view of peer effects among hospitals differs from the usual interpretation of
learning from the reference school treatment style (Epstein and Nicholson, 2009). Secondly,
the presence of peer effects should generate an excess variance in equilibrium, meaning that
even a small difference in fundamentals among hospitals (belonging to different institutional
authorities) might produce large differences in cesarean section rates. Therefore, peer effects
contribute to explain the large regional variation in health services not explained by
differences in fundamentals (Skinner, 2011).9
To some extent, the aforementioned process generating peer effects is similar to models
of enforcement congestion developed in other strands of literature, such as crime behavior
(Sah, 1991) and tax evasion (Galbiati and Zanella, 2012). However, our model presents the
significant advantage that each hospital can have a limited number of peers within the
8 Linear-in-mean models would need a stability requirement on the magnitude of peer effects, such as the impact
of peers’ behavior on the probability of being audited has to be somewhat lower than the impact of own
behavior (e.g., Galbiati and Zanella, 2012). Provided that probabilities are well-behaved, in our non-linear-in-
mean model such requirement is not needed for guarantee a unique Nash equilibrium, as the equilibrium would
converge in any case, as can be gathered from Figure 2. Nonetheless, this restriction on the magnitude of peer
effects remains certainly reasonable also in our context and, in particular, we will see below that estimated
marginal peer effects are strictly less than 1 in all estimates. 9 The other implications of the model are more standard in the literature on hospital behavior (Chandra et al.,
2011). In particular, to the extent that different hospital types (private vs. public) might evaluate patients utility
differently in their objective function (i.e., ), they could exhibit different equilibrium cesarean section
rates. Similarly, those institutional authorities with a higher fee differential (i.e.,
) could
have hospitals with higher equilibrium cesarean section rates. Finally, as long as the provision of childbirth
services is characterized by economies of scale and/or learning-by-doing effects, hospitals with different
characteristics and/or different degrees of specialization (i.e., ) could also exhibit
different cesarean rates, ceteris paribus.
9
reference group, making more reasonable the idea that agents somehow guess the probability
of being audited by the RHA after observing the behavior of their peers.
An important feature of our model is that we focus on one source of social interaction
only (i.e., constrain interactions within the same RHA), although other social forces may be
at work. Nonetheless, we have good reasons to do so in our context. Firstly, the usual
argument that widespread inappropriate behaviors violate social norms, the strength of which
decreases with the diffusion of such behavior within the reference group, does not seem to
apply in our context, as high cesarean rate is not necessarily viewed as negative by patients
(Grant, 2005; Fusco et al., 2010). Similarly, previous literature on physicians’ treatment styles
(a potential source of preference interactions among peers) shows that physicians do not
significantly change their style of childbirth treatments because of local peer interactions
(Epstein and Nicholson, 2009). Moreover, many studies emphasize that higher tariff
differentials among alternative treatments induce hospitals to shift deliveries to the more
highly reimbursed procedure (Grant, 2009; Cavalieri et al., 2014); thus, it seems reasonable to
investigate whether peers’ behavior within the reference institutional authority represents a
significant constraint for hospitals’ inappropriate behavior. Finally, the source of social
interaction emphasized here identifies the reference group exogenously for each hospital, as
opposed to being the outcome of an arbitrary choice of the researcher. This should represent a
significant advantage of our model, especially for the subsequent empirical analysis, as it is
well known that wrong assumptions on reference groups can be strongly misleading (Conley
and Topa, 2003).
3. Data description
Our empirical analysis uses data provided by several sources. Our dependent variable is
provided by the National Program for Outcome Assessment (PNE) run by the National
Agency for Regional Health Services (AGENAS), together with the Italian Ministry of Health.
Since its inception in 2009, the program has assessed the healthcare activity of all Italian
hospitals, public and private, providing several performance and outcome indicators10
. In
particular, the indicator employed here is the risk-adjusted cesarean section rate at the hospital
10
Overall, 45 performance indicators (32 related to hospital services and 13 to hospitalization) are computed,
mostly using discharge data gathered through the Informative Hospital System (SIO). For more information on
PNE see http://151.1.149.72/pne11_new.
10
level for first-time mothers11
, aged 10–55 years. The cesarean rate for first-time mothers
provided by the PNE is adjusted for maternal age and comorbidities (main and secondary
diagnoses for admissions during the last two years), as well as for a-priori fetus risk factors12
.
Other variables related to the structural characteristics of providers (number of beds, yearly
birth deliveries, hospital type) are provided by the Italian Ministry of Health. Among the
demand factors potentially relevant, we consider the female employment rate at the province
level, provided by the Italian National Institute of Statistics (ISTAT). Finally, data on regional
fees for childbirth deliveries come from the AGENAS and, in some cases, directly from Italian
RHAs.
All data have been checked for reporting errors, outliers, and missing values, and refer
to the period 2007–2012. Therefore, the final data set consists of a panel of 492 public and
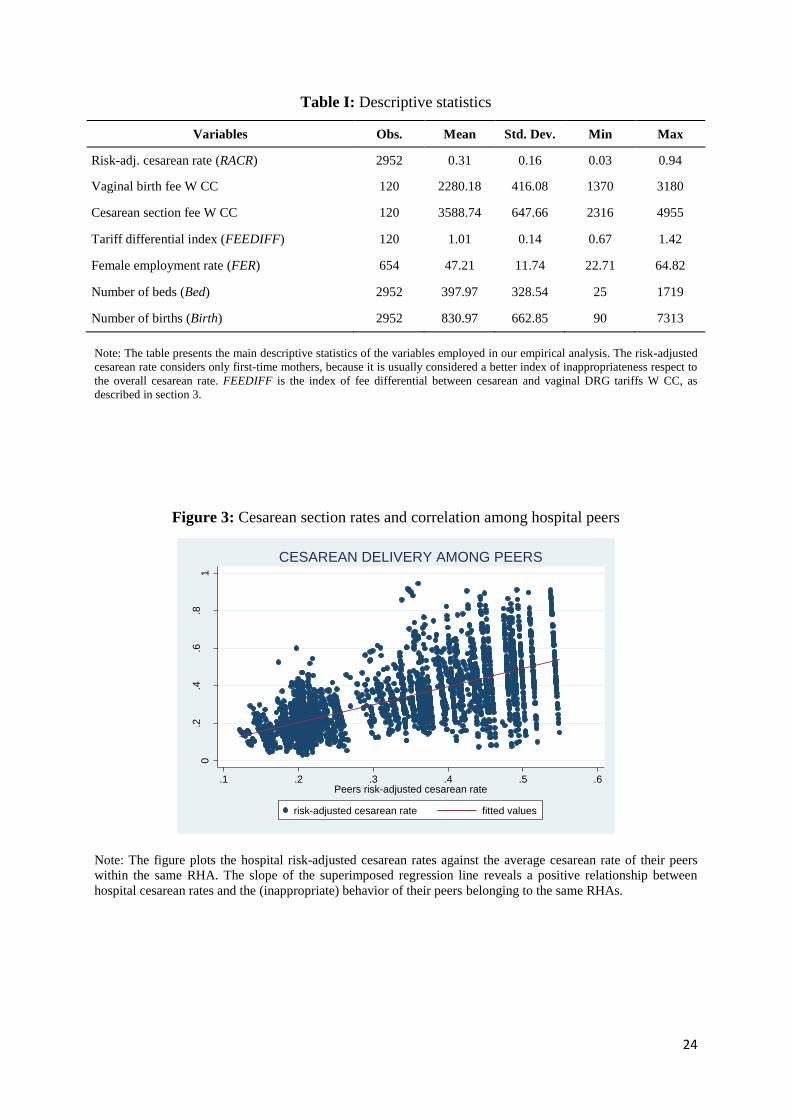
private Italian hospitals within the study period, yielding 2,952 observations. Table I shows
the summary statistics for the variables employed in the analysis, while Appendix 1 contains
some more descriptive statistics for the risk-adjusted cesarean rates.
- TABLE I about here –
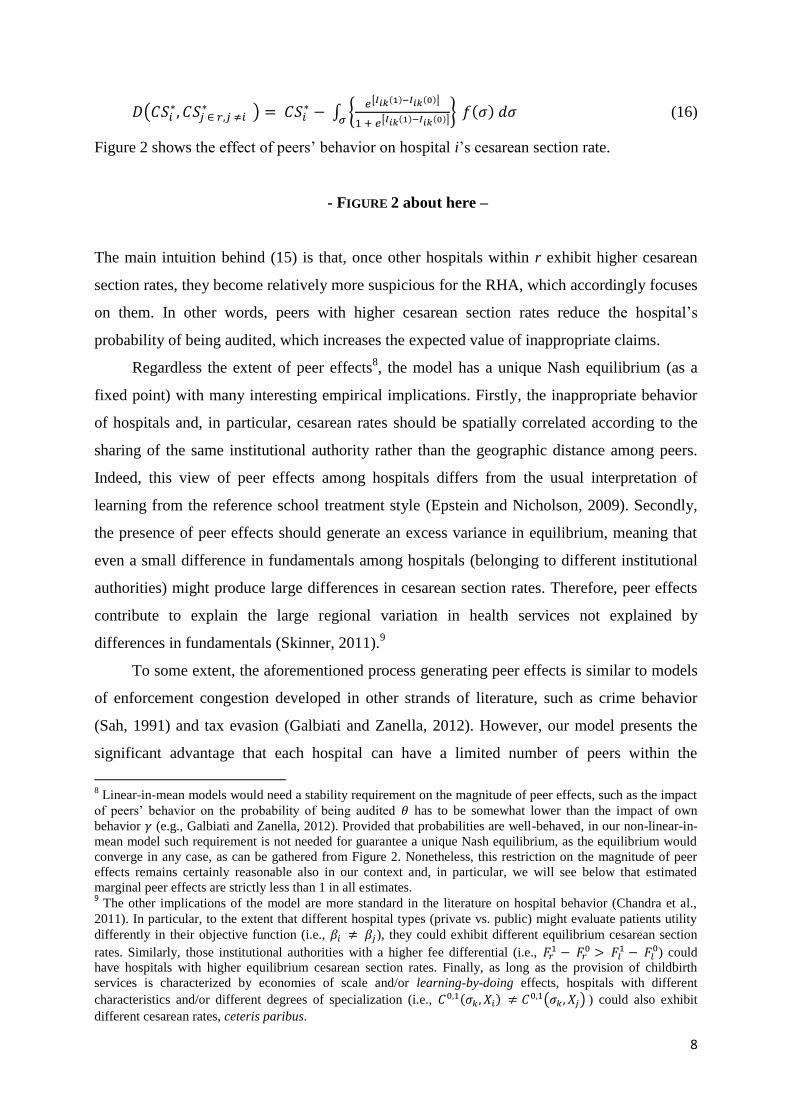
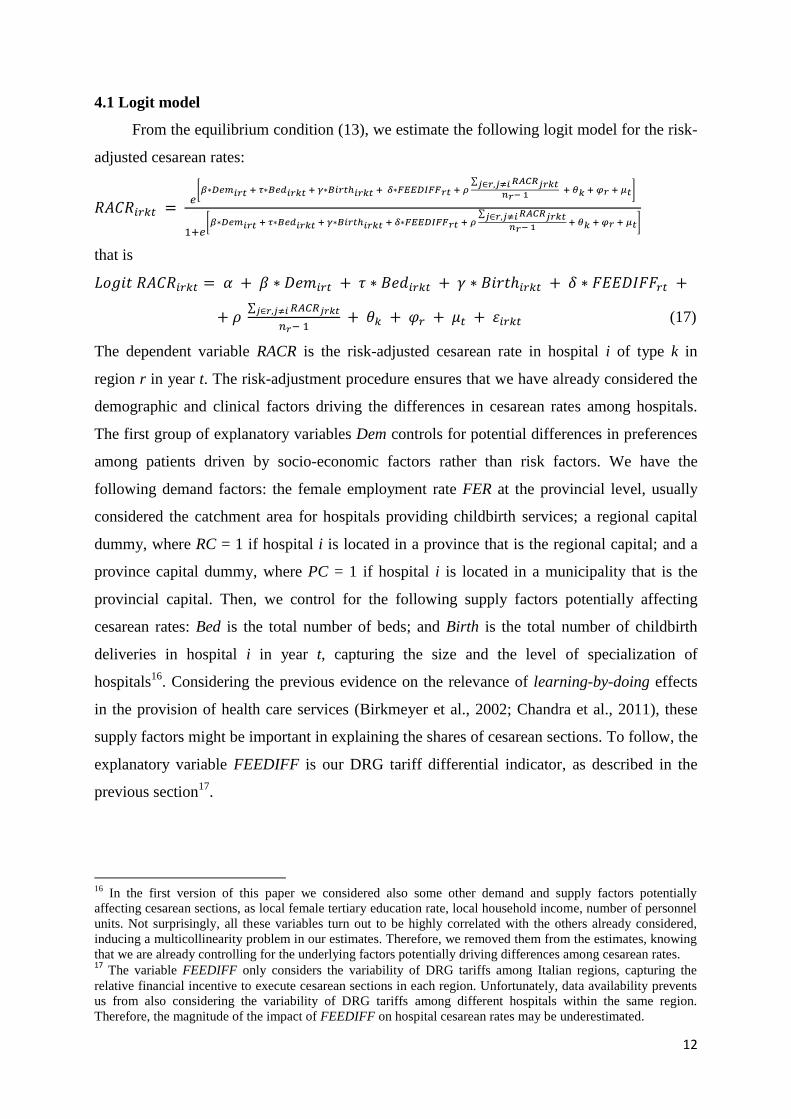
To investigate the presence of peer effects among hospitals belonging to the same
RHAs, Figure 3 plots hospital risk-adjusted cesarean rates against the average cesarean rate of
their peers. Despite the significant heterogeneity, probably due to the different hospital types
in the Italian NHS, the fitted values seem to reveal a positive relationship between hospital
cesarean rates and the (inappropriate) behavior of their peers belonging to the same RHAs
(correlation coefficient ).
- FIGURE 3 about here –
With regard to regional payment policies for childbirth deliveries, we match data from
several sources, mainly from the AGENAS, but also directly from RHAs. We consider tariffs
for ordinary admissions (longer than one day) for two specific DRGs (Medical Disease
Classification 14), namely DRG 370 (cesarean section with complications and comorbidities)
11
Compared to the overall rate of cesarean deliveries, this indicator is considered better suited to capturing the
phenomenon of clinical inappropriateness, since it is not strongly influenced by the high risk of cesarean delivery
for those women who have already experienced a cesarean section and by their distribution among hospitals. 12
Risk adjusted cesarean rates for first time mothers are reported by the PNE only for those hospitals with at
least 10 childbirths in the selected year.
11
and DRG 372 (vaginal delivery with complications)13
, for each RHA in the study period. In
the Italian NHS, each RHA is free to apply the national tariffs or to set their own fees. As
shown in Table I, tariffs for cesarean sections are higher than those for vaginal deliveries,
because the former is a surgical intervention, performed in an operating room by a surgeon.
Even higher tariffs are set for childbirth deliveries in the presence of complications and
comorbidities.14
In particular, in our empirical analysis we consider the following tariff differential
indicator:
The idea behind this indicator is that hospital cesarean rates are driven more by the tariff
differential than by the amount of each tariff. Therefore, a higher regional tariff differential
between cesarean and vaginal deliveries implies a greater incentive for providers to behave
strategically by opting for a cesarean section15
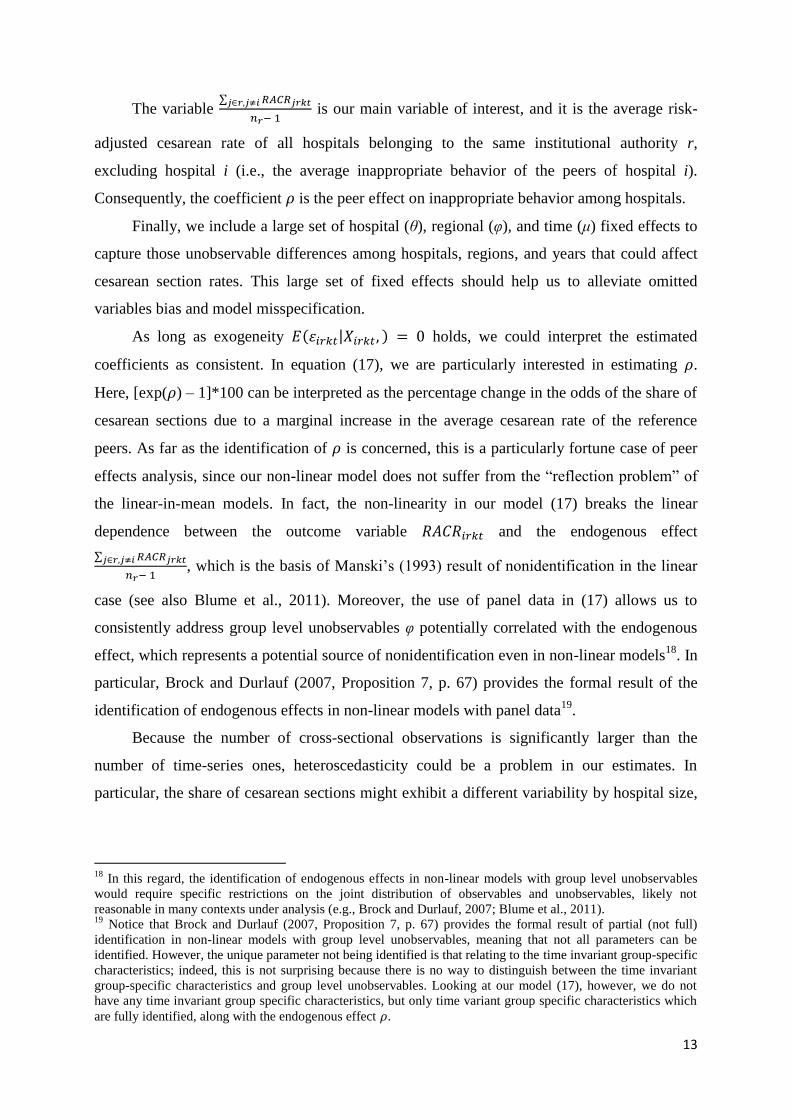
. More specifically, a value of 1 for FEEDIFF
indicates that a RHA has applied the national tariffs for both cesarean and vaginal deliveries.
A value greater (less) than 1 designates a RHA where the ratio between the two tariffs is
higher (lower) than the corresponding national one, implying a relative financial benefit of
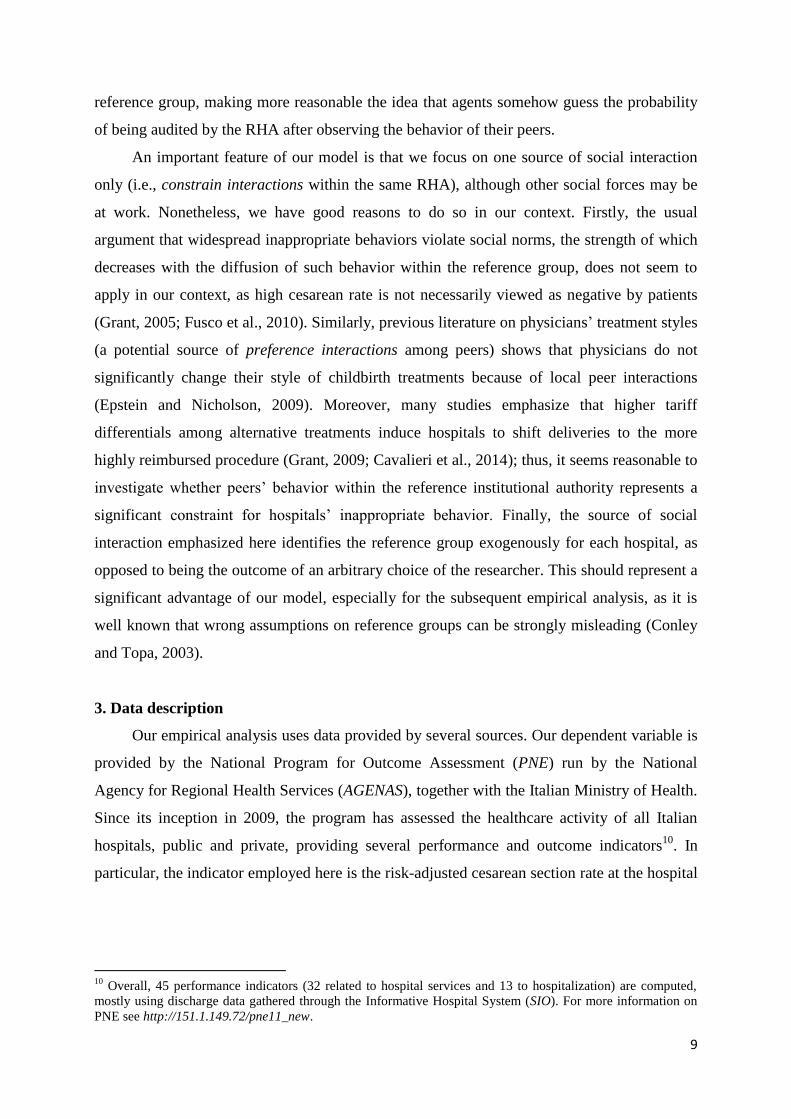
executing cesarean sections. Figure 4 provides an overview of FEEDIFF by region for the
last year in our sample, showing that RHAs in Italy have opted for different tariff policies.
- FIGURE 4 about here -
4. Empirical strategy
In this section we present our empirical strategy to test for the presence of peer effects
in cesarean section rates among Italian hospitals. We first perform a traditional peer effects
estimate, really close to our model of hospitals’ behavior. Then, we carry out also the more
recent (but less microfounded) spatial econometric analysis, where we emphasize the primary
importance of institutions respect to geography.
13
Indeed, we might consider also the two DRG tariffs for childbirth deliveries without complications and
comorbidities, namely DRG 371 (cesarean section without complications and comorbidities) and DRG 373
(vaginal delivery without complications). However, in Cavalieri et al. (2014) it is found that only DRG tariffs
with CC are significant in driving providers’ behavior, probably because of the greater difficulty for providers to
“induce” and justify a cesarean delivery in absence of complications and comorbidities. 14
For a more detailed description of the Italian NHS and the specific hospital financing system for childbirth
services, see e.g. Cavalieri et al. (2014, Section 2.2). 15
By asserting this, we are implicitly assuming that costs are relatively homogeneous at the national level, at
least among the same type of providers, which seems quite reasonable in the Italian context (e.g., Francese et al.,
2014; Cavalieri et al., 2014).
12
4.1 Logit model
From the equilibrium condition (13), we estimate the following logit model for the risk-
adjusted cesarean rates:
that is
(17)
The dependent variable RACR is the risk-adjusted cesarean rate in hospital i of type k in
region r in year t. The risk-adjustment procedure ensures that we have already considered the
demographic and clinical factors driving the differences in cesarean rates among hospitals.
The first group of explanatory variables Dem controls for potential differences in preferences
among patients driven by socio-economic factors rather than risk factors. We have the
following demand factors: the female employment rate FER at the provincial level, usually
considered the catchment area for hospitals providing childbirth services; a regional capital
dummy, where RC = 1 if hospital i is located in a province that is the regional capital; and a
province capital dummy, where PC = 1 if hospital i is located in a municipality that is the
provincial capital. Then, we control for the following supply factors potentially affecting
cesarean rates: Bed is the total number of beds; and Birth is the total number of childbirth
deliveries in hospital i in year t, capturing the size and the level of specialization of
hospitals16
. Considering the previous evidence on the relevance of learning-by-doing effects
in the provision of health care services (Birkmeyer et al., 2002; Chandra et al., 2011), these
supply factors might be important in explaining the shares of cesarean sections. To follow, the
explanatory variable FEEDIFF is our DRG tariff differential indicator, as described in the
previous section17
.
16
In the first version of this paper we considered also some other demand and supply factors potentially
affecting cesarean sections, as local female tertiary education rate, local household income, number of personnel
units. Not surprisingly, all these variables turn out to be highly correlated with the others already considered,
inducing a multicollinearity problem in our estimates. Therefore, we removed them from the estimates, knowing
that we are already controlling for the underlying factors potentially driving differences among cesarean rates. 17
The variable FEEDIFF only considers the variability of DRG tariffs among Italian regions, capturing the
relative financial incentive to execute cesarean sections in each region. Unfortunately, data availability prevents
us from also considering the variability of DRG tariffs among different hospitals within the same region.
Therefore, the magnitude of the impact of FEEDIFF on hospital cesarean rates may be underestimated.
13
The variable
is our main variable of interest, and it is the average risk-
adjusted cesarean rate of all hospitals belonging to the same institutional authority r,
excluding hospital i (i.e., the average inappropriate behavior of the peers of hospital i).
Consequently, the coefficient is the peer effect on inappropriate behavior among hospitals.
Finally, we include a large set of hospital (θ), regional (φ), and time (μ) fixed effects to
capture those unobservable differences among hospitals, regions, and years that could affect
cesarean section rates. This large set of fixed effects should help us to alleviate omitted
variables bias and model misspecification.
As long as exogeneity holds, we could interpret the estimated
coefficients as consistent. In equation (17), we are particularly interested in estimating .
Here, [exp( ) – 1]*100 can be interpreted as the percentage change in the odds of the share of
cesarean sections due to a marginal increase in the average cesarean rate of the reference
peers. As far as the identification of is concerned, this is a particularly fortune case of peer
effects analysis, since our non-linear model does not suffer from the “reflection problem” of
the linear-in-mean models. In fact, the non-linearity in our model (17) breaks the linear
dependence between the outcome variable and the endogenous effect
, which is the basis of Manski’s (1993) result of nonidentification in the linear
case (see also Blume et al., 2011). Moreover, the use of panel data in (17) allows us to
consistently address group level unobservables φ potentially correlated with the endogenous
effect, which represents a potential source of nonidentification even in non-linear models18
. In
particular, Brock and Durlauf (2007, Proposition 7, p. 67) provides the formal result of the
identification of endogenous effects in non-linear models with panel data19
.
Because the number of cross-sectional observations is significantly larger than the
number of time-series ones, heteroscedasticity could be a problem in our estimates. In
particular, the share of cesarean sections might exhibit a different variability by hospital size,
18
In this regard, the identification of endogenous effects in non-linear models with group level unobservables
would require specific restrictions on the joint distribution of observables and unobservables, likely not
reasonable in many contexts under analysis (e.g., Brock and Durlauf, 2007; Blume et al., 2011). 19
Notice that Brock and Durlauf (2007, Proposition 7, p. 67) provides the formal result of partial (not full)
identification in non-linear models with group level unobservables, meaning that not all parameters can be
identified. However, the unique parameter not being identified is that relating to the time invariant group-specific
characteristics; indeed, this is not surprising because there is no way to distinguish between the time invariant
group-specific characteristics and group level unobservables. Looking at our model (17), however, we do not
have any time invariant group specific characteristics, but only time variant group specific characteristics which
are fully identified, along with the endogenous effect .
14
specialization and type, eventually implying heteroscedastic residuals. Therefore, for all our
estimates, we provide standard errors that are robust to the presence of heteroscedasticity.
4.2 Spatial econometric model
An alternative empirical approach to study social interactions among agents is the more
recent spatial econometric. Several studies have performed spatial analysis to infer similar
effects in agents’ behavior (Moscone et al., 2012; Gravelle et al., 2014; Atella et al., 2014).
An interesting empirical implication of our model is that cesarean section rates should be
spatially correlated according to the sharing of the same institutional authority. Therefore, as
further evidence of the significant presence of peer effects among hospitals, we carry out the
following spatial econometric analysis, exploiting the panel dimension of our data.
Looking at the specific model, when spatially lagged dependent variable, regressors,
and error term are included simultaneously, the model is not identified unless at least one of
these interaction effects is excluded (Manski, 1993). As suggested by LeSage and Pace
(2009), the choice of the excluded effect should be driven by the specific research question.
According to our model in Section 2, hospitals’ behavior within the same region should be
affected by their peers’ behavior rather than their characteristics. Specifically, hospital i’s
cesarean section rate (13) is affected by its peers’ cesarean section rates rather than their
supply factors. Therefore, we specify the following spatial autoregressive model with
autoregressive disturbances (SAC), provided that we perform standard model selection tests:
(18)
(19)
where is the vector of demand and supply factors, and and are the
elements for each t of the spatial matrices W and M, respectively20
.
In contrast to the standard spatial analysis, the spatial weights matrix is not based on the
geographic distance among hospitals. Rather, it is based on the sharing of the same
institutional authorities, to be consistent with our model of hospitals’ behavior. More
specifically, the row-standardized spatial weights matrices W = M are as follows:
(20)
20
According to the spatial econometric literature (e.g., Anselin, 1988), the two spatial matrices W and M
(respectively, for the dependent variable and disturbances) can be different; however, in the following spatial
analysis we consider W = M.
15
This implies that each hospital is correlated only with other hospitals within the same region.
Therefore, the spatial weights matrix (20) emphasizes the primary role of institutions respect
to geography in affecting agents’ behavior (Rodrik et al., 2004; Arbia et al., 2009; Atella et
al., 2014). In particular, this reflects our interpretation of the effect of peers among hospitals
as a constraint interaction within the same institutional authority.
5. Results
First, we show the estimates for the logit model, along with the generalized linear model
(GLM), potentially an econometric specification even more appropriate for cesarean section
rates. Then, for the spatial analysis, we present our estimates for different spatial
econometrics models, along with standard model selection tests.21
5.1 Logit model
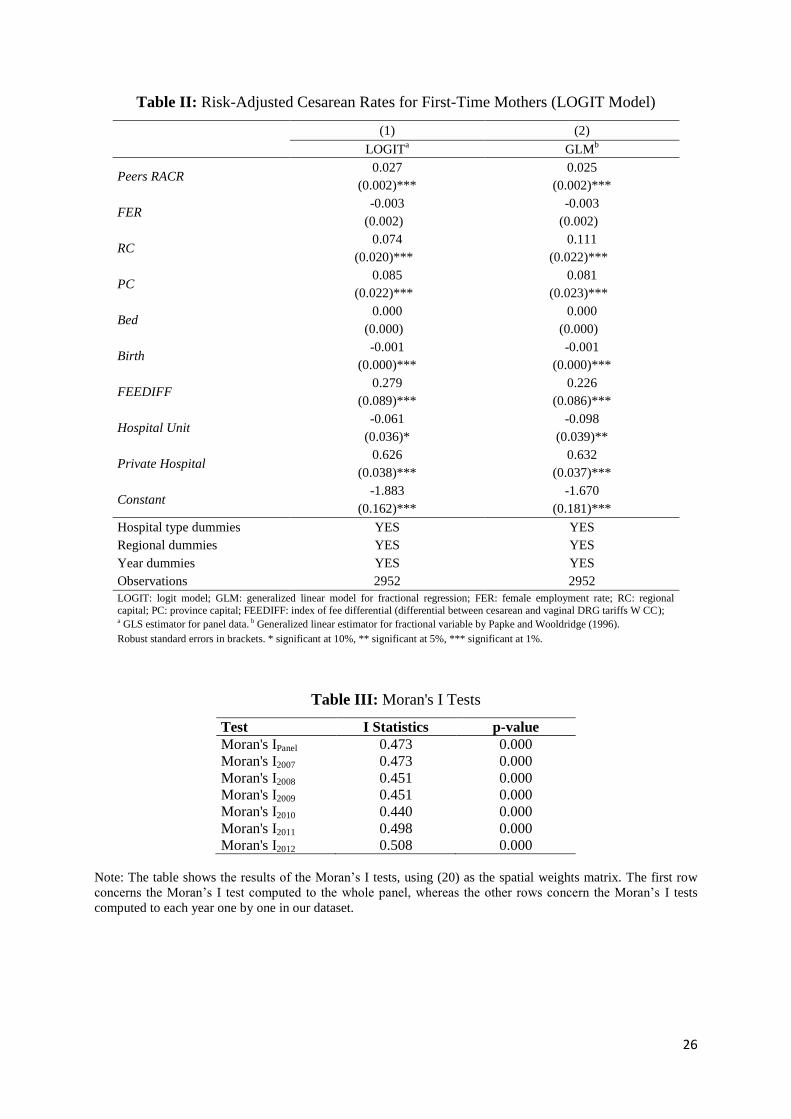
Table II reports the estimates from the logit model (17). As discussed earlier,
heteroscedasticity may be present in our estimates. Therefore, we use a generalized least
squares (GLS) estimator for panel data22
. As shown in column (1), the point estimate of our
main variable of interest Peers RACR is positive and strongly significant. In particular, the
coefficient of 0.027 implies a marginal effect of 0.006, meaning that an increase of one
percentage point in peers’ cesarean rates would increase hospitals’ cesarean rates by about 0.6
percentage points23
. Therefore, our estimate of Peers RACR suggests a significant presence of
peer effects among Italian hospitals.
- TABLE II about here –
With regard to the demand and supply factors, while the female employment rate at the
provincial level (FER) does not seem to play a role24
, both the regional (RC) and province
21
We have also conducted different sensitivity analyses to check the robustness of our estimates, finding results
fully in line with both the logit and the spatial econometric estimates reported here in the paper. For a matter of
space, we have not reported our robustness checks, but the interested reader can easily find them in the working
paper version of the paper (Guccio and Lisi, 2014). 22
We have also tried to run a pooled OLS estimator with robust standard errors (POLS results available upon
request), obtaining coefficients fairly close to GLS in Table II but, not surprisingly, estimates were less precise. 23
In particular, we are considering the standard marginal effect at means (MEMs), that is
16
capital (PC) dummies are positive and significant at the 1% significance level. This implies
that, on average, patients in big provinces and big cities tend to prefer more cesarean
deliveries, ceteris paribus. Among the supply factors, the number of childbirth deliveries
(Birth) is significant, while hospital size (Bed) does not seem to play any role, probably
because we control for hospital type. In particular, the negative coefficient of Birth indicates
that more specialized hospitals tend to exhibit lower cesarean rates, suggesting the presence of
a learning-by-doing effect in the provision of childbirth services.
With regard to the financial factor, the point estimate of FEEDIFF is positive and
significant at the 1% significance level, implying that higher tariff differentials are associated
with higher cesarean rates. In particular, the coefficient of 0.279 implies a marginal effect of
0.058, meaning that a marginal increase of FEEDIFF would increase the probability of a
cesarean delivery by 5.8 percentage points. Thus, in those regions with a relatively greater
financial incentive to execute cesarean sections, providers respond in a strategic way by
shifting procedures towards more cesarean deliveries.
Finally, our estimates show interesting regularities in the differences among hospital
types. In particular, directly managed public hospitals (Hospital Units), where financial
factors should not play a big role, tend to experience lower cesarean rates. Conversely,
accredited private hospitals (Private Hospitals), where financial aspects should be crucial,
tend to execute more cesarean sections, ceteris paribus. These findings suggest that providers
behave strategically in accordance with financial incentives, which is consistent with the
previous literature.
From an econometric point of view, although the logit model (17) is more appropriate
than the simple linear probability model, it might not be the most appropriate for cesarean
rates. In this regard, Papke and Wooldridge (1996) note that the log-odds type procedures
implicitly assume a standard normal distribution for the error term, which might not be
appropriate for regression models with fractional dependent variables. Therefore, since
fractional variables are the result of a dichotomous process, they propose a more attractive
quasi-likelihood estimation method in the framework of generalized linear models (GLM),
using the logit transformation as link function, but assuming a binomial distribution for the
24
We find similar results if we include local female tertiary education rate or local household income, instead of
female employment rate; indeed, this is not surprising as all these demand factors tend to be positively correlated
in our sample.
17
error term25
. To the extent that the share of cesarean sections is the result of the dichotomous
choice between vaginal/cesarean delivery, GLM could be even more appropriate.
Therefore, in the second column of Table II, we run the same model, but for the
described GLM estimator. Nonetheless, column (2) shows that all the results are also
confirmed by the GLM estimates. In particular, the coefficient of Peers RACR is still positive
and strongly significant, implying a marginal effect of about 0.5 percentage points in
hospitals’ cesarean rates. Similarly, all other results concerning the demand, supply, and
financial factors are in line with the logit estimates.
Overall, both the logit and GLM estimates seem to support our predictions on hospitals’
behavior. Provided that we control for demand, supply, and financial factors in (17), we
interpret our estimate as the (reduced-form) hospitals’ reaction function (13) to the
inappropriate behavior of their peers within the RHA. Therefore, our estimate of Peers RACR
suggests a significant presence of peer effects among hospitals. In particular, our estimate
implies that an increase of one percentage point in peers’ cesarean rates leads to an increase of
about 0.6 percentage points in hospitals’ cesarean rates.
Following the classification proposed by Manski (2000), we interpret this evidence as a
presence of substantial constraint interactions in the hospital sector, meaning that the
behavior of peers represents a constraint for the inappropriate behavior of hospitals within the
same authority. Looking at our theoretical model, this interpretation would seem fairly
reasonable for the specific context of the Italian healthcare sector.
5.2 Spatial econometric model
We now move to the spatial analysis. Since the implication of our theoretical model is
that cesarean rates should be spatially correlated within the same institutional authority, our
spatial analysis could provide further support for our model, thus, providing evidence of peer
effects among hospitals.
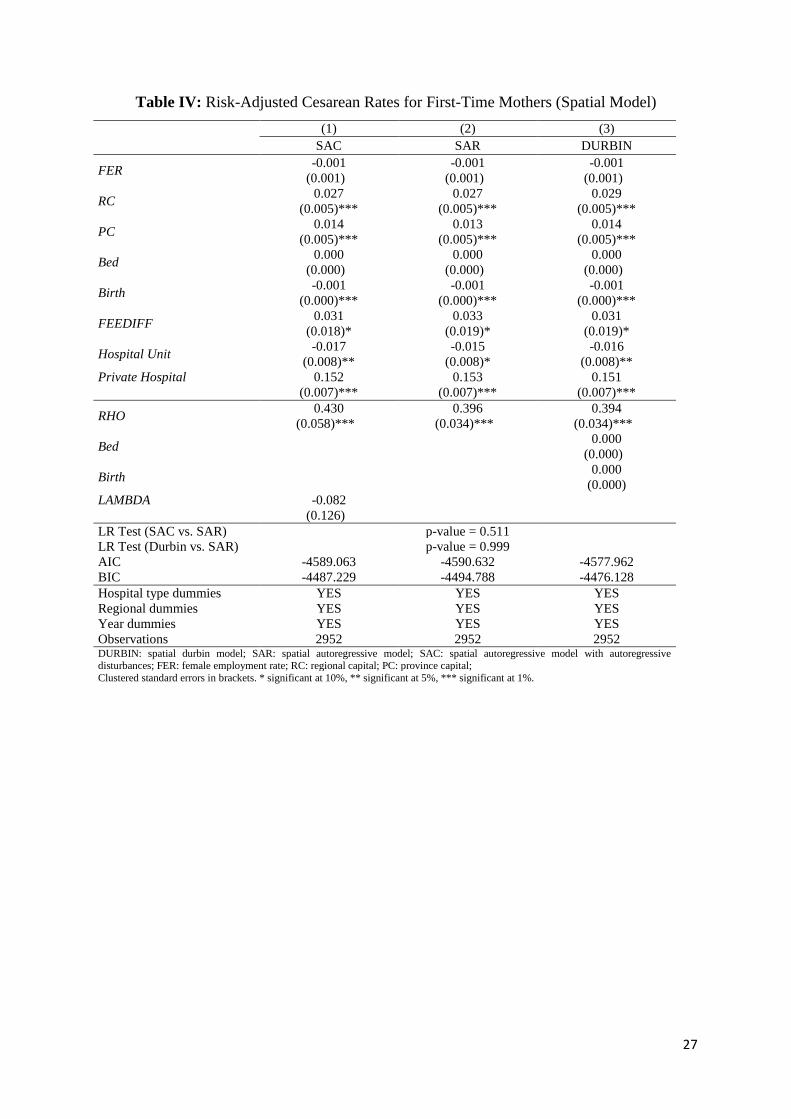
First, we test pre-emptively whether cesarean section rates show spatial dependence
within the same RHA. Table III shows the results of the Moran’s I test, using (20) as the
spatial weights matrix. As can be seen, we find evidence of spatial dependence among
25
Indeed, Papke and Wooldridge (1996) proposed the so-called “fractional logit” in the cross-section context.
However, there are no serious drawbacks in applying their GLM approach with panel data, provided that one “...
can account for unobserved heterogeneity that is possibly correlated with the explanatory variables ...” (Papke
and Wooldridge, 2008). In this regard, we are confident that in our study the large structure of fixed effects
should be sufficiently able to account for the unobserved heterogeneity, without suffering from the incidental
parameters problem. For a study applying the “fractional logit” with panel data see e.g. Hausman and Leonard
(1997), where they use a similar strategy to account for the unobserved heterogeneity.
18
cesarean section rates, regardless of whether we compute the Moran’s I test on the whole data
set or per year.
- TABLE III about here –
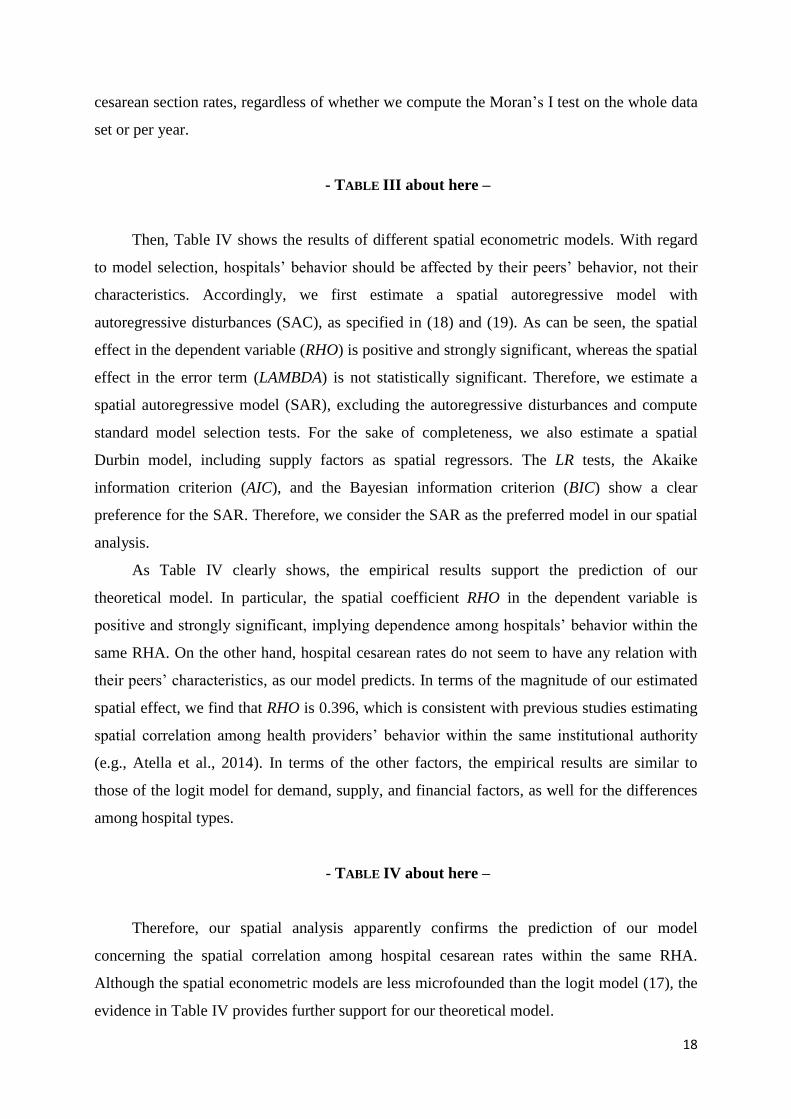
Then, Table IV shows the results of different spatial econometric models. With regard
to model selection, hospitals’ behavior should be affected by their peers’ behavior, not their
characteristics. Accordingly, we first estimate a spatial autoregressive model with
autoregressive disturbances (SAC), as specified in (18) and (19). As can be seen, the spatial
effect in the dependent variable (RHO) is positive and strongly significant, whereas the spatial
effect in the error term (LAMBDA) is not statistically significant. Therefore, we estimate a
spatial autoregressive model (SAR), excluding the autoregressive disturbances and compute
standard model selection tests. For the sake of completeness, we also estimate a spatial
Durbin model, including supply factors as spatial regressors. The LR tests, the Akaike
information criterion (AIC), and the Bayesian information criterion (BIC) show a clear
preference for the SAR. Therefore, we consider the SAR as the preferred model in our spatial
analysis.
As Table IV clearly shows, the empirical results support the prediction of our
theoretical model. In particular, the spatial coefficient RHO in the dependent variable is
positive and strongly significant, implying dependence among hospitals’ behavior within the
same RHA. On the other hand, hospital cesarean rates do not seem to have any relation with
their peers’ characteristics, as our model predicts. In terms of the magnitude of our estimated
spatial effect, we find that RHO is 0.396, which is consistent with previous studies estimating
spatial correlation among health providers’ behavior within the same institutional authority
(e.g., Atella et al., 2014). In terms of the other factors, the empirical results are similar to
those of the logit model for demand, supply, and financial factors, as well for the differences
among hospital types.
- TABLE IV about here –
Therefore, our spatial analysis apparently confirms the prediction of our model
concerning the spatial correlation among hospital cesarean rates within the same RHA.
Although the spatial econometric models are less microfounded than the logit model (17), the
evidence in Table IV provides further support for our theoretical model.
19
6. Conclusion
In this study, we explored the presence of social interaction effects in the inappropriate
behavior among hospitals sharing the same institutional authority. The main intuition of our
theoretical prediction is that each institutional authority cannot afford to tackle the
inappropriate behavior of all hospitals under its authority. Therefore, higher hospitals’
inappropriate behavior can produce an enforcement congestion effect, which makes the open
road to the inappropriate behavior of their peers. Subsequently, we tested the implications of
our model in the Italian hospital sector, controlling for demand, supply, and financial factors.
Here, our estimates show a significant and strong presence of peer effects among hospitals.
Following the classification proposed by Manski (2000), we interpret this evidence as a
presence of substantial constraint interactions in the hospital sector, meaning that the
behavior of peers represents a constraint on the inappropriate behavior of hospitals within the
same institutional authority responsible for auditing inappropriate behavior.
Our results have important implications for healthcare policies against
inappropriateness. First, through the social interaction effect, health authorities could reduce
inappropriate behavior at a cost less than that of auditing all hospitals under their authority.
However, consistent with previous literature, the significant presence of constraint
interactions among hospitals and the high level of inappropriateness in Italian regions suggest
that auditing policies do not appear to be effective in reducing inappropriate behavior.
Instead, policies that set resource allocation on outcome targets (e.g. pay for performance),
regardless of audits on appropriateness, has the potential to work better as a measure against
inappropriateness, especially in medical procedures in the gray area of medicine, such as the
childbirth medical services. Moreover, policies based on outcome targets could lead to
consistent savings in human and financial resources respect to auditing systems on the
appropriateness of each medical procedure provided by hospitals.
References
Abdul-Rahim HF, Abu-Rmeileh NM, Wick L. 2009. Cesarean section deliveries in the
occupied Palestinian territory (oPt): An analysis of the 2006 Palestinian Family Health
Survey. Health Policy 93: 151–156.
Althabe F, Sosa C, Beliz´an, JM, Gibbons L, et al. 2006. Cesarean Section Rates and
Maternal and Neonatal Mortality in Low-, Medium-, and High Income Countries: An
Ecological study. Birth 33: 270–277.
20
Anselin L. 1988. Spatial econometrics: methods and models. Kluwer, London.
Apouey B, Picone G. 2014. Social Interactions and Malaria Preventive Behaviors in Sub-
saharan Africa. Health Economics 23 (9): 994-1012.
Arbia G, Battisti, M, Di Vaio, G. 2009. Institutions and geography: Empirical test of spatial
growth models for European regions. Economic Modelling 27: 12–21.
Atella V, Belotti F, Depalo D, Mortari, AP. 2014. Measuring Spatial Effects in Presence of
Institutional Constraints: the Case of Italian Local Health Authority Expenditure. Regional
Science and Urban Economics 49: 232–241.
Auld MC. 2011. Effect of large-scale social interactions on body weight. Journal of Health
Economics 30: 303–316.
Baicker K, Buckles K, Chandra A. 2006. Geographic Variation In The Appropriate Use Of
Cesarean Delivery. Health Affairs 25(5): w355–w367.
Belizàn JM, Althabe F, Cafferata ML. 2007. Health Consequences of the Increasing Cesarean
Section Rates. Epidemiology 18: 485–486.
Betràn AP, Merialdi M, Lauer JA, Bing-Shun W, et al. 2007. Rates of Cesarean Section:
Analysis of Global, Regional and National Estimates. Paediatric and Perinatal
Epidemiology 21: 98–113.
Birkmeyer JD, Siewers AE, Finlayson EV, Stukel TA, et al. 2002. Hospital volume and
surgical mortality in the United States. New England Journal of Medicine 346, 1128–1137.
Blume L, Brock W, Durlauf S, Ioannides Y. 2011. Identification of Social Interactions. In:
Benhabib, J, Bisin, A, Jackson, MO (Eds), Handbook of Social Economics, Vol 1: 853–
964, Elsevier.
Brock WA, Steven N, Durlauf SN. 2007. Identification of binary choice models with social
interactions. Journal of Econometrics 140: 52–75.
Busse R, Geissler A, Quentin W, Wiley M. 2011. Diagnosis-Related Groups in Europe:
Moving towards transparency, efficiency and quality in hospitals. Open University Press.
Cavalieri M, Guccio C, Lisi D, Pignataro G. 2014. Financial Incentives and Inappropriateness
in Healthcare: Evidence from Italian Cesarean Sections. FinanzArchiv/Public Finance
Analysis 70(3): 1–28.
Chandra A, Cutler D, Song Z. 2011. Who Ordered That? The Economics of Treatment
Choices in Medical Care. In: Mark, V, Pauly, TGM, Barros, PP (Eds), Handbook of Health
Economics, Vol 2: 397–432, Elsevier.
Conley T, Topa G. 2003. Identification of local interaction models with imperfect location
data. Journal of Applied Econometrics 18(5): 605–618.
Cots F, Chiarello P, Salvador X, Castells X, Quentin W. 2011. DRG-based hospital payment:
Intended and unintended consequences. In: Busse R, Geissler A, Quentin W, Wiley M
(Eds), Diagnosis Related Groups in Europe Moving Towards Transparency, Efficiency and
Quality in Hospitals. Open University Press.
Crane J. 1991. The Epidemic Theory of Ghettos and Neighborhood Effects on Dropping Out
and Teenage Childbearing. American Journal of Sociology 96: 1226-1259.
Dubay L, Kaestner R, Waidmann,T. 1999. The Impact of Malpractice Fears on Cesarean
Section Rates. Journal of Health Economics 18: 491–522.
Ellis RP, McGuire TG. 1986. Provider behavior under prospective reimbursement Cost
sharing and supply. Journal of Health Economics 5(2): 129–151.
Epple D, Romano R. 1998. Competition Between Private and Public Schools, Vouchers and
Peer Group Effects. The American Economic Review 88(1): 33–62.
21
Epple D, Romano R. 2011. Peer Effects in Education: A Survey of the Theory and Evidence.
In: Benhabib, J, Bisin, A, Jackson, MO Eds., Handbook of Social Economics, Vol 1: 1053–
1163, Elsevier.
Epstein A, Nicholson S. 2009. The formation and evolution of physician treatment styles: An
application to cesarean sections. Journal of Health Economics 28: 1126–1140.
Fortino A, Lispi L, D’Ippolito F, Ascone G. 2002. L’Eccessivo ricorso al taglio cesareo:
Analisi dei dati italiani, Italian Ministry of Health.
Francese M, Piacenza M, Romanelli M, Turati G. 2014. Understanding inappropriateness in
health spending: The role of regional policies and institutions in caesarean deliveries.
Regional Science and Urban Economics 49: 262–277.
Fusco D, Davoli M, Lallo A, Perucci C. 2010. Valutazione nazionale degli esiti del parto:
taglio cesareo. Monitor 26: 51–59.
Galbiati R, Zanella G. 2012. The tax evasion social multiplier: Evidence from Italy. Journal
of Public Economics 96: 485–494.
Glaeser E, Sacerdote B, Scheinkman J. 1996. Crime and Social Interactions. The Quarterly
Journal of Economics 111.: 507–548.
Grant D. 2005. Information and sorting in the market for obstetrical services. Health
Economics 14: 703–719.
Grant D. 2009. Physician Financial Incentives and Cesarean Delivery: New Conclusions from
the Healthcare Cost and Utilization Project. Journal of Health Economics 28: 244–250.
Grant D, McInnes MM. 2004. Malpractice experience and the incidence of cesarean delivery:
a physician-level longitudinal analysis. Inquiry 41: 170–188.
Gravelle H, Santos R, Siciliani L. 2014. Does a hospital’s quality depend on the quality of
other hospitals? A spatial econometrics approach. Regional Science and Urban Economics
49: 203–216.
Gruber J, Kim J, Mayzlin D. 1999., Physician fees and procedure intensity: the case of
cesarean delivery. Journal of Health Economics 18: 473–490.
Hausman J, Leonard G. 1997. Superstars in the national basketball association: Economic
value and policy. Journal of Labor Economics 15: 586–624.
Hopkins K. 2000. Are Brazilian Women really Choosing to Deliver by Cesarean? Social
Science & Medicine 51: 725–740.
Hsu KH, Liao PJ, Hwang CJ. 2008. Factors affecting Taiwanese women’s choice of cesarean
section. Social Science & Medicine 66: 201–209.
Ivers N, Jamtvedt, G, Flottorp S, et al. 2012. Audit and feedback: effects on professional
practice and healthcare outcomes. Cochrane Database of Systematic Reviews 6, No.
CD000259.
Kabakian-Khasholian T, Kaddour A, DeJong J, Shayboub R, Nassar A. 2007. The Policy
Environment Encouraging C-section in Lebanon. Health Policy 83: 37–49.
LeSage JP, Pace RK. 2009. Introduction to Spatial Econometrics. Taylor & Francis.
Lo JC. 2003. Patients’ attitudes vs physicians’ determination: implications for cesarean
sections. Social Science & Medicine 57: 91–96.
Lomas J, Enkin M, Anderson G, et al. 1991. Opinion Leaders vs Audit and Feedback to
Implement Practice Guidelines Delivery After Previous Cesarean Section. The Journal of
the American Medical Association 265: 2202–2207.
Manski C. 1993. Identification of Endogenous Social Effects: The Reflection Problem.
Review of Economic Studies 60: 531–542.
22
Manski C. 2000. Economic Analysis of Social Interactions. Journal of Economic Perspectives
14(3): 115–136.
Mayer SE. 1991. How Much Does a High School’s Racial and Socioeconomic Mix Affect
Graduation and Teenage Fertility Rates? In: Jencks, C and Peterson, PE Eds., The Urban
Underclass, Washington DC, The Brookings Institution.
McGuire TG, Pauly, MV 1991. Physician response to fee changes with multiple payers.
Journal of Health Economics 10: 385–410.
Moscone F, Tosetti E, Vittadini G. 2012. Social interaction in patients' hospital choice:
evidence from Italy. Journal of the Royal Statistical Society: Series A 175: 453–472.
Murphy KM, Topel RH. 2006. The Value of Health and Longevity. Journal of Political
Economy 114(5): 871– 904.
OECD 2011. Health at a Glance 2011: OECD Indicators, Paris.
Papke LE, Wooldridge JM. 1996. Econometric methods for fractional response variables with
an application to 401k. plan participation rates. Journal of Applied Econometrics 11: 619–
632.
Papke LE, Wooldridge JM. 2008. Panel data methods for fractional response variables with
an application to test pass rates. Journal of Econometrics 145: 121–133.
Rodrik D, Subramanian A, Trebbi F. 2004. Institutions rule: The primacy of institutions over
geography and integration in economic development. Journal of Economic Growth 9: 131–
165.
Rusticali B, Di Virgilio E. 2010. Considerazioni sull’appropriatezza del taglio cesareo: La
ricerca Agenas. Monitor 26: 29–50.
Sacerdote B. 2001. Peer effects with random assignment: Results for Darmouth roommates.
The Quarterly Journal of Economics 116(2): 681–704.
Sah R. 1991. Social Osmosis and Patterns of Crime. Journal of Political Economy 94: 1272–
1295.
Skinner J. 2011. Causes and Consequences of Regional Variations in Health Care. In: Mark,
V, Pauly, TGM and Barros, PP Eds., Handbook of Health Economics, Vol 2: 45–93,
Elsevier.
Trogdon J, Nonnemaker J, Pais J. 2008. Peer effects in adolescent overweight. Journal of
Health Economics 27(5): 1388–1399.
World Health Organization 1985. Appropriate Technology for Birth. Lancet 2: 436–437.
Zimmerman D. 2003. Peer effects in academic outcomes: Evidence from a natural
experiment. Review of Economics and Statistics 85(1): 9–23.
23
TABLES AND FIGURES
Figure 1: Optimal best response
Note: The figure depicts the best response (as a fixed point) given by the equilibrium condition (13),
showing that the hospital i’ s optimal cesarean section rate is unique.
Figure 2. Peers effect on equilibrium
Note: The figure depicts the effect of peers’ behavior on the hospital i’ s cesarean rate given by equation (15),
showing that being “surrounded” by peers with higher cesarean section rates increases the optimal best
response.
24
Table I: Descriptive statistics
Variables Obs. Mean Std. Dev. Min Max
Risk-adj. cesarean rate (RACR) 2952 0.31 0.16 0.03 0.94
Vaginal birth fee W CC 120 2280.18 416.08 1370 3180
Cesarean section fee W CC 120 3588.74 647.66 2316 4955
Tariff differential index (FEEDIFF) 120 1.01 0.14 0.67 1.42
Female employment rate (FER) 654 47.21 11.74 22.71 64.82
Number of beds (Bed) 2952 397.97 328.54 25 1719
Number of births (Birth) 2952 830.97 662.85 90 7313
Note: The table presents the main descriptive statistics of the variables employed in our empirical analysis. The risk-adjusted
cesarean rate considers only first-time mothers, because it is usually considered a better index of inappropriateness respect to
the overall cesarean rate. FEEDIFF is the index of fee differential between cesarean and vaginal DRG tariffs W CC, as
described in section 3.
Figure 3: Cesarean section rates and correlation among hospital peers
Note: The figure plots the hospital risk-adjusted cesarean rates against the average cesarean rate of their peers
within the same RHA. The slope of the superimposed regression line reveals a positive relationship between
hospital cesarean rates and the (inappropriate) behavior of their peers belonging to the same RHAs.
0.2
.4.6
.81
risk-a
dju
ste
d c
esare
an
ra
te
.1 .2 .3 .4 .5 .6Peers risk-adjusted cesarean rate
risk-adjusted cesarean rate fitted values
CESAREAN DELIVERY AMONG PEERS
25
Figure 4: Tariff differential indicator across Italian regions
Note: The figure provides an overview of our tariff differential indicator (FEEDIFF) across the Italian regions.
Specifically, a value of 1 of FEEDIFF indicates that a RHA has applied the same tariffs as the national ones for
both cesarean and vaginal deliveries. Differently, a value higher (lower) than 1 designates a RHA where the ratio
between the two DRG tariffs is higher (lower) than the corresponding national one, implying a relative financial
convenience to execute a cesarean section. Overall, the figure shows that different RHAs in Italy have opted for
different tariff policies.
0.5
11
.5
FE
ED
IFF
Lom
bard
ia
Mar
che
Abr
uzzo
Cam
pania
Lazio
Ligu
ria
Pug
lia
Sicilia
Friuli V.G
.
Bolza
no
Piem
onte
Tosca
na
Sar
degn
a
Trent
o
Um
bria
Calab
ria
Bas
ilica
ta
Molise
Em
ilia
Rom
agna
Ven
eto
TARIFF DIFFERENTIAL ACROSS REGIONS
26
Table II: Risk-Adjusted Cesarean Rates for First-Time Mothers (LOGIT Model)
(1) (2)
LOGITa GLM
b
Peers RACR 0.027 0.025
(0.002)*** (0.002)***
FER -0.003 -0.003
(0.002)_ (0.002)_
RC 0.074 0.111
(0.020)***_ (0.022)***_
PC 0.085 0.081
(0.022)***_ (0.023)***_
Bed 0.000 0.000
(0.000)_ (0.000)_
Birth -0.001 -0.001
(0.000)*** (0.000)***
FEEDIFF 0.279 0.226
(0.089)*** (0.086)***
Hospital Unit -0.061 -0.098
(0.036)* (0.039)**
Private Hospital 0.626 0.632
(0.038)*** (0.037)***
Constant -1.883 -1.670
(0.162)*** (0.181)***
Hospital type dummies YES YES
Regional dummies YES YES
Year dummies YES YES
Observations 2952 2952
LOGIT: logit model; GLM: generalized linear model for fractional regression; FER: female employment rate; RC: regional
capital; PC: province capital; FEEDIFF: index of fee differential (differential between cesarean and vaginal DRG tariffs W CC); a GLS estimator for panel data. b Generalized linear estimator for fractional variable by Papke and Wooldridge (1996).
Robust standard errors in brackets. * significant at 10%, ** significant at 5%, *** significant at 1%.
Table III: Moran's I Tests
Test I Statistics p-value
Moran's IPanel 0.473 0.000
Moran's I2007 0.473 0.000
Moran's I2008 0.451 0.000
Moran's I2009 0.451 0.000
Moran's I2010 0.440 0.000
Moran's I2011 0.498 0.000
Moran's I2012 0.508 0.000
Note: The table shows the results of the Moran’s I tests, using (20) as the spatial weights matrix. The first row
concerns the Moran’s I test computed to the whole panel, whereas the other rows concern the Moran’s I tests
computed to each year one by one in our dataset.
27
Table IV: Risk-Adjusted Cesarean Rates for First-Time Mothers (Spatial Model)
(1) (2) (3)
SAC SAR DURBIN
FER -0.001 -0.001 -0.001
(0.001)_ (0.001)_ (0.001)_
RC 0.027 0.027 0.029
(0.005)*** (0.005)*** (0.005)***
PC 0.014 0.013 0.014
(0.005)*** (0.005)*** (0.005)***
Bed 0.000 0.000 0.000
(0.000)_ (0.000)_ (0.000)_
Birth -0.001 -0.001 -0.001
(0.000)*** (0.000)*** (0.000)***
FEEDIFF 0.031 0.033 0.031
(0.018)* (0.019)* (0.019)*
Hospital Unit -0.017 -0.015 -0.016
(0.008)** (0.008)* (0.008)**
Private Hospital
0.152 0.153 0.151
(0.007)*** (0.007)*** (0.007)***
RHO 0.430 0.396 0.394
(0.058)***_ (0.034)***_ (0.034)***_
Bed 0.000
(0.000)_
Birth 0.000
(0.000)
LAMBDA
-0.082
(0.126)_
LR Test (SAC vs. SAR) p-value = 0.511
LR Test (Durbin vs. SAR) p-value = 0.999
AIC -4589.063 -4590.632 -4577.962
BIC -4487.229 -4494.788 -4476.128
Hospital type dummies YES YES YES
Regional dummies YES YES YES
Year dummies YES YES YES
Observations 2952 2952 2952 DURBIN: spatial durbin model; SAR: spatial autoregressive model; SAC: spatial autoregressive model with autoregressive disturbances; FER: female employment rate; RC: regional capital; PC: province capital;
Clustered standard errors in brackets. * significant at 10%, ** significant at 5%, *** significant at 1%.
28
APPENDIX 1: RISK-ADJUSTED CESAREN SECTION RATE IN THE
SAMPLE
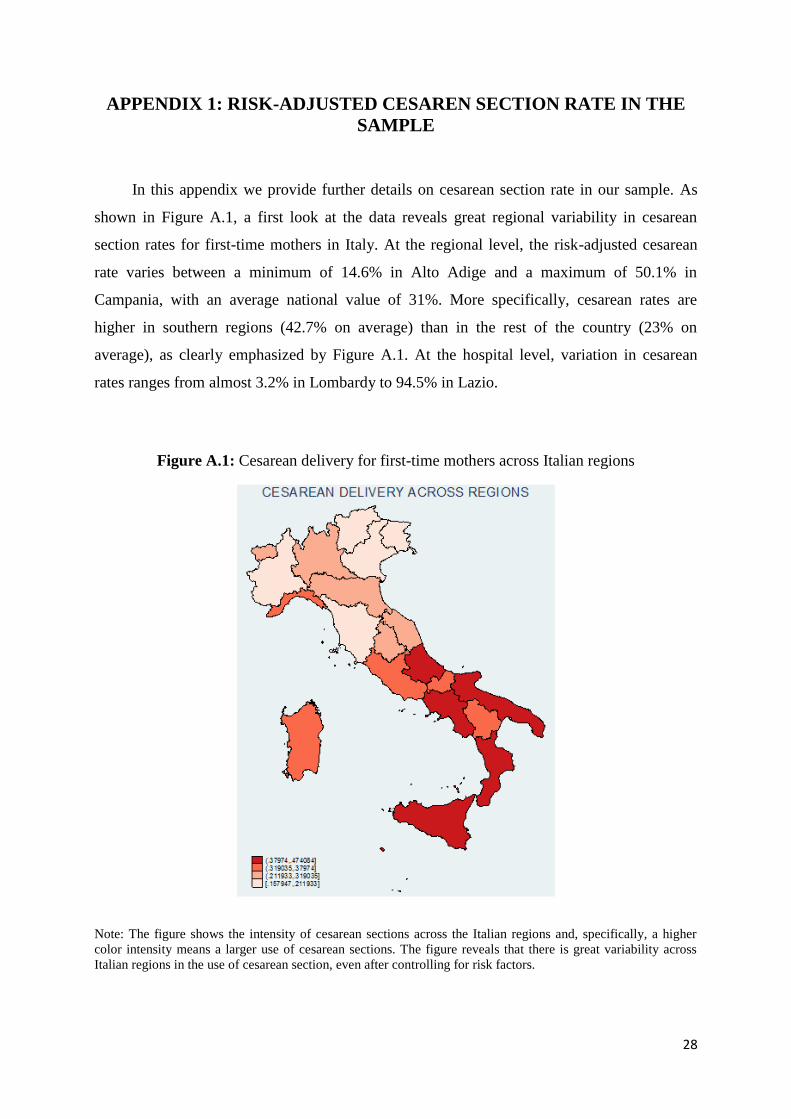
In this appendix we provide further details on cesarean section rate in our sample. As
shown in Figure A.1, a first look at the data reveals great regional variability in cesarean
section rates for first-time mothers in Italy. At the regional level, the risk-adjusted cesarean
rate varies between a minimum of 14.6% in Alto Adige and a maximum of 50.1% in
Campania, with an average national value of 31%. More specifically, cesarean rates are
higher in southern regions (42.7% on average) than in the rest of the country (23% on
average), as clearly emphasized by Figure A.1. At the hospital level, variation in cesarean
rates ranges from almost 3.2% in Lombardy to 94.5% in Lazio.
Figure A.1: Cesarean delivery for first-time mothers across Italian regions
Note: The figure shows the intensity of cesarean sections across the Italian regions and, specifically, a higher
color intensity means a larger use of cesarean sections. The figure reveals that there is great variability across
Italian regions in the use of cesarean section, even after controlling for risk factors.
29
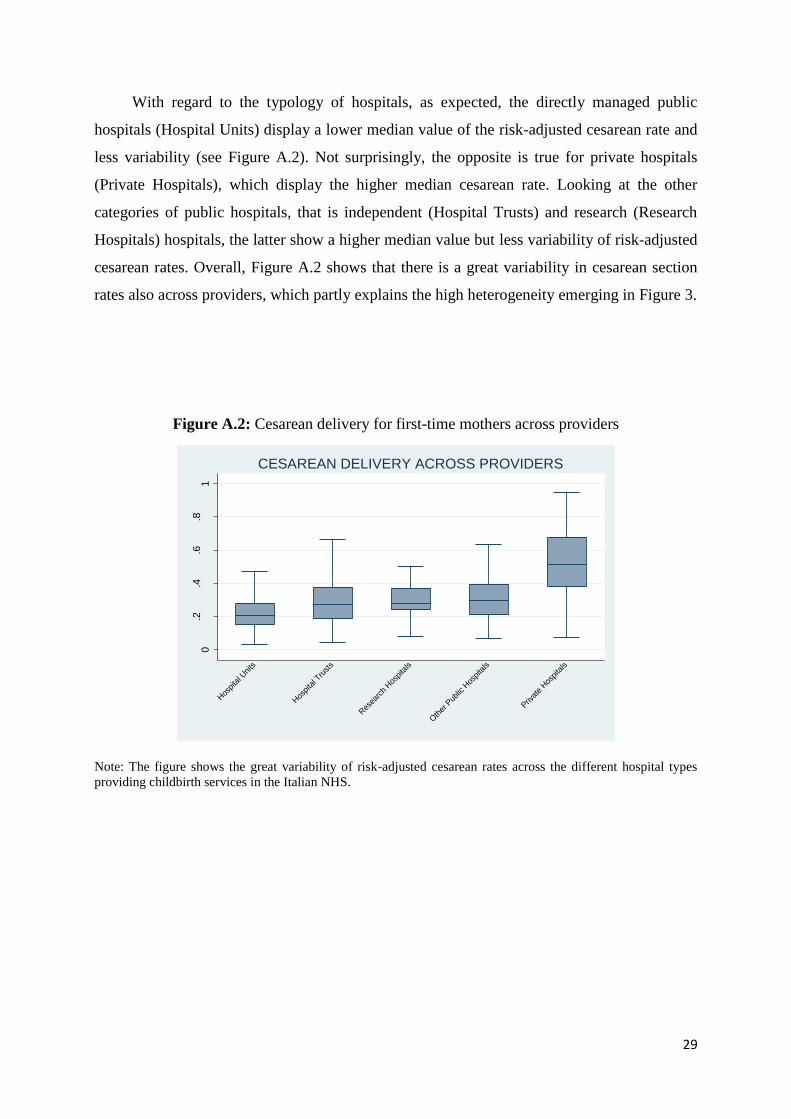
With regard to the typology of hospitals, as expected, the directly managed public
hospitals (Hospital Units) display a lower median value of the risk-adjusted cesarean rate and
less variability (see Figure A.2). Not surprisingly, the opposite is true for private hospitals
(Private Hospitals), which display the higher median cesarean rate. Looking at the other
categories of public hospitals, that is independent (Hospital Trusts) and research (Research
Hospitals) hospitals, the latter show a higher median value but less variability of risk-adjusted
cesarean rates. Overall, Figure A.2 shows that there is a great variability in cesarean section
rates also across providers, which partly explains the high heterogeneity emerging in Figure 3.
Figure A.2: Cesarean delivery for first-time mothers across providers
Note: The figure shows the great variability of risk-adjusted cesarean rates across the different hospital types
providing childbirth services in the Italian NHS.
0.2
.4.6
.81
risk-a
dju
ste
d c
esare
an
ra
te
Hos
pita
l Units
Hos
pita
l Tru
sts
Res
earc
h Hos
pita
ls
Oth
er P
ublic
Hos
pita
ls
Priv
ate
Hos
pita
ls
CESAREAN DELIVERY ACROSS PROVIDERS